1. Introduction
Access to energy is crucial in determining social-economic development and reducing poverty [
1] as modern societies depend on abundant and low-cost energy [
2]. Unfortunately, the energy sector is also the largest emitter of greenhouse gases (GHGs) [
3], which are driving climate change and the concomitant negative externalities for humanity and nature [
4]. For example, in Canada, the energy sector emitted 80% of the total GHG emissions [
5] and Canadian per capita emissions are some of the highest in the world [
6]. To rectify this, Canada has made a commitment to aggressively reduce GHG emissions by passing the Net-Zero Emission Accountability Act, with the mandate to reach net-zero emissions by 2050 [
7]. To reach zero emissions, the residential sector is of particular interest because building energy use is responsible for 17% of the GHG emissions in Canada [
5] and residential buildings are under the control of consumers/citizens [
8,
9]. For the energy use in residential buildings space heating and domestic hot water demand account for 63.6% and 17.2% of energy consumption in average Canadian homes, respectively [
10]. Thermal energy demands also drive energy use in the residential sector outside of Canada, as about 27% of the world's total energy consumption is used by residential structures [
11].
One of the solutions to the energy/emissions challenge is the deployment of renewable energy sources, which can meet rising energy demands without harming the environment by replacing scarce and unsustainable fossil fuels [
12,
13]. Among renewable energy sources, solar photovoltaic (PV) systems have gained prominence due to their environmental friendly, clean, and safe operations [
14]. Since its commercial development a few decades ago, the growth of power generation utilizing PV technology has been sustained and increased [
15]. PV accounted for 2.6% of the world's electricity generation in 2019 and is projected to provide 25% of the energy required by 2050 [
16]. Additionally, it is anticipated that integrated PV buildings will provide 40% of this energy [
16]. In recent years solar energy has radically dropped in price [
15] and been employed at accelerating rates [
17] making it one of the most rapidly growing sources of energy supply globally [
18]. PV systems can be deployed for stand-alone operation in residential homes economically [
19,
20,
21], sizing such systems can be complicated because of the need for battery storage [
22,
23,
24,
25,
26]. Recent work has even used artificial neural networks (ANNs) and metaheuristic methods [
27], which are computationally demanding [
28], but reliable techniques that provide a techno-economic solution to determine appropriate sizing [
29]. Stand-alone PV systems, however, are the minority as most residential PV systems are grid-tied [
30].
Although the value of solar electricity is often higher than the net metered rate [
31], residential solar customers may be credited far lower than the net metered rate [
32]. In such instances, it is economically optimum for the residential solar customer to self-consume, that is, to use their higher-value solar energy rather than feed it back to the grid. Nicoletti et al. [
33], have shown it is challenging to guarantee high self-consumption with just the installation of the PV system alone. PV coupled with electric storage increases the ability for self-consumption but is generally costly [
34]. Another approach, which has recently gained economic viability in North America is to use PV-powered heat pumps (HPs) [
35,
36,
37]. PV coupled with HPs can also increase the self-sufficiency and self-consumption rates of households becoming a source of local flexibility [
38,
39]. Electrically-powered HPs efficiently serve both space/water heating and cooling, making them superior to conventional heaters as they also function as air conditioners during the summer [
40]. Due to the great thermodynamic efficiency of HPs and the potential to use renewable electricity as a source of energy, they are currently the most promising technology for reducing the carbon footprint of the heat supply while fostering the integration of renewable energy in buildings [
41]. For example, solar PV technology with HPs can reduce residential building GHG emissions by up to 50% immediately [
36]. Several studies perform sizing of HPs for different objectives [
42,
43,
44] along with numerous heat pump designs that consider the available heat source (such as air, earth, or water) and the way the heat is delivered to the building. (e.g., ducted air, ductless air, hydronic) [
45].
HPs can be broadly categorized into two groups: ground-source heat pumps (GSHP), often known as geothermal heat pumps, and air-source heat pumps (ASHP). GSHPs are generally more efficient and more costly than ASHPs. In GSHP, with a coefficient of performance (COP) equal to 2.94 at -17.7
oC [
46], the ground heat exchanger's (GHE) design is frequently the most important factor in determining performance and economics [
47,
48,
49]. The drilling prices of the GSHP are also an added cost that makes the capital expense much higher than the ASHP [
50]. One of the ways to reduce the cost of the GSHP is to use horizontal GHE, however, this approach requires more land area and thus is not suitable for all residential applications. According to Lim et al. [
51], only 61% of residences in the U.S. can install GSHP; of those that can, 8% must utilize the more expensive vertical GHE. Beyond installation costs, it is challenging to make a single HP design proposal for an entire region [
52], due to the significant relationships between climate, geology, energy prices, fuel prices, and inflation rates [
53].
By eliminating the requirement for GHE, ASHPs offer a stronger economic proposition than GSHPs, and in recent years, the technology has advanced to be a competitive alternative in cold areas [
54]. Lowering the minimum operating temperatures and reducing auxiliary heat have been accomplished using new refrigerants, ejectors, and dual-stage compression [
55]. The COP of air-to-air heat pumps normally ranges between 2 and 5.4 at 8
oC [
56] and can fall to a meagre 1.04 at -21
oC [
57], testing on commercial models has shown that it can reach 1.5 [
58]. Thus, the economic competitiveness of ASHP varies by geography and application, just as GSHP. The economics, however, have recently shifted in favor of HPs. According to the latest International Energy Agency (IEA) analysis, global sale of HPs grew by 11% in 2022; with Europe HPs sales growing by nearly 40% whereas in 2023 in U.S. HPs sales exceeded gas furnaces for the first time [
59]. Dated studies of only a few years on Canadian buildings [
60,
61] showed that ASHPs are more expensive than natural gas in most places, with milder climates being the most promising. More recent results, however, have shown that PV-powered ASHPs are economical in Canada [
35]. Similarly, in the northern U.S. Padovani et al. [
36] showed that the electrification of the heating system by combining PV and HPs can be economical at the residential level for replacing propane and other studies have shown the same for natural gas [
35,
37]. HPs achieve up to 66% secondary energy savings and up to 84% in GHG reductions [
62].
If PV systems are to also cover thermal loads, these have a great influence on the sizing of the PV [
63]. Determining the amount of energy needed to provide thermal loads in buildings today is challenging as it depends on a variety of factors like the kind of construction materials and their coefficients of heat transfer, outside and indoor temperatures, humidity, the number of occupants, lightning, and human behavior all must be included [
64,
65]. In addition, the optimal sizing of the PV+HP system depends on various other parameters i.e., solar radiation, and variable solar electricity costs that are sensitive to initial costs of every component of the system. Although much work has been done on sizing PV systems to meet non-thermal electric loads, comparatively less work has focused on the use of solar-powering heat pumps for heating and cooling thermal loads.
This study aims to develop an open-source thermal house model to be coupled to solar PV and HP models for grid-connected residential housing. This model provides hourly and monthly thermal load profiles that are used to observe how the import and export of electricity to/from the grid changes based on different load profiles for optimally sized solar PV systems used run optimally-sized HPs. After briefly reviewing the literature, the calculation of the thermal loads (i.e., both space heating and cooling) is made to provide the selection of HPs. This is done using the black box model developed in Python for an air-source heat pump to meet thermal loads for a one-story grid-connected residential building model for both space heating and cooling and validated by using the Hourly Analysis Program 5.11 (HAP) [
66]. Finally, the capacity of PV required to supply the HP is calculated using the System Advisor Model (SAM) integrated Python model [
67]. The novelty of this approach is a PV model which has been introduced to select the system developed for an optimal power supply considering both heating and cooling load requirements of the HP. This model provides details about the import/export of electricity to/from the grid, self-consumption, and self-sufficiency, and how they change based on hourly and monthly load profiles. A case study is presented for Ontario Canada, but the model can be used for other geographical regions globally. The results are presented and discussed in the context of accelerating the solar electrification of heating and cooling to offset the use of fossil fuels.
2. Background
For all PV system sizing calculations, input data (system specifications, meteorological data, load demand data), system models, simulation techniques, and formulated objective functions are typically the four key components of numerical techniques [
68]. Analytical techniques [
69] generate a simple formula that specifies the size of PV systems to achieve desired system reliabilities. This method’s main advantage is its simple computations, while its main drawback is the difficulty of predicting the coefficients of mathematical models and the dependence of these models on location [
21,
70]. With purely electrical residential PV systems there are a wide variety of PV simulation tools to match simple electric loads [
71] which includes ESP-r [
72], SolarGIS (PV Planner) [
73], SolarDesignTool [
74], Aurora Solar Software [
75], PVSYST [
76], SolarPro [
77], and others. To solve the general issue of PV sizing for more complex systems involving thermal loads, various software programs, including TRNSYS [
78], RETScreen [
79], SAM [
67], HOMER [
80], IHOGA [
81], and HYBRID2 [
82] have been developed to determine the PV system’s optimal size [
83,
84]. The most well-known software for PV scaling of complex systems is RETscreen and HOMER [
85,
86] although many authors write MATLAB code for the optimization of PV size [
26,
87]. The vast majority of these tools are adequate for net metered systems, but as many utilities do not net meter [
88] and there is a trend away from net metering [
32,
89] more complex calculations are necessary to optimize the economic return of a PV system.
For PV+HP systems, the dimensioning of all the components is done considering economic criteria [
90] and therefore it is necessary to analyze the whole system together; as the size chosen for one of these components inevitably affects the size of the others. For example, Angenendt et al. [
91] used different operating strategies to perform optimization of PV+HP+battery system component size and the results showed a great economic impact on the cost associated with the operation. Beck et al. [
92] analyzed the combined size of PV and heat pumps under different scenarios and found that while the size of the PV field and the electrical storage are significantly influenced by the electrical load profiles, while the choice of heat pump is almost completely independent of scenario assumptions. These articles do not consider the impact on summer behavior and thus space cooling loads. Other studies have also analyzed the dimensioning of the heat pump coupled with PV systems [
92,
93,
94]. Lyden et al. [
94] designed the heat pump size based on the different tariffs and assumed predictive control. These articles, however, did not focus on the sizing of the PV system. Energy simulations were carried out by Dongellini et al. [
95] using an air-water heat pump (AWHP) that only provides a portion of the building’s thermal demand while the remaining portion is delivered by the boiler. The study highlights the significance of appropriate design by showing that the performance is highly related to HP sizing.
Air-water HPs are systems that are frequently utilized to offer space heating and cooling in the Mediterranean region. The optimal dimensioning of components for cold climate locations, where cooling is not necessary, is the subject of the research works listed so far. Whereas space cooling is a crucial factor to take into account in areas with temperate climates [
96]. The quantity of electrical energy needed by the HP during the summer must be considered while choosing the best dimensions. Nicoletti et al. [
33] used EnergyPlus to carry out energy simulations for obtaining data for the combined sizing of PV-battery and air-water HP systems considering both heating and cooling demand. Baghoolizadeh et al., [
2] simulated a building model in cities with different climatic conditions using EnergyPlus to optimize the energy loads and their costs for both heating and cooling loads. In the literature, combined optimal dimensioning is only used for cold areas with low cooling demand. In warm climate sites where it is necessary to consider both the winter and summer building-plant behavior, there is a gap in the literature about the joint dimensioning of these systems. Therefore, in this study, the sizing of PV is done based on both the HP specification and all the thermal loads (both heating and cooling).
5. Discussion
The size of the PV system plays a crucial role in determining the economic viability, feasibility, and extent of adoption [
68]. Thus, designing optimal systems sizing is essential for achieving reliability and the highest degree of cost-effectiveness [
19,
20,
110]. Existing studies provide combined sizing of PV+HP systems in cold climates [
63,
91,
92,
111,
112], by only considering the heating load of the house neglecting the cooling load. Similarly, other studies focus on sizing PV and battery systems without including the HP sizing [
113,
114,
115], or only focus on the sizing of HP systems [
93,
94,
95,
116]. In contrast, this study presents a mathematical model for heat pump sizing as well as a straightforward PV sizing method, shedding light on the potential of PV-powered heat pumps for residential housing based on both heating and cooling loads with stepwise sizing of the system, providing the basis for the economic analysis of the system based on the load profile and importance of coupling thermal energy storage to the PV+HP system. The house model is validated with HAP and the HP model with the manufactural datasheets and presents the reliability of these models for future techno-economic optimizations under the circumstances of any possible locations. The heating and cooling load demand for the house is obtained by developing an open-source Python model of the house as it gives more flexibility in terms of customization to the users as compared to HAP software. HAP has limitations in terms of customization, and users are typically bound to the offered features i.e., it takes default values for certain parameters whereas the proposed model parameters can be modified as required giving an advantage for unique or specialized simulations.
The open-source house model, including the heating/cooling loads that can be regulated by the users, is developed and well-defined. The simulation results are obtained on an hourly, daily, and monthly basis. Although monthly data provides seasonal variations and trends with an understanding of monthly energy consumption, it may not provide short-term variations within the month. Daily load data simulations, however, provide more details than monthly load data but still lack the granularity of hourly load simulations. Hourly load data simulation is also useful for understanding the impact of diurnal and seasonal change; however, it requires more computational time and detailed input data. Since the sizing of one component can affect the other it is therefore necessary to analyze the mutual influence to appropriately size the whole system and this is achieved in this study by hourly simulation data. The system sizing based on hourly simulations provides more precise results compared to monthly for understanding energy consumption and PV self-consumption and self-sufficiency on specific days which is used for import/export of electricity to/from the grid providing especially for economic studies and evaluating peak loads which are shown in this study. Furthermore, the open-source black box air-air heat pump model is developed based on the Goodman manufacturers’ datasheet and hourly load of the house. The COP and EER of the proposed HP model 0301B series on the coldest and for 0421B on the warmest day are 2.06 and 4.42 respectively. This underscores the need to correctly select the situation that the optimization is run for in the system.
The maximum size of PV required to provide the power to run the heat pump to supply the residential thermal loads is estimated as 6.88 kW. The PV system is designed in SAM with an aim to minimize the grid electricity costs and the emissions from the residential sectors, aligning with the overarching goal of achieving net zero energy consumption. Therefore, in this study, PV power generated over the year, monthly, and on the coldest /warmest day as well as on the spring/fall equinox is also presented with self-consumption and self-sufficiency of PV as well as energy sent to/from the grid to provide clarity. By integrating these analyses, the study not only addresses immediate energy needs but also contributes to the larger objective of sustainable energy practices and achieving a net zero energy footprint for the residential sector. Residential sectors account for energy use 20% of energy consumption in Ontario [
117] where 40% of emissions come from space and water heating [
118] i.e., an average home in London emits 10.5 tons of carbon emission each year [
118]. To reduce these emissions and achieve Canada’s net zero energy goal [
7], the data obtained for energy sent to/from the grid will give us a reference to fulfill our missing targets. It also highlights the change in energy sent to/from the grid based on the hourly and monthly load profile which is an important consideration when it comes to an economic analysis of the system model.
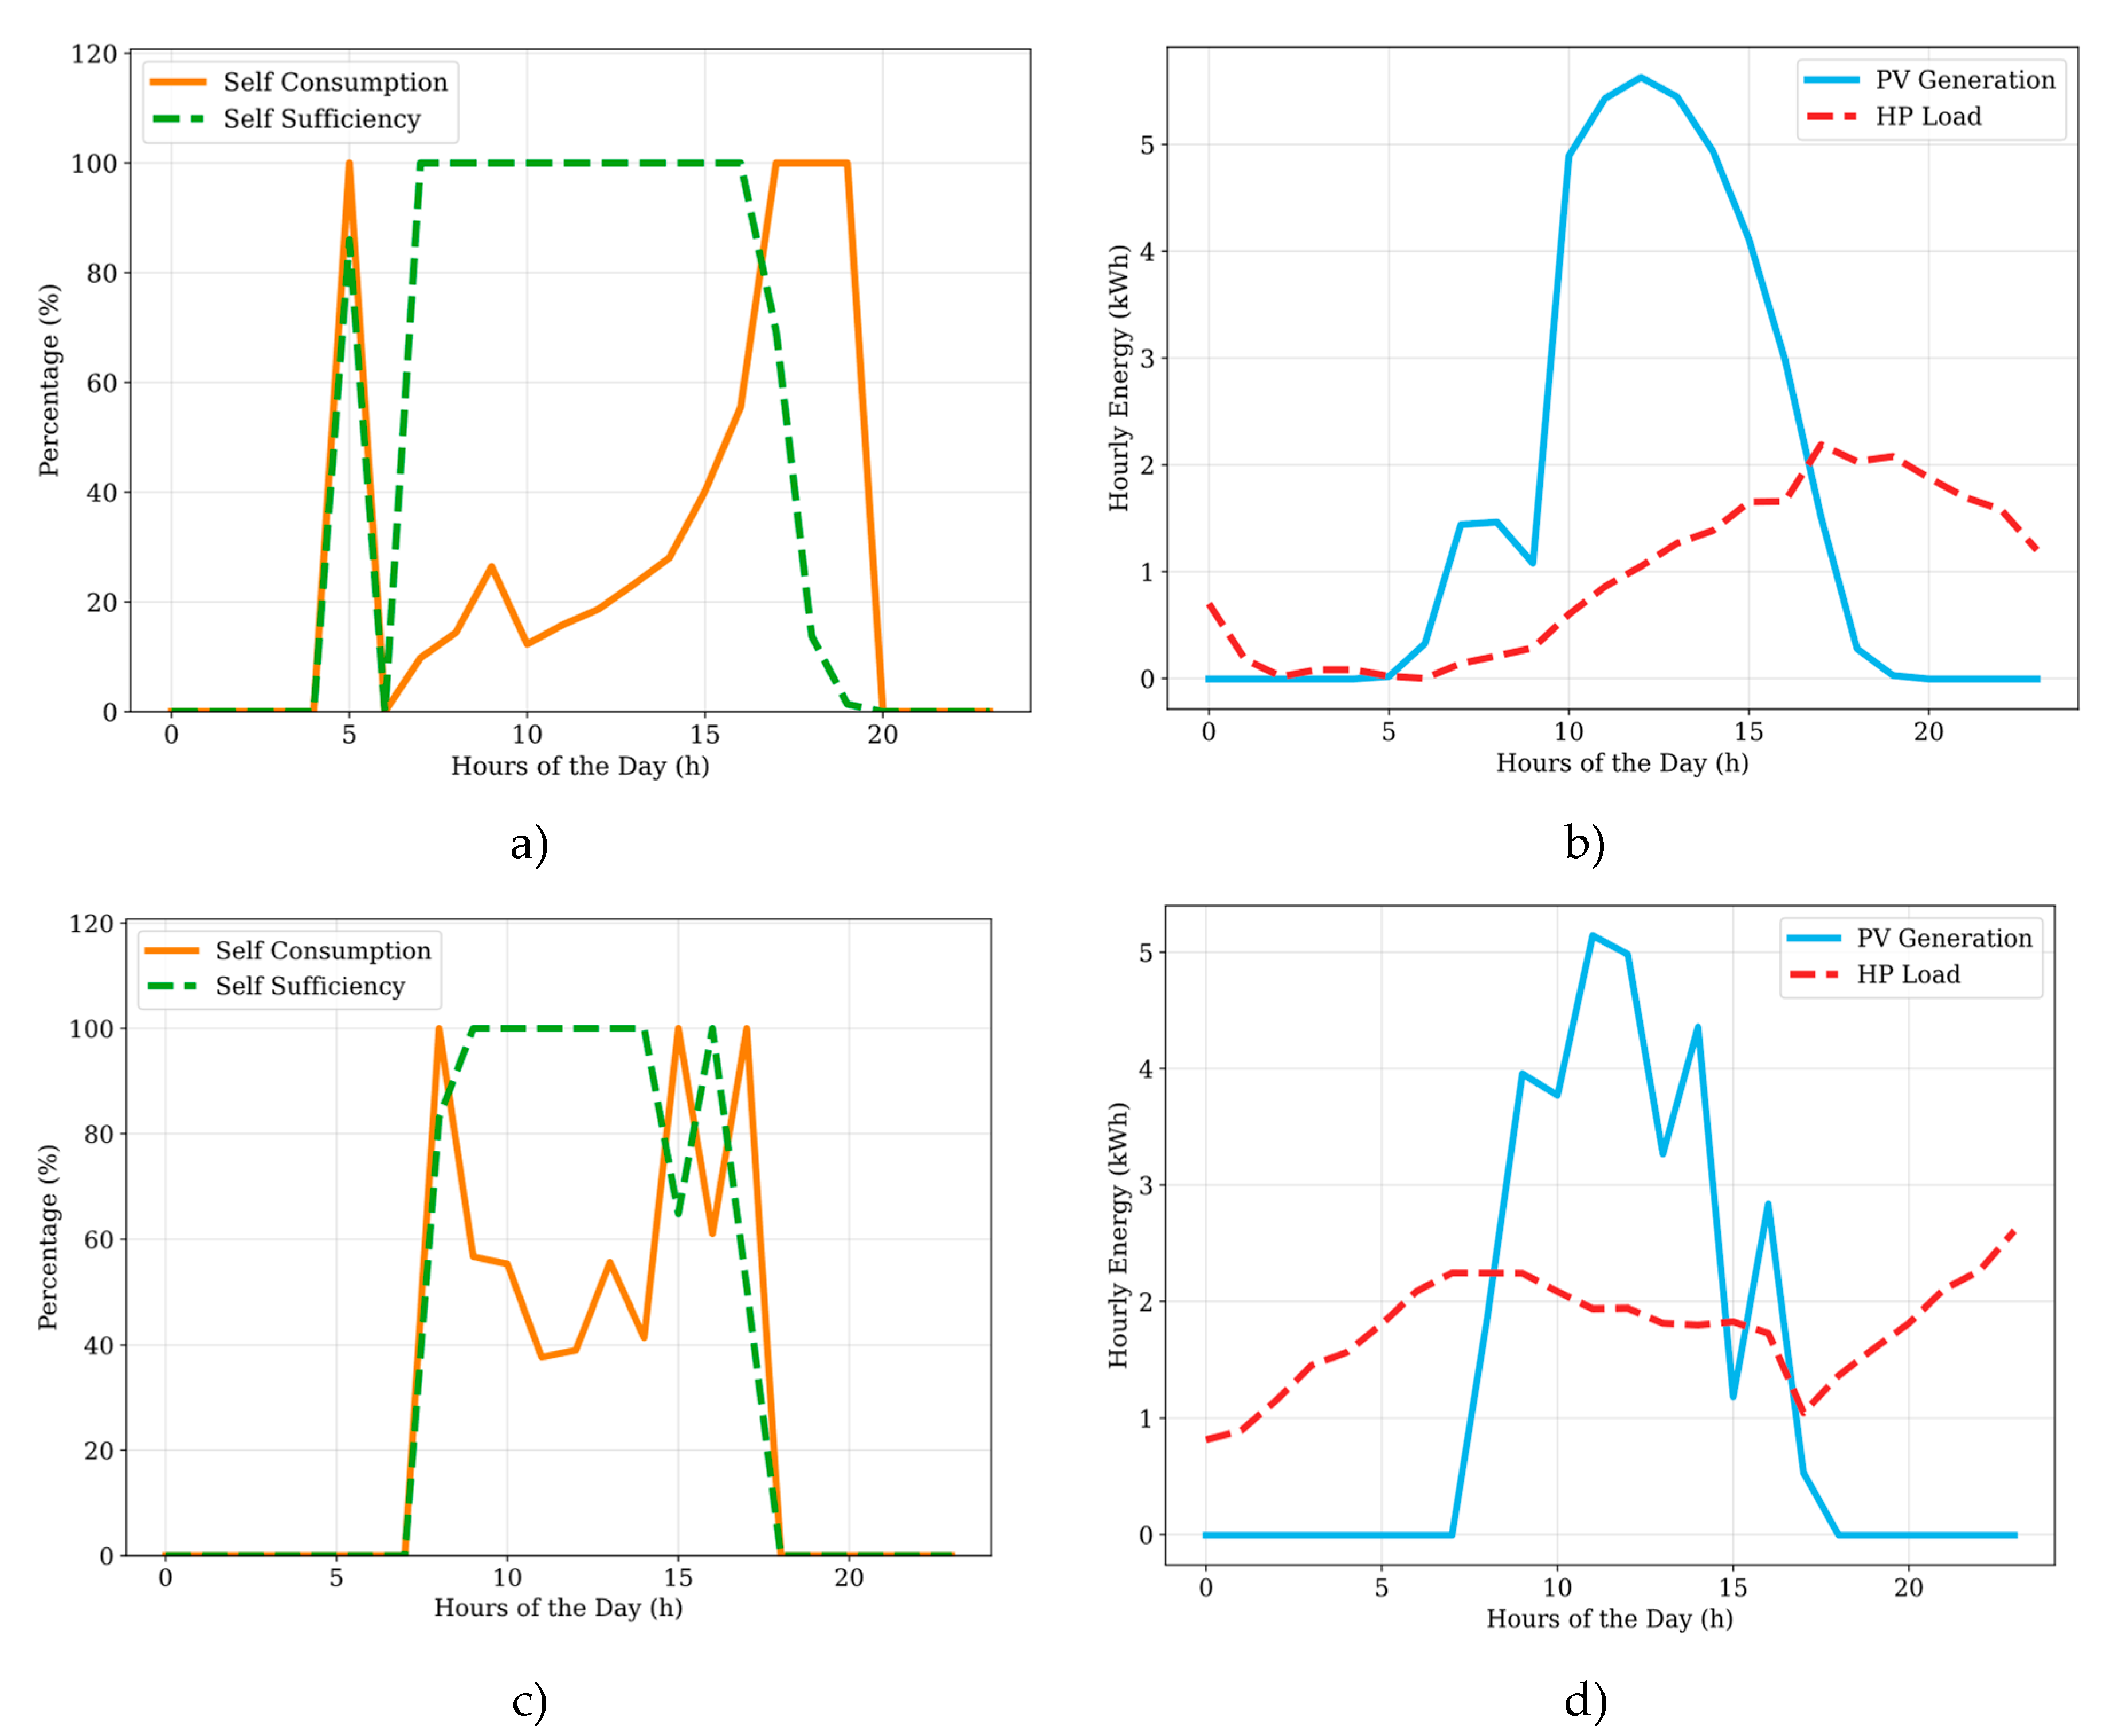
It is also shown in this study referring to the coldest, warmest, spring, and fall equinox day of the year that there is a peak time mismatch for maximum PV generation and peak-time HP load as shown in
Figure 13b, PV generation peaks in the middle of the day, while the heat pump load reaches the peak at 5 pm for summer. Similarly, on February 17, the heat pump load is elevated during the nighttime due to a significant drop in winter temperatures, resulting in increased heating demands. The PV generation, however, reaches its peak in the middle of the day, causing a peak load timing discrepancy during the winter as well as shown in
Figure 13d. Similar trends are also seen on the spring and fall equinox as shown in
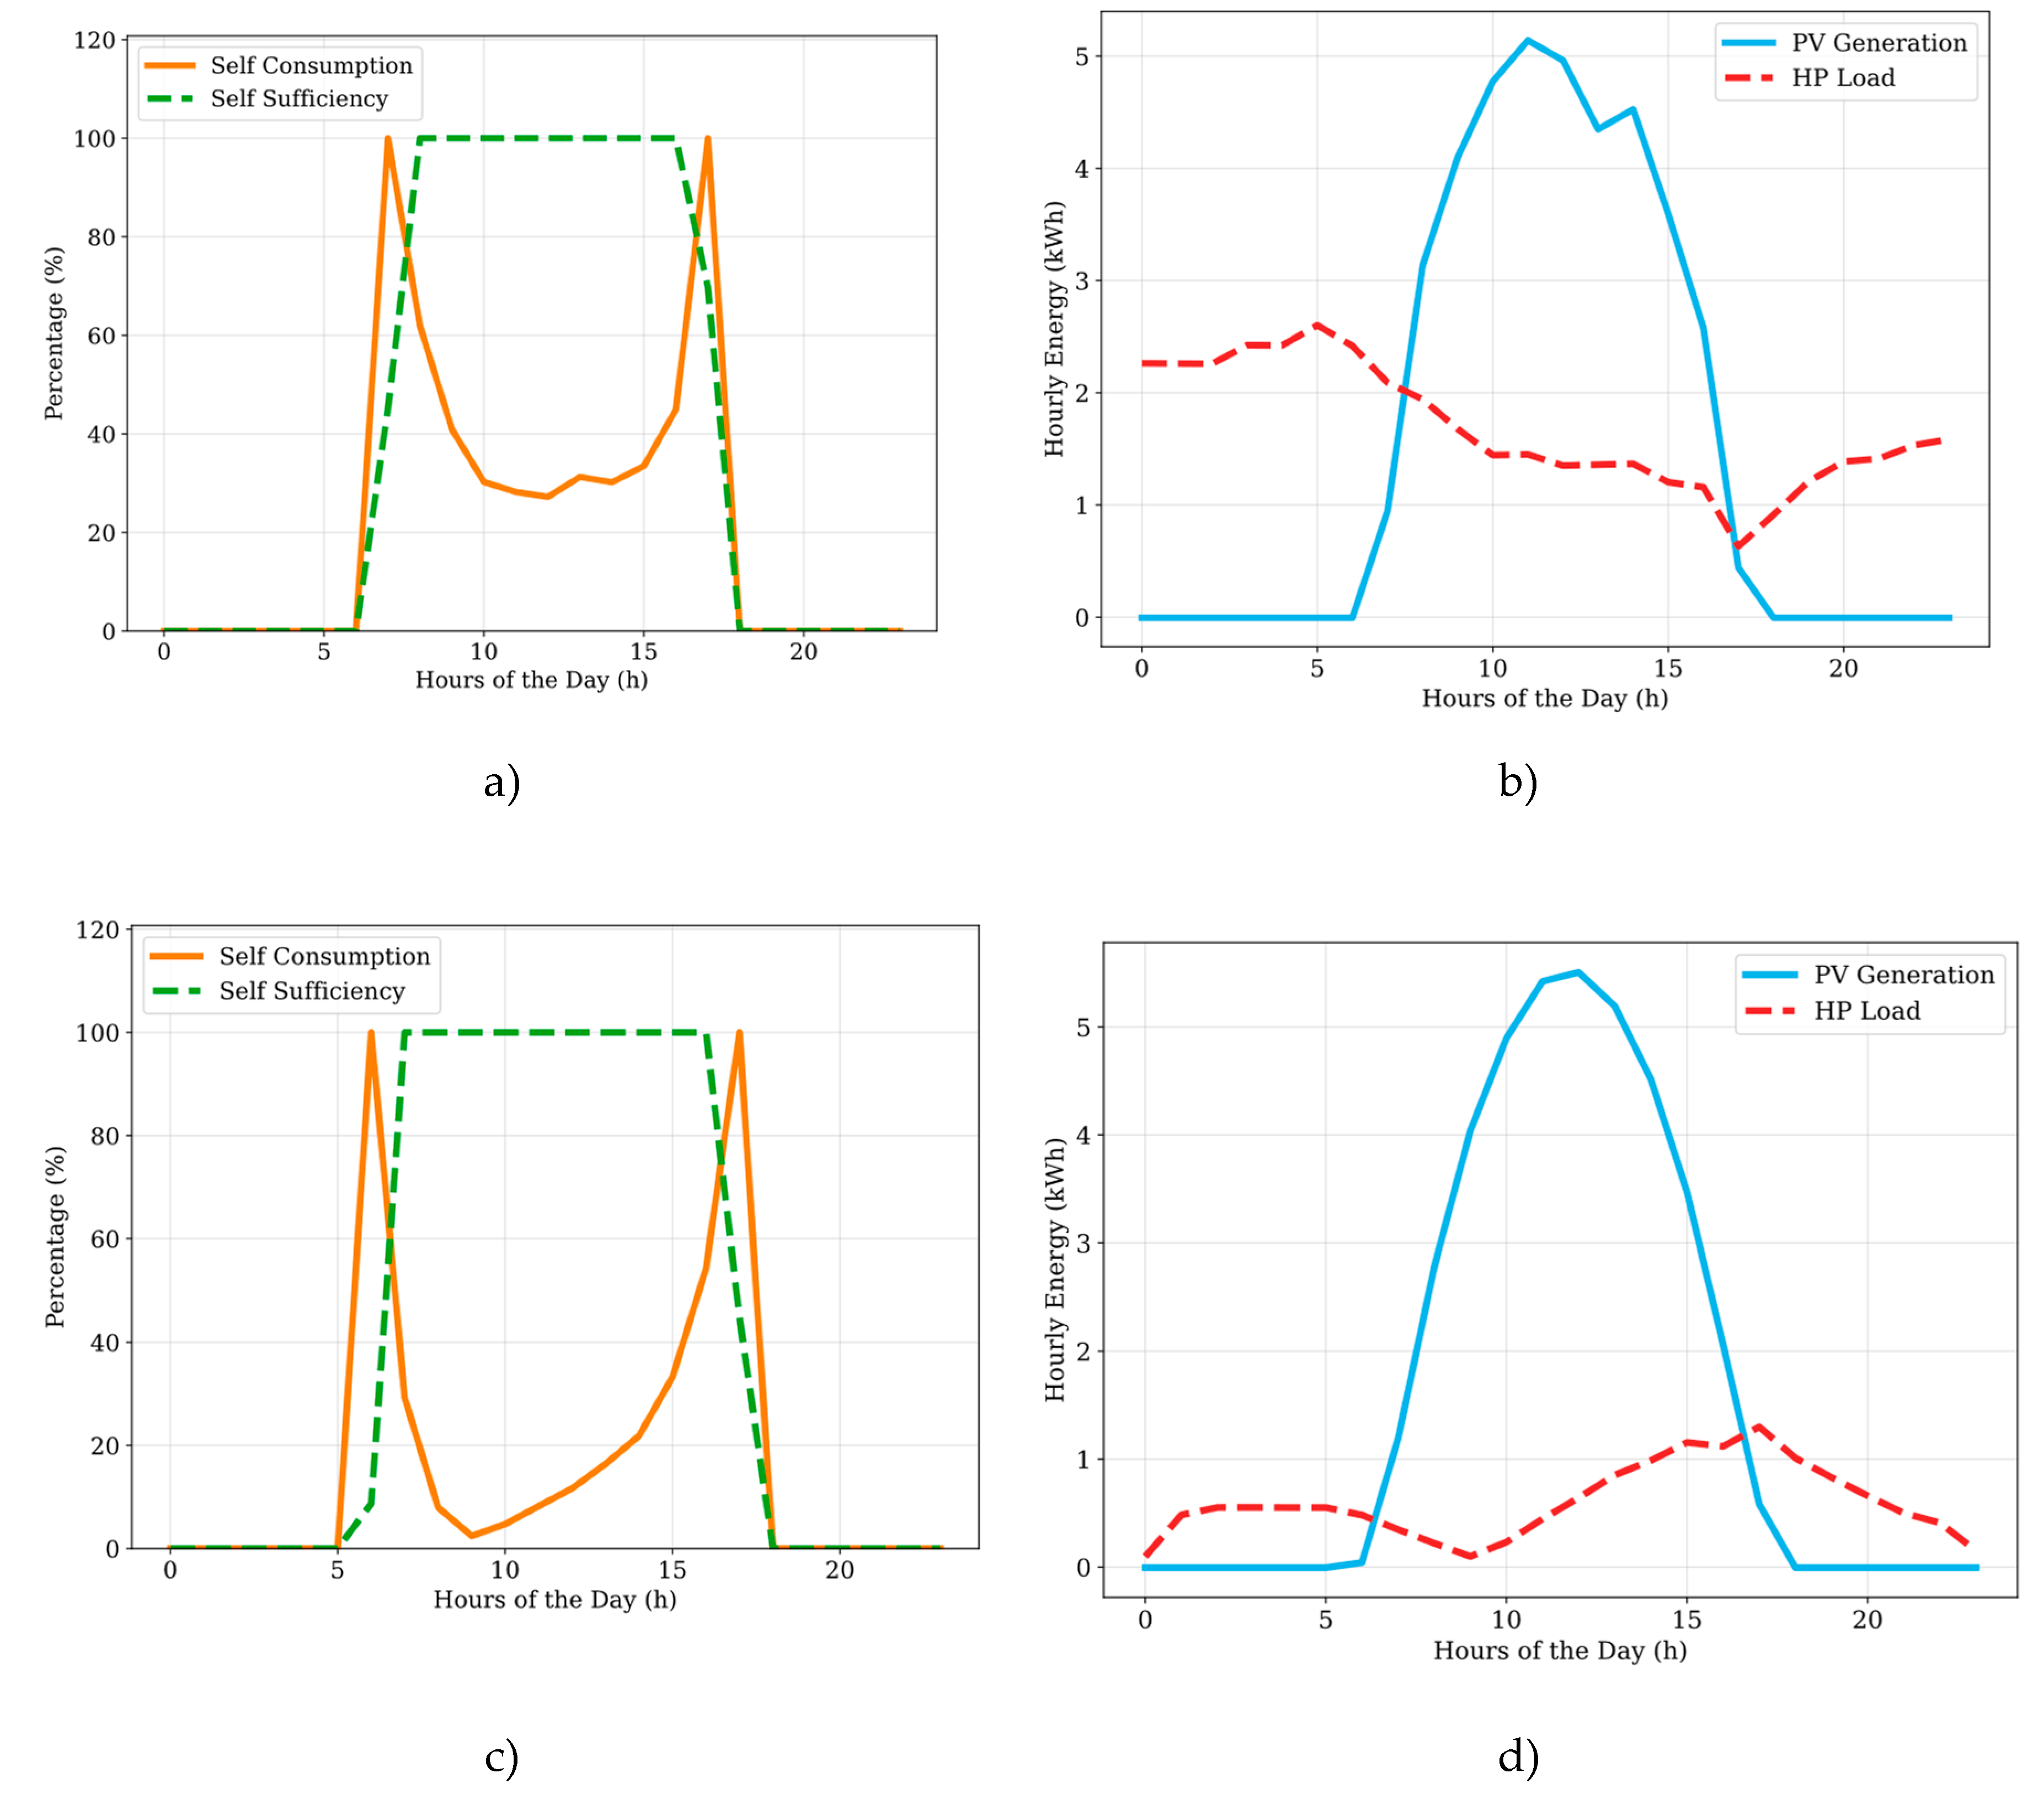
Figure 14 b, d. Thus, maintaining the reliability on the grid during these periods is critical. This, however, opens future opportunities to store the excess PV energy generated during these mismatch periods in thermal energy storage systems (i.e., thermal batteries) to increase the reliability of system models and decrease the dependence on the grid.
One of the limitations of this study pertains to the use of only the Gaussian model to generate the hourly data from the monthly energy. The main argument for using another model was to show the importance of generating accurate hourly data on PV system sizing in residential buildings' heat pump applications. The results have, expectedly, revealed the importance of hourly data for PV-HP energy performance and economic analysis. Future work is required to investigate the impact of changing the mean and standard deviation of the normal distribution on the PV performance. This could result in proposing an optimal distribution model that matches the hourly data generated in this study. Further studies are also required to investigate other types of statistical distributions for the heat pump load [
119]. These results can be further improved by incorporating non-HP electric loads into the full system with sizing. Future work can also include the optimization of this model based on the other constraints i.e., space and specific economic limitations. These results can also to used further to size the backup system for the model for example integration of a thermal storage system i.e., developing an optimal thermal battery (TB) model that can store the excess energy from the solar PV during the generation in off-peak time period and use it during the peak time period such the need of electricity from the grid can be minimized. Moreover, this thermal battery model should also be sized accordingly based on the economics and size of the whole system, which again raises the need for economic analysis of the PV+HP+TB system. Along with this, the strategy needed to store energy in the TB system to be developed with a detailed thermodynamic model of the heat pump to optimize the size of TB and obtain its charging and discharging capability. Further, the study can also include electrical loads and domestic hot water demand throughout the year and optimize the system together making it more sustainable leading the path to net zero energy goal. It also opens the scope of doing economic efficiency and environmental impact studies to calculate yearly carbon tax/reduction yearly compared to conventional fossil fuel systems.
Author Contributions
Conceptualization, J.M.P.; methodology, S.R., U.J., N.A., K.S.H., J.G. and J.M.P. ; software, S.R., U.J., N.A., K.S.H., J.G.; validation, S.R., U.J., N.A., K.S.H., J.G. and J.M.P.; formal analysis, S.R., U.J., N.A., K.S.H., J.G. and J.M.P.; investigation, S.R., U.J., N.A., K.S.H., J.G. and J.M.P.; resources, J.M.P.; data curation, S.R., U.J., N.A., K.S.H., J.G.; writing—original draft preparation, S.R., U.J., N.A., K.S.H., J.G. and J.M.P.; writing—review and editing, S.R., U.J., N.A., K.S.H., J.G. and J.M.P.; visualization, S.R., U.J., N.A., K.S.H.; supervision, J.M.P.; funding acquisition, J.M.P. All authors have read and agreed to the published version of the manuscript.
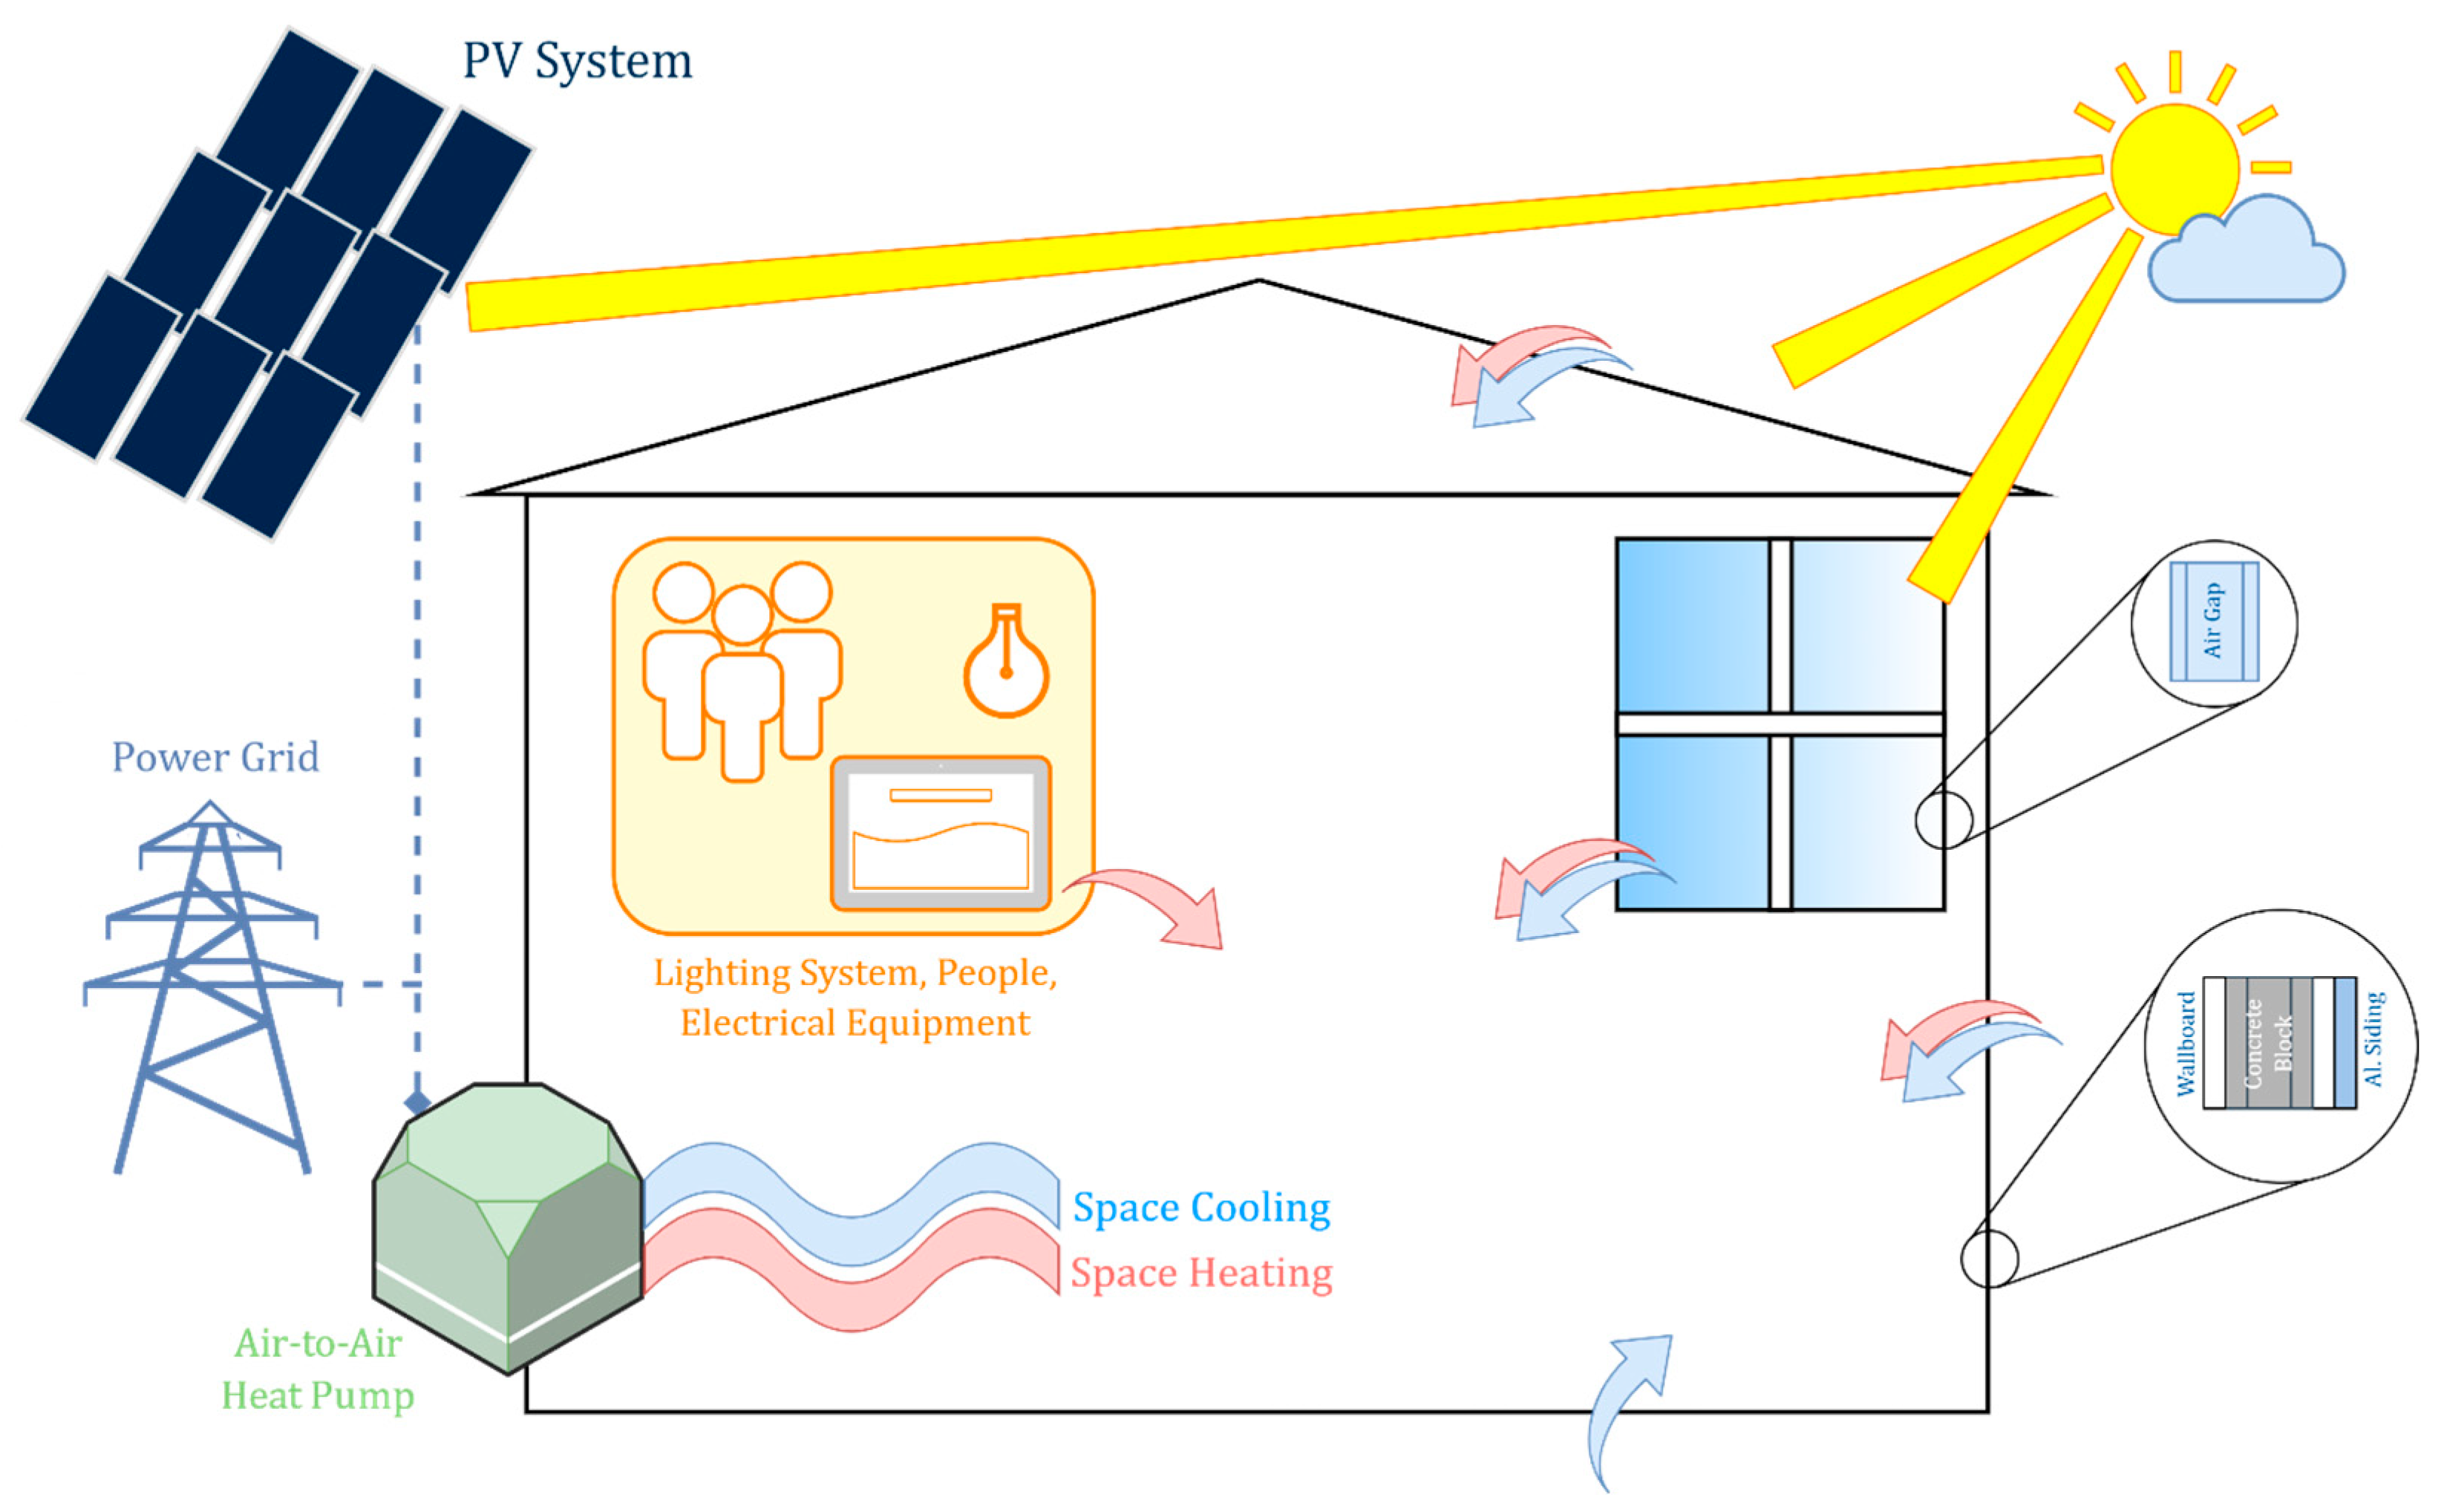
Figure 1.
Schematic of the house+HP+PV system.
Figure 1.
Schematic of the house+HP+PV system.
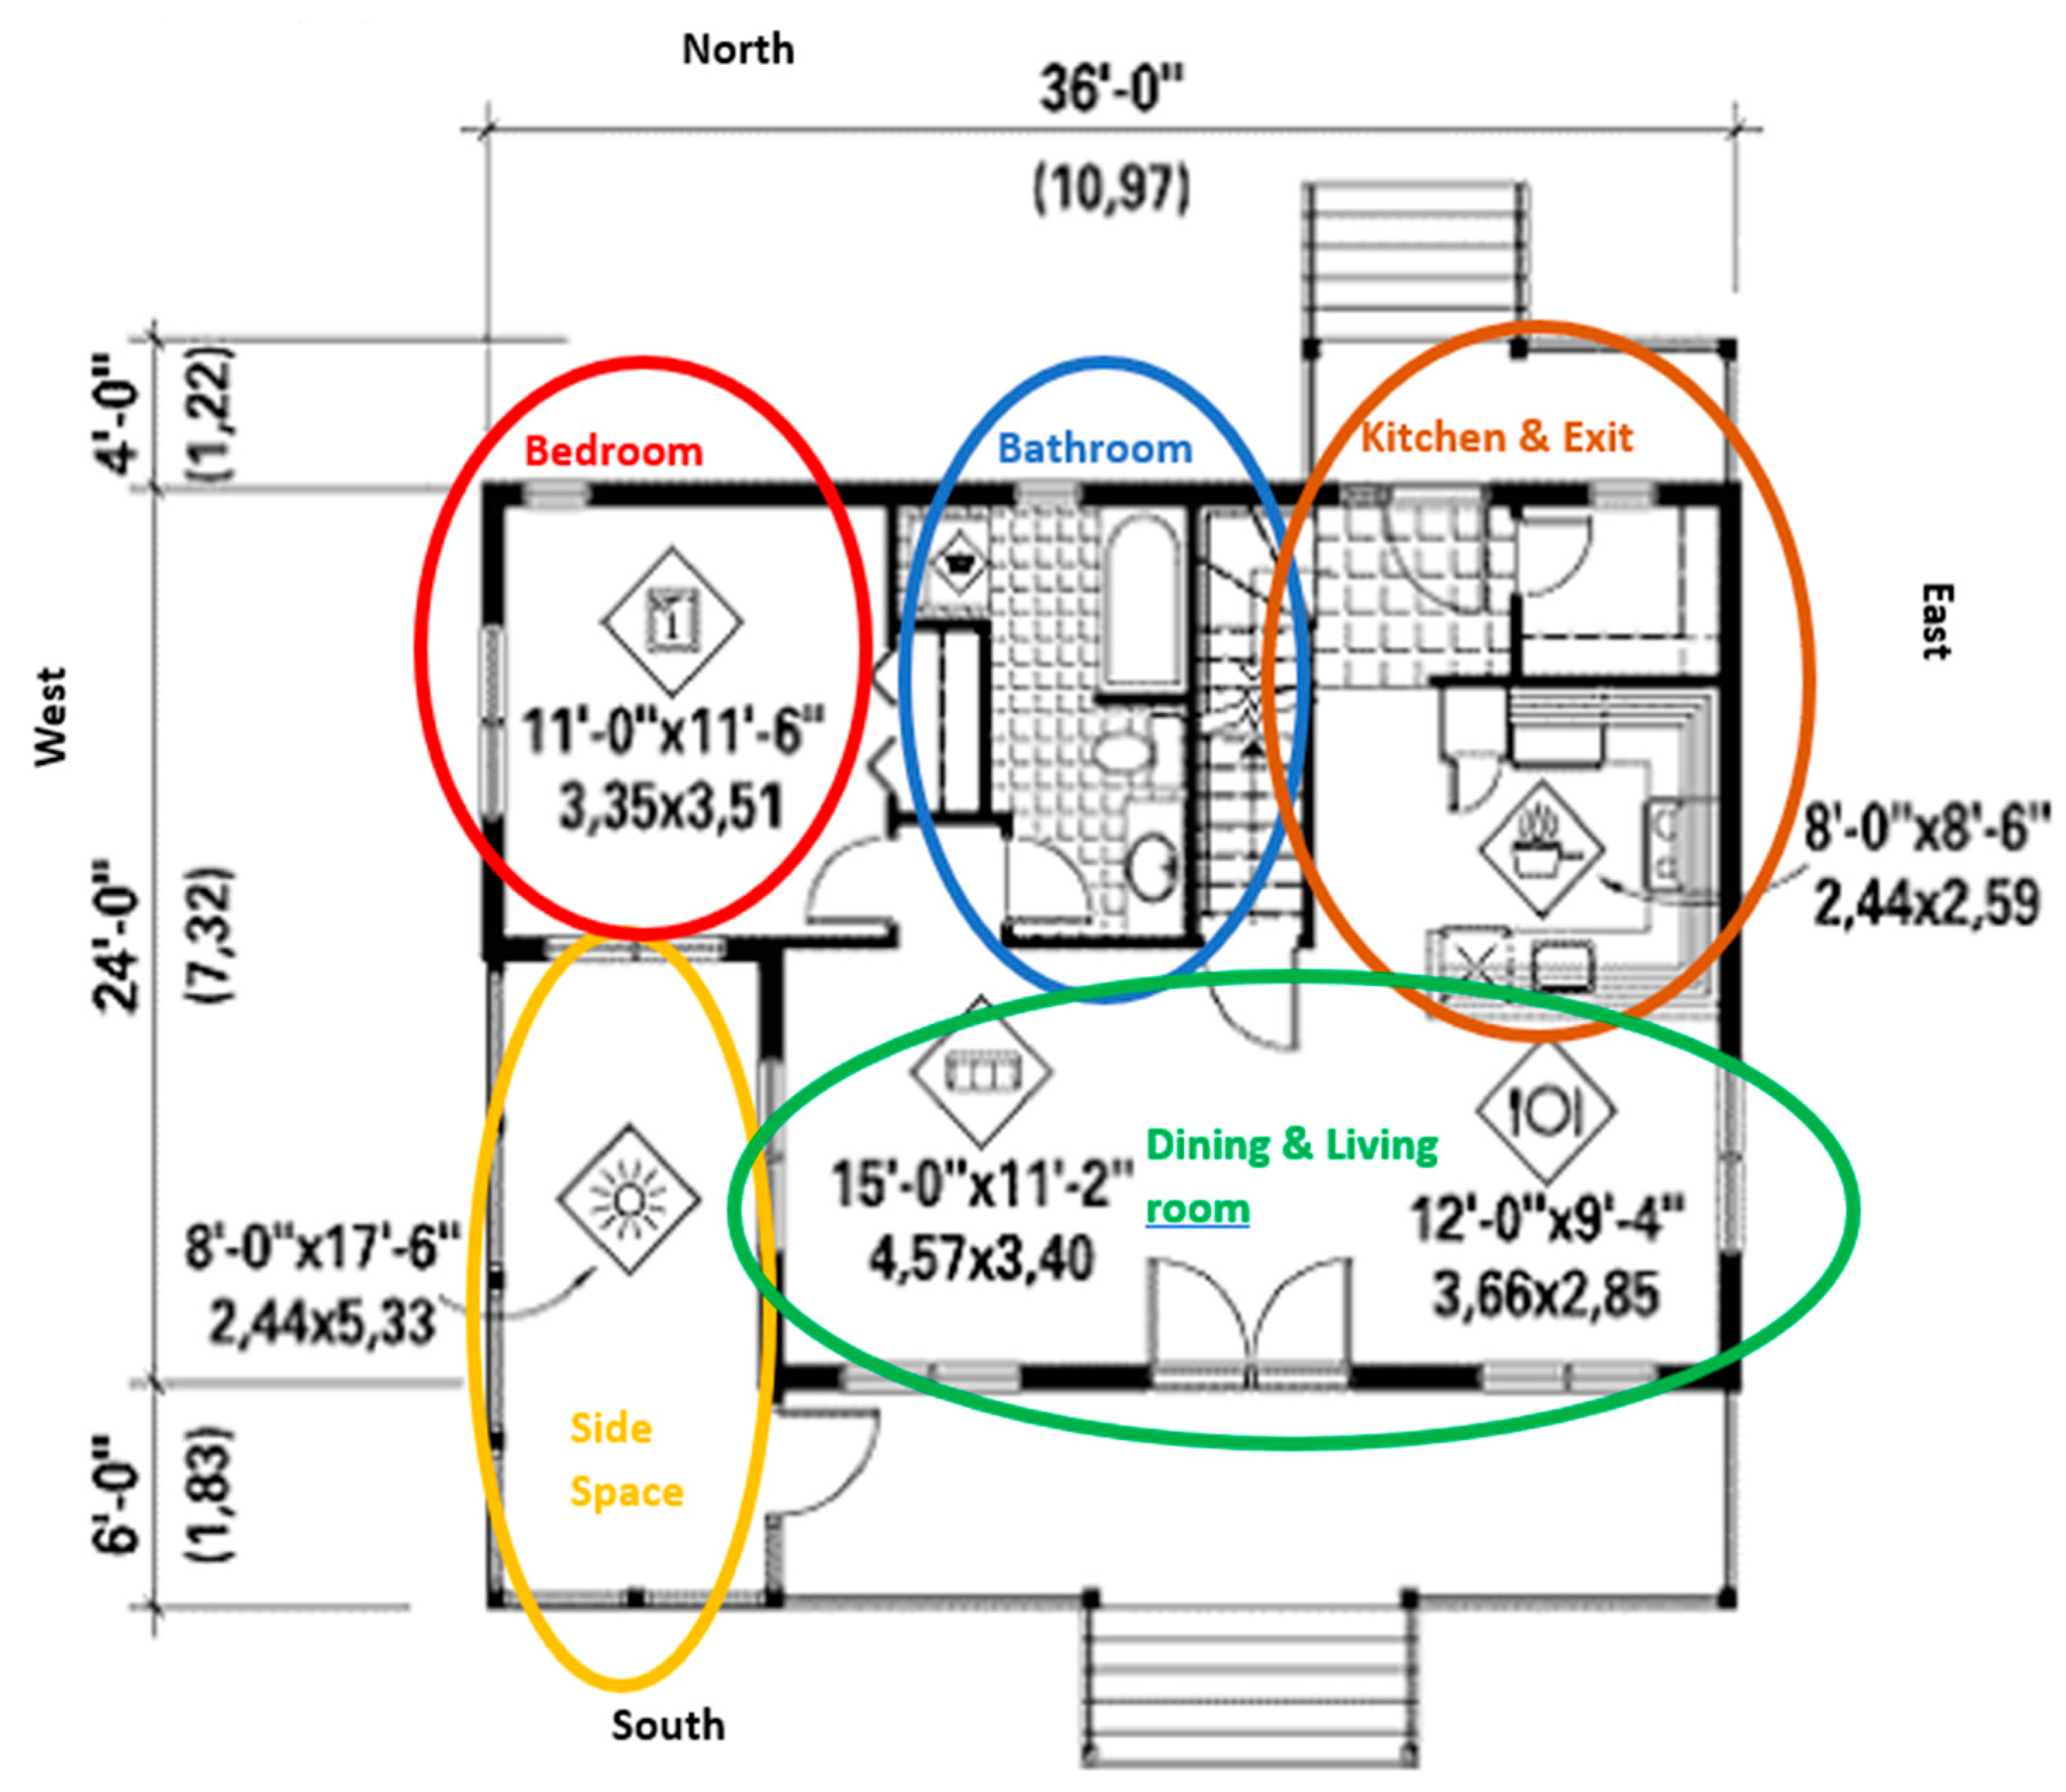
Figure 2.
Floor plan of the house.
Figure 2.
Floor plan of the house.
Figure 3.
Block diagram for heating load calculations.
Figure 3.
Block diagram for heating load calculations.
Figure 4.
Block diagram for cooling load calculations.
Figure 4.
Block diagram for cooling load calculations.
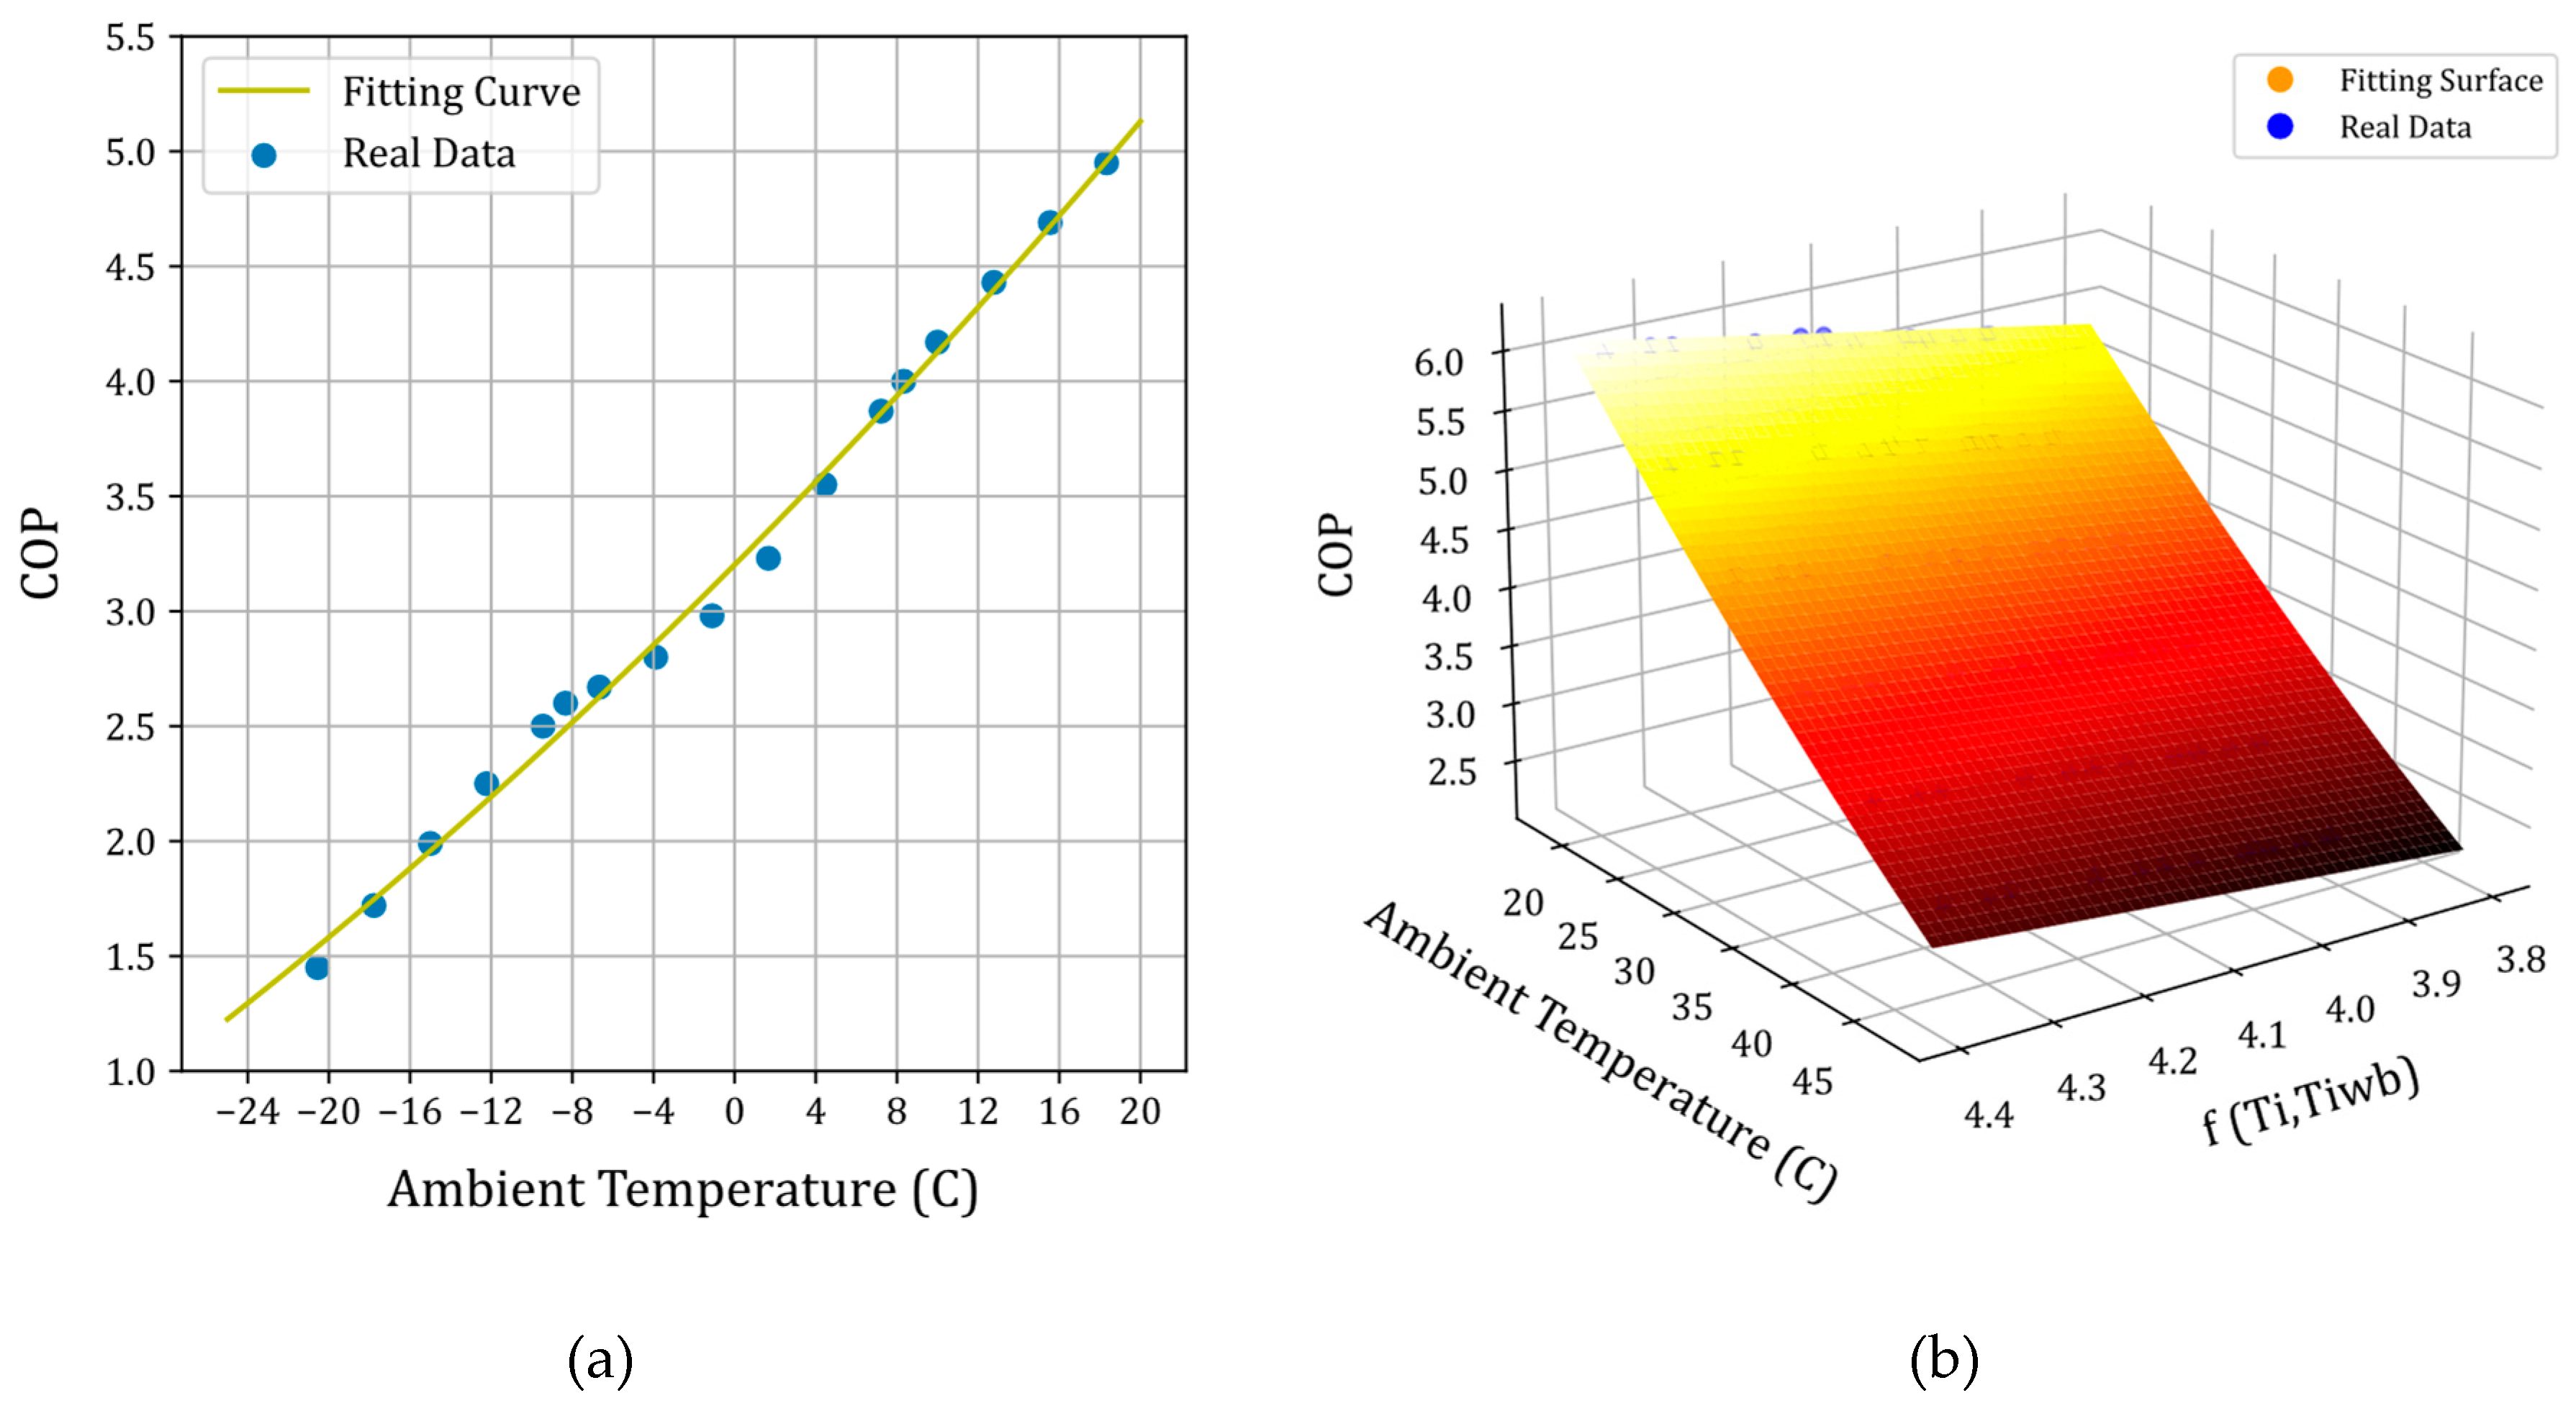
Figure 5.
Fitting curves of COP for 18,000 BTU/hr heat pump: a) heating mode, b) cooling mode.
Figure 5.
Fitting curves of COP for 18,000 BTU/hr heat pump: a) heating mode, b) cooling mode.
| Rated Capacity (BTU/hr) |
COP Coefficients |
|
|
|
|
| 18000 |
3.202 |
0.0887 |
0.000386 |
99.55 |
| 24000 |
3.202 |
0.08879 |
0.000348 |
99.53 |
| 30000 |
3.232 |
0.09092 |
-0.00048 |
99.11 |
| 36000 |
3.197 |
0.08875 |
0.000523 |
99.66 |
| 42000 |
3.093 |
0.0737 |
0.000217 |
99.44 |
| 48000 |
3.273 |
0.08474 |
-0.00024 |
99.13 |
| 60000 |
2.967 |
0.07639 |
0.000272 |
99.43 |
| |
Radiative (%) |
Convective (%) |
| Wall, window |
63 |
37 |
| Roof |
84 |
16 |
| People |
70 |
30 |
| Lighting |
67 |
33 |
| Equipment |
20 |
80 |
| Window solar |
90 |
10 |
| Infiltration |
0 |
100 |
| Temperature |
|---|
|
|
| Solar heat gain |
|
|
| Conduction |
|
|
|
| Heat transfers due to infiltration |
|
| Radiant Time Series |
|
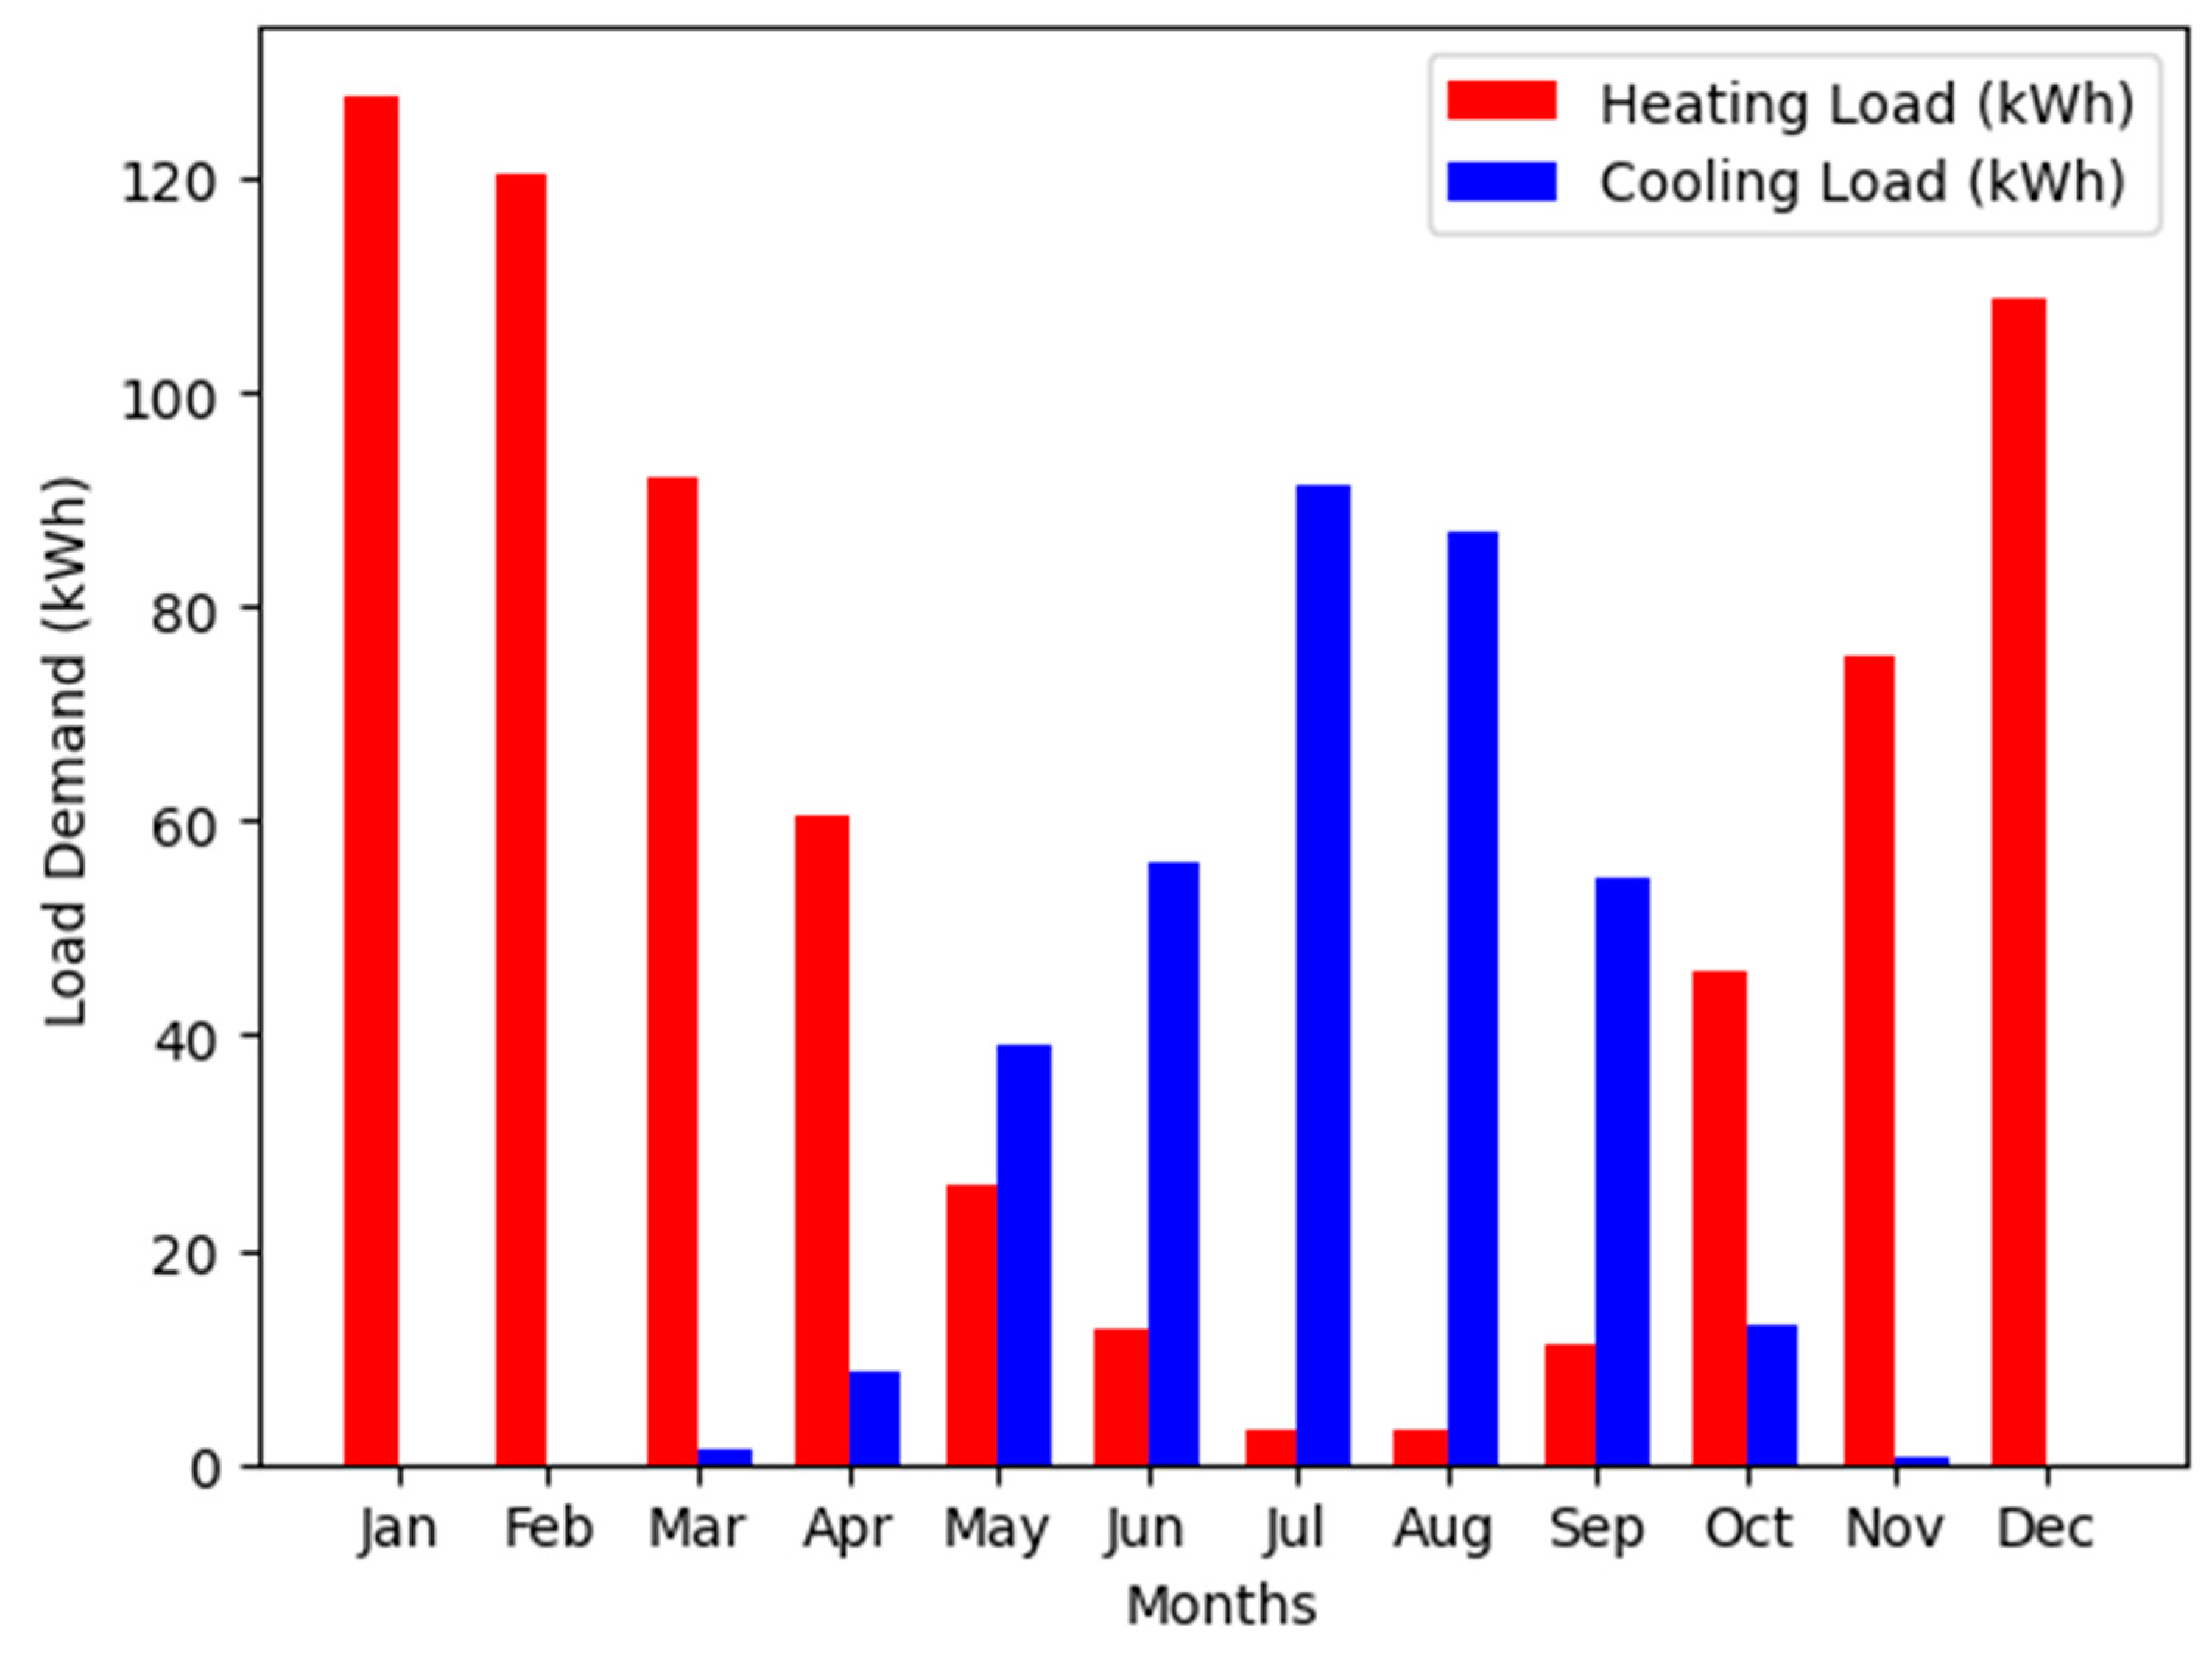
Figure 6.
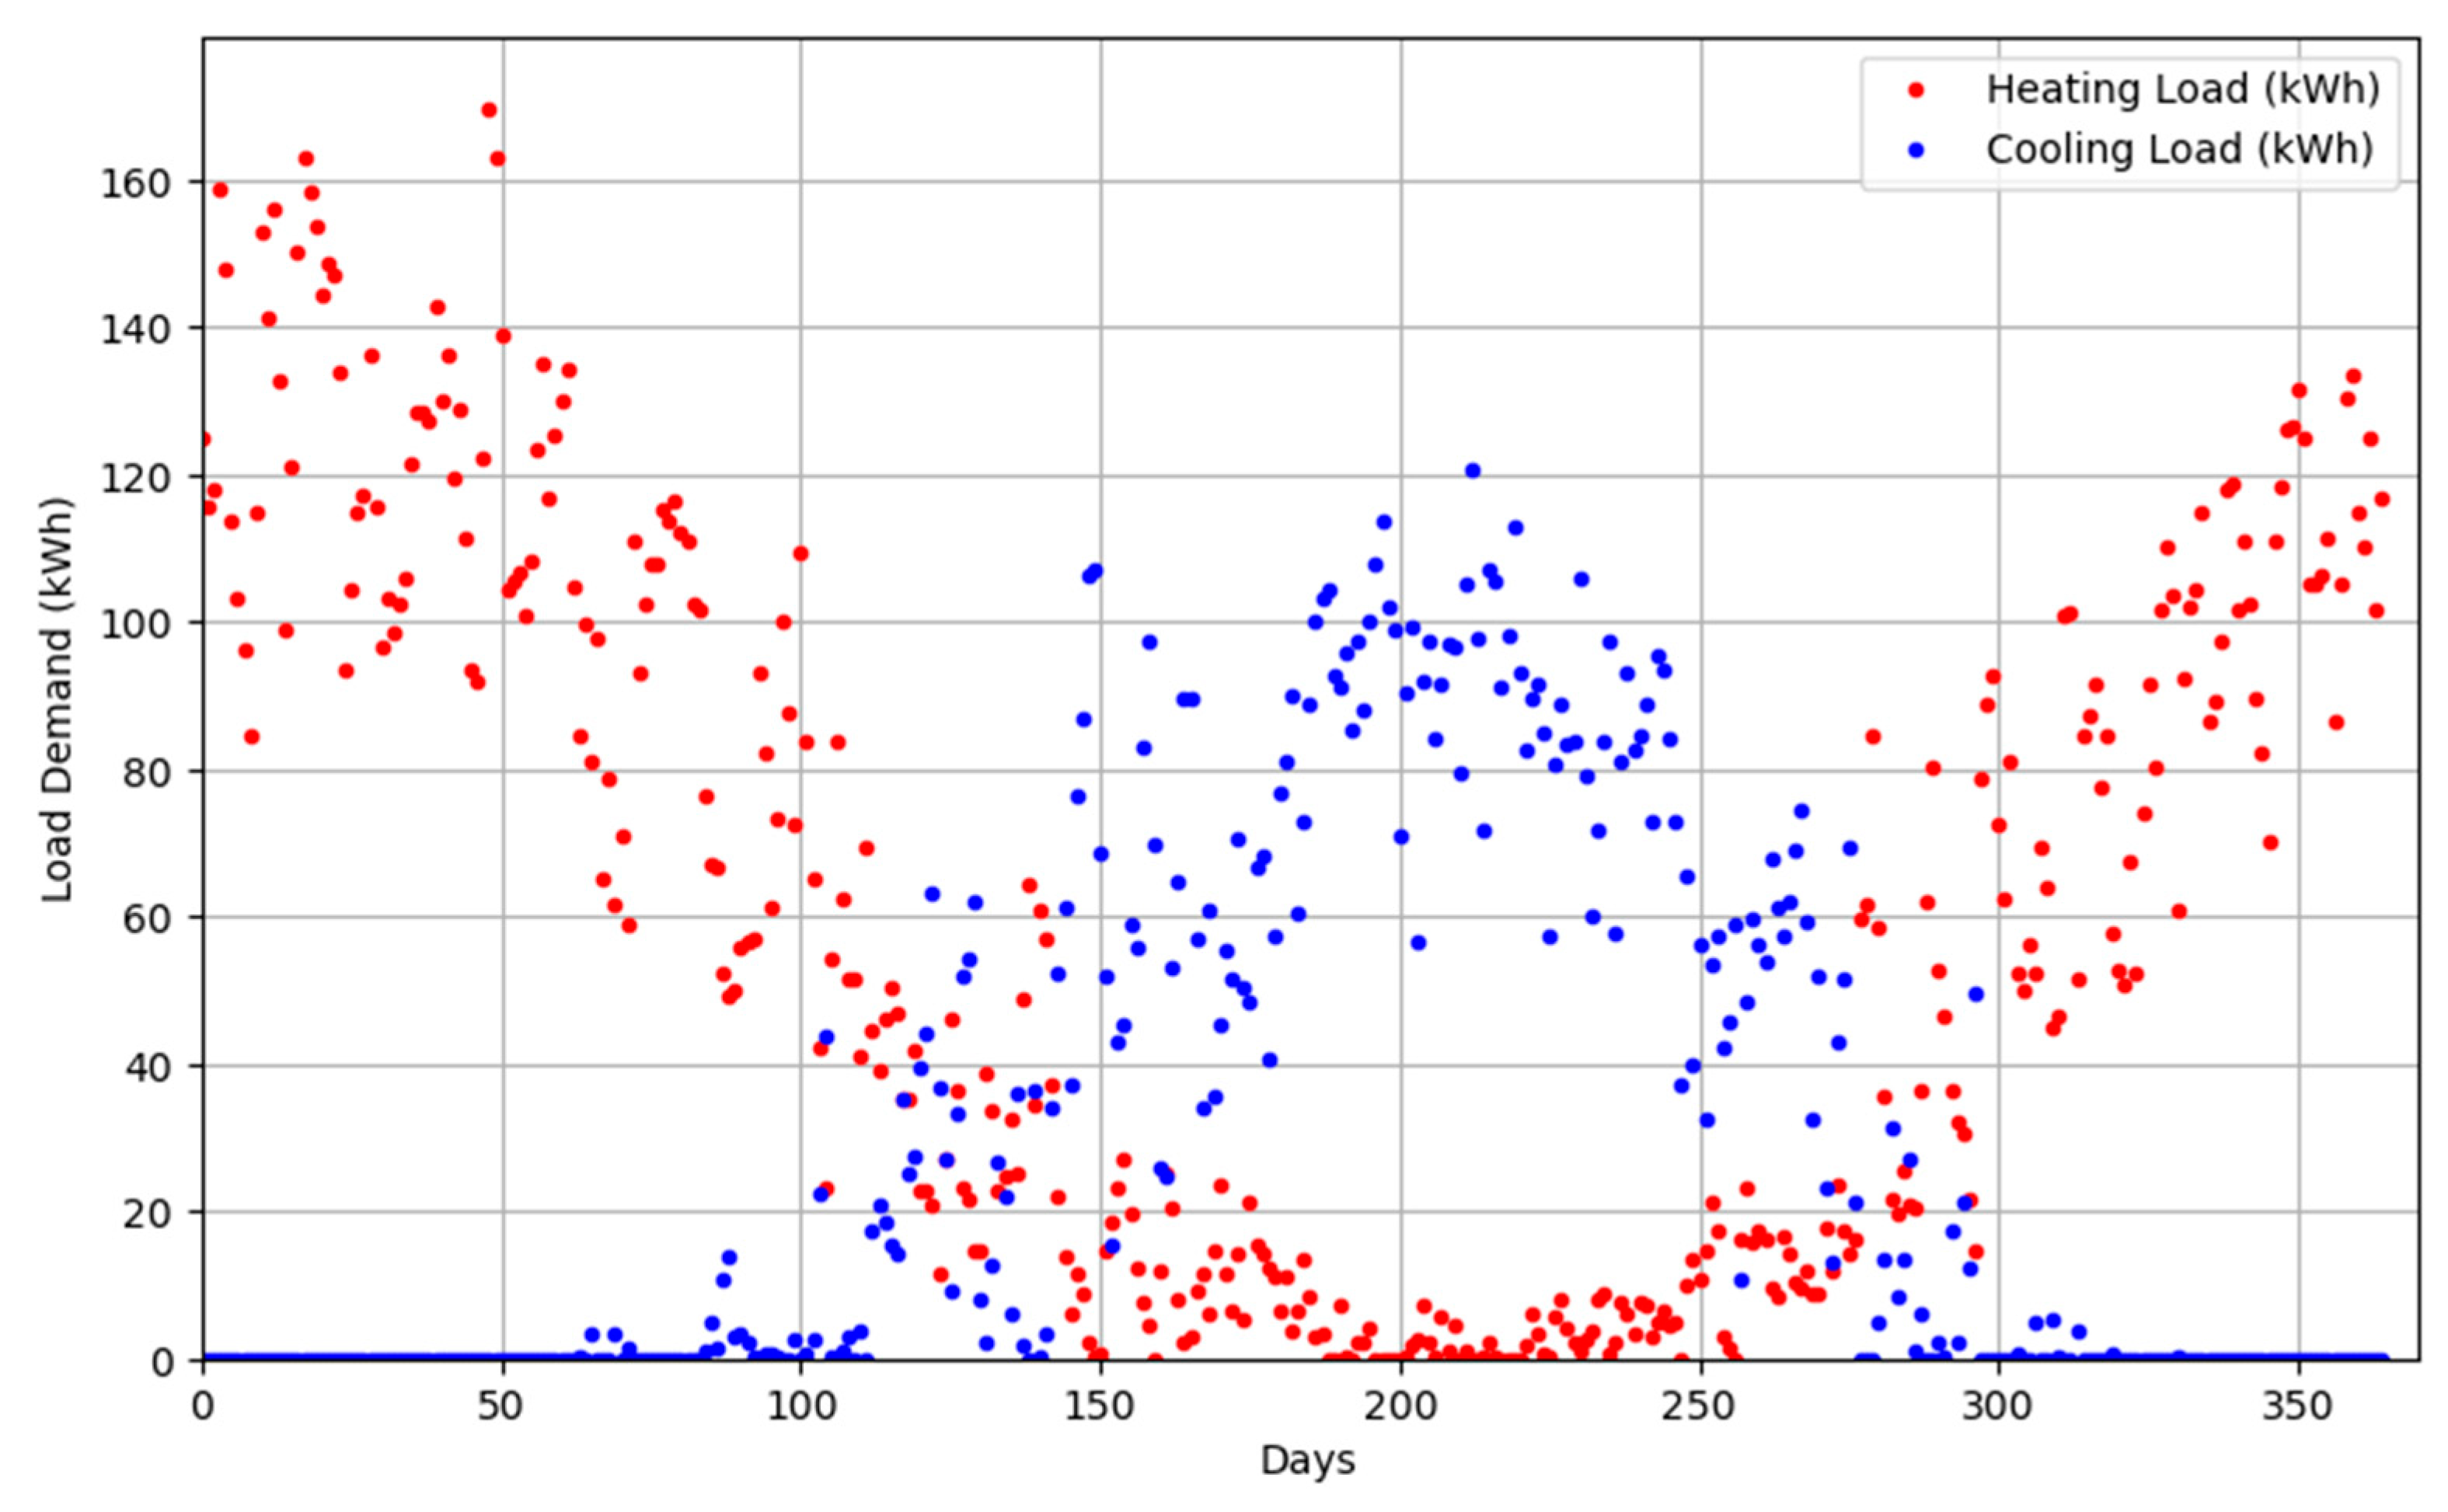
Comparison of average monthly load demand profile for heating and cooling.
Figure 6.
Comparison of average monthly load demand profile for heating and cooling.
Figure 7.
Comparison of average daily load demand profile for heating and cooling.
Figure 7.
Comparison of average daily load demand profile for heating and cooling.
Figure 8.
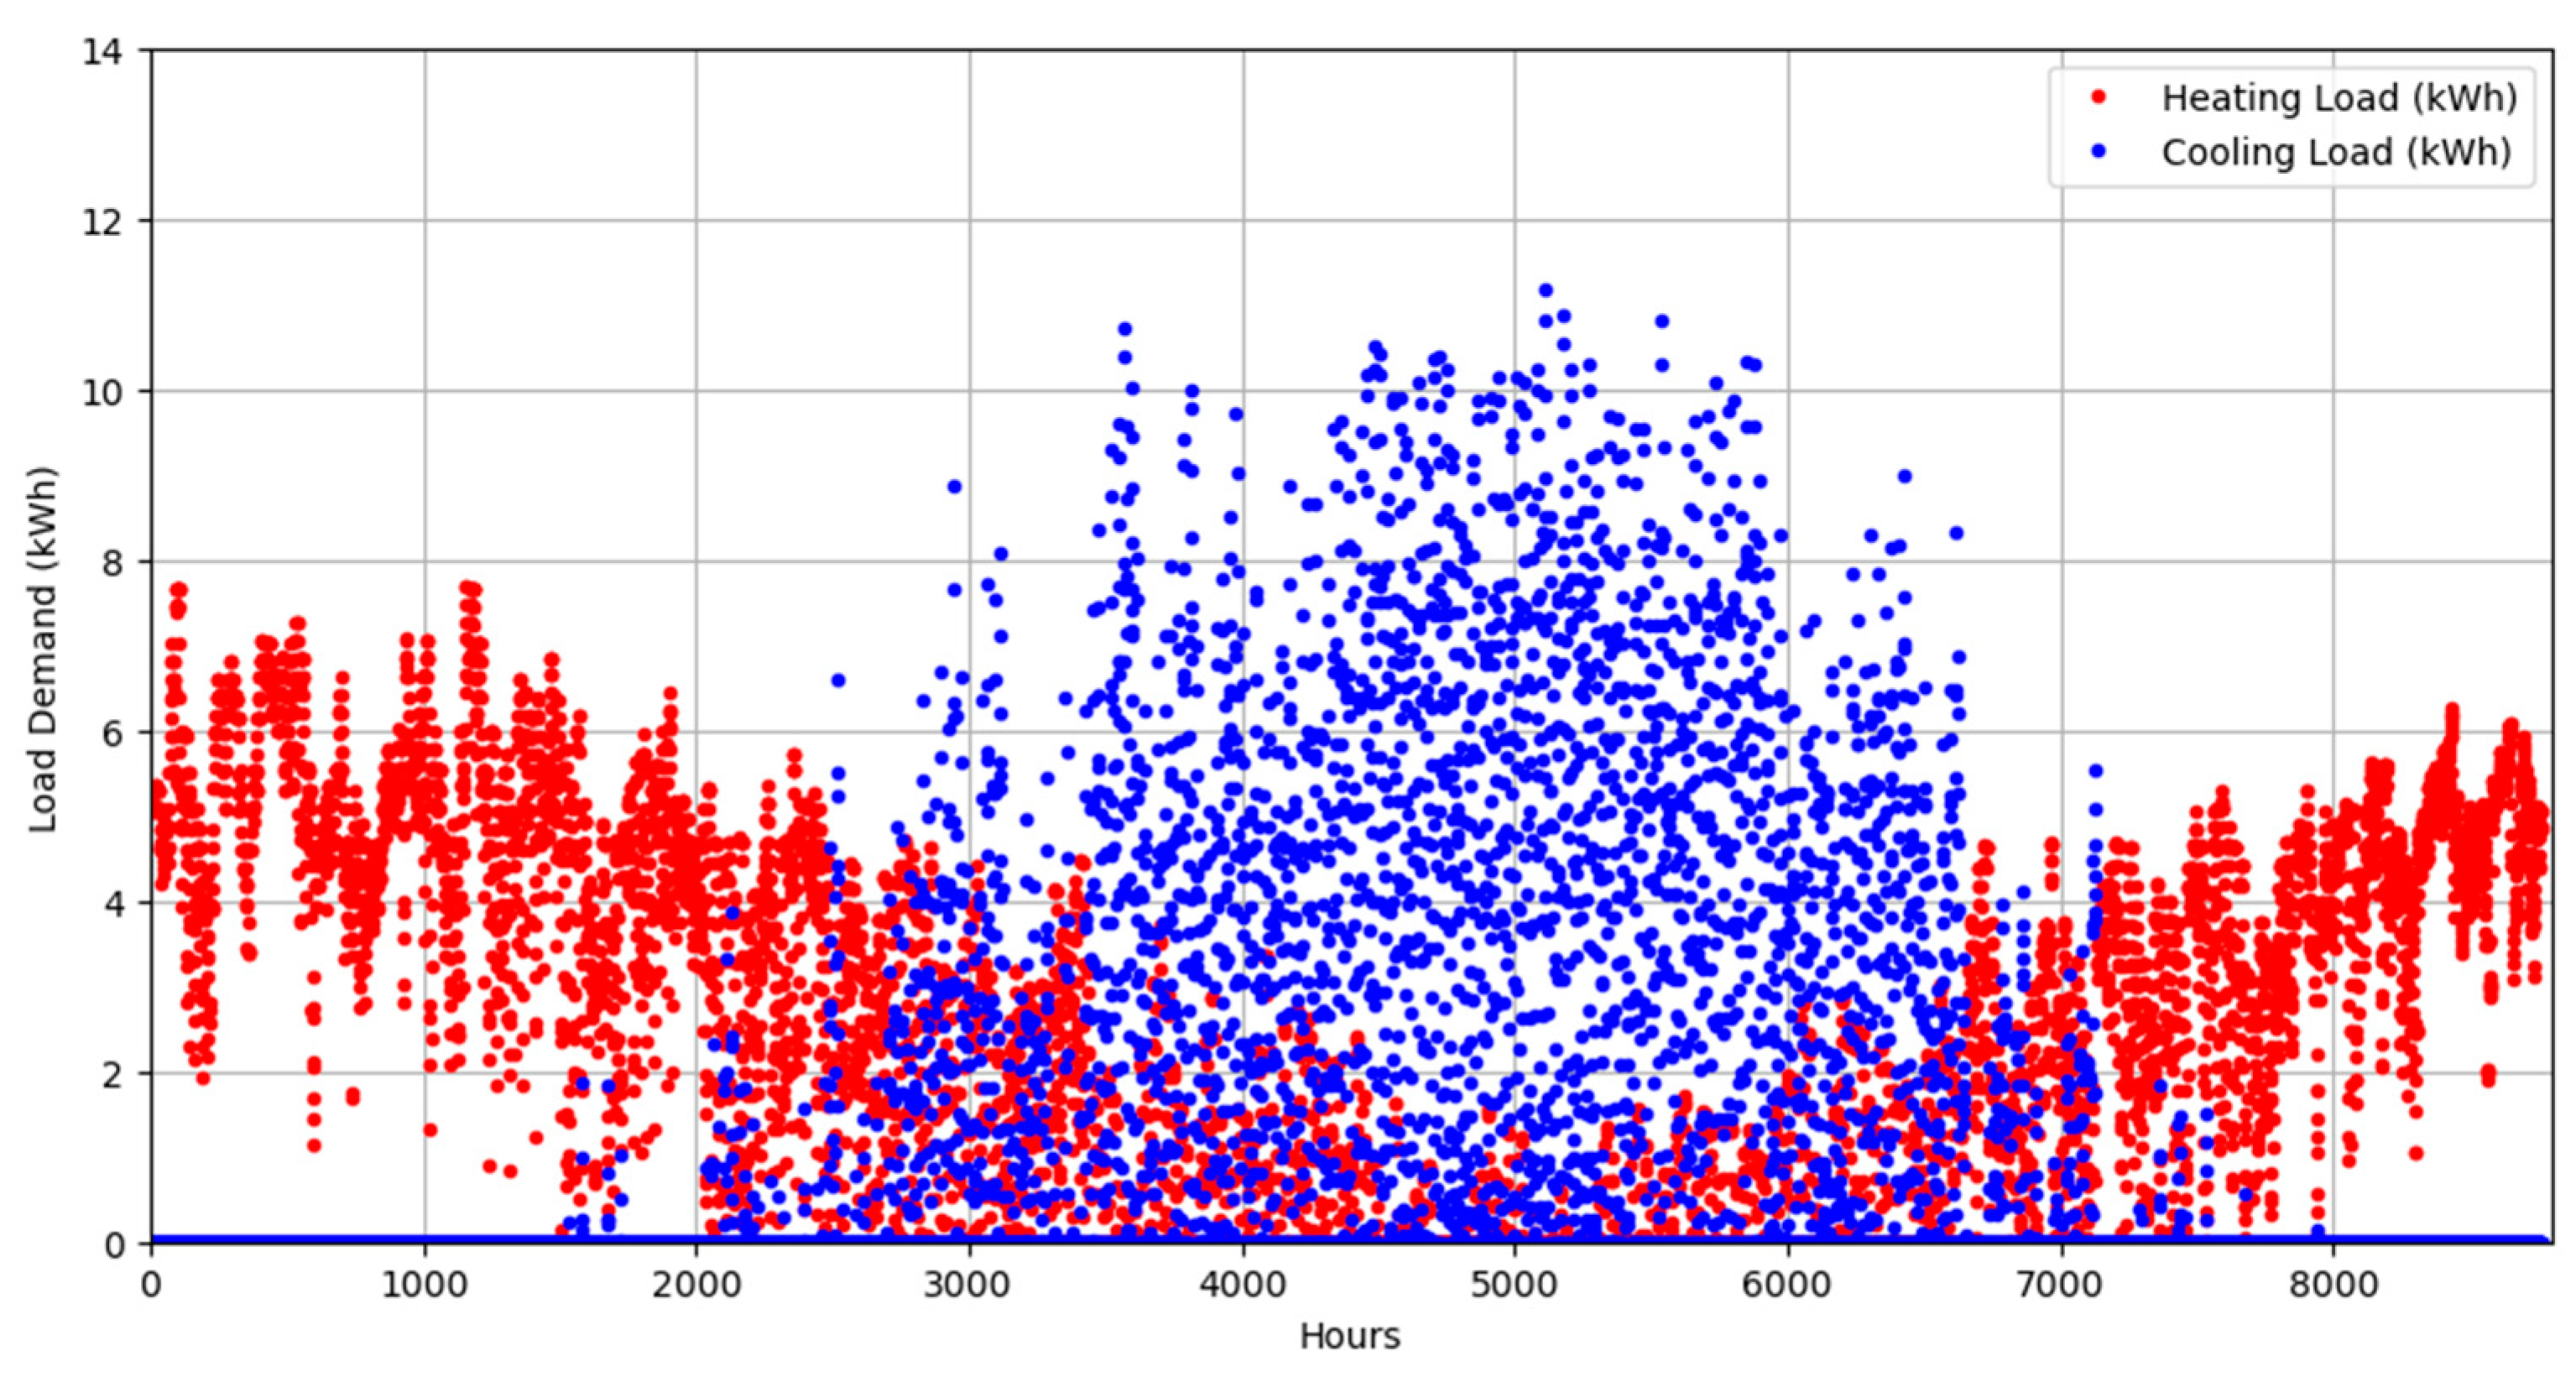
Comparison of average hourly load demand profile for heating and cooling.
Figure 8.
Comparison of average hourly load demand profile for heating and cooling.
Figure 9.
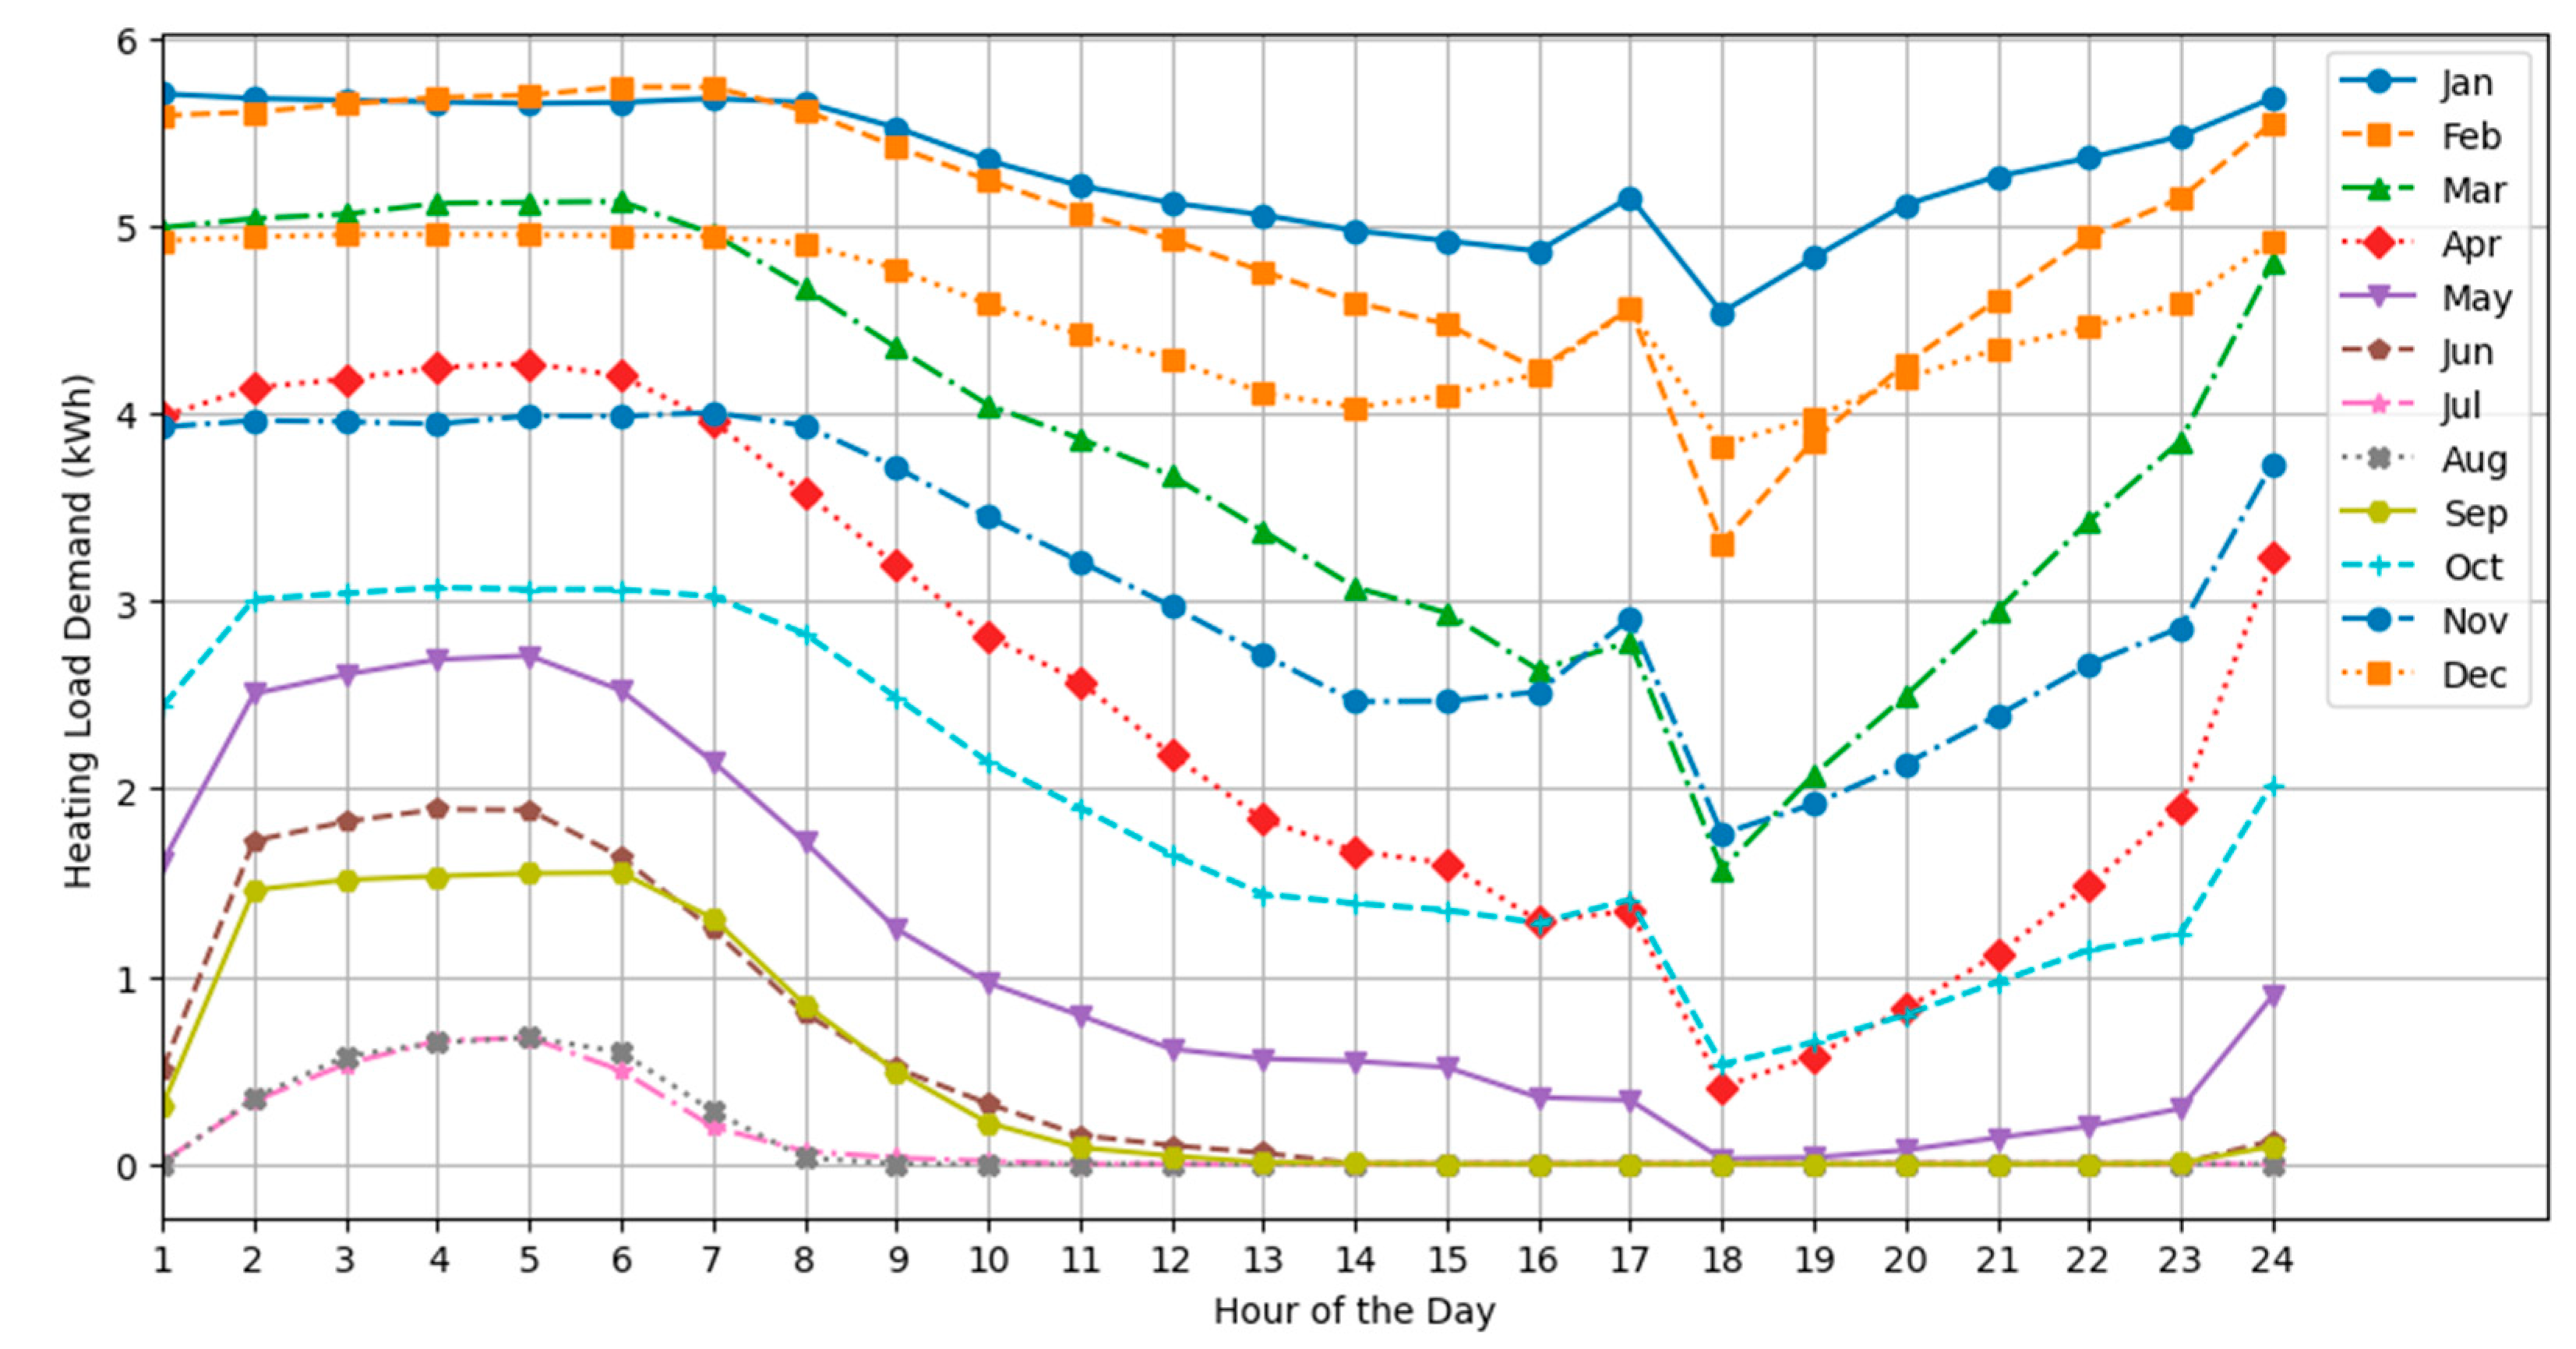
Hourly-monthly load profile for heating load.
Figure 9.
Hourly-monthly load profile for heating load.
Figure 10.
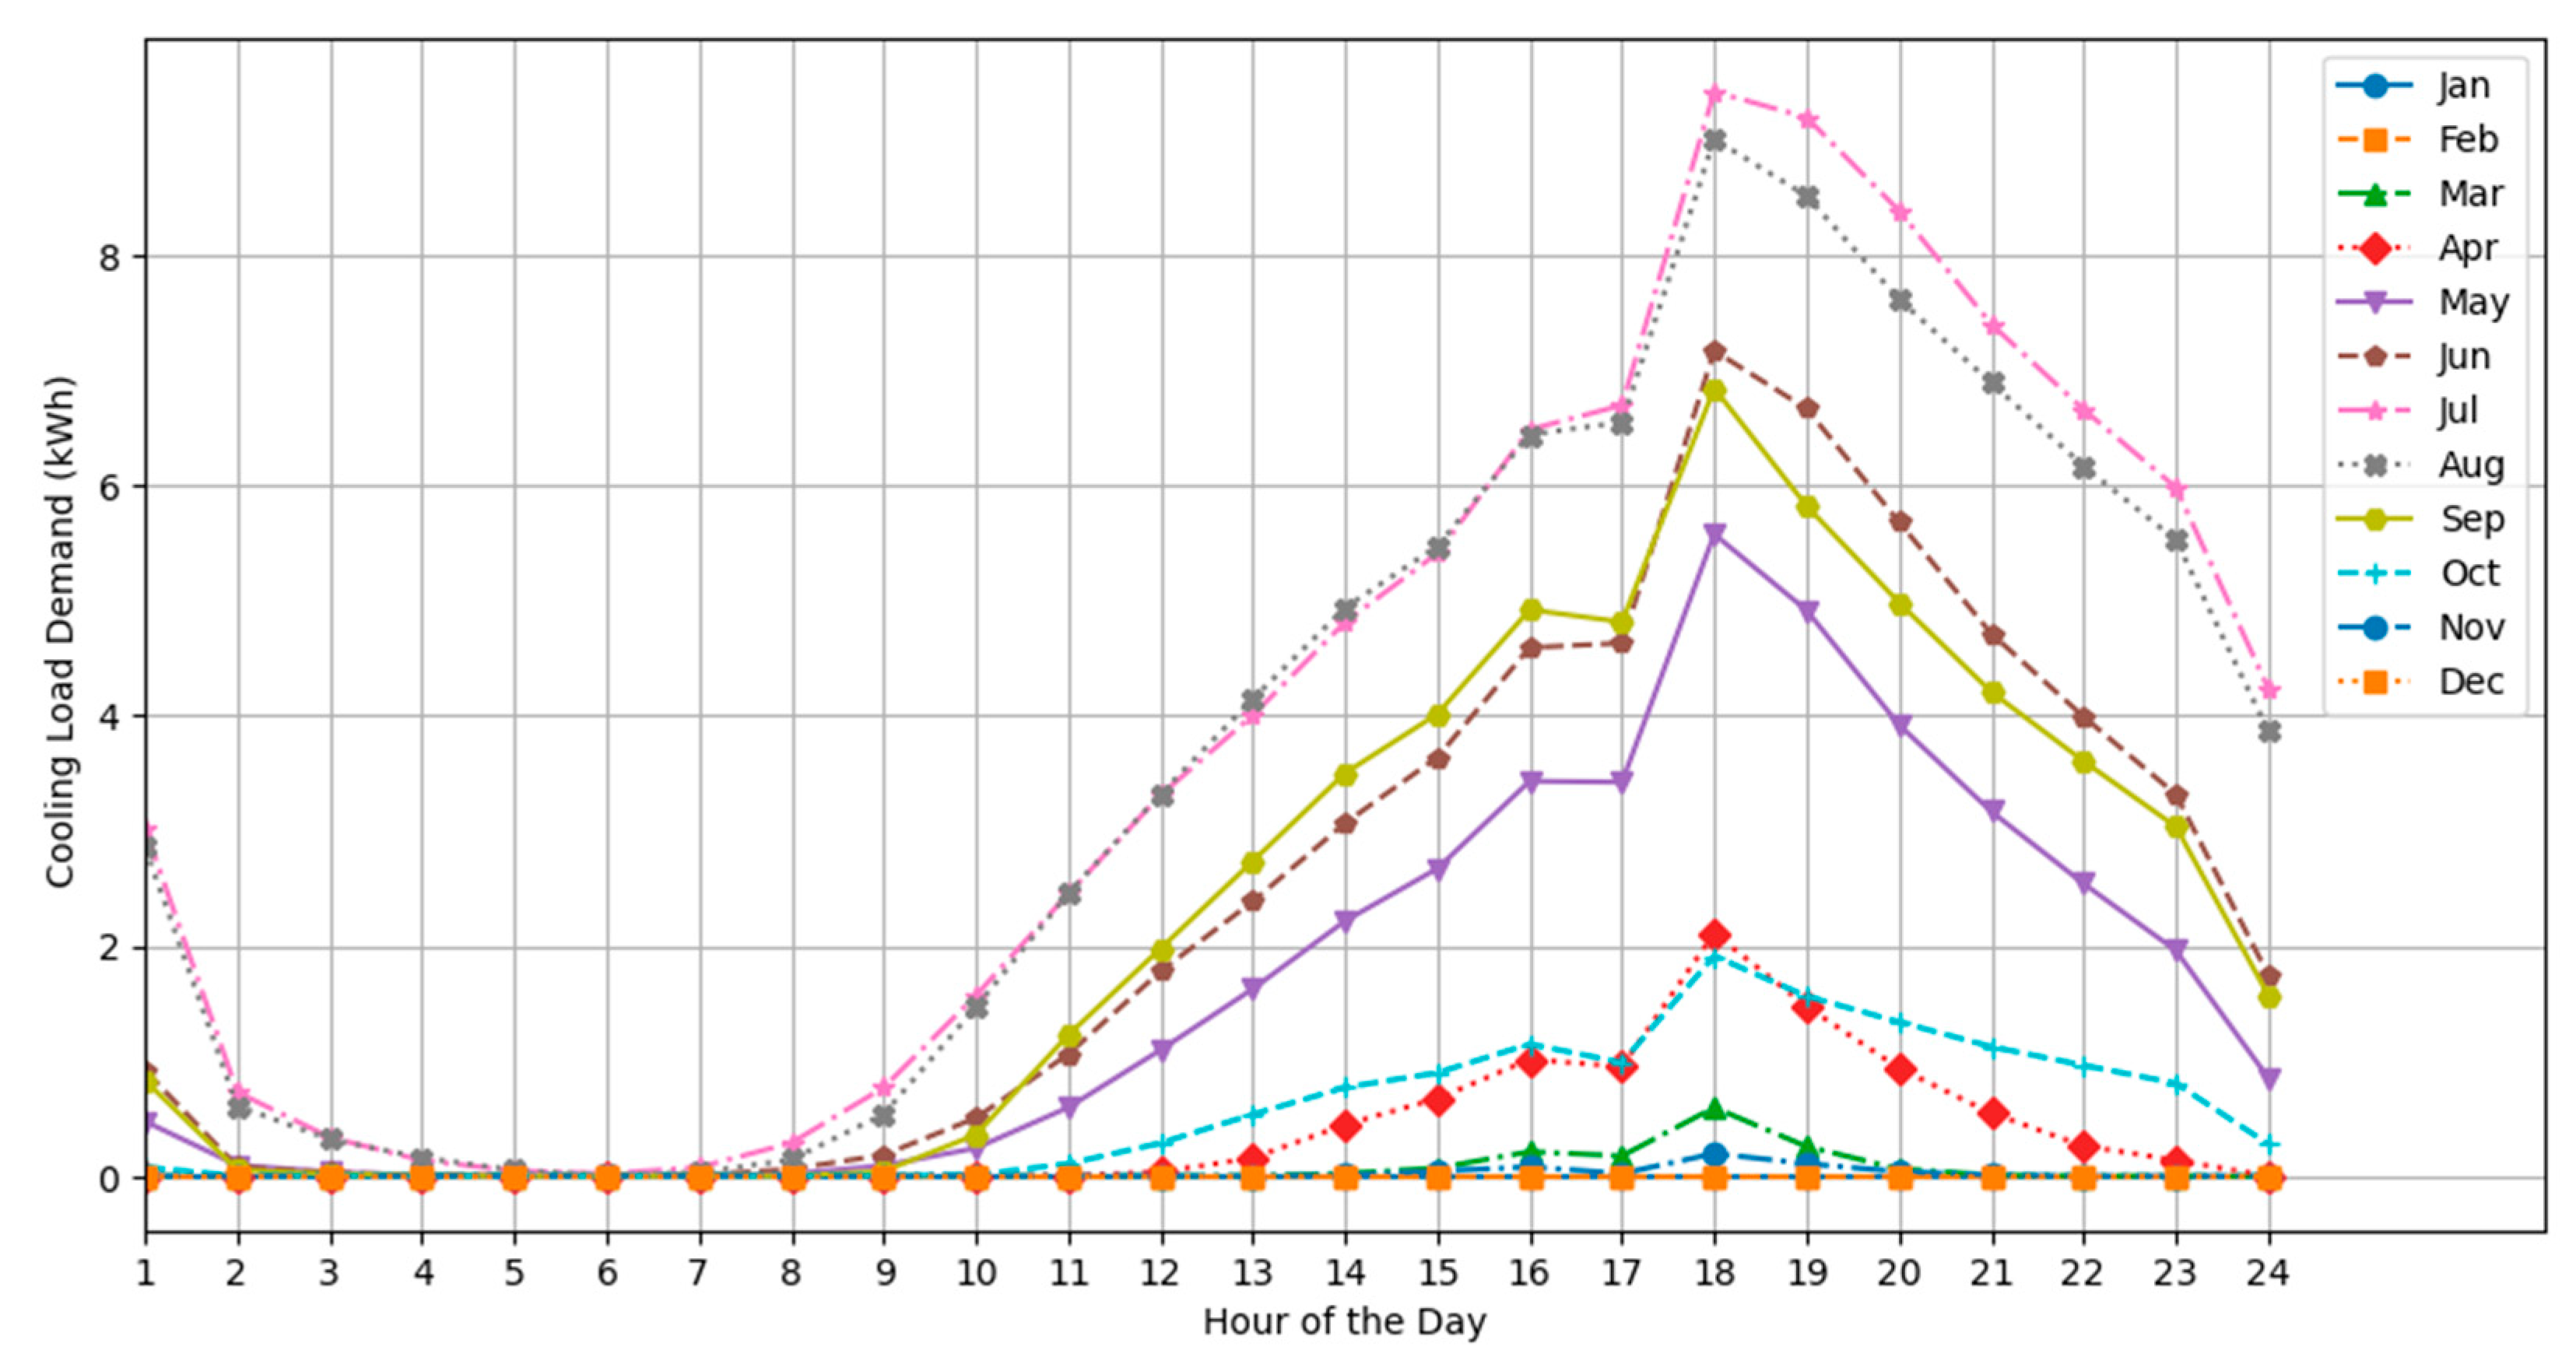
Hourly-monthly load profile for cooling load.
Figure 10.
Hourly-monthly load profile for cooling load.
Figure 11.
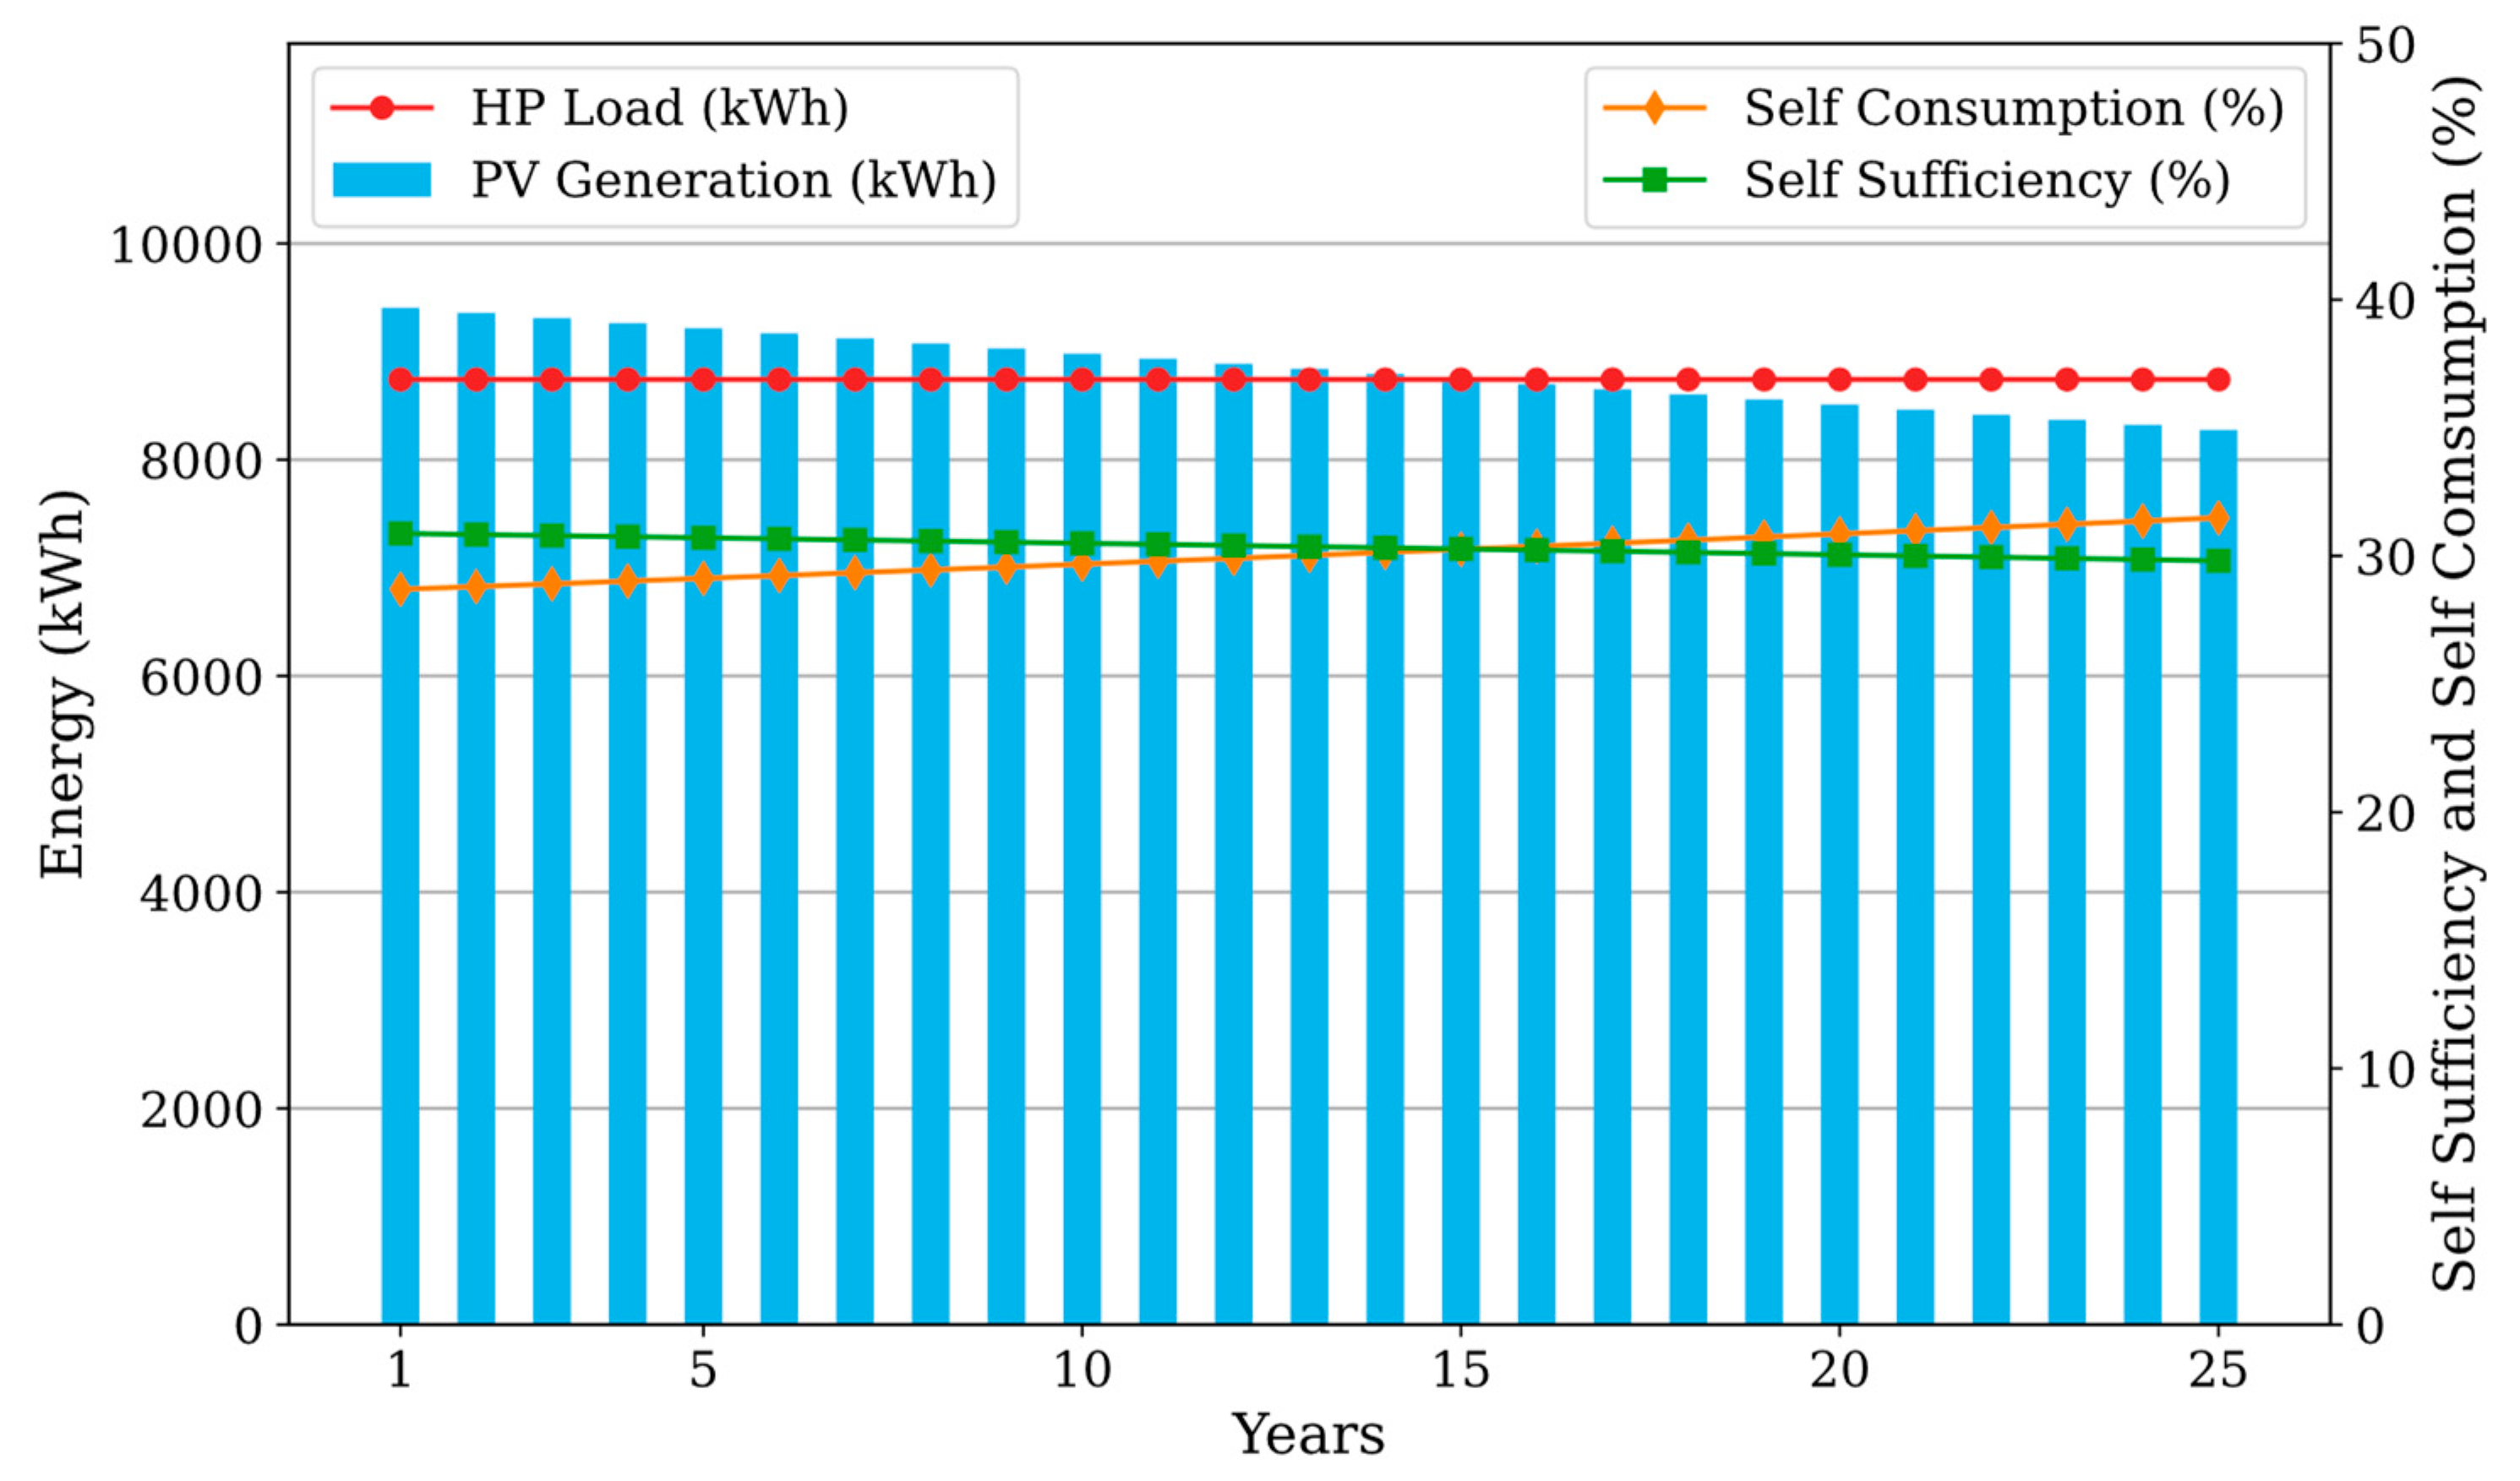
25-year Lifetime annual energy performance results of the proposed residential house with air-source heat pump.
Figure 11.
25-year Lifetime annual energy performance results of the proposed residential house with air-source heat pump.
Figure 12.
Year 1 energy performance results of proposed residential house with ASHP: a) Daily PV energy generation and load demand. b) Monthly PV generation, load demand, self-consumption, and self-sufficiency. c) Monthly PV generation, load demand, energy to the grid, and energy from the grid.
Figure 12.
Year 1 energy performance results of proposed residential house with ASHP: a) Daily PV energy generation and load demand. b) Monthly PV generation, load demand, self-consumption, and self-sufficiency. c) Monthly PV generation, load demand, energy to the grid, and energy from the grid.
Figure 13.
Energy performance results of the warmest day (July 31) and the coldest day (February 17) of the study period: a) Self-sufficiency and self-consumption on the warmest day. b) PV generation and HP load for the warmest day. c) Self-sufficiency and self-consumption on the coldest day. d) PV generation and HP load for the coldest day.
Figure 14.
Energy performance results of the spring equinox (March 21) and the fall equinox (September 22) of the study period: a) Self-sufficiency and self-consumption on the spring equinox. b) PV generation and HP load for the spring equinox. c) Self-sufficiency and self-consumption on the fall equinox. d) PV generation and HP load for the fall equinox.
Figure 15.
Comparison of the energy sent to the grid and the energy received from the grid using two different load data models. a) hourly data model proposed in this study. b) Gaussian model generated from unique monthly data.
Figure 15.
Comparison of the energy sent to the grid and the energy received from the grid using two different load data models. a) hourly data model proposed in this study. b) Gaussian model generated from unique monthly data.
Table 1.
Calculated surface areas and perimeter of the house plan.
Table 1.
Calculated surface areas and perimeter of the house plan.
| Space area/perimeter |
Direction |
Bedroom |
Bathroom |
Kitchen and exit |
Dining and living |
Side space |
| Wall (m2) |
North |
8.36 |
6.16 |
8.95 |
- |
141.7 |
| West |
6.40 |
- |
- |
- |
- |
| East |
- |
- |
10.60 |
5.57 |
26.60 |
| South |
- |
- |
- |
11.09 |
63 |
| Window (m2) |
North |
0.40 |
6.16 |
0.40 |
- |
- |
| West |
2.71 |
- |
- |
- |
- |
| East |
- |
- |
- |
2.74 |
- |
| South |
- |
- |
- |
2.74 |
- |
| Roof (m2) |
- |
15.78 |
7.82 |
20.86 |
27.97 |
139.40 |
| Door (m2) |
North |
- |
- |
1.89 |
- |
- |
| South |
- |
- |
- |
3.90 |
- |
| Floor slab (m) |
- |
7.34 |
2.71 |
9.14 |
11.40 |
9.60 |
Table 2.
Required heat transfer equations for heating load calculations [
98].
Table 2.
Required heat transfer equations for heating load calculations [
98].
| Overall heat transfer coefficient |
|---|
|
|
|
|
| Conduction |
|
|
|
| Convection |
|
|
|
| Heat transfers due to infiltration |
|
|
|
|
|
Table 3.
Required heat transfer equations for cooling load calculations.
Table 3.
Required heat transfer equations for cooling load calculations.
| Temperature |
|---|
|
|
| Solar heat gain |
|
|
| Conduction |
|
|
|
| Heat transfers due to infiltration |
|
| Radiant Time Series |
|
Table 4.
Radiative-convective heat gain.
Table 4.
Radiative-convective heat gain.
| |
Radiative (%) |
Convective (%) |
| Wall, window |
63 |
37 |
| Roof |
84 |
16 |
| People |
70 |
30 |
| Lighting |
67 |
33 |
| Equipment |
20 |
80 |
| Window solar |
90 |
10 |
| Infiltration |
0 |
100 |
Table 7.
COP and EER of the proposed heat pumps on the worst day of the year and seasonal, respectively.
Table 7.
COP and EER of the proposed heat pumps on the worst day of the year and seasonal, respectively.
| |
COP/EER |
SCOP/EER |
| Heat pump |
On Worst day |
|
| Heating Mode |
2.06 |
3.14 |
| Cooling Mode |
4.42 |
5.06 |
Table 8.
Parameters of the designed PV system in SAM.
Table 8.
Parameters of the designed PV system in SAM.
| Parameters |
Value |
| System Type |
Residential |
| Total PV Capacity (kWp) |
6.88 |
| PV Module |
SunPower SPR-M430-H-AC |
| Module DC Rating (Wp) |
429.6 |
| Number of Modules |
16 |
| DC/AC Ratio |
0.99 |
| Inverter Capacity (kW) |
7.21 |
| Number of Inverters |
1 |
| Number of Strings |
2 |
| Modules per Strings |
8 |
| Azimuth (°) |
180 |
| Tilt Angle (Optimal tilt angle in London ON) |
34 |
|
DC Losses (%) (Default SAM values) [67] |
4.44 |
| Location |
London ON |
Table 9.
Lifetime simulation results of the PV-ASHP in SAM showing the energy performance of the PV system using the thermal model data in this study and the Gaussian distribution data for limited load data scenarios.
Table 9.
Lifetime simulation results of the PV-ASHP in SAM showing the energy performance of the PV system using the thermal model data in this study and the Gaussian distribution data for limited load data scenarios.
| Parameters |
Thermal Model Data |
Gaussian Distribution Data |
| Estimated PV Rating (kW) |
6.85 |
6.85 |
| Real PV Rating (kW) |
6.88 |
6.88 |
| Load Demand (MWh) |
218.57 |
218.57 |
| PV Energy (MWh) |
221.03 |
221.03 |
| Energy to Grid (MWh) |
154.69 |
88.66 |
| Energy from Grid (MWh) |
152.22 |
86.19 |
| Self-Consumption (%) |
30.02 |
59.89 |
| Self-Sufficiency (%) |
30.06 |
60.56 |
