Submitted:
01 May 2024
Posted:
03 May 2024
You are already at the latest version
Abstract
Keywords:
1. Introduction
2. Results
2.1. General Consideratons
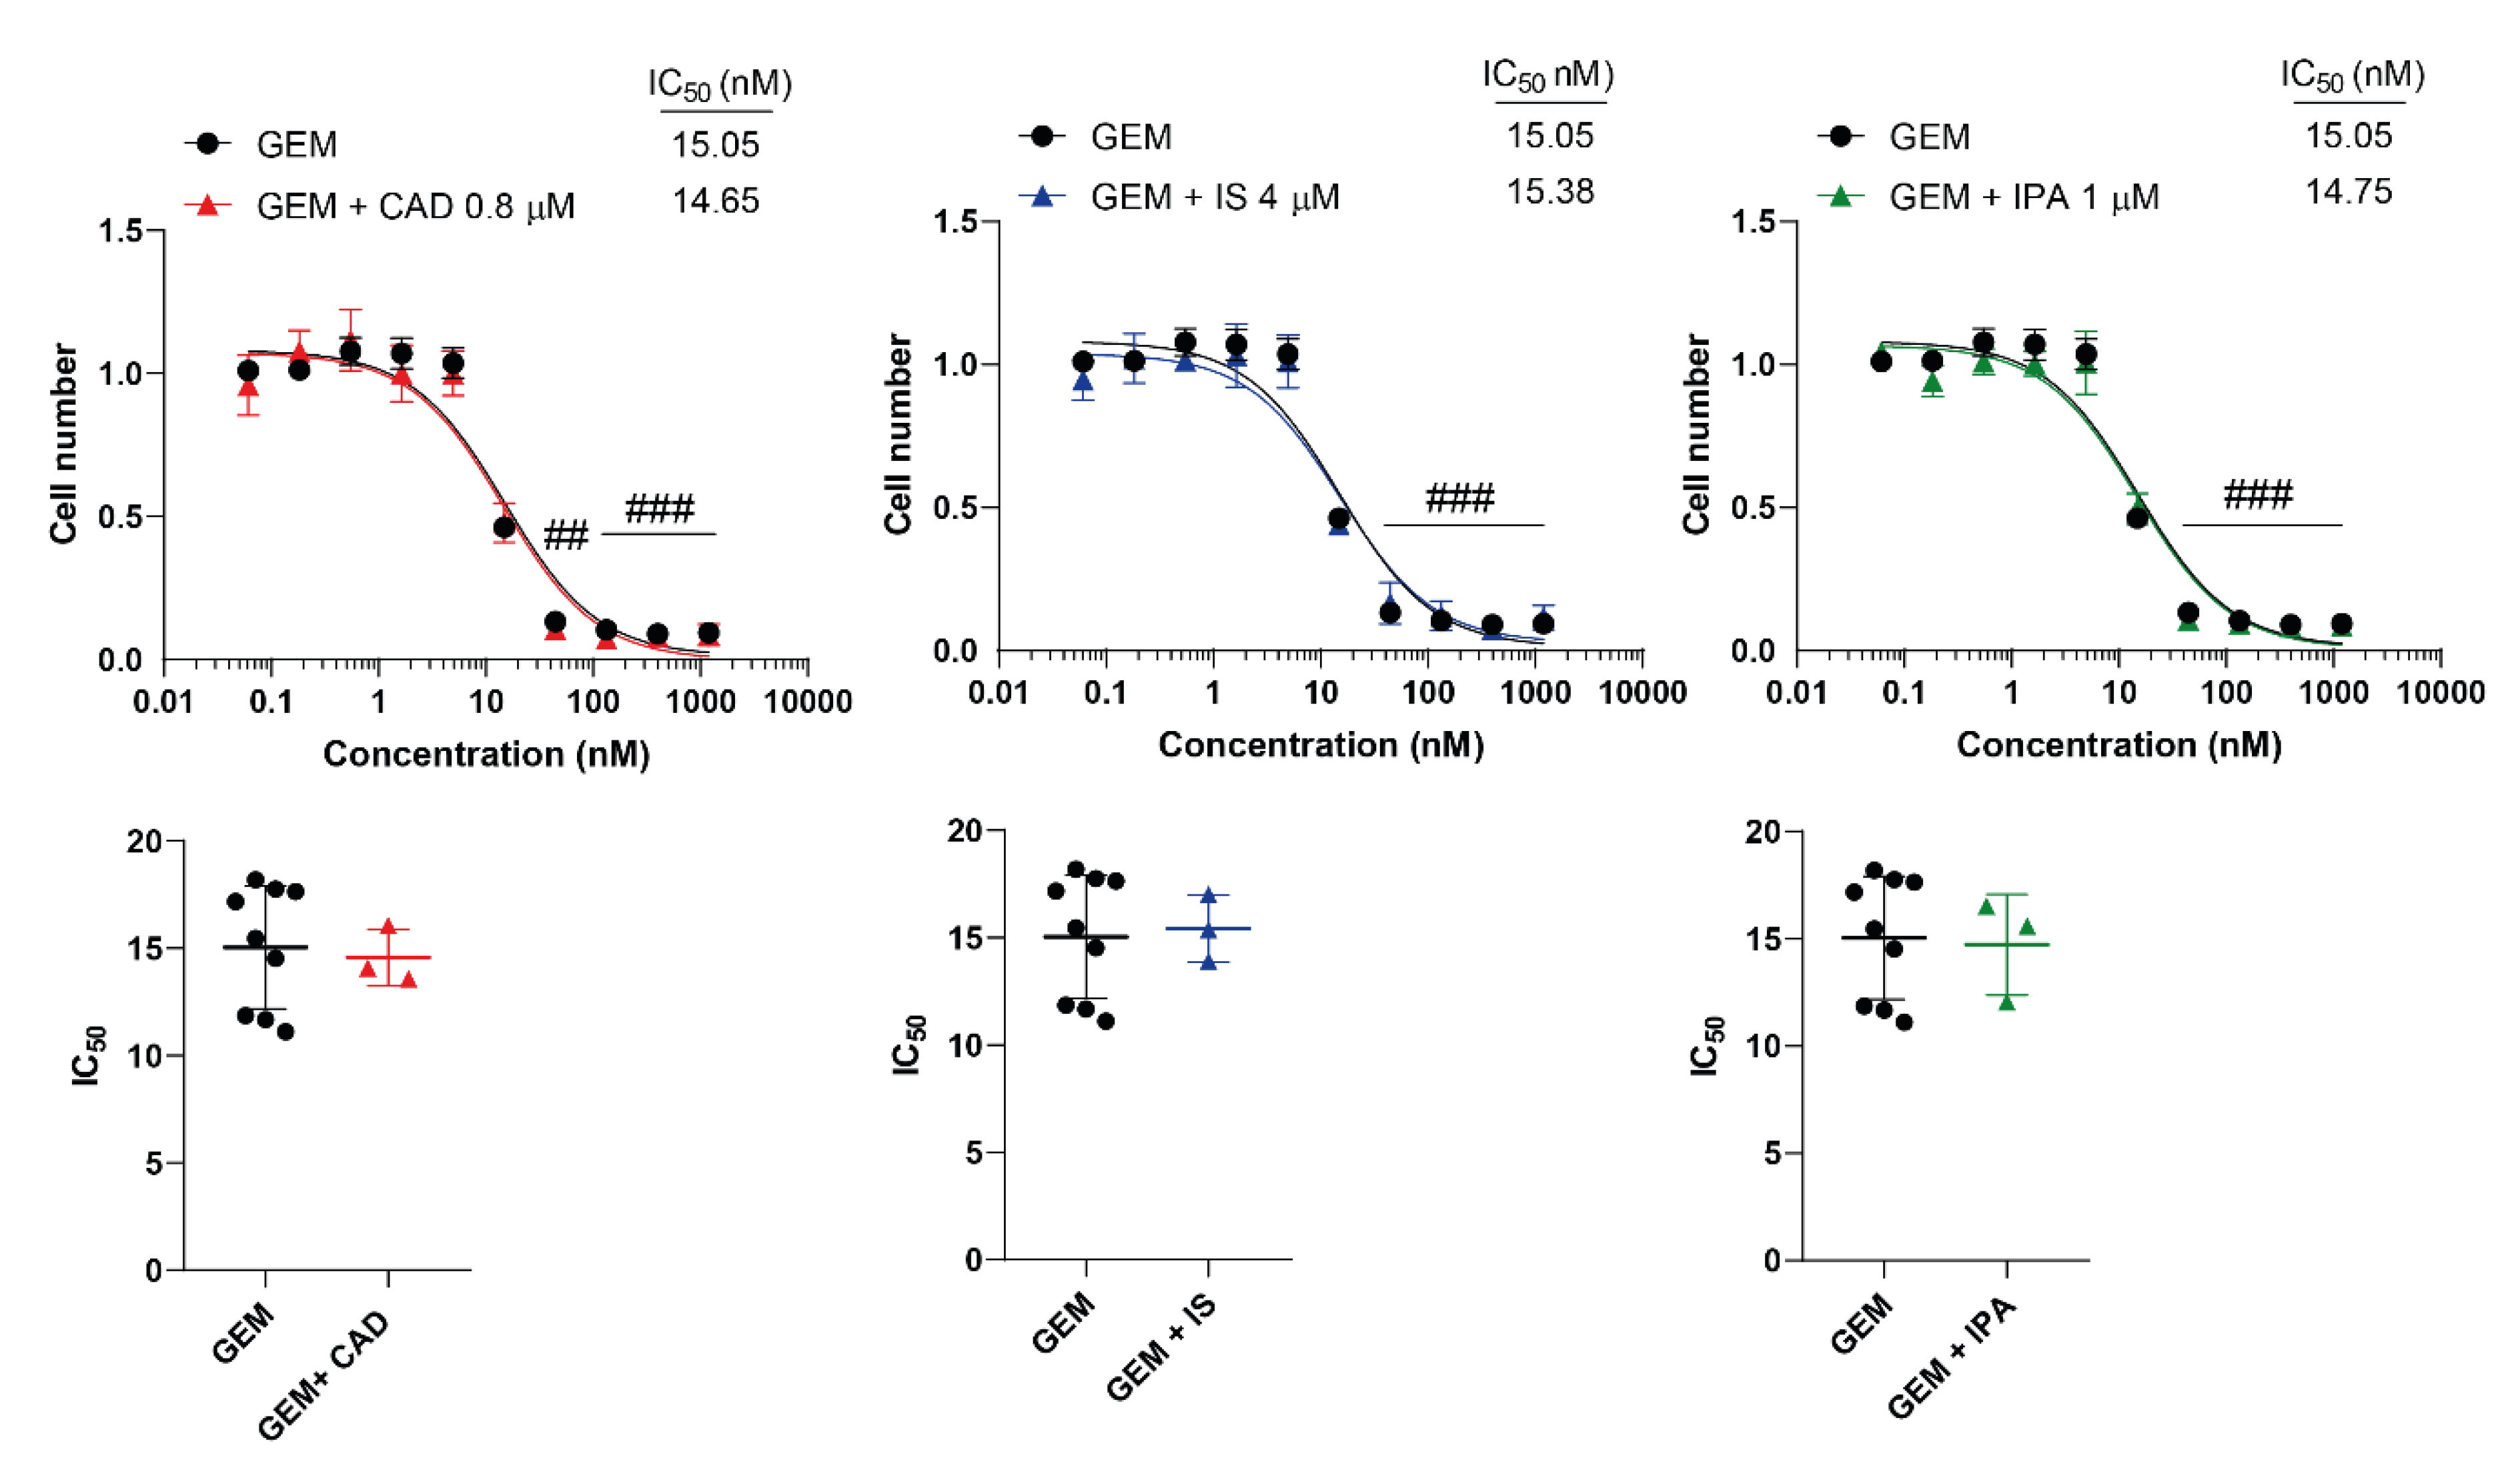
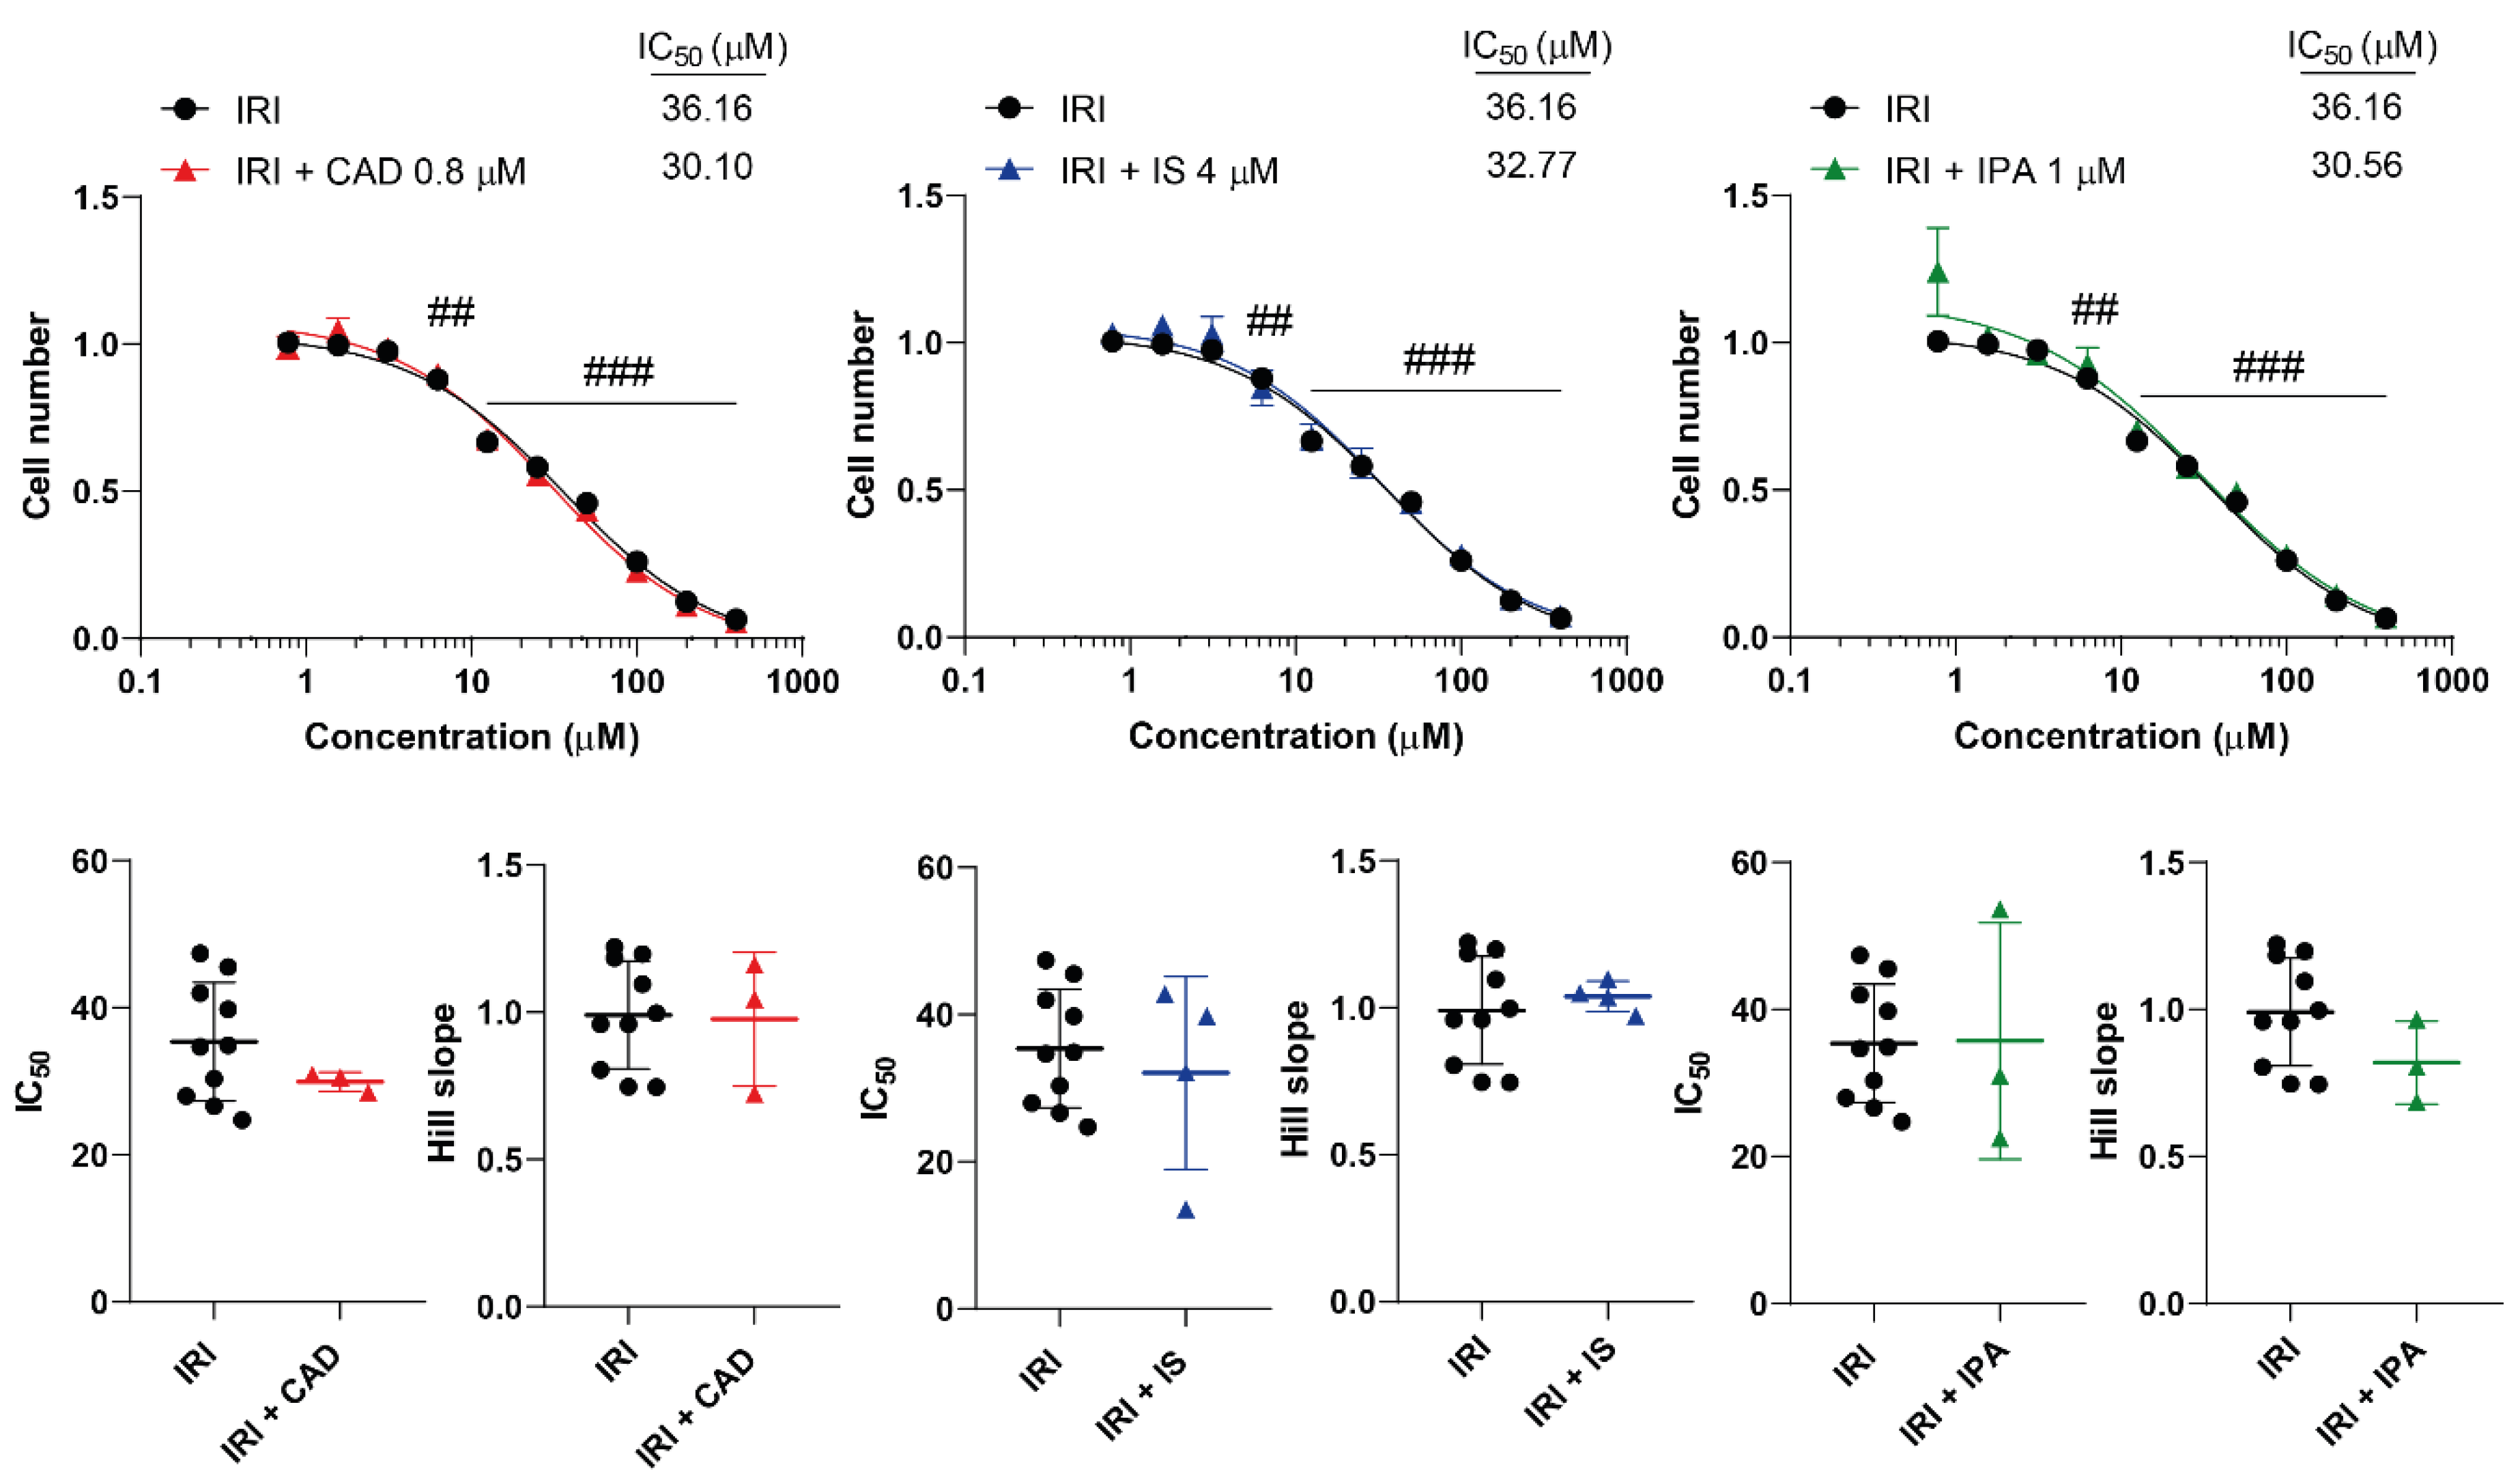
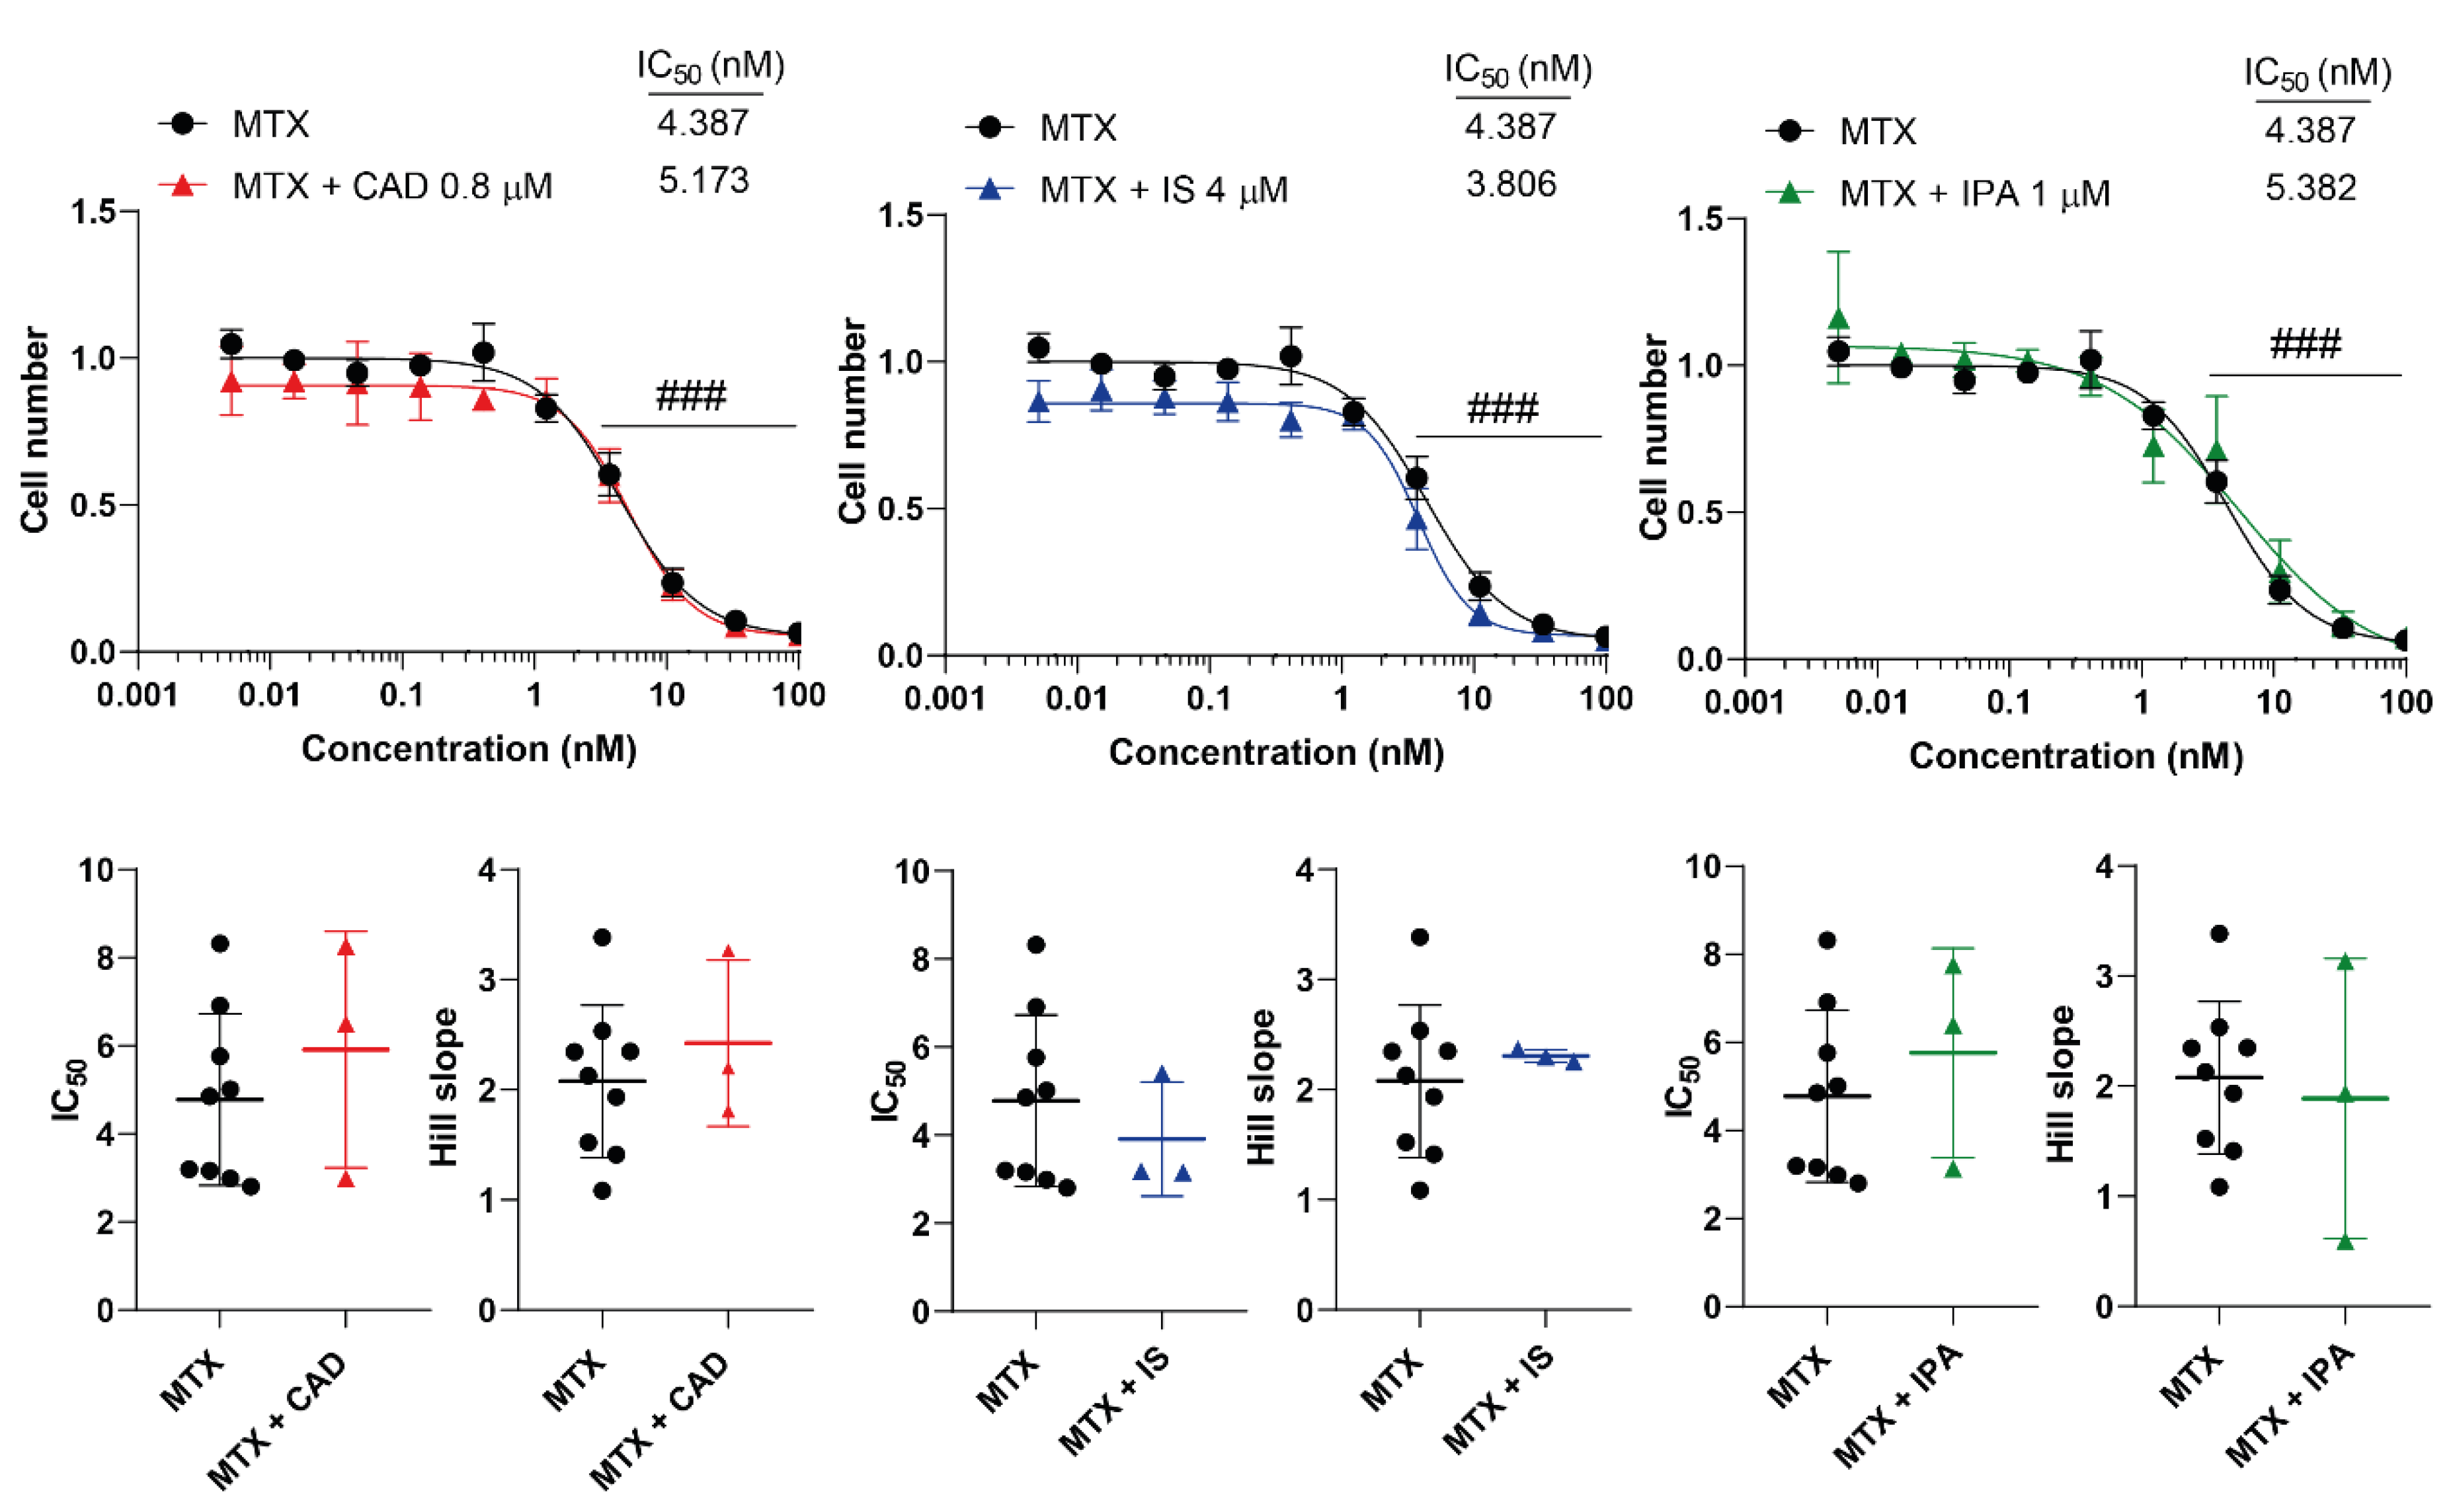
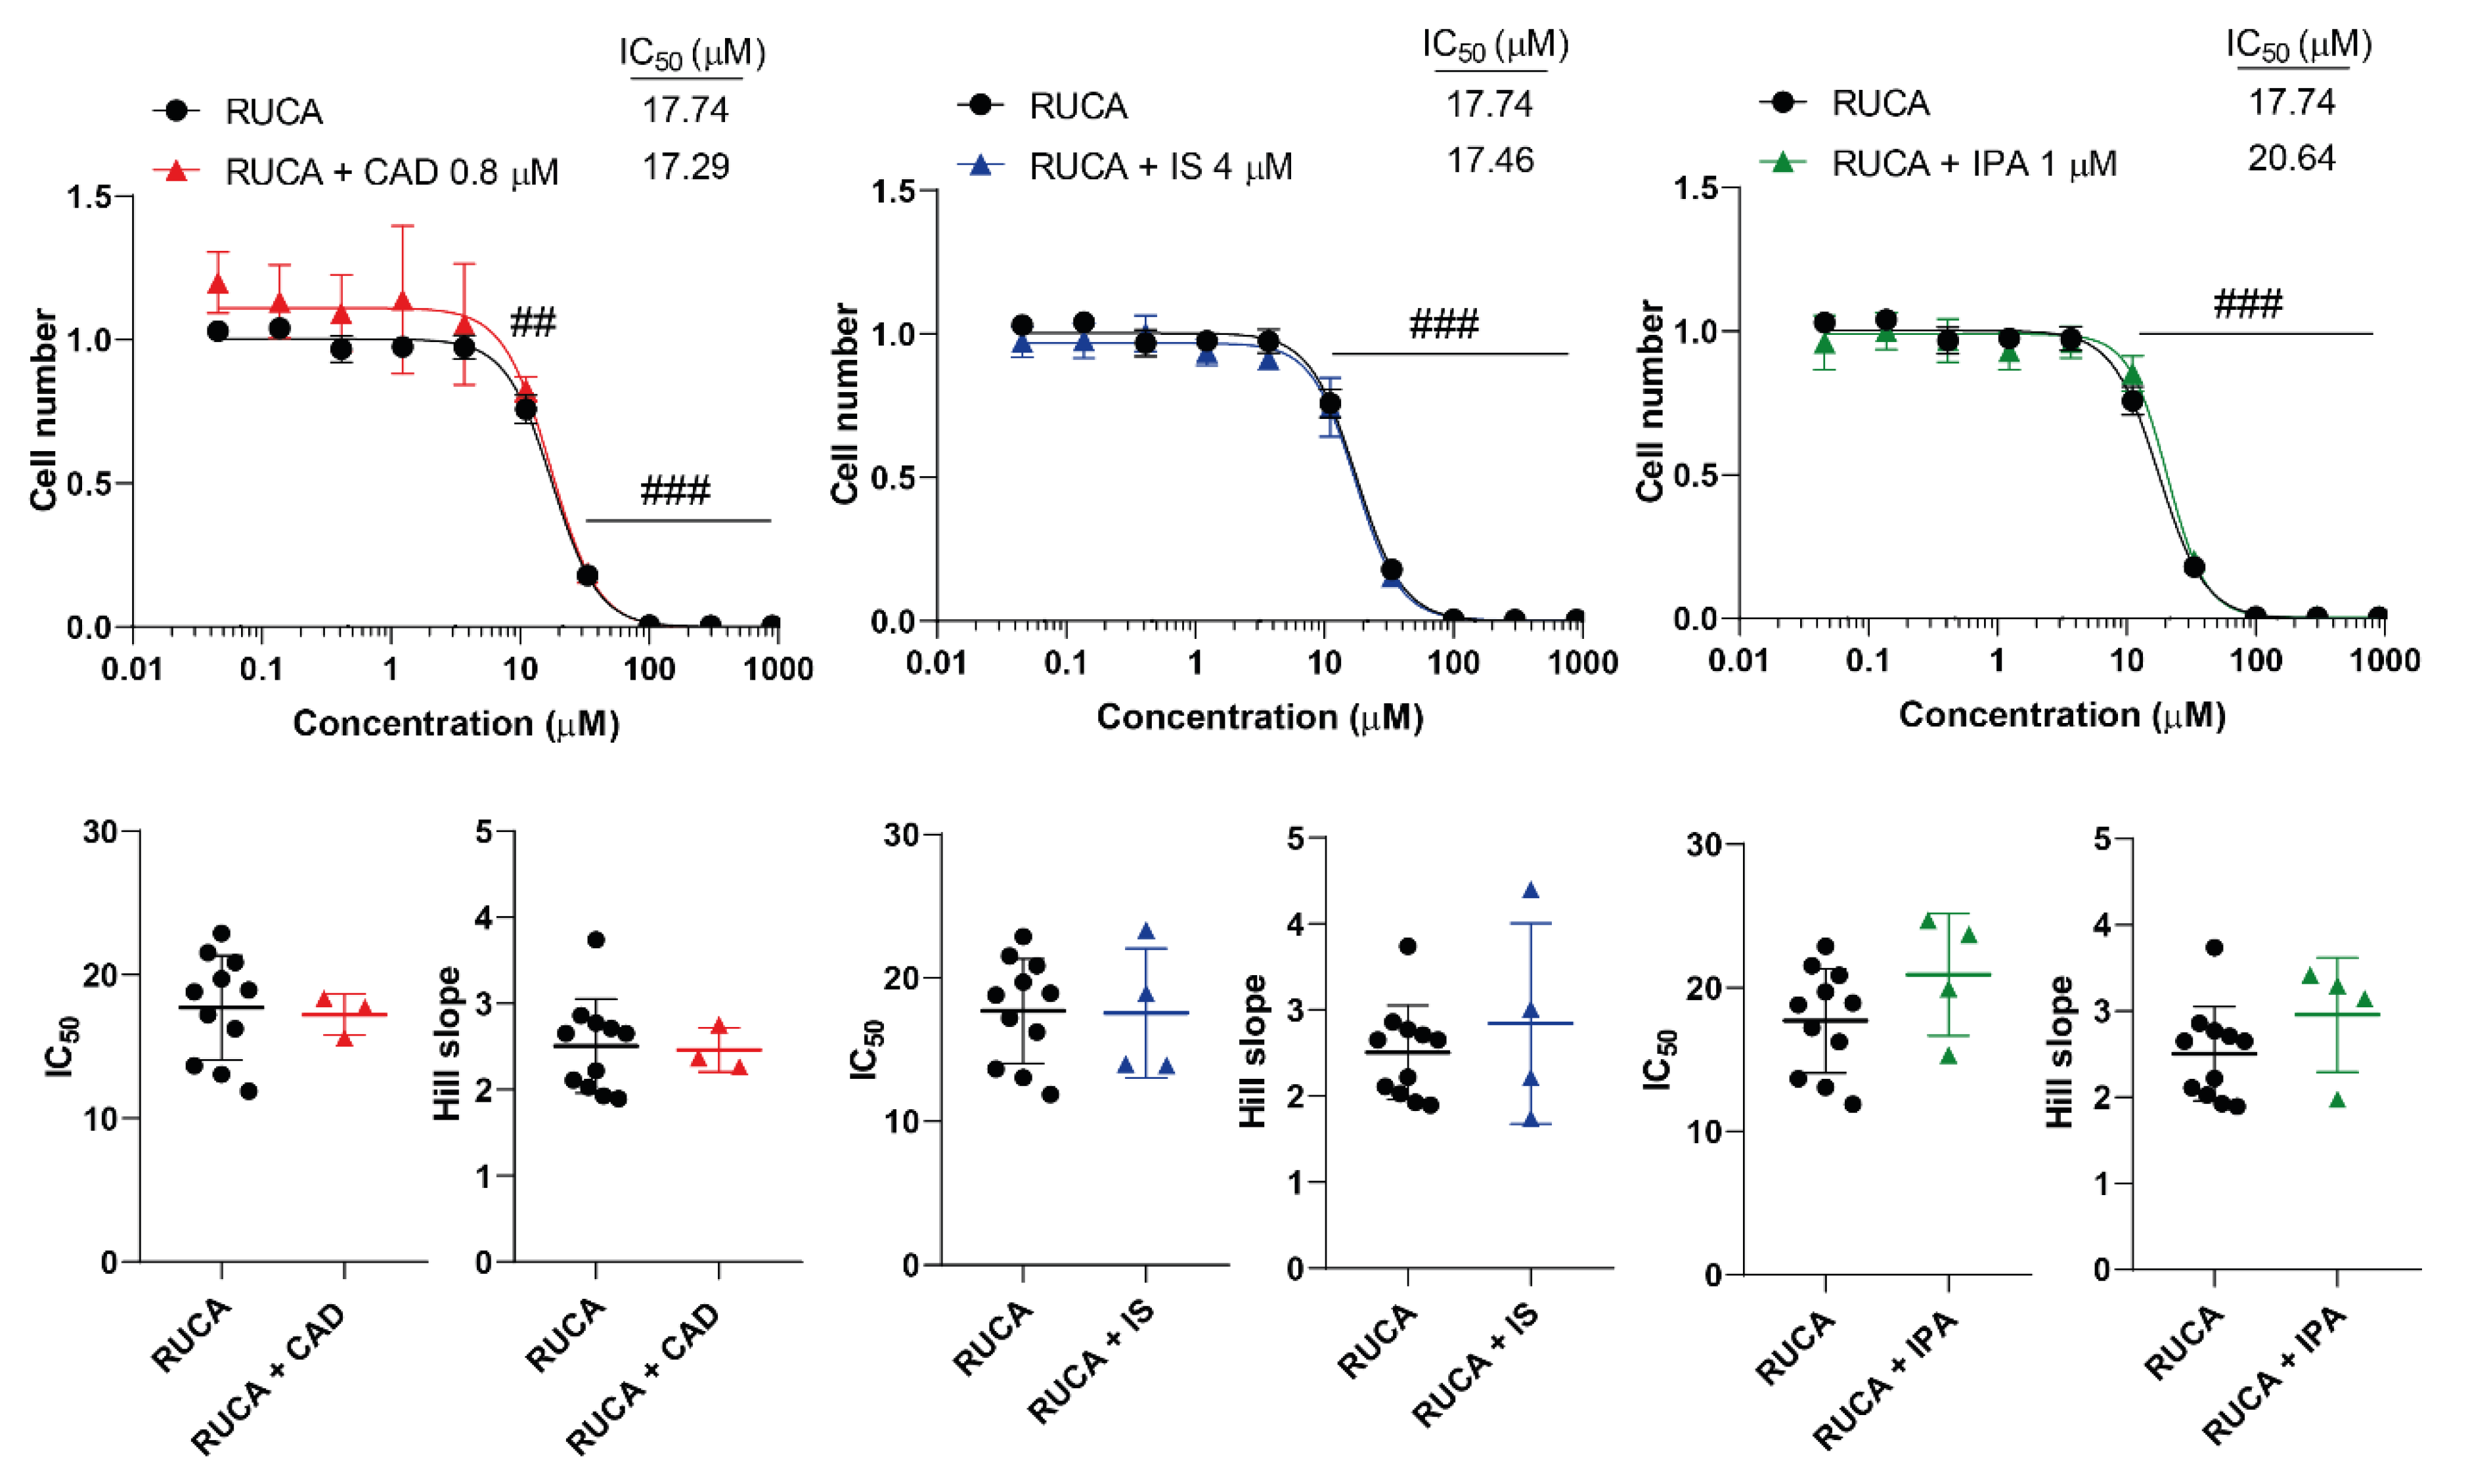
2.2. Bacterial Metabolites Do Not Interfere with Doxorubicin, Gemcitabine, Irinotecan, Methotrexate and Rucaparib Activity
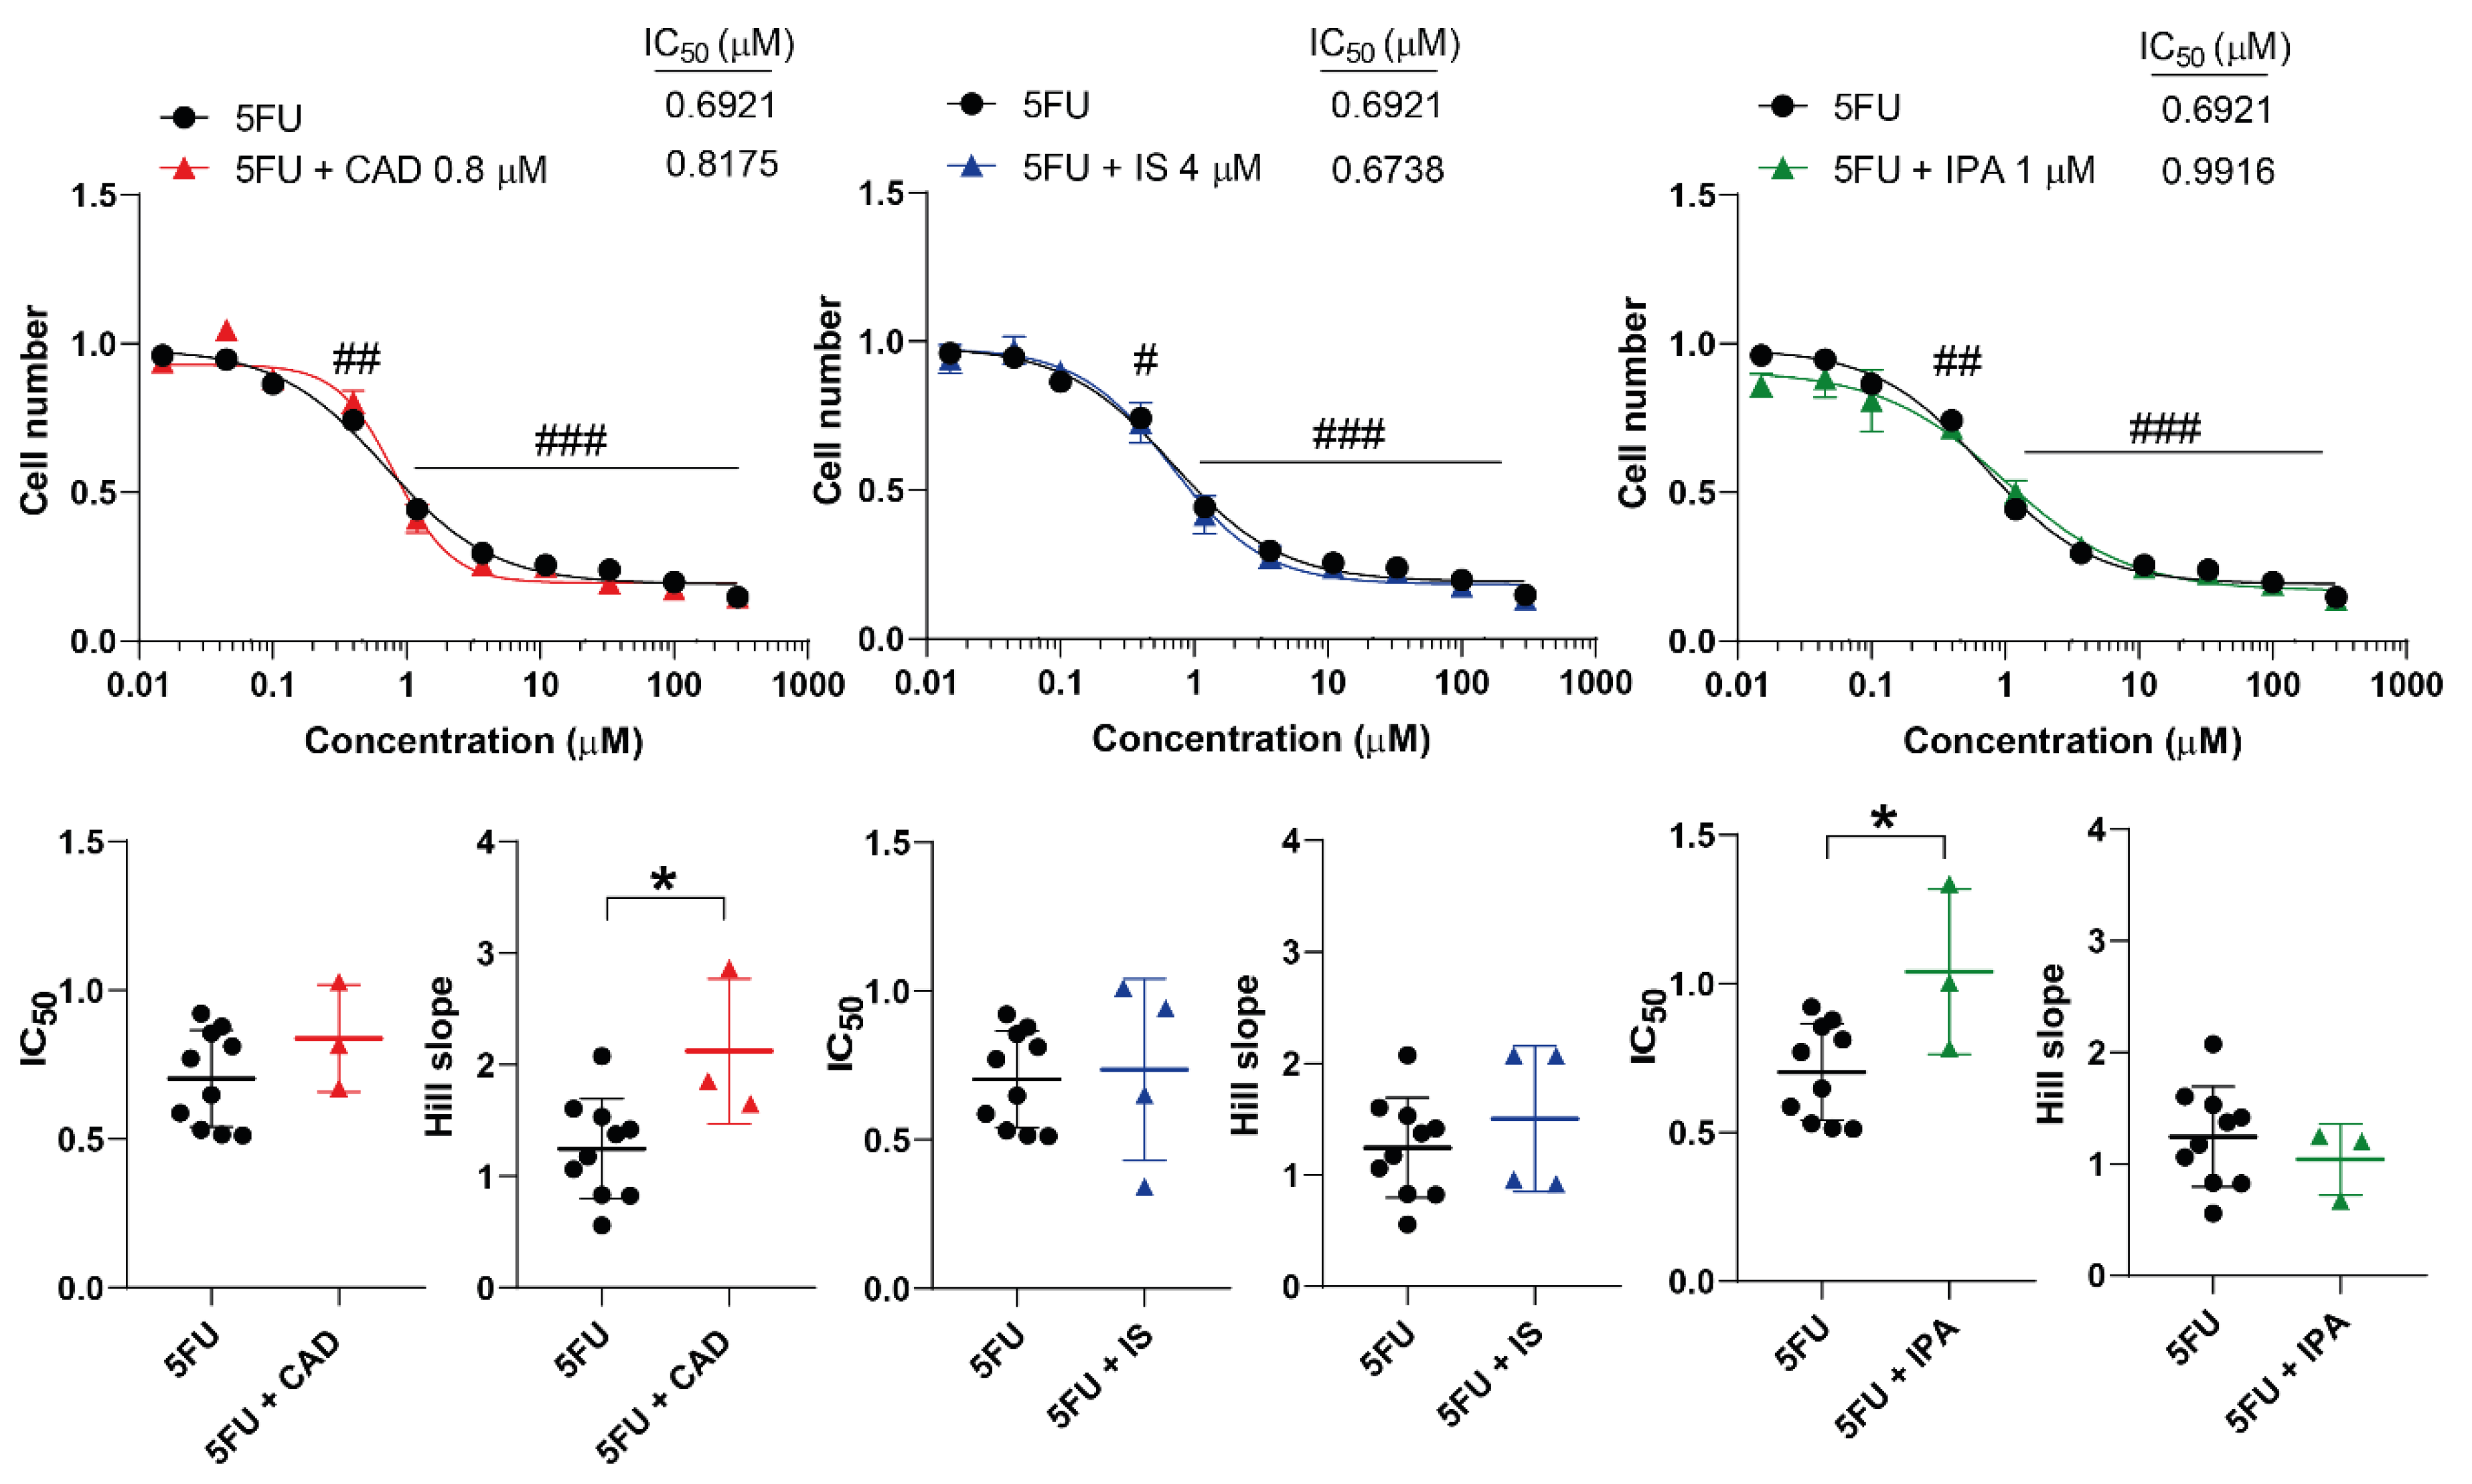
2.3. Bacterial Metabolites Interfere with 5-Fluorouracil
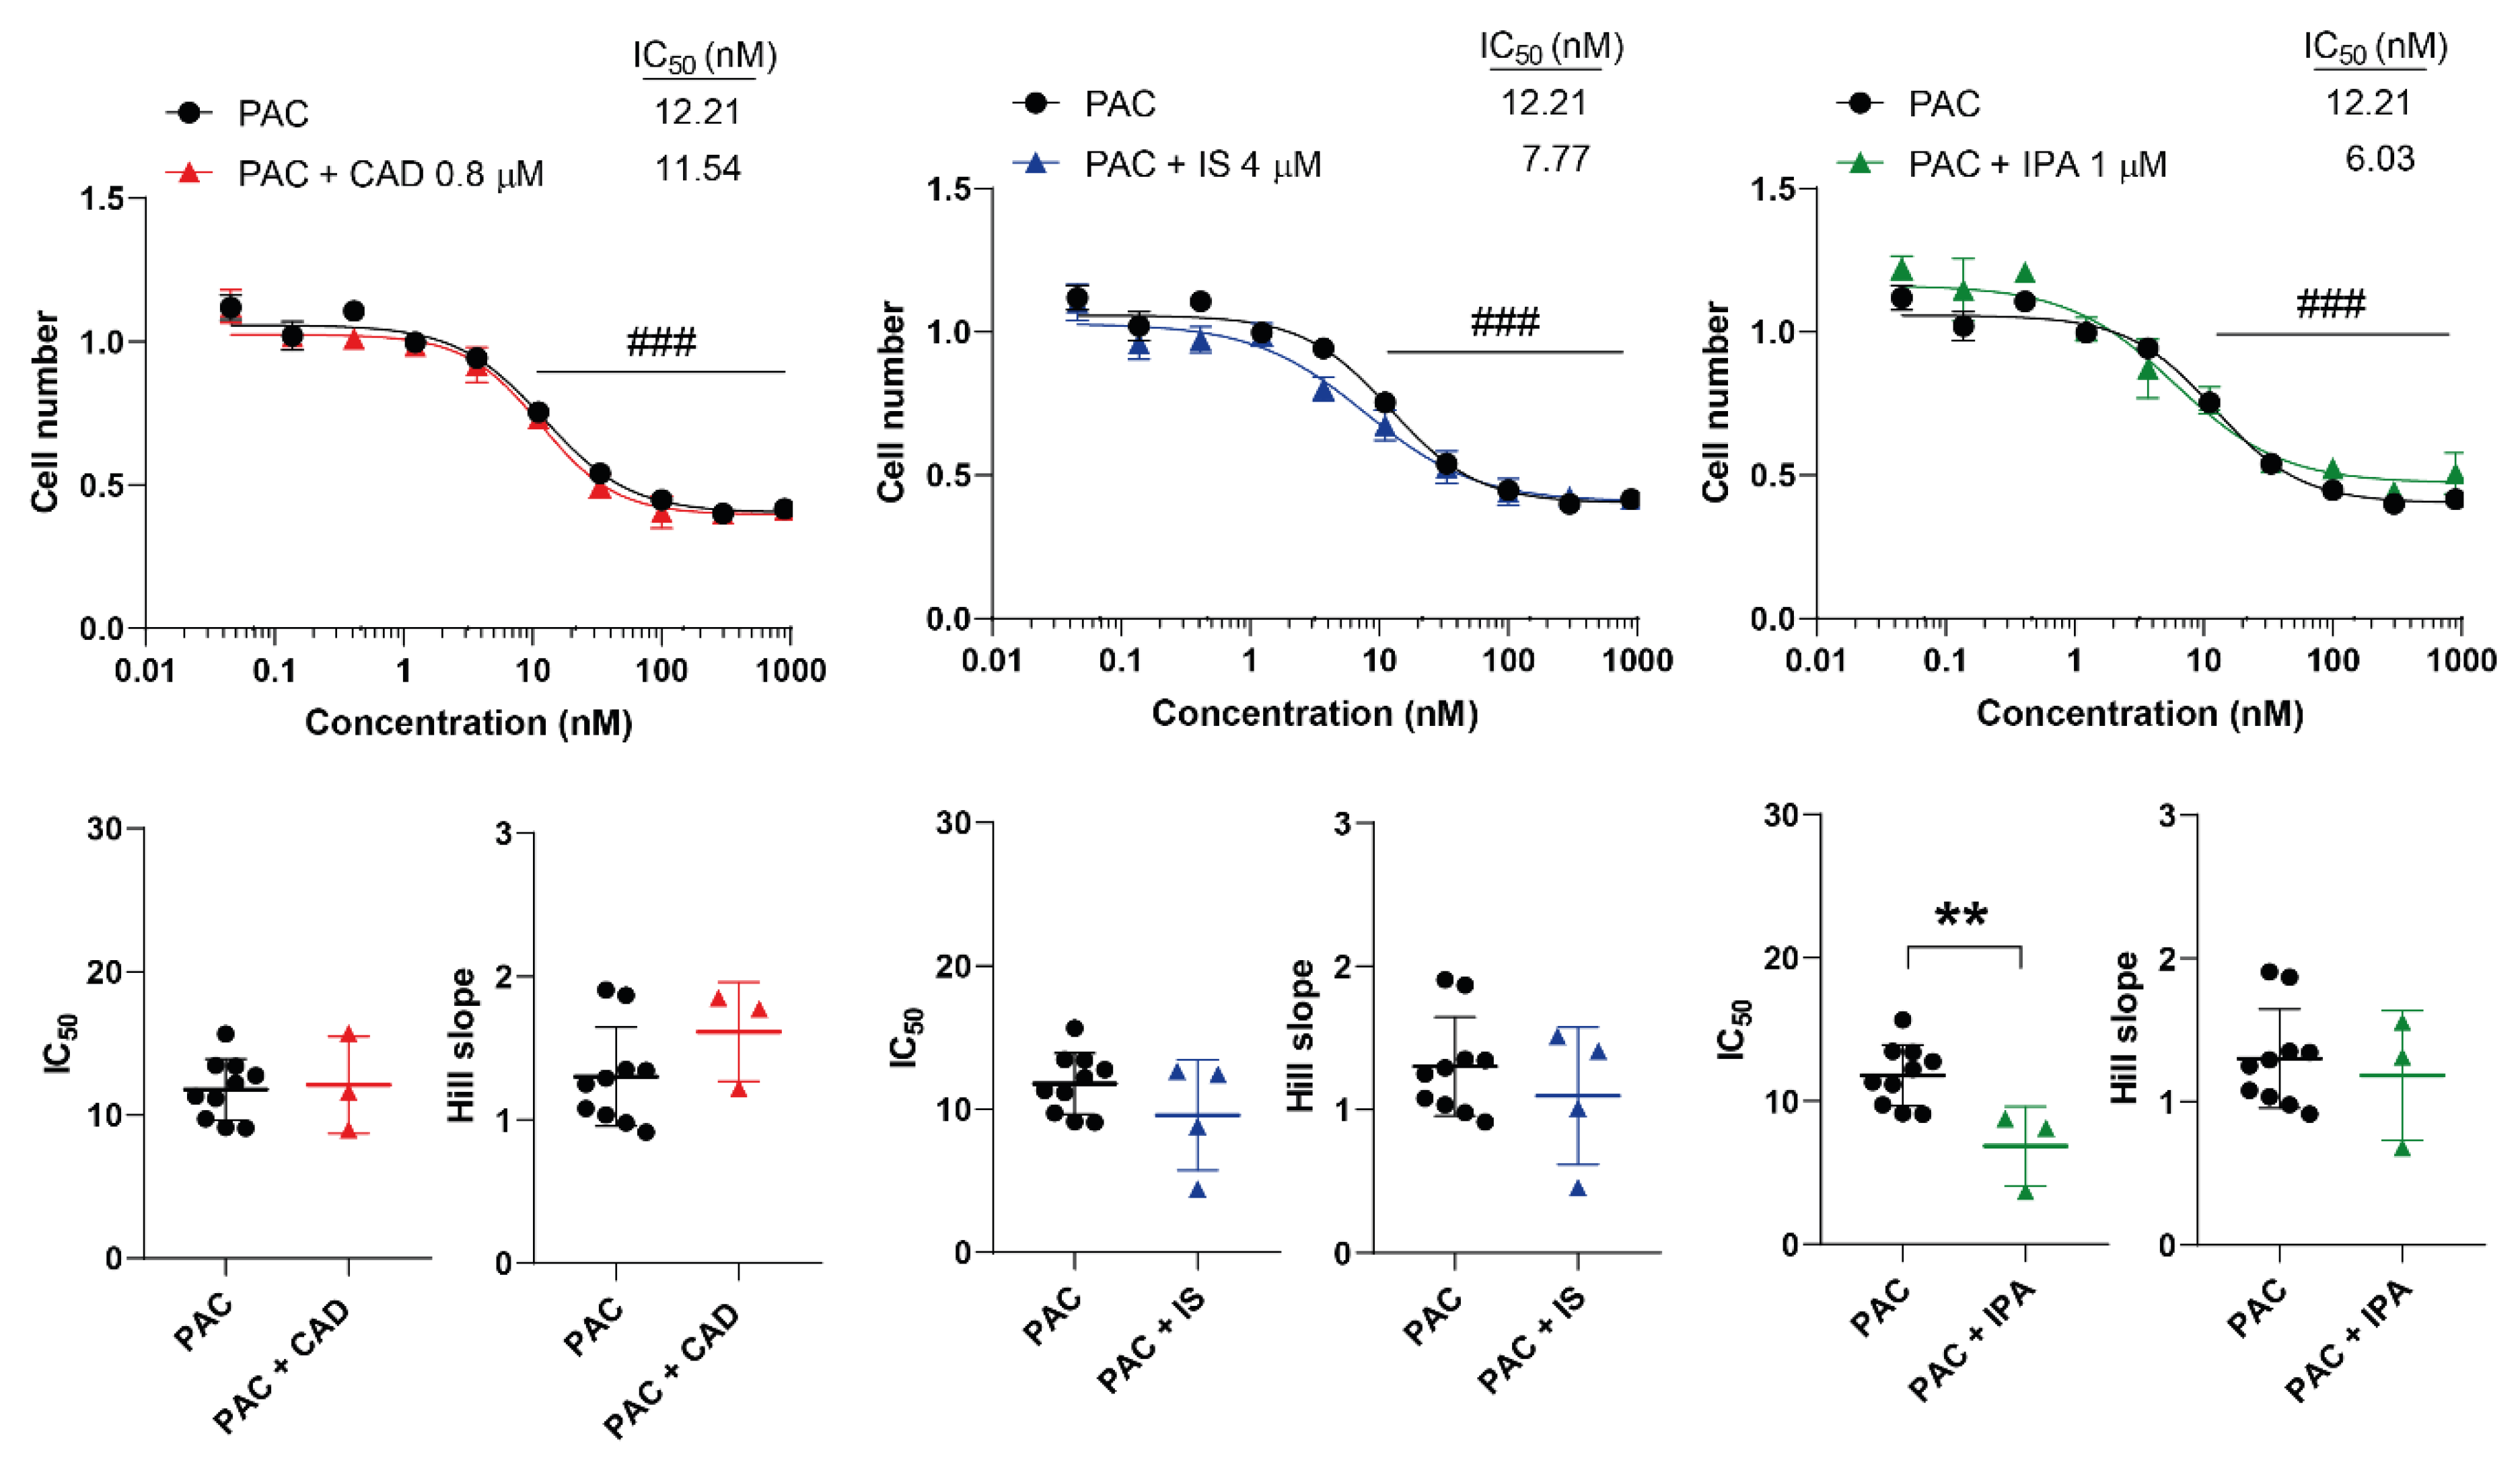
2.4. Bacterial Metabolites Interfere with Paclitaxel
3. Discussion
4. Materials and Methods
Chemicals
Cell Line
MTT Assay
Statistical Analysis
5. Conclusions
Supplementary Materials
Author Contributions
Funding
Institutional Review Board Statement
Informed Consent Statement
Data Availability Statement
Acknowledgments
Conflicts of Interest
References
- Sipos, A.; Ujlaki, G.; Mikó, E.; Maka, E.; Szabó, J.; Uray, K.; Krasznai, Z.; Bai, P. The role of the microbiome in ovarian cancer: mechanistic insights into oncobiosis and to bacterial metabolite signaling. Molecular medicine (Cambridge, Mass.) 2021, 27, 33. [CrossRef]
- Kiss, B.; Mikó, E.; Sebő, É.; Toth, J.; Ujlaki, G.; Szabó, J.; Uray, K.; Bai, P.; Árkosy, P. Oncobiosis and Microbial Metabolite Signaling in Pancreatic Adenocarcinoma. Cancers (Basel) 2020, 12, E1068. [CrossRef]
- Kovács, T.; Mikó, E.; Ujlaki, G.; Yousef, H.; Csontos, V.; Uray, K.; Bai, P. The involvement of oncobiosis and bacterial metabolite signaling in metastasis formation in breast cancer. Cancer and Metastasis Reviews 2021, 40, 1223-1249.
- Miko, E.; Vida, A.; Kovacs, T.; Ujlaki, G.; Trencsenyi, G.; Marton, J.; Sari, Z.; Kovacs, P.; Boratko, A.; Hujber, Z.; et al. Lithocholic acid, a bacterial metabolite reduces breast cancer cell proliferation and aggressiveness. Biochimica et Biophysica Acta - Bioenergetics 2018, 1859, 958-974.
- Kovács, T.; Mikó, E.; Vida, A.; Sebő, É.; Toth, J.; Csonka, T.; Boratkó, A.; Ujlaki, G.; Lente, G.; Kovács, P.; et al. Cadaverine, a metabolite of the microbiome, reduces breast cancer aggressiveness through trace amino acid receptors. Scientific Reports 2019, 9, 1300. [CrossRef]
- Sári, Z.; Mikó, E.; Kovács, T.; Jankó, L.; Csonka, T.; Sebő, E.; Toth, J.; Tóth, D.; Árkosy, P.; Boratkó, A.; et al. Indolepropionic acid, a metabolite of the microbiome, has cytostatic properties in breast cancer by activating AHR and PXR receptors and inducing oxidative stress. Cancers (Basel) 2020, 12, 2411. [CrossRef]
- Sári, Z.; Mikó, E.; Kovács, T.; Boratkó, A.; Ujlaki, G.; Jankó, L.; Kiss, B.; Uray, K.; Bai, P. Indoxylsulfate, a Metabolite of the Microbiome, Has Cytostatic Effects in Breast Cancer via Activation of AHR and PXR Receptors and Induction of Oxidative Stress Cancers (Basel) 2020, 12, 2915. [CrossRef]
- Wang, H.; Rong, X.; Zhao, G.; Zhou, Y.; Xiao, Y.; Ma, D.; Jin, X.; Wu, Y.; Yan, Y.; Yang, H.; et al. The microbial metabolite trimethylamine N-oxide promotes antitumor immunity in triple-negative breast cancer. Cell Metab 2022, 34, 581-594.e588. [CrossRef]
- Arpaia, N.; Campbell, C.; Fan, X.; Dikiy, S.; van der Veeken, J.; deRoos, P.; Liu, H.; Cross, J.R.; Pfeffer, K.; Coffer, P.J.; et al. Metabolites produced by commensal bacteria promote peripheral regulatory T-cell generation. Nature 2013, 504, 451-455.
- Rodrigues, M.F.; Carvalho, E.; Pezzuto, P.; Rumjanek, F.D.; Amoedo, N.D. Reciprocal modulation of histone deacetylase inhibitors sodium butyrate and trichostatin A on the energy metabolism of breast cancer cells. J Cell Biochem. 2015, 116, 797-808.
- Tan, J.; McKenzie, C.; Potamitis, M.; Thorburn, A.N.; Mackay, C.R.; Macia, L. The role of short-chain Fatty acids in health and disease. Adv Immunol 2014, 121, 91-119.
- Schulthess, J.; Pandey, S.; Capitani, M.; Rue-Albrecht, K.C.; Arnold, I.; Franchini, F.; Chomka, A.; Ilott, N.E.; Johnston, D.G.W.; Pires, E.; et al. The Short Chain Fatty Acid Butyrate Imprints an Antimicrobial Program in Macrophages. Immunity. 2019, 50, 432-445.
- Salimi, V.; Shahsavari, Z.; Safizadeh, B.; Hosseini, A.; Khademian, N.; Tavakoli-Yaraki, M. Sodium butyrate promotes apoptosis in breast cancer cells through reactive oxygen species (ROS) formation and mitochondrial impairment. Lipids Health Dis. 2017, 16, 208.
- Ujlaki, G.; Kovács, T.; Vida, A.; Kókai, E.; Rauch, B.; Schwarcz, S.; Mikó, E.; Janka, E.; Sipos, A.; Hegedűs, C.; et al. Identification of Bacterial Metabolites Modulating Breast Cancer Cell Proliferation and Epithelial-Mesenchymal Transition. Molecules (Basel, Switzerland) 2023, 28, 5898.
- Radde, B.N.; Ivanova, M.M.; Mai, H.X.; Salabei, J.K.; Hill, B.G.; Klinge, C.M. Bioenergetic differences between MCF-7 and T47D breast cancer cells and their regulation by oestradiol and tamoxifen. Biochem J. 2015, 465, 49-61.
- Radde, B.N.; Ivanova, M.M.; Mai, H.X.; Alizadeh-Rad, N.; Piell, K.; Van Hoose, P.; Cole, M.P.; Muluhngwi, P.; Kalbfleisch, T.S.; Rouchka, E.C.; et al. Nuclear respiratory factor-1 and bioenergetics in tamoxifen-resistant breast cancer cells. Exp Cell Res. 2016, 347, 222-231.
- Sotgia, F.; Lisanti, M.P. Mitochondrial mRNA transcripts predict overall survival, tumor recurrence and progression in serous ovarian cancer: Companion diagnostics for cancer therapy. Oncotarget. 2017, 8, 66925-66939.
- Gandhi, N.; Das, G.M. Metabolic Reprogramming in Breast Cancer and Its Therapeutic Implications. Cells. 2019, 8, 89. [CrossRef]
- Zacksenhaus, E.; Shrestha, M.; Liu, J.C.; Vorobieva, I.; Chung, P.E.D.; Ju, Y.; Nir, U.; Jiang, Z. Mitochondrial OXPHOS Induced by RB1 Deficiency in Breast Cancer: Implications for Anabolic Metabolism, Stemness, and Metastasis. Trends Cancer. 2017, 3, 768-779.
- Maximov, P.Y.; Abderrahman, B.; Curpan, R.F.; Hawsawi, Y.M.; Fan, P.; Jordan, V.C. A unifying biology of sex steroid-induced apoptosis in prostate and breast cancers. Endocr Relat Cancer. 2018, 25, R83-R113.
- Al-Howail, H.A.; Hakami, H.A.; Al-Otaibi, B.; Al-Mazrou, A.; Daghestani, M.H.; Al-Jammaz, I.; Al-Khalaf, H.H.; Aboussekhra, A. PAC down-regulates estrogen receptor alpha and suppresses epithelial-to-mesenchymal transition in breast cancer cells. BMC Cancer. 2016, 16, 540.
- Bouris, P.; Skandalis, S.S.; Piperigkou, Z.; Afratis, N.; Karamanou, K.; Aletras, A.J.; Moustakas, A.; Theocharis, A.D.; Karamanos, N.K. Estrogen receptor alpha mediates epithelial to mesenchymal transition, expression of specific matrix effectors and functional properties of breast cancer cells. Matrix Biol. 2015, 43, 42-60.
- Kulkoyluoglu-Cotul, E.; Arca, A.; Madak-Erdogan, Z. Crosstalk between Estrogen Signaling and Breast Cancer Metabolism. Trends Endocrinol Metab. 2019, 30, 25-38.
- Wu, Q.; Hatse, S.; Kenis, C.; Fernández-García, J.; Altea-Manzano, P.; Billen, J.; Planque, M.; Vandekeere, A.; Lambrechts, Y.; Richard, F.; et al. Serum methylmalonic acid concentrations at breast cancer diagnosis significantly correlate with clinical frailty. GeroScience 2024, 46, 1489-1498. [CrossRef]
- Cox, G.; Koteva, K.; Wright, G.D. An unusual class of anthracyclines potentiate Gram-positive antibiotics in intrinsically resistant Gram-negative bacteria. J Antimicrob Chemother. 2014, 69, 1844-1855.
- Westman, E.L.; Canova, M.J.; Radhi, I.J.; Koteva, K.; Kireeva, I.; Waglechner, N.; Wright, G.D. Bacterial inactivation of the anticancer drug doxorubicin. Chem Biol. 2012, 19, 1255-1264.
- Parajuli, P.; Pandey, R.P.; Nguyen, T.H.T.; Dhakal, D.; Sohng, J.K. Substrate Scope of O-Methyltransferase from Streptomyces peucetius for Biosynthesis of Diverse Natural Products Methoxides. Appl Biochem Biotechnol. 2018, 184, 1404-1420.
- Dhakal, D.; Lim, S.K.; Kim, D.H.; Kim, B.G.; Yamaguchi, T.; Sohng, J.K. Complete genome sequence of Streptomyces peucetius ATCC 27952, the producer of anticancer anthracyclines and diverse secondary metabolites. J Biotechnol. 2018, 267, 50-54.
- Zabala, D.; Brana, A.F.; Florez, A.B.; Salas, J.A.; Mendez, C. Engineering precursor metabolite pools for increasing production of antitumor mithramycins in Streptomyces argillaceus. Metab Eng. 2013, 20, 187-197.
- Dou, T.Y.; Luan, H.W.; Liu, X.B.; Li, S.Y.; Du, X.F.; Yang, L. Enzymatic hydrolysis of 7-xylosyltaxanes by an extracellular xylosidase from Cellulosimicrobium cellulans. Biotechnol Lett. 2015, 37, 1905-1910.
- Zhou, D.J.; Pan, J.; Yu, H.L.; Zheng, G.W.; Xu, J.H. Target-oriented discovery of a new esterase-producing strain Enterobacter sp. ECU1107 for whole cell-catalyzed production of (2S,3R)-3-phenylglycidate as a chiral synthon of Taxol. Appl Microbiol Biotechnol. 2013, 97, 6293-6300.
- Garcia-Gonzalez, A.P.; Ritter, A.D.; Shrestha, S.; Andersen, E.C.; Yilmaz, L.S.; Walhout, A.J.M. Bacterial Metabolism Affects the C. elegans Response to Cancer Chemotherapeutics. Cell. 2017, 169, 431-441.
- Scott, T.A.; Quintaneiro, L.M.; Norvaisas, P.; Lui, P.P.; Wilson, M.P.; Leung, K.Y.; Herrera-Dominguez, L.; Sudiwala, S.; Pessia, A.; Clayton, P.T.; et al. Host-Microbe Co-metabolism Dictates Cancer Drug Efficacy in C. elegans. Cell. 2017, 169, 442-456.
- Geller, L.T.; Straussman, R. Intratumoral bacteria may elicit chemoresistance by metabolizing anticancer agents. Mol Cell Oncol. 2018, 5, e1405139.
- Sandrini, M.P.; Shannon, O.; Clausen, A.R.; Bjorck, L.; Piskur, J. Deoxyribonucleoside kinases activate nucleoside antibiotics in severely pathogenic bacteria. Antimicrob Agents Chemother. 2007, 51, 2726-2732.
- Sandrini, M.P.; Clausen, A.R.; On, S.L.; Aarestrup, F.M.; Munch-Petersen, B.; Piskur, J. Nucleoside analogues are activated by bacterial deoxyribonucleoside kinases in a species-specific manner. J Antimicrob Chemother. 2007, 60, 510-520.
- Alexander, J.L.; Wilson, I.D.; Teare, J.; Marchesi, J.R.; Nicholson, J.K.; Kinross, J.M. Gut microbiota modulation of chemotherapy efficacy and toxicity. Nat Rev Gastroenterol Hepatol. 2017, 14, 356-365.
- Geller, L.T.; Barzily-Rokni, M.; Danino, T.; Jonas, O.H.; Shental, N.; Nejman, D.; Gavert, N.; Zwang, Y.; Cooper, Z.A.; Shee, K.; et al. Potential role of intratumor bacteria in mediating tumor resistance to the chemotherapeutic drug gemcitabine. Science. 2017, 357, 1156-1160.
- Vande Voorde, J.; Sabuncuoglu, S.; Noppen, S.; Hofer, A.; Ranjbarian, F.; Fieuws, S.; Balzarini, J.; Liekens, S. Nucleoside-catabolizing enzymes in mycoplasma-infected tumor cell cultures compromise the cytostatic activity of the anticancer drug gemcitabine. J Biol Chem. 2014, 289, 13054-13065. [CrossRef]
- Lehouritis, P.; Cummins, J.; Stanton, M.; Murphy, C.T.; McCarthy, F.O.; Reid, G.; Urbaniak, C.; Byrne, W.L.; Tangney, M. Local bacteria affect the efficacy of chemotherapeutic drugs. Sci Rep. 2015, 5:14554., . [CrossRef]
- Loser, C.; Folsch, U.R.; Paprotny, C.; Creutzfeldt, W. Polyamine concentrations in pancreatic tissue, serum, and urine of patients with pancreatic cancer. Pancreas. 1990, 5, 119-127.
- Loser, C.; Folsch, U.R.; Paprotny, C.; Creutzfeldt, W. Polyamines in colorectal cancer. Evaluation of polyamine concentrations in the colon tissue, serum, and urine of 50 patients with colorectal cancer. Cancer. 1990, 65, 958-966.
- Danaceau, J.P.; Anderson, G.M.; McMahon, W.M.; Crouch, D.J. A liquid chromatographic-tandem mass spectrometric method for the analysis of serotonin and related indoles in human whole blood. J Anal Toxicol. 2003, 27, 440-444.
- Rosas, H.D.; Doros, G.; Bhasin, S.; Thomas, B.; Gevorkian, S.; Malarick, K.; Matson, W.; Hersch, S.M. A systems-level “misunderstanding”: the plasma metabolome in Huntington’s disease. Ann Clin Transl Neurol. 2015, 2, 756-768.
- Roager, H.M.; Licht, T.R. Microbial tryptophan catabolites in health and disease. Nat Commun. 2018, 9, 3294.
- Lin, C.-N.; Wu, I.W.; Huang, Y.-F.; Peng, S.-Y.; Huang, Y.-C.; Ning, H.-C. Measuring serum total and free indoxyl sulfate and p-cresyl sulfate in chronic kidney disease using UPLC-MS/MS. Journal of Food and Drug Analysis 2019, 27, 502-509. [CrossRef]
- Kacsir, I.; Sipos, A.; Kiss, T.; Major, E.; Bajusz, N.; Tóth, E.; Buglyo, P.; Somsak, L.; Kardos, G.; Bai, P.; et al. Half Sandwich-Type Osmium, Ruthenium, Iridium and Rhodium Complexes with Bidentate Glycosyl Heterocyclic Ligands Induce Cytostasis in Platinum-Resistant Ovarian Cancer Cells and Bacteriostasis in Gram-Positive Multiresistant Bacteria. Frontiers in Chemistry 2023, 11, 1086267.
- Kacsir, I.; Sipos, A.; Major, E.; Bajusz, N.; Bényei, A.; Buglyó, P.; Somsák, L.; Kardos, G.; Bai, P.; Bokor, É. Half-Sandwich Type Platinum-Group Metal Complexes of C-Glucosaminyl Azines: Synthesis and Antineoplastic and Antimicrobial Activities. Molecules (Basel, Switzerland) 2023, 28, 3058. [CrossRef]
- Senkus, E.; Kyriakides, S.; Ohno, S.; Penault-Llorca, F.; Poortmans, P.; Rutgers, E.; Zackrisson, S.; Cardoso, F. Primary breast cancer: ESMO Clinical Practice Guidelines for diagnosis, treatment and follow-up. Ann Oncol. 2015, 26, v8-30.
- Harbeck, N.; Gnant, M. Breast cancer. Lancet. 2017, 389, 1134-1150.
- Curtin, N.; Szabo, C. Therapeutic Applications of PARP Inhibitors: Anticancer Therapy and Beyond. Molecular Aspects of Medicine 2013, 6, 1043-1258.
- Bai, P. Biology of Poly(ADP-Ribose) Polymerases: The Factotums of Cell Maintenance. Molecular Cell 2015, 58, 947-958.
- Fong, P.C.; Boss, D.S.; Yap, T.A.; Tutt, A.; Wu, P.; Mergui-Roelvink, M.; Mortimer, P.; Swaisland, H.; Lau, A.; O’Connor, M.J.; et al. Inhibition of Poly(ADP-Ribose) Polymerase in Tumors from BRCA Mutation Carriers. N Engl J Med 2009, 361(2), 123-134.
- Kwapisz, D. Cyclin-dependent kinase 4/6 inhibitors in breast cancer: palbociclib, ribociclib, and abemaciclib. Breast Cancer Res Treat. 2017, 166, 41-54.
- Fan, Y.; Liang, L.; Tang, X.; Zhu, J.; Mu, L.; Wang, M.; Huang, X.; Gong, S.; Xu, J.; Liu, T.; et al. Changes in the gut microbiota structure and function in rats with doxorubicin-induced heart failure. Front Cell Infect Microbiol 2023, 13, 1135428. [CrossRef]
- Tian, Z.; Qiao, X.; Wang, Z.; Li, X.; Pan, Y.; Wei, X.; Lv, Z.; Li, P.; Du, Q.; Wei, W.; et al. Cisplatin and doxorubicin chemotherapy alters gut microbiota in a murine osteosarcoma model. Aging (Albany NY) 2024, 16, 1336-1351. [CrossRef]
- Sivan, A.; Corrales, L.; Hubert, N.; Williams, J.B.; Aquino-Michaels, K.; Earley, Z.M.; Benyamin, F.W.; Lei, Y.M.; Jabri, B.; Alegre, M.L.; et al. Commensal Bifidobacterium promotes antitumor immunity and facilitates anti-PD-L1 efficacy. Science 2015, 350, 1084-1089. [CrossRef]
- Schwarcz, S.; Kovács, P.; Kovács, T.; Ujlaki, G.; Nyerges, P.; Uray, K.; Bai, P.; Mikó, E. The pro- and antineoplastic effects of deoxycholic acid in pancreatic adenocarcinoma cell models. Mol Biol Rep 2023, 50, 5273-5282. [CrossRef]
- Schwarcz, S.; Kovács, P.; Nyerges, P.; Ujlaki, G.; Sipos, A.; Uray, K.; Bai, P.; Mikó, E. A bacterial metabolite, lithocholic acid has anti-carcinogenic effects in pancreatic adenocarcinoma. Research Square 2024.
- Gesztelyi, R.; Zsuga, J.; Kemeny-Beke, A.; Varga, B.; Juhasz, B.; Tosaki, A. The Hill equation and the origin of quantitative pharmacology. Archive for History of Exact Sciences 2012, 66, 427-438. [CrossRef]
- Yokoyama, M.T.; Carlson, J.R. Microbial metabolites of tryptophan in the intestinal tract with special reference to skatole. Am J Clin Nutr. 1979, 32, 173-178.
- Auslander, N.; Yizhak, K.; Weinstock, A.; Budhu, A.; Tang, W.; Wang, X.W.; Ambs, S.; Ruppin, E. A joint analysis of transcriptomic and metabolomic data uncovers enhanced enzyme-metabolite coupling in breast cancer. Sci Rep. 2016, 6, 29662.
- Tang, X.; Lin, C.C.; Spasojevic, I.; Iversen, E.S.; Chi, J.T.; Marks, J.R. A joint analysis of metabolomics and genetics of breast cancer. Breast Cancer Research 2014, 16, 415.
- Box, G.E.P.; Cox, D.R. An analysis of transformations. Journal of the Royal Statistical Society, B 1964, 26, 211-234.

Disclaimer/Publisher’s Note: The statements, opinions and data contained in all publications are solely those of the individual author(s) and contributor(s) and not of MDPI and/or the editor(s). MDPI and/or the editor(s) disclaim responsibility for any injury to people or property resulting from any ideas, methods, instructions or products referred to in the content. |
© 2024 by the authors. Licensee MDPI, Basel, Switzerland. This article is an open access article distributed under the terms and conditions of the Creative Commons Attribution (CC BY) license (http://creativecommons.org/licenses/by/4.0/).


