Submitted:

01 May 2024

Posted:

03 May 2024

You are already at the latest version

A peer-reviewed article of this preprint also exists.

Abstract
Primary open-angle glaucoma (POAG) is a progressive optic neuropathy with a complex, multifactorial aetiology. Raised intraocular pressure (IOP) is the most important clinically modifiable risk factor for POAG. All current pharmacological agents target aqueous hu-mour dynamics to lower IOP. Newer therapeutic agents are required as some patients with POAG show a limited therapeutic response or develop ocular and systemic side ef-fects to topical medication. Elevated IOP in POAG results from cellular and molecular changes in the trabecular meshwork driven by increased levels of transforming growth factor β (TGFβ) in the anterior segment of the eye. Understanding how TGF affects both the structural and functional changes in the outflow pathway and IOP is required to de-velop new glaucoma therapies that target the molecular pathology in the trabecular meshwork. In this study we evaluated the effects of TGF-1 and -2 treatment on miRNA expression in cultured human primary trabecular meshwork cells. Our findings are pre-sented in terms of specific miRNAs (miRNA-centric), but given miRNAs work in net-works to control cellular pathways and processes, a pathway-centric view of miRNA ac-tion is also reported. Evaluating TGF-responsive miRNA expression in trabecular meshwork cells will further our understanding of the important pathways and changes involved in the pathogenesis of glaucoma and could lead to the development of miRNAs as new therapeutic modalities in glaucoma.
Keywords: 
Subject: 
Medicine and Pharmacology  -   Ophthalmology

1. Introduction

Glaucoma is a progressive optic neuropathy with loss of retinal ganglion cells and characteristic visual field and optic nerve changes [1]. Glaucoma affects over 60 million people worldwide and the prevalence is projected to increase to over 118 million people by 2040 [2]. Primary open-angle glaucoma (POAG) forms the most prevalent subtype of glaucoma and has a complex, multifactorial aetiology. Raised intraocular pressure (IOP) is the most important clinically modifiable risk factor for POAG. IOP is generated by the conventional aqueous humour outflow pathway via the trabecular meshwork and all current pharmacological agents target aqueous humour dynamics to lower IOP [3,4].
However, some patients with POAG show a limited therapeutic response or are refractory to these pharmacological agents (Scherer, 2002; Ang, 2004; Cai et al., 2021), while others have clinically significant adverse physiological impacts, such as bradycardia or bronchospasm [8]. Until the development of Rho kinase (ROCK) inhibitors, none of the topical drug treatments for POAG targeted the underlying cellular pathophysiology in the trabecular meshwork [9,10]. ROCK inhibitors pharmacologically manipulate the cytoskeleton of trabecular meshwork and Schlemm’s canal cells reducing outflow resistance and lowering IOP [9,10]. Relatively common ocular side effects like conjunctival hyperaemia have limited tolerability of ROCK inhibitors in the pharmacological management of POAG [3,4,10]. Therefore, there is a clinical need to develop novel therapies for POAG specifically targeting the molecular pathology in the trabecular meshwork to lower IOP [3,4,11].
Elevated IOP in POAG results from cellular and molecular changes in the trabecular meshwork (TM) driven by increased levels of transforming growth factor β (TGFβ) in the anterior segment of the eye [12]. TGF-β1 and -β2 result in pathogenic changes in the human trabecular meshwork (TM) cell population and phenotype, which contribute to increased IOP [13]. Various studies have identified elevated TGFβ2 levels in the aqueous humour of POAG patients [14,15,16,17,18], but the cause of these elevated levels is unclear. Elevated TGFβ2 levels have also been reported in the glaucomatous TM, indicating that increased levels of total and mature TGFβ may play an important role in the pathogenesis of POAG [19]. TGFβ2 perfusion in an anterior eye segment organ culture model resulted in elevated intra-ocular pressure (IOP) and fibrillary material accumulation in the trabecular meshwork [15,20]. In pseudoexfoliation glaucoma (XFG), an aggressive form of secondary open-angle glaucoma, both the latent and active forms of TGFβ1 are increased in the aqueous humour and extracellular matrix (ECM) [21,22,23].
The TGFβ receptor complex transmits signals via both canonical and non-canonical pathways [24,25,26]. Canonical TGFβ signalling results in Smad2/3 - Smad4 complexes translocating to the nucleus where they function as transcription factors that can regulate gene expression including microRNAs (miRNAs) [27,28,29,30]. MiRNAs are small, single-stranded, noncoding RNAs which are important regulators of eukaryotic gene expression in health and disease [31]. Normally, miRNAs bind to the 3′ untranslated region (UTR) of their target mRNAs resulting in mRNA degradation or translation repression [32]. Most TGFβ signalling pathway components are known to be targeted by one or more miRNAs, and miRNA regulation of TGFβ signalling molecules influences the pathogenesis of fibrotic diseases [33]. TGFβ signalling can also regulate miRNA expression at transcriptional and post-transcriptional levels [25]. TGFβ is both cell and context-specific in terms of its functionality. Therefore, research must focus on building our understanding of how TGFβ affects both the structural and functional changes in the outflow pathway and therefore IOP to develop new glaucoma therapies that target the molecular pathology in the TM.
Identifying the expression profiles of miRNAs in POAG and XFG could help us to better understand the changes in gene expression in the TM as well as gain insight into potential pathways that may be involved in the pathogenesis of the disease. The ability of miRNA manipulations to alter gene expression has raised the possibility of miRNA-based therapeutics [34,35,36,37]. Using miRNA-Seq the miRNA expression profile in the normal human trabecular meshwork has been established [38]. However, no previous studies have looked at miRNA expression changes in the TM following TGFβ treatment. Therefore, our study is the first miRNA-Seq study to evaluate the effects of TGFβ1 and -β2 treatment on miRNA expression in normal human primary TM cells. Evaluating TGFβ-responsive miRNA expression in the TM will further our understanding of the important pathways and changes involved in the pathogenesis of POAG and XFG and could lead to the development of miRNAs as new therapeutic modalities in glaucoma.

2. Materials and Methods

2.1. Human Trabecular Meshwork Culture and Characterisation

Cadaveric eyes (n = 4) were provided by the Liverpool Research Eye Bank, approved by the local ethics review board (RETH000833), and handled following the tenets of the Declaration of Helsinki. Donor eyes were obtained from the Royal Liverpool University Hospital mortuary. Medical history for the donor eyes was unknown, however, no donors had previous ocular surgery or a known glaucoma diagnosis. Donor eyes were excluded if the maximum post-mortem time exceeded 48 hours. Primary normal human trabecular meshwork (TM) cells were isolated using the blunt dissection method as reported previously [39]. Cells were maintained in Dulbecco’s Modified Eagle Media (DMEM)-low glucose (Sigma, Gillingham, UK) supplemented with 10% fetal calf serum (Biosera, Heathfield, UK), 2 mM L-glutamine (Sigma, Gillingham, UK), Pen/Step (Sigma, Gillingham, UK), and 2.5 µg/mL Fungizone (amphotericin B, Sigma, Gillingham, UK). Samples were incubated at 37 °C (5% CO2 and 95% humidity). Human TM characterisation was performed as previously described [39] including dexamethasone upregulation of myocilin protein expression (polyclonal rabbit anti-myocilin primary antibody was a kind gift from Dr. W. Daniel Stamer) as previously described by our group [40].

2.2. TGFβ Treatment and RNA Extraction

Human TM cells between passages 4 and 6 were grown to 70-80% confluency and growth arrested overnight using serum free medium before TGF-β1 or -β2 stimulation. with either recombinant human TGFβ1 (240-B-010, R&D Systems, UK) or TGFβ2 (302-B2-010, R&D Systems, UK) at a concentration of 5 ng/mL for 24 hours. Total RNA was extracted from cells using the miRNeasy Mini Kit (Qiagen, Manchester, UK) following the manufacturer’s instructions. The RNA concentration was measured using the NanoDrop 2000 (Thermofisher Scientific, Horsham, UK) and RNA quality was determined by the Bioanalyser 2100 (Agilent Technologies, Stockport, UK) using an RNA 6000 Nano Kit (Agilent, Santa Clara, CA, USA).

2.3. Small RNA Sequencing and Data Analysis

Small RNA sequencing was performed at the Genomics Core Technology Unit (Queen’s University Belfast, UK) using the Qiagen QIAseq miRNA Library Kit (Qiagen, Manchester, UK) to construct small RNA sequencing libraries. Sequencing was performed using a high output sequencing kit (76 cycles) on a NextSeq500 (Illumina Inc., USA) according to the manufacturer’s instructions. The raw sequence data reads were evaluated using FastQC v0.11.9 [41] to check the quality of the reads. Cutadapt 3.0 [42] was applied to remove low quality reads (reads with a Q score/Phred score of less than 30; 99% accuracy) and adapters to ensure only the highest quality sequences were included for further analysis. Following quality control, the Subread and RSubread packages [43] were used to align the remaining sequences to the human genome reference (GRCh38) from the Human GENCODE Gene Set [44]. The reference database miRbase (v22.1) was used for miRNA alignment (Griffiths-Jones et al., 2006). A count matrix of mapped reads for each miRNA was generated using featureCount [46]. These raw counts were used for downstream differential expression analysis. Counts data were generated for each paired treatment group and the significance of miRNA expression was compared using the generalised linear model (GLM) approach implemented by Bioconductor edgeR (v3.18), following the Trimmed Mean of M (TMM) method of normalization [47]. miRNAs were considered to be differentially expressed if the p-value was less than 0.05. Volcano plots of differentially expressed miRNAs (DEmiRs) were generated using the Enhanced Volcano package in R [48].

2.4. Functional and Pathway Enrichment Analysis

Following miRNA-Seq analysis, functional enrichment analysis was performed through Database for Annotation, Visualization and Integrated Discovery (DAVID) bioinformatic package (http://david.abcc.ncifcrf.gov) [49,50]. Firstly, to gather a list of target genes for significant miRNAs, TargetScan (https://www.targetscan.org/vert_71/) [51] and miRTarbase (https://dianalab.e-ce.uth.gr/tarbasev9) [52] were used to identify strong experimentally validated genes for significant miRNAs with a threshold of FDR < 0.05 to ensure a high confidence. The list of gene targets was added to the DAVID software to assess significantly enriched pathways. Kyoto Encyclopedia of Genes and Genomes (KEGG) enrichment analysis was carried out to investigate relationships between the significantly expressed genes and their related pathways. Significance was calculated in DAVID using Fisher’s exact test to obtain p-values. Only pathways with a p-value < 0.05 were considered significant.

2.5. miRNA RT-qPCR Validation of miRNA-Seq Data

For miRNA analyses, 5 ng/µL of total RNA was reverse transcribed into cDNA using the miRCURY LNA RT Kit (Qiagen, UK) following manufacturer specifications. RT-qPCR was performed using miRCURY LNA SYBR Green PCR Kit (Qiagen, UK) on a LightCycler®480 real-time PCR system (Roche Diagnostics, Switzerland), following manufacturer instructions. miRNA primers were obtained from Qiagen (miRCURY LNA primer assays (Qiagen, UK) (Table S1). All miRNA expression was measured in duplicate at CT threshold levels and normalised with the average CT values of a housekeeping control; U6. Values were expressed as fold increase over the corresponding values for control by the 2-ΔΔCT method. Two independent experiments were performed, and the average (±SD) results were calculated using GraphPad Prism software (GraphPad Software, San Diego, USA). Data were expressed as the mean values ± SD and graphed using log scale. Statistical significance was analysed using a student t-test. Differences in the mean were considered statistically significant if p < 0.05.

3. Results

3.1. Descriptive Features of Small RNA-Seq Data

Three small RNA libraries (donor control, donor TGFβ1-treated and donor TGFβ2-treated) were sequenced. In total, 10+ million 75 bp reads were obtained with an average of 13.2 million reads per sample ranging from 10–15 million reads per sample. Only data with a Q score greater than 30 (>99.9% correct) were utilised in the mapping step of the analysis pipeline. The mapping for each sample was on average 86% and the uniformity of the mapping statistics suggests that the samples are comparable.

3.2. Differential Expression of TGFβ1-Responsive miRNAs in TM Cells

To determine changes in miRNA expression in the TM in response to TGFβ1, normal primary human TM cells were treated with 5 ng/mL TGFβ1 and analysed using small RNA-Seq. In total, 107 miRNAs were statistically significantly altered (p < 0.05), with 58 significantly up-regulated and 49 significantly down-regulated. All differentially expressed TGFβ1-induced miRNAs were graphed on a volcano plot (Figure 1) which allows for easy visual identification of miRNAs with large and statistically significant fold changes. The top 30 up-regulated and 30 down-regulated DEmiRs were ranked by fold change and are shown in Table 1 and 2, respectively.

3.3. Functional Enrichment Analysis of the TGFβ1 Differentially Expressed Genes

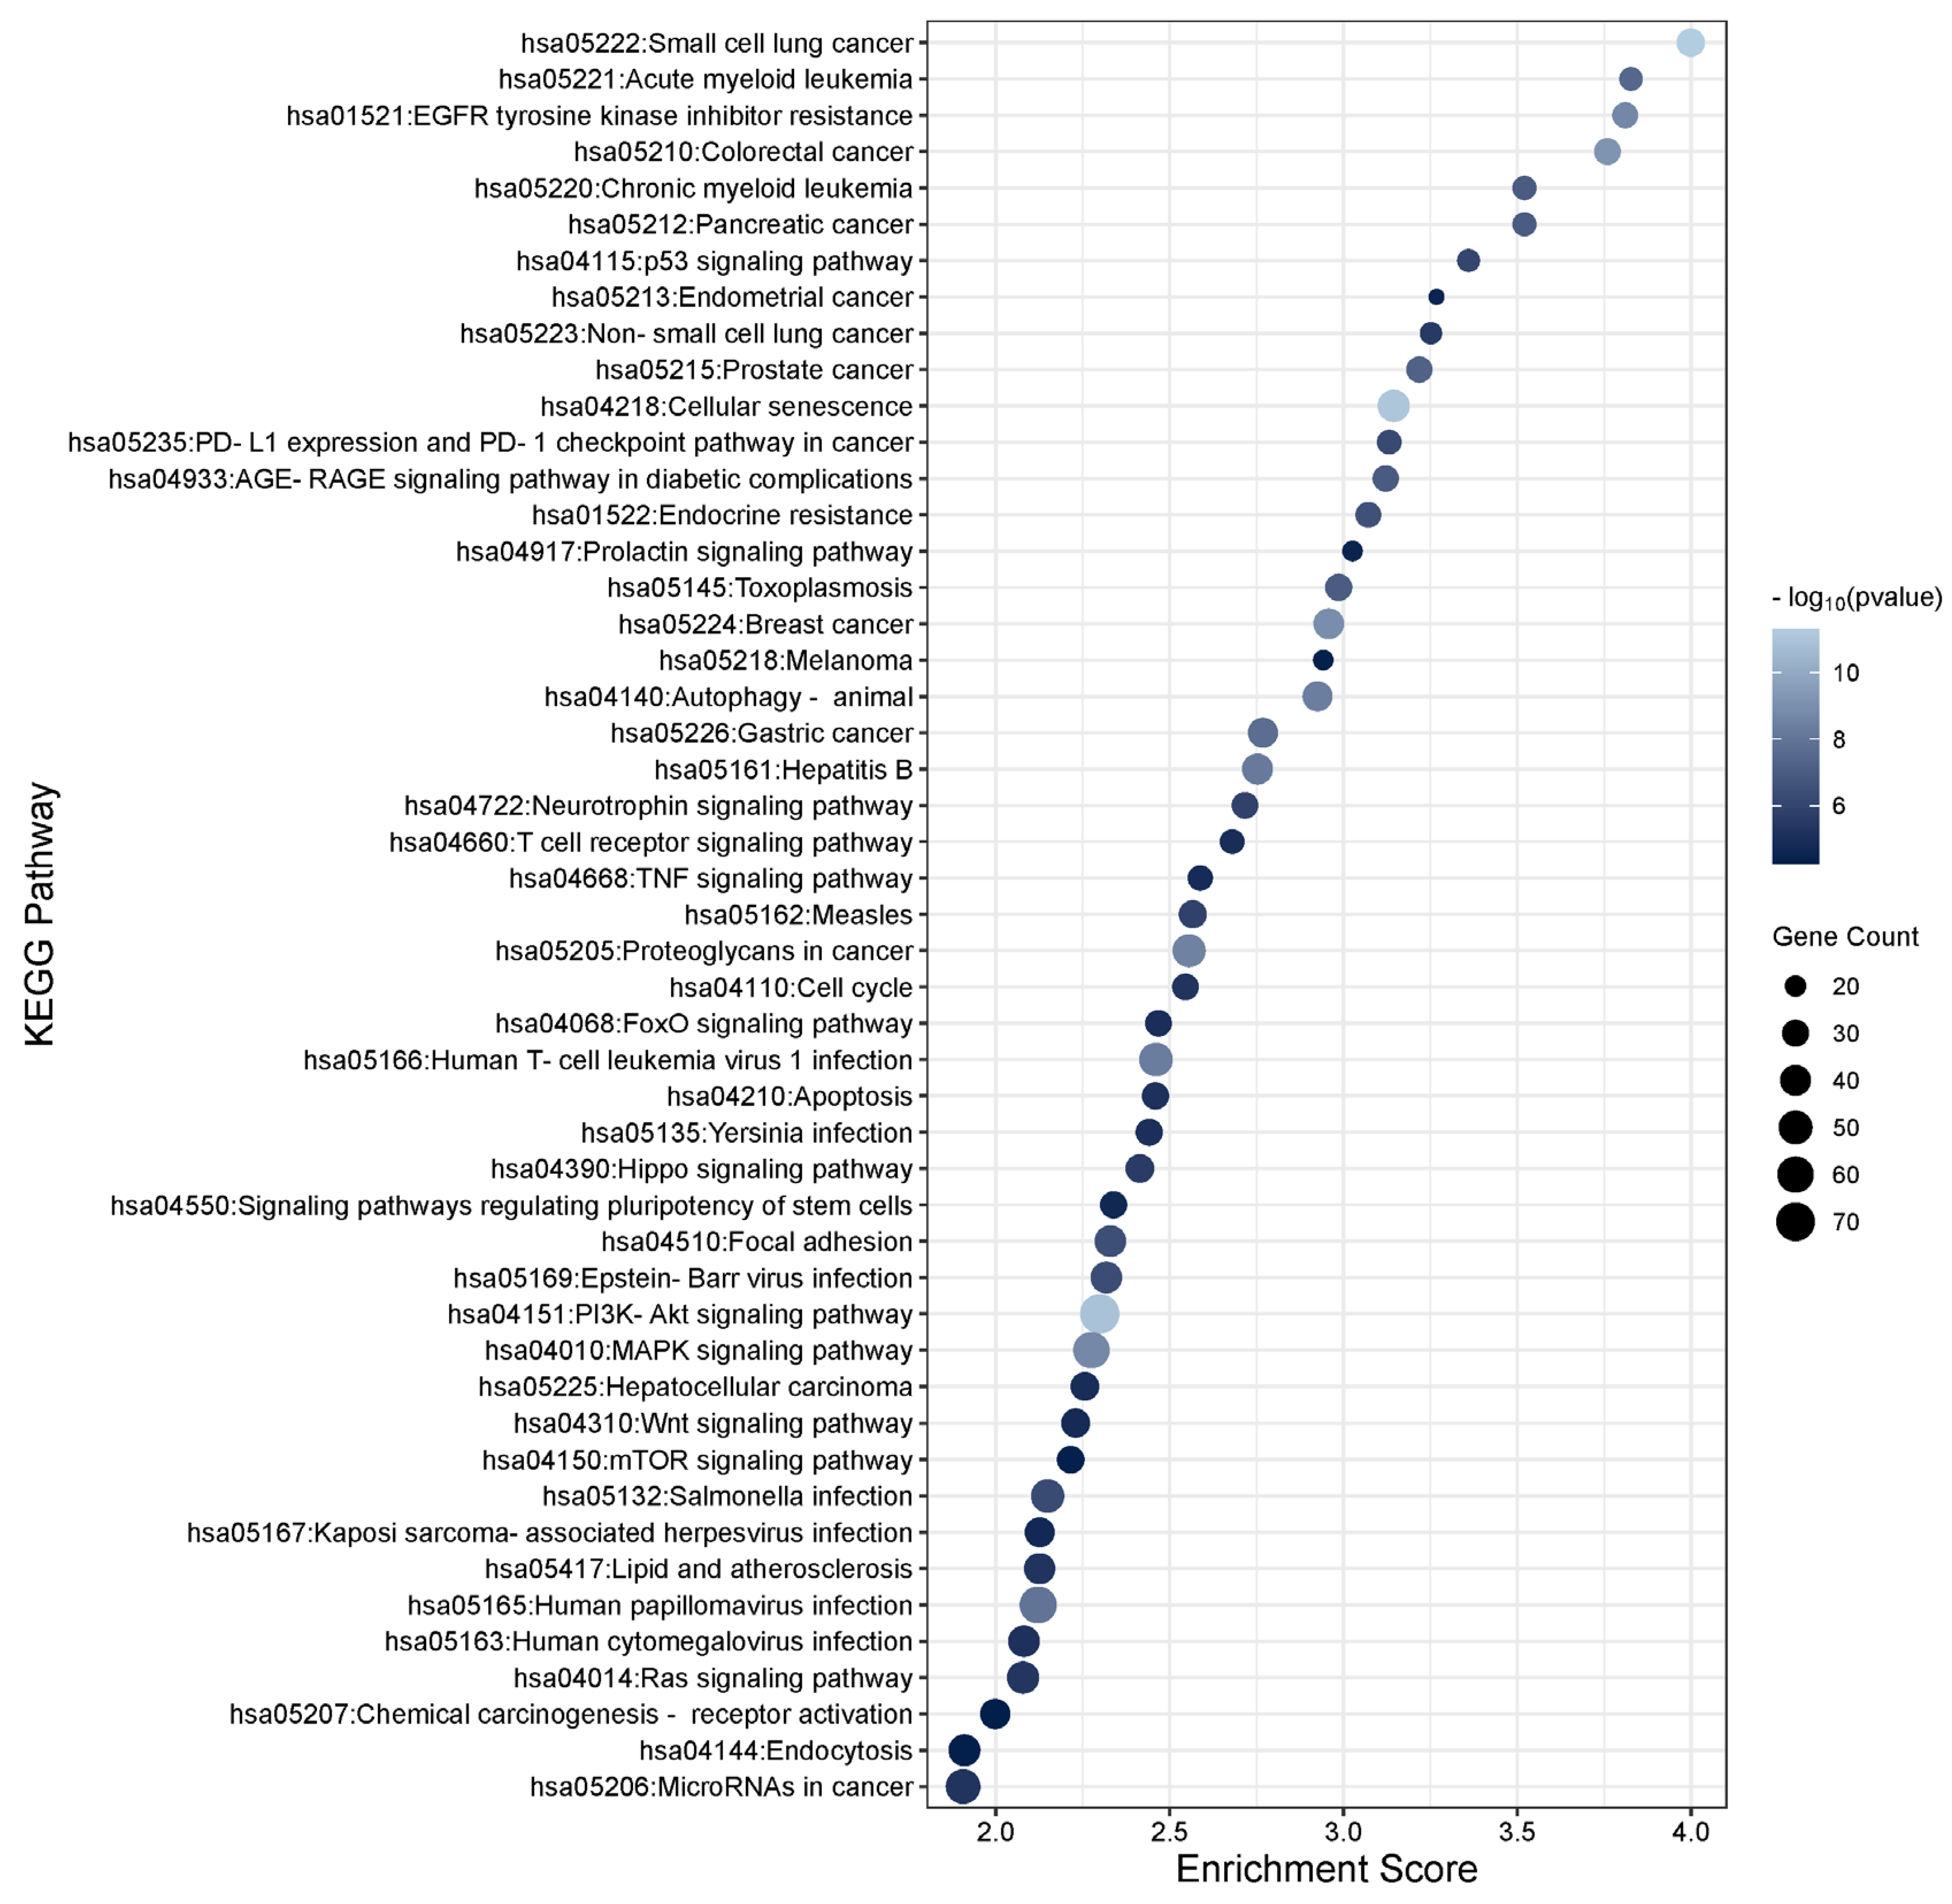
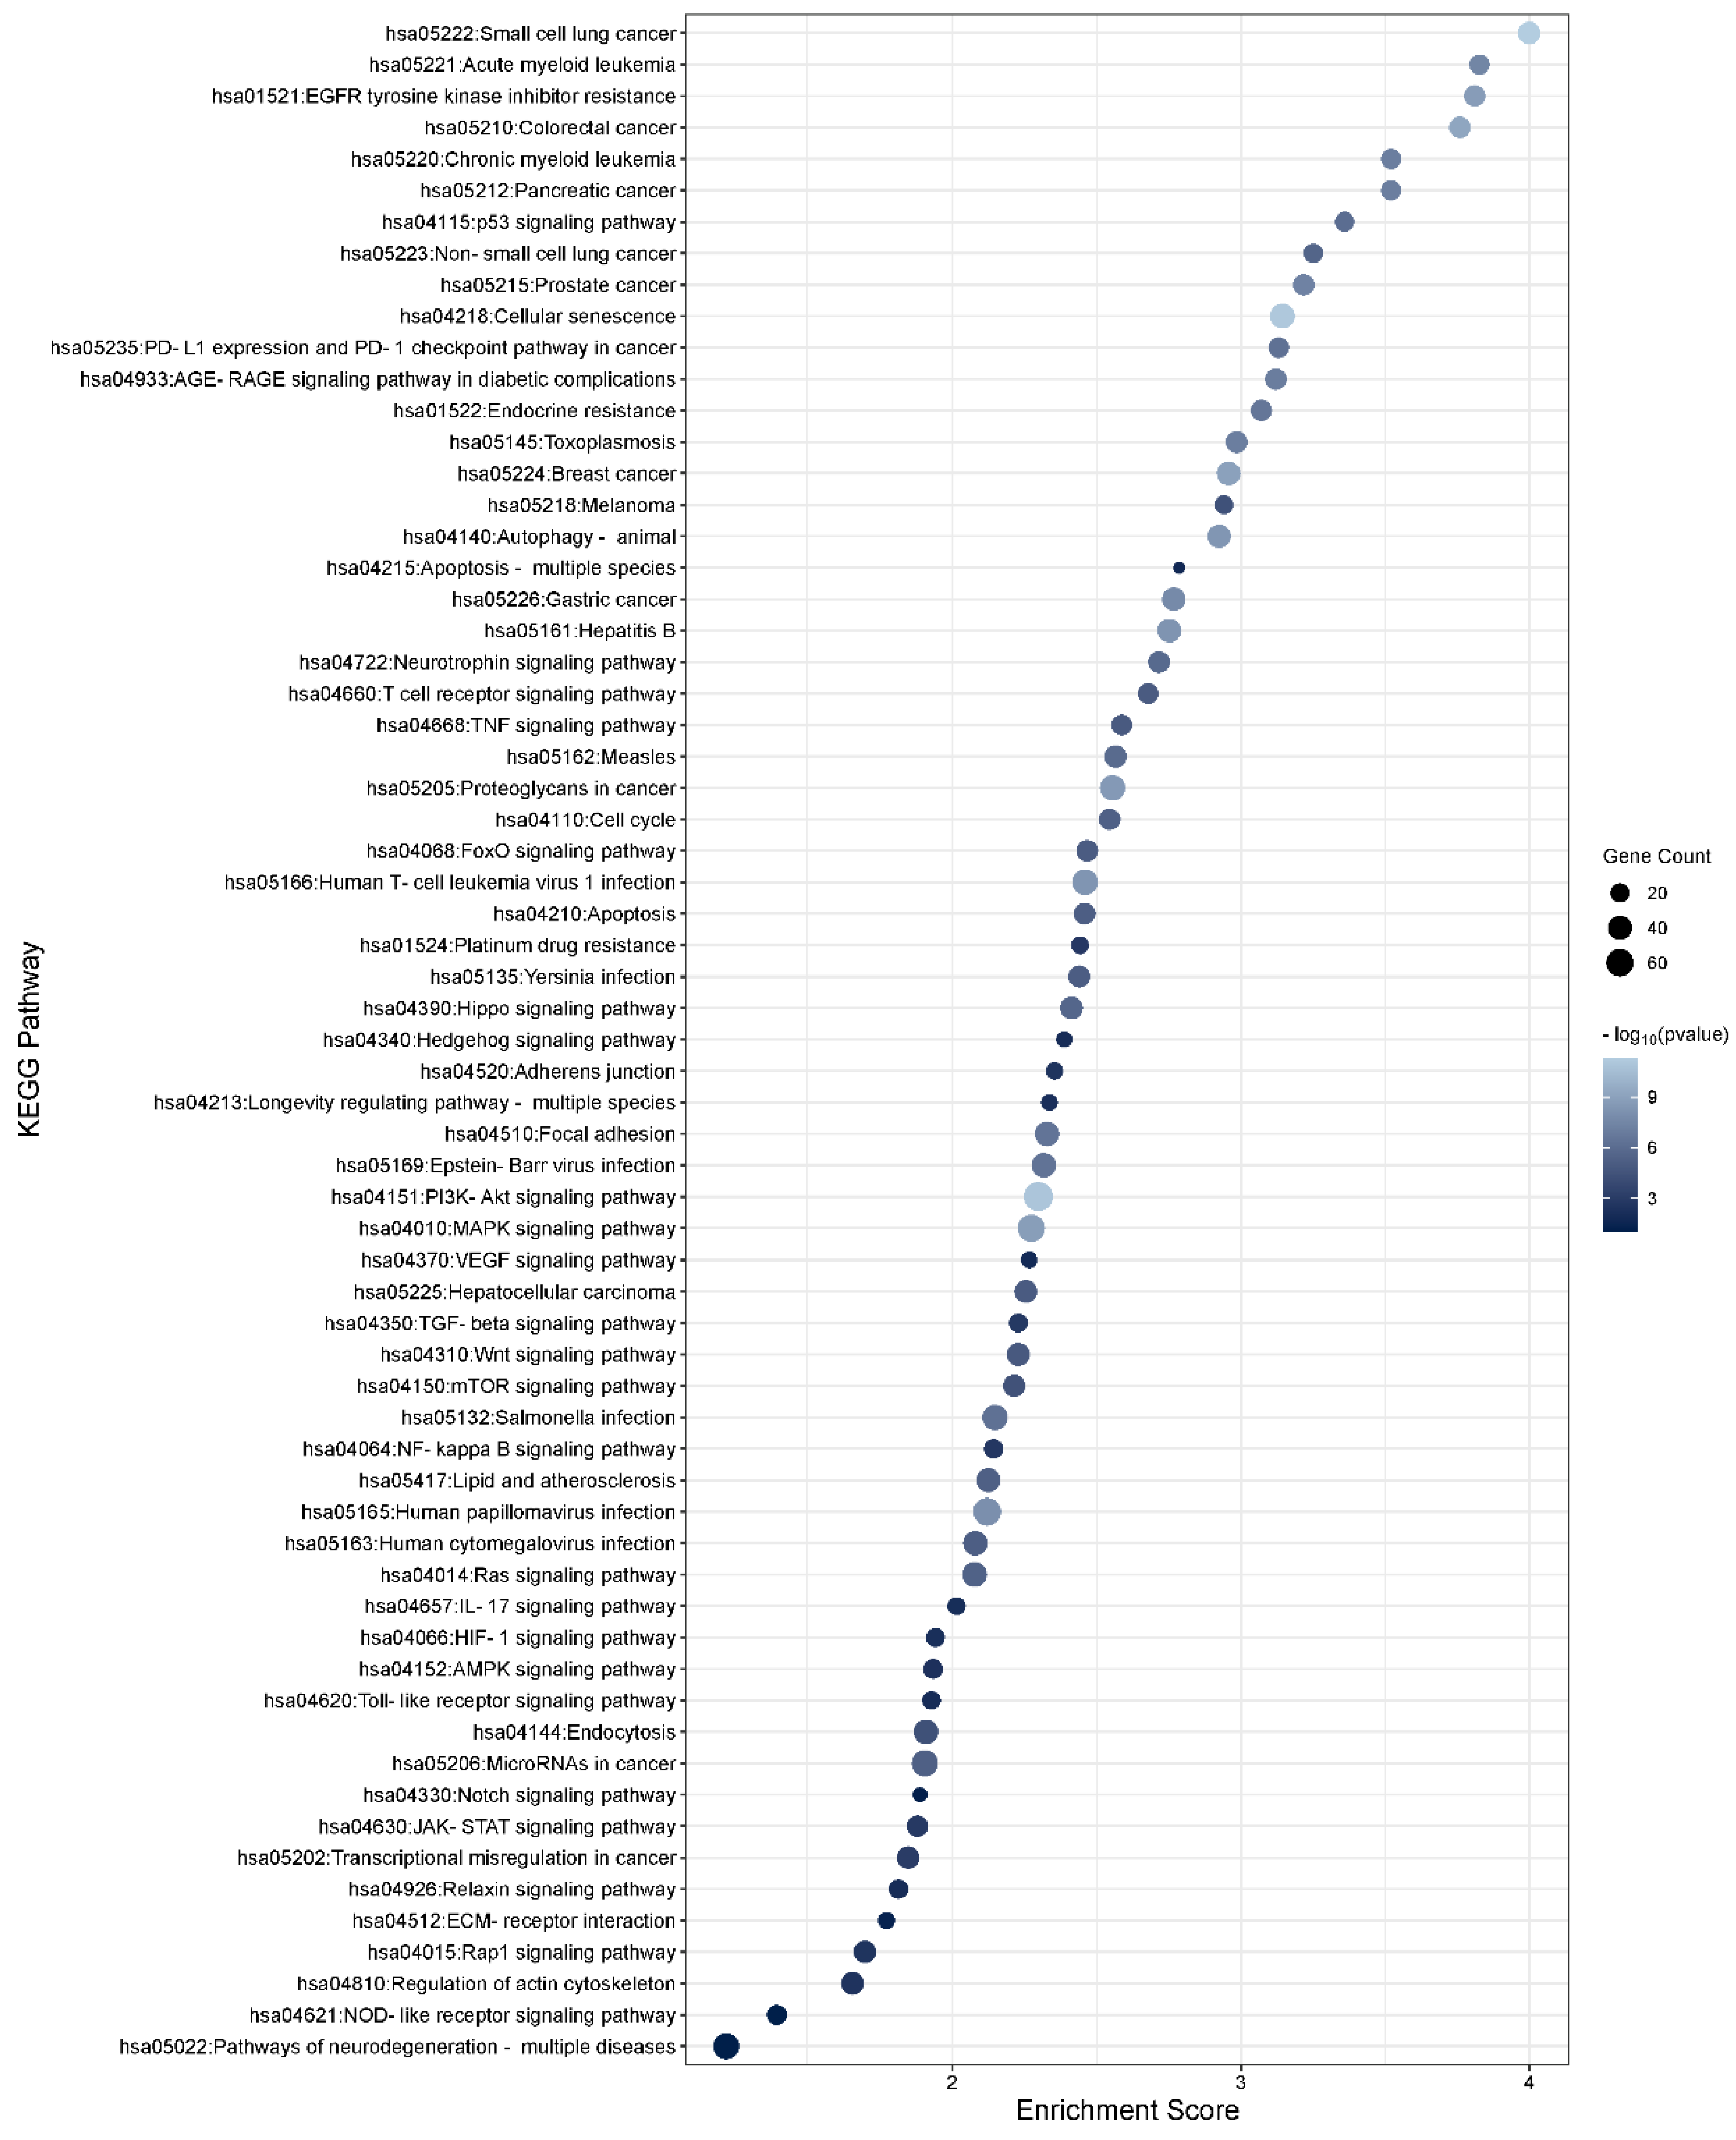
To determine the function of the TGFβ1-induced DEmiRs and the potential role they play within the TM, KEGG enrichment analysis was performed using DAVID software (https://david.ncifcrf.gov) on the target genes of the significant DEmiRs (p < 0.05). To gather a list of target genes for the significant miRNAs, TargetScan and miRTarbase were used to identify strong experimentally validated genes for significant miRNAs with a threshold of FDR < 0.05 to ensure high confidence. The list of gene targets was added to the DAVID software to assess significantly enriched pathways. In total, 135 unique pathways were found to be associated with TGFβ1-regulated miRNAs. The top 30 KEGG pathways for gene targets of the up- and down-regulated TGFβ1 responsive miRNAs are shown in Figure 2 and Figure 3, respectively. Pathways relating to TGFβ signalling, MAPK signalling, PI3K-Akt signalling, Hippo signalling, Wnt signalling, focal adhesion, and regulation of the actin cytoskeleton are relevant to glaucoma/PXFG pathogenesis and are listed in Table 3 (significantly up-regulated miRNAs) and Table 4 (significantly down-regulated miRNAs) along with the associated miRNAs and gene targets. Pathways relating to TGFβ signalling, MAPK signalling, PI3K-Akt signalling, Hippo signalling, Wnt signalling, focal adhesion, and regulation of the actin cytoskeleton are relevant to glaucoma/PXFG pathogenesis and are listed in Table S2 (significantly up-regulated miRNAs) and Table S3 (significantly down-regulated miRNAs) along with the associated miRNAs and gene targets.

3.4. Validation of TGFβ1 Responsive DEmiRs by RT-qPCR

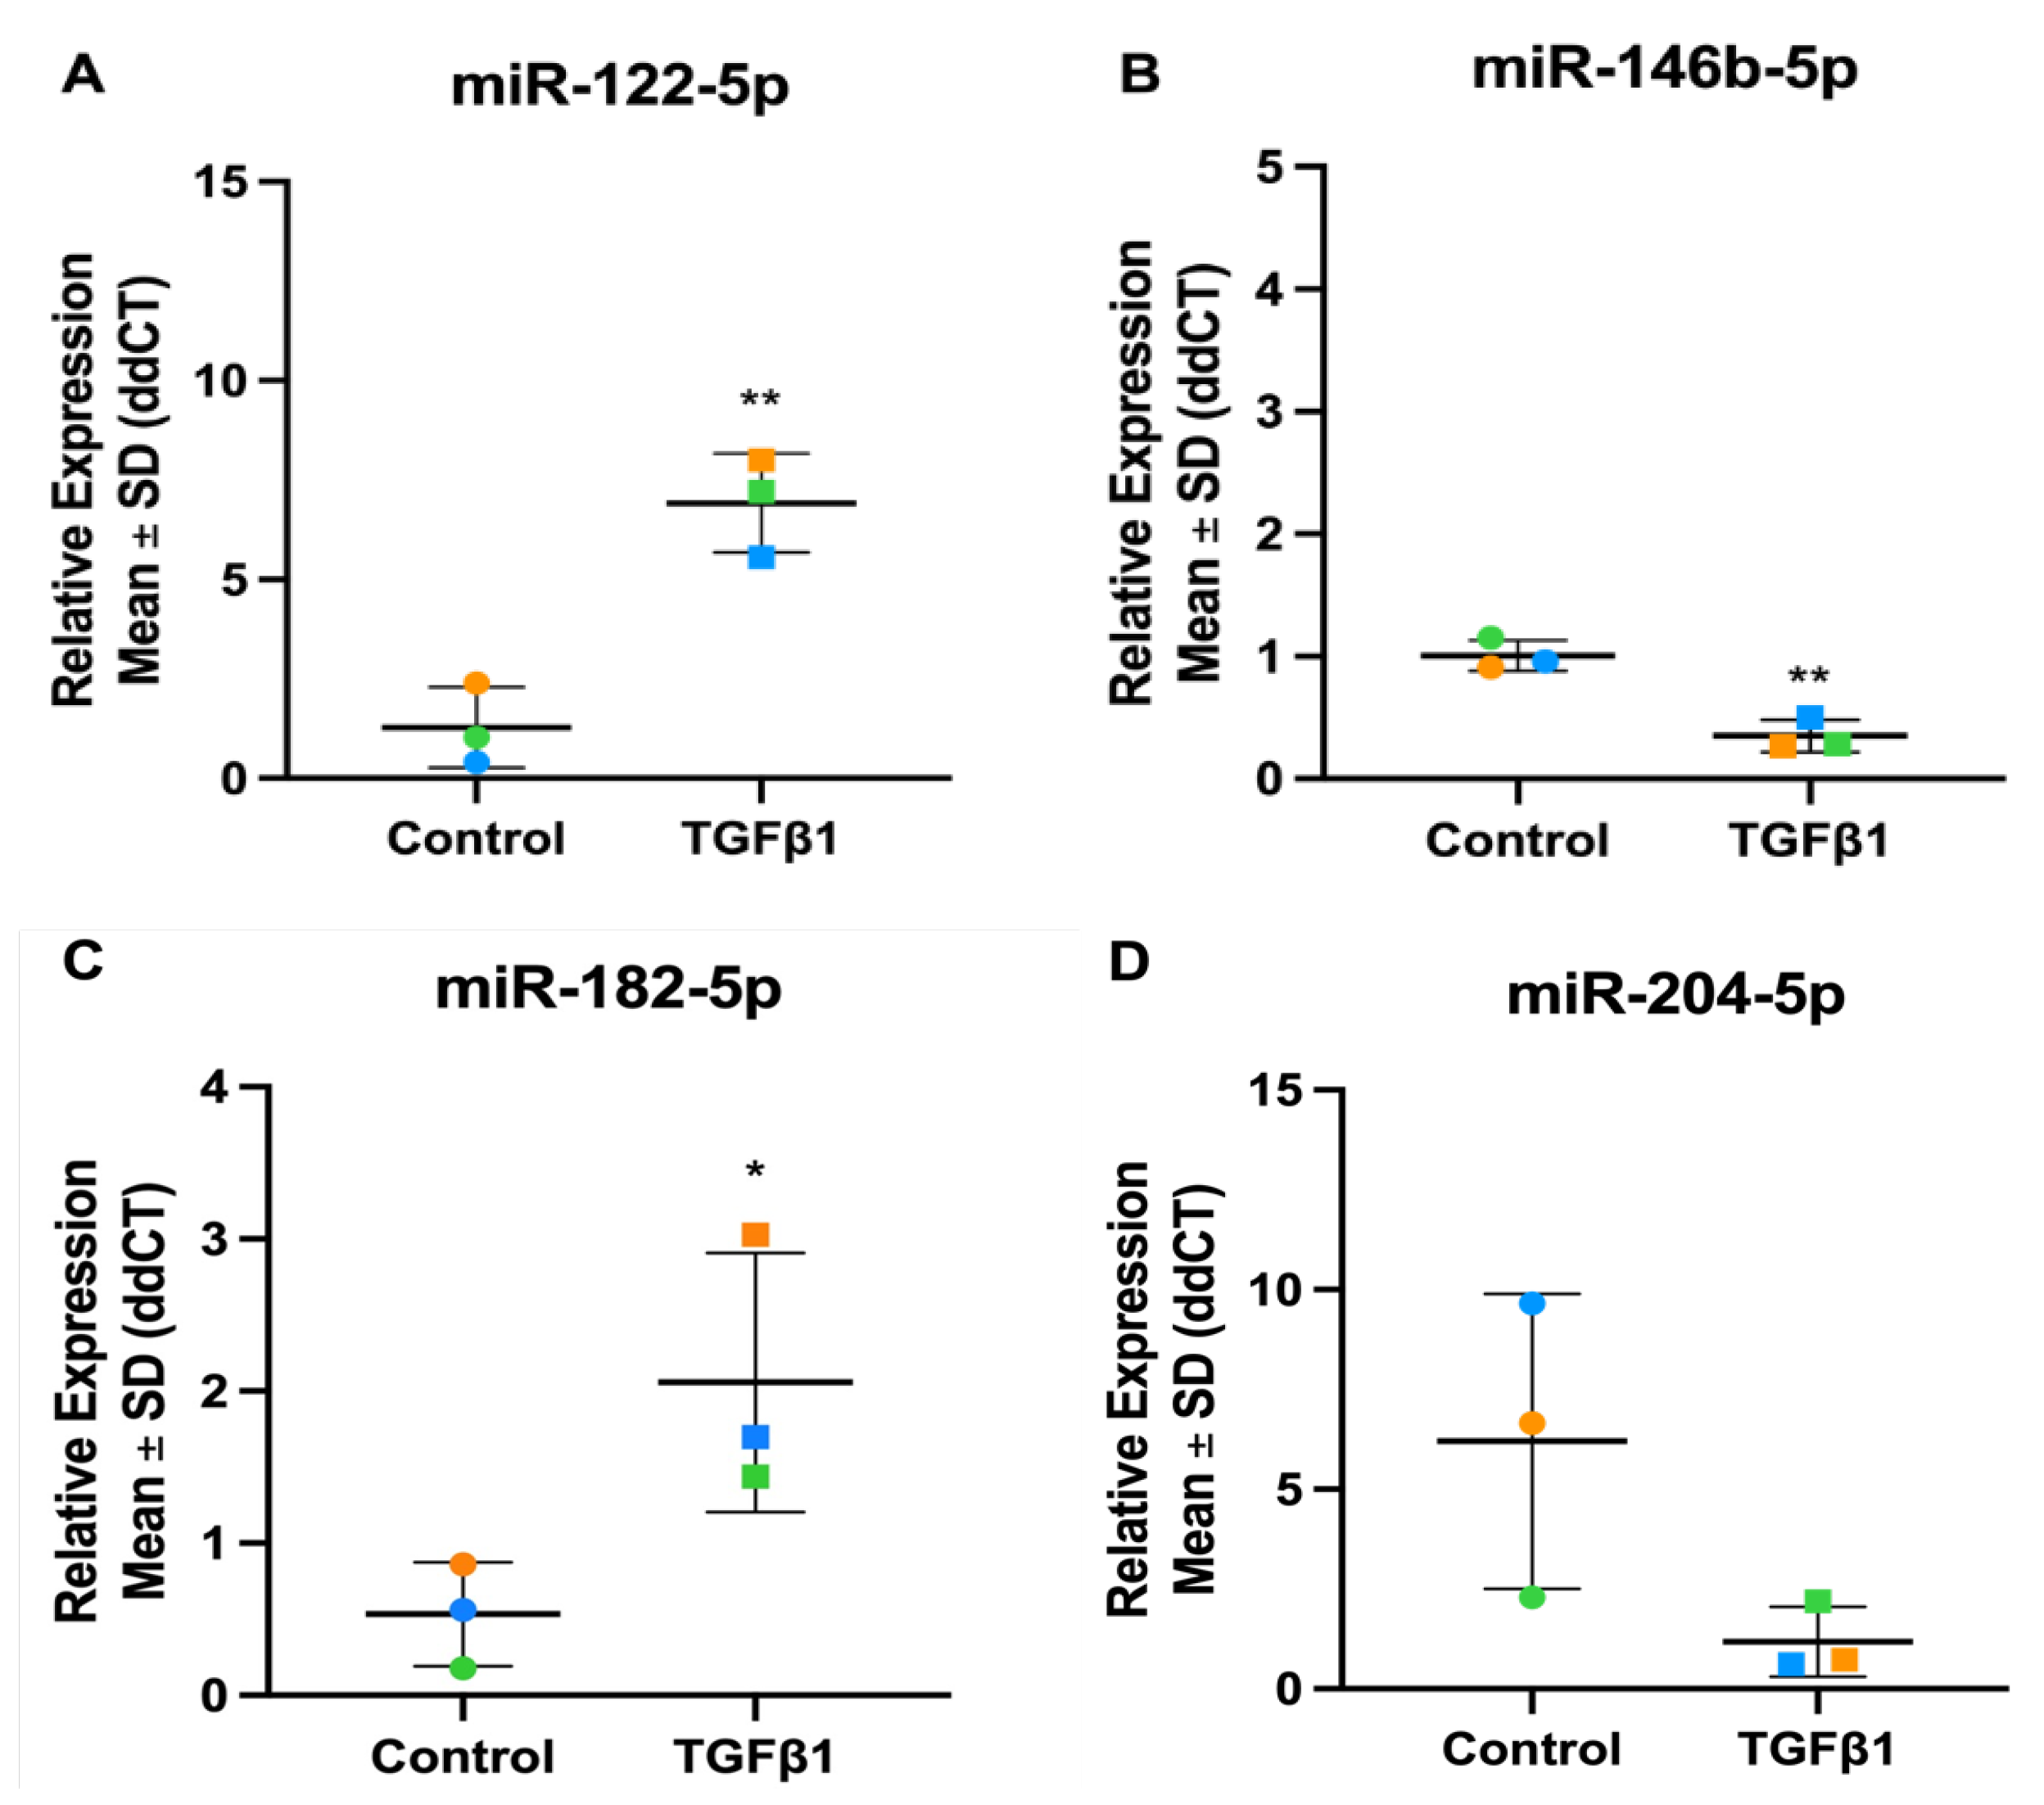
To validate the TGFβ1 miRNA-Seq results, the expression of a selected panel of significant TGFβ1 responsive miRNAs was analysed by RT-qPCR (Figure 4). The differential expression of the four miRNAs was validated by RT-qPCR: miR-122-5p (miRNA-Seq: Fold Change = 9.13, p-value = 6.15E-11), miR-146b-5p (miRNA-Seq: Fold Change = 0.48, p-value = 1.96E-06), miR-182-5p (miRNA-Seq: Fold Change = 1.75, p-value = 0.02) and miR-204-5p (miRNA-Seq: Fold Change = 0.52, p-value = 9.46E-05), correlate to the expression patterns shown in the miRNA-Seq data set, confirming the reliability of the sequencing experiment.

3.5. Differential Expression of TGFβ2-Responsive miRNAs in TM Cells

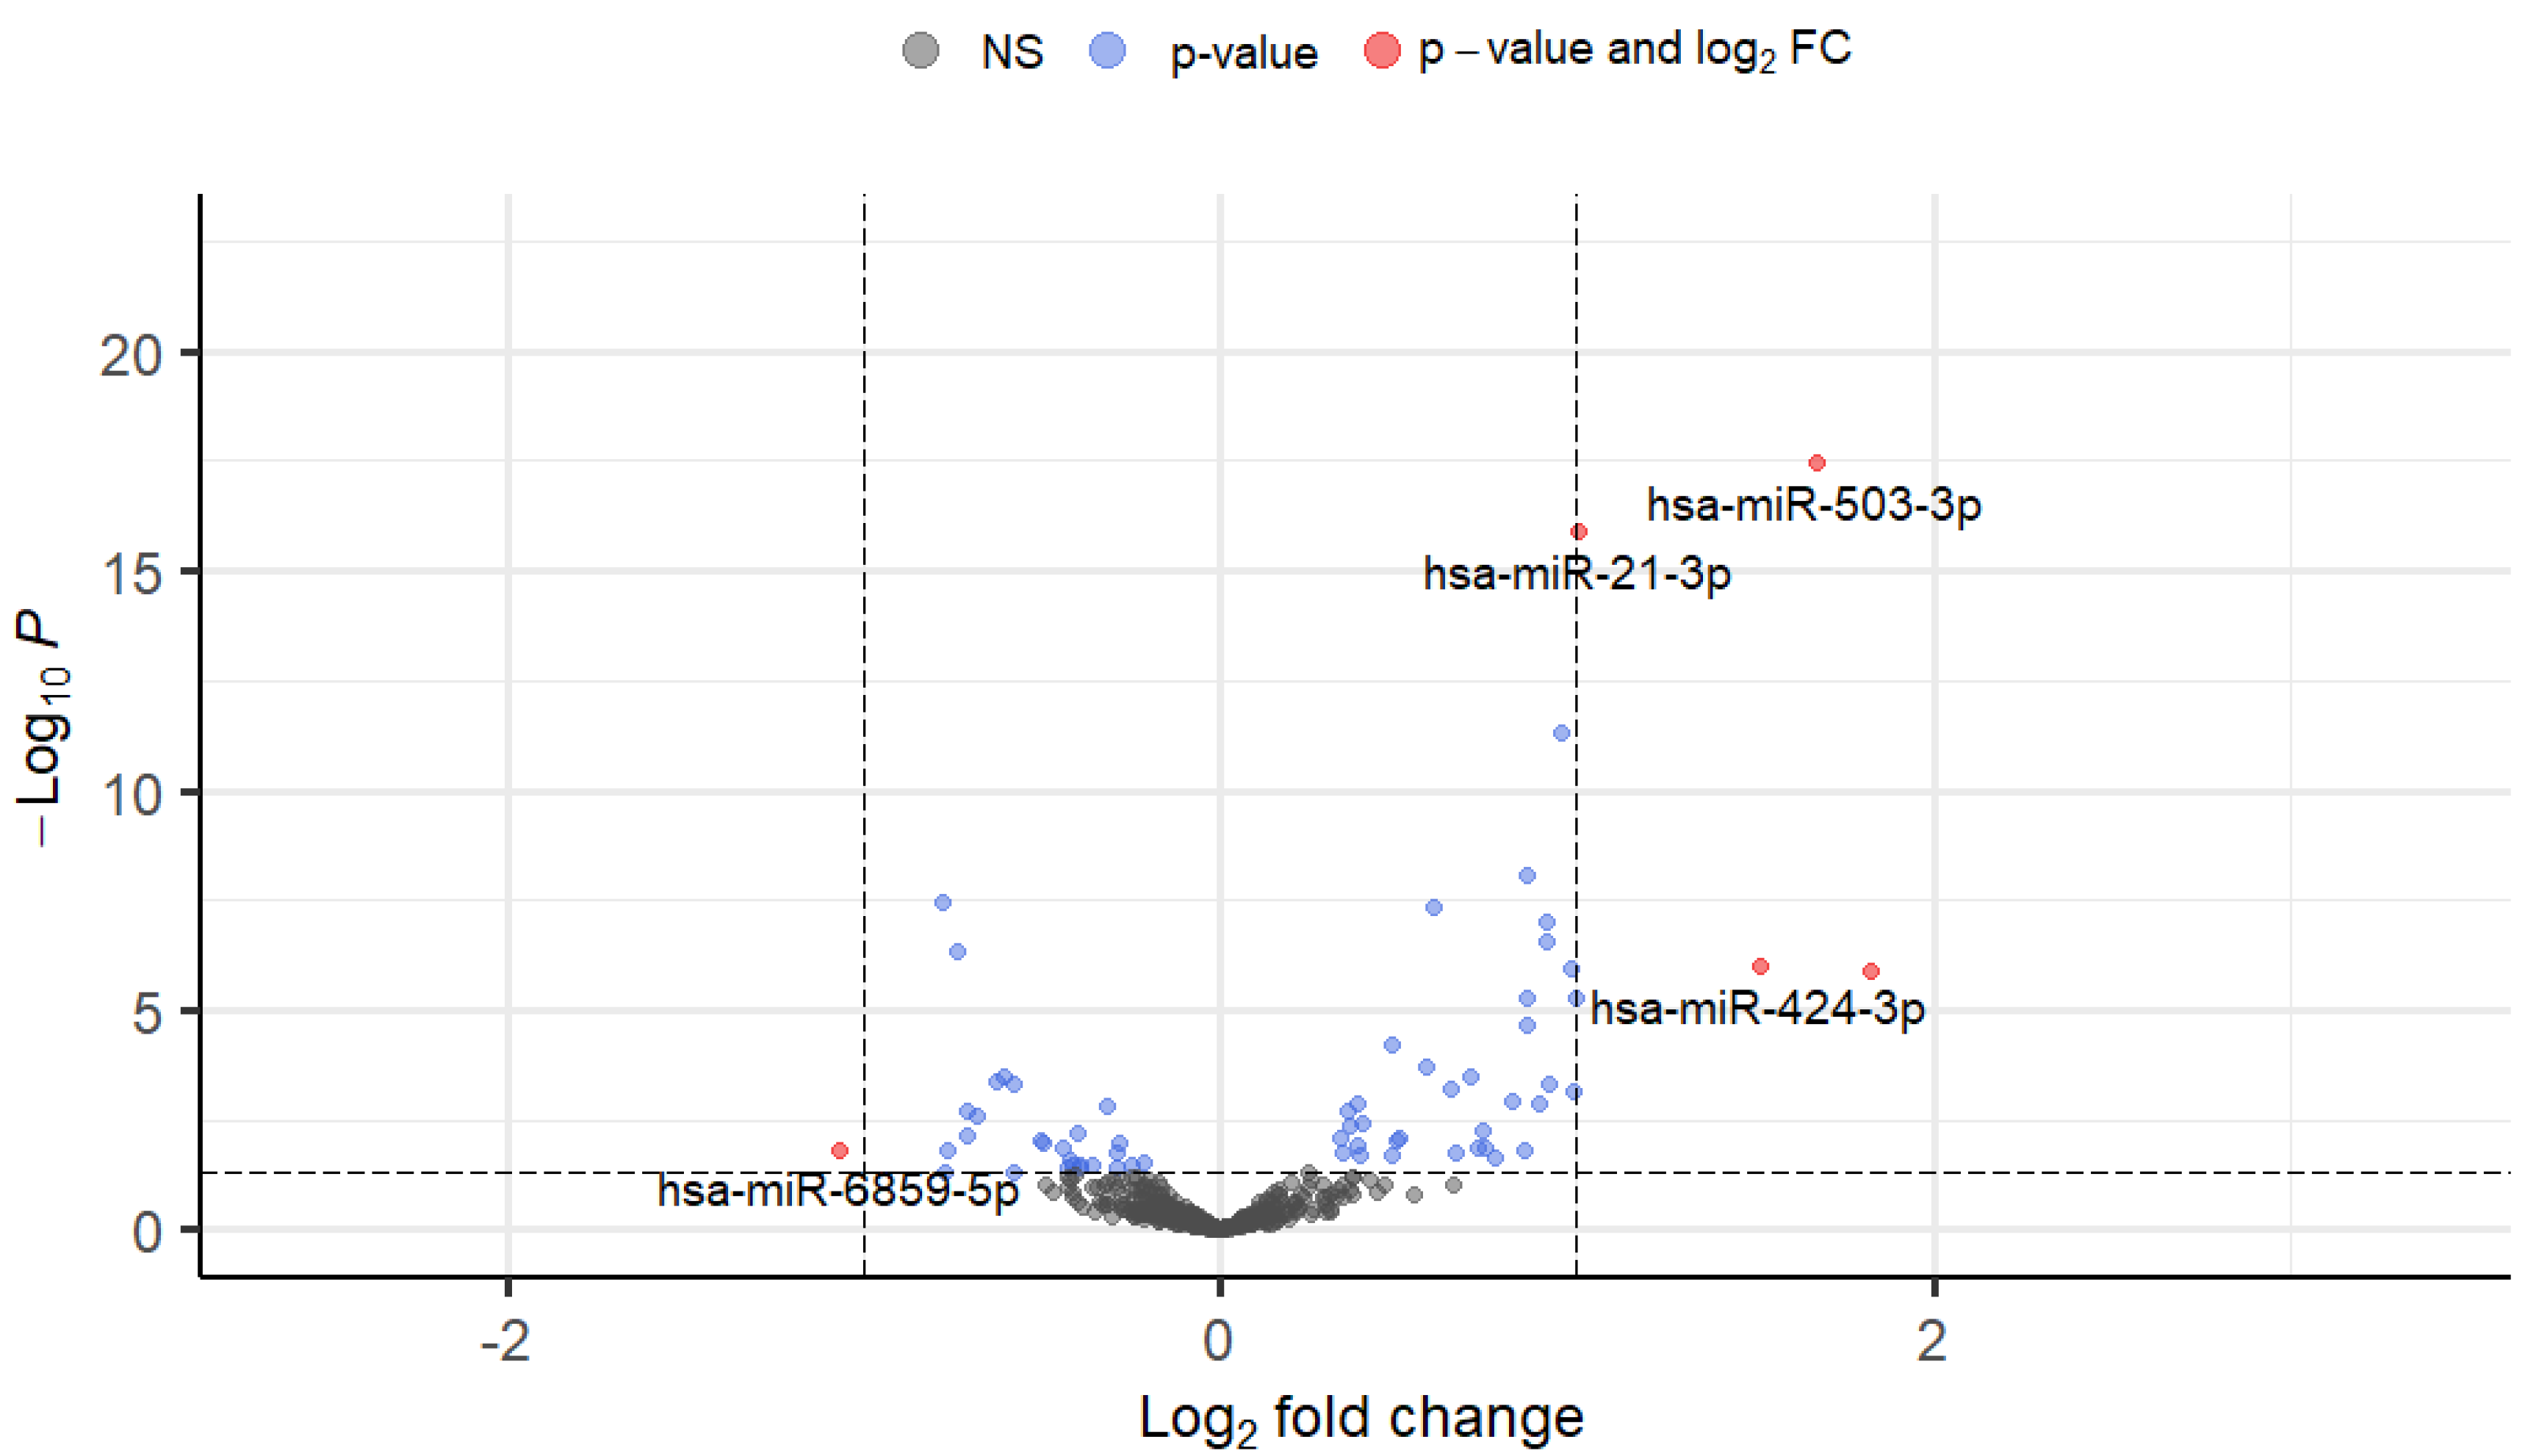
To determine changes in miRNA expression in the TM in response to TGFβ2, normal primary human TM cells were treated with 5 ng/mL TGFβ2 and analysed using small RNA-Seq. In total, 67 miRNAs were statistically significantly altered (p < 0.05), with 38 significantly up-regulated and 28 significantly down-regulated. All differentially expressed TGFβ2-induced miRNAs were graphed on a volcano plot (Figure 5). The up-regulated and down-regulated DEmiRs were ranked by fold change and are shown in Table 3 and Table 4, respectively.

3.6. Functional Enrichment Analysis of the TGFβ2 Responsive Differentially Expressed Genes

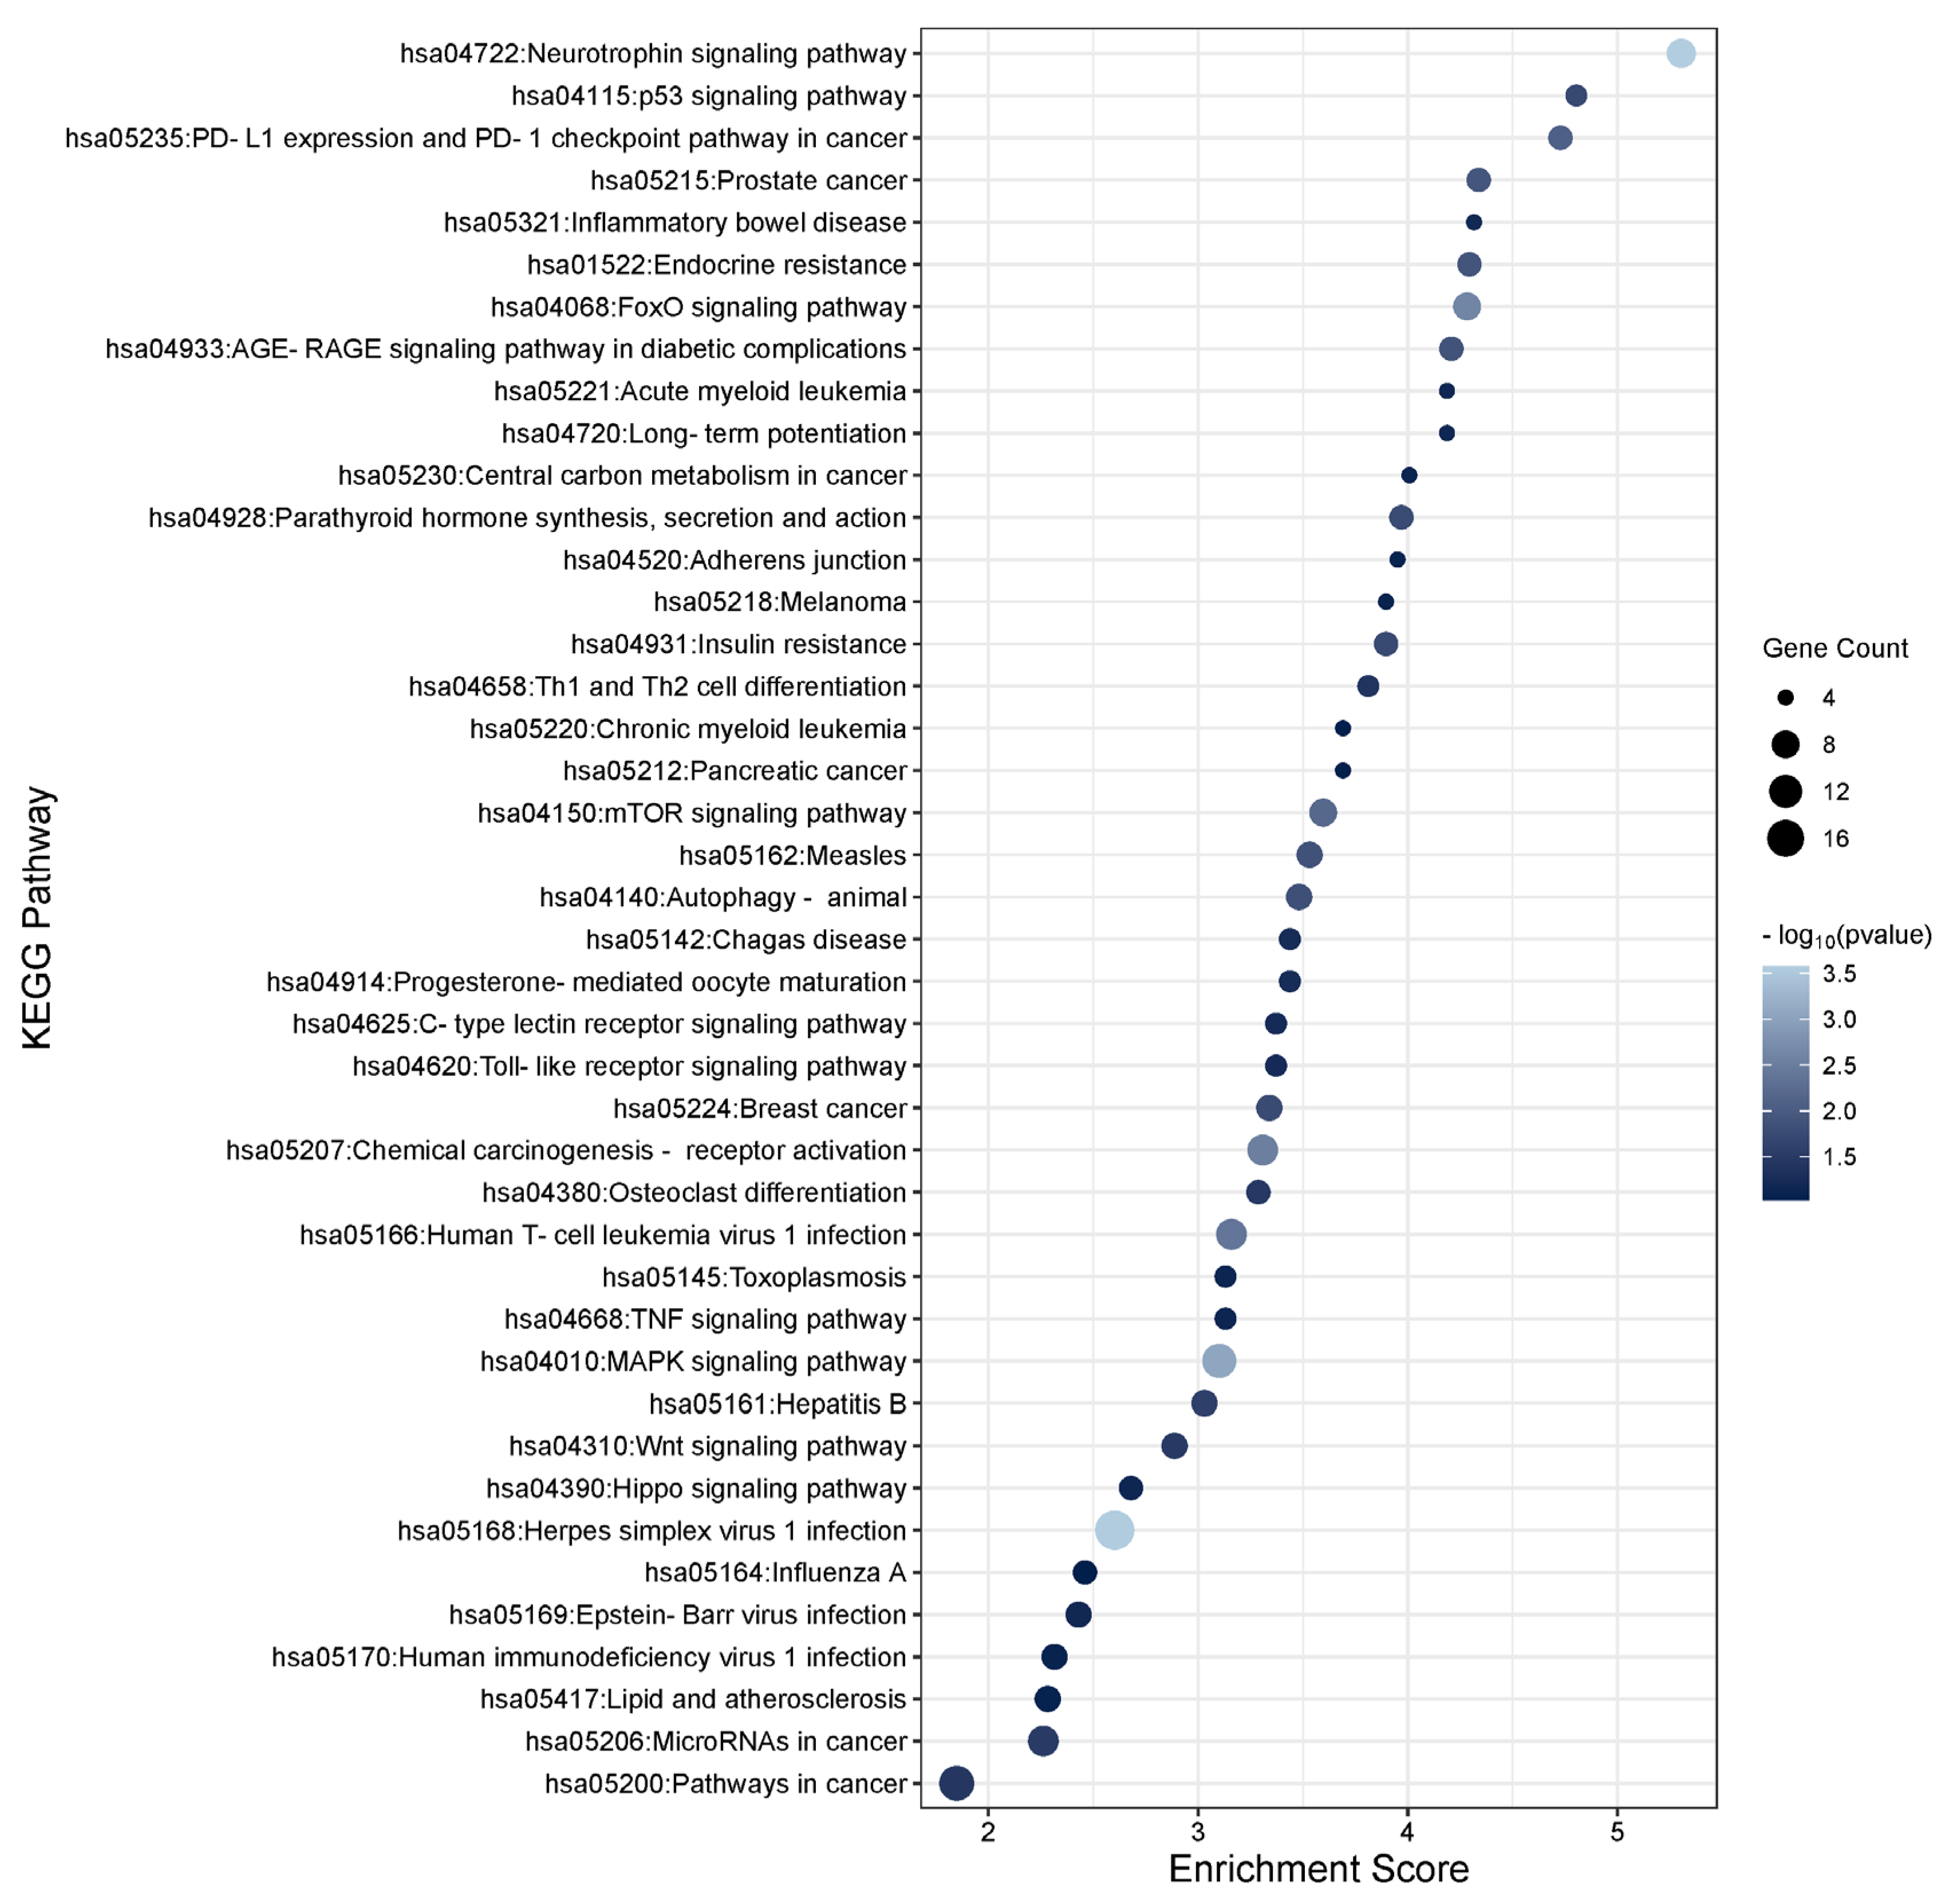
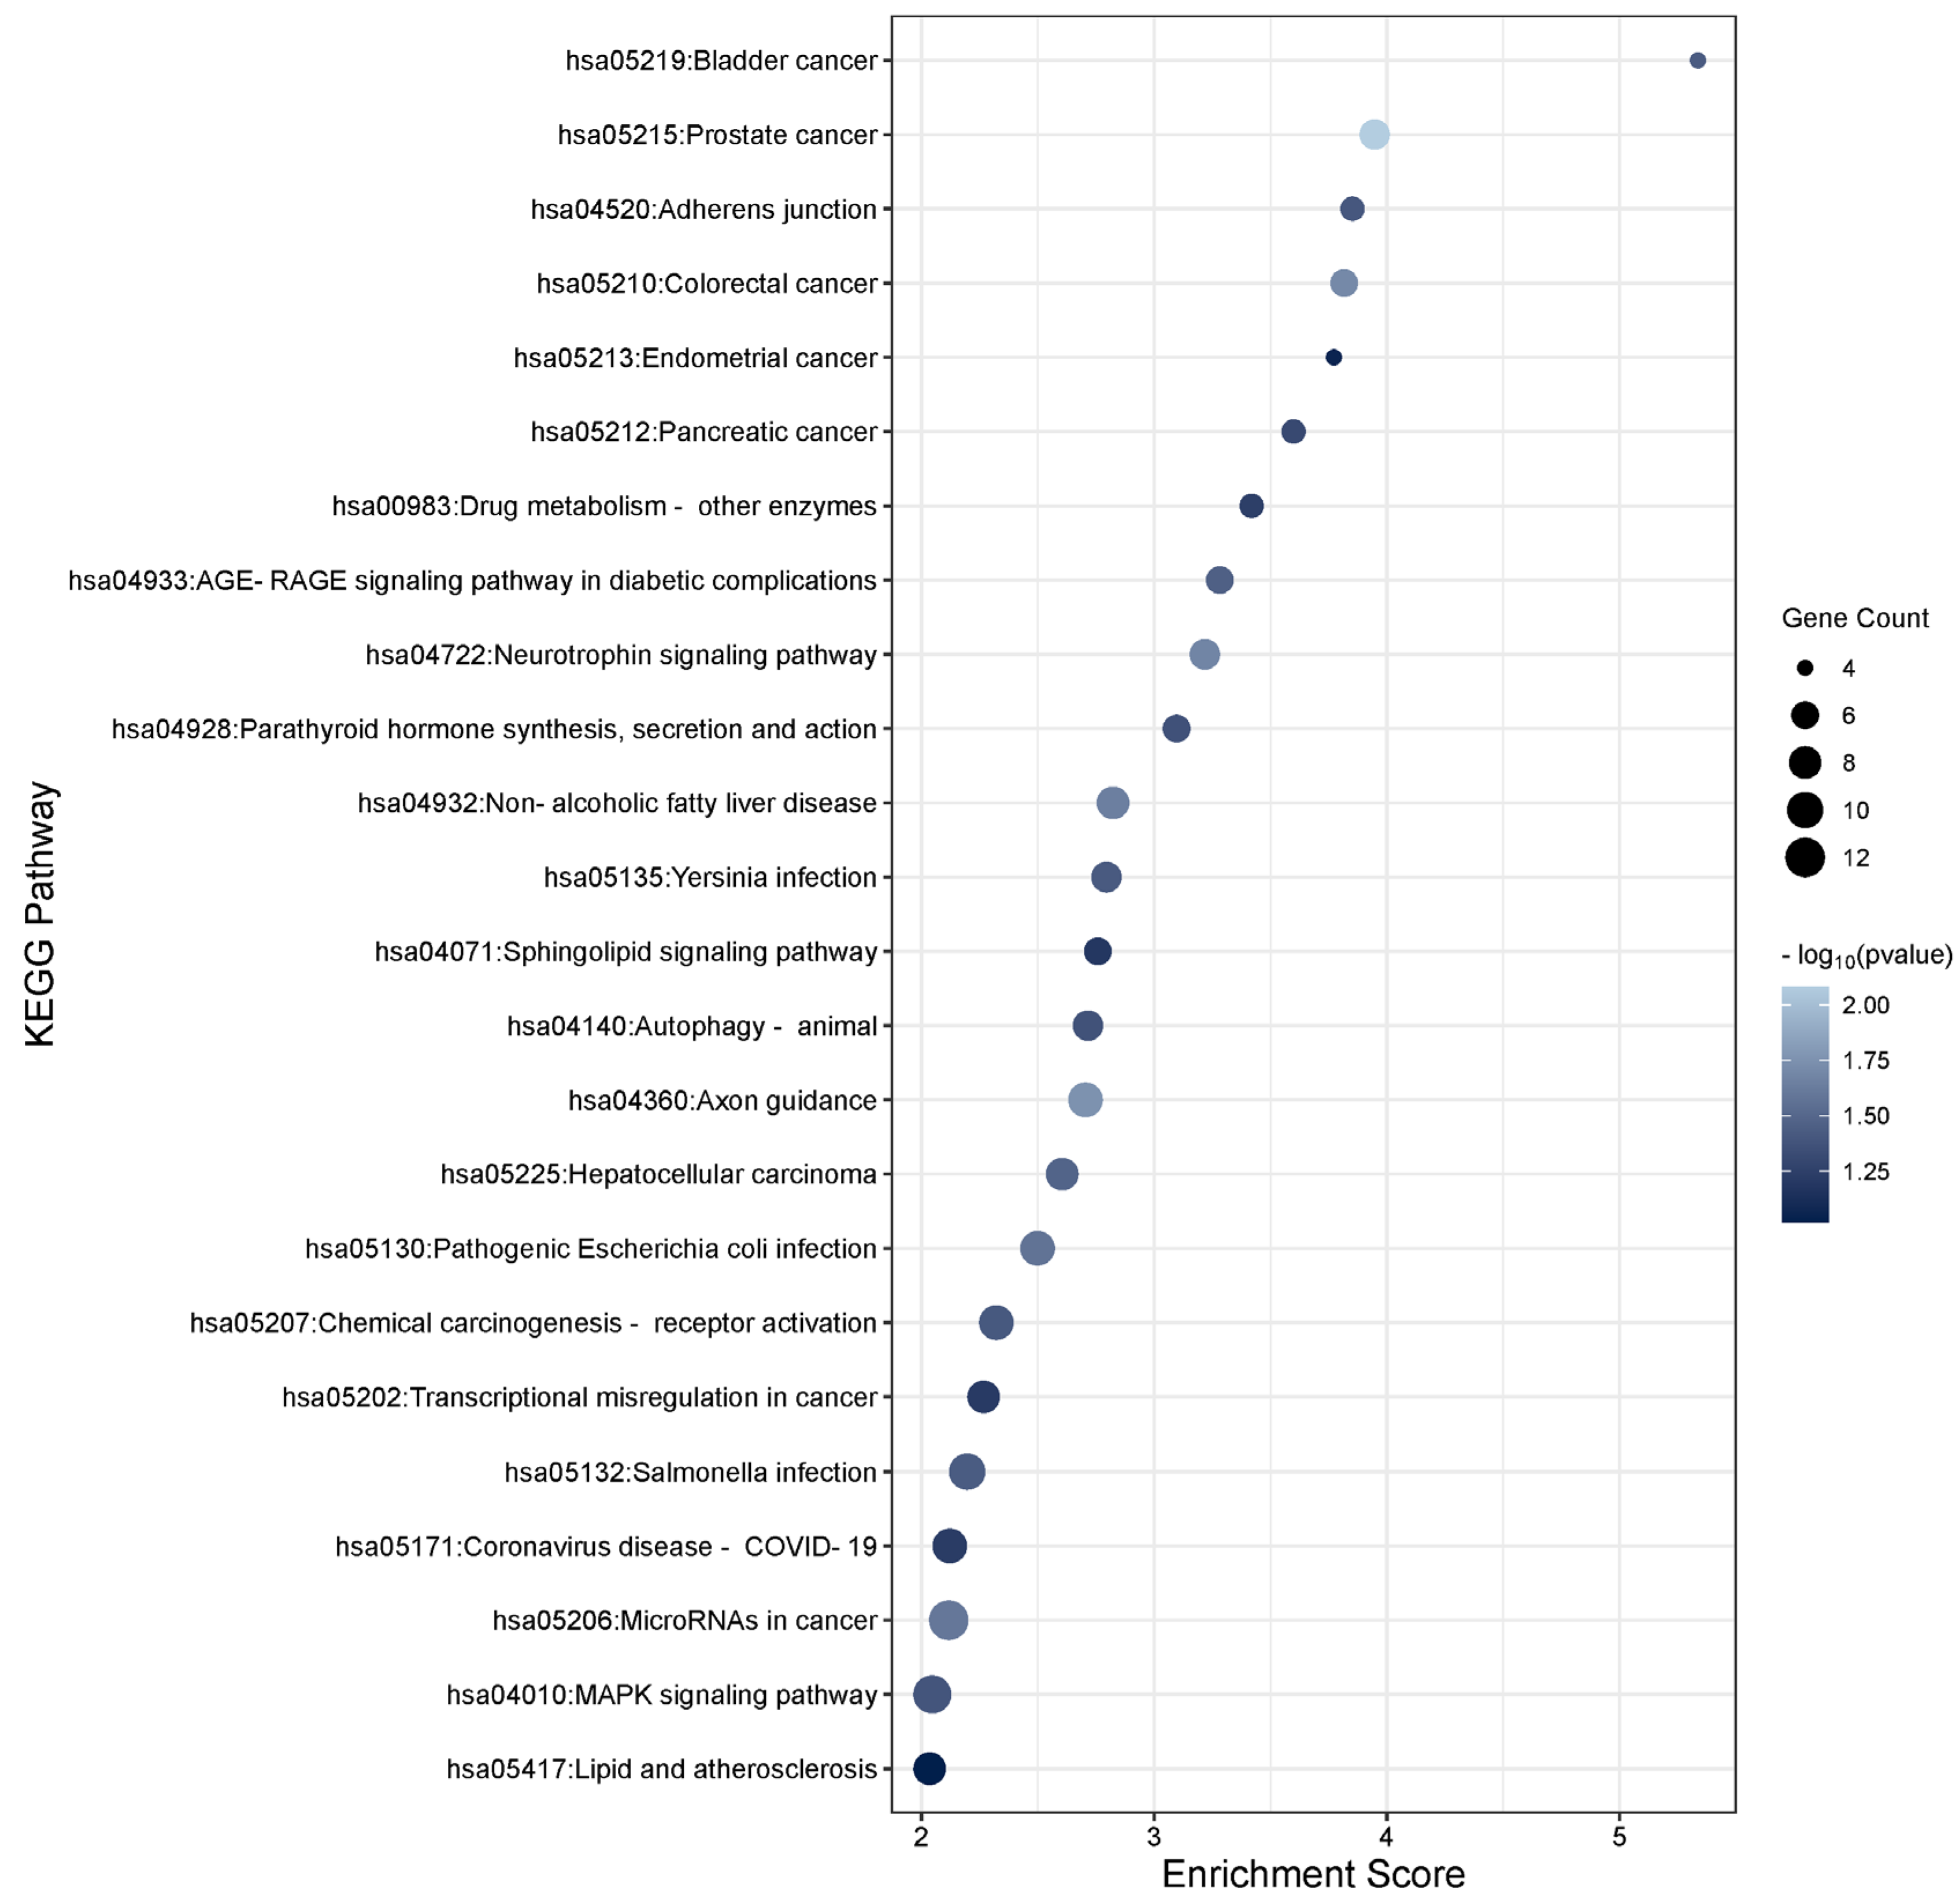
To determine the function of the TGFβ2-induced DEmiRs and the potential role they play within the TM, KEGG enrichment analysis was performed using DAVID software on the target genes of the significant DEmiRs adjusting for multiple corrections (FDR < 0.05). To gather a list of target genes for the significant miRNAs, TargetScan and miRTarbase were used to identify experimentally validated genes for significant miRNAs with a threshold of FDR < 0.05 to ensure a high confidence. The genes were added to the DAVID software to assess significant pathways. In total, 58 pathways were found to be associated with TGFβ2-regulated miRNAs. The top 30 KEGG pathways for gene targets of the up- and down-regulated TGFβ2 responsive miRNAs are shown in Figure 6 and Figure 7, respectively. Pathways relating to MAPK signalling, PI3K-Akt signalling, Hippo signalling, Wnt signalling, focal adhesion, apoptosis, cellular senescence, and regulation of the actin cytoskeleton are relevant to POAG pathogenesis and are listed in Table S4 (significantly up-regulated miRNAs) and Table S5 (significantly down-regulated miRNAs) along with the associated miRNAs and gene targets.

3.7. Validation of TGFβ2 Responsive DEmiRs by RT-qPCR

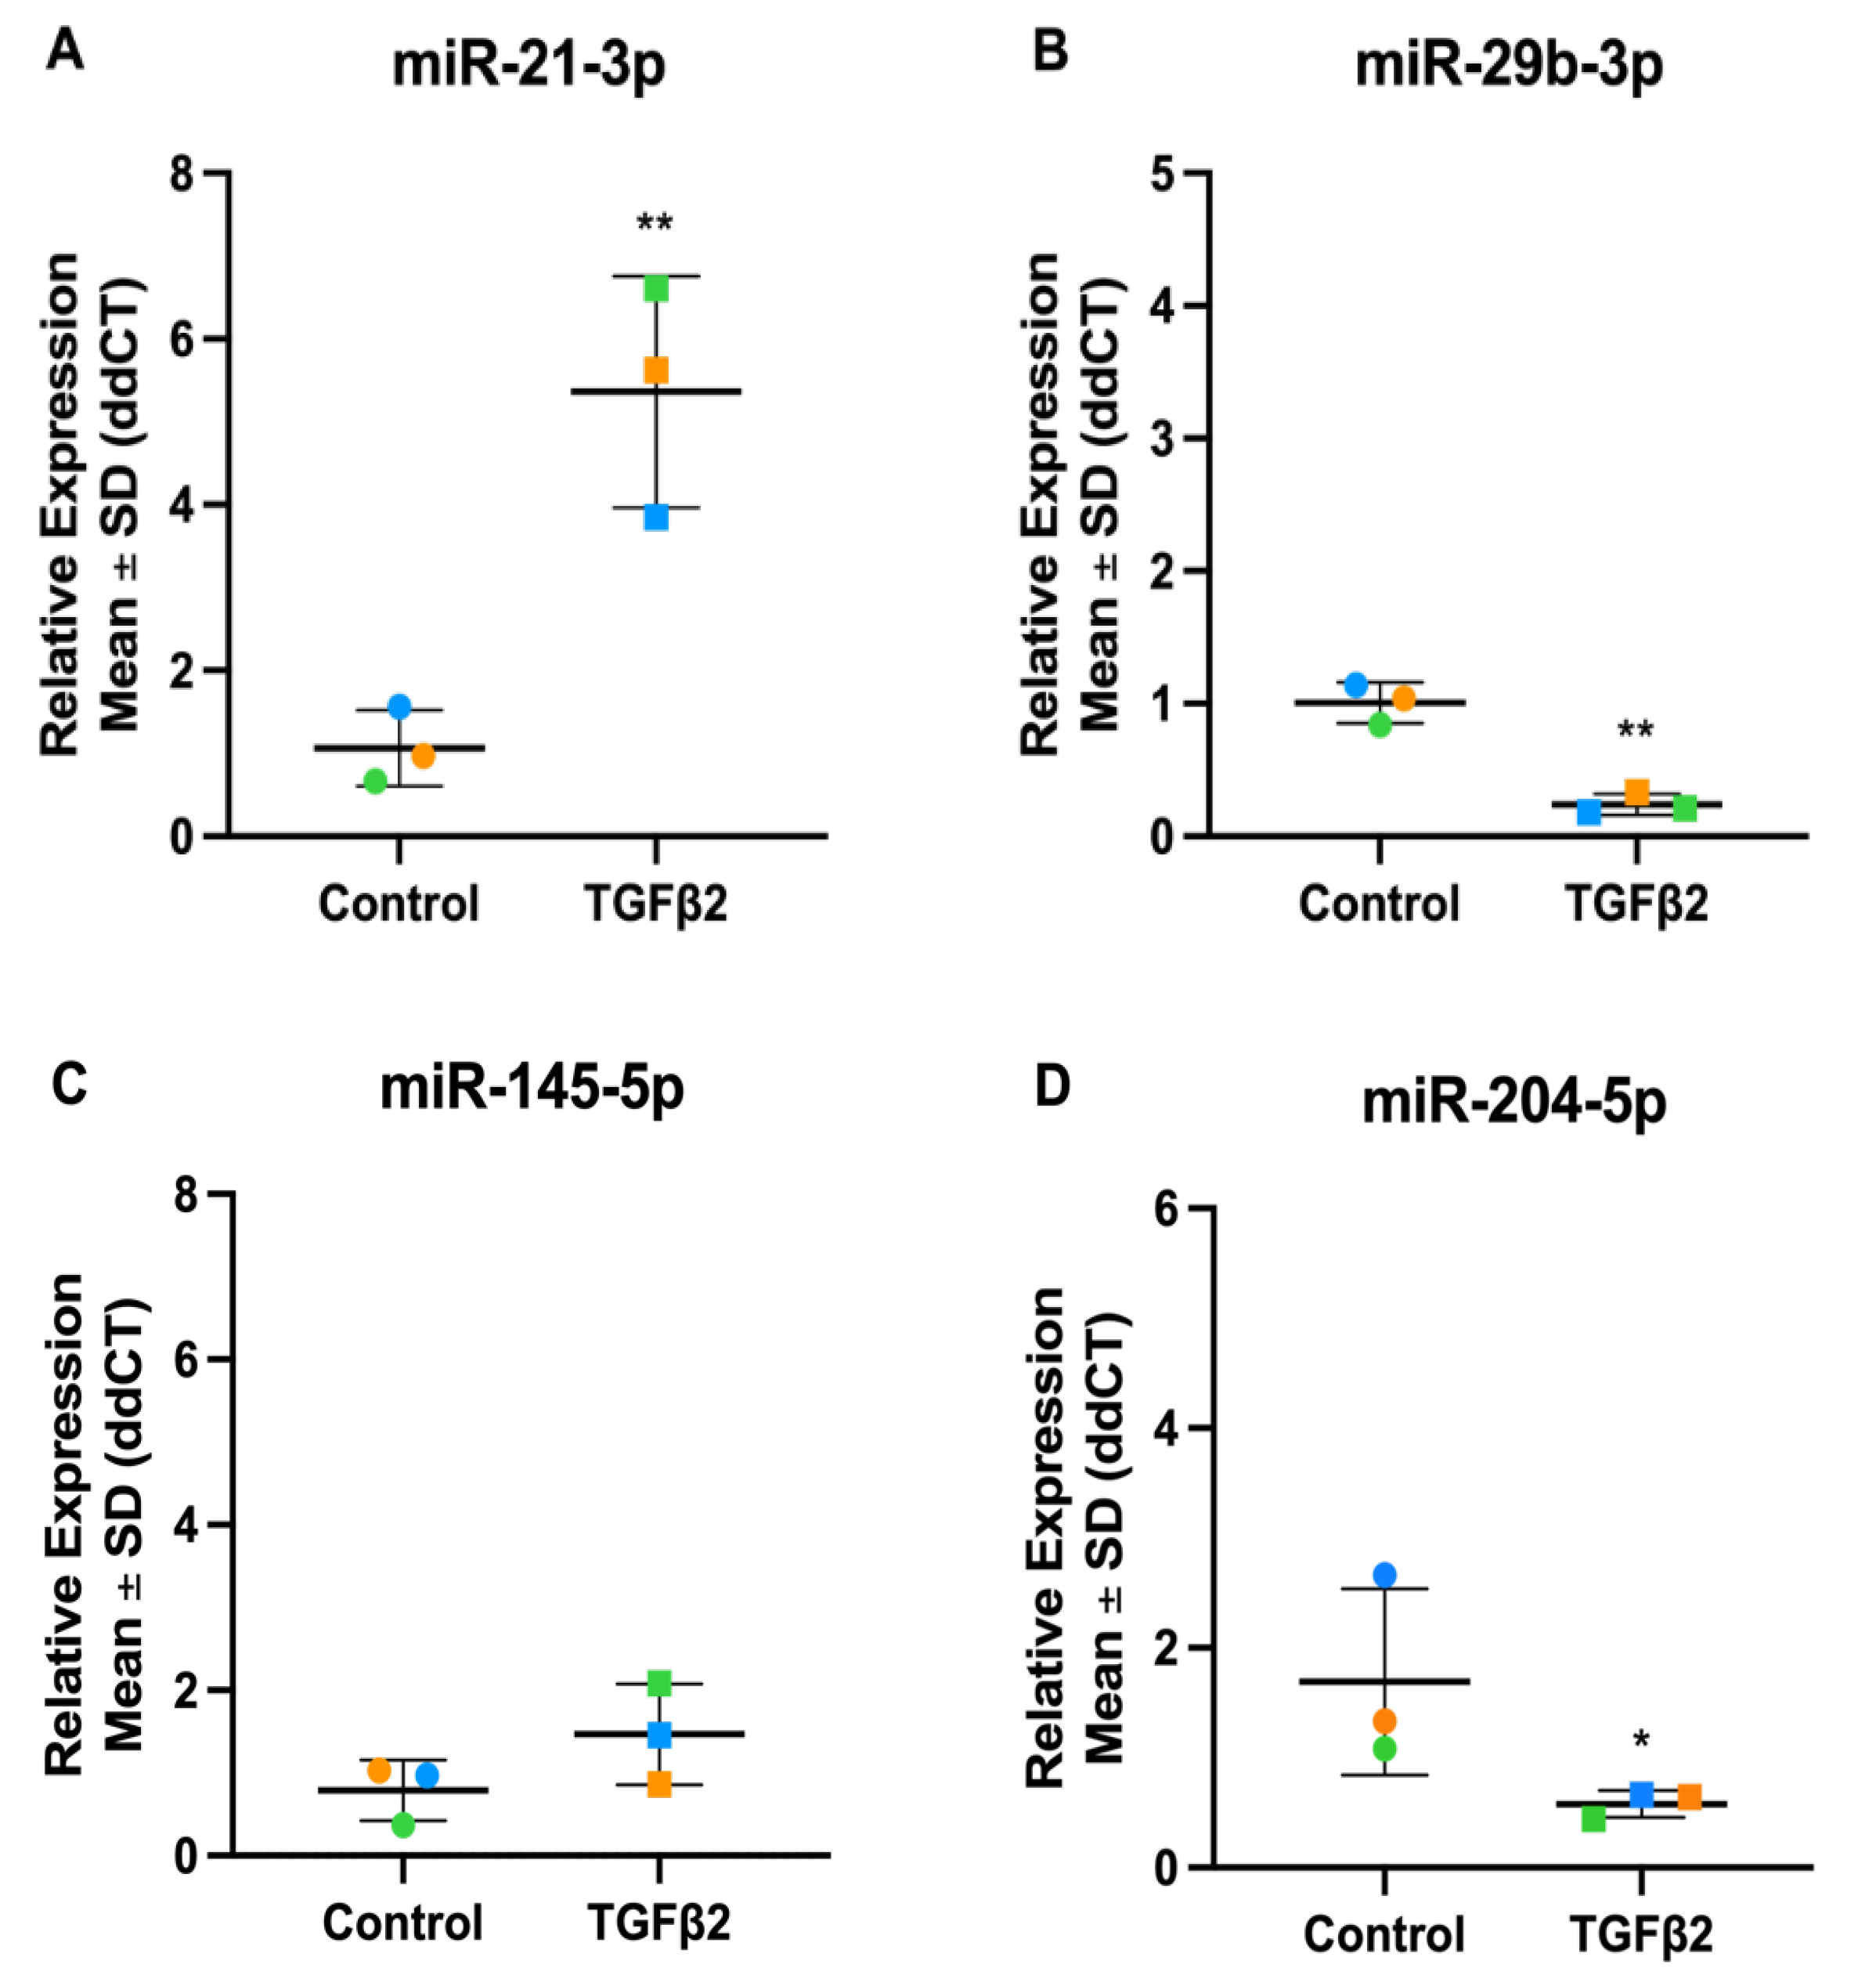
To validate the TGFβ2 miRNA-Seq results, the expression of a selected panel of significant TGF2-responsive miRNAs was analysed by RT-qPCR (Figure 8). The differential expression of the four miRNAs was validated by RT-qPCR: miR-21-3p (miRNA-Seq: Fold Change = 2.01, p-value = 1.26E-16), miR-29b-3p (miRNA-Seq: Fold Change = 0.81, p-value = 0.04), miR-145-5p (miRNA-Seq: Fold Change = 1.51, p-value = 4.34E-08) and miR-204-5p (miRNA-Seq: Fold Change = 0.82, p-value = 0.01), correlate to the expression patterns shown in the miRNA-Seq dataset, again confirming the reliability of the sequencing experiment.

3.8. Altered miRNA Expression Grouped by miRNA Families

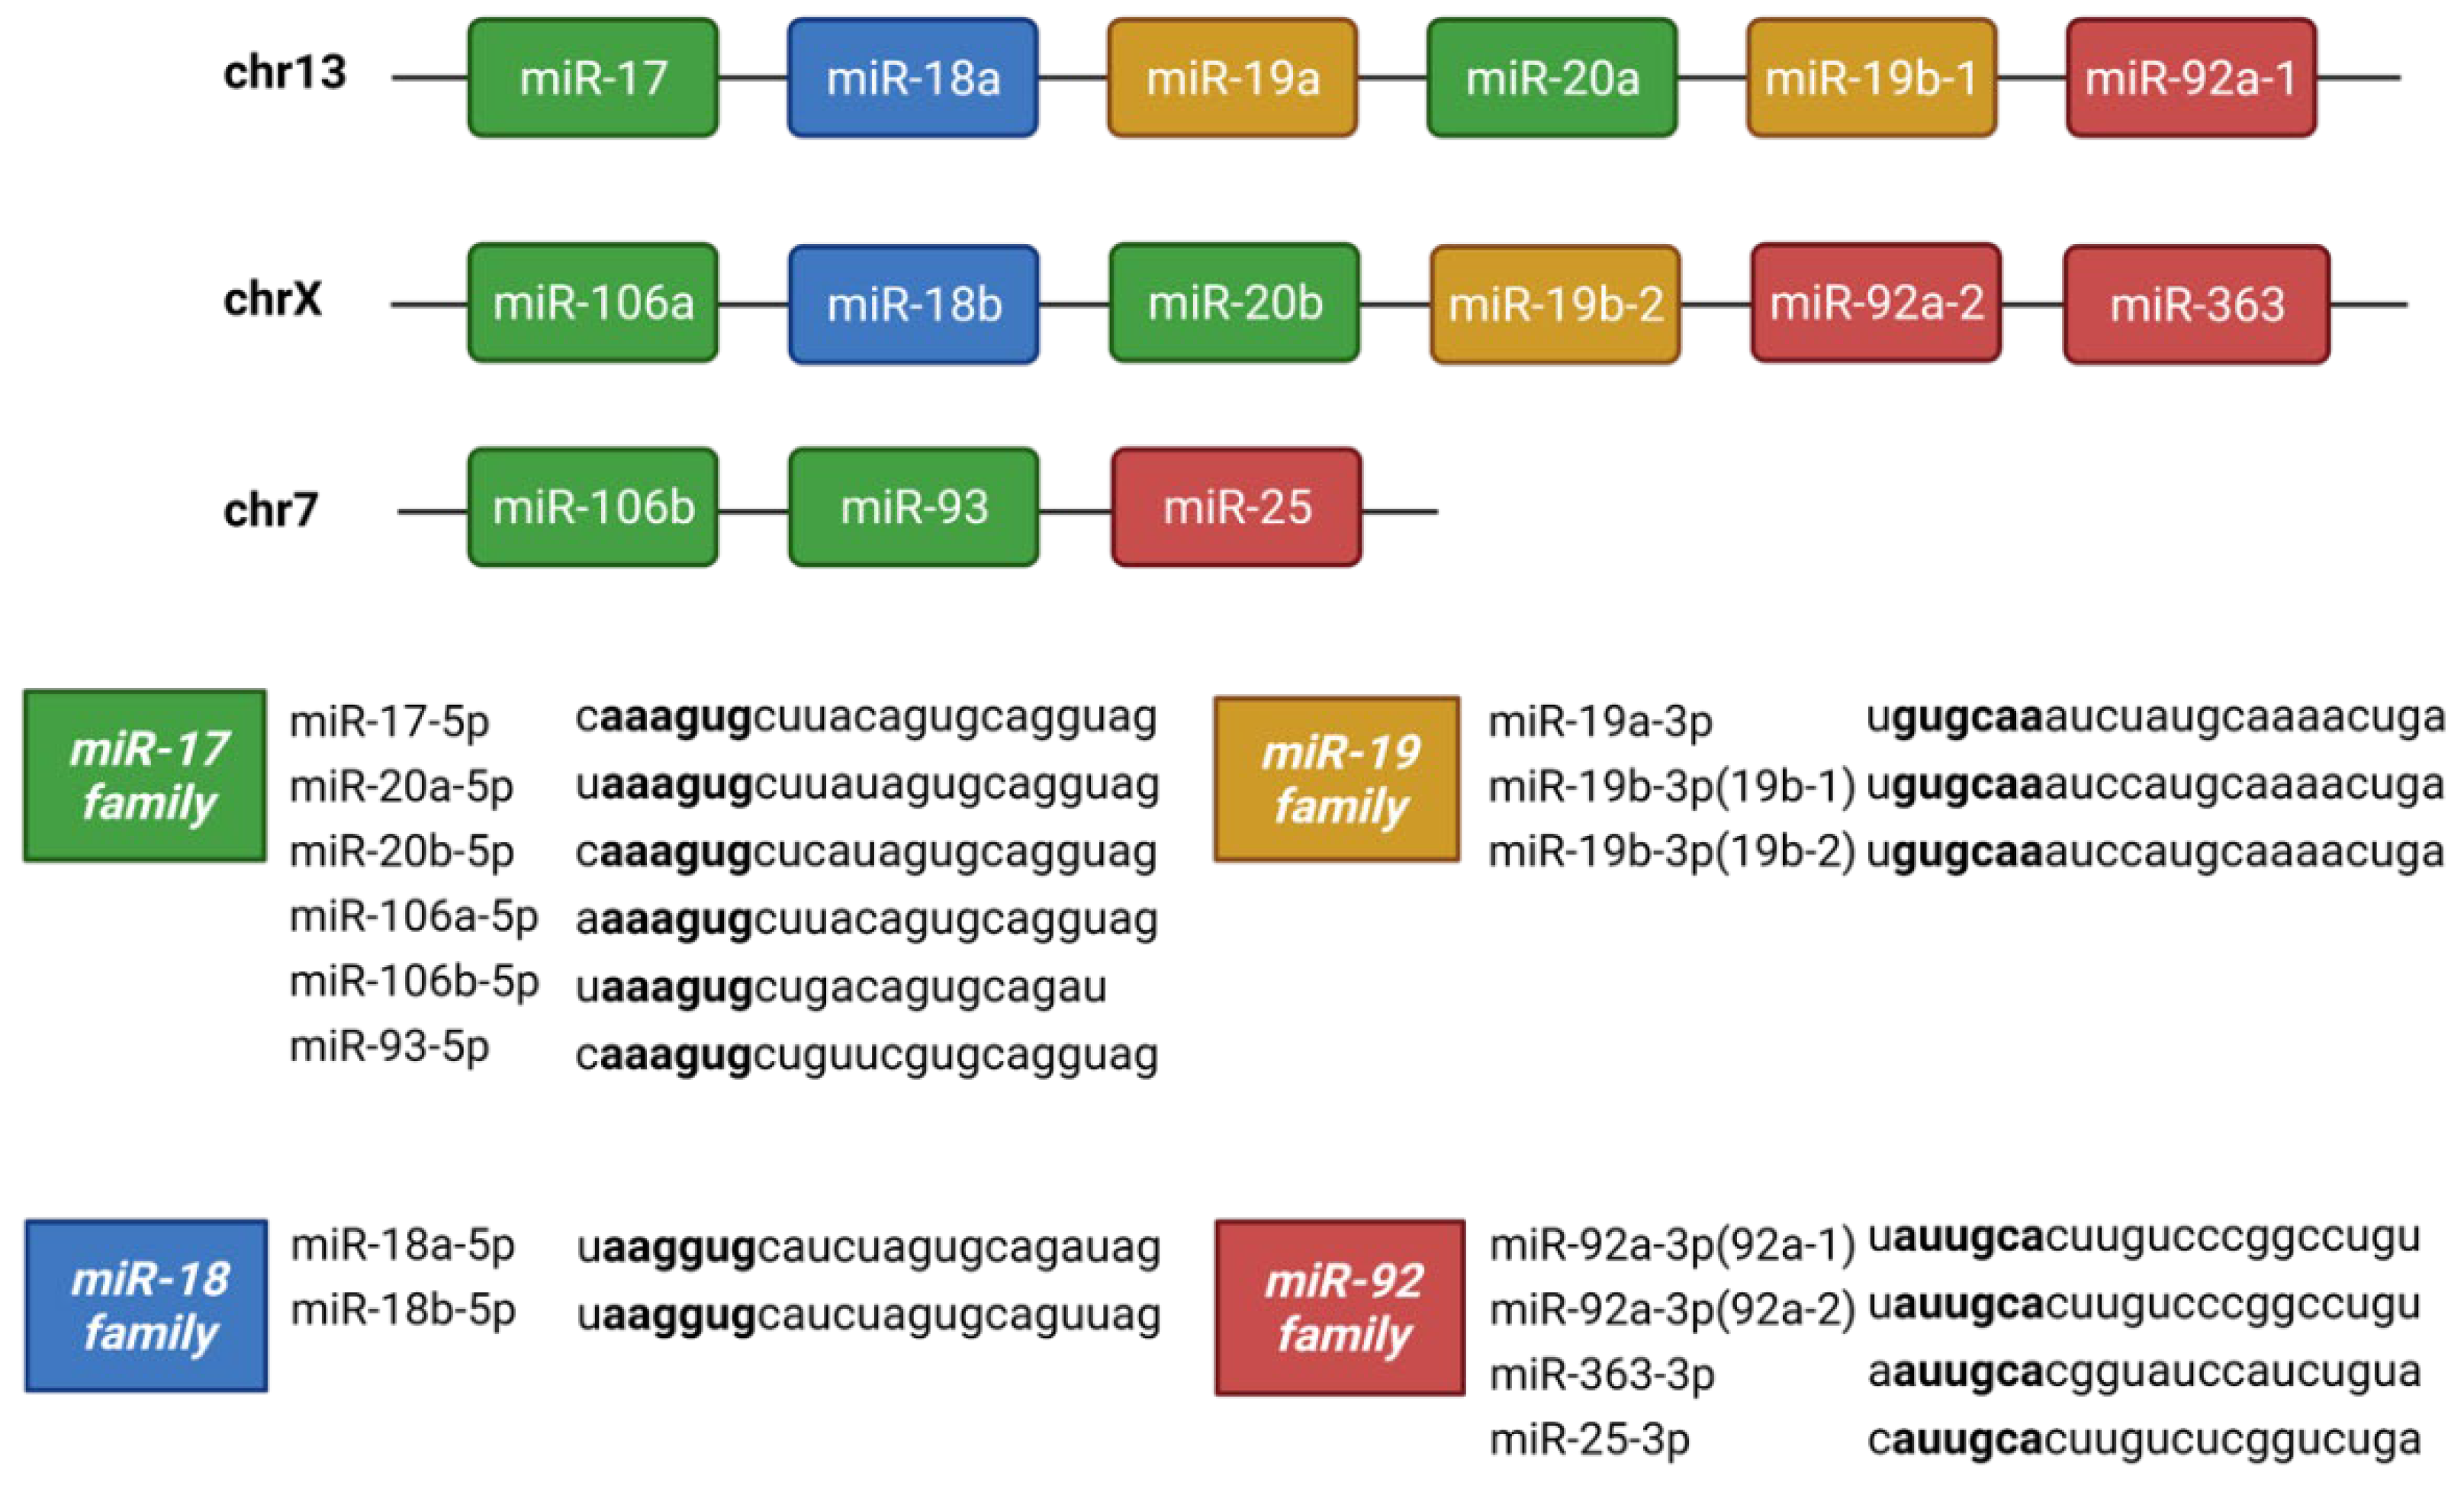
Several miRNAs form a miRNA family which is defined as two or more miRNAs with high sequence similarity and are derived from molecular ancestors during evolution [53]. MiRNA family members can target inter-related genes and pathways [53] and two well-studied examples in cancer and fibrosis are the miR-17-92 [54,55] and miR-29 families [56].

3.8.1. miR-17-92 Family

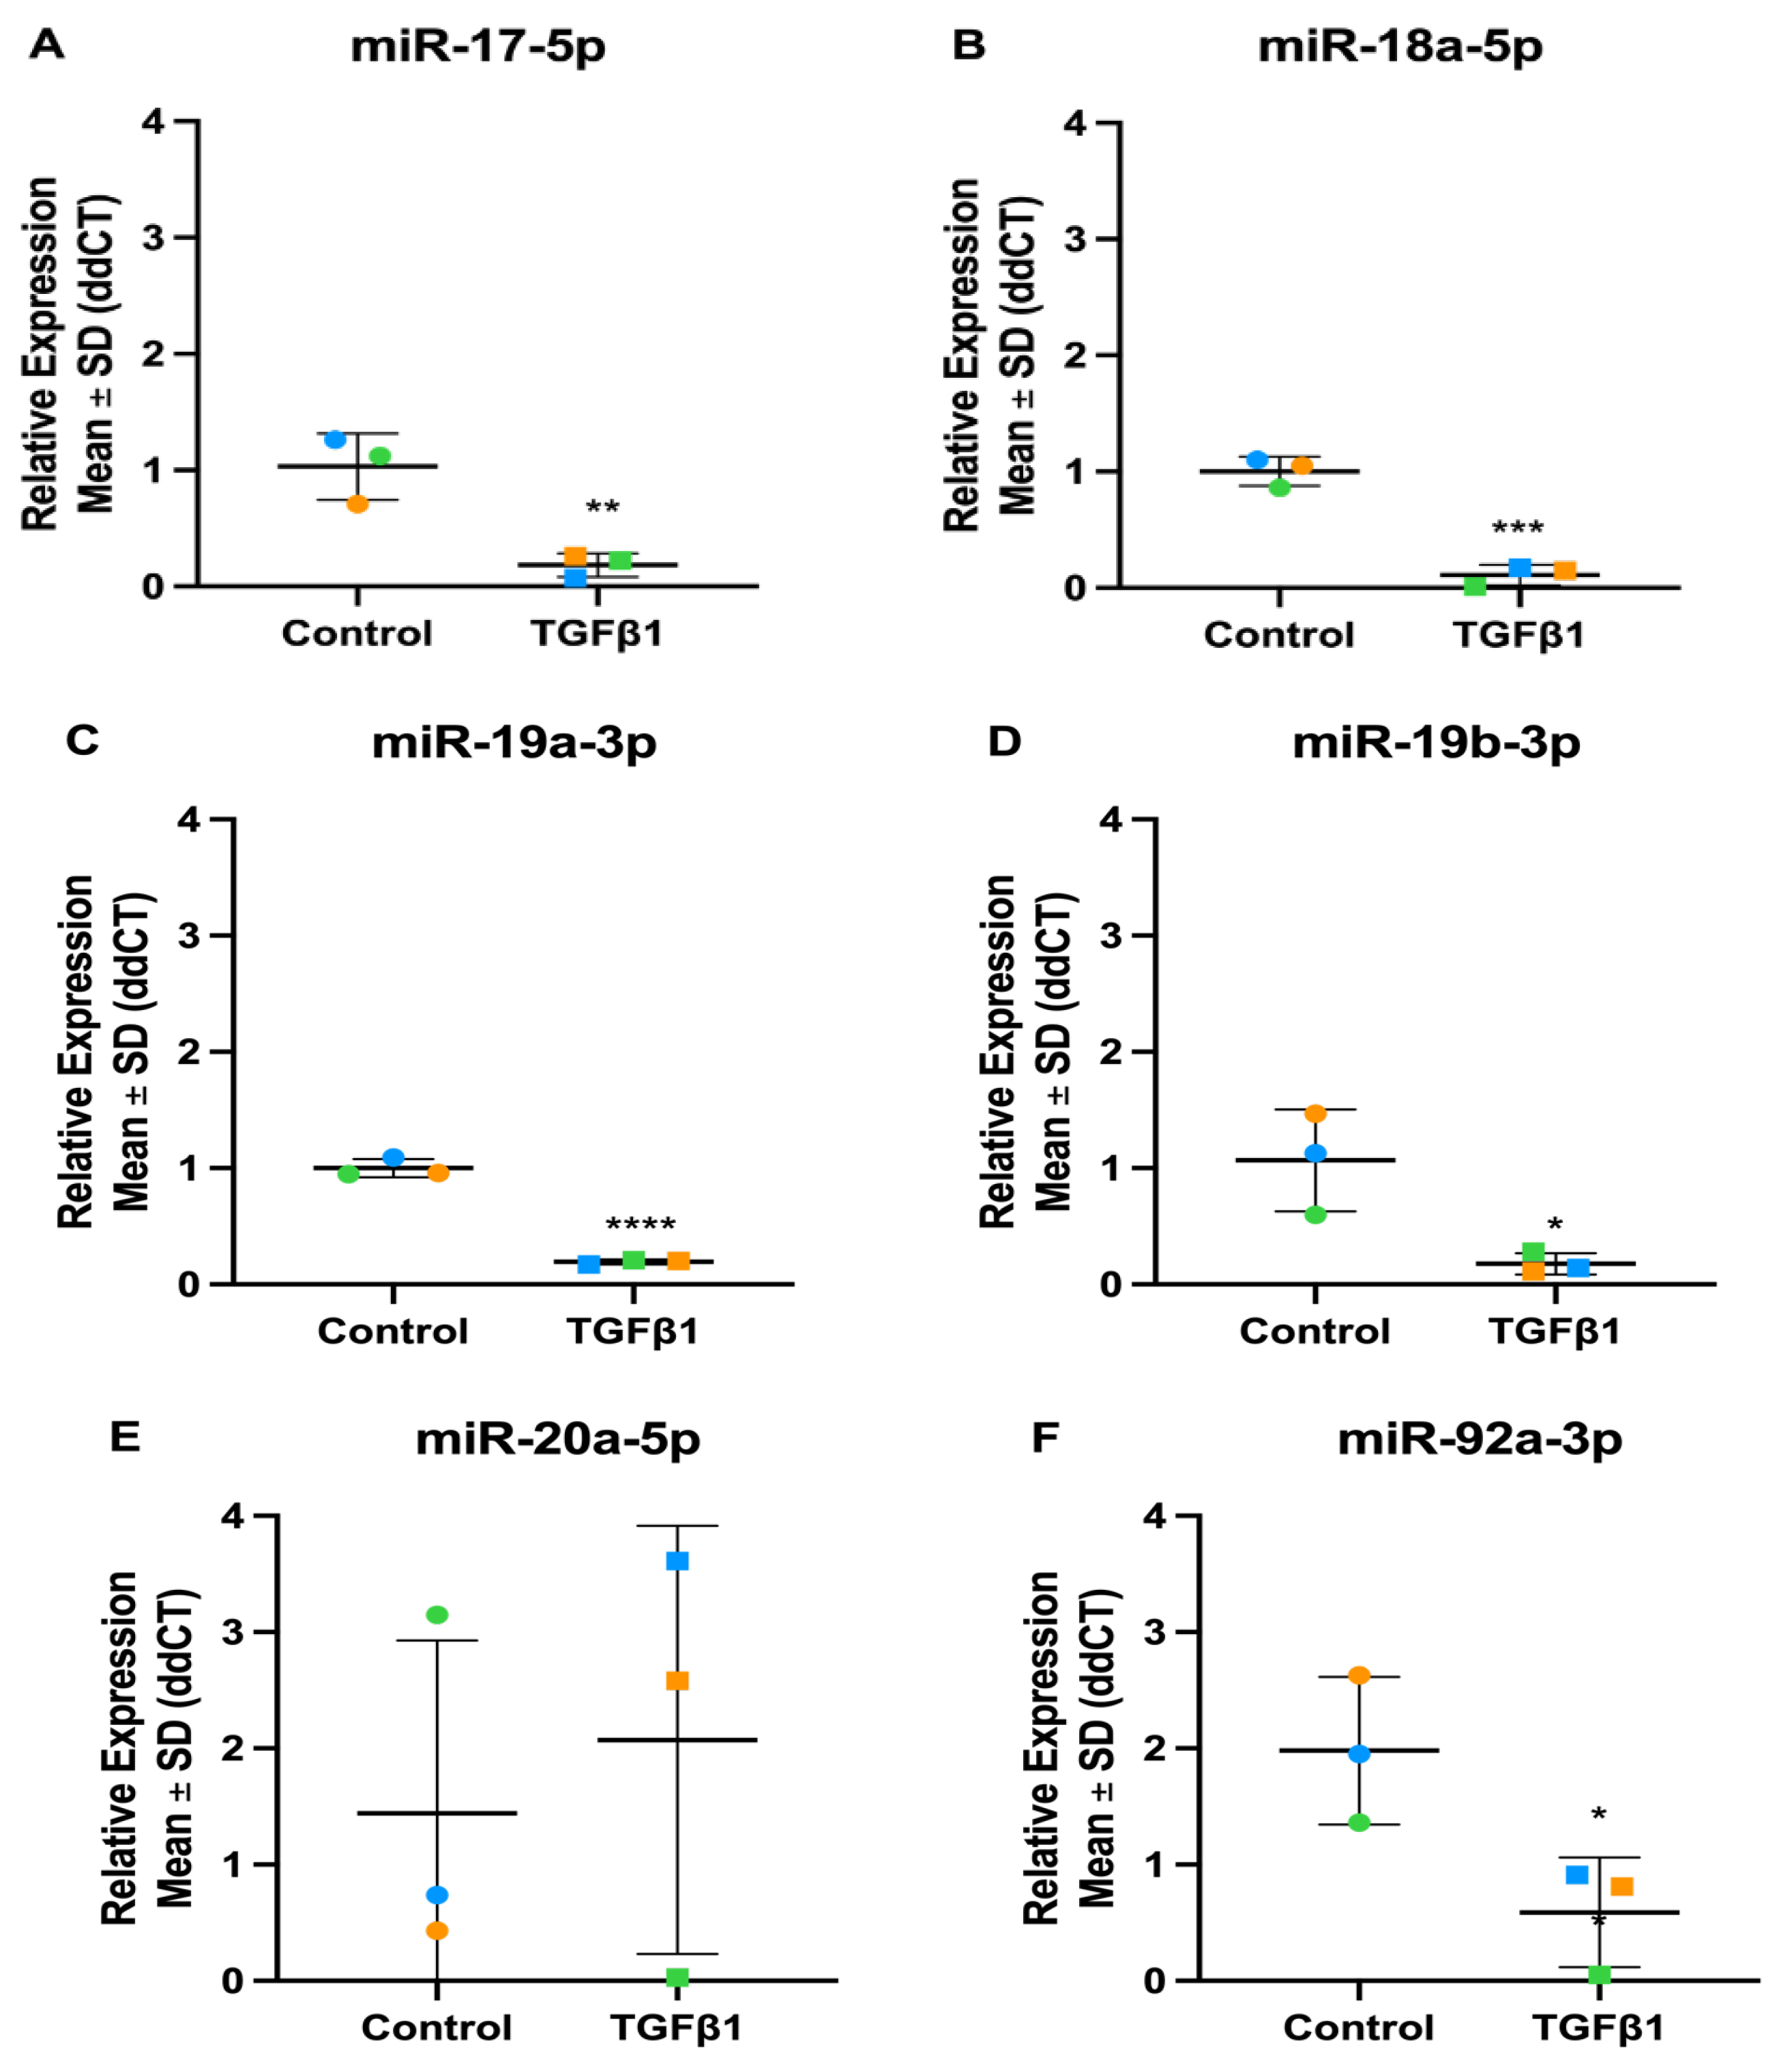
The miR-17-92 family is encoded by the MIR17HG gene, which is transcribed as a polycistronic transcript that produces six mature miRNAs: miR-17, miR-18, miR-19a, miR-19b, miR-20, and miR-92 [57]. Interestingly, we identified the miR-17-92 family as differentially expressed in TM cells following both TGFβ1 and -β2 stimulation. One striking difference we found between the TGFβ1 and TGFβ2 datasets was that TGFβ1 treatment appeared to have a larger effect on the family members. To confirm the differential expression of this family in TM cells, we performed RT-qPCR, treating the cells with either TGFβ1 or TGFβ2. In TGFβ1-treated TM cells, the RT-qPCR results followed the same trend as the miRNA-Seq data, apart from miR-20a-5p which showed donor variability. The RT-qPCR results in TGFβ2-treated TM cells were less significant, which followed the pattern found in the miRNA-Seq data. miR-17-5p and miR-18a-5p were both significantly up-regulated, like the miRNA-Seq data, while the rest of the family were not significantly altered.
Figure 9. The structure of the miR-17-92 family along with its two paralogs: miR-106a-363 and miR-106b-25. The miR-17-92 cluster is located on chromosome 13 and consists of miR-17, miR-18a, miR-19a, miR-19b-1, miR-20a and miR-92a-1. The miR-106a-363 cluster is located on chromosome X and consists of miR-106a, miR-18b, miR-20b, miR-19b-2, miR-92a-2 and miR-363. The third cluster is miR-106b-25 consisting of miR-106b, miR-93 and miR-25. These fifteen miRNAs can be grouped into four seed families: miR-17, miR-18, miR-19, and miR-92 families.
Preprints 105395 g009
Table 5. Fold Change and p-value of the miR-17-92 family members in the miRNA-Seq datasets.
miRNA TGFβ1 dataset TGFβ2 dataset
Fold Change P-value Fold Change P-value
hsa-miR-17-5p 0.77 0.060 1.07 0.510
hsa-miR-18a-5p 0.67 0.007 1.13 0.222
hsa-miR-19a-3p 0.63 0.002 0.89 0.360
hsa-miR-19b-3p 0.64 0.001 0.96 0.765
hsa-miR-20a-5p 0.67 0.002 0.91 0.255
hsa-miR-92a-3p 0.83 0.160 0.92 0.361
Figure 10. Expression levels of miR-17-92 family in TGFβ1-stimulated TM cells. (A) hsa-miR-17-5p (B) hsa-miR-18a-5p (C) hsa-miR-19a-3p (D) hsa-miR-19b-3p (E) hsa-miR-20a-5p (F) hsa-miR-92a-3p. Vehicle controls are denoted as “Control” on graphs and TGFβ1 treated cells as “TGFβ1”. Individual values for donors 1, 2 and 3 are shown. Data was normalised to U6 control and analysed using the ΔΔCt method. Circles represent individual donor gene without TGFβ1 treatment and squares represent donors with TGFβ1 treatment. An asterisk denotes significant differential gene expression after treatment (* = p < 0.05, ** = p < 0.005, *** = p < 0.0005, **** = p < 0.00005).
Preprints 105395 g010
Figure 11. Expression levels of miR-17-92 family in TGFβ2-stimulated TM cells. (A) hsa-miR-17-5p (B) hsa-miR-18a-5p (C) hsa-miR-19a-3p (D) hsa-miR-19b-3p (E) hsa-miR-20a-5p (F) hsa-miR-92a-3p. Vehicle controls are denoted as “Control” on graphs and TGFβ2 treated cells as “TGFβ2”. Individual values for donors 1, 2 and 3 are shown. Data was normalised to U6 control and analysed using the ΔΔCt method. Circles represent individual donor gene without TGFβ2 treatment and squares represent donors with TGFβ2 treatment. An asterisk denotes significant differential gene expression after treatment (* = p < 0.05).
Preprints 105395 g011

3.8.2. miR-29 Family

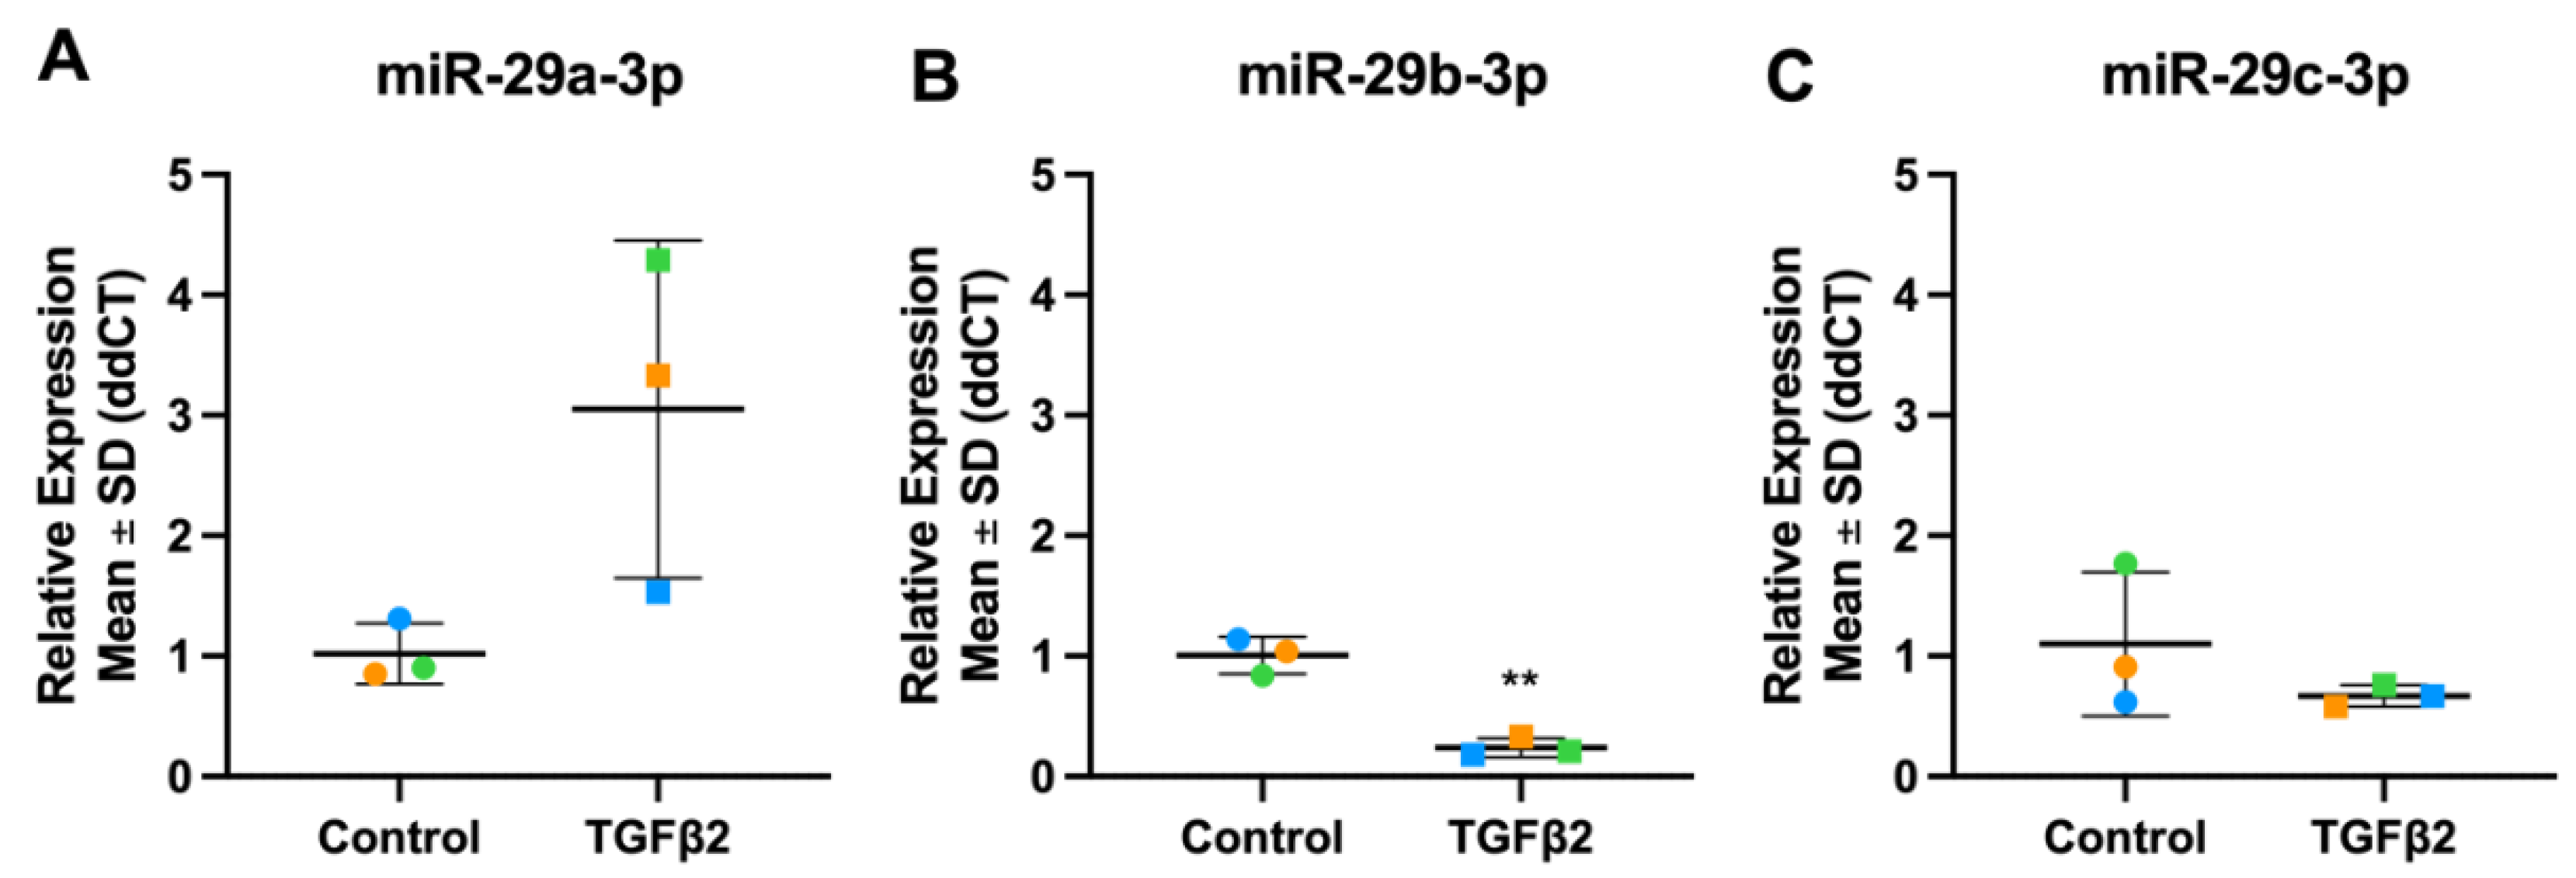
The miR-29 family includes miR-29a, miR-29b-1, miR-29b-2, and miR-29c [58]. Both miR-29b-1 and miR-29b-2 have identical mature sequences and are therefore collectively referred to as miR-29b [59]. MiR-29a and -29b-1 are encoded on chromosome 7q32.3, while the miR-29b-2 and -29c cluster are found on chromosome 1q32.2 [60] (Figure 12). All four members have a common seed sequence in nucleotides 2 to 8 and largely regulate a similar group of target mRNAs. Following TGFβ2 stimulation, miR-29a was up-regulated while miR-29b and miR-29c were down-regulated, in both the miRNA-Seq dataset and RT-qPCR (Figure 13).
Figure 12. Schematic representation of the miR-29 family. Adapted from Smyth et al. [61]
Preprints 105395 g012
Figure 13. Expression levels of miR-29 family in TGFβ2-stimulated TM cells. (A) hsa-miR-29a-3p (B) hsa-miR-29b-3p (C) hsa-miR-29c-3p. Vehicle controls are denoted as “Control” on graphs and TGFβ2 treated cells as “TGFβ2”. Individual values for donors 1, 2 and 3 are shown. Data was normalised to U6 control and analysed using the ΔΔCt method. Circles represent individual donor gene without TGFβ2 treatment and squares represent donors with TGFβ2 treatment. An asterisk denotes significant differential gene expression after treatment (** = p < 0.005).
Preprints 105395 g013

3.9. miRNA Strands

During miRNA biogenesis, one strand of the miRNA duplex is selectively loaded into the AGO protein where the specificity of the miRISC is determined based on the complementarity between the miRNA and the 3′UTR of the target mRNA [62]. The miRNA can originate from the 5′ side of the pre-miRNA to which it is referred to as the “-5p” strand or the 3′ side of the pre-miRNA, to which it is referred to as the “-3p” strand. Typically, one strand is loaded into the AGO protein becoming the functional miRNA or guide strand while the other strand is discarded. This strand is known as the miRNA* or passenger strand [63,64,65]. The fact that both strands may be loaded into the AGO protein is becoming more widely studied and either strand may form fully functioning mature miRNAs [66,67]. Therefore, it is important to know whether one or both of -5p/-3p strands of a miRNA are playing a functional role in glaucoma pathology. We were interested in understanding the effects of TGFβ on the expression of the paired -5p and -3p strands of the same miRNA in the TM cells.
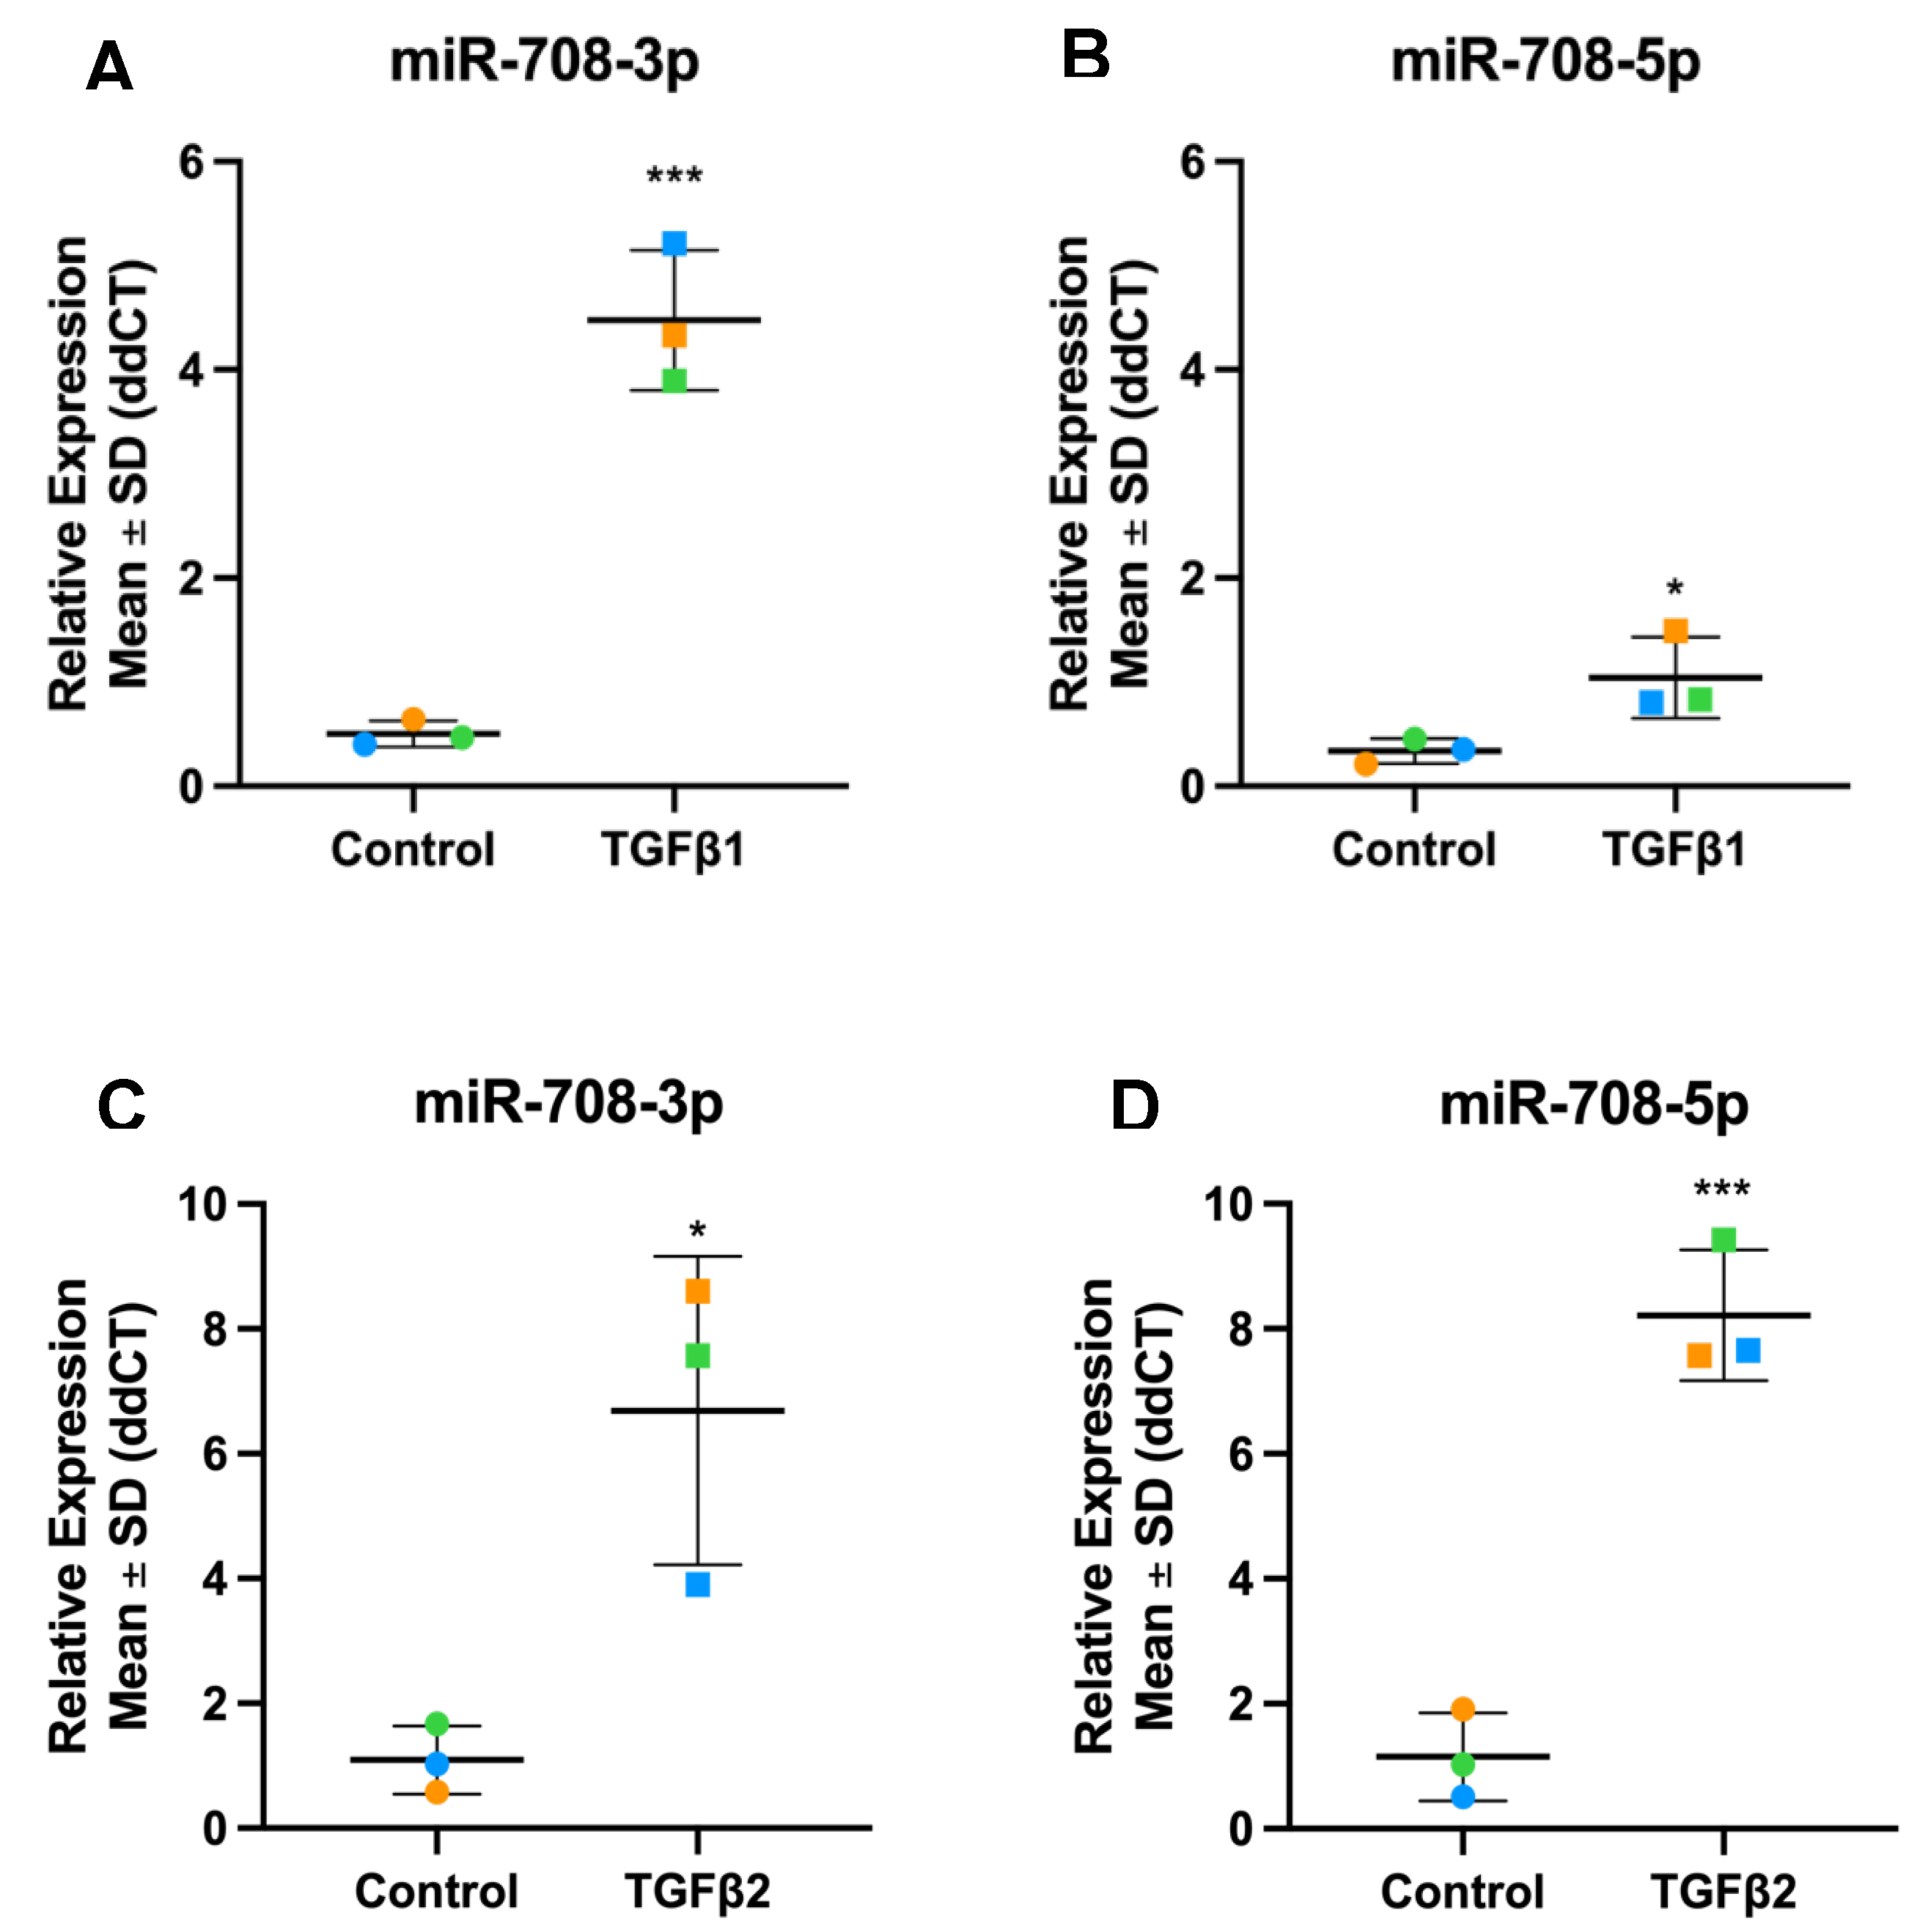
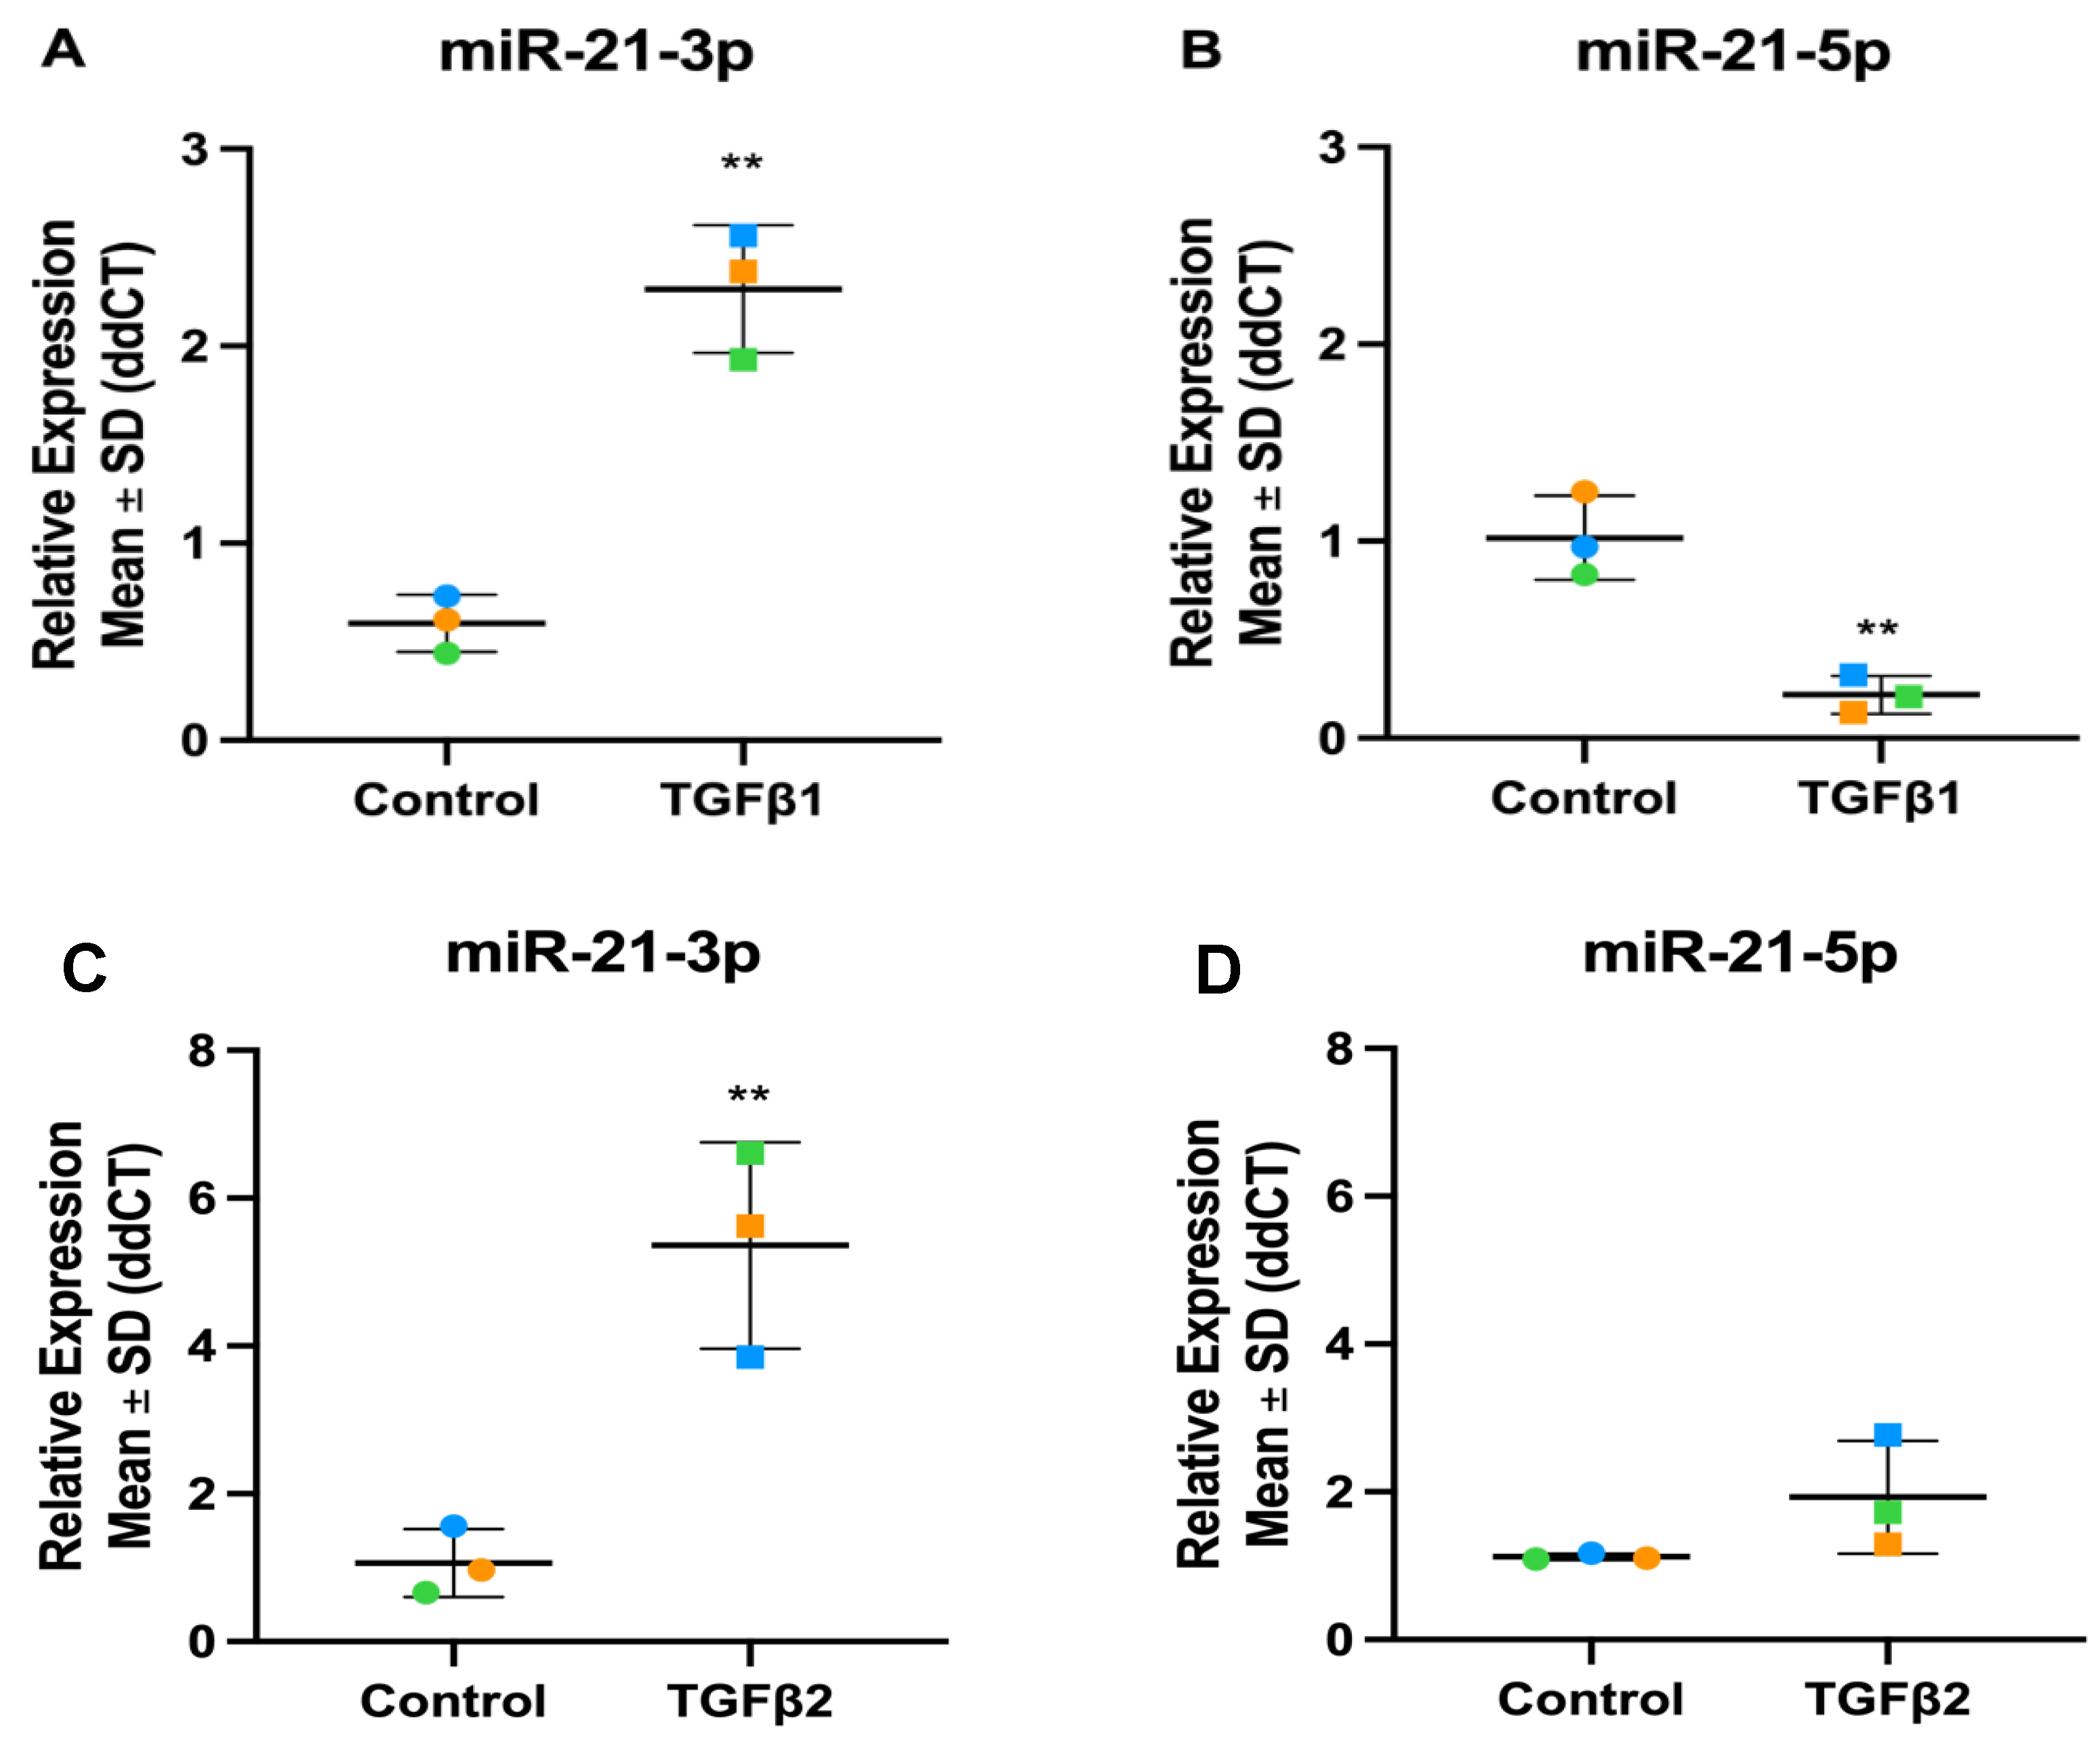
In our datasets, we discovered both the guide and passenger strands of several miRNAs were altered by TGFβ treatment. miR-708-3p and -5p are significantly up-regulated in TGFβ1 and TGFβ2 stimulated TM cells (Figure 14). miR-21-3p, also referred to as miR-21*, is significantly up-regulated in both TGFβ1 and TGFβ2 treated cells (Figure 15), while miR-21-5p, referred to as the miR-21 guide, was significantly down-regulated in TGFβ1 treated cells and slightly up-regulated, although not significant, in TGFβ2-treated TM cells (Figure 15).

4. Discussion

Understanding the role of the TGFβ-induced microRNAome in the trabecular meshwork (TM) provides insight into the molecular pathology of primary open-angle glaucoma (POAG) and pseudo-exfoliation glaucoma (XFG). Determining the specific genes and pathways impacted by dysregulated miRNA expression will support the development of miRNA-based therapeutics for glaucoma [68,69,70]. In this study, we have treated human primary TM cells with either TGFβ1 or TGFβ2, as cellular models of POAG (TGFβ2) and XFG (TGFβ1), and using small RNA sequencing, we identified 186 TGFβ1-regulated miRNAs in TM cells and 72 TGFβ2-regulated miRNAs suggesting TGFβ1 stimulation had a stronger effect on the miRNA expression profile in TM cells. Increased levels of TGFβ in the anterior segment of the eye induce fibrotic changes in the TM in glaucoma (POAG and XFG) including altered turnover of extracellular matrix (ECM) components, formation of cross-linked actin networks (CLANS), upregulation of alpha-smooth muscle actin (αSMA), aberrant formation of actin stress fibres and epithelial to mesenchymal transition (EMT) (Keller et al., 2009; Fuchshofer and Ernst R Tamm, 2012; Mark A. Prendes et al., 2013; Takahashi et al., 2014; Wordinger, Sharma and Clark, 2014)
miR-122-5p was one of the highest upregulated miRNAs in response to TGFβ1 in the TM in our study. This response was also previously reported in the TM and miR-122 was associated with the regulation of the TGFβ/Smad pathway [75]. Within the TGFβ signalling pathway, miR-122-5p has predicted target interactions with TGFβR1, TGFβR2, LTBP1 and SMAD2. The levels of miR-122-5p are significantly elevated in the aqueous humour in XFG [76] in addition to TGFβ1 [21,22,23]. miR-122 is one of the most abundant miRNAs in the liver, playing an important role in liver fibrosis [77] and other organ fibrosis targeting the TGFβ signalling pathway [78].
There was significant upregulation of miR-182-5p in TGFβ1-treated primary human TM cells. Elevated expression of miR-182-5p was reported during stress-induced premature senescence in cultured TM cells [79]. The absolute expression of miR-182-5p in the aqueous humour samples from glaucoma patients was elevated 2-fold [80]. A SNP (rs76481776) in the MIR182 gene was associated with POAG in the NEIGHBORHOOD GWAS dataset although the mechanism linking this SNP with POAG has not been elucidated [80]. Originally described as a sensory organ-specific miRNA, miR-182 is also involved in immunity, cancer and regulation of TGFβ signalling [81,82,83]. By targeting SMAD7, a negative regulator of the TGFβ signalling pathway, miR-182-5p amplifies TGFβ induced epithelial to mesenchymal transition (EMT) and metastasis of cancer cells while inhibition of miR-182-5p reduces pulmonary fibrosis [84,85].
miR-145-5p is abundantly expressed in the TM and smooth muscle in the eye and is highly expressed in the aqueous humour in POAG patients [69,86,87]. It is a member of the miR-143/145 cluster which play a role in the regulation of IOP [69]. miR-143/145 double knockout mice resulted in 19% decrease in IOP [69]. miR-143/145 increases IOP by modulating actin dynamics enhancing the contractility of TM cells [69]. Manipulation of miR-143/145 levels in the TM may offer therapeutic potential in glaucoma [69].
The expression of miR-146b-5p was downregulated with TGFβ treatment. miR-146b-5p is a member of the miR-146 family of miRNAs, consisting of miR-146a-5p and miR-146b-5p. These two miRNAs only differ by two nucleotides on the 3′ end of their mature strand, sharing the same seed region [88]. During replicative senescence in human TM cells, miR-146a upregulation limited inflammatory responses [89]. miR-146a regulates the pro-inflammatory NF-κB signalling pathway by inhibiting interleukin-1 receptor-associated kinase 1 (IRAK1) to inhibit inflammation [90]. Following lentiviral delivery intracamerally of miR-146a in rats there was a sustained reduction of IOP of 4.4 ± 2.9 mmHg over 8 months [68]. The mechanism of IOP lowering was postulated as likely complex and potentially involving alterations in TGFβ signalling, ROCK inhibition and/or NF-κB signalling [68]. While miR-146b-5p has not been studied in the TM, it also inhibited NF-κB-induced interleukin 6 (IL-6) expression in breast cancer cells [91]. This suggests that miR-146b-5p may play a similar role to miR-146a-5p in the TM.
miRNA clusters and families
The action of miRNAs can be synergistic and this is exemplified by miRNA clusters which consist of multiple miRNAs with a common promoter resulting in co-expression and coordinated action [92,93,94]. The miR-17-92 cluster was enriched in both the TGFβ1 and TGFβ2 datasets. This cluster consists of six mature miRNAs: miR-17, miR-18a, miR-19a, miR-19b, miR-20a and miR-92a [95]. Through gene duplication, this cluster has evolved to form two paralogs: the miR-106a-363 cluster and the miR-106b-25 cluster, shown in Figure 9 [55]. As some of the miRNAs share a seed sequence, they have been divided into four main miRNA families: the miR-17, miR-18, miR-19, and miR-92 families [55]. An important pathway targeted by members of the miR-17-92 family is the TGFβ signalling pathway [96,97]. miR-17-5p is down-regulated in response to TGFβ1 treatment in TM cells. TM cells under oxidative stress down-regulate miR-17-5p which may regulate the proliferation and apoptosis of TM cells through its direct targeting of tumour suppressor PTEN [98], which is up-regulated in TM cells following TGFβ treatment [99]. Previous research from our group has shown miR-18a-5p expression increased in TM cells following TGFβ2, consistent with our miRNA-Seq results [100]. miR-18a-5p targets connective tissue growth factor (CTGF), which is a fibrotic gene elevated in the TM of glaucoma patients [101]. CTGF induces actin stress fibres and increases TM cell contractility by activating RhoA [102]. Lentiviral-mediated overexpression of miR-18a reduced TGFβ2-induced CTGF expression in TM cells and showed a reduction in TGFβ2-induced contraction of collagen gels [100]. miR-18a-5p is a potential miRNA therapeutic in glaucoma because of its ability to inhibit CTGF-associated increased TM cell contractility [100].
The synergistic action of miRNAs is also supported by miRNA families [94,103]. A miRNA family consists of two or more miRNAs with high sequence similarity and can be located in one or more distinct clusters [94]. The miR-29 family regulates a plethora of fibrosis associated genes in various cell types including lungs, liver, heart, eye and other organs (Cushing, Kuang and Lü, 2015; Deng et al., 2017; Smyth, Callaghan, Colin E Willoughby, et al., 2022). The family is a known downstream target in the TGFβ/Smad pathway, and the phosphorylation of Smad3 by TGFβ causes miR-29 to be downregulated [61]. Our study detected down-regulation of miR-29b-3p in both TGFβ1 and TGFβ2 treated TM cells, as seen in previous reported [105,106]. Transfection of human TM cells with miR-29b-3p mimic down-regulated ECM proteins including collagens, laminin subunit gamma 1 (LAMC1), and fibrillin 1 (FBN1), and secreted protein acidic rich in cysteine (SPARC), a gene involved in ECM remodelling [107]. Alterations in SPARC, and collagens I and IV, cause significant changes in IOP in transgenic mice [108]. Our KEGG analysis identified the PI3K-Akt signalling pathway to be over-represented with miR-29b-3p expression. Overexpression of miR-29b-3p represses the PI3K-Akt pathway reducing collagen I expression in human Tenon’s ocular fibroblasts [109]. miR-29b-3p down-regulation in the TM may contribute to increased TGFβ-induced ECM components. miR-29 plays a critical role in regulating ECM production and is an anti-fibrotic miRNA [110] and miRNA-29b mimics attenuate pulmonary fibrosis in vivo [111].
miRNA strands
The miRNA biogenesis pathway involves sequential processing of the pri-miRNA into pre-miRNA and finally into a mature miRNA [112]. Following Drosha processing of pri-miRNAs in the nucleus, pre-miRNAs are exported into the cytoplasm and cleaved by Dicer, resulting in the miRNA duplex [65]. Transcription produces equal amounts of both strands of miRNA duplexes; however, their accumulation is mostly asymmetric at steady state [113]. As proposed in the oncology field [114], the results from our study highlight that both 3p- and 5p-arms from a miRNA warrant independent study.
miR-21-5p is known to be one of the most overexpressed miRNAs in response to tissue injury and to play an important role in fibrosis [115,116]. During miRNA biogenesis, pre-miR-21 is exported by Exportin 5 and processed by Dicer to release mature hsa-miR-21 (also known as hsa-miR-21-5p, the biologically dominant arm) and hsa-miR-21-3p (formerly named hsa-miR-21*), previously considered the less abundant or active miRNA strand [117,118,119,120]. Pro-fibrotic miR-21-5p binds to Smad7, an inhibitory Smad, and thus amplifies the TGFβ signalling pathway, causing fibrotic responses [121,122]. There is crosstalk between miR-21-5p and a variety of signalling pathways: TGFβ/SMAD, PI3K/AKT and ERK/MAPK signalling pathways, in the regulation of fibrotic processes [123]. A role of miR-21-5p in regulating IOP and outflow facility has been reported [124]. Topical administration of a synthetic miR-21-5p mimic increased miR-21-5p expression in the TM while reducing IOP by 17% [124]. Using RNA-sequencing and pathway analysis, with the predicted downstream target genes of miR-21-5p identified, they found a pathway involving FGF18, SMAD7 and MMP9 based on protein-protein interaction networks [124]. RT-qPCR confirmed the downregulation of SMAD7 and FGF18 by a miR-21-5p mimic suggesting that miR-21-5p targets SMAD7 and FGF18 to encourage ECM degradation by MMP9 in the TM [124]. In our data miR-21-5p expression was unaltered by TGFβ2 treatment in the TM but significantly downregulated with TGFβ1 treatment. Unexpectedly, our data shows an upregulation of miR-21-3p with both TGFβ1 and -β2 treatment. There is emerging evidence for a biological role for miR-21-3p in malignancy [114,125], vascular biology [126,127] and in the regulation of TGFβ signalling [117]. In hepatocellular carcinoma, miR-21-3p regulates both TGFβ and Hippo signalling via SMAD7 and YAP1 [117]. Overexpression of miR-21-3p directly silences SMAD7 expression and reduces the stability of the SMAD7/YAP1 complex allowing YAP1 translocation to the nucleus and resultant profibrotic gene expression [117]. Further work is required to understand the role of the -5p and -3p miR-21 strands in TM pathophysiology.
miR-708 is not a widely studied miRNA in ocular tissues, however its expression has been reported in retinal ganglion cells [128]. miR-708-5p is the more abundant strand and is involved in oncogenesis [129,130]. miR-708-5p was upregulated in the TM in response to TGFβ2 but the passenger strand (miR-708-3p) was significantly upregulated in response to TGFβ1 and -β2. A disintegrin and metalloproteinase 17 (ADAM17), which is overexpressed in fibrotic disorders [131,132,133] and is expressed in TM cells [134,135], is a direct target of miR-708-3p. By targeting ADAM17, miR-708-3p represses the GATA/STAT3 signalling pathway in idiopathic pulmonary fibrosis (IPF) reducing fibrosis [136]. GATA6 promotes fibroblast differentiation into myofibroblasts in IPF by mediating the α-SMA-inducing signal of TGFβ1 [137,138], and STAT3, is abundantly expressed in multiple fibrotic disorders [139]. In breast cancer cells miR-708-3p inhibits EMT by directly targeting ZEB1, cadherin 2 and vimentin [140]. Therefore, miR-708-3p could present a new therapeutic target for TM fibrosis by targeting the ADAM17-GATA/STAT pathway and EMT.
miRNA regulation of signalling pathways
A cell can simultaneously express multiple miRNAs to regulate gene expression in a holistic, intricate network with a single miRNA targeting multiple mRNAs and a single mRNA targeted by multiple miRNAs [92,93,141]. Our data can be considered in terms of specific miRNAs (miRNA-centric) but miRNAs work in networks to control cellular pathways and processes and a pathway-centric view of miRNA action is also required [142]. Several of the DEmiRs altered by TGFβ in the TM have been implicated in the regulation of the TGFβ signalling pathway [96,97,143]. Interestingly, the TGFβ signalling pathway was only significantly enriched in TGFβ1 down-regulated miRNAs in the TM. The transforming growth factor beta receptor 2 (TGFβR2) is targeted by miR-18a-5p [144], miR-20a-5p, miR-29b-3p and miR-204-5p which were all significantly downregulated in the TM in response to TGFβ1. Smad2/3, the regulatory Smads in the canonical TGFβ signalling pathway, are also targeted by miR-18a-5p [145,146,147,148]. Lentiviral expression of miR-18a-5p in bleomycin mice presented lowered levels of phosphorylated Smad2/3 and a reduction in pulmonary fibrosis [144]. There are several overlapping miRNAs involved in the regulation of both the TGFβ signalling pathway and the Hippo signalling pathway.
The Hippo signalling pathway is considered a tumour suppressor pathway, playing important roles in cell differentiation and cell proliferation [149,150]. Our pathway enrichment analysis identified the Hippo signalling pathway as significantly enriched in both TGFβ1 and -β2 miRNA-Seq datasets in the TM, associated with both up- and down-regulated miRNAs. TGFβ2 upregulated the expression of miR-181c-5p in TM cells and miR-181c-5p inhibits Hippo signalling through its target large tumour suppressor 2 (LATS2) and Salvador Family WW Domain Containing Protein 1 (SAV1) [151,152,153]. SAV1 bind to the Macrophage Stimulating 1/2 (MST1/2) kinases forming an enzyme complex which phosphorylates LATS1/2 [154,155]. The LATS1/2 kinases phosphorylate Yes-Associated Protein 1 (YAP) which in turn prevents nuclear translocation and signals its proteasomal degradation [156]. Therefore, miR-181c-5p disrupts the negative regulation of Hippo signalling and promotes the activation of YAP by targeting LATS2 and SAV1 [151,152]. YAP/TAZ also stimulates the nuclear accumulation of SMAD complexes to increase their transcriptional activity [157,158,159]. YAP/TAZ nuclear levels are elevated by TGFβ2 in both normal and glaucomatous human TM cells while inhibition of YAP/TAZ resulted in reduced focal adhesions, ECM remodelling and cell contractility [160]. When Hippo signalling is inhibited the nuclear translocation of YAP/TAZ induces the transcriptional activity of TEA domain (TEAD) family members which increases the expression of CTGF which is associated with glaucoma and TM fibrosis [100,161,162].
MAPK signalling pathway and PI3K-Akt signalling pathway were two of the most enriched pathways targeted by DEmiRs in both TGFβ1 and -β2-treated TM cells. AKT1/2/3, MAPK1, PTEN, RAC1 and PIK3CG were associated with multiple DEmiRs. Rac family small GTPase 1 (RAC1), targeted by miR-146a-5p [163,164] and miR-574-3p [165], activates p38-MAPK signalling [166], increases ECM production in TM cells and elevates SPARC and proinflammatory IL-6 in TM cells [167,168]. SPARC binds to ECM proteins and regulates the expression of matrix metalloproteinases (MMPs) [169]. SPARC expression is up-regulated by TGFβ2 in TM cells and is inhibited by the miR-29 family in the TM [106,170]. Up-regulation of IL-6 by TGFβ1 and TGFβ2 through p38-MAPK signalling, affects mechanical stress in TM cells [171,172]. RAF1, targeted by miR-125a-5p [173], leads to MAP ERK kinase [174] and ERK1/2 activation [166]. ERK1/2 can elevate PAI-1 expression in the TM, ultimately leading to increased ECM production [175].
The PI3K-Akt signalling pathway can promote cell survival and suppress apoptosis [176]. As there is a decline in TM cellularity in glaucoma due to apoptosis and ECM remodelling [177,178], AKT activation may play an important role in the protection of TM cellularity. In our datasets, up-regulated miRNAs including miR-29b-1-5p [179], miR-122-5p [180,181], miR-143-3p [182], miR-182-5p [183,184], miR-214-3p [185] and miR-708-5p [186,187] are all putative targets of AKT. PTEN indirectly influences cellular proliferation and apoptosis as a major negative regulator of the Akt signalling pathway [188,189]. Interestingly, six down-regulated miRNAs in our dataset target PTEN [190,191,192,193,194,195,196,197,198,199,200]. Specifically studied in the TM, the down-regulation of miR-17-5p increases PTEN expression leading to increased apoptosis and decreased proliferation of TM cells under oxidative stress conditions [98].
Inhibition of Wnt signalling has previously been shown in glaucomatous TM cells and is associated with TM cell stiffening (Mao et al., 2012; Morgan et al., 2015). Secreted frizzled-related protein-1 (SFRP1), targeted by miR-582-3p (Wang et al., 2020) which was down-regulated in TGFβ2-treated TM cells, inhibits the Wnt signalling pathway and is associated with increased IOP [207]. Activating Wnt signalling through miRNA targets could restore the normal phenotype caused by Wnt inactivation, through repression of ECM genes (SPARC and CTGF), cross-linking genes (LOX) and inhibitors of MMPs (TIMP1 and PAI-1) [208,209].

5. Conclusion

To our knowledge, this is the first study reporting a genome-wide miRNA expression in primary normal human TM cell samples following either TGFβ1 or -β2 stimulation using miRNA-Seq. We have identified differentially expressed miRNAs that could target genes associated with the pathogenesis of POAG and PXFG, and the identified enriched pathways associated with these miRNAs. Access to diseased TM disease from glaucoma patients is limited but would add to our understanding of miRNA dysregulation in the TM and disease pathogenesis. Further work to identify the miRNA::mRNA interactome is required to fully understand the TGFβ induced microRNAome of the TM. This knowledge is also required to develop miRNA-based therapeutics for POAG and XFG which will require consideration of miRNA-centric and pathway-centric effects. There are several challenges to overcome to develop miRNA therapeutics to reduce IOP in glaucoma [210], but early pre-clinical studies are encouraging [68,70,124,211].

Supplementary Materials

The following supporting information can be downloaded at the website of this paper posted on Preprints.org. Table S1. RT-qPCR miRCURY LNA miRNA primer assays sequences. Table S2. Significantly up-regulated TGFβ1-responsive miRNAs associated with glaucoma-related signalling pathways and their gene targets. Table S3. Significantly down-regulated TGFβ1-responsive miRNAs associated with glaucoma-related signalling pathways and their gene targets. Table S4. Significantly up-regulated TGFβ2-reponsive miRNAs associated with glaucoma-related signalling pathways and their gene targets. Table S5. Significantly down-regulated TGFβ2-responsive miRNAs associated with glaucoma-related signalling pathways and their gene targets. Table S6. Significantly down-regulated TGFβ2-responsive miRNAs associated with glaucoma-related signalling pathways and their gene targets.

Author Contributions

Conceptualization, C.S., D.A.S., and C.E.W.; methodology, C.D., B.C., A.W.R., L.A., K.L., S.D.A., D.J.M., D.A.S. and C.E.W.; software, C.D. and A.W.R.; validation, C.D., B.C., L.A.; formal analysis, C.D.; investigation, C.D., B.C., A.W.R., L.A. and K.L.; resources, C.S., D.A.S., S.D.A., D.J.M. and C.E.W.; data curation, C.D. and A.W.R.; writing—original draft preparation, C.D. and C.E.W.; writing—review and editing, C.D., B.C., A.W.R., L.A., K.L., S.D.A., D.J.M. and C.E.W.; visualization, C.D.; supervision, S.D.A., D.J.M. and C.E.W.; project administration, K.L., C.D. and C.E.W.; funding acquisition, C.S., D.A.S., S.D.A., D.J.M. and C.E.W. All authors have read and agreed to the published version of the manuscript.

Funding

This research was funded by Glaucoma UK (formerly the International Glaucoma Association), UK and Eire Glaucoma Society (UKEGS) and Fight for Sight (UK).

Institutional Review Board Statement

The study was conducted in accordance with the Declaration of Helsinki, and approved by the NHS Research Ethics Committee, United Kingdom (REC Ref 14/LO/1088).

Informed Consent Statement

Informed consent was obtained from all subjects involved in the study.

Data Availability Statement

Data is contained within the article. Raw RNA-Seq data was deposited and released in the SRA database: https://www.ncbi.nlm.nih.gov/sra/PRJNA1099874.

Conflicts of Interest

The authors declare no conflicts of interest.

References

  1. Weinreb, R.N.; Leung, C.K.S.; Crowston, J.G.; Medeiros, F.A.; Friedman, D.S.; Wiggs, J.L.; Martin, K.R. Primary Open-Angle Glaucoma. Nat Rev Dis Primers 2016, 2, 16067. [Google Scholar] [CrossRef] [PubMed]
  2. Tham, Y.-C.C.; Li, X.; Wong, T.Y.; Quigley, H.A.; Aung, T.; Cheng, C.-Y.Y. Global Prevalence of Glaucoma and Projections of Glaucoma Burden through 2040. Ophthalmology 2014, 121, 2081–2090. [Google Scholar] [CrossRef] [PubMed]
  3. Shalaby, W.S.; Shankar, V.; Razeghinejad, R.; Katz, L.J. Current and New Pharmacotherapeutic Approaches for Glaucoma. Expert Opin Pharmacother 2020, 21, 2027–2040. [Google Scholar] [CrossRef] [PubMed]
  4. Cvenkel, B.; Kolko, M. Current Medical Therapy and Future Trends in the Management of Glaucoma Treatment. J Ophthalmol 2020, 2020, 1–14. [Google Scholar] [CrossRef] [PubMed]
  5. Ang, A. Long Term Effect of Latanoprost on Intraocular Pressure in Normal Tension Glaucoma. British Journal of Ophthalmology 2004, 88, 630–634. [Google Scholar] [CrossRef]
  6. Scherer, W.J. A Retrospective Review of Non-Responders to Latanoprost. Journal of Ocular Pharmacology and Therapeutics 2002, 18, 287–291. [Google Scholar] [CrossRef] [PubMed]
  7. Cai, Z.; Cao, M.; Liu, K.; Duan, X. Analysis of the Responsiveness of Latanoprost, Travoprost, Bimatoprost, and Tafluprost in the Treatment of OAG/OHT Patients. J Ophthalmol 2021, 2021, 1–12. [Google Scholar] [CrossRef]
  8. Dikopf, M.S.; Vajaranant, T.S.; Edward, D.P. Topical Treatment of Glaucoma: Established and Emerging Pharmacology. Expert Opin Pharmacother 2017, 18, 885–898. [Google Scholar] [CrossRef]
  9. Rao, P.V.; Pattabiraman, P.P.; Kopczynski, C. Role of the Rho GTPase/Rho Kinase Signaling Pathway in Pathogenesis and Treatment of Glaucoma: Bench to Bedside Research. Exp Eye Res 2017, 158, 23–32. [Google Scholar] [CrossRef]
  10. Tanna, A.P.; Johnson, M. Rho Kinase Inhibitors as a Novel Treatment for Glaucoma and Ocular Hypertension. Ophthalmology 2018, 125, 1741–1756. [Google Scholar] [CrossRef]
  11. O’Callaghan, J.; Delaney, C.; O’Connor, M.; van Batenburg-Sherwood, J.; Schicht, M.; Lütjen-Drecoll, E.; Hudson, N.; Ni Dhubhghaill, S.; Humphries, P.; Stanley, C.; et al. Matrix Metalloproteinase-3 (MMP-3)-Mediated Gene Therapy for Glaucoma. Sci Adv 2023, 9, eadf6537. [Google Scholar] [CrossRef] [PubMed]
  12. Fuchshofer, R.; Tamm, E.R. The Role of TGF-β in the Pathogenesis of Primary Open-Angle Glaucoma. Cell Tissue Res 2012, 347, 279–290. [Google Scholar] [CrossRef] [PubMed]
  13. Clark, A.F. The Cell and Molecular Biology of Glaucoma: Biomechanical Factors in Glaucoma. Investigative Opthalmology & Visual Science 2012, 53, 2473. [Google Scholar] [CrossRef] [PubMed]
  14. Trivedi, R.H.; Nutaitis, M.; Vroman, D.; Crosson, C.E. Influence of Race and Age on Aqueous Humor Levels of Transforming Growth Factor-Beta 2 in Glaucomatous and Nonglaucomatous Eyes. Journal of Ocular Pharmacology and Therapeutics 2011, 27, 477–480. [Google Scholar] [CrossRef]
  15. Fleenor, D.L.; Shepard, A.R.; Hellberg, P.E.; Jacobson, N.; Pang, I.-H.; Clark, A.F. TGFβ2-Induced Changes in Human Trabecular Meshwork: Implications for Intraocular Pressure. Investigative Opthalmology & Visual Science 2006, 47, 226. [Google Scholar] [CrossRef] [PubMed]
  16. Tripathi, R.C.; Li, J.; Chan, W.A.; Tripathi, B.J. Aqueous Humor in Glaucomatous Eyes Contains an Increased Level of TGF-Β2. Exp Eye Res 1994, 59, 723–728. [Google Scholar] [CrossRef]
  17. Prendes, M.A.; Harris, A.; Wirostko, B.M.; Gerber, A.L.; Siesky, B. The Role of Transforming Growth Factor b in Glaucoma and the Therapeutic Implications. Br. J. Ophthalmol. 2013, 97, 680–686. [Google Scholar] [CrossRef] [PubMed]
  18. Wordinger, R.J.; Sharma, T.; Clark, A.F. The Role of TGF-Β2 and Bone Morphogenetic Proteins in the Trabecular Meshwork and Glaucoma. J Ocul Pharmacol Ther 2014, 30, 154–162. [Google Scholar] [CrossRef]
  19. Tovar-Vidales, T.; Clark, A.F.; Wordinger, R.J. Transforming Growth Factor-Beta2 Utilizes the Canonical Smad-Signaling Pathway to Regulate Tissue Transglutaminase Expression in Human Trabecular Meshwork Cells. Exp Eye Res 2011, 93, 442–451. [Google Scholar] [CrossRef]
  20. Gottanka, J. Effects of TGF- 2 in Perfused Human Eyes. Invest Ophthalmol Vis Sci 2004, 45, 153–158. [Google Scholar] [CrossRef]
  21. Schlötzer-Schrehardt, U.; Zenkel, M.; Küchle, M.; Sakai, L.Y.; Naumann, G.O.H. Role of Transforming Growth Factor-Β1 and Its Latent Form Binding Protein in Pseudoexfoliation Syndrome. Exp Eye Res 2001, 73, 765–780. [Google Scholar] [CrossRef] [PubMed]
  22. Kara, S.; Yildirim, N.; Ozer, A.; Colak, O.; Sahin, A. Matrix Metalloproteinase-2, Tissue Inhibitor of Matrix Metalloproteinase-2, and Transforming Growth Factor Beta 1 in the Aqueous Humor and Serum of Patients with Pseudoexfoliation Syndrome. Clinical Ophthalmology 2014, 305–309. [Google Scholar] [CrossRef] [PubMed]
  23. Garweg, J.G.; Zandi, S.; Pfister, I.B.; Skowronska, M.; Gerhardt, C. Comparison of Cytokine Profiles in the Aqueous Humor of Eyes with Pseudoexfoliation Syndrome and Glaucoma. PLoS One 2017, 12, e0182571. [Google Scholar] [CrossRef] [PubMed]
  24. Clayton, S.W.; Ban, G.I.; Liu, C.; Serra, R. Canonical and Noncanonical TGF-β Signaling Regulate Fibrous Tissue Differentiation in the Axial Skeleton. Sci Rep 2020, 10, 21364. [Google Scholar] [CrossRef] [PubMed]
  25. Hata, A.; Chen, Y.-G. TGF-β Signaling from Receptors to Smads. Cold Spring Harb Perspect Biol 2016, 8. [Google Scholar] [CrossRef] [PubMed]
  26. Gordon, K.J.; Blobe, G.C. Role of Transforming Growth Factor-β Superfamily Signaling Pathways in Human Disease. Biochimica et Biophysica Acta (BBA) - Molecular Basis of Disease 2008, 1782, 197–228. [Google Scholar] [CrossRef]
  27. Hill, C.S. Nucleocytoplasmic Shuttling of Smad Proteins. Cell Res 2009, 19, 36–46. [Google Scholar] [CrossRef]
  28. Kubiczkova, L.; Sedlarikova, L.; Hajek, R.; Sevcikova, S. TGF-β – an Excellent Servant but a Bad Master. J Transl Med 2012, 10, 183. [Google Scholar] [CrossRef] [PubMed]
  29. Attisano, L.; Tuen Lee-Hoeflich, S. The Smads. Genome Biol 2001, 2, reviews3010.1. [Google Scholar] [CrossRef]
  30. Heldin, C.-H.; Moustakas, A. Signaling Receptors for TGF-β Family Members. Cold Spring Harb Perspect Biol 2016, 8, a022053. [Google Scholar] [CrossRef]
  31. Bartel, D.P. Metazoan MicroRNAs. Cell 2018, 173, 20–51. [Google Scholar] [CrossRef] [PubMed]
  32. Ha, M.; Kim, V.N. Regulation of MicroRNA Biogenesis. Nat Rev Mol Cell Biol 2014, 15, 509–524. [Google Scholar] [CrossRef] [PubMed]
  33. Kang, H. Role of MicroRNAs in TGF-β Signaling Pathway-Mediated Pulmonary Fibrosis. Int J Mol Sci 2017, 18, 2527. [Google Scholar] [CrossRef] [PubMed]
  34. Sakuma, H.; Hagiwara, S.; Kantharidis, P.; Gohda, T.; Suzuki, Y. Potential Targeting of Renal Fibrosis in Diabetic Kidney Disease Using MicroRNAs. Front Pharmacol 2020, 11, 1797. [Google Scholar] [CrossRef] [PubMed]
  35. Gallant-Behm, C.L.; Piper, J.; Lynch, J.M.; Seto, A.G.; Hong, S.J.; Mustoe, T.A.; Maari, C.; Pestano, L.A.; Dalby, C.M.; Jackson, A.L.; et al. A MicroRNA-29 Mimic (Remlarsen) Represses Extracellular Matrix Expression and Fibroplasia in the Skin. J Invest Dermatol 2019, 139, 1073–1081. [Google Scholar] [CrossRef]
  36. Chakraborty, C.; Sharma, A.R.; Sharma, G.; Lee, S.-S. Therapeutic Advances of MiRNAs: A Preclinical and Clinical Update. J Adv Res 2021, 28, 127–138. [Google Scholar] [CrossRef] [PubMed]
  37. Montgomery, R.L.; Yu, G.; Latimer, P.A.; Stack, C.; Robinson, K.; Dalby, C.M.; Kaminski, N.; van Rooij, E. Micro <scp>RNA</Scp> Mimicry Blocks Pulmonary Fibrosis. EMBO Mol Med 2014, 6, 1347–1356. [Google Scholar] [CrossRef] [PubMed]
  38. Drewry, M.; Helwa, I.; Allingham, R.R.; Hauser, M.A.; Liu, Y. MiRNA Profile in Three Different Normal Human Ocular Tissues by MiRNA-Seq. Investigative Opthalmology & Visual Science 2016, 57, 3731. [Google Scholar] [CrossRef] [PubMed]
  39. Keller, K.E.; Bhattacharya, S.K.; Borrás, T.; Brunner, T.M.; Chansangpetch, S.; Clark, A.F.; Dismuke, W.M.; Du, Y.; Elliott, M.H.; Ethier, C.R.; et al. Consensus Recommendations for Trabecular Meshwork Cell Isolation, Characterization and Culture. Exp Eye Res 2018, 171, 164–173. [Google Scholar] [CrossRef]
  40. Callaghan, B.; Lester, K.; Lane, B.; Fan, X.; Goljanek-Whysall, K.; Simpson, D.A.; Sheridan, C.; Willoughby, C.E. Genome-Wide Transcriptome Profiling of Human Trabecular Meshwork Cells Treated with TGF-Β2. Sci Rep 2022, 12, 9564. [Google Scholar] [CrossRef]
  41. Babraham Bioinformatics Fastqc. Available online: https://www.bioinformatics.babraham.ac.uk/projects/fastqc/ (accessed on 6 September 2022).
  42. Martin, M. Cutadapt Removes Adapter Sequences from High-Throughput Sequencing Reads. EMBnet J 2011, 17, 10. [Google Scholar] [CrossRef]
  43. Liao, Y.; Smyth, G.K.; Shi, W. The R Package Rsubread Is Easier, Faster, Cheaper and Better for Alignment and Quantification of RNA Sequencing Reads. Nucleic Acids Res 2019, 47, e47–e47. [Google Scholar] [CrossRef]
  44. Frankish, A.; Diekhans, M.; Jungreis, I.; Lagarde, J.; Loveland, J.E.; Mudge, J.M.; Sisu, C.; Wright, J.C.; Armstrong, J.; Barnes, I.; et al. GENCODE 2021. Nucleic Acids Res 2021, 49, D916–D923. [Google Scholar] [CrossRef]
  45. Griffiths-Jones, S. MiRBase: MicroRNA Sequences, Targets and Gene Nomenclature. Nucleic Acids Res 2006, 34, D140–D144. [Google Scholar] [CrossRef] [PubMed]
  46. Liao, Y.; Smyth, G.K.; Shi, W. FeatureCounts: An Efficient General Purpose Program for Assigning Sequence Reads to Genomic Features. Bioinformatics 2014, 30, 923–930. [Google Scholar] [CrossRef] [PubMed]
  47. Robinson, M.D.; McCarthy, D.J.; Smyth, G.K. EdgeR: A Bioconductor Package for Differential Expression Analysis of Digital Gene Expression Data. Bioinformatics 2010, 26, 139–140. [Google Scholar] [CrossRef] [PubMed]
  48. Blighe, K.; Rana, S.; Lewis, M. EnhancedVolcano Version 1.10.0: Publication-Ready Volcano Plots with Enhanced Colouring and Labeling. R-Package 2021. [Google Scholar]
  49. Sherman, B.T.; Hao, M.; Qiu, J.; Jiao, X.; Baseler, M.W.; Lane, H.C.; Imamichi, T.; Chang, W. DAVID: A Web Server for Functional Enrichment Analysis and Functional Annotation of Gene Lists (2021 Update). Nucleic Acids Res 2022, 50, W216–W221. [Google Scholar] [CrossRef]
  50. Huang, D.W.; Sherman, B.T.; Lempicki, R.A. Systematic and Integrative Analysis of Large Gene Lists Using DAVID Bioinformatics Resources. Nat Protoc 2009, 4, 44–57. [Google Scholar] [CrossRef] [PubMed]
  51. Agarwal, V.; Bell, G.W.; Nam, J.-W.; Bartel, D.P. Predicting Effective MicroRNA Target Sites in Mammalian MRNAs. Elife 2015, 4. [Google Scholar] [CrossRef]
  52. Skoufos, G.; Kakoulidis, P.; Tastsoglou, S.; Zacharopoulou, E.; Kotsira, V.; Miliotis, M.; Mavromati, G.; Grigoriadis, D.; Zioga, M.; Velli, A.; et al. TarBase-v9.0 Extends Experimentally Supported MiRNA–Gene Interactions to Cell-Types and Virally Encoded MiRNAs. Nucleic Acids Res 2024, 52, D304–D310. [Google Scholar] [CrossRef] [PubMed]
  53. Guo, L.; Zhao, Y.; Zhang, H.; Yang, S.; Chen, F. Integrated Evolutionary Analysis of Human MiRNA Gene Clusters and Families Implicates Evolutionary Relationships. Gene 2014, 534, 24–32. [Google Scholar] [CrossRef] [PubMed]
  54. Fang, L.L.; Wang, X.H.; Sun, B.F.; Zhang, X.D.; Zhu, X.H.; Yu, Z.J.; Luo, H. Expression, Regulation and Mechanism of Action of the MiR-17-92 Cluster in Tumor Cells. Int J Mol Med 2017, 40, 1624–1630. [Google Scholar] [CrossRef] [PubMed]
  55. Concepcion, C.P.; Bonetti, C.; Ventura, A. The MicroRNA-17-92 Family of MicroRNA Clusters in Development and Disease. The Cancer Journal 2012, 18, 262–267. [Google Scholar] [CrossRef] [PubMed]
  56. Smyth, A.; Callaghan, B.; Willoughby, C.E.; O’Brien, C. The Role of MiR-29 Family in TGF-β Driven Fibrosis in Glaucomatous Optic Neuropathy. Int J Mol Sci 2022, 23, 10216. [Google Scholar] [CrossRef]
  57. Olive, V.; Li, Q.; He, L. Mir-17-92: A Polycistronic Oncomir with Pleiotropic Functions. Immunol Rev 2013, 253, 158–166. [Google Scholar] [CrossRef] [PubMed]
  58. Eyholzer, M.; Schmid, S.; Wilkens, L.; Mueller, B.U.; Pabst, T. The Tumour-Suppressive MiR-29a/B1 Cluster Is Regulated by CEBPA and Blocked in Human AML. Br J Cancer 2010, 103, 275–284. [Google Scholar] [CrossRef] [PubMed]
  59. Kriegel, A.J.; Liu, Y.; Fang, Y.; Ding, X.; Liang, M. The MiR-29 Family: Genomics, Cell Biology, and Relevance to Renal and Cardiovascular Injury. Physiol Genomics 2012, 44, 237–244. [Google Scholar] [CrossRef]
  60. Horita, M.; Farquharson, C.; Stephen, L.A. The Role of MiR-29 Family in Disease. J Cell Biochem 2021, 122, 696–715. [Google Scholar] [CrossRef] [PubMed]
  61. Smyth, A.; Callaghan, B.; Willoughby, C.E.; O’Brien, C. The Role of MiR-29 Family in TGF-β Driven Fibrosis in Glaucomatous Optic Neuropathy. Int J Mol Sci 2022, 23, 10216. [Google Scholar] [CrossRef]
  62. Medley, J.C.; Panzade, G.; Zinovyeva, A.Y. MicroRNA Strand Selection: Unwinding the Rules. WIREs RNA 2021, 12. [Google Scholar] [CrossRef] [PubMed]
  63. Lau, N.C.; Lim, L.P.; Weinstein, E.G.; Bartel, D.P. An Abundant Class of Tiny RNAs with Probable Regulatory Roles in Caenorhabditis Elegans. Science (1979) 2001, 294, 858–862. [Google Scholar] [CrossRef] [PubMed]
  64. Bartel, D.P. MicroRNAs. Cell 2004, 116, 281–297. [Google Scholar] [CrossRef]
  65. Kim, V.N. MicroRNA Biogenesis: Coordinated Cropping and Dicing. Nat Rev Mol Cell Biol 2005, 6, 376–385. [Google Scholar] [CrossRef]
  66. Guo, L.; Lu, Z. The Fate of MiRNA* Strand through Evolutionary Analysis: Implication for Degradation As Merely Carrier Strand or Potential Regulatory Molecule? PLoS One 2010, 5, e11387. [Google Scholar] [CrossRef]
  67. Okamura, K.; Liu, N.; Lai, E.C. Distinct Mechanisms for MicroRNA Strand Selection by Drosophila Argonautes. Mol Cell 2009, 36, 431–444. [Google Scholar] [CrossRef] [PubMed]
  68. Luna, C.; Parker, M.; Challa, P.; Gonzalez, P. Long-Term Decrease of Intraocular Pressure in Rats by Viral Delivery of MiR-146a. Transl Vis Sci Technol 2021, 10, 14. [Google Scholar] [CrossRef]
  69. Li, X.; Zhao, F.; Xin, M.; Li, G.; Luna, C.; Li, G.; Zhou, Q.; He, Y.; Yu, B.; Olson, E.; et al. Regulation of Intraocular Pressure by MicroRNA Cluster MiR-143/145. Sci Rep 2017, 7, 915. [Google Scholar] [CrossRef] [PubMed]
  70. Luna, C.; Li, G.; Huang, J.; Qiu, J.; Wu, J.; Yuan, F.; Epstein, D.L.; Gonzalez, P. Regulation of Trabecular Meshwork Cell Contraction and Intraocular Pressure by MiR-200c. PLoS One 2012, 7. [Google Scholar] [CrossRef]
  71. Fuchshofer, R.; Tamm, E.R. The Role of TGF-β in the Pathogenesis of Primary Open-Angle Glaucoma. Cell Tissue Res 2012, 347, 279–290. [Google Scholar] [CrossRef] [PubMed]
  72. Keller, K.E.; Aga, M.; Bradley, J.M.; Kelley, M.J.; Acott, T.S. Extracellular Matrix Turnover and Outflow Resistance. Exp Eye Res 2009, 88, 676–682. [Google Scholar] [CrossRef] [PubMed]
  73. Prendes, M.A.; Harris, A.; Wirostko, B.M.; Gerber, A.L.; Siesky, B. The Role of Transforming Growth Factor β in Glaucoma and the Therapeutic Implications. Br J Ophthalmol 2013, 97, 680–686. [Google Scholar] [CrossRef]
  74. Takahashi, E.; Inoue, T.; Fujimoto, T.; Kojima, S.; Tanihara, H. Epithelial Mesenchymal Transition-like Phenomenon in Trabecular Meshwork Cells. Exp Eye Res 2014, 118, 72–79. [Google Scholar] [CrossRef]
  75. Chakraborthy, M.; Rao, A. A Feedback Loop between TGF-Β1 and ATG5 Mediated by MiR-122-5p Regulates Fibrosis and EMT in Human Trabecular Meshwork Cells. Curr Issues Mol Biol 2023, 45, 2381–2392. [Google Scholar] [CrossRef] [PubMed]
  76. Drewry, M.D.; Challa, P.; Kuchtey, J.G.; Navarro, I.; Helwa, I.; Hu, Y.; Mu, H.; Stamer, W.D.; Kuchtey, R.W.; Liu, Y. Differentially Expressed MicroRNAs in the Aqueous Humor of Patients with Exfoliation Glaucoma or Primary Open-Angle Glaucoma. Hum Mol Genet 2018, 27, 1263–1275. [Google Scholar] [CrossRef] [PubMed]
  77. Cheng, B.; Zhu, Q.; Lin, W.; Wang, L. MicroRNA-122 Inhibits Epithelial-mesenchymal Transition of Hepatic Stellate Cells Induced by the TGF-β1/Smad Signaling Pathway. Exp Ther Med 2018. [Google Scholar] [CrossRef] [PubMed]
  78. Liu, Y.; Song, J.-W.; Lin, J.-Y.; Miao, R.; Zhong, J.-C. Roles of MicroRNA-122 in Cardiovascular Fibrosis and Related Diseases. Cardiovasc Toxicol 2020, 20, 463–473. [Google Scholar] [CrossRef]
  79. Li, G.; Luna, C.; Qiu, J.; Epstein, D.L.; Gonzalez, P. Alterations in MicroRNA Expression in Stress-Induced Cellular Senescence. Mech Ageing Dev 2009, 130, 731–741. [Google Scholar] [CrossRef] [PubMed]
  80. Liu, Y.; Bailey, J.C.; Helwa, I.; Dismuke, W.M.; Cai, J.; Drewry, M.; Brilliant, M.H.; Budenz, D.L.; Christen, W.G.; Chasman, D.I.; et al. A Common Variant in MIR182 Is Associated With Primary Open-Angle Glaucoma in the NEIGHBORHOOD Consortium. Investigative Opthalmology & Visual Science 2016, 57, 4528. [Google Scholar] [CrossRef]
  81. Stafford, M.Y.C.; McKenna, D.J. MiR-182 Is Upregulated in Prostate Cancer and Contributes to Tumor Progression by Targeting MITF. Int J Mol Sci 2023, 24, 1824. [Google Scholar] [CrossRef]
  82. Ichiyama, K.; Dong, C. The Role of MiR-183 Cluster in Immunity. Cancer Lett 2019, 443, 108–114. [Google Scholar] [CrossRef] [PubMed]
  83. Wei, Q.; Lei, R.; Hu, G. Roles of MiR-182 in Sensory Organ Development and Cancer. Thorac Cancer 2015, 6, 2–9. [Google Scholar] [CrossRef] [PubMed]
  84. Chen, Y.; Zhang, Q.; Zhou, Y.; Yang, Z.; Tan, M. Inhibition of MiR-182-5p Attenuates Pulmonary Fibrosis via TGF-β/Smad Pathway. Hum Exp Toxicol 2020, 39, 683–695. [Google Scholar] [CrossRef] [PubMed]
  85. Yu, J.; Lei, R.; Zhuang, X.; Li, X.; Li, G.; Lev, S.; Segura, M.F.; Zhang, X.; Hu, G. MicroRNA-182 Targets SMAD7 to Potentiate TGFβ-Induced Epithelial-Mesenchymal Transition and Metastasis of Cancer Cells. Nat Commun 2016, 7, 13884. [Google Scholar] [CrossRef] [PubMed]
  86. Bhattachariya, A.; Dahan, D.; Ekman, M.; Boettger, T.; Braun, T.; Swärd, K.; Hellstrand, P.; Albinsson, S. Spontaneous Activity and Stretch-Induced Contractile Differentiation Are Reduced in Vascular Smooth Muscle of MiR-143/145 Knockout Mice. Acta Physiologica 2015, 215, 133–143. [Google Scholar] [CrossRef] [PubMed]
  87. Jayaram, H.; Phillips, J.I.; Lozano, D.C.; Choe, T.E.; Cepurna, W.O.; Johnson, E.C.; Morrison, J.C.; Gattey, D.M.; Saugstad, J.A.; Keller, K.E. Comparison of MicroRNA Expression in Aqueous Humor of Normal and Primary Open-Angle Glaucoma Patients Using PCR Arrays: A Pilot Study. Investigative Opthalmology & Visual Science 2017, 58, 2884. [Google Scholar] [CrossRef] [PubMed]
  88. Paterson, M.R.; Kriegel, A.J. MiR-146a/b: A Family with Shared Seeds and Different Roots. Physiol Genomics 2017, 49, 243–252. [Google Scholar] [CrossRef]
  89. Li, G.; Luna, C.; Qiu, J.; Epstein, D.L.; Gonzalez, P. Modulation of Inflammatory Markers by MiR-146a during Replicative Senescence in Trabecular Meshwork Cells. Investigative Opthalmology & Visual Science 2010, 51, 2976. [Google Scholar] [CrossRef] [PubMed]
  90. Su, Y.-L.; Wang, X.; Mann, M.; Adamus, T.P.; Wang, D.; Moreira, D.F.; Zhang, Z.; Ouyang, C.; He, X.; Zhang, B.; et al. Myeloid Cell–Targeted MiR-146a Mimic Inhibits NF-ΚB–Driven Inflammation and Leukemia Progression in Vivo. Blood 2020, 135, 167–180. [Google Scholar] [CrossRef]
  91. Xiang, M.; Birkbak, N.J.; Vafaizadeh, V.; Walker, S.R.; Yeh, J.E.; Liu, S.; Kroll, Y.; Boldin, M.; Taganov, K.; Groner, B.; et al. STAT3 Induction of MiR-146b Forms a Feedback Loop to Inhibit the NF-ΚB to IL-6 Signaling Axis and STAT3-Driven Cancer Phenotypes. Sci Signal 2014, 7. [Google Scholar] [CrossRef]
  92. Bartel, D.P. MicroRNAs: Genomics, Biogenesis, Mechanism, and Function. Cell 2004, 116, 281–297. [Google Scholar] [CrossRef] [PubMed]
  93. Bartel, D.P. MicroRNAs: Target Recognition and Regulatory Functions. Cell 2009, 136, 215–233. [Google Scholar] [CrossRef] [PubMed]
  94. Gregorova, J.; Vychytilova-Faltejskova, P.; Sevcikova, S. Epigenetic Regulation of MicroRNA Clusters and Families during Tumor Development. Cancers 2021, 13, 1333. [Google Scholar] [CrossRef] [PubMed]
  95. Fang, L.L.; Wang, X.H.; Sun, B.F.; Zhang, X.D.; Zhu, X.H.; Yu, Z.J.; Luo, H. Expression, Regulation and Mechanism of Action of the MiR-17-92 Cluster in Tumor Cells (Review). Int J Mol Med 2017, 40, 1624–1630. [Google Scholar] [CrossRef] [PubMed]
  96. Petrocca, F.; Vecchione, A.; Croce, C.M. Emerging Role of MiR-106b-25/MiR-17-92 Clusters in the Control of Transforming Growth Factor β Signaling. Cancer Res 2008, 68, 8191–8194. [Google Scholar] [CrossRef] [PubMed]
  97. Mestdagh, P.; Boström, A.-K.; Impens, F.; Fredlund, E.; Van Peer, G.; De Antonellis, P.; von Stedingk, K.; Ghesquière, B.; Schulte, S.; Dews, M.; et al. The MiR-17-92 MicroRNA Cluster Regulates Multiple Components of the TGF-β Pathway in Neuroblastoma. Mol Cell 2010, 40, 762–773. [Google Scholar] [CrossRef] [PubMed]
  98. Wang, X.; Li, Z.; Bai, J.; Song, W.; Zhang, F. MiR-17-5p Regulates the Proliferation and Apoptosis of Human Trabecular Meshwork Cells by Targeting Phosphatase and Tensin Homolog. Mol Med Rep 2019, 19, 3132–3138. [Google Scholar] [CrossRef]
  99. Tellios, N.; Belrose, J.C.; Tokarewicz, A.C.; Hutnik, C.; Liu, H.; Leask, A.; Motolko, M.; Iijima, M.; Parapuram, S.K. TGF-β Induces Phosphorylation of Phosphatase and Tensin Homolog: Implications for Fibrosis of the Trabecular Meshwork Tissue in Glaucoma. Sci Rep 2017, 7, 812. [Google Scholar] [CrossRef]
  100. Knox, J.; Bou-Gharios, G.; Hamill, K.J.; Willoughby, C.E. MiR-18a-5p Targets Connective Tissue Growth Factor Expression and Inhibits Transforming Growth Factor Β2-Induced Trabecular Meshwork Cell Contractility. Genes 2022, 13, 1500. [Google Scholar] [CrossRef] [PubMed]
  101. Browne, J.G.; Ho, S.L.; Kane, R.; Oliver, N.; Clark, A.F.; O’Brien, C.J.; Crean, J.K. Connective Tissue Growth Factor Is Increased in Pseudoexfoliation Glaucoma. Investigative Opthalmology & Visual Science 2011, 52, 3660. [Google Scholar] [CrossRef]
  102. Junglas, B.; Kuespert, S.; Seleem, A.A.; Struller, T.; Ullmann, S.; Bösl, M.; Bosserhoff, A.; Köstler, J.; Wagner, R.; Tamm, E.R.; et al. Connective Tissue Growth Factor Causes Glaucoma by Modifying the Actin Cytoskeleton of the Trabecular Meshwork. Am J Pathol 2012, 180, 2386–2403. [Google Scholar] [CrossRef] [PubMed]
  103. Jiang, X.P.; Ai, W.B.; Wan, L.Y.; Zhang, Y.Q.; Wu, J.F. The Roles of MicroRNA Families in Hepatic Fibrosis. Cell Biosci 2017, 7. [Google Scholar] [CrossRef] [PubMed]
  104. Cushing, L.; Kuang, P.; Lü, J. The Role of MiR-29 in Pulmonary Fibrosis. Biochemistry and Cell Biology 2015, 93, 109–118. [Google Scholar] [CrossRef] [PubMed]
  105. Luna, C.; Li, G.; Qiu, J.; Epstein, D.L.; Gonzalez, P. Cross-Talk between MiR-29 and Transforming Growth Factor-Betas in Trabecular Meshwork Cells. Investigative Opthalmology & Visual Science 2011, 52, 3567. [Google Scholar] [CrossRef] [PubMed]
  106. Villarreal, G.; Oh, D.-J.; Kang, M.H.; Rhee, D.J. Coordinated Regulation of Extracellular Matrix Synthesis by the MicroRNA-29 Family in the Trabecular Meshwork. Investigative Opthalmology & Visual Science 2011, 52, 3391. [Google Scholar] [CrossRef] [PubMed]
  107. Luna, C.; Li, G.; Qiu, J.; Epstein, D.L.; Gonzalez, P. Role of MiR-29b on the Regulation of the Extracellular Matrix in Human Trabecular Meshwork Cells under Chronic Oxidative Stress. Mol Vis 2009, 15, 2488–2497. [Google Scholar] [PubMed]
  108. MacDonald, W.W.; Swaminathan, S.S.; Heo, J.Y.; Castillejos, A.; Hsueh, J.; Liu, B.J.; Jo, D.; Du, A.; Lee, H.; Kang, M.H.; et al. Effect of SPARC Suppression in Mice, Perfused Human Anterior Segments, and Trabecular Meshwork Cells. Investigative Opthalmology & Visual Science 2022, 63, 8. [Google Scholar] [CrossRef] [PubMed]
  109. Li, N.; Cui, J.; Duan, X.; Chen, H.; Fan, F. Suppression of Type I Collagen Expression by MiR-29b via PI3K, Akt, and Sp1 Pathway in Human Tenon’s Fibroblasts. Investigative Opthalmology & Visual Science 2012, 53, 1670. [Google Scholar] [CrossRef]
  110. Deng, Z.; He, Y.; Yang, X.; Shi, H.; Shi, A.; Lu, L.; He, L. MicroRNA-29: A Crucial Player in Fibrotic Disease. Mol Diagn Ther 2017, 21, 285–294. [Google Scholar] [CrossRef]
  111. Chioccioli, M.; Roy, S.; Newell, R.; Pestano, L.; Dickinson, B.; Rigby, K.; Herazo-Maya, J.; Jenkins, G.; Ian, S.; Saini, G.; et al. A Lung Targeted MiR-29 Mimic as a Therapy for Pulmonary Fibrosis. EBioMedicine 2022, 85, 104304. [Google Scholar] [CrossRef]
  112. O’Brien, J.; Hayder, H.; Zayed, Y.; Peng, C. Overview of MicroRNA Biogenesis, Mechanisms of Actions, and Circulation. Front Endocrinol (Lausanne) 2018, 9. [Google Scholar] [CrossRef]
  113. Yoke-Kqueen, C. Differential MicroRNA Expression and Identification of Putative MiRNA Targets and Pathways in Head and Neck Cancers. Int J Mol Med 2011. [Google Scholar] [CrossRef] [PubMed]
  114. Amirfallah, A.; Knutsdottir, H.; Arason, A.; Hilmarsdottir, B.; Johannsson, O.T.; Agnarsson, B.A.; Barkardottir, R.B.; Reynisdottir, I. Hsa-MiR-21-3p Associates with Breast Cancer Patient Survival and Targets Genes in Tumor Suppressive Pathways. PLoS One 2021, 16, e0260327. [Google Scholar] [CrossRef]
  115. Zhang, T.; Yang, Z.; Kusumanchi, P.; Han, S.; Liangpunsakul, S. Critical Role of MicroRNA-21 in the Pathogenesis of Liver Diseases. Front Med (Lausanne) 2020, 7. [Google Scholar] [CrossRef] [PubMed]
  116. Sen, C.K.; Roy, S. MicroRNA 21 in Tissue Injury and Inflammation. Cardiovasc Res 2012, 96, 230–233. [Google Scholar] [CrossRef]
  117. Hong, Y.; Ye, M.; Wang, F.; Fang, J.; Wang, C.; Luo, J.; Liu, J.; Liu, J.; Liu, L.; Zhao, Q.; et al. MiR-21-3p Promotes Hepatocellular Carcinoma Progression via SMAD7/YAP1 Regulation. Front Oncol 2021, 11. [Google Scholar] [CrossRef]
  118. Krichevsky, A.M.; Gabriely, G. MiR-21: A Small Multi-faceted RNA. J Cell Mol Med 2009, 13, 39–53. [Google Scholar] [CrossRef]
  119. Pink, R.C.; Samuel, P.; Massa, D.; Caley, D.P.; Brooks, S.A.; Carter, D.R.F. The Passenger Strand, MiR-21-3p, Plays a Role in Mediating Cisplatin Resistance in Ovarian Cancer Cells. Gynecol Oncol 2015, 137, 143–151. [Google Scholar] [CrossRef]
  120. Shi, P.; Zhao, X.-D.; Shi, K.-H.; Ding, X.-S.; Tao, H. MiR-21–3p Triggers Cardiac Fibroblasts Pyroptosis in Diabetic Cardiac Fibrosis via Inhibiting Androgen Receptor. Exp Cell Res 2021, 399, 112464. [Google Scholar] [CrossRef]
  121. Zhu, H.; Luo, H.; Li, Y.; Zhou, Y.; Jiang, Y.; Chai, J.; Xiao, X.; You, Y.; Zuo, X. MicroRNA-21 in Scleroderma Fibrosis and Its Function in TGF-β- Regulated Fibrosis-Related Genes Expression. J Clin Immunol 2013, 33, 1100–1109. [Google Scholar] [CrossRef]
  122. Yuan, J.; Chen, H.; Ge, D.; Xu, Y.; Xu, H.; Yang, Y.; Gu, M.; Zhou, Y.; Zhu, J.; Ge, T.; et al. Mir-21 Promotes Cardiac Fibrosis after Myocardial Infarction Via Targeting Smad7. Cellular Physiology and Biochemistry 2017, 42, 2207–2219. [Google Scholar] [CrossRef] [PubMed]
  123. LIU, R.-H.; NING, B.; MA, X.-E.; GONG, W.-M.; JIA, T.-H. Regulatory Roles of MicroRNA-21 in Fibrosis through Interaction with Diverse Pathways (Review). Mol Med Rep 2016, 13, 2359–2366. [Google Scholar] [CrossRef] [PubMed]
  124. Tan, C.; Song, M.; Stamer, W.D.; Qiao, Y.; Chen, X.; Sun, X.; Lei, Y.; Chen, J. MiR-21-5p: A Viable Therapeutic Strategy for Regulating Intraocular Pressure. Exp Eye Res 2020, 200. [Google Scholar] [CrossRef]
  125. Jiao, W.; Leng, X.; Zhou, Q.; Wu, Y.; Sun, L.; Tan, Y.; Ni, H.; Dong, X.; Shen, T.; Liu, Y.; et al. Different MiR-21-3p Isoforms and Their Different Features in Colorectal Cancer. Int J Cancer 2017, 141, 2103–2111. [Google Scholar] [CrossRef] [PubMed]
  126. Wang, Z.; Zeng, Z.; Starkuviene, V.; Erfle, H.; Kan, K.; Zhang, J.; Gunkel, M.; Sticht, C.; Rahbari, N.; Keese, M. MicroRNAs Influence the Migratory Ability of Human Umbilical Vein Endothelial Cells. Genes (Basel) 2022, 13, 640. [Google Scholar] [CrossRef] [PubMed]
  127. Zheng, F.; Ye, C.; Ge, R.; Wang, Y.; Tian, X.-L.; Chen, Q.; Li, Y.-H.; Zhu, G.-Q.; Zhou, B. MiR-21-3p in Extracellular Vesicles from Vascular Fibroblasts of Spontaneously Hypertensive Rat Promotes Proliferation and Migration of Vascular Smooth Muscle Cells. Life Sci 2023, 330, 122023. [Google Scholar] [CrossRef] [PubMed]
  128. Zhang, Q.; He, C.; Li, R.; Ke, Y.; Sun, K.; Wang, J. MiR-708 and MiR-335-3p Inhibit the Apoptosis of Retinal Ganglion Cells Through Suppressing Autophagy. Journal of Molecular Neuroscience 2021, 71, 284–292. [Google Scholar] [CrossRef]
  129. Carvalho de Oliveira, J.; Mathias, C.; Oliveira, V.C.; Pezuk, J.A.; Brassesco, M.S. The Double Face of MiR-708: A Pan-Cancer Player with Dissociative Identity Disorder. Genes 2022, 13, 2375. [Google Scholar] [CrossRef]
  130. Monteleone, N.J.; Lutz, C.S. MiR-708-5p: A MicroRNA with Emerging Roles in Cancer. Oncotarget 2017, 8, 71292–71316. [Google Scholar] [CrossRef]
  131. Kefaloyianni, E.; Muthu, M.L.; Kaeppler, J.; Sun, X.; Sabbisetti, V.; Chalaris, A.; Rose-John, S.; Wong, E.; Sagi, I.; Waikar, S.S.; et al. ADAM17 Substrate Release in Proximal Tubule Drives Kidney Fibrosis. JCI Insight 2016, 1. [Google Scholar] [CrossRef]
  132. Arribas, J.; Esselens, C. ADAM17 as a Therapeutic Target in Multiple Diseases. Curr Pharm Des 2009, 15, 2319–2335. [Google Scholar] [CrossRef] [PubMed]
  133. Scheller, J.; Chalaris, A.; Garbers, C.; Rose-John, S. ADAM17: A Molecular Switch to Control Inflammation and Tissue Regeneration. Trends Immunol 2011, 32, 380–387. [Google Scholar] [CrossRef] [PubMed]
  134. Choi, J.A.; Karnam, S.; Skiba, N.; Maddala, R.; Challa, P.; Vann, R.; Rao, V. Vasorin, an Antagonist of TGF-β Is Decreased in Glaucoma Patients. Invest Ophthalmol Vis Sci 2021, 62, 1638–1638. [Google Scholar]
  135. Ashok, A.; Chaudhary, S.; Rana, N.A.; Kritikos, A.; Ayyagari, R.V.; Singh, N. The Prion Protein as a Mediator of Amyloid-β Toxicity in Retinal and Glaucomatous Degeneration Associated with Alzheimer’s Disease. Invest Ophthalmol Vis Sci 2020, 61, 244–244. [Google Scholar]
  136. Liu, B.; Li, R.; Zhang, J.; Meng, C.; Zhang, J.; Song, X.; Lv, C. MicroRNA-708-3p as a Potential Therapeutic Target via the ADAM17-GATA/STAT3 Axis in Idiopathic Pulmonary Fibrosis. Exp Mol Med 2018, 50, e465–e465. [Google Scholar] [CrossRef] [PubMed]
  137. Leppäranta, O.; Pulkkinen, V.; Koli, K.; Vähätalo, R.; Salmenkivi, K.; Kinnula, V.L.; Heikinheimo, M.; Myllärniemi, M. Transcription Factor GATA-6 Is Expressed in Quiescent Myofibroblasts in Idiopathic Pulmonary Fibrosis. Am J Respir Cell Mol Biol 2010, 42, 626–632. [Google Scholar] [CrossRef]
  138. Kimura, T.; Ishii, Y.; Yoh, K.; Morishima, Y.; Iizuka, T.; Kiwamoto, T.; Matsuno, Y.; Homma, S.; Nomura, A.; Sakamoto, T.; et al. Overexpression of the Transcription Factor GATA-3 Enhances the Development of Pulmonary Fibrosis. Am J Pathol 2006, 169, 96–104. [Google Scholar] [CrossRef]
  139. Pedroza, M.; Le, T.T.; Lewis, K.; Karmouty-Quintana, H.; To, S.; George, A.T.; Blackburn, M.R.; Tweardy, D.J.; Agarwal, S.K. STAT-3 Contributes to Pulmonary Fibrosis through Epithelial Injury and Fibroblast-myofibroblast Differentiation. The FASEB Journal 2016, 30, 129–140. [Google Scholar] [CrossRef]
  140. Lee, J.; Guan, W.; Han, S.; Hong, D.; Kim, L.; Kim, H. Micro <scp>RNA</scp>-708-3p Mediates Metastasis and Chemoresistance through Inhibition of Epithelial-to-mesenchymal Transition in Breast Cancer. Cancer Sci 2018, 109, 1404–1413. [Google Scholar] [CrossRef]
  141. Bartel, D.P. Metazoan MicroRNAs. Cell 2018, 173, 20–51. [Google Scholar] [CrossRef]
  142. Kehl, T.; Kern, F.; Backes, C.; Fehlmann, T.; Stöckel, D.; Meese, E.; Lenhof, H.-P.; Keller, A. MiRPathDB 2.0: A Novel Release of the MiRNA Pathway Dictionary Database. Nucleic Acids Res 2020, 48, D142–D147. [Google Scholar] [CrossRef] [PubMed]
  143. Suzuki, H. MicroRNA Control of TGF-β Signaling. Int J Mol Sci 2018, 19, 1901. [Google Scholar] [CrossRef]
  144. Zhang, Q.; Ye, H.; Xiang, F.; Song, L.-J.; Zhou, L.-L.; Cai, P.-C.; Zhang, J.-C.; Yu, F.; Shi, H.-Z.; Su, Y.; et al. MiR-18a-5p Inhibits Sub-Pleural Pulmonary Fibrosis by Targeting TGF-β Receptor II. Molecular Therapy 2017, 25, 728–738. [Google Scholar] [CrossRef] [PubMed]
  145. Lian, C.; Tao, T.; Su, P.; Liao, Z.; Wang, X.; Lei, Y.; Zhao, P.; Liu, L. Targeting MiR-18a Sensitizes Chondrocytes to Anticytokine Therapy to Prevent Osteoarthritis Progression. Cell Death Dis 2020, 11, 947. [Google Scholar] [CrossRef] [PubMed]
  146. Krutilina, R.; Sun, W.; Sethuraman, A.; Brown, M.; Seagroves, T.N.; Pfeffer, L.M.; Ignatova, T.; Fan, M. MicroRNA-18a Inhibits Hypoxia-Inducible Factor 1α Activity and Lung Metastasis in Basal Breast Cancers. Breast Cancer Research 2014, 16, R78. [Google Scholar] [CrossRef] [PubMed]
  147. Xu, P.; Li, Z.; Wang, Y.; Yu, X.; Shao, X.; Li, Y.; Peng, C.; Zhao, Y.; Wang, Y.-L. MiR-18a Contributes to Preeclampsia by Downregulating Smad2 (Full Length) and Reducing TGF-β Signaling. Mol Ther Nucleic Acids 2020, 22, 542–556. [Google Scholar] [CrossRef] [PubMed]
  148. Li, T.; Wu, Y.; Liu, D.; Zhuang, L. MicroRNA-18a-5p Represses Scar Fibroblast Proliferation and Extracellular Matrix Deposition through Regulating Smad2 Expression. Exp Ther Med 2021, 22, 1318. [Google Scholar] [CrossRef]
  149. Lee, M.; Goraya, N.; Kim, S.; Cho, S. Hippo-yap Signaling in Ocular Development and Disease. Developmental Dynamics 2018, 247, 794–806. [Google Scholar] [CrossRef]
  150. Zhu, J.; Lin, S.; Ye, J. YAP and TAZ, the Conductors That Orchestrate Eye Development, Homeostasis, and Disease. J Cell Physiol 2019, 234, 246–258. [Google Scholar] [CrossRef]
  151. Rezaei, T.; Amini, M.; Hashemi, Z.S.; Mansoori, B.; Rezaei, S.; Karami, H.; Mosafer, J.; Mokhtarzadeh, A.; Baradaran, B. MicroRNA-181 Serves as a Dual-Role Regulator in the Development of Human Cancers. Free Radic Biol Med 2020, 152, 432–454. [Google Scholar] [CrossRef]
  152. Chen, M.; Wang, M.; Xu, S.; Guo, X.; Jiang, J. Upregulation of MiR-181c Contributes to Chemoresistance in Pancreatic Cancer by Inactivating the Hippo Signaling Pathway. Oncotarget 2015, 6, 44466–44479. [Google Scholar] [CrossRef] [PubMed]
  153. Kubelac, P.; Braicu, C.; Raduly, L.; Chiroi, P.; Nutu, A.; Cojocneanu, R.; Budisan, L.; Berindan-Neagoe, I.; Achimas-Cadariu, P. Comprehensive Analysis of the Expression of Key Genes Related to Hippo Signaling and Their Prognosis Impact in Ovarian Cancer. Diagnostics 2021, 11, 344. [Google Scholar] [CrossRef] [PubMed]
  154. Wu, S.; Huang, J.; Dong, J.; Pan, D. Hippo Encodes a Ste-20 Family Protein Kinase That Restricts Cell Proliferation and Promotes Apoptosis in Conjunction with Salvador and Warts. Cell 2003, 114, 445–456. [Google Scholar] [CrossRef] [PubMed]
  155. Zhao, B.; Wei, X.; Li, W.; Udan, R.S.; Yang, Q.; Kim, J.; Xie, J.; Ikenoue, T.; Yu, J.; Li, L.; et al. Inactivation of YAP Oncoprotein by the Hippo Pathway Is Involved in Cell Contact Inhibition and Tissue Growth Control. Genes Dev 2007, 21, 2747–2761. [Google Scholar] [CrossRef]
  156. Wang, Y.; Xu, X.; Maglic, D.; Dill, M.T.; Mojumdar, K.; Ng, P.K.-S.; Jeong, K.J.; Tsang, Y.H.; Moreno, D.; Bhavana, V.H.; et al. Comprehensive Molecular Characterization of the Hippo Signaling Pathway in Cancer. Cell Rep 2018, 25, 1304–1317. [Google Scholar] [CrossRef] [PubMed]
  157. Qin, Z.; Xia, W.; Fisher, G.J.; Voorhees, J.J.; Quan, T. YAP/TAZ Regulates TGF-β/Smad3 Signaling by Induction of Smad7 via AP-1 in Human Skin Dermal Fibroblasts. Cell Communication and Signaling 2018, 16, 18. [Google Scholar] [CrossRef] [PubMed]
  158. Hiemer, S.E.; Szymaniak, A.D.; Varelas, X. The Transcriptional Regulators TAZ and YAP Direct Transforming Growth Factor β-Induced Tumorigenic Phenotypes in Breast Cancer Cells. Journal of Biological Chemistry 2014, 289, 13461–13474. [Google Scholar] [CrossRef]
  159. Varelas, X.; Sakuma, R.; Samavarchi-Tehrani, P.; Peerani, R.; Rao, B.M.; Dembowy, J.; Yaffe, M.B.; Zandstra, P.W.; Wrana, J.L. TAZ Controls Smad Nucleocytoplasmic Shuttling and Regulates Human Embryonic Stem-Cell Self-Renewal. Nat Cell Biol 2008, 10, 837–848. [Google Scholar] [CrossRef]
  160. Li, H.; Raghunathan, V.; Stamer, W.D.; Ganapathy, P.S.; Herberg, S. Extracellular Matrix Stiffness and TGFβ2 Regulate YAP/TAZ Activity in Human Trabecular Meshwork Cells. Front Cell Dev Biol 2022, 10. [Google Scholar] [CrossRef]
  161. Browne, J.G.; Ho, S.L.; Kane, R.; Oliver, N.; Clark, A.F.; O’Brien, C.J.; Crean, J.K. Connective Tissue Growth Factor Is Increased in Pseudoexfoliation Glaucoma. Investigative Opthalmology & Visual Science 2011, 52, 3660. [Google Scholar] [CrossRef]
  162. Junglas, B.; Kuespert, S.; Seleem, A.A.; Struller, T.; Ullmann, S.; Bösl, M.; Bosserhoff, A.; Köstler, J.; Wagner, R.; Tamm, E.R.; et al. Connective Tissue Growth Factor Causes Glaucoma by Modifying the Actin Cytoskeleton of the Trabecular Meshwork. American Journal of Pathology 2012, 180, 2386–2403. [Google Scholar] [CrossRef] [PubMed]
  163. Sun, Q.; Zhao, X.; Liu, X.; Wang, Y.; Huang, J.; Jiang, B.; Chen, Q.; Yu, J. MiR-146a Functions as a Tumor Suppressor in Prostate Cancer by Targeting Rac1. Prostate 2014, 74, 1613–1621. [Google Scholar] [CrossRef] [PubMed]
  164. Chen, Y.; Yuan, B.; Chen, G.; Zhang, L.; Zhuang, Y.; Niu, H.; Zeng, Z. Circular RNA RSF1 Promotes Inflammatory and Fibrotic Phenotypes of Irradiated Hepatic Stellate Cell by Modulating MiR-146a-5p. J Cell Physiol 2020, 235, 8270–8282. [Google Scholar] [CrossRef] [PubMed]
  165. Feng, T.; Li, K.; Zheng, P.; Wang, Y.; Lv, Y.; Shen, L.; Chen, Y.; Xue, Z.; Li, B.; Jin, L.; et al. Weighted Gene Coexpression Network Analysis Identified MicroRNA Coexpression Modules and Related Pathways in Type 2 Diabetes Mellitus. Oxid Med Cell Longev 2019, 2019, 1–12. [Google Scholar] [CrossRef] [PubMed]
  166. Zhang, Y.E. Non-Smad Pathways in TGF-β Signaling. Cell Res 2009, 19, 128–139. [Google Scholar] [CrossRef]
  167. Han, H.; Wecker, T.; Grehn, F.; Schlunck, G. Elasticity-Dependent Modulation of TGF-β Responses in Human Trabecular Meshwork Cells. Investigative Opthalmology & Visual Science 2011, 52, 2889. [Google Scholar] [CrossRef]
  168. Pervan, C.L. Smad-Independent TGF-Β2 Signaling Pathways in Human Trabecular Meshwork Cells. Exp Eye Res 2017, 158, 137–145. [Google Scholar] [CrossRef]
  169. Bradshaw, A.D.; Sage, E.H. SPARC, a Matricellular Protein That Functions in Cellular Differentiation and Tissue Response to Injury. Journal of Clinical Investigation 2001, 107, 1049–1054. [Google Scholar] [CrossRef]
  170. Kang, M.H.; Oh, D.-J.; Kang, J.; Rhee, D.J. Regulation of SPARC by Transforming Growth Factor Β2 in Human Trabecular Meshwork. Investigative Opthalmology & Visual Science 2013, 54, 2523. [Google Scholar] [CrossRef]
  171. Inoue-Mochita, M.; Inoue, T.; Kojima, S.; Futakuchi, A.; Fujimoto, T.; Sato-Ohira, S.; Tsutsumi, U.; Tanihara, H. Interleukin-6–Mediated Trans-Signaling Inhibits Transforming Growth Factor-β Signaling in Trabecular Meshwork Cells. Journal of Biological Chemistry 2018, 293, 10975–10984. [Google Scholar] [CrossRef]
  172. Liton, P.B.; Li, G.; Luna, C.; Gonzalez, P.; Epstein, D.L. Cross-Talk between TGF-Beta1 and IL-6 in Human Trabecular Meshwork Cells. Mol Vis 2009, 15, 326–334. [Google Scholar] [PubMed]
  173. Naidu, S.; Shi, L.; Magee, P.; Middleton, J.D.; Laganá, A.; Sahoo, S.; Leong, H.S.; Galvin, M.; Frese, K.; Dive, C.; et al. PDGFR-Modulated MiR-23b Cluster and MiR-125a-5p Suppress Lung Tumorigenesis by Targeting Multiple Components of KRAS and NF-KB Pathways. Sci Rep 2017, 7, 15441. [Google Scholar] [CrossRef] [PubMed]
  174. Gauthier, A.C.; Liu, J. Epigenetics and Signaling Pathways in Glaucoma. Biomed Res Int 2017, 2017, 1–12. [Google Scholar] [CrossRef] [PubMed]
  175. Han, H.; Wecker, T.; Grehn, F.; Schlunck, G. Elasticity-Dependent Modulation of TGF-β Responses in Human Trabecular Meshwork Cells. Investigative Opthalmology & Visual Science 2011, 52, 2889. [Google Scholar] [CrossRef] [PubMed]
  176. Song, G.; Ouyang, G.; Bao, S. The Activation of Akt/PKB Signaling Pathway and Cell Survival. J Cell Mol Med 2005, 9, 59–71. [Google Scholar] [CrossRef] [PubMed]
  177. Alvarado, J.; Murphy, C.; Juster, R. Trabecular Meshwork Cellularity in Primary Open-Angle Glaucoma and Nonglaucomatous Normals. Ophthalmology 1984, 91, 564–579. [Google Scholar] [CrossRef] [PubMed]
  178. Baleriola, J.; García-Feijoo, J.; Martínez-de-la-Casa, J.M.; Fernández-Cruz, A.; de la Rosa, E.J.; Fernández-Durango, R. Apoptosis in the Trabecular Meshwork of Glaucomatous Patients. Mol Vis 2008, 14, 1513–1516. [Google Scholar]
  179. Kim, E.H.; Jo, Y.; Sai, S.; Park, M.-J.; Kim, J.-Y.; Kim, J.S.; Lee, Y.-J.; Cho, J.-M.; Kwak, S.-Y.; Baek, J.-H.; et al. Tumor-Treating Fields Induce Autophagy by Blocking the Akt2/MiR29b Axis in Glioblastoma Cells. Oncogene 2019, 38, 6630–6646. [Google Scholar] [CrossRef] [PubMed]
  180. Wang, L.; Wu, W.; Chen, J.; Li, Y.; Xu, M.; Cai, Y. MiR-122 and MiR-199 Synergistically Promote Autophagy In oral Lichen Planus by Targeting the Akt/MTOR Pathway. Int J Mol Med 2019. [Google Scholar] [CrossRef]
  181. Ganesan, H.; Nandy, S.K.; Banerjee, A.; Pathak, S.; Zhang, H.; Sun, X.-F. RNA-Interference-Mediated MiR-122-Based Gene Regulation in Colon Cancer, a Structural In Silico Analysis. Int J Mol Sci 2022, 23, 15257. [Google Scholar] [CrossRef]
  182. Zhong, Y.; Li, L.; Chen, Z.; Diao, S.; He, Y.; Zhang, Z.; Zhang, H.; Yuan, X.; Li, J. MIR143 Inhibits Steroidogenesis and Induces Apoptosis Repressed by H3K27me3 in Granulosa Cells. Front Cell Dev Biol 2020, 8. [Google Scholar] [CrossRef] [PubMed]
  183. Weeraratne, S.D.; Amani, V.; Teider, N.; Pierre-Francois, J.; Winter, D.; Kye, M.J.; Sengupta, S.; Archer, T.; Remke, M.; Bai, A.H.C.; et al. Pleiotropic Effects of MiR-183~96~182 Converge to Regulate Cell Survival, Proliferation and Migration in Medulloblastoma. Acta Neuropathol 2012, 123, 539–552. [Google Scholar] [CrossRef] [PubMed]
  184. Lee, Y.; Bernstock, J.D.; Klimanis, D.; Hallenbeck, J.M. Akt Protein Kinase, MiR-200/MiR-182 Expression and Epithelial-Mesenchymal Transition Proteins in Hibernating Ground Squirrels. Front Mol Neurosci 2018, 11. [Google Scholar] [CrossRef] [PubMed]
  185. Honardoost, M.; Soleimani, M.; Arefian, E.; Sarookhani, M. reza Expression Change of MiR-214 and MiR-135 during Muscle Differentiation. Cell J 2015, 17, 461–470. [Google Scholar]
  186. Guo, P.; Lan, J.; Ge, J.; Nie, Q.; Mao, Q.; Qiu, Y. MiR-708 Acts as a Tumor Suppressor in Human Glioblastoma Cells. Oncol Rep 2013, 30, 870–876. [Google Scholar] [CrossRef]
  187. Saini, S.; Majid, S.; Shahryari, V.; Arora, S.; Yamamura, S.; Chang, I.; Zaman, M.S.; Deng, G.; Tanaka, Y.; Dahiya, R. MiRNA-708 Control of CD44(+) Prostate Cancer-Initiating Cells. Cancer Res 2012, 72, 3618–3630. [Google Scholar] [CrossRef] [PubMed]
  188. Ronen, S.; Abbott, D.W.; Kravtsov, O.; Abdelkader, A.; Xu, Y.; Banerjee, A.; Iczkowski, K.A. PTEN Loss and P27 Loss Differ among Morphologic Patterns of Prostate Cancer, Including Cribriform. Hum Pathol 2017, 65, 85–91. [Google Scholar] [CrossRef]
  189. Feng, Y.; Zou, W.; Hu, C.; Li, G.; Zhou, S.; He, Y.; Ma, F.; Deng, C.; Sun, L. Modulation of CASC2/MiR-21/PTEN Pathway Sensitizes Cervical Cancer to Cisplatin. Arch Biochem Biophys 2017, 623–624, 20–30. [Google Scholar] [CrossRef] [PubMed]
  190. Gao, X.; Qin, T.; Mao, J.; Zhang, J.; Fan, S.; Lu, Y.; Sun, Z.; Zhang, Q.; Song, B.; Li, L. PTENP1/MiR-20a/PTEN Axis Contributes to Breast Cancer Progression by Regulating PTEN via PI3K/AKT Pathway. J Exp Clin Cancer Res 2019, 38, 256. [Google Scholar] [CrossRef]
  191. Yuan, J.; Su, Z.; Gu, W.; Shen, X.; Zhao, Q.; Shi, L.; Jin, C.; Wang, X.; Cong, H.; Ju, S. MiR-19b and MiR-20a Suppress Apoptosis, Promote Proliferation and Induce Tumorigenicity of Multiple Myeloma Cells by Targeting PTEN. Cancer Biomark 2019, 24, 279–289. [Google Scholar] [CrossRef]
  192. Shi, L.; Zhu, W.; Huang, Y.; Zhuo, L.; Wang, S.; Chen, S.; Zhang, B.; Ke, B. Cancer-Associated Fibroblast-Derived Exosomal MicroRNA-20a Suppresses the PTEN/PI3K-AKT Pathway to Promote the Progression and Chemoresistance of Non-Small Cell Lung Cancer. Clin Transl Med 2022, 12, e989. [Google Scholar] [CrossRef] [PubMed]
  193. Tian, D.; Xiang, Y.; Tang, Y.; Ge, Z.; Li, Q.; Zhang, Y. Circ-ADAM9 Targeting PTEN and ATG7 Promotes Autophagy and Apoptosis of Diabetic Endothelial Progenitor Cells by Sponging Mir-20a-5p. Cell Death Dis 2020, 11, 526. [Google Scholar] [CrossRef] [PubMed]
  194. Chen, Y.; Zhang, L.; Li, E.; Zhang, G.; Hou, Y.; Yuan, W.; Qu, W.; Ding, L. Long-Chain Non-Coding RNA HOTAIR Promotes the Progression of Osteoarthritis via Sponging MiR-20b/PTEN Axis. Life Sci 2020, 253, 117685. [Google Scholar] [CrossRef] [PubMed]
  195. Zhang, M.; Jiang, Y.; Guo, X.; Zhang, B.; Wu, J.; Sun, J.; Liang, H.; Shan, H.; Zhang, Y.; Liu, J.; et al. Long Non-Coding RNA Cardiac Hypertrophy-Associated Regulator Governs Cardiac Hypertrophy via Regulating MiR-20b and the Downstream PTEN/AKT Pathway. J Cell Mol Med 2019, 23, 7685–7698. [Google Scholar] [CrossRef] [PubMed]
  196. Xia, T.; Dong, S.; Tian, J. MiR-29b Promotes the Osteogenic Differentiation of Mesenchymal Stem Cells Derived from Human Adipose Tissue via the PTEN/AKT/Β-catenin Signaling Pathway. Int J Mol Med 2020, 46, 709–717. [Google Scholar] [CrossRef] [PubMed]
  197. Xiao, X.; Li, W.; Xu, Z.; Sun, Z.; Ye, H.; Wu, Y.; Zhang, Y.; Xie, L.; Jiang, D.; Jia, R.; et al. Extracellular Vesicles from Human Umbilical Cord Mesenchymal Stem Cells Reduce Lipopolysaccharide-Induced Spinal Cord Injury Neuronal Apoptosis by Mediating MiR-29b-3p/PTEN. Connect Tissue Res 2022, 63, 634–649. [Google Scholar] [CrossRef]
  198. Suo, H.-B.; Zhang, K.-C.; Zhao, J. MiR-200a Promotes Cell Invasion and Migration of Ovarian Carcinoma by Targeting PTEN. Eur Rev Med Pharmacol Sci 2018, 22, 4080–4089. [Google Scholar] [CrossRef]
  199. Xu, M.; Wang, G.; Zhou, H.; Cai, J.; Li, P.; Zhou, M.; Lu, Y.; Jiang, X.; Huang, H.; Zhang, Y.; et al. TGF-Β1-MiR-200a-PTEN Induces Epithelial-Mesenchymal Transition and Fibrosis of Pancreatic Stellate Cells. Mol Cell Biochem 2017, 431, 161–168. [Google Scholar] [CrossRef]
  200. Li, Y.; Sun, J.; Cai, Y.; Jiang, Y.; Wang, X.; Huang, X.; Yin, Y.; Li, H. MiR-200a Acts as an Oncogene in Colorectal Carcinoma by Targeting PTEN. Exp Mol Pathol 2016, 101, 308–313. [Google Scholar] [CrossRef]
  201. Morgan, J.T.; Raghunathan, V.K.; Chang, Y.-R.; Murphy, C.J.; Russell, P. Wnt Inhibition Induces Persistent Increases in Intrinsic Stiffness of Human Trabecular Meshwork Cells. Exp Eye Res 2015, 132, 174–178. [Google Scholar] [CrossRef]
  202. Raghunathan, V.K.; Morgan, J.T.; Dreier, B.; Reilly, C.M.; Thomasy, S.M.; Wood, J.A.; Ly, I.; Tuyen, B.C.; Hughbanks, M.; Murphy, C.J.; et al. Role of Substratum Stiffness in Modulating Genes Associated with Extracellular Matrix and Mechanotransducers YAP and TAZ. Investigative Opthalmology & Visual Science 2013, 54, 378. [Google Scholar] [CrossRef] [PubMed]
  203. Mao, W.; Millar, J.C.; Wang, W.-H.; Silverman, S.M.; Liu, Y.; Wordinger, R.J.; Rubin, J.S.; Pang, I.-H.; Clark, A.F. Existence of the Canonical Wnt Signaling Pathway in the Human Trabecular Meshwork. Investigative Opthalmology & Visual Science 2012, 53, 7043. [Google Scholar] [CrossRef] [PubMed]
  204. Wang, J.; Zhao, J.; Zhu, J.; Zhang, S. Hypoxic Non-Small-Cell Lung Cancer Cell-Secreted Exosomal MicroRNA-582-3p Drives Cancer Cell Malignant Phenotypes by Targeting Secreted Frizzled-Related Protein 1. Cancer Manag Res 2020, 12, 10151–10161. [Google Scholar] [CrossRef] [PubMed]
  205. Yang, M.; Ju, L.; Li, C.; Cheng, H.; Li, N.; Zhang, Q.; Sun, S.; Ding, L.; Sui, X.; Zhang, C.; et al. MiR-582-3p Participates in the Regulation of Biological Behaviors of A549 Cells by Ambient PM2.5 Exposure. Environmental Science and Pollution Research 2022, 29, 13624–13634. [Google Scholar] [CrossRef] [PubMed]
  206. Fang, L.; Cai, J.; Chen, B.; Wu, S.; Li, R.; Xu, X.; Yang, Y.; Guan, H.; Zhu, X.; Zhang, L.; et al. Aberrantly Expressed MiR-582-3p Maintains Lung Cancer Stem Cell-like Traits by Activating Wnt/β-Catenin Signalling. Nat Commun 2015, 6, 8640. [Google Scholar] [CrossRef] [PubMed]
  207. Wang, W.H.; McNatt, L.G.; Pang, I.H.; Millar, J.C.; Hellberg, P.E.; Hellberg, M.H.; Steely, H.T.; Rubin, J.S.; Fingert, J.H.; Sheffield, V.C.; et al. Increased Expression of the WNT Antagonist SFRP-1 in Glaucoma Elevates Intraocular Pressure. J Clin Invest 2008, 118, 1056–1064. [Google Scholar] [CrossRef] [PubMed]
  208. Dhamodaran, K.; Baidouri, H.; Sandoval, L.; Raghunathan, V. Wnt Activation After Inhibition Restores Trabecular Meshwork Cells Toward a Normal Phenotype. Investigative Opthalmology & Visual Science 2020, 61, 30. [Google Scholar] [CrossRef] [PubMed]
  209. Zhang, C.; Sanchez, L.U.; Zheng, J.J. Small-Molecules Wnt Inhibitors Modulate the Effect of Dexamethasone on MYOC Expression in Primary Human Trabecular Meshwork Cells. Invest Ophthalmol Vis Sci 2020, 61, 3466. [Google Scholar]
  210. Dobrzycka, M.; Sulewska, A.; Biecek, P.; Charkiewicz, R.; Karabowicz, P.; Charkiewicz, A.; Golaszewska, K.; Milewska, P.; Michalska-Falkowska, A.; Nowak, K.; et al. MiRNA Studies in Glaucoma: A Comprehensive Review of Current Knowledge and Future Perspectives. Int J Mol Sci 2023, 24, 14699. [Google Scholar] [CrossRef]
  211. Tan, C.; Jia, F.; Zhang, P.; Sun, X.; Qiao, Y.; Chen, X.; Wang, Y.; Chen, J.; Lei, Y. A MiRNA Stabilizing Polydopamine Nano-Platform for Intraocular Delivery of MiR-21-5p in Glaucoma Therapy. J Mater Chem B 2021, 9. [Google Scholar] [CrossRef]
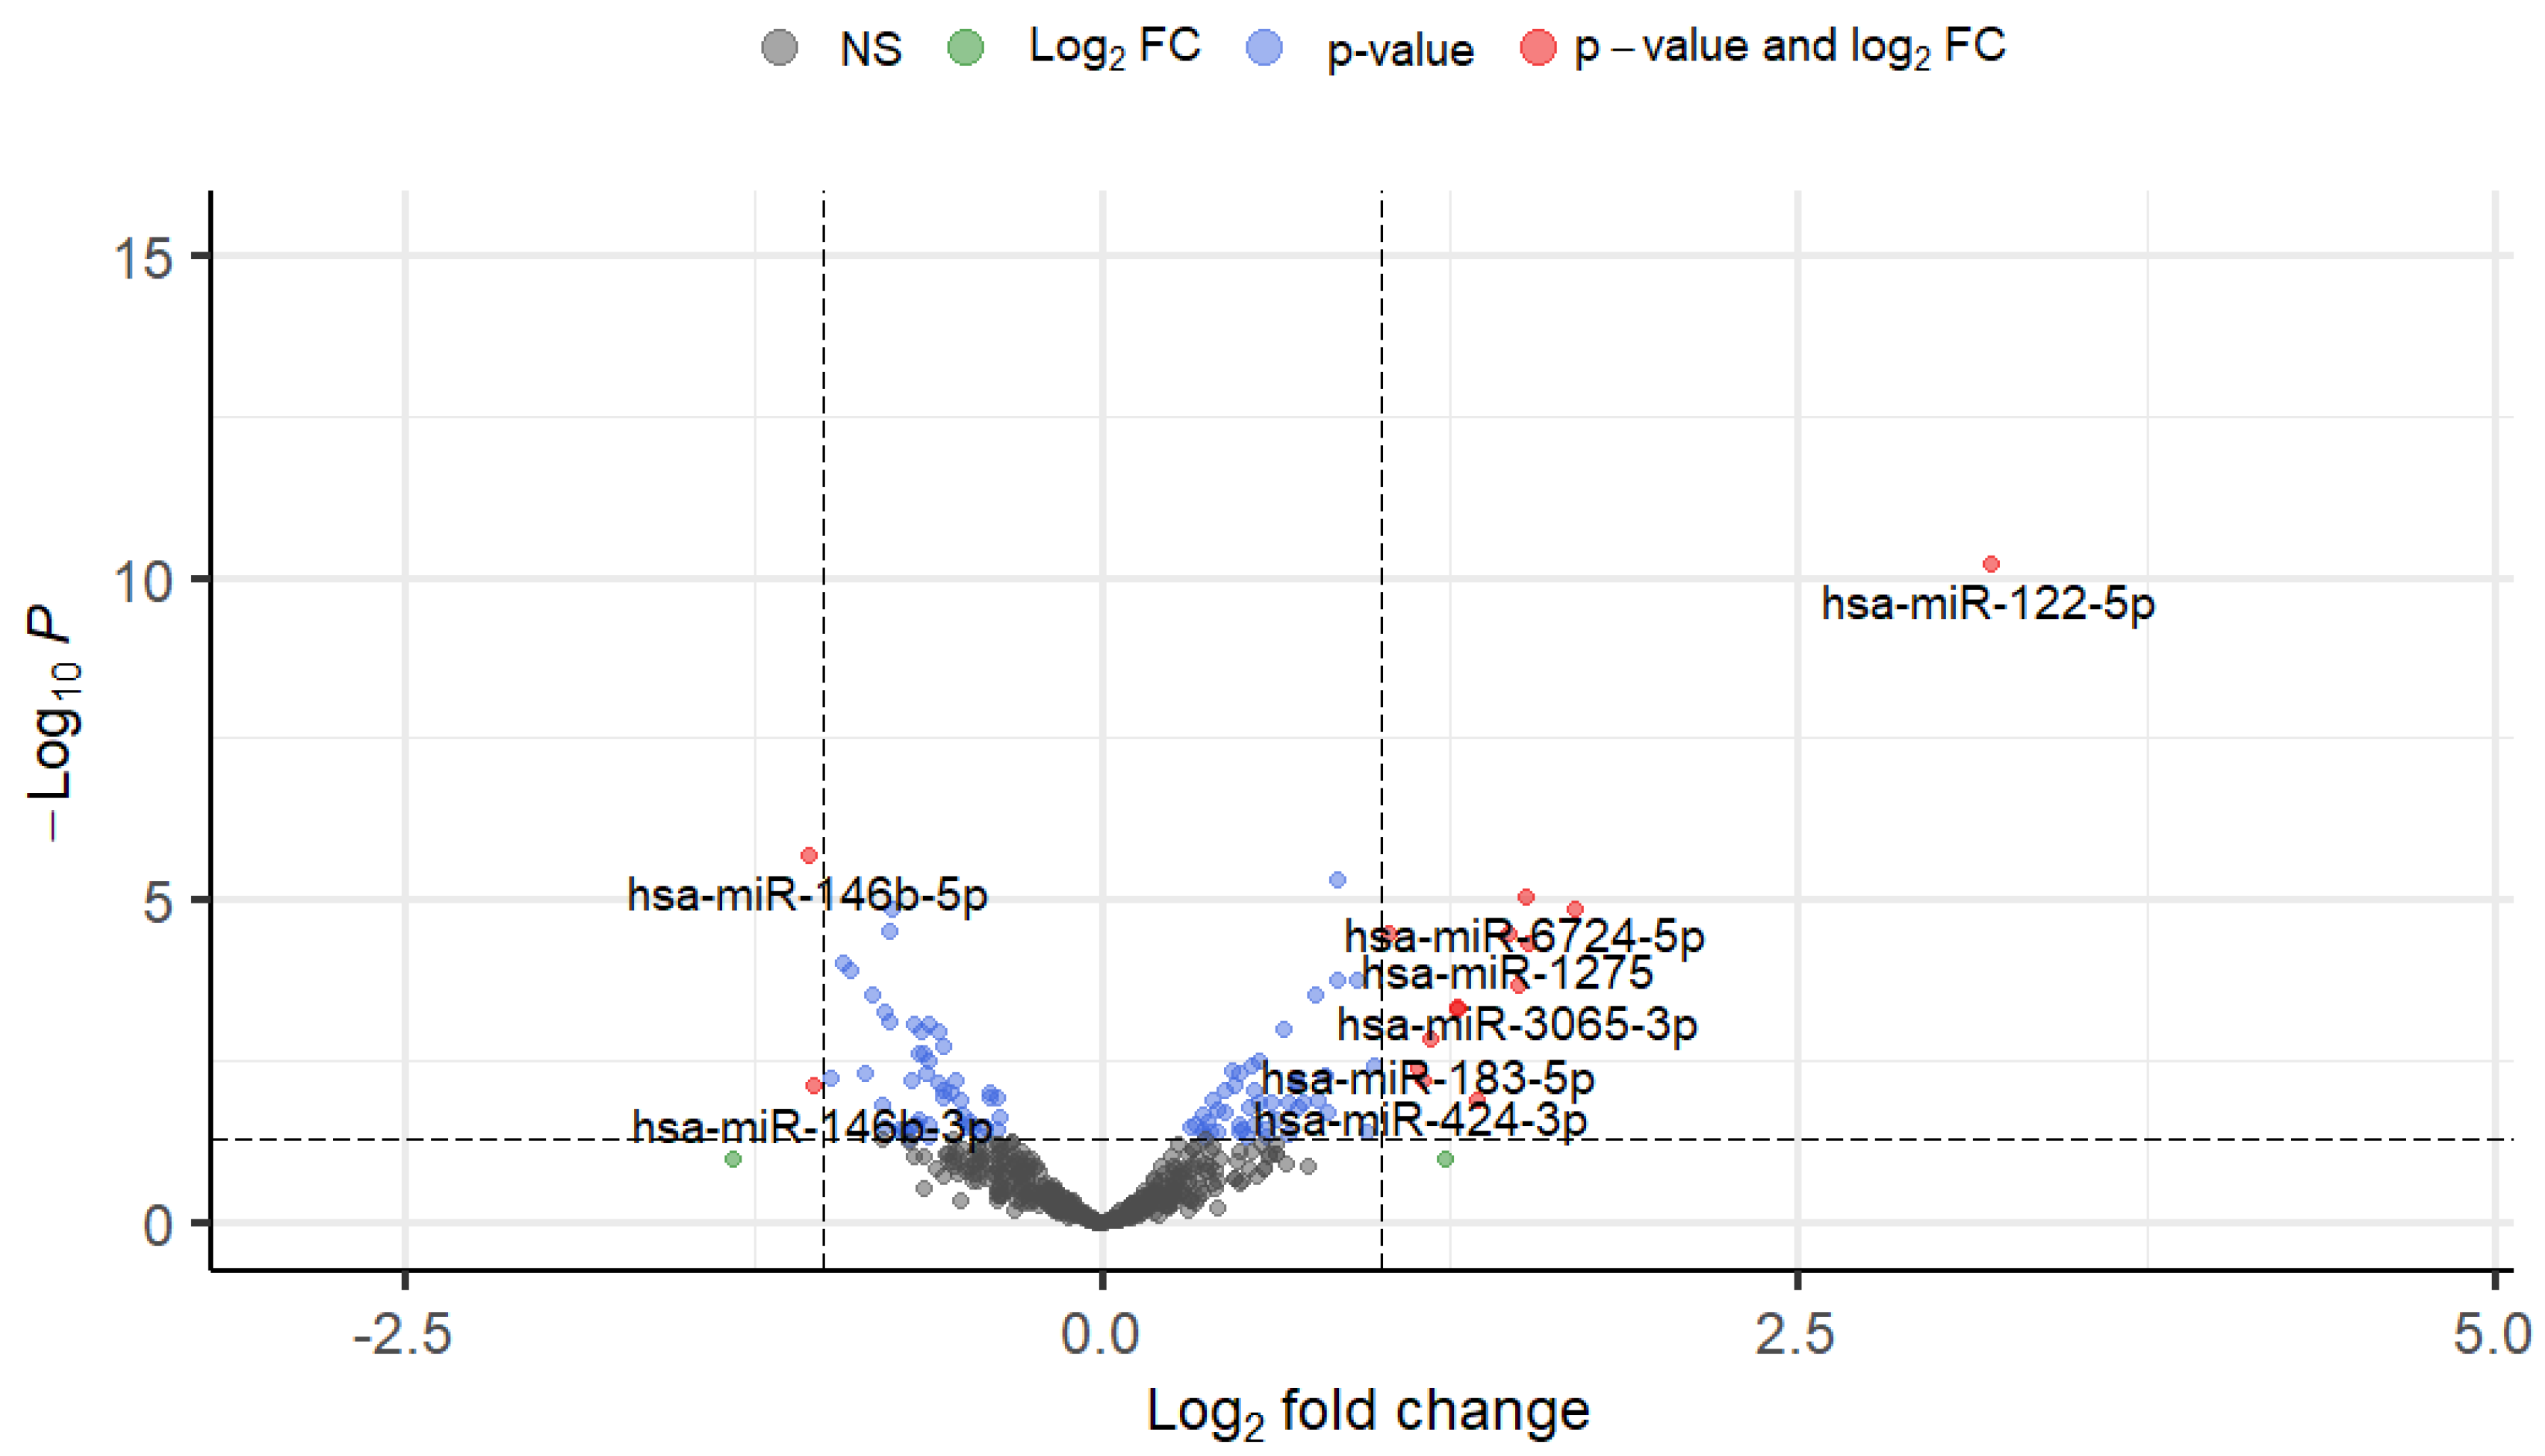
Figure 1. Significant differential expression of miRNAs in response to TGFβ1 treatment (5 ng/mL 24 hours). Volcano plot identifying differentially expressed miRNAs in response to TGFβ1 treatment in TM cells. A threshold was applied using a statistical significance of p < 0.05 and log2FC > 1. Grey and green dots represent miRNAs failing to meet the significance cut-off. Blue dots represent miRNAs that have met the p-value but are below the log2FC criteria. Red dots represent those miRNAs that have met the threshold with a p < 0.05 and log2FC > 1. Those on the left corner of the plot are down-regulated whilst those on the right area of the plot are the up-regulated miRNAs. Grey dots = Not Significant (NS), Red dots = p-value < 0.05 & Log2FC ≥ 1, Blue dots = p-value < 0.05. P-value is represented by the dashed horizontal line and Log2FC is represented by the vertical dashed lines.
Preprints 105395 g001
Figure 2. KEGG pathway analysis of significantly up-regulated TGFβ1-responsive miRNAs in TM cells. KEGG pathway analysis of the significant differentially expressed miRNAs (p < 0.05) was performed. The enrichment plot presents the top 30 KEGG pathway enrichment terms for differentially expressed miRNAs up-regulated in response to TGFβ1 in TM cells. The X-axis label represents Enrichment Score, the amount of differentially expressed genes enriched in the pathway, and Y-axis label represents the enriched pathway. The size and colour of the bubble represent the amount of differentially expressed genes enriched in the pathway and the enrichment significance respectively.
Preprints 105395 g002
Figure 3. KEGG pathway analysis of significantly down-regulated TGFβ1-responsive miRNAs in TM cells. KEGG pathway analysis of the significant differentially expressed miRNAs (p < 0.05) was performed. The enrichment plot presents the top 30 KEGG pathway enrichment terms for differentially expressed miRNAs down-regulated in response to TGFβ1 in TM cells. The X-axis label represents Enrichment Score, the amount of differentially expressed genes enriched in the pathway, and Y-axis label represents the enriched pathway. The size and colour of the bubble represent the amount of differentially expressed genes enriched in the pathway and the enrichment significance respectively.
Preprints 105395 g003
Figure 4. Expression levels of four candidate miRNAs in TGFβ1-stimulated TM cells. Candidate miRNAs were identified as significantly differentially expressed through miRNA-Seq. (A) hsa-miR-122-5p (B) hsa-miR-146b-5p (C) hsa-miR-182-5p (D) hsa-miR-204-5p. Vehicle controls are denoted as “Control” on graphs and TGFβ1 treated cells as “TGFβ1”. Individual values for donors 1, 2 and 3 are shown. Data was normalised to U6 control and analysed using the ΔΔCt method. Circles represent individual donor gene without TGFβ1 treatment and squares represent donors with TGFβ1 treatment. An asterisk denotes significant differential gene expression after treatment (* = p < 0.05, ** = p < 0.005).
Preprints 105395 g004
Figure 5. Significant differential expression of miRNAs in response to TGFβ2 treatment (5 ng/mL 24 hours). Volcano Plot identifying differentially expressed miRNAs in response to TGFβ2 treatment in TM cells. A threshold was applied using a statistical significance of p < 0.05 and log2FC > 1. Grey and green dots represent miRNAs failing to meet the significance cut-off. Blue dots represent miRNAs that have met the p-value but are below the log2FC criteria. Red dots represent those miRNAs that have met the threshold with a p < 0.05 and log2FC > 1. Those on the left corner of the plot are down-regulated whilst those on the right area of the plot are the up-regulated miRNAs. Grey dots - Not Significant (NS), Red dots = p-value < 0.05 & Log2FC ≥ 1, Blue dots = p-value < 0.05. P-value is represented by the dashed horizontal line and Log2FC is represented by the vertical dashed lines.
Preprints 105395 g005
Figure 6. KEGG pathway analysis of significantly up-regulated TGFβ2-responsive miRNAs in TM cells. KEGG pathway analysis of the significant differentially expressed miRNAs (p < 0.05) was performed. The enrichment plot presents the top 30 KEGG pathway enrichment terms for differentially expressed miRNAs up-regulated in response to TGFβ2 in TM cells. The X-axis label represents Enrichment Score, the amount of differentially expressed genes enriched in the pathway, and Y-axis label represents the enriched pathway. The size and colour of the bubble represents the amount of differentially expressed genes enriched in the pathway and the enrichment significance.
Preprints 105395 g006
Figure 7. KEGG pathway analysis of significantly down-regulated TGFβ2-responsive miRNAs in TM cells. KEGG pathway analysis of the significant differentially expressed miRNAs (p < 0.05) was performed. The enrichment plot presents the top 30 KEGG pathway enrichment terms for differentially expressed miRNAs down-regulated in response to TGFβ2 in TM cells. The X-axis label represents Enrichment Score, the amount of differentially expressed genes enriched in the pathway, and Y-axis label represents the enriched pathway. The size and colour of the bubble represents the amount of differentially expressed genes enriched in the pathway and the enrichment significance.
Preprints 105395 g007
Figure 8. Expression levels of five candidate miRNAs in TGFβ2-stimulated TM cells. Candidate miRNAs were identified as significantly differentially expressed through miRNA-Seq. (A) hsa-miR-21-3p (B) hsa-miR-29b-3p (C) hsa-miR-145-5p (D) hsa-miR-204-5p. Vehicle controls are denoted as “Control” on graphs and TGFβ2 treated cells as “TGFβ2”. Individual values for donors 1, 2 and 3 are shown. Data was normalised to U6 control and analysed using the ΔΔCt method. Circles represent individual donor gene without TGFβ2 treatment and squares represent donors with TGFβ2 treatment. An asterisk denotes significant differential gene expression after treatment (* = p < 0.05, ** = p < 0.005).
Preprints 105395 g008
Figure 14. Expression levels of miR-708-5p and miR-708-3p in TGFβ1 and β2-stimulated TM cells. (A) hsa-miR-708-3p (B) hsa-miR-708-5p. Individual values for donors 1, 2 and 3 are shown. Data was normalised to U6 control and analysed using the ΔΔCt method. Circles represent individual donor gene without TGFβ treatment and squares represent donors with TGFβ treatment. An asterisk denotes significant differential gene expression after treatment (* = p < 0.05, *** = p < 0.0005).
Preprints 105395 g014
Figure 15. Expression levels of miR-21-3p and miR-21-5p in TGFβ1 and β2-stimulated TM cells. (A) hsa-miR-21-3p (B) hsa-miR-21-5p. Individual values for donors 1, 2 and 3 are shown. Data was normalised to U6 control and analysed using the ΔΔCt method. Circles represent individual donor gene without TGFβ1 treatment and squares represent donors with TGFβ1 treatment. An asterisk denotes significant differential gene expression after treatment (** = p < 0.005).
Preprints 105395 g015
Table 1. Top 30 significantly up-regulated miRNAs in response to TGFβ1 (5 ng/mL) treatment for 24 hours. MiRNAs are ranked by Fold Change. Significance defined as p-value < 0.05. log2FC = Log2 Fold Change.
miRNAs Fold Change Log2FC P-value
hsa-miR-122-5p 9.13380754 3.19121639 6.15E-11
hsa-miR-139-5p 3.25102103 1.70089289 1.38E-05
hsa-miR-3065-5p 2.89575179 1.53393795 4.57E-05
hsa-miR-6724-5p 2.86974573 1.52092291 8.51E-06
hsa-miR-3065-3p 2.8198025 1.49559412 0.00020201
hsa-miR-1275 2.74691918 1.45781447 3.19E-05
hsa-miR-122b-5p 2.53489937 1.34192848 0.01283611
hsa-miR-10395-5p 2.4233795 1.27702035 0.00046603
hsa-miR-10395-3p 2.42334707 1.27700104 0.00048254
hsa-miR-183-5p 2.25763024 1.17480922 0.00134539
hsa-miR-424-3p 2.22458455 1.15353593 0.00616844
hsa-miR-10401-5p 2.19097642 1.13157396 0.00394718
hsa-miR-23a-5p 2.04351302 1.03105144 3.24E-05
hsa-miR-6716-3p 1.96658773 0.97569454 0.00379127
hsa-miR-503-3p 1.92984739 0.94848677 0.03910098
hsa-miR-146a-5p 1.89191456 0.91984694 0.00017454
hsa-miR-181b-5p 1.79978193 0.84782212 4.79E-06
hsa-miR-708-5p 1.79528708 0.84421456 0.0001733
hsa-miR-182-5p 1.75251953 0.80943052 0.01995341
hsa-miR-543 1.73760333 0.79709877 0.00498442
hsa-miR-3679-5p 1.70656765 0.77109761 0.01196514
hsa-miR-210-3p 1.6996398 0.76522903 0.00029772
hsa-miR-216a-5p 1.64469194 0.71781738 0.01385089
hsa-miR-365a-5p 1.63395301 0.7083665 0.01578449
hsa-miR-129-5p 1.61816529 0.69435898 0.0061433
hsa-miR-10401-3p 1.61801867 0.69422826 0.00669733
hsa-miR-10527-5p 1.59469424 0.67327984 0.0141122
hsa-miR-181b-3p 1.59404885 0.67269584 0.04147052
hsa-miR-24-2-5p 1.57231126 0.65288685 0.00099304
hsa-miR-495-3p 1.54712784 0.62959242 0.02393389
Table 2. Top 30 significantly down-regulated miRNAs in response to TGFβ1 (5 ng/mL) treatment for 24 hours. MiRNAs are ranked by Fold Change. Significance defined as p-value < 0.05. log2FC = Log2 Fold Change.
miRNAs Fold Change Log2FC P-value
hsa-miR-146b-5p 0.4822713 -1.0520831 1.96E-06
hsa-miR-146b-3p 0.48914069 -1.0316786 0.00766537
hsa-miR-651-5p 0.50861592 -0.9753515 0.00545332
hsa-miR-204-5p 0.52483108 -0.9300749 9.46E-05
hsa-miR-99a-5p 0.53341448 -0.9066711 0.00011864
hsa-miR-218-1-3p 0.55523124 -0.8488393 0.00496279
hsa-miR-660-5p 0.56382312 -0.8266855 0.00028811
hsa-miR-549a-3p 0.57752493 -0.7920449 0.01521947
hsa-miR-26a-1-3p 0.58078639 -0.7839205 0.00053314
hsa-miR-500b-3p 0.58162831 -0.7818306 0.03273988
hsa-miR-15a-5p 0.58925697 -0.7630312 2.90E-05
hsa-miR-452-3p 0.59020601 -0.7607095 0.00077017
hsa-miR-218-5p 0.59343236 -0.7528445 1.37E-05
hsa-miR-26a-2-3p 0.60264724 -0.7306143 0.03565943
hsa-miR-1255a 0.61107737 -0.710573 0.0361198
hsa-miR-502-5p 0.61558839 -0.6999621 0.03998012
hsa-miR-99a-3p 0.61886292 -0.6923082 0.03455279
hsa-miR-20b-5p 0.61932422 -0.6912332 0.04897627
hsa-miR-9985 0.62109457 -0.6871151 0.00625545
hsa-miR-195-5p 0.62558473 -0.6767228 0.00080717
hsa-let-7c-3p 0.63013432 -0.6662687 0.03065585
hsa-miR-19a-3p 0.63378238 -0.6579405 0.00243884
hsa-miR-335-3p 0.63422802 -0.6569265 0.02491361
hsa-miR-19b-3p 0.6385444 -0.6471412 0.00104799
hsa-miR-335-5p 0.64169946 -0.6400303 0.00237981
hsa-miR-29b-3p 0.64655536 -0.6291542 0.00472803
hsa-miR-497-5p 0.6492189 -0.6232231 0.00294707
hsa-miR-20a-3p 0.65002719 -0.621428 0.04420571
hsa-miR-454-5p 0.65124762 -0.6187219 0.03029567
hsa-miR-101-3p 0.65134387 -0.6185087 0.00085122
Table 3. Top 30 significantly up-regulated miRNAs in response to TGFβ2 (5 ng/mL) treatment for 24 hours. MiRNAs are ranked by Fold Change. Significance defined as p-value < 0.05. log2FC = Log2 Fold Change.
miRNA Name Fold Change Log2FC P-value
hsa-miR-181b-2-3p 3.53991903 1.82371636 1.27E-06
hsa-miR-503-3p 3.18394765 1.67081662 3.60E-18
hsa-miR-424-3p 2.85950834 1.51576711 1.05E-06
hsa-miR-21-3p 2.00735084 1.00529279 1.26E-16
hsa-miR-708-3p 1.99270313 0.99472679 5.17E-06
hsa-miR-6716-3p 1.99202337 0.99423458 0.00072026
hsa-miR-503-5p 1.98194499 0.98691692 1.18E-06
hsa-miR-27a-5p 1.93586762 0.9529803 4.55E-12
hsa-miR-6724-5p 1.89734963 0.92398555 0.00050886
hsa-miR-145-3p 1.88867966 0.91737802 2.71E-07
hsa-miR-181a-2-3p 1.88789033 0.91677496 9.80E-08
hsa-miR-3187-3p 1.85686868 0.89287179 0.00135669
hsa-miR-24-2-5p 1.8166234 0.86125937 5.52E-06
hsa-miR-143-5p 1.81551189 0.86037638 8.45E-09
hsa-miR-708-5p 1.81499426 0.85996499 2.20E-05
hsa-miR-3179 1.80771879 0.85417027 0.01538545
hsa-miR-3065-3p 1.76608959 0.82055853 0.00122102
hsa-miR-10401-5p 1.70851951 0.77274672 0.02374628
hsa-miR-5701 1.67320751 0.74261638 0.01320843
hsa-miR-216a-5p 1.66610529 0.73647958 0.00576722
hsa-miR-135a-5p 1.65188519 0.72411342 0.01440031
hsa-miR-214-5p 1.62635075 0.70163843 0.00031568
hsa-miR-23a-5p 1.58158263 0.66136893 0.0171346
hsa-miR-3065-5p 1.56823909 0.64914552 0.00064297
hsa-miR-145-5p 1.51098725 0.59549148 4.34E-08
hsa-miR-181b-5p 1.49487096 0.58002095 0.00019705
hsa-miR-199b-5p 1.41320621 0.49897199 0.0083763
hsa-miR-424-5p 1.41198062 0.49772029 0.00883417
hsa-miR-210-3p 1.39737981 0.4827242 6.48E-05
hsa-miR-6511a-3p 1.39588043 0.48117537 0.01910117
Table 4. Top 30 significantly down-regulated miRNAs in response to TGFβ2 (5 ng/mL) treatment for 24 hours. MiRNAs are ranked by Fold Change. Significance defined as p-value < 0.05. log2FC = Log2 Fold Change.
miRNA Name Fold Change Log2FC P-value
hsa-miR-6859-5p 0.47775733 -1.0656501 0.01471161
hsa-miR-218-1-3p 0.5838476 -0.7763363 3.56E-08
hsa-miR-20b-5p 0.5851248 -0.7731837 0.04888215
hsa-miR-15a-3p 0.58819277 -0.765639 0.01533516
hsa-miR-26a-1-3p 0.60051027 -0.7357392 4.51E-07
hsa-miR-744-3p 0.61105129 -0.7106346 0.00203953
hsa-miR-760 0.61267545 -0.7068051 0.00696877
hsa-miR-3613-5p 0.62166996 -0.6857792 0.00247998
hsa-miR-485-5p 0.64873167 -0.6243062 0.00044685
hsa-miR-3618 0.6551584 -0.6100843 0.00031305
hsa-miR-96-5p 0.66784058 -0.5824243 0.04879471
hsa-let-7c-3p 0.66958237 -0.5786666 0.00046092
hsa-miR-26a-2-3p 0.70516762 -0.5039619 0.00985704
hsa-miR-454-5p 0.70792943 -0.4983225 0.01136527
hsa-miR-452-3p 0.73641685 -0.4414055 0.01341871
hsa-miR-302b-3p 0.74394926 -0.4267239 0.03858273
hsa-miR-379-3p 0.74729697 -0.4202464 0.02575367
hsa-miR-200a-3p 0.75177354 -0.41163 0.03409936
hsa-miR-330-3p 0.75655443 -0.4024842 0.00629521
hsa-miR-652-3p 0.76101822 -0.3939971 0.04107676
hsa-miR-330-5p 0.76266111 -0.390886 0.0358708
hsa-miR-582-3p 0.7793746 -0.3596112 0.03470739
hsa-miR-218-5p 0.80206106 -0.318216 0.00150533
hsa-miR-324-3p 0.81716595 -0.291299 0.0171506
hsa-miR-29b-3p 0.8178589 -0.2900761 0.03715585
hsa-miR-204-5p 0.82376963 -0.2796872 0.01111315
hsa-miR-887-3p 0.84285826 -0.2466381 0.03219643
hsa-miR-138-5p 0.86349689 -0.2117371 0.03055703
Disclaimer/Publisher’s Note: The statements, opinions and data contained in all publications are solely those of the individual author(s) and contributor(s) and not of MDPI and/or the editor(s). MDPI and/or the editor(s) disclaim responsibility for any injury to people or property resulting from any ideas, methods, instructions or products referred to in the content.
Copyright: This open access article is published under a Creative Commons CC BY 4.0 license, which permit the free download, distribution, and reuse, provided that the author and preprint are cited in any reuse.
Alerts
Prerpints.org logo

Preprints.org is a free preprint server supported by MDPI in Basel, Switzerland.

Subscribe

© 2025 MDPI (Basel, Switzerland) unless otherwise stated