Preprint
Article

Unraveling Dry Jigging: Insights into Pulsation, Energy Consumption, and Stratification Dynamics

Altmetrics

Downloads

79

Views

33

Comments

0

A peer-reviewed article of this preprint also exists.

Submitted:

02 May 2024

Posted:

03 May 2024

You are already at the latest version

Alerts
Abstract
Despite its growing importance as a dry beneficiation method, there is a lack of studies exploring the fundamentals aspects of dry jigging. In this sense, this study focuses on explore some essential aspects of density-based separation in dry jigs, like pulse profile, energy consumption and, especially, stratification over time, also exploring an innovative operational strategy here called “transient pulsation”. The tests were carried out using density tracers distributed across 11 density ranges (0.4-2.4 g/cm³) and employing a base bed (gravel) to analyze their segregation in a pilot-scale dry jig. Pressure drop and active power data were acquired to measure the pulse characteristics and energy consumption. The findings suggest that establishing the dry jigging cycle is more complex than in hydraulic jigs due to the compressibility of air. Stationary pulsation tests revealed an unstable behavior of stratification over time, contrasting with traditional hydraulic jigs, while transient pulsation tests unveiled varied trends in separation quality. Energy consumption analysis underscored the significant role of the blower drive. These insights have the potential to inform operational enhancements in dry jigging.
Keywords: 
Subject: Engineering  -   Mining and Mineral Processing

1. Introduction

Gravity separation, based on the separation of particles due to their differential motion in fluids, encompasses techniques with diverse characteristics and operational principles. Jigging is one such technique, involving the density stratification of particle beds subjected to vertical pulsations generated by the upward movement of a fluid. This method has been well known since ancient times, and has been extensively applied in concentrating coarse ores, coals, and, more recently, in the recycling of solid waste [1,2].
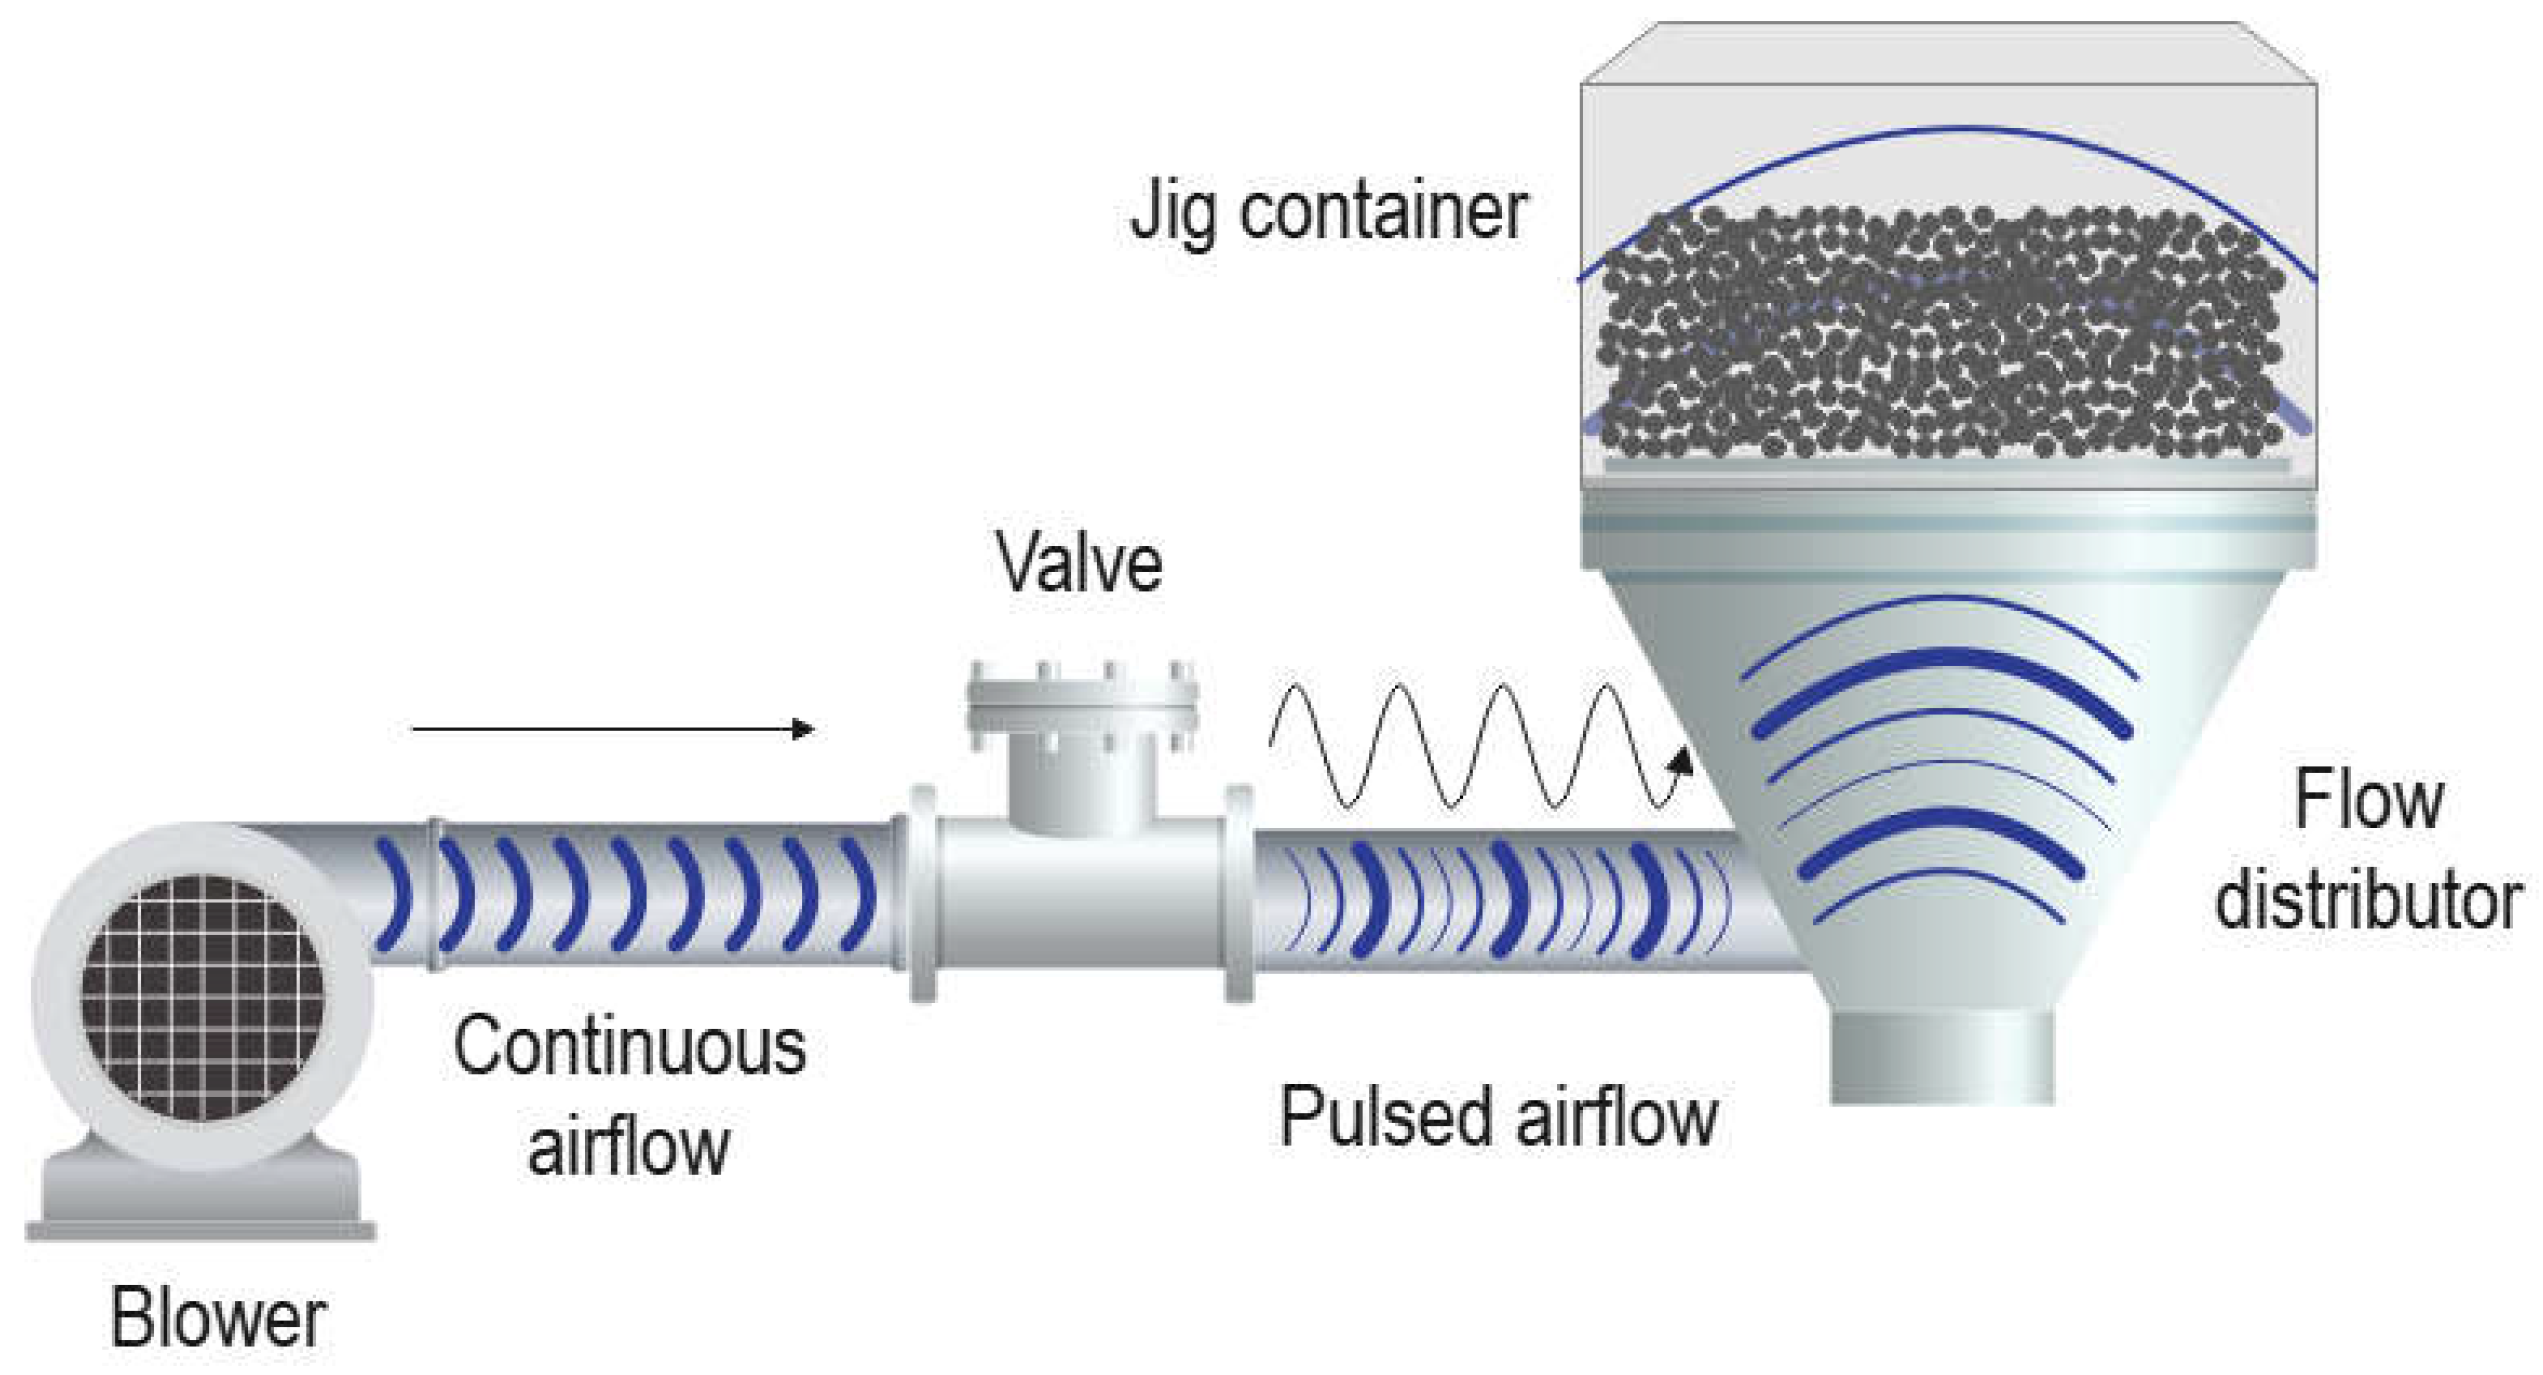
Jigging can be conducted wet or dry. In conventional hydraulic jigging, a pulsating mechanism (plungers or air chambers) generates vertical water pulses to ‘open’ the bed, increasing its porosity for allowing density-based separation. In dry jigging, airflow from a blower is utilized, and rotary valves control the air feed frequency rate, thus regulating the pulse generated (Figure 1). Due to their superior separation efficiency, hydraulic jigs are widely preferred over dry jigs. However, rising environmental concerns regarding water usage and management in mineral processing plants, along with the growing emphasis on social and environmental responsibility by stakeholders, have spurred a demand for more sustainable beneficiation methods, notably dry beneficiation [3].
Dry jigs exhibit unique operational features that influence the stratification process, often leading to lower separation efficiencies compared to hydraulic jigs. The most apparent difference lies in the use of air rather than water as the pulsating fluid, directly affecting the density-based separation. The concentration criterion (CC), a well-known index originally proposed by Taggart [4], provides insights into the influence of changing the fluid type (particularly its density) on predicting the ease of density-based separation of two different materials, and is given by:
C C = ρ d ρ f ρ l ρ f q ,
where ρ d , ρ l , and ρ f are the densities of the dense material, light material, and fluid, respectively. The quotient q is related to the flow regime where q = ½ for the Stoke’s regime, q = 1 for the Newtons’ regime, and ½ < q < 1 for the intermediary regime [5]. For example, considering the separation of coarse coal (𝜌𝑠 = 1.3 g/cm³) and quartz (𝜌𝑠 = 2.6 g/cm³), the values of CC in water and air would be 5.33 and 2, respectively (Newtonian regime), indicating a significantly greater separation difficulty in the latter case.
Another way to compare the performance of hydraulic and dry jigging is by observing the difference in the minimum fluidization velocity to move the bed [1]:
U f , m í n = ε ( 1 ε ) ρ s p f g d p 2 180 μ ,
where U f , m í n , ε , and 𝜇 are the superficial velocity, the bed porosity, and the viscosity of the fluid, respectively; d p is the average diameter of the bed particles, for the case of spherical particles.
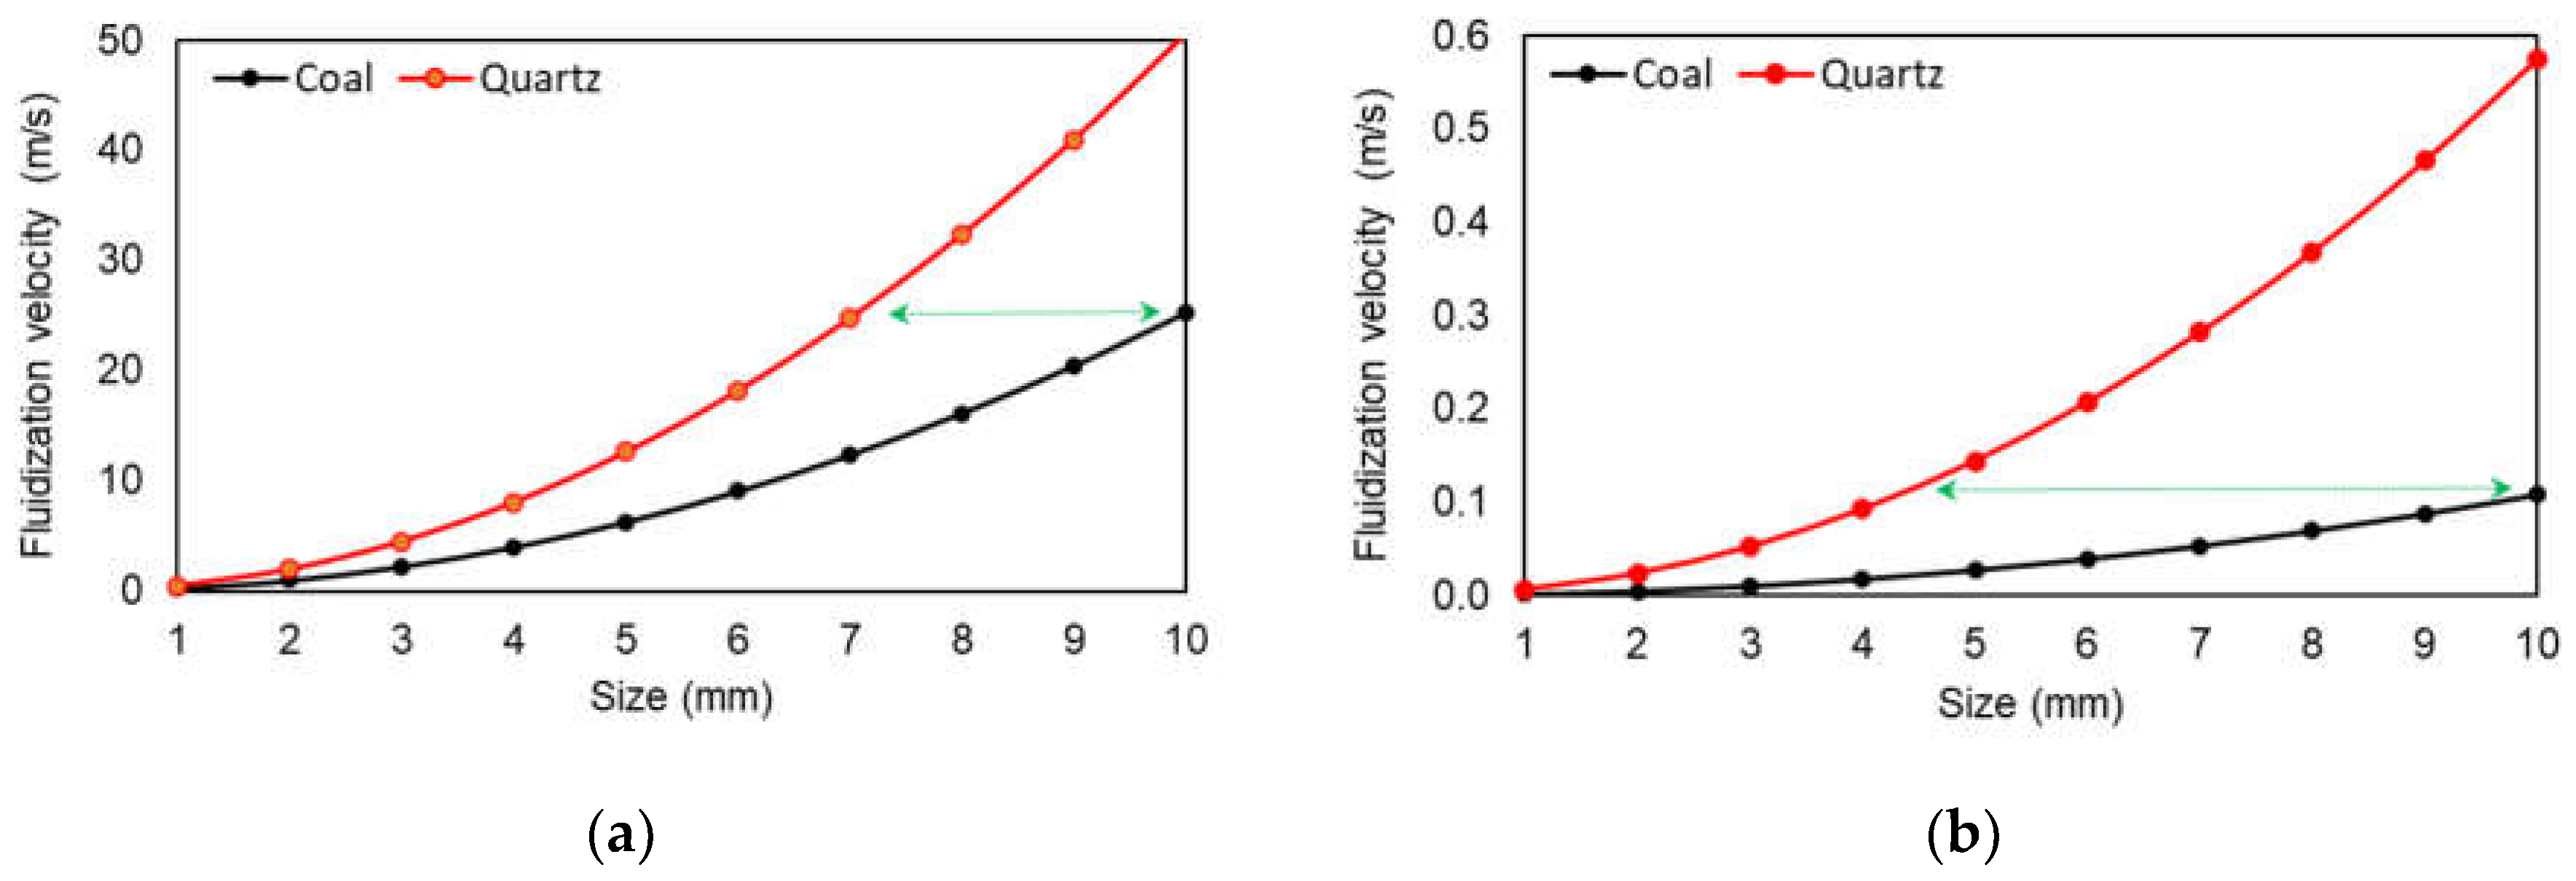
The fact that the air density is hundreds of times lower than that of water results in the need for high velocities to move the bed. As depicted in Figure 2(a), dry fluidization of coal beds demands velocities up to 240 times greater than hydraulic fluidization (Figure 2.b). It can also be observed that air fluidization requires separations in narrower size ranges for similar performance to water separation.
It is important to note that the fluidization velocity curves shown in Figure 2 and calculated according to equation (2) assume laminar flow conditions and uniform particle size, which is not the case in dry jigging. In practice, the jigging bed consists of irregularly shaped materials, resulting in packing distortions that can create preferential airflow paths and short circuits. All these factors contribute to a more turbulent pulsation dynamics, making maintaining a uniform bed pulsation significantly more challenging than in conventional hydraulic jigging.
Another distinguishing factor is the absence of an apparent suction phase in dry jigging, as the air pulse, unlike water, does not have a return flow after passing through the jig. In the context of classical hydrodynamic theory, this implies that the interstitial percolation mechanism has less influence, and segregation in dry jigs tends to be more direct, meaning that fine particles tend to concentrate with the light ones, as pointed out by Sampaio and Tavares [5] and experimentally observed by Ambrós, et al. [6].
Despite the mentioned peculiarities of dry jigging, there is a lack of general studies dedicated to investigating the fundamental factors behind its operation and the segregation phenomenon in dry jigs. Most available works are limited to case studies [7,8,9,10,11,12,13,14], providing only isolated information on potential process improvements. In this context, the present study aims to investigate general characteristics of pulsation in dry jigs, its approximate energy consumption, and especially the evolution of stratification over time. Additionally, it seeks to investigate a new process strategy, here called “transient pulsation”, which have potential to enhance the efficiency of density-based separation of dry jigging.

2. Materials and Methods

2.1. Equipment

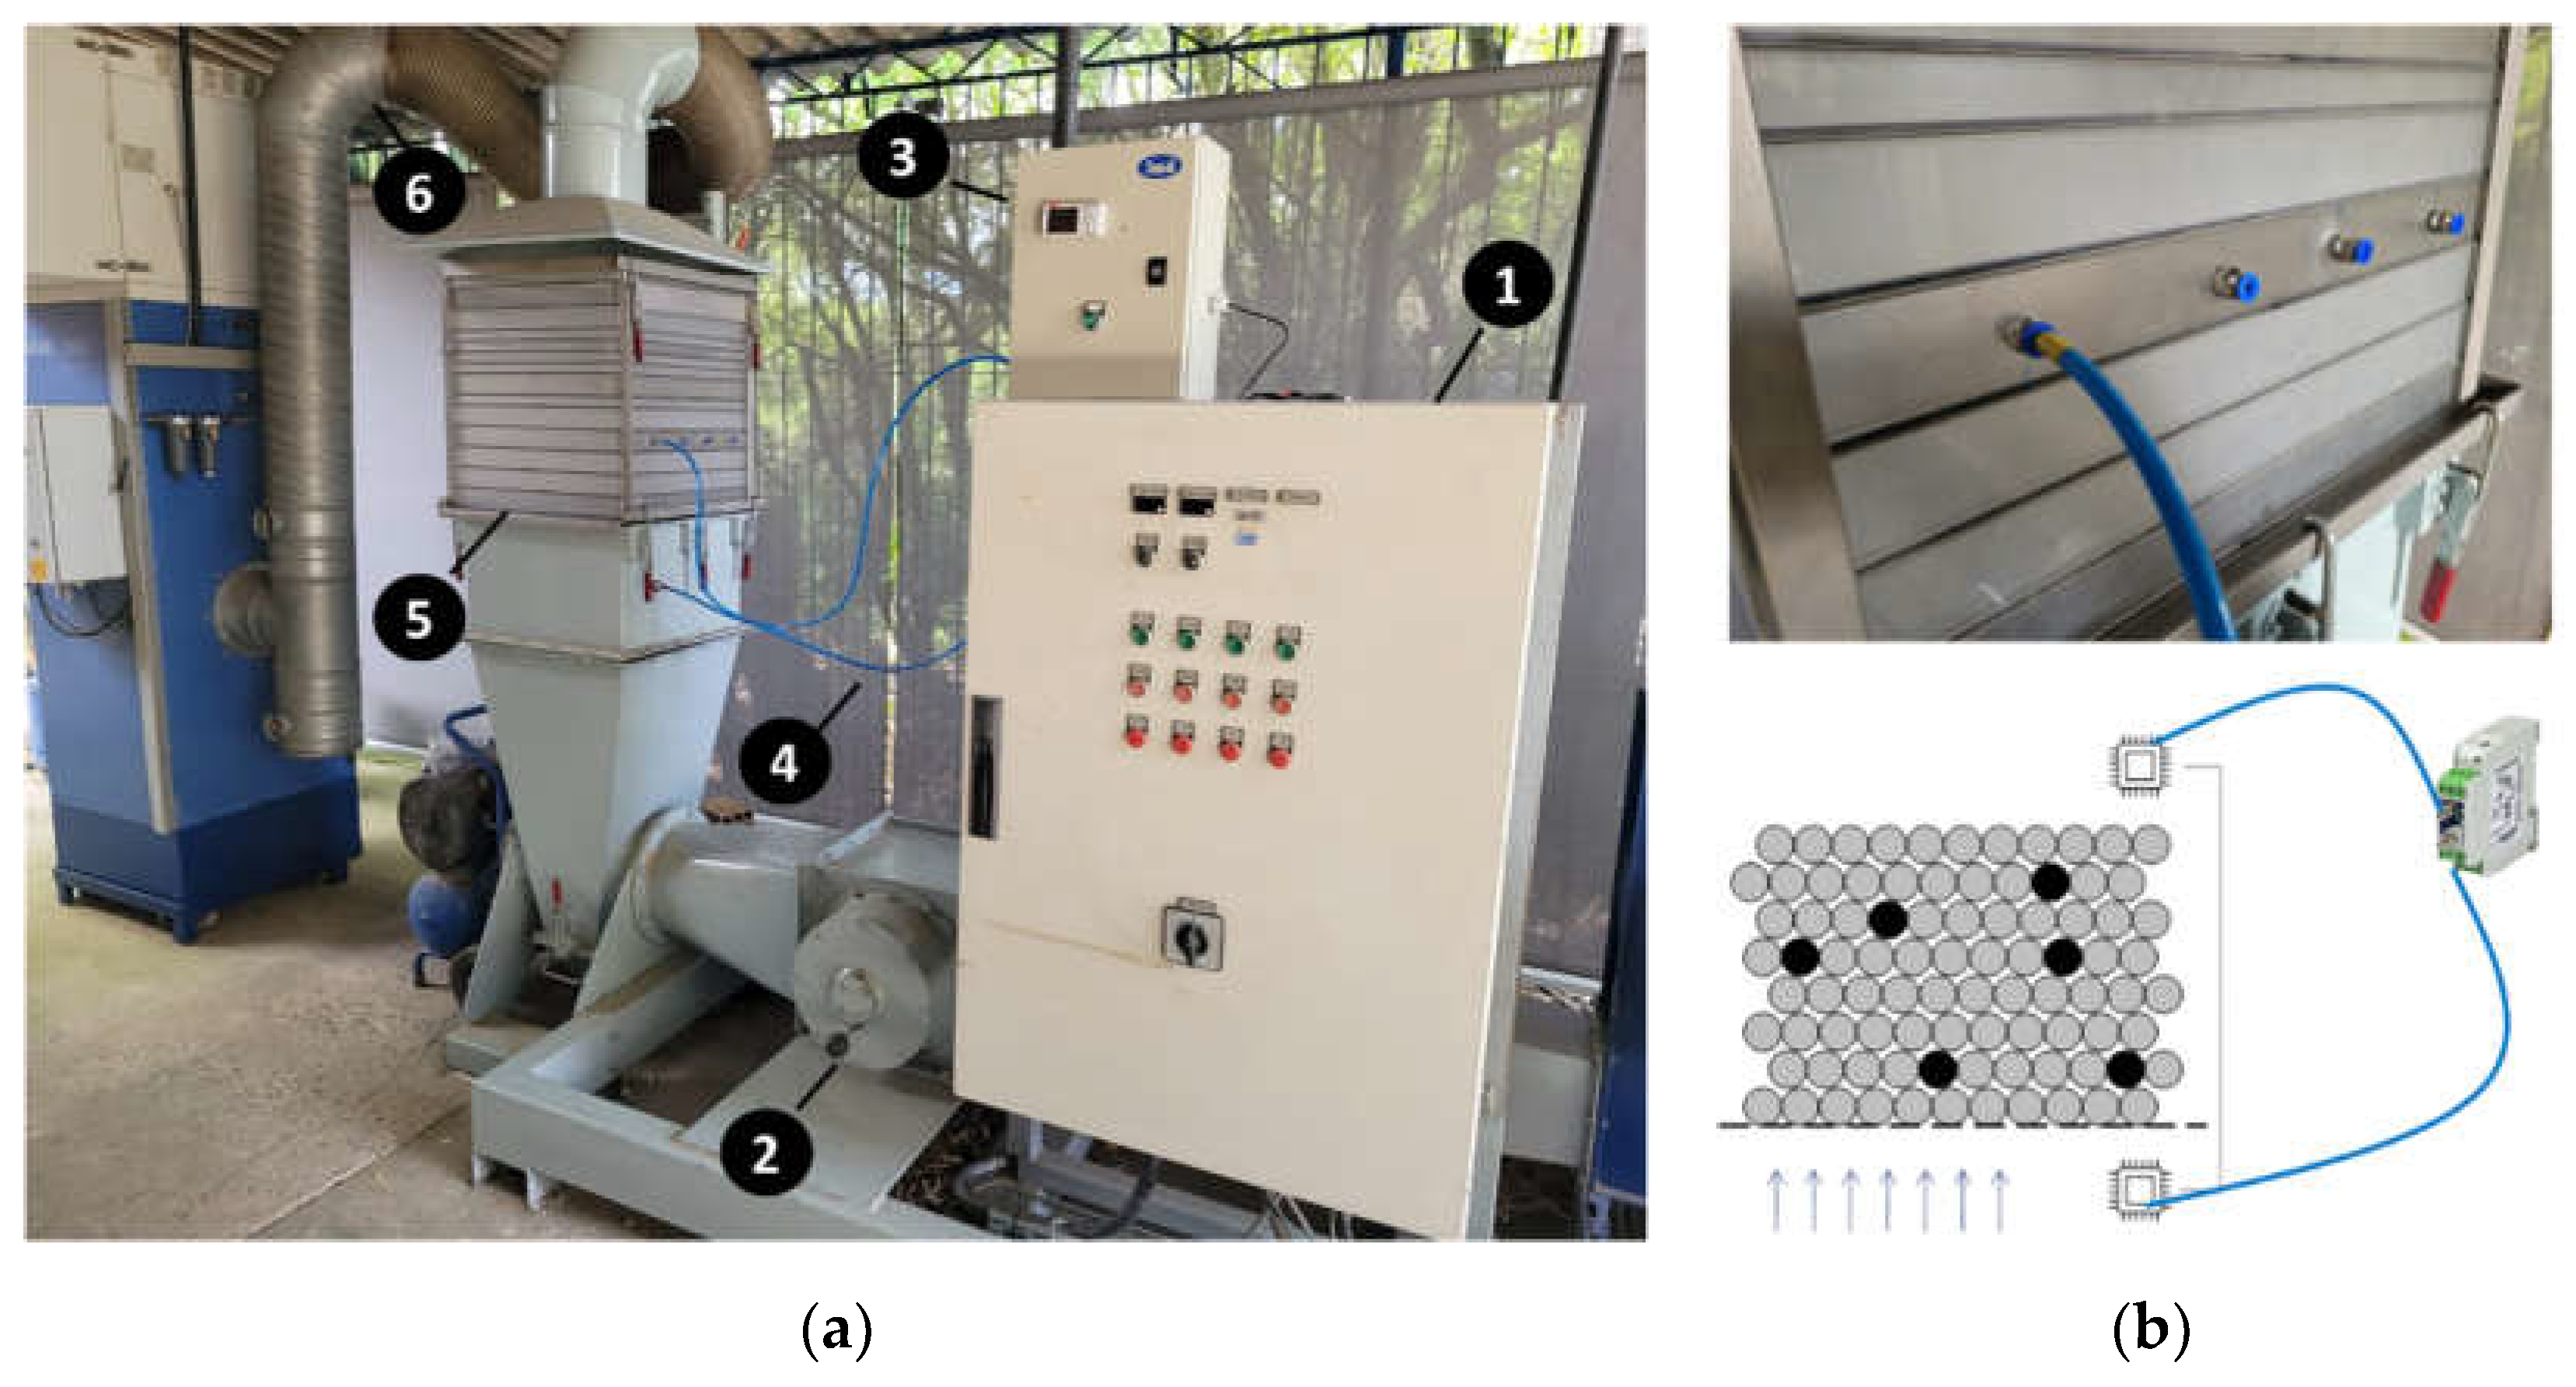
The tests were conducted on a pilot-scale batch-operated dry jig, model AllAir S-500 from the manufacturer allmineral® (Figure 3a) with a capacity of about 60 kg per batch. The jig consists of a container formed by overlapping square plexiglass frames (530 x 530 x 50 mm³) mounted on a 1 mm opening sieve, through which an upward pulsed airflow passes through the separation container. During testing, samples of particulate materials are placed inside the container and subjected to the pulsating airflow for a defined time, with the intensity and frequency of the pulse being regulated on a control panel.
Air injection into the jig container is achieved through a 15 kW centrifugal blower, with an output pressure of up to 6 kPa. The airflow is adjusted on the control panel in terms of the percentage of the maximum blower power, ranging from 0 to 100%, and is not directly known a priori. Before passing through the chamber containing the particulate bed, the air travels through a circular metal duct with a dual “Y”-shaped connection that divides the flow into two streams, one continuous and the other discontinuous. The continuous air stream aims to promote preliminary bed expansion to minimize the formation of short-circuits and ensure as uniform a bed expansion as possible during pulsations. The discontinuous air stream, on the other hand, is controlled by a butterfly valve, where cycles of opening and closing enable the generation of air pulses with frequencies of up 400 CPM (cycles per minute). Each opening and closing cycle of the valve results in an air pulse, inducing an expansion and compaction cycles of the bed.
After testing, airflow is halted, bed pulsation ceases, and each compartment can be individually removed for collecting and analyzing vertical slices (strata) of the stratified bed. It is worth noting that slicing the bed in discontinuous jigs may disturb particle positions near the interface between two strata, potentially leading to errors of up to 9.1% in the composition of stratified products [6].
The airflow entering the jig is calculated based on pressure drop data obtained using a Novus® NP785-68 differential pressure sensor, with a range of -68 to +68 mbar, ±2% error, and 11.6-bit reading resolution. Measurements were taken every 0.1 seconds at inlet and outlet points using pneumatic hoses (Figure 3b). Data were recorded in mbar using a Novus® FieldLogger 512K recorder, with a 512,000-record memory and 1000 records/second per channel.
The recorded ΔP values were used to calculate the air pulse velocity in the jig using the following equation:
v = 2   Δ P ρ a i r
where v and ρ a i r are the velocity (m/s) and density of air (1.225 kg/m³ at 25°C and 101.325 kPa). The air flow rate (m³/s)) was calculated by multiplying v by the cross-sectional area of the jig chamber, which is equal to 0.25 m². In assigning test conditions, the flow rate considered corresponds to the peak (maximum flow rate) detected in a certain operational configuration.

2.2. Experimental Setup

In selecting the jigging bed for the tests, three factors were crucial. Firstly, a system comprising particles of diverse densities was necessary to enable individual collection and counting for constructing partition curves. Secondly, an expedited method for assessing bed stratification was sought, given the substantial mass of particulate material (typically below 20 mm) required for each jig test, making manual grain-by-grain a counting time-consuming and tedious process. Lastly, a strategy was devised to minimize the slicing error mentioned earlier (Section 2.1), assumed to be proportional to the mass of material dragged during strata removal.
Therefore, it was decided that the jigging tests would be conducted using density tracers mixed with a base bed, consisting of material with uniform characteristics (i.e., no significant variations in density, size, or shape). Subsequently, the analysis focused on determining the distribution of tracers with different densities over the stratified bed. Due to the smaller number of tracers compared to bed grains, this expedited the collection and evaluation of stratification, while also minimizing the slicing error during strata removal.
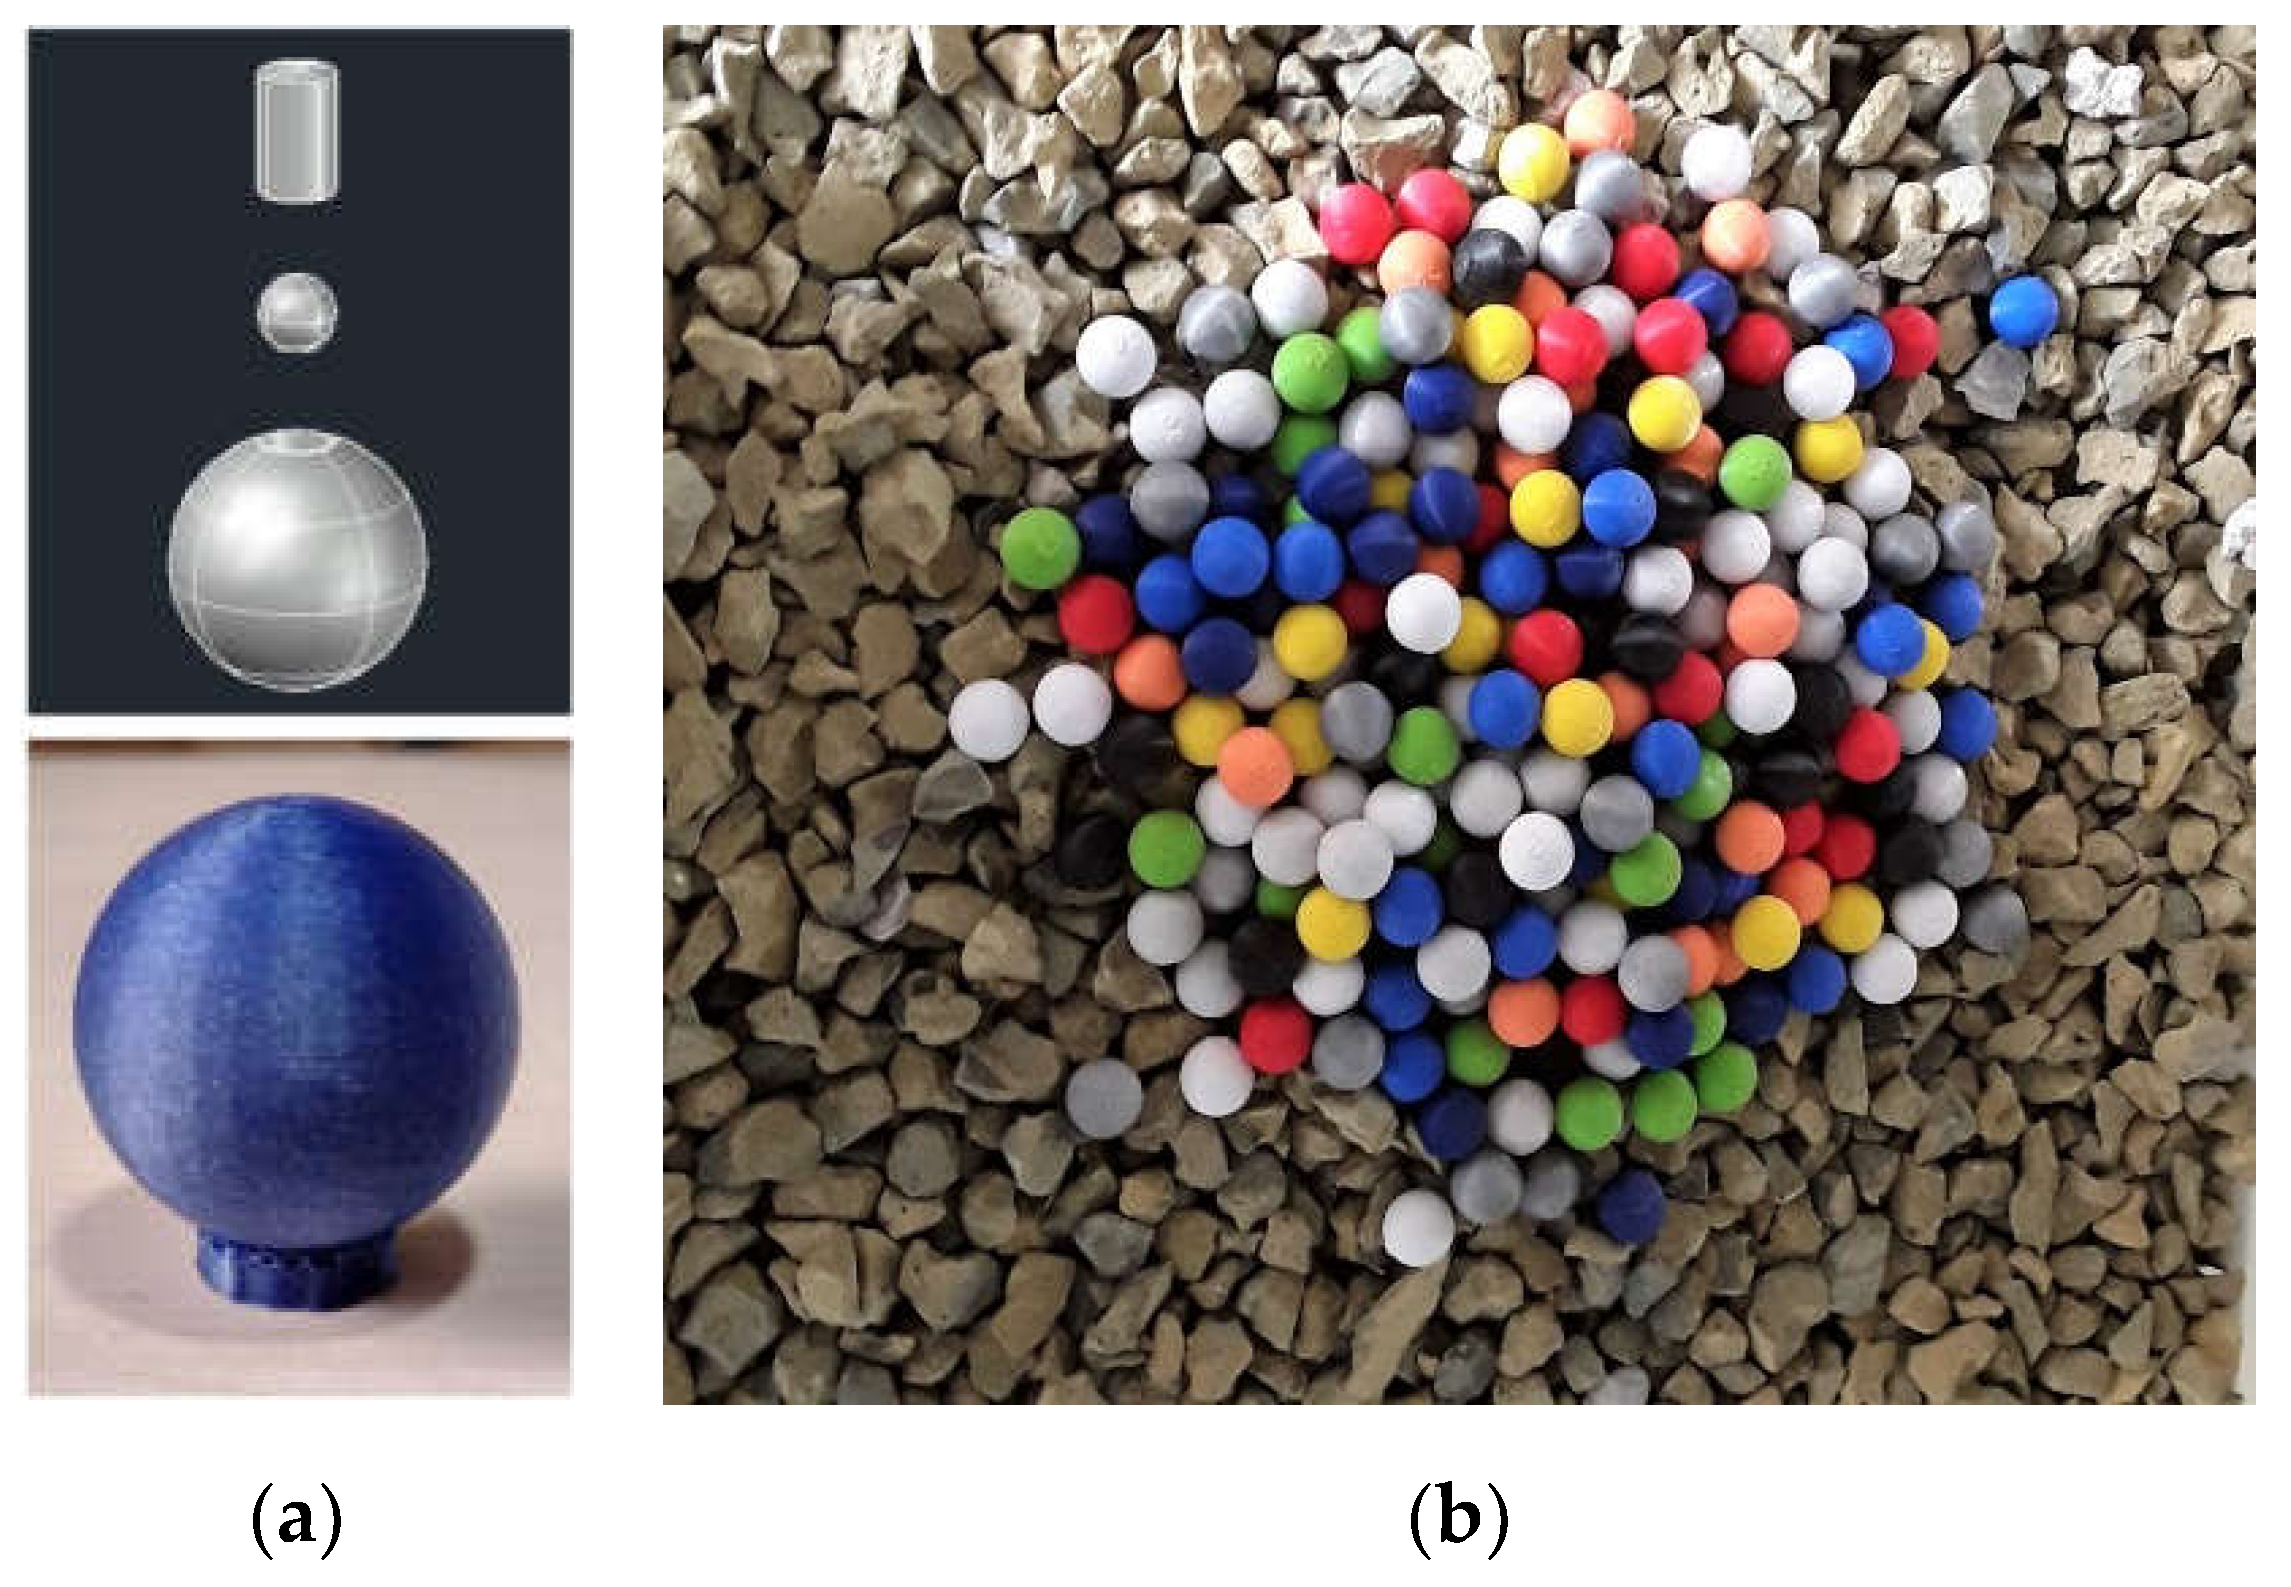
The density tracers used were made of polylactic acid (PLA) and produced using the Fused Deposition Modeling (FDM) 3D printing method, as described by Warke and Puranik [15]. The tracers were spherical, with a diameter of 20 mm, and had the following specific masses: 0.4, 0.6, 0.8, 1.0, 1.2, 1.4, 1.6, 1.8, 2.0, 2.2, and 2.4 g/cm³. During manufacturing, the density of the tracers was controlled by adjusting the thickness of the internal cavity for densities below 1.2 g/cm³, while for densities above 1.2 g/cm³, it was also necessary to adjust the diameter of steel microspheres introduced into the internal cavity (Figure 4a) to ensure the desired density range and facilitate the magnetic recovery of the tracers (Table 1). This adjustment requirement limited the minimum diameter of the tracers to the adopted value of 20 mm. Each of the eleven specific masses comprised 20 spheres of different colors and embossed marking indicating the nominal density, totaling 220 density tracers (Figure 4b).
At first, polyethylene terephthalate (PET) particles with a diameter of 3 mm and a density of 1.4 g/cm³ were considered for the base bed. Indeed, the tracers were purposely manufactured for use with a PET bed base, justifying the chosen range of specific masses (0.4 - 2.4 g/cm³). However, exploratory tests revealed several issues with using PET as the base material. The main concern was the significant size disparity between the tracers and PET particles, causing most tracers to accumulate at the bottom of the bed, even those with very light densities (down to ρ = 0.8 g/cm³), thereby exacerbating the size influence on separation. Reducing the size influence on segregation in a PET bed proved challenging: constructing smaller tracers was not possible and acquiring or manufacturing tens of kilograms of PET with particle size closer to the tracers (20 mm) was unfeasible.
Further exploratory tests revealed that a gravel bed ( ρ = 2.89 g/cm³, measured using a helium pycnometer) in the range of -19 + 12.7 mm proved more suitable for the experiments. Firstly, segregation by size is minimized due to the coarser size of the gravel. Secondly, as gravel is denser than PET, there is a reduction in excessive concentration at the bottom layer observed in the latter case. Concentration of tracers at the bottom layer in fact indicate inefficiencies in jigging, as gravel is denser than the tracers, with their concentration at the top of the bed being the expected trend in an ideal density-based stratification.

2.3. Stratification Analysis

All jigging tests were conducted with a fixed bed thickness of 150 mm, corresponding to 3 larger jig layers (50 mm each) fully filled. This thickness was chosen based on preliminary tests indicating that thicker beds result in low bed movement even under intense pulsation conditions (100% blower power). On the other hand, thinner thicknesses (e.g., 100 mm) would result in a thickness/top size ratio of only 5, which may not be sufficient to analyze the nuances of segregation differences under different operational conditions.
The following product configuration was defined: the upper stratum classified as ‘light product’ and the two lower strata as ‘dense product’. This nomenclature is adopted throughout the text. Thus, at the end of jigging, the light and dense products were separately collected, and the tracers present in them were collected and counted. The level of stratification was measured by analyzing the partitioning of tracers between the products, calculated according to:
P i = n p i , d e n s e N p i × 100 %
where P i is the partition coefficient, n p i , d e n s e is the number of tracers with specific mass ρ i collected in the dense product, and N p i is the total number of tracers with specific mass ρ i present in the bed. Plotting P i x ρ i illustrates the partition curve of the process, from which a parameter can be obtained as indicator of jigging separation efficiency. This parameter is the mean probable error of separation [5,16]:
E p = ρ 75 ρ 25 2  
where ρ 75 and ρ 25 represent the densities corresponding to the 25% and 75% partitions, respectively. In addition to partition analysis, other indices were used for specific cases. For instance, in the analysis of stratification kinetics, the variation in the distribution of tracers of different densities in different strata over the jigging time was also evaluated.

2.4. Stratification Kinetics Analysis

Tests were carried out to analyze variations in the segregation profile of the bed over time under fixed pulsation conditions. To this end, jigging tests were conducted under the following fixed pulsation conditions: pulse frequency of 70 CPM (1.16 cycles per second) and relative air flow rate of 95% (2.9 m³/s). These conditions were adjusted in exploratory tests and proved suitable as they allowed for sufficient expansion of the bed during the pulse without causing excessive apparent turbulence. The tests were conducted within a jigging time range of 30 to 300 seconds, with ∆t = 30 seconds (totaling 10 jigging times). The minimum jigging time of 30 seconds was defined due to the reasons discussed in section xx. The results were analyzed for the distribution of tracers in the light and dense products and partition indices for different jigging times.

2.5. Transient Pulsation Tests

The transient pulsation tests aimed to investigate whether bed stratification could be improved by varying the pulsation conditions as the bed rearranges itself (in this case, as the tracers distribute themselves to their equilibrium or near-equilibrium points along the gravel bed). It involved a series of experiments in which the bed pulsation conditions (frequency or air flow rate) were systematically varied in either increasing or decreasing order. The tests were conducted considering five jigging times: 60, 120, 180, 240, and 300 seconds. At each jigging time, four distinct transient pulsation conditions were evaluated:
-
Increasing frequency pulses: the relative air flow rate was maintained at 95% (2.9 m³/s), while the bed pulsation frequency was varied in the range of 55–85 CPM at each quarter of the jigging time and at a rate of (85–55) / 3 = + 10 CPM;
-
Decreasing frequency pulses: the relative air flow rate was maintained at 95% (2.9 m³/s), while the bed pulsation frequency was varied in the range of 85–55 CPM at each quarter of the jigging time and at a rate of (55–85) / 3 = - 10 CPM.
-
Increasing amplitude pulses: the pulsation frequency was maintained at 70 CPM, while the relative air flow rate was varied in the range of 90% - 100% at each quarter of the jigging time and at a rate of (100–90) / 3 = + 3.3%.
-
Decreasing amplitude pulses: the pulsation frequency was maintained at 70 CPM, while the relative air flow rate was varied in the range of 100% - 90% at each quarter of the jigging time and at a rate of (90–100) / 3 = - 3.3%.
Table 2 exemplifies the adjustment of pulsation conditions for the test case with a jigging time of 60 s. The stratification profile under transient conditions was compared with those obtained under fixed pulsation condition (i.e., no variation during jigging) where the frequency remained at 70 CPM and air flow rate at 95%.

3. Results

3.1. Air Pulse Characteristics

As mentioned in Section 2, the air pulse frequency in dry jigs is regulated by the rotational frequency of a butterfly valve controlling the air intake into the jig container. However, the valve rotational frequency does not necessarily match the bed pulsation frequency. Unlike hydraulic jigs, where changes in water level can be directly associated with pulse amplitude, this relationship is harder to establish for dry jigging, since air lacks a clearly defined ‘return’ phase (suction phase in hydraulic jigs). Furthermore, the batch operation of the tested jig represents a fundamental difference compared to industrial jigs, which run continuously. Each test started with the jig turned off, so there is a time interval until the pulsation conditions reach steady-state. However, stratification begins early on with minimal movement of the bed. Hence, it was convenient to define the time interval from which the pulsation could be considered stationary or stable.
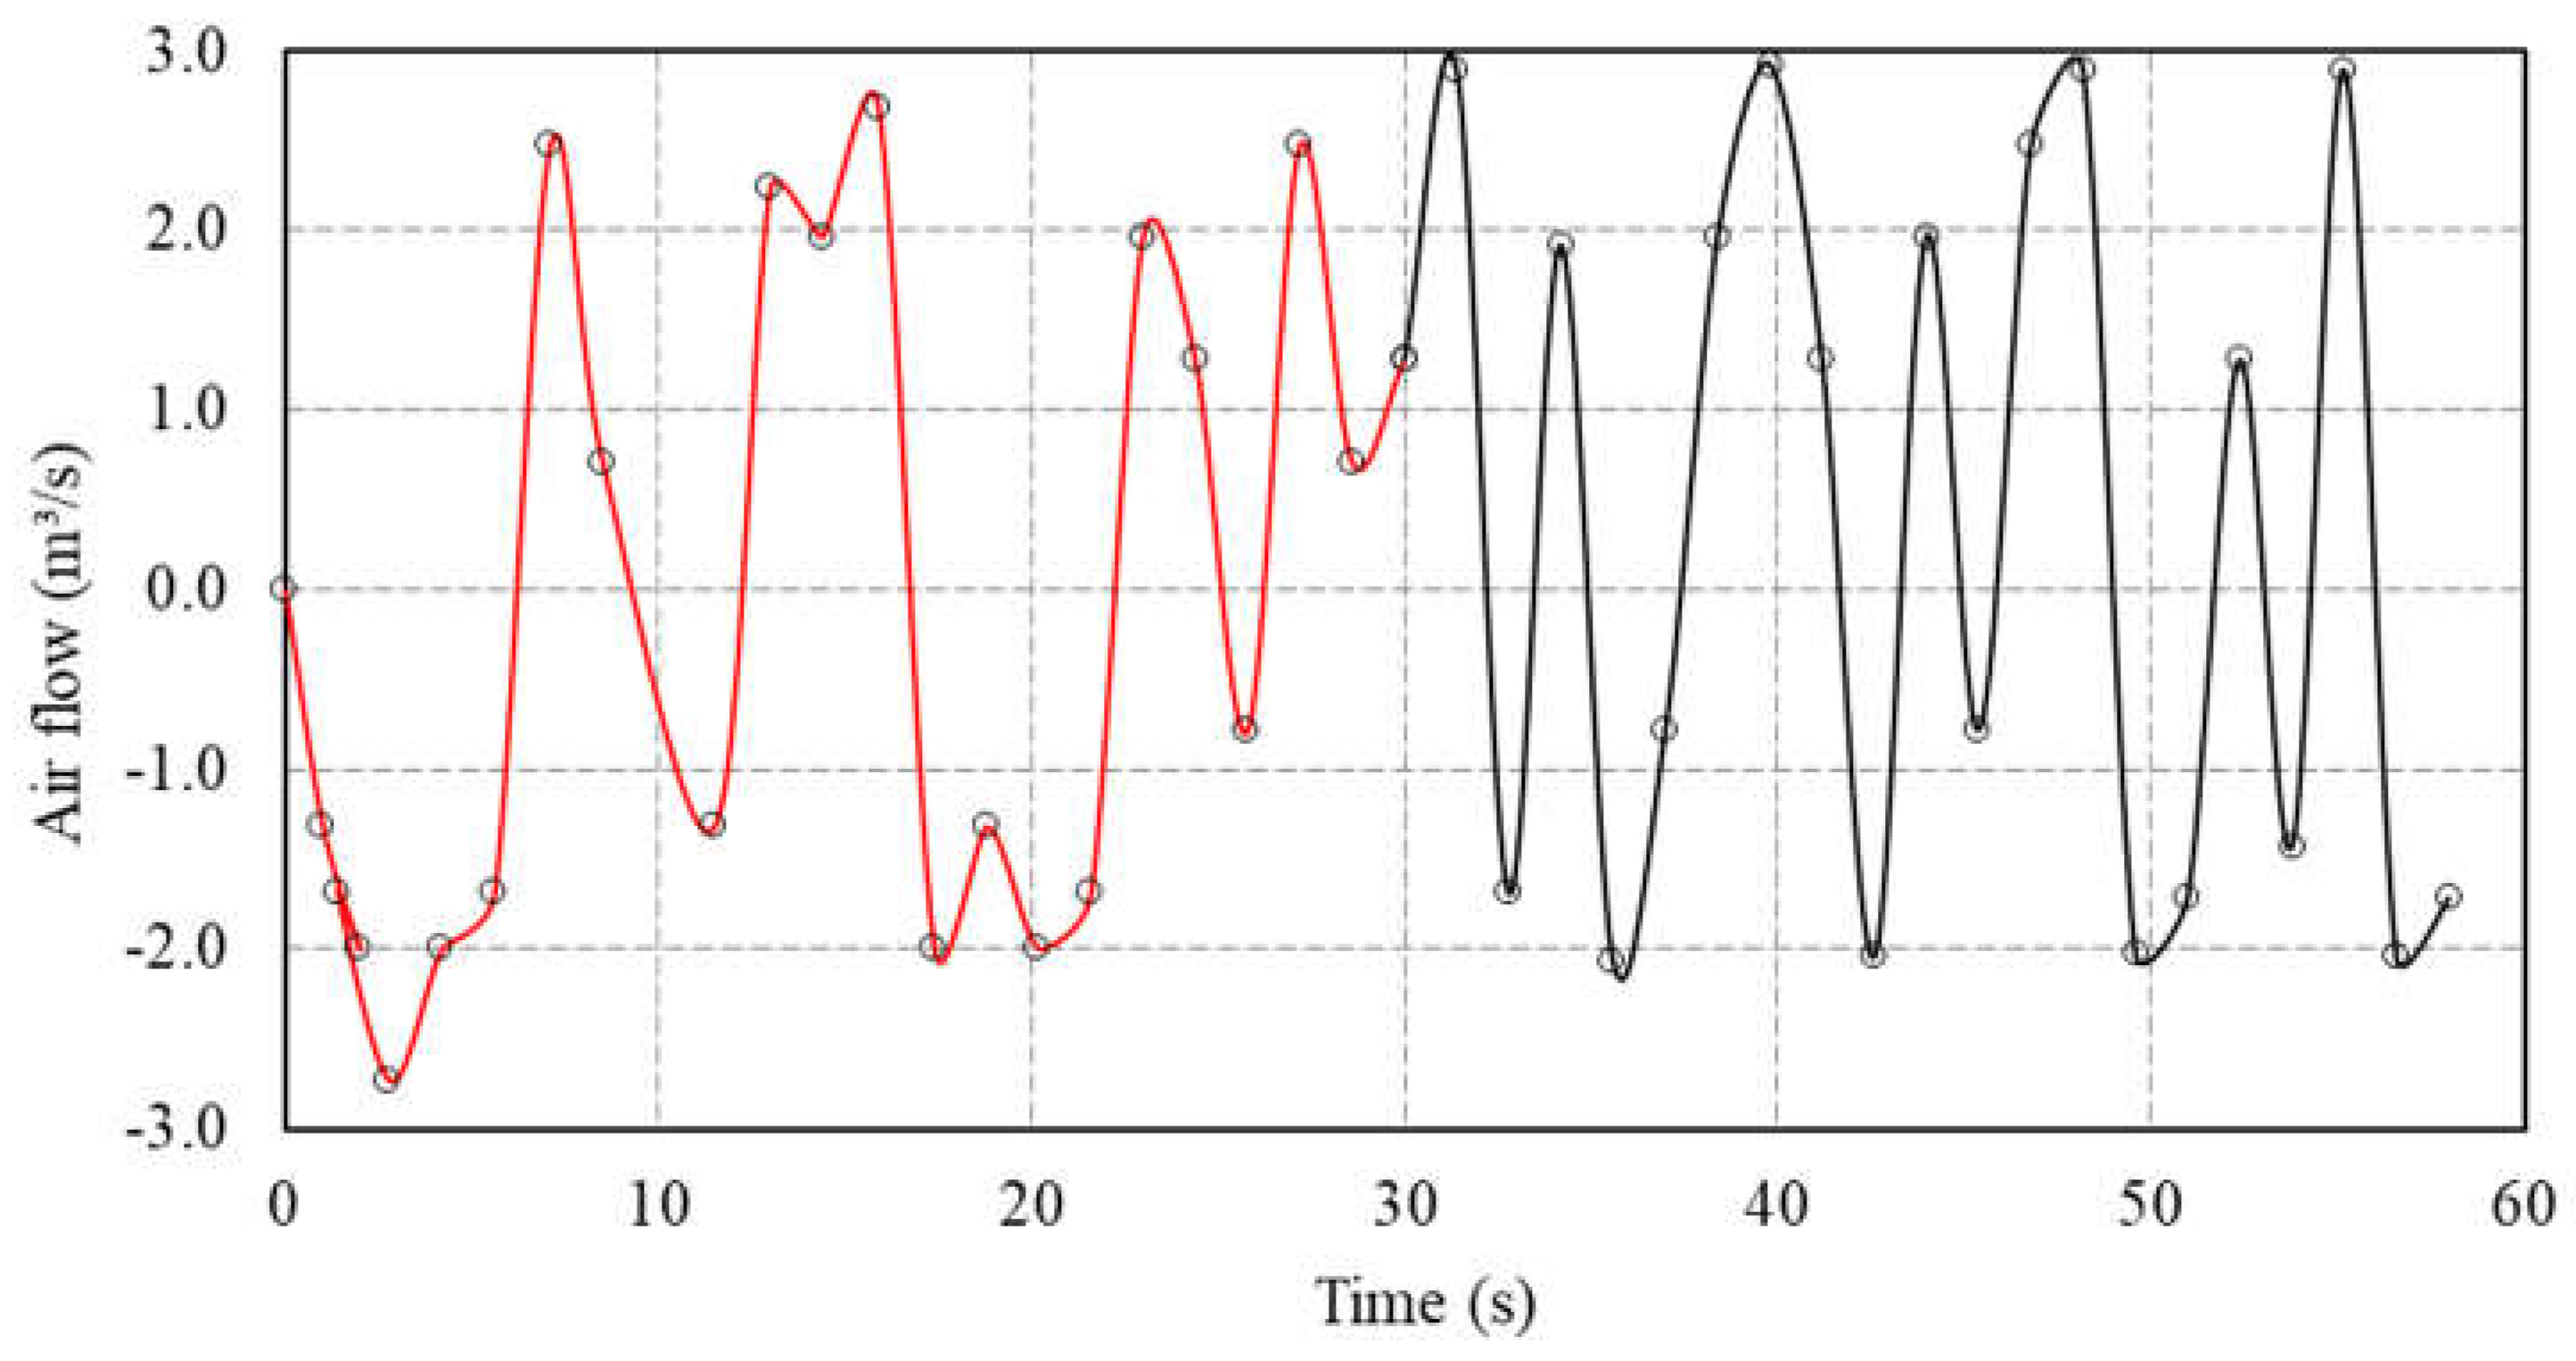
Figure 5 depicts the variation of air flow (calculated as described in Section 2.1) over time for a fixed pulsation of 85 CPM (1.4 cycle per second) and a peak flow of 2.9 m³/s. It can be observed that approximately 30 s are required for the ∆P signal to stabilize. A ‘stable signal’ is understood to mean the repetition of peaks and valleys and the shape (signature) of the air flow profile over time. It can be observed that the pulse takes a considerable time, approximately 30 seconds (red line), to reach stable conditions of flow rate and pulse frequency (black line). Thus, it can be inferred that tests conducted in jigging times shorter than 30 s would not be representative of the jigging conditions defined in the equipment control panel.
For this reason, all segregation tests on the jig were conducted with a minimum time of 30 seconds. Figure 5 also illustrates negative air flow values, which are possibly related to the pressure wave generated by the sudden change in air velocity during the moments of closure of the butterfly valve regulating the pulse. This evidence suggests the existence of a phenomenon equivalent to suction on the bed during certain moments of the jigging cycle. While the peak airflow of the pulse was 2.9 m³/s, negative airflows (opposite to the pulse direction) reached peaks of up to 2 m³/s (about 70% of the magnitude of the pulse peaks). After stabilization (t > 30 s), two alternating peaks in pulse flow emerge: one of higher intensity (≈ 3 m³/s) and another of lower intensity (≈ 2 m³/s or lower). This behavior is unexpected beforehand given the butterfly-type valve controlling the jig pulse, ideally resulting in repeated peaks of similar intensity.
To examine whether the observed pattern persisted across various pulsation conditions, we compared air flow curves for different blower power used, as depicted in Figure 6. Notably, at lower airflow rates (20% blower power), the curve displayed a well-defined and harmonious pattern over time, characterized by distinct yet similar peaks and valleys. Additionally, it exhibited a consistent wave period and frequency of 3 s and 0.33 Hz (≈ 20 CPM, closely aligned with the value specified in the control panel), respectively. However, at significantly higher airflow rates (60% and 95% blower power), the air flow profile becomes erratic, displaying peaks and valleys of varying magnitudes, including notably negative ones. The wave period and frequency also fluctuate and do not align with the rotation of the butterfly valve displayed by the jig panel.
At least two factors may be related to the described discrepancy: (1) the valve rotation does not correspond to that indicated on the panel; (2) as the airflow increases, the momentary trapping of air during the fraction of seconds the valve remains closed generates an increasing “pressure blow,” causing a sudden increase in impulsion (and suction) that leads to a mismatch between the pulse frequency and the valve rotation frequency. Since for low airflow rates the frequencies (of ∆P and the valve) were in sync, it is reasonable to assume that the first hypothesis does not apply.
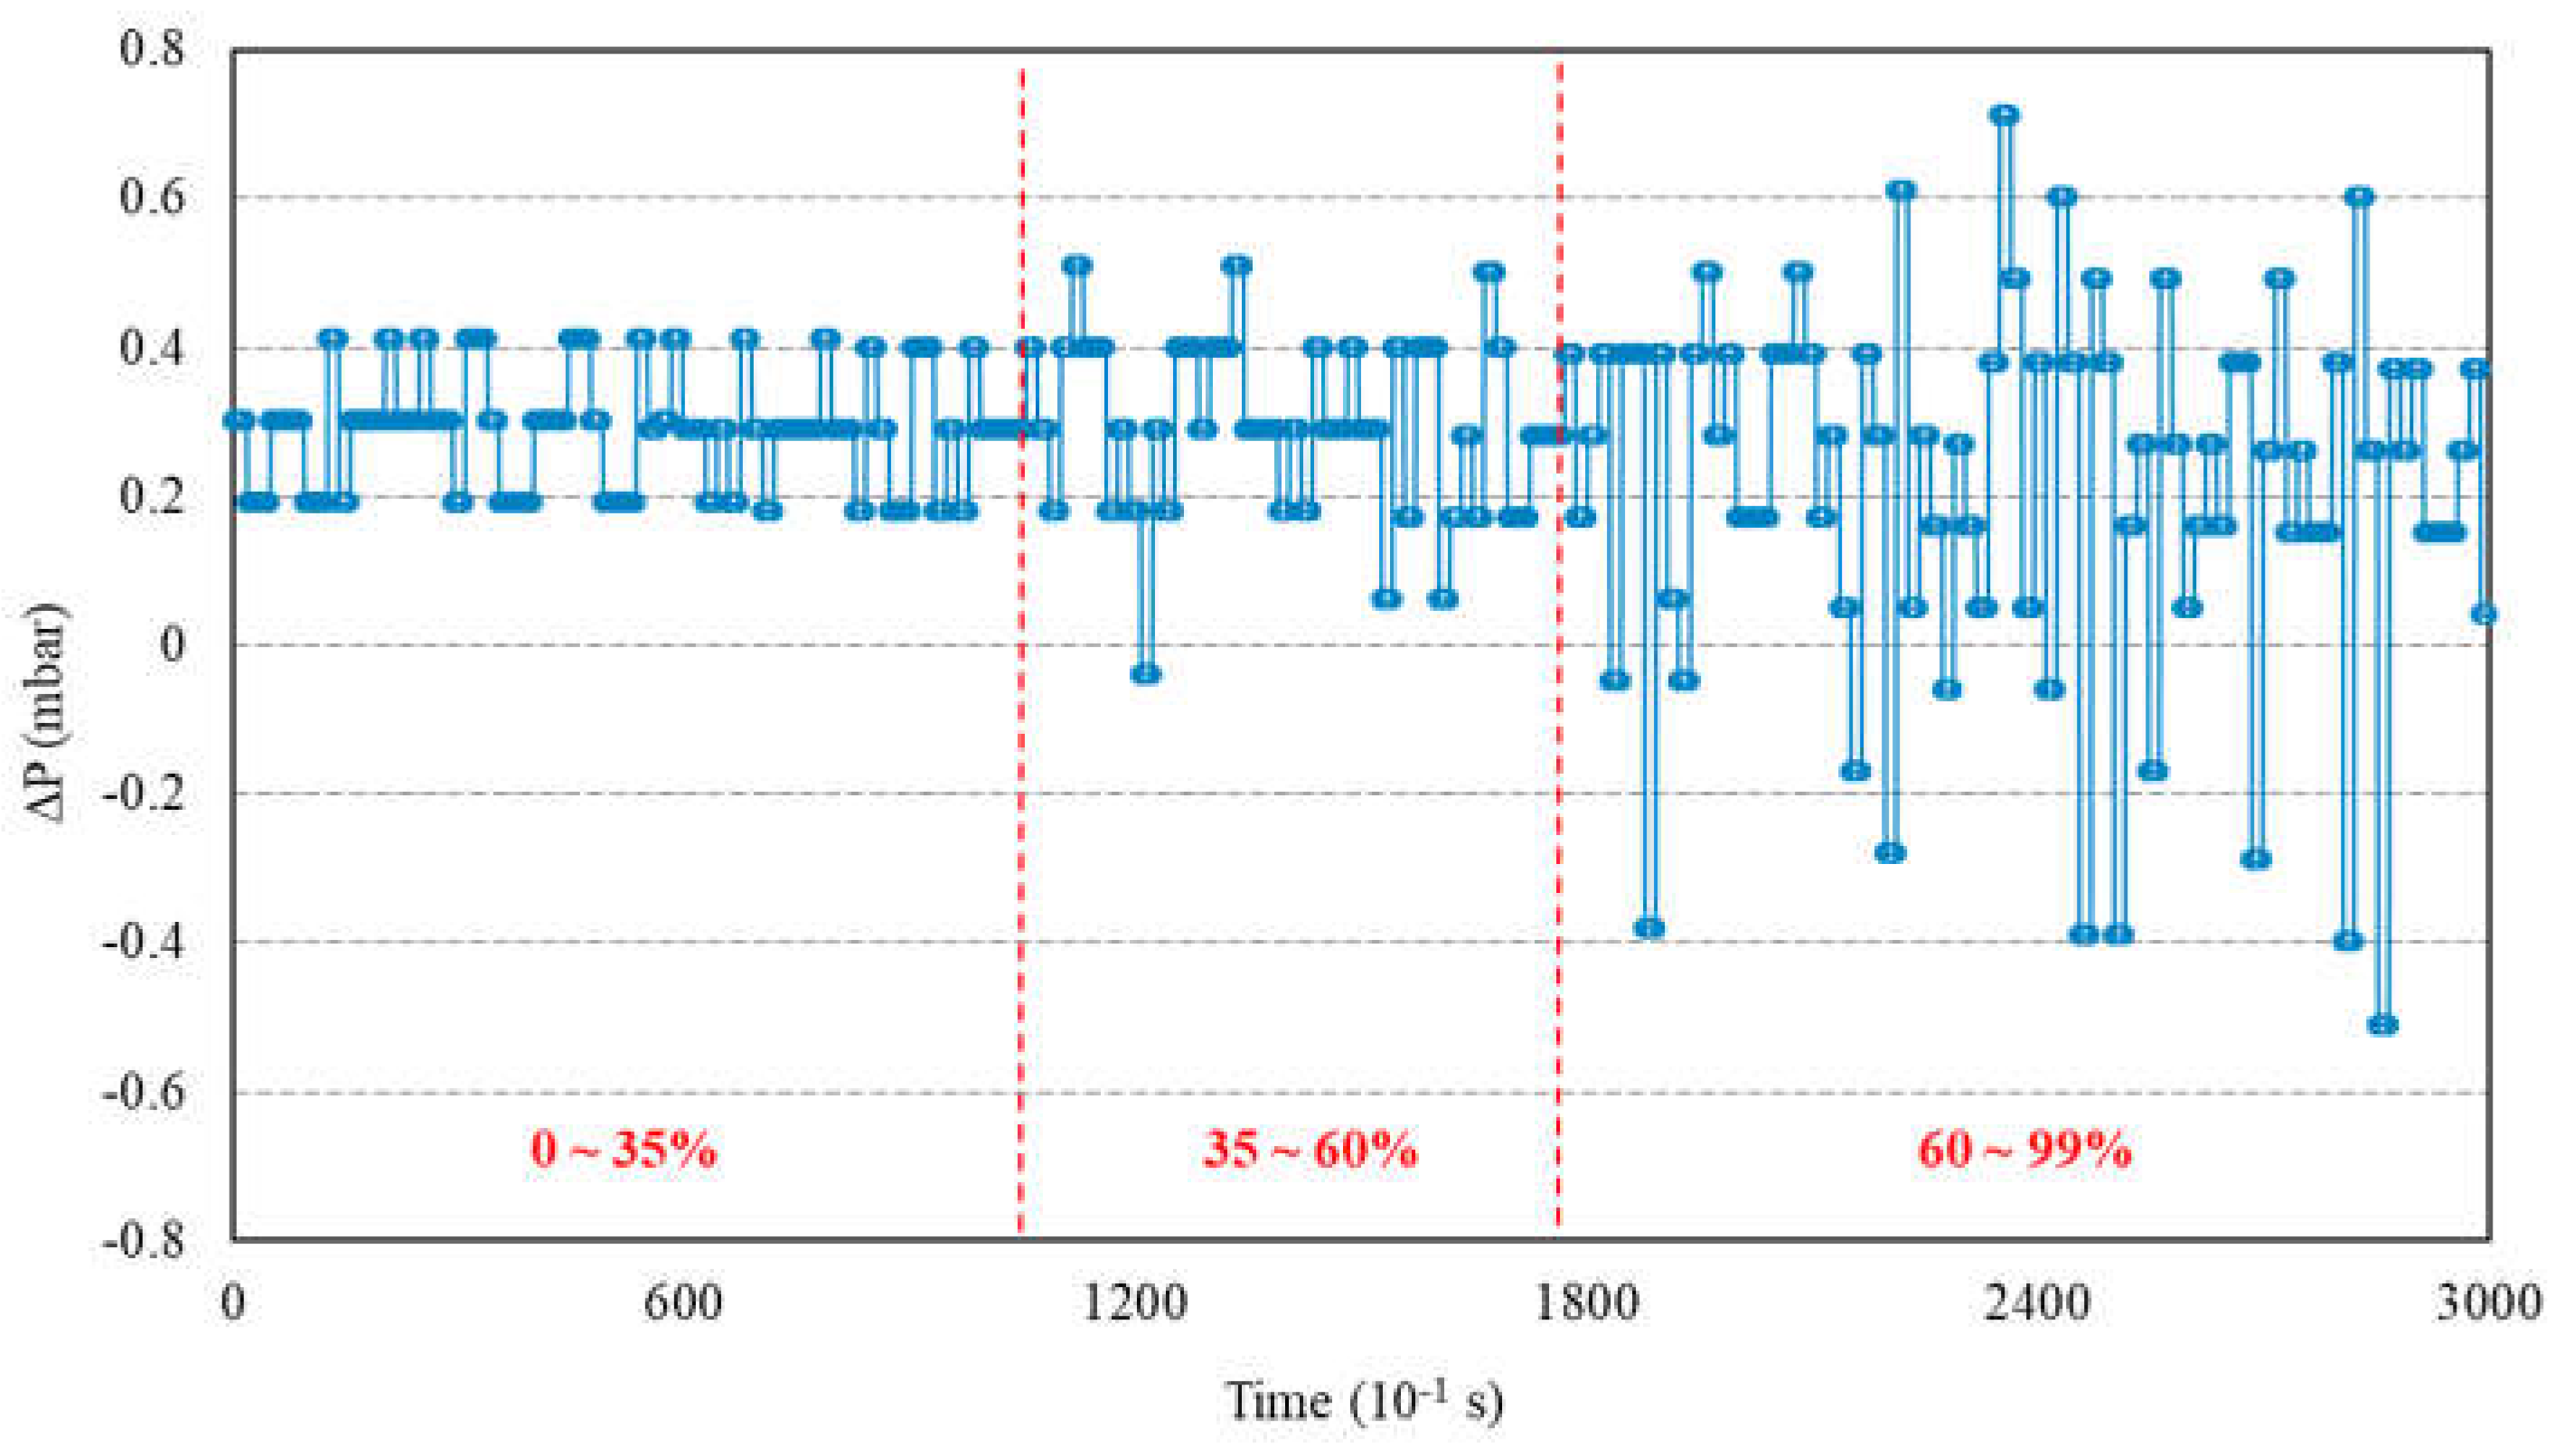
Evaluating the variations of ∆P across the entire spectrum of jig airflow rates, as shown in Figure 7, can be a way to assess the significance of the second hypothesis. It is noted that the ∆P signal presents three distinct phases: (a) a period of apparent stability in the range of 0–35% of blower power; (b) onset of instabilities in the range 35–60%, with discordant peaks of ∆P; (c) curves of variable ∆P peaks, indicating a high level of pulse instability as it approaches the maximum fan power.
In summary, the findings suggest that establishing the jigging cycle, particularly in dry jigging, entails factors as intricate as or possibly more intricate than those in traditional hydraulic jigging. Given that air is a compressible medium (unlike water), it experiences notable pressure fluctuations during the process, notably due to compression and suction during valve closure, which marks the cycle reversal. With air compression contingent on valve closure duration, it implies that airflow and pulsation frequency are interrelated, as evidenced by the data in Figure 6.

3.2. Energy Consumption

Dry jigs comprise two key energy-consuming components: the rotary valve and the air blower. Additionally, the jigging system may feature a fan for dust channeling to be collected in bag filters or deposited in electrostatic precipitators. The batch jig used in the tests is equipped with a suction system and dust collection via bag filters.
Given their capacity for high tonnages and their application at the beginning of the mineral processing chain, particularly in typical coarse mineral pre-concentration operations, dry jigs may require a significant amount of energy. As highlighted in the study by Coelho and de Brito [17], dry jigs can incur the highest energy costs in simple processing plants, such as those handling construction and demolition waste. Thus, a more comprehensive investigation into the energy consumption profile of this operation is warranted.
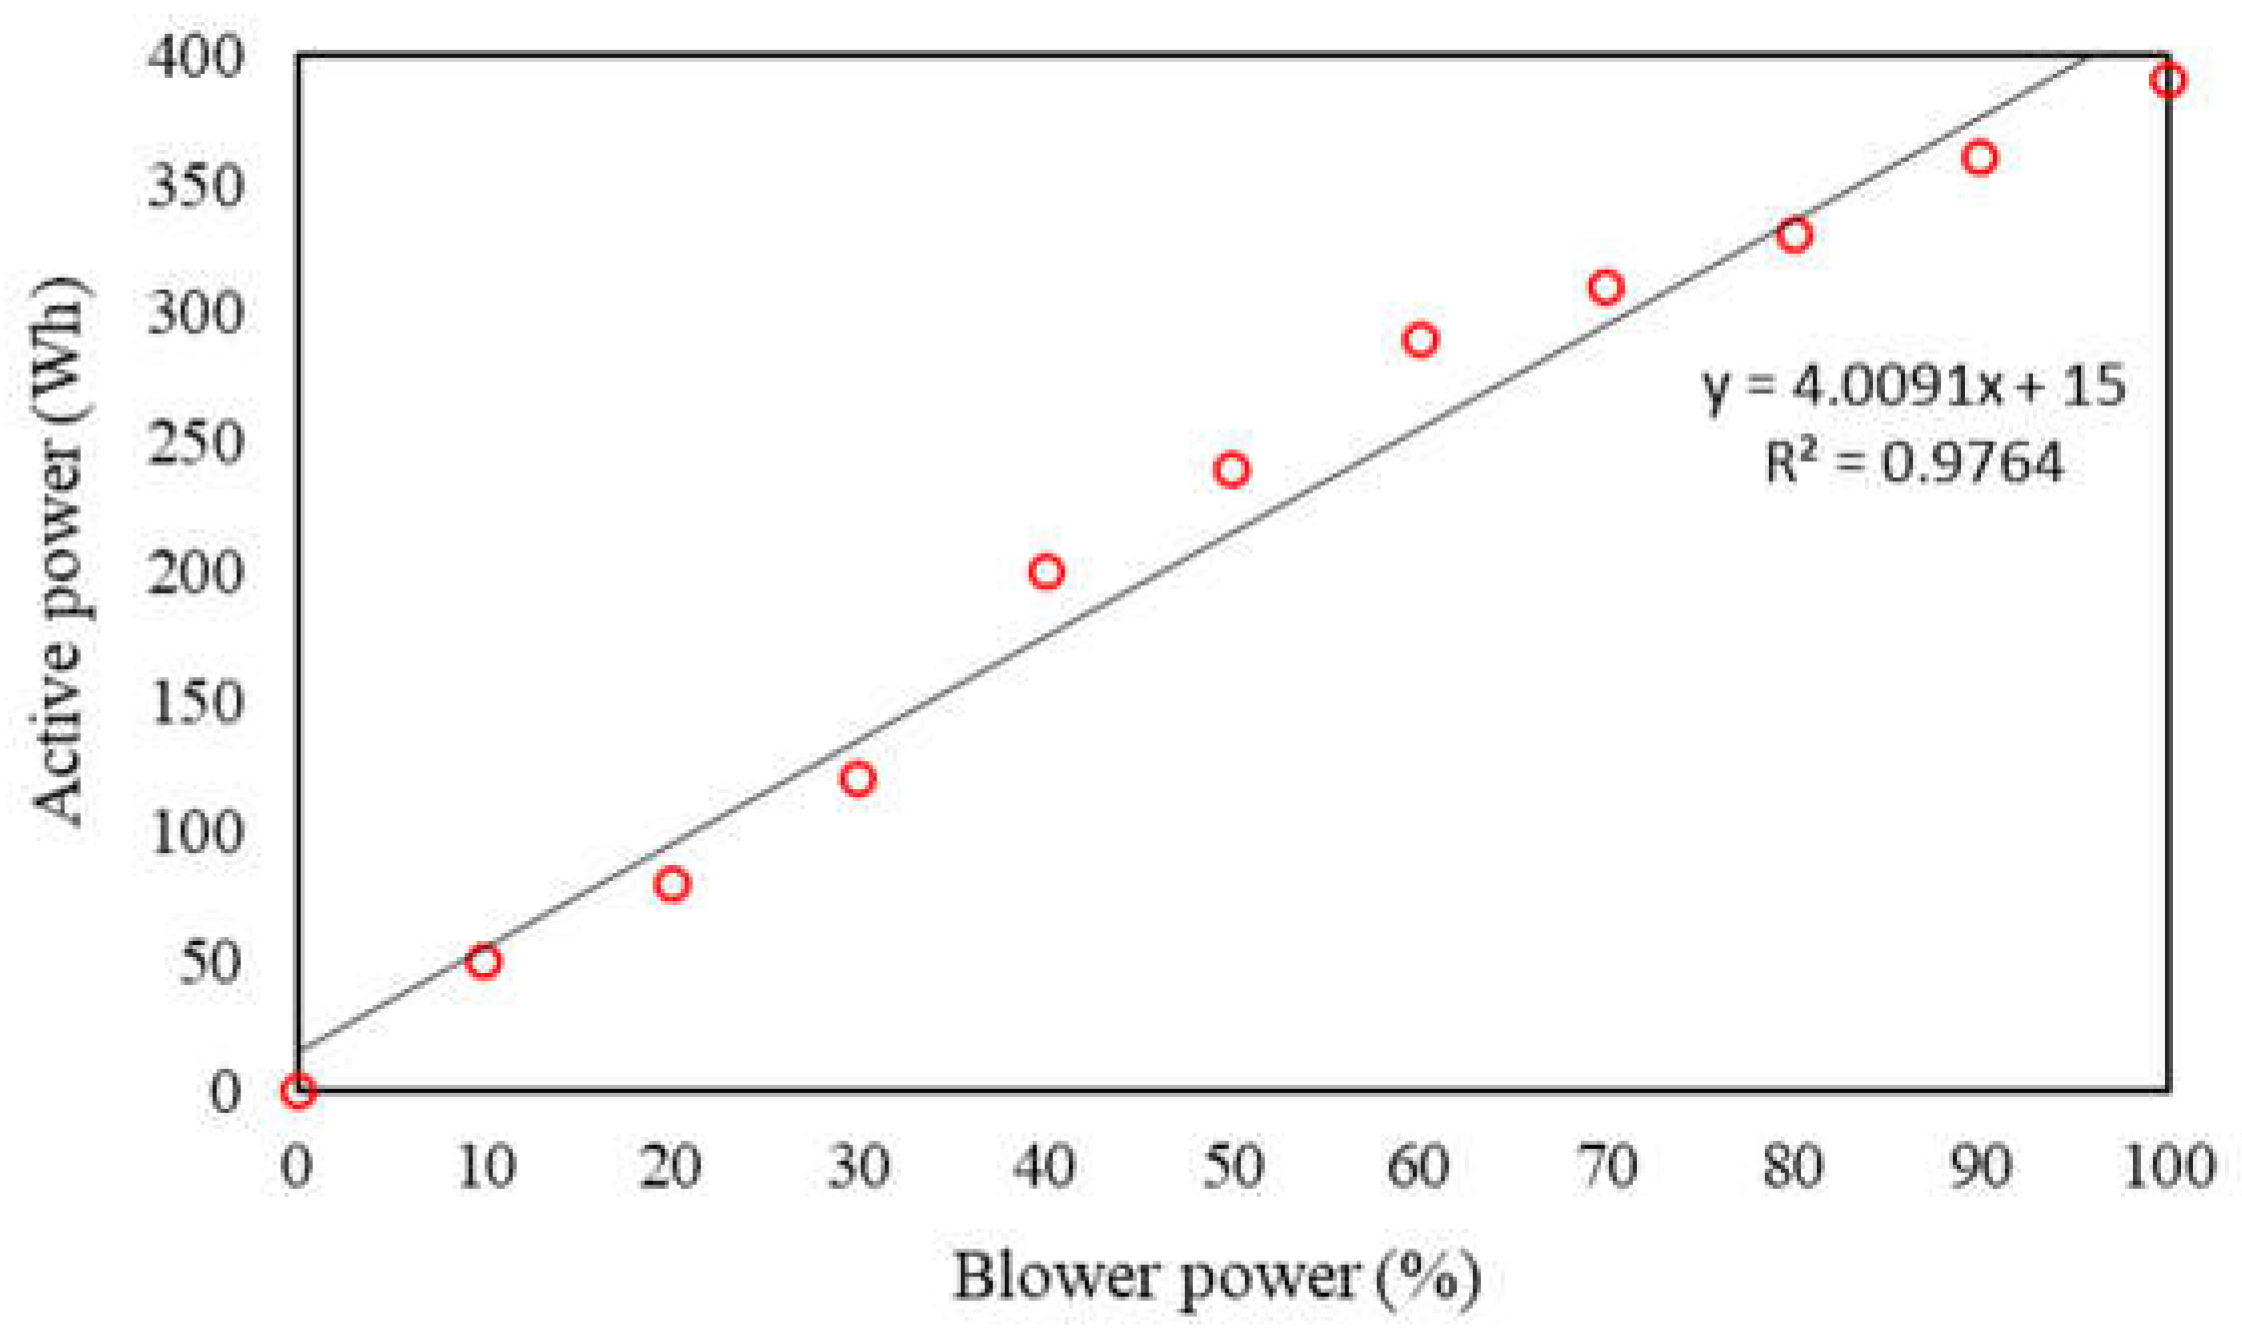
Figure 8 depicts the useful (active) power curve as a function of the percentage of airflow from the blower. A nearly linear increase in energy consumption is observed as the blower flow rate increases, with the peak consumption reaching approximately 400 Wh. It is important to note that the curve only considers the power associated with the air blower. For the operation of the rotary valve of the jig, the average useful power demanded across the entire operational range (10 to 400 CPM) is 54.74 ± 5.41 Wh. The slight variation in consumption with rotation is because most of the power is consumed in driving the valve. The dust collection system, specifically the fan generating suction in the duct, showed a fixed consumption of 40 Wh.
For the pulsation conditions used in the tests, the overall energy consumption measured in the jig was 496.82 Wh. With the total weight of the gravel bed plus tracers totaling 46.6 kg of material, the specific energy consumption was 10.66 Wh/kg of jigged material. Thus, if 30 tons/h of construction and demolition waste were processed in a dry jig, as described by Coelho and de Brito [17], the required energy would be 319.8 kW, approximately 12% higher than that indicated by the authors (282.5 kWh/jig). The higher consumption detected in this study may result from characteristics of the local electrical installations. In this regard, it is important to note that the reactive power of the electrical grid is not being accounted for.

3.3. Stratification Evolution over Time

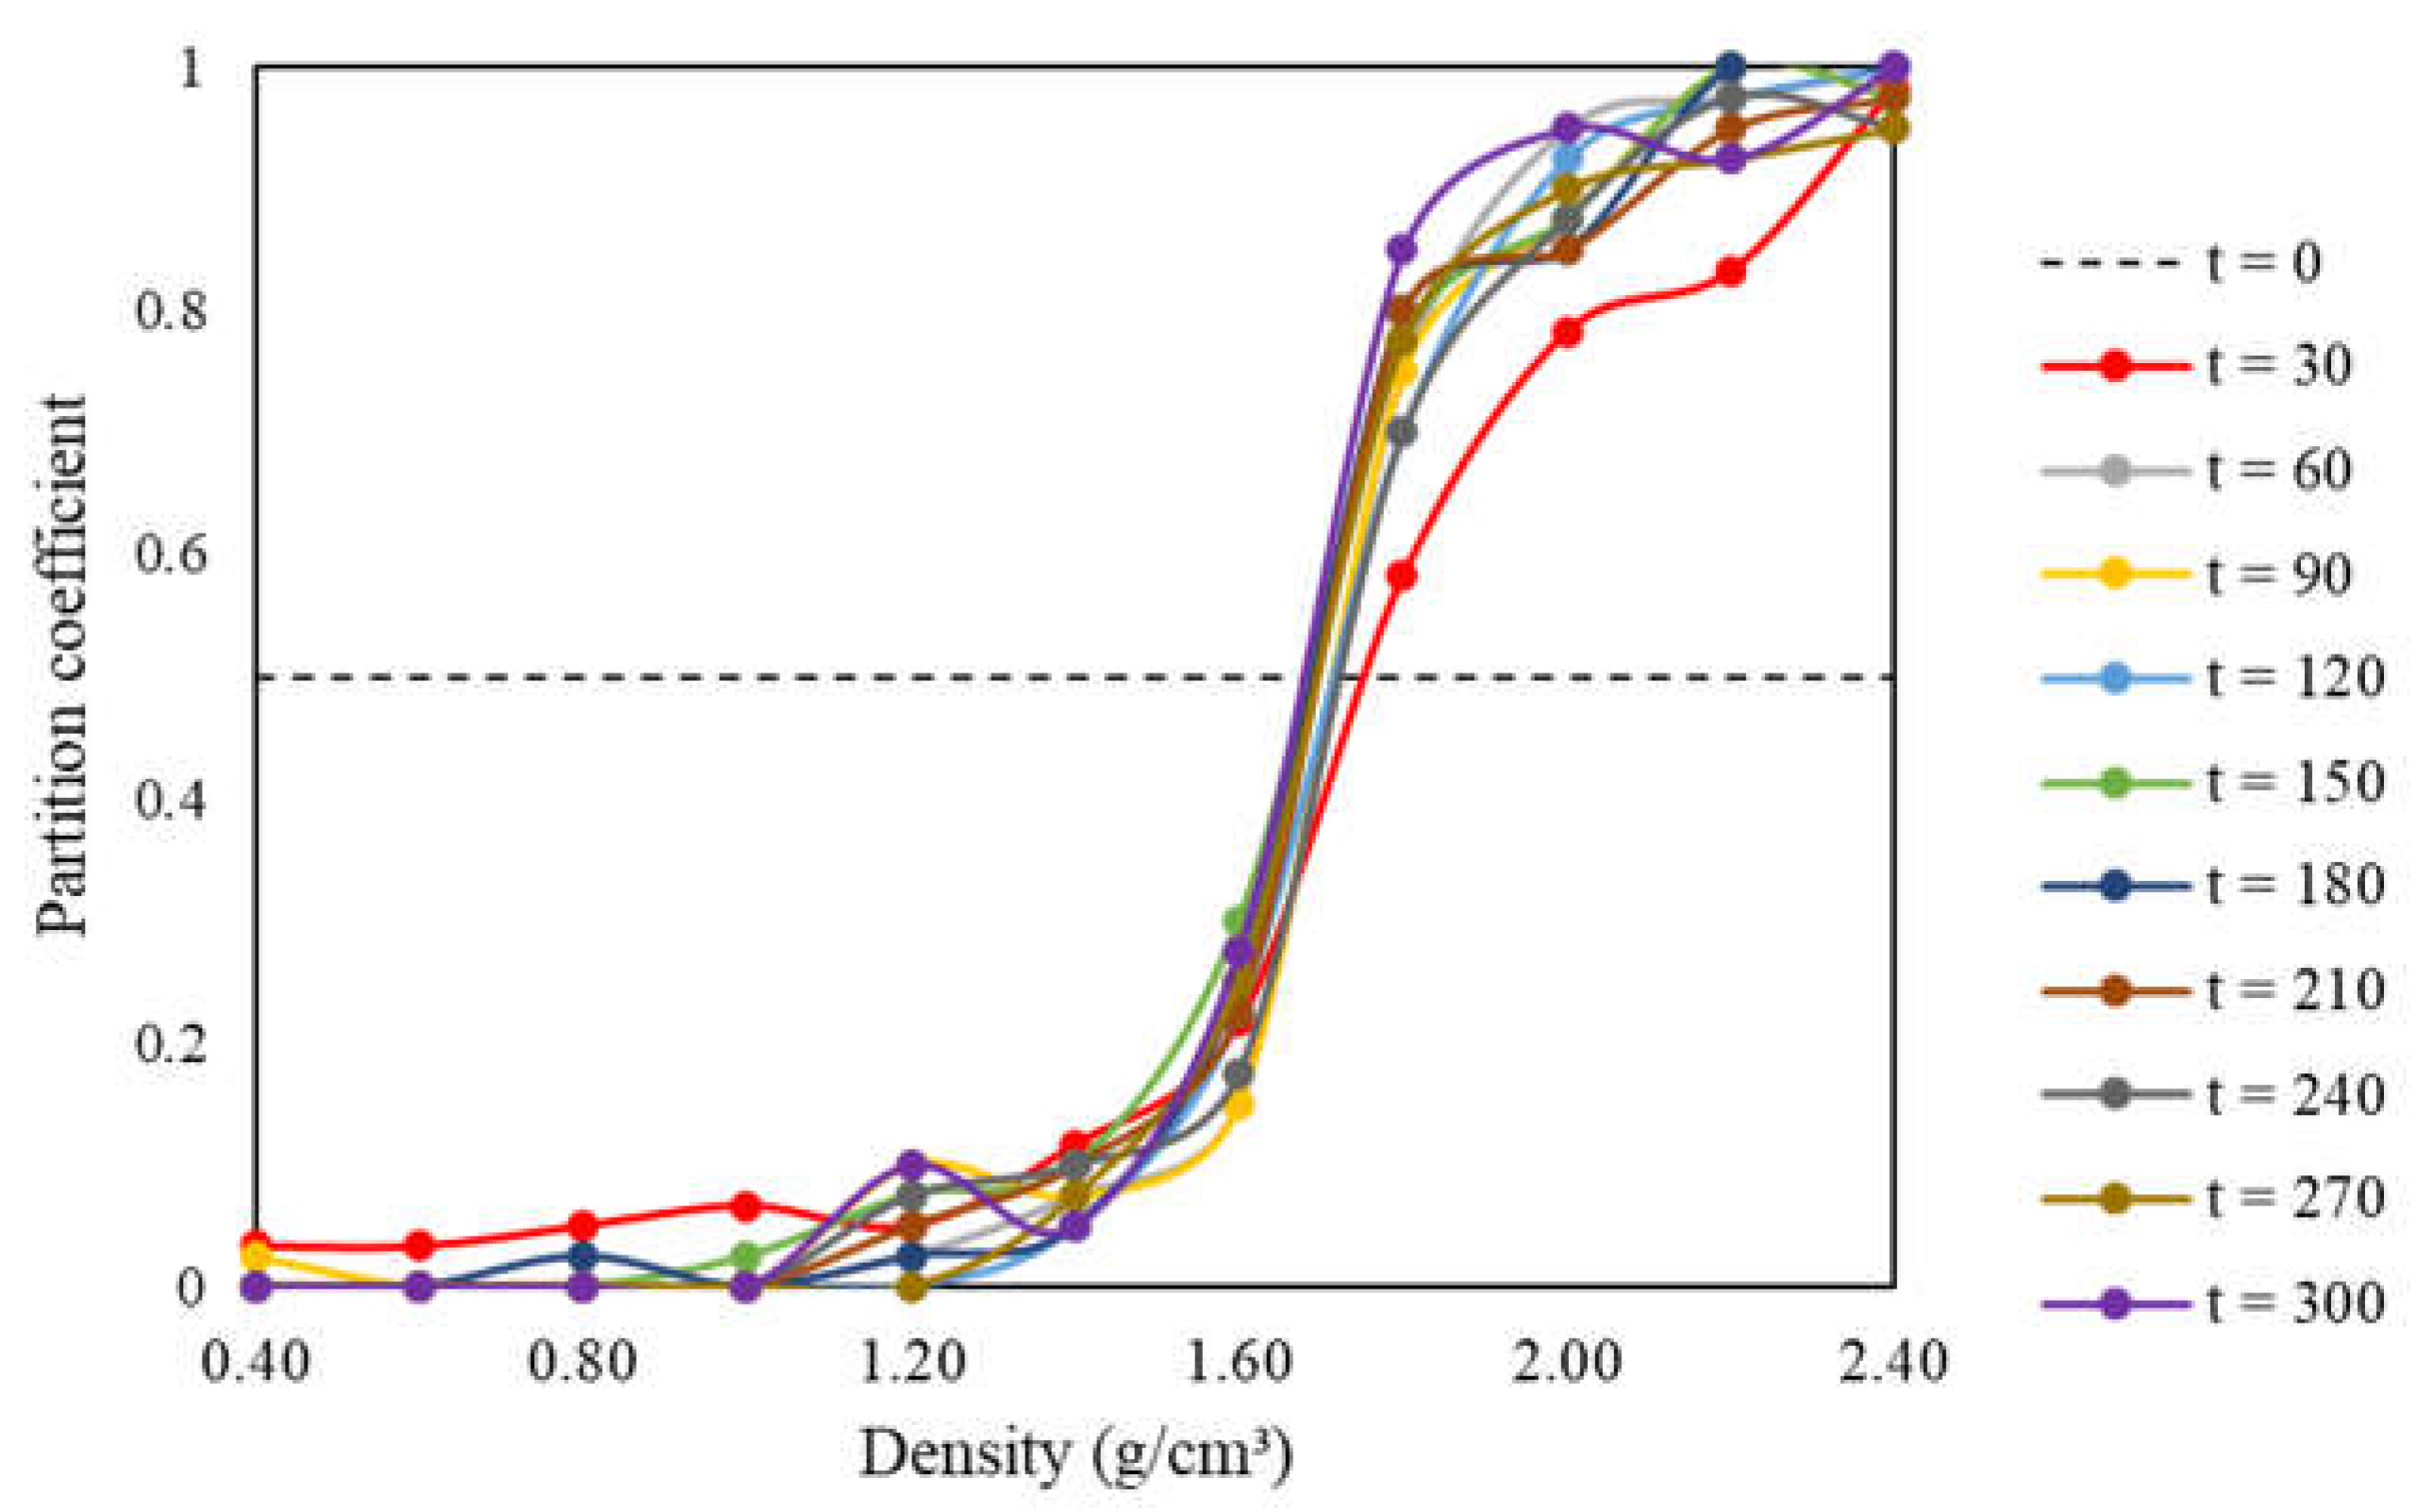
Jigging tests were conducted under the conditions described in Section 2.4 for jigging times of 30, 60, 90, 120, 150, 180, 210, 240, 270, and 300 s. The pulsation conditions were held constant at 70 CPM, with an air flow peak of 2.9 m³/s (corresponding to 95% of the maximum fan flow rate). Figure 9 and Table 3 show the joint partition curves and the resulting separation efficiency indices, respectively.
In general, the results indicate a non-asymptotic behavior of stratification in pneumatic jigs. That is, the stratification does not appear to evolve toward a defined equilibrium, with a stable distribution of tracers along the stratified bed, but rather to continuously vary with time due to possible remixing of previously segregated tracers.
Except for t = 30 s, the partition curves appear overlapped within the range of calculation of the mean probable error (between ρ 25 and ρ 75 ). On the other hand, there is a significant variation in the partition profiles for the higher density ranges (> ρ 75 ), an issue that will be discussed further.
From 60 s onwards, an oscillatory behavior in the values of Ep can be observed, sometimes decreasing, and sometimes increasing at each interval of + 60 s. For the times of 60 and 90 s, Ep = 0.08, increasing in the next two-time steps, returning to a level of Ep < 0.1 thereafter, and finally increasing again for t = 270 and 300 s.
The results highlight the fact that remixing is an evident phenomenon in dry jigging, which is one of the factors contributing to its usual low efficiency of stratification. It is reasonable to presume that this is associated with the need for high air pulse velocities, compared to water pulses, due to the significantly lower density of air compared to water. Therefore, for dry jigging, due to the specific characteristics of air, the remixing effect is more pronounced, making it difficult to achieve a defined final state of equilibrium, even with long jigging times. Regarding the variation in Ep values, alternations in partitioning can be observed every 60 seconds, suggesting that this is an intrinsic phenomenon to the dry jigging process.
The value of Ep = 0.1 is emblematic because, according to Sampaio and Tavares [5], it distinguishes high-performance gravity concentration equipment (dense media cyclones, centrifugal separators, etc., where Ep < 0.1) from lower-performance ones (autogenous separators, some jigs, etc., where Ep > 0.1). Thus, the oscillatory behavior demonstrated by the partition over time can be roughly approximated as an alternation between states of high and low separation performance in the jig.
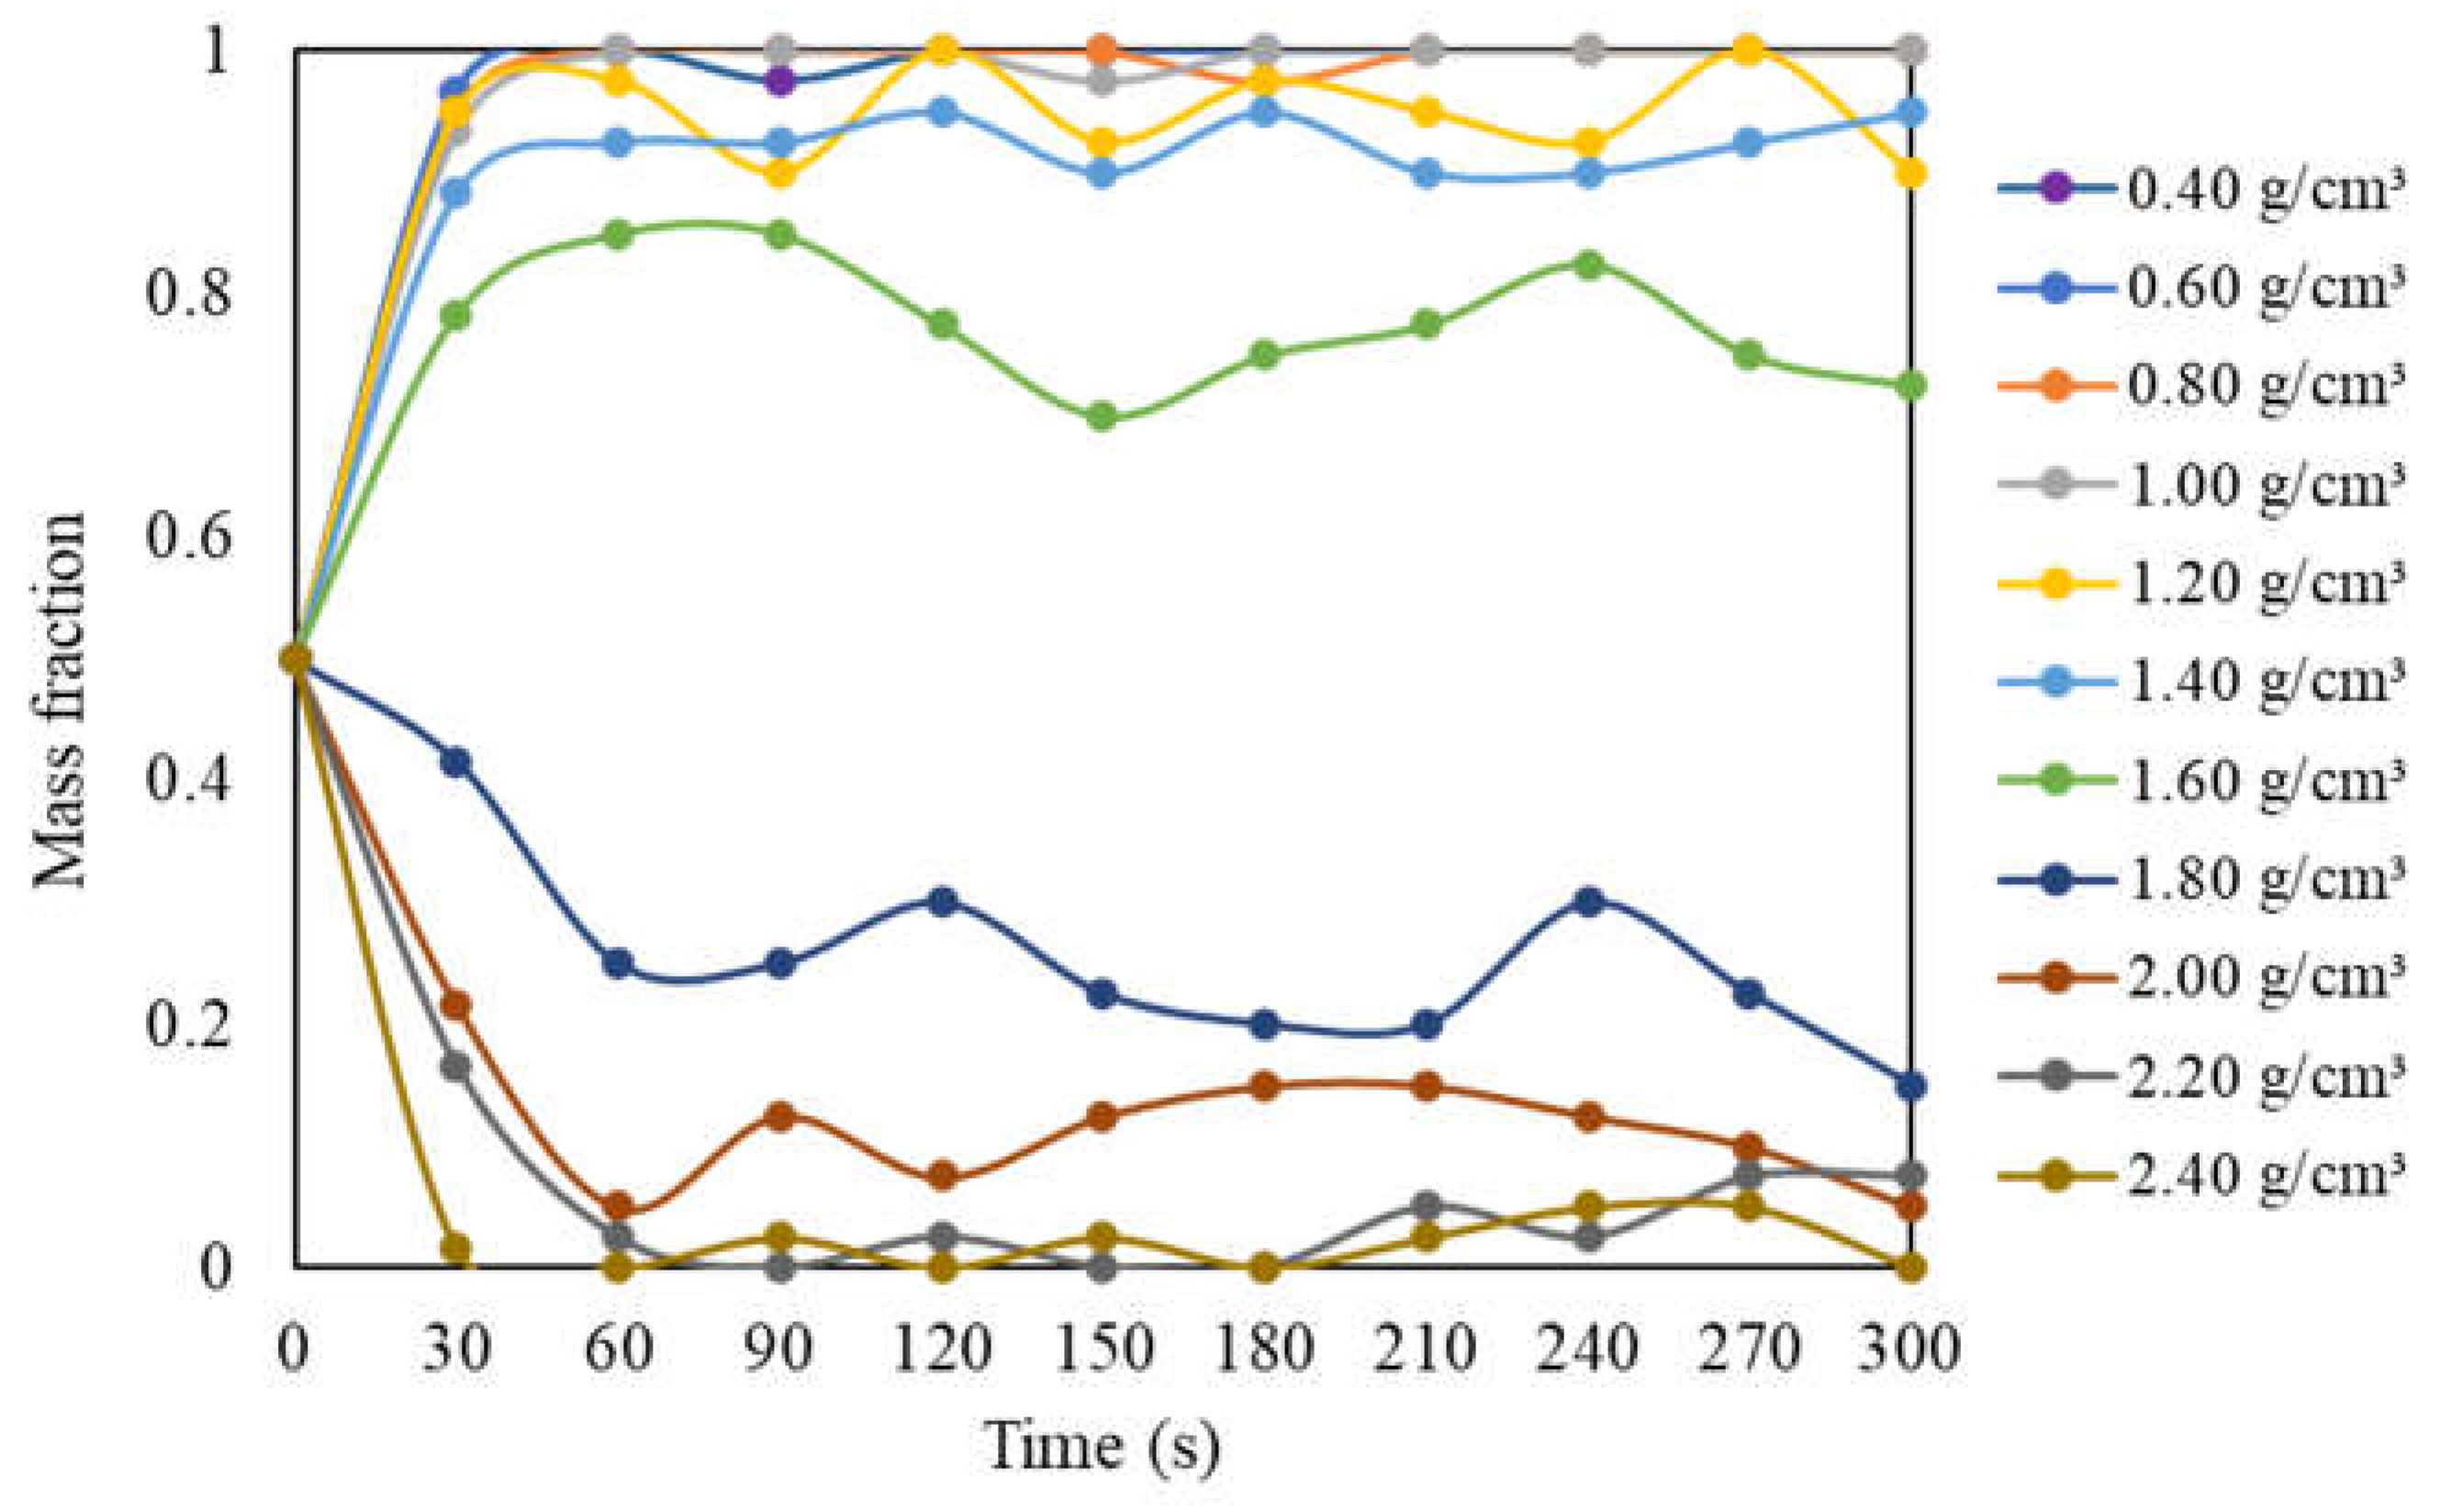
The trend observed in the partition analysis can be better visualized by considering the distribution of tracers in the stratified bed (Figure 10). A general trend of rapid concentration of lighter tracers in the light product can be noticed, while denser tracers decrease their concentration, indicating their transfer to the dense product zone. In fact, three distinct behaviors can be observed: that of lighter tracers ( ρ < 1.4 g/cm³), which rapidly concentrate in the light product of the jig; denser tracers ( ρ > 2 g/cm³), which concentrate in the dense product; and tracers with intermediate densities ( ρ = 1.6 and 1.8 g/cm³), which exhibit a more pronounced oscillatory behavior regarding concentration over time.
As previously described in Table 3, the values of ρ 50 (separation density) remained very close, averaging 1.71 g/cm³ (± 1.34% standard deviation). The tracers that showed a more oscillating concentration over time were precisely those found in the near-gravity material (NGM) range, that is, at densities distant by ± 0.1 g/cm³ from the separation density [16].
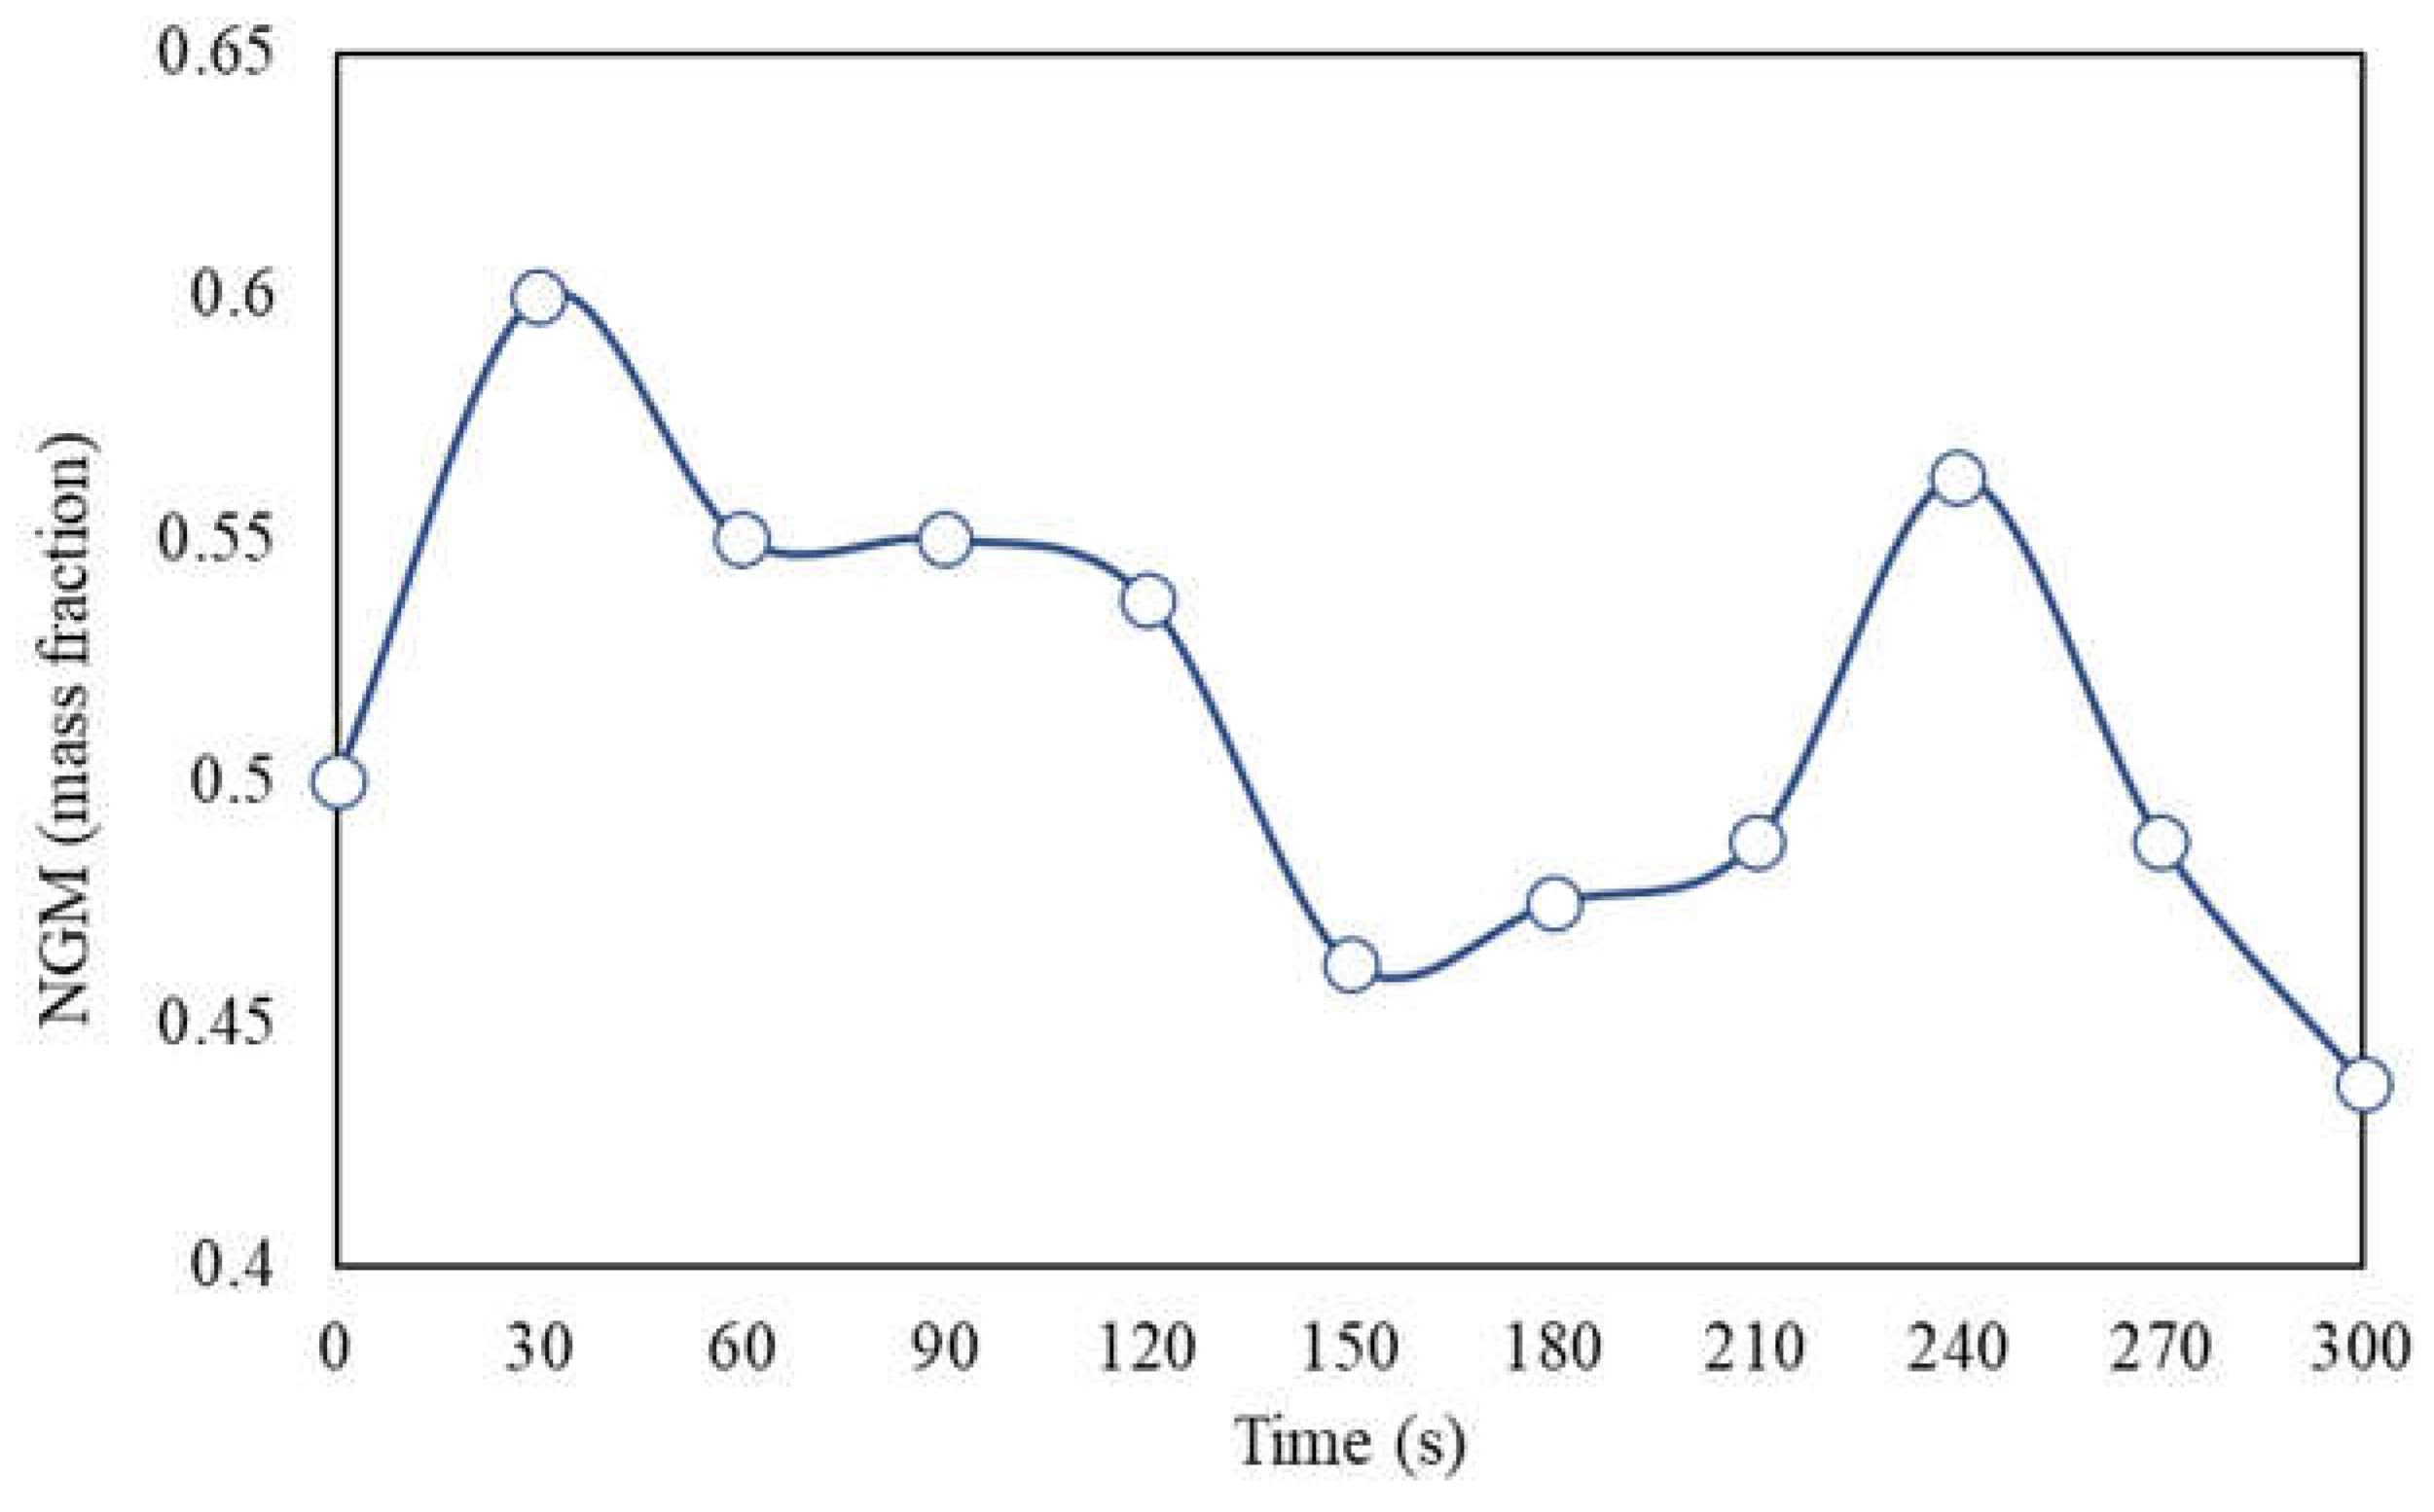
An interesting behavior of the NGM can be observed in Figure 11. At certain intervals, peaks of variation in the NGM concentration of up to 10% are noticeable every 60 s (between 30 - 90 s, 90 - 150 s, and 180 - 240 s). This behavior suggests that tracers in this density range do not find stable positions as the bed stratifies but apparently remain in constant motion as the bed pulses, sometimes rising and concentrating in upper portions (light product) or descending and penetrating the lower portion of the bed (dense product, which includes 2 out of 3 layers of the bed).
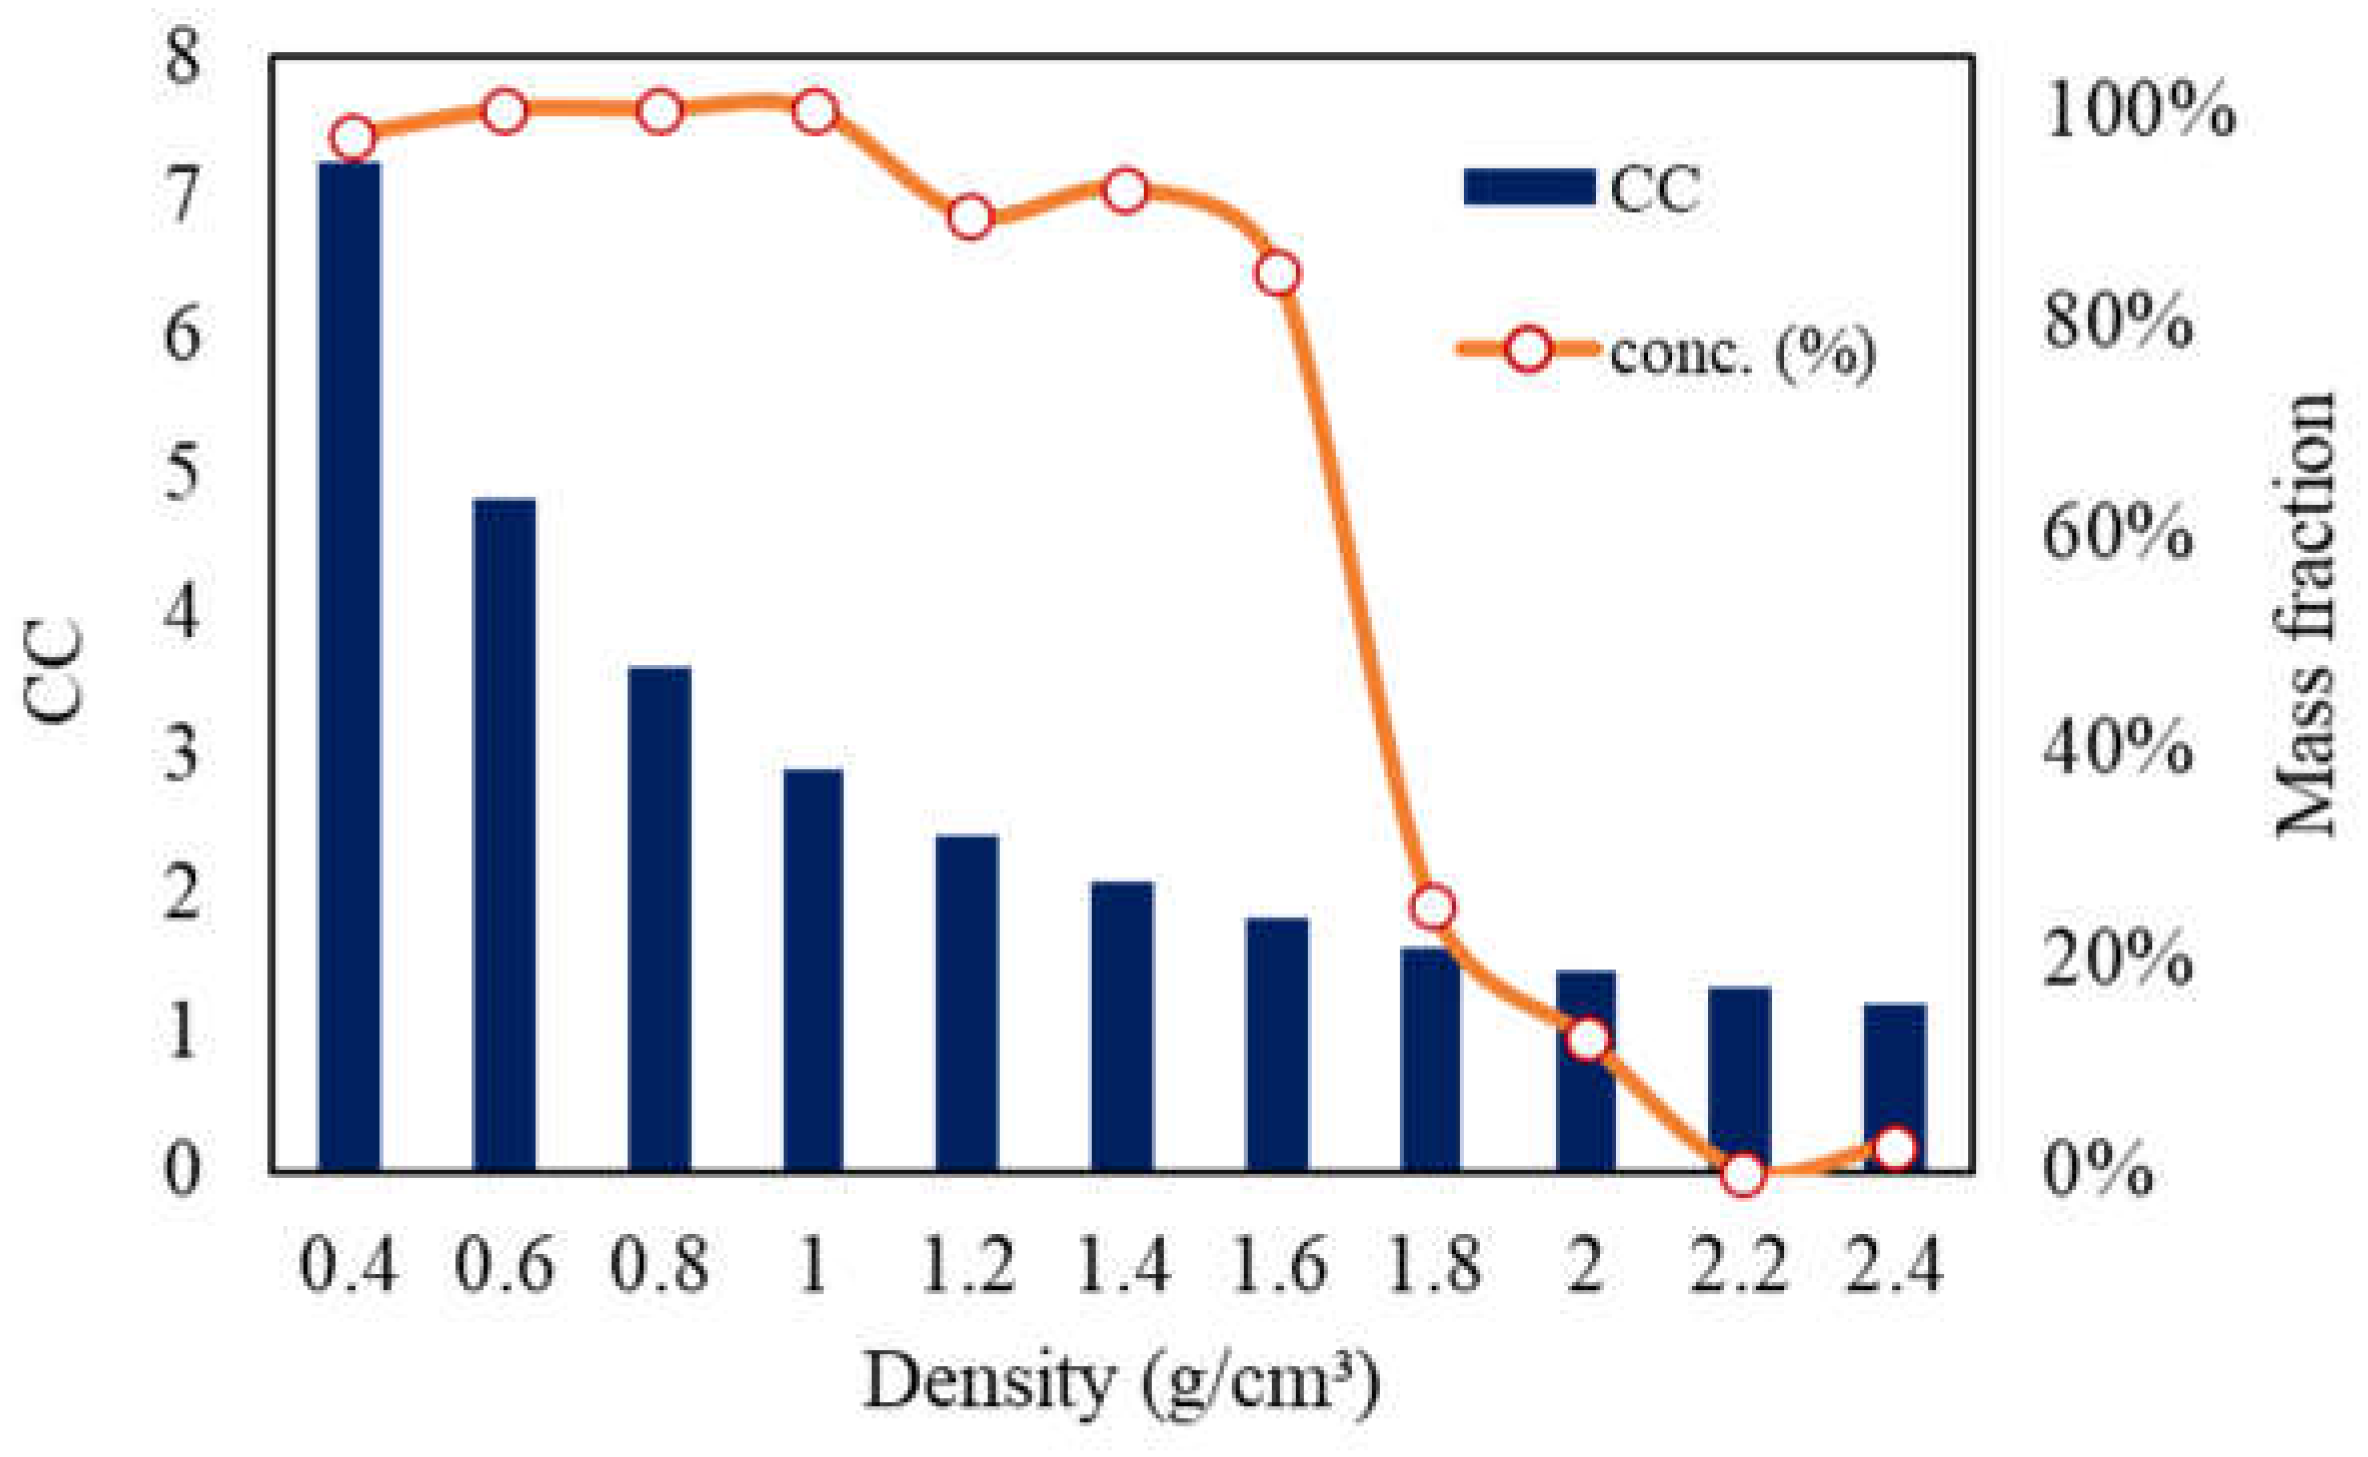
Another way to interpret the distribution of tracers in the stratified bed is presented in Figure 12. Here, it is noticeable that the trend of concentration in the light product is proportional to the concentration criterion, calculated for separation in air in the Newton regime, according to equation (1), and for the case of ρ d e n s e = 2.89 g/cm³ (density of the gravel). It can be observed that for CC ≥ 3, in the density range of -1 g/cm³, the separation is almost complete, whereas for CC < 1, concerning the density range of +2 g/cm³, the separation is almost negligible. Between these limits, the density range 1.2 - 1.8 g/cm³ progressively decreases its concentration in the light fraction as the CC value decreases. The analysis of CC values confirms the possibility that differences in size and geometry between tracers and bed, even if small, may have significantly influenced segregation, with these differences being more important as the density of the tracers approached the density of the bed (especially for CC < 1).

3.4. Transient Pulsation

The results of transient pulsation tests are divided into two categories based on the overall response observed for each experimental setup: (1) Pulsation with progressively decreasing bed movement amplitude; (2) Pulsation with progressively increasing bed movement amplitude.
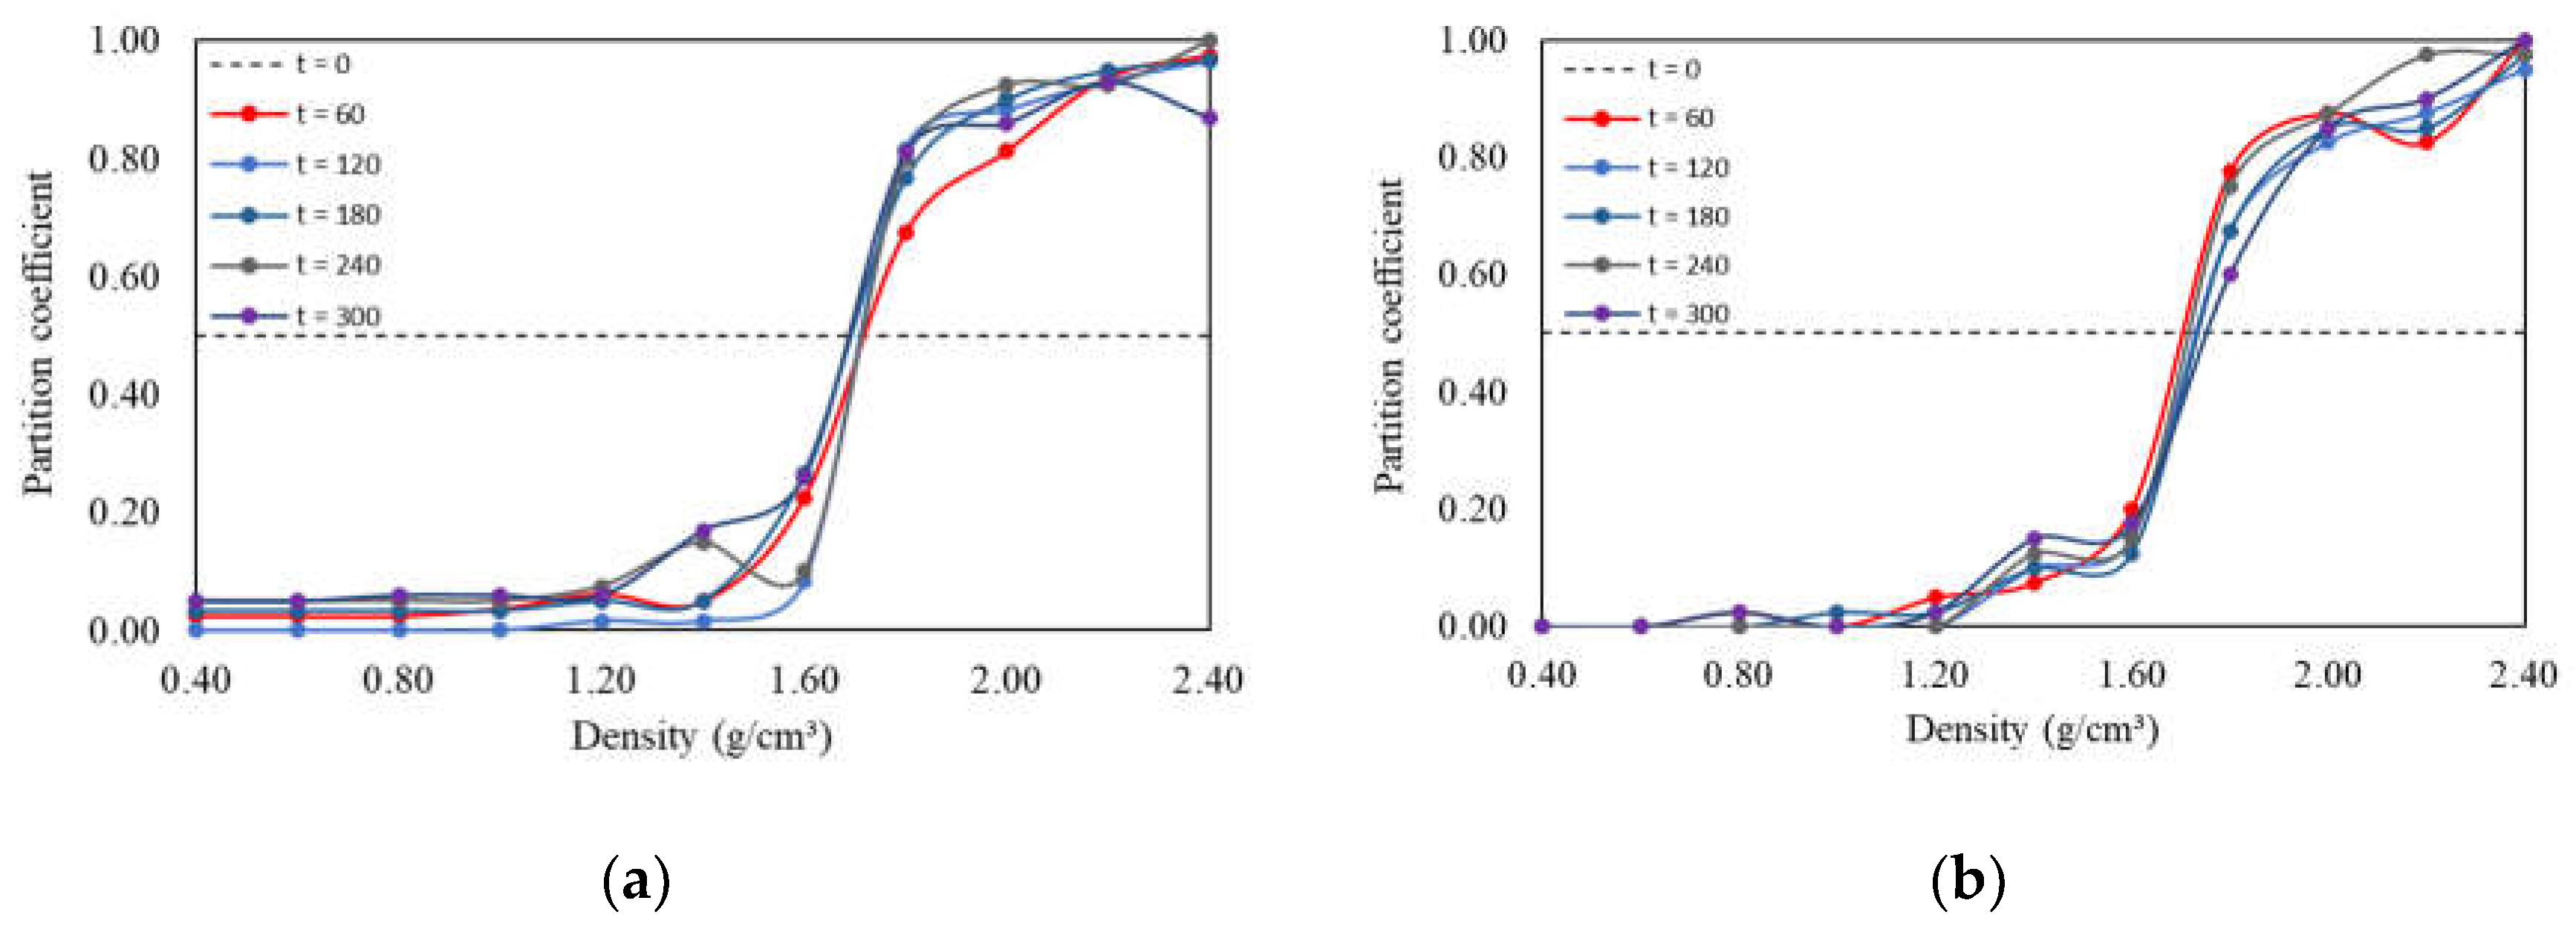
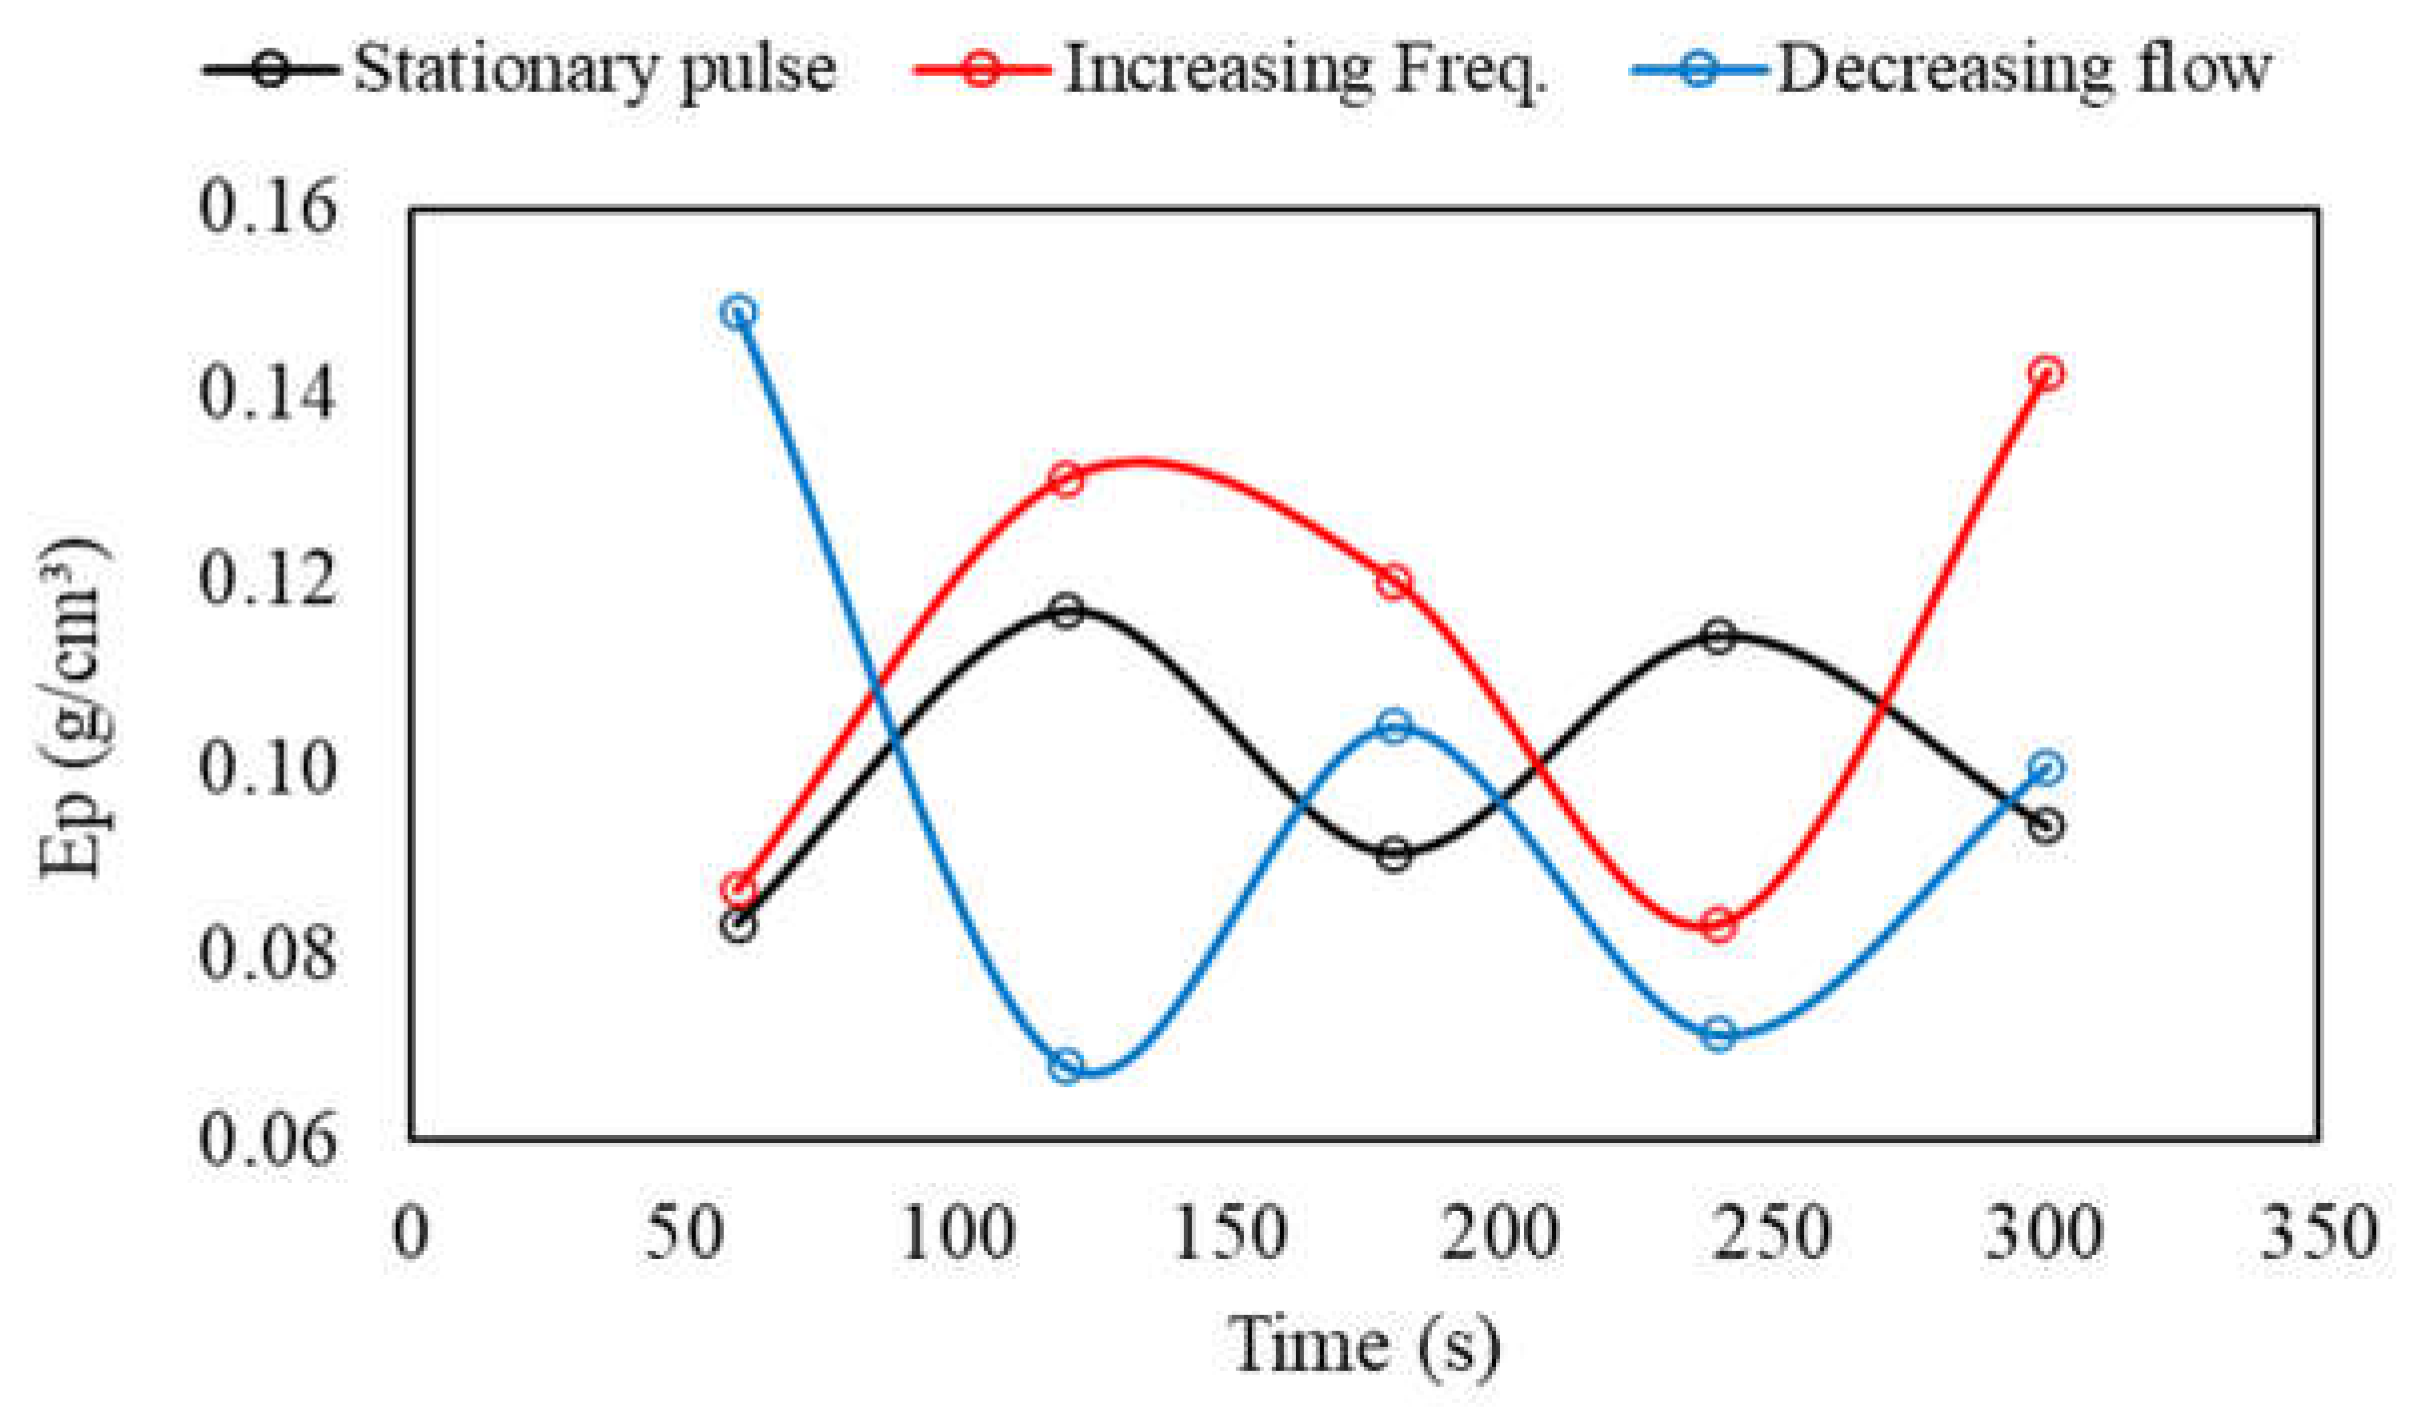
Figure 13 and Table 4 display the partition curves and their respective indices for the tests with transient flow pulse of decreasing flow rate and increasing frequency (case 1 mentioned above). In general, concerning separation efficiency alone, no significant differences were observed between the partitions under fixed pulsation and under the considered transient pulsation conditions. However, there were some nuanced differences. The average separation density for decreasing flow rate remained at ρ 50 = 1.71 g/cm³, but with a more consistent level of regularity (standard deviation of only 0.88% compared to 1.71% for the steady-state case). For the increasing frequency condition, the separation density was slightly higher, at 1.73 g/cm³ (± 1.08%). On the other hand, while the partition indices showed similar values, again oscillating close to Ep ≈ 0.1, their variation over time demonstrated greater inconsistency (Figure 14). In other words, the stratification became more unstable, making it harder to predict partitioning over time. The approximate oscillation period (between peaks and troughs) remained at 60 s.
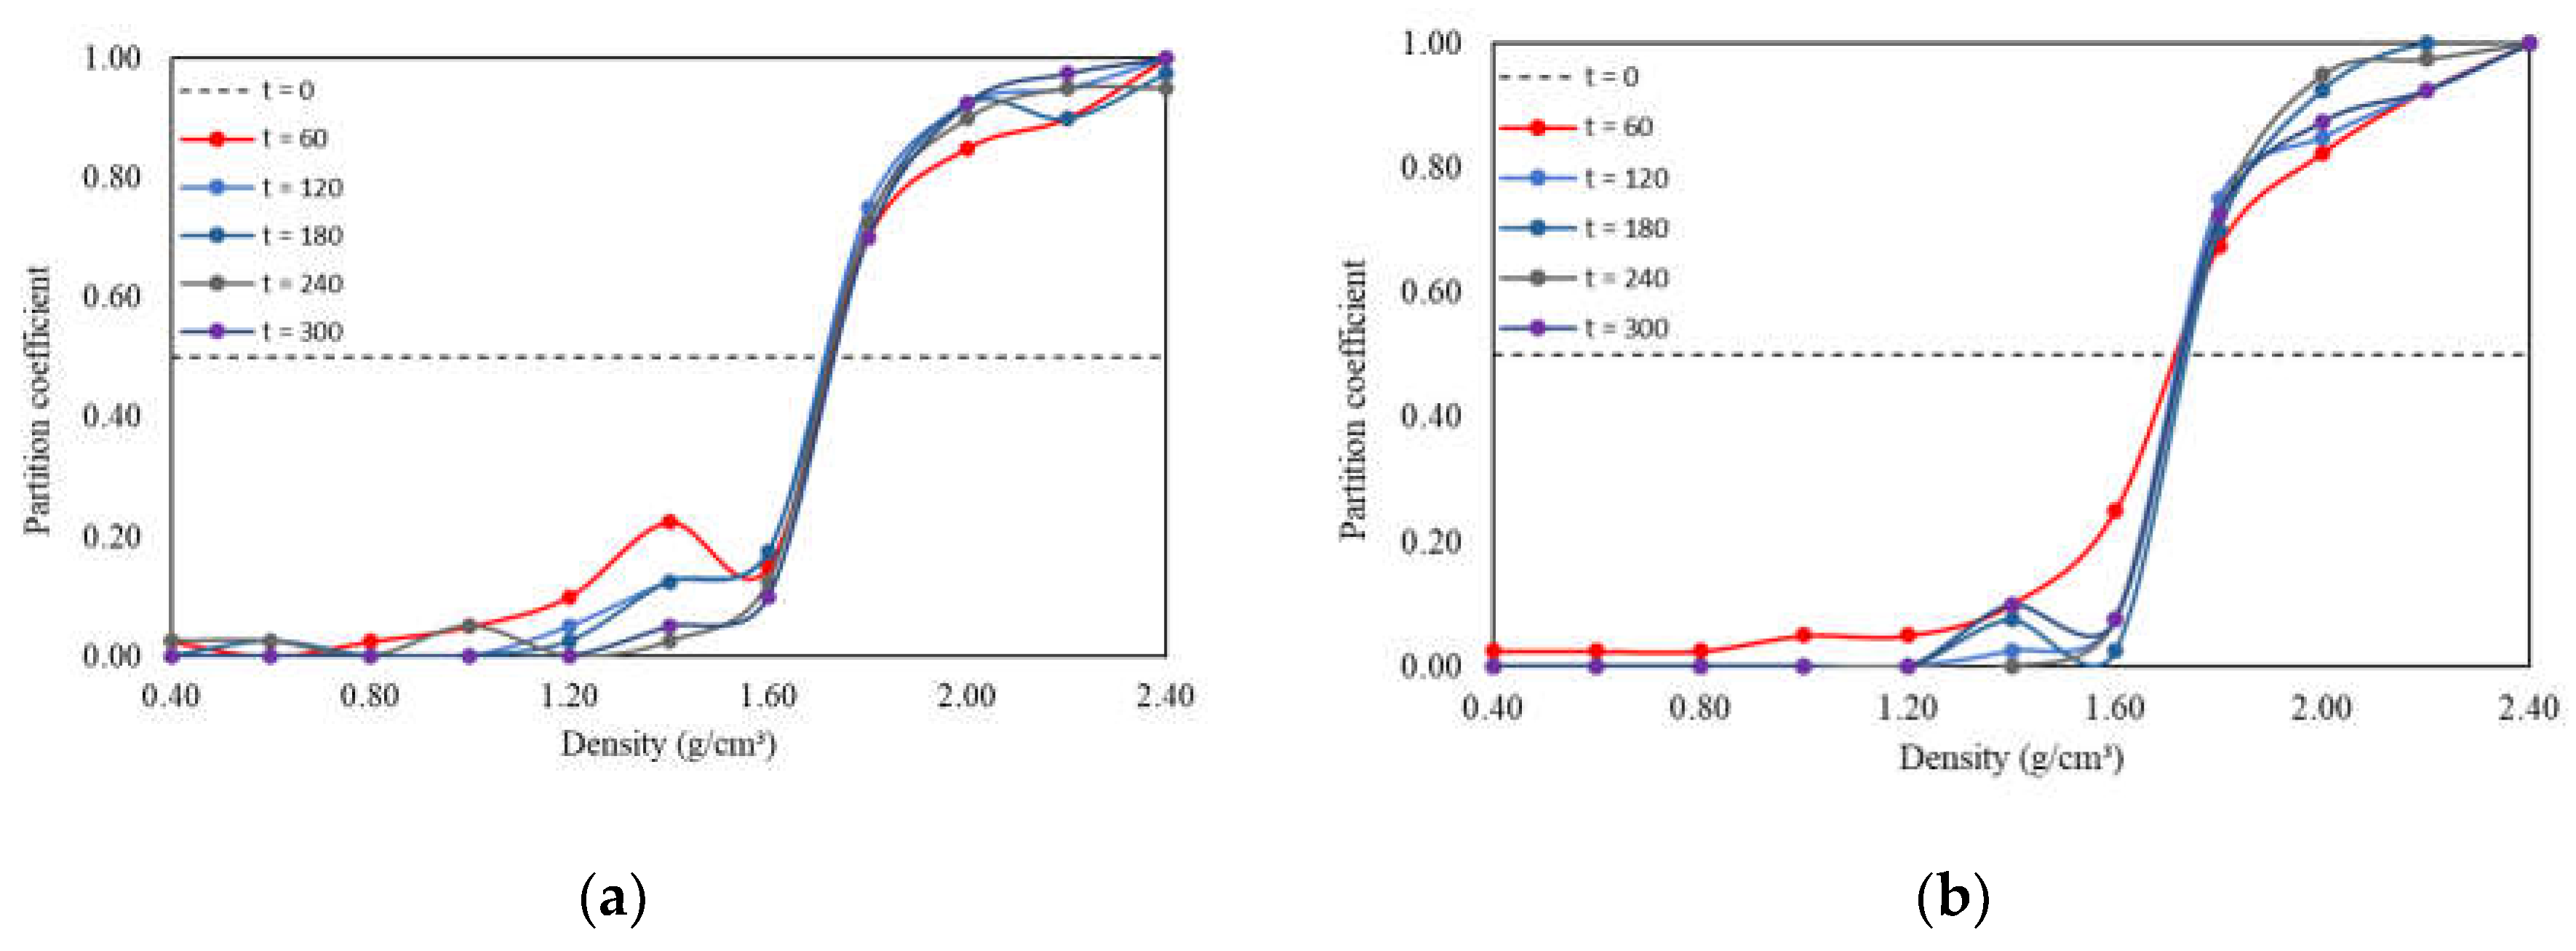
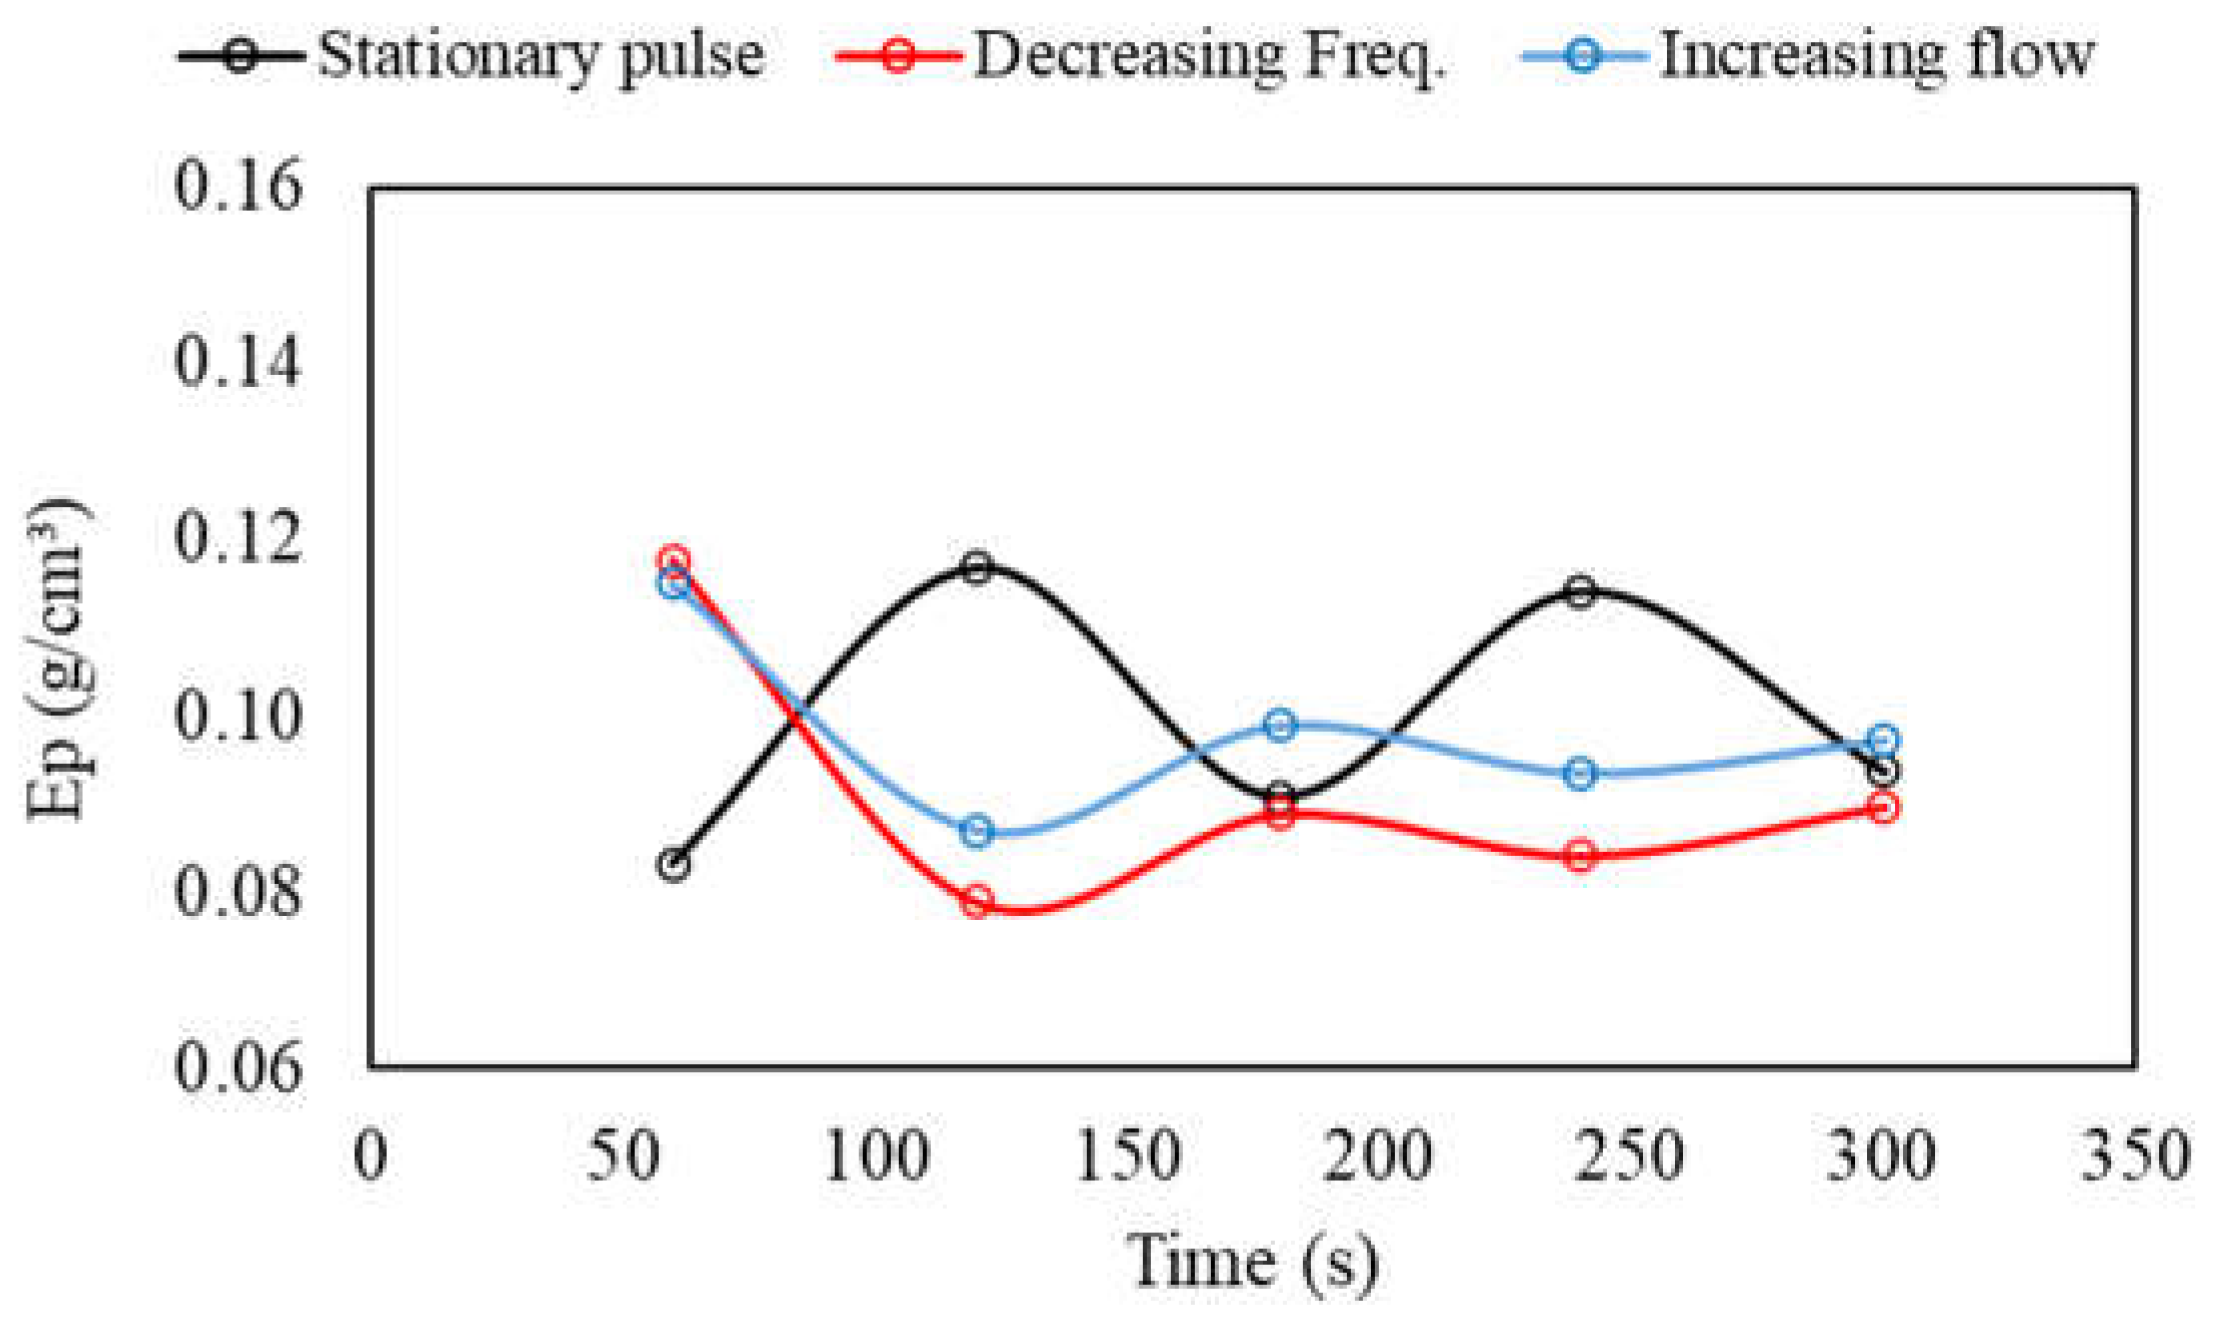
Figure 15 and Table 5 depict partition curves and their respective indices for tests with transient flow pulses of increasing flow and decreasing frequency (case 2 previously mentioned). Despite the short-circuits indicated at the curve limits (also observed in other operational conditions, suggesting contamination of light and dense products), it is noteworthy to observe the overlap of different partition curves within the ρ 25 ρ 75 interval, particularly for the transient flow pulse condition with increasing flow. This overlap indicates stability, as it suggests that the slope of the partition curve was not significantly affected by jigging time, except in the initial moments (highlighted in the decreasing frequency curve in Figure 30.b). Another way to assess this behavior is through the variability of the ρ 50 value. For decreasing frequency and increasing flow pulses, the mean values and standard deviations of ρ 50 were 1.73 g/cm³ (± 1.08%) and 1.72 g/cm³ (± 0.46%), respectively. The low standard deviations around the mean indicate minimal fluctuation in values, implying high stability of the separation density, practically independent of jigging time (for t > 60 s).
Figure 16 depicts the evolution of the mean probable deviation values over time compared to the stationary pulsation condition. More significant than the individual Ep values is their maintenance at values very close to each other from t = 120 s onwards. While in the fixed pulsation condition, the average variation of Ep from this time onwards was ± 22% every 60 s, it decreased to ± 8% (decreasing frequency) and ± 7.7% (increasing flow) under transient conditions.
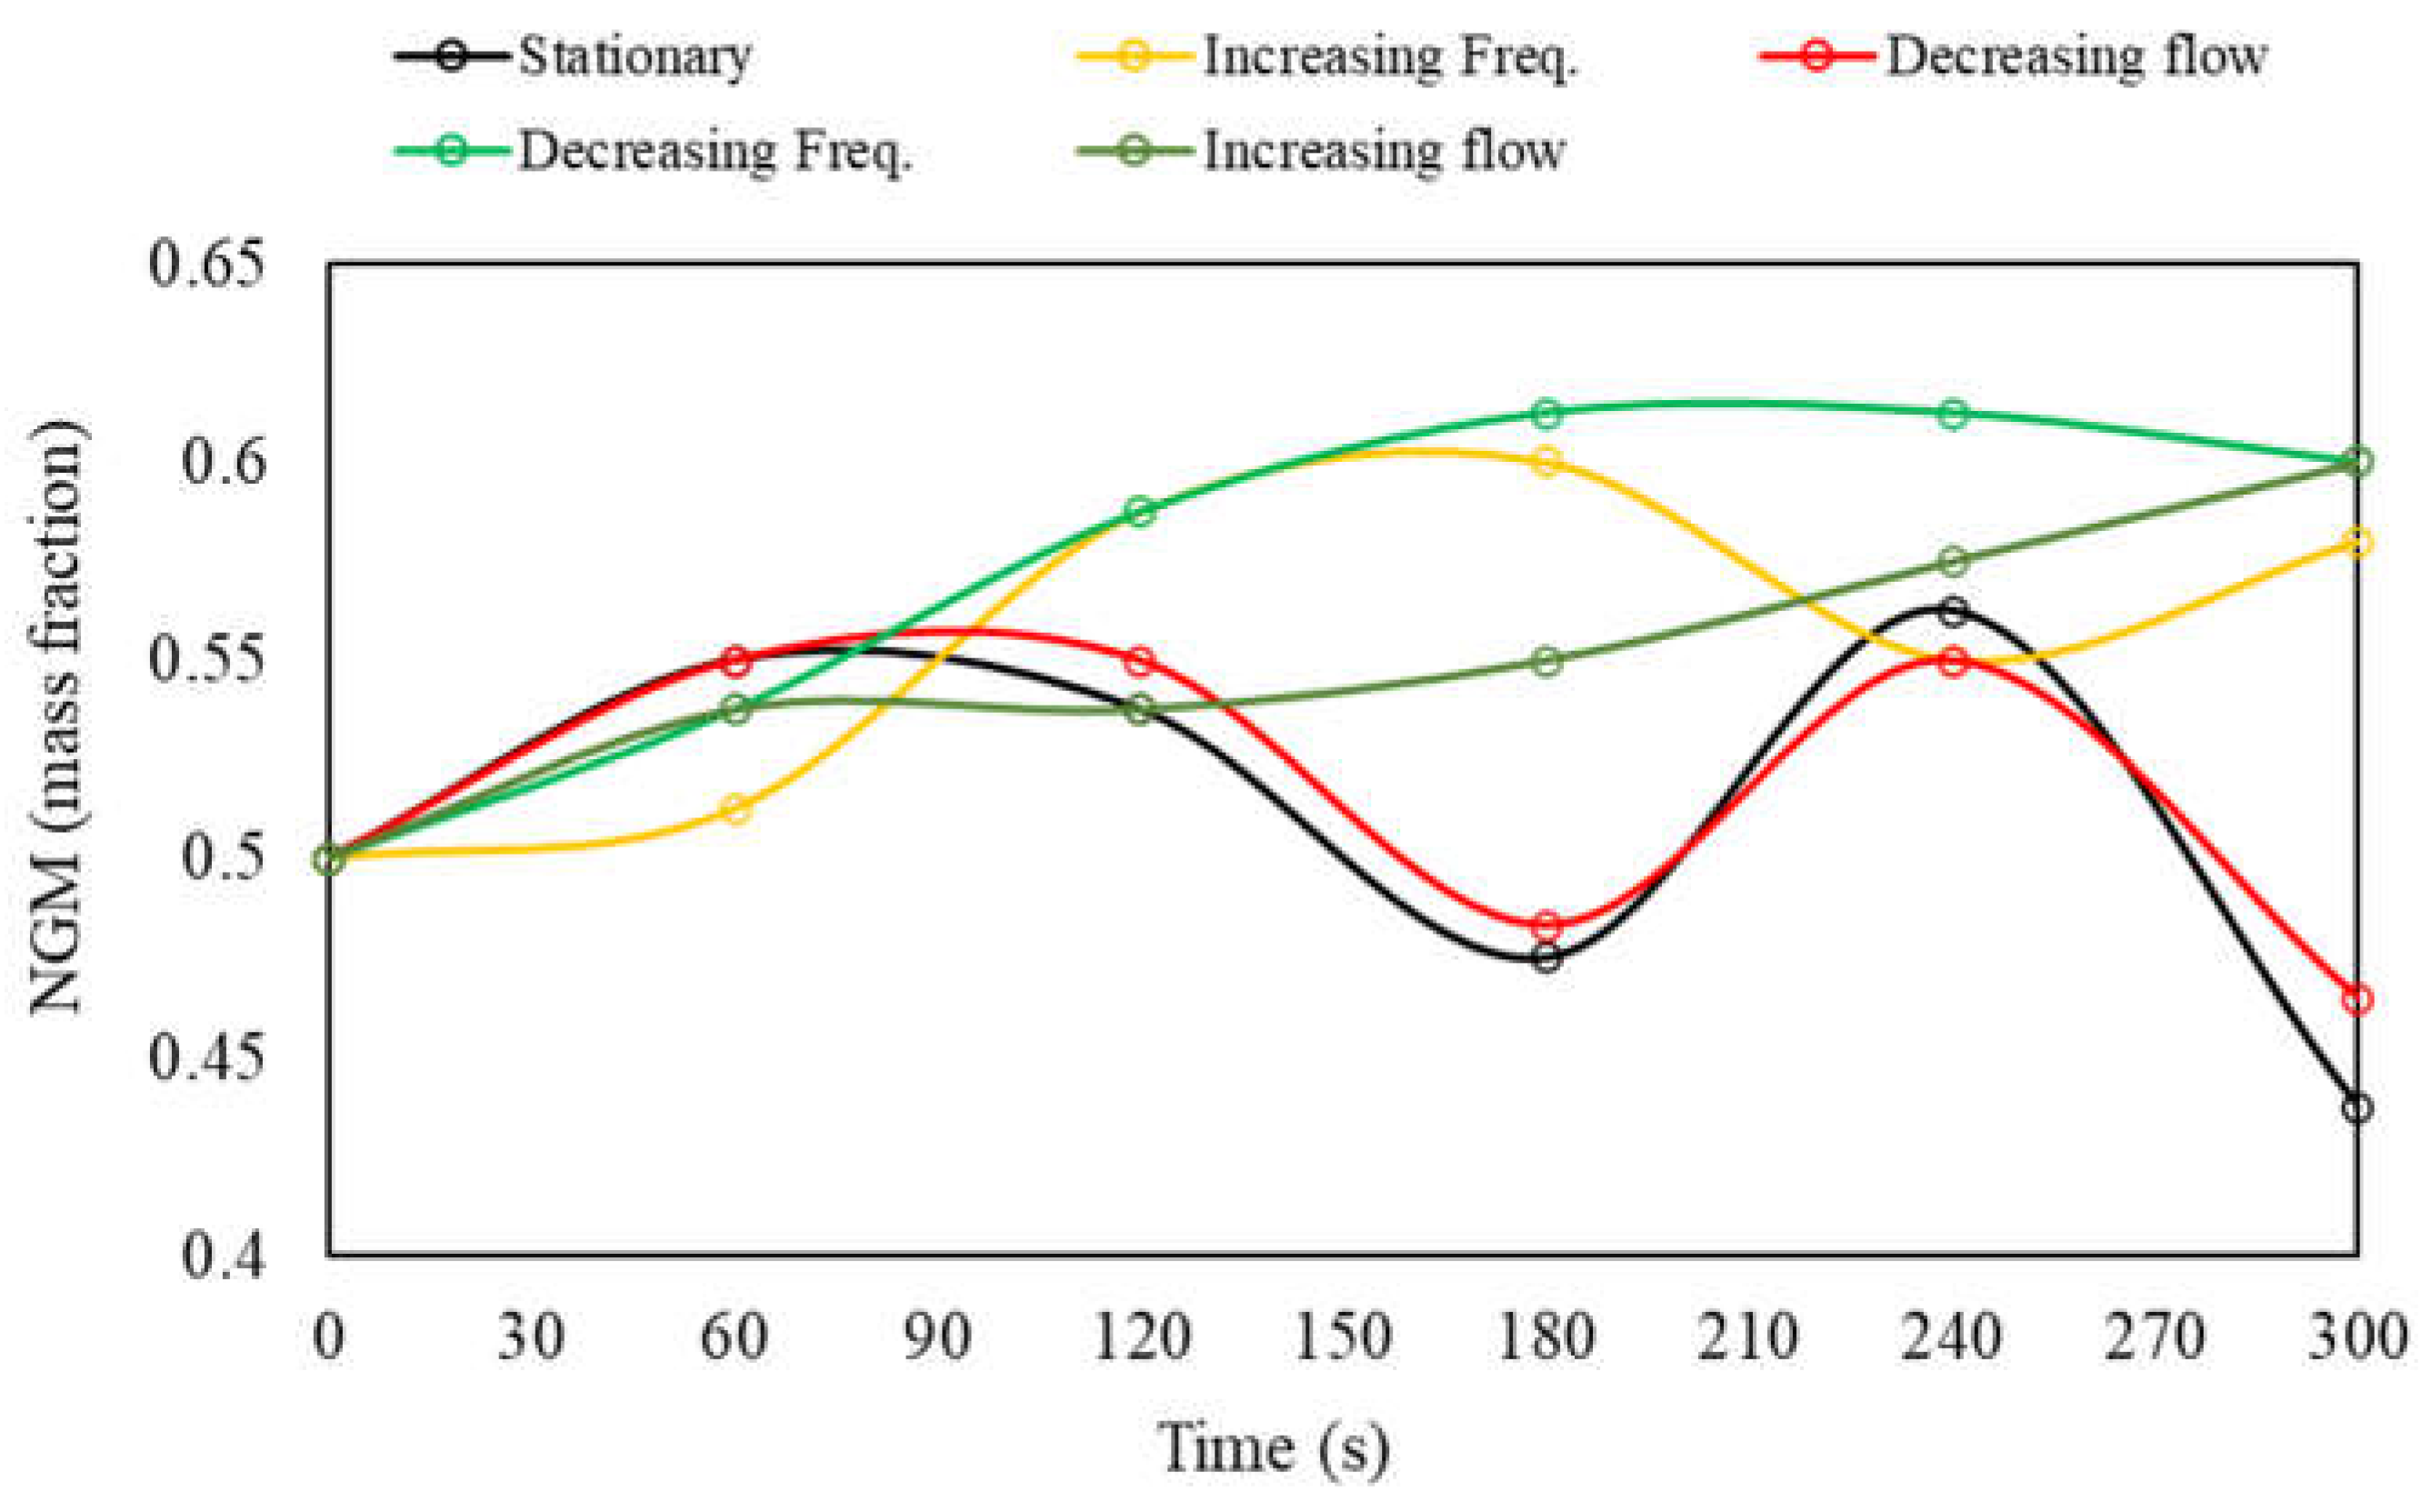
Figure 17 compares the proportions of NGM in the light product across all tested conditions. It’s worth noting that the base bed density (2.89 g/cm³) is higher than the density of all tracers, so a higher proportion of NGM in the light product can be understood as an approximation of ideal density-based separation. The concentration of denser tracers in the heavy product can be due to the combined effect of density, which is closer to the bed density, as well as differences in size and geometry between tracers and bed, with the former being slightly coarser and spherical in shape, favoring their movement towards lower layers of the bed [1,5].
It can be observed that pulsation conditions with decreasing frequency and increasing flow rate provided the highest proportions of NGM from t = 120 s onwards, describing a progressive and non-oscillatory growth over time. In other conditions, however, an oscillating behavior is observed, which can be interpreted as an alternation of the vertical position of tracers (sometimes in the light zone, sometimes in the dense zone).

3.5. Transient Pulsation and Segregation: Preliminary Mechanism

The results obtained demonstrated that the use of transient pulses, where flow or frequency conditions vary during material segregation, can alter the level of bed segregation as well as the evolution over time of dry jigging. Overall, it was observed that transient pulsation conditions that tend to decrease the amplitude of bed movement (vertical displacement) during jigging, such as cycles with decreasing air flow or increasing frequency, had an apparently negative effect on the process, as they accentuated fluctuations in the segregation level over time. On the other hand, pulsation conditions that progressively increase the vertical displacement of the bed, such as those with increasing flow or decreasing frequency, resulted in slightly better segregation levels and a more stable jigging kinetics, with less dramatic variations in separation indices.
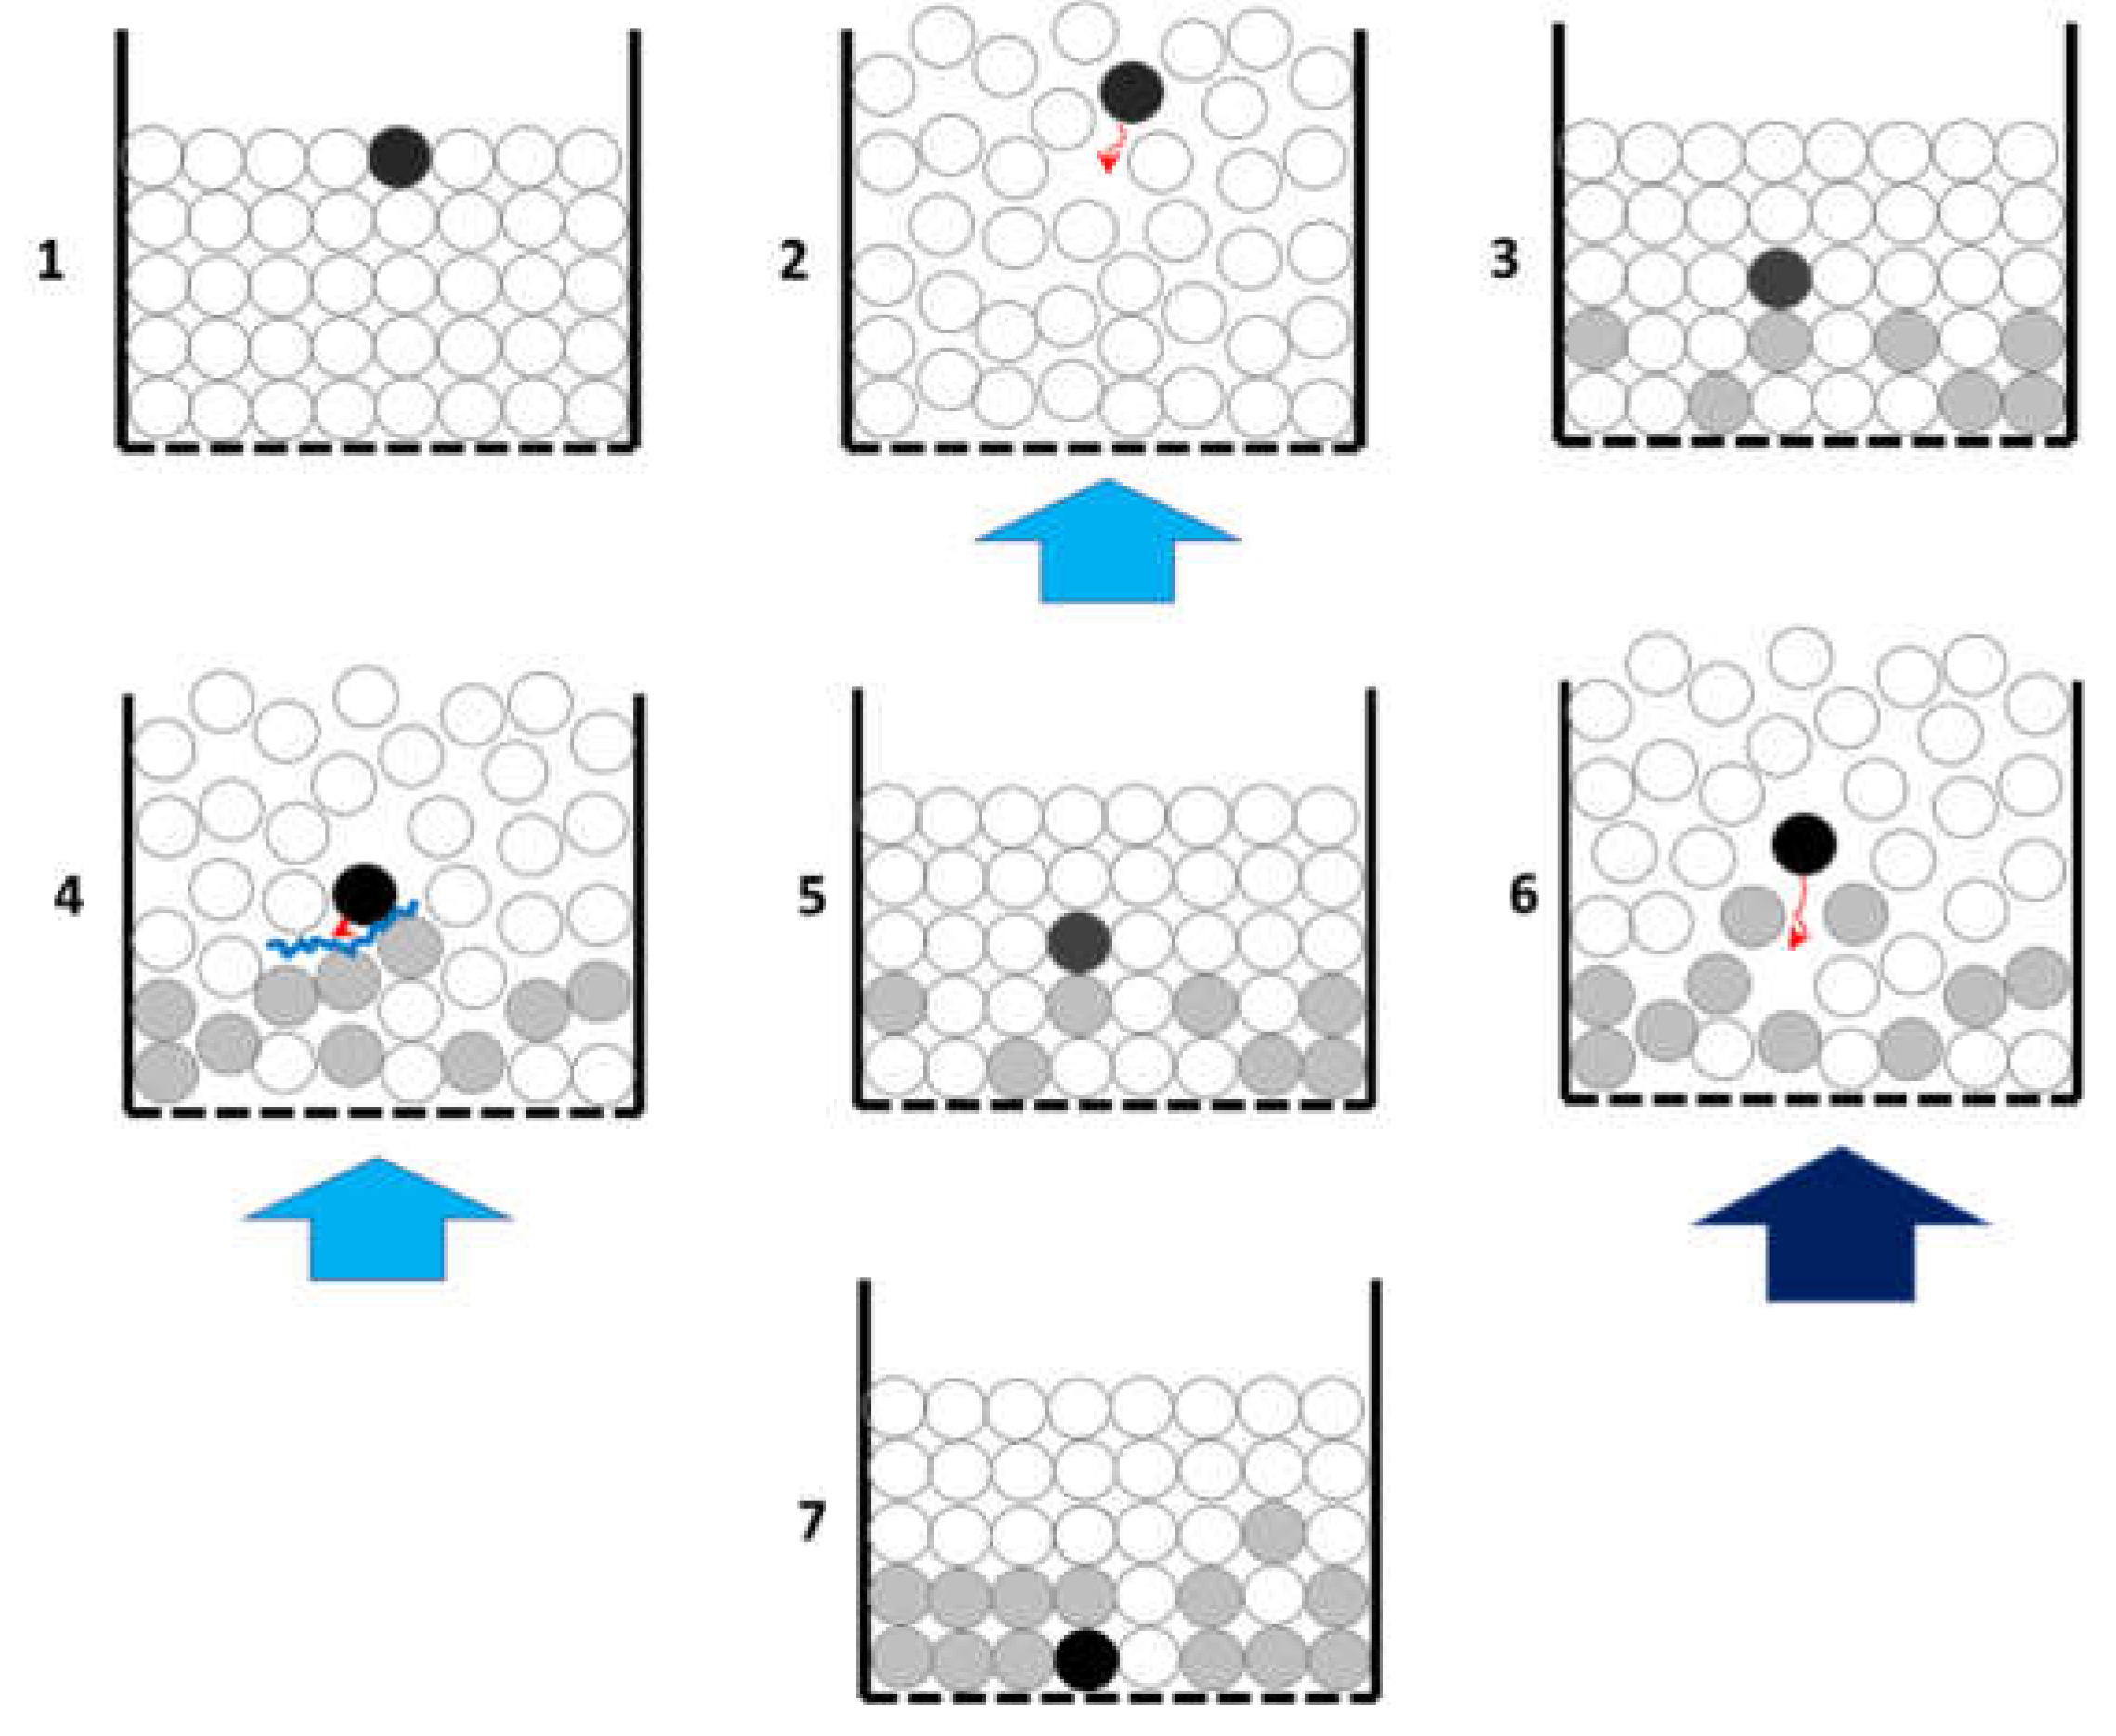
Based on the above, a preliminary possible mechanism is proposed to describe the effect of transient pulses on the stratification of the dry jigging bed. The key to this mechanism lies in the variation of the bed porosity throughout the jigging cycle and the subsequent mobility of particles with different densities while the bed is open. Figure 18 depicts a hypothetical situation representing a jigging bed immediately before the start of the pulse. The numbering from 1 to 7 represents the sequence of events presumed to occur during the variation of the pulse magnitude passing through the bed (in the case of pulses with increasing flow, for example), considering the possible movement of a dense particle. In this case, the following sequence can be conceived:
1) Initially, a dense particle (dark coloration) is positioned at the top portion of a stationary bed.
2) A pulse of air with intensity Y expands the bed, increasing porosity (free space between particles), allowing those of greater weight (denser and larger) to move towards lower portions of the bed.
3) At the end of the first pulse, the dense particle is positioned at an intermediate height in the bed.
4) Another pulse of air with intensity Y crosses the bed, once again causing its dispersion and increasing porosity. However, the movement of the dense particle faces competition from other dense particles, which, due to their weight, move less than light particles in the system. Additionally, compaction increases as one descends into the bed, so the dense particle encounters increasing resistance to its downward movement.
5) The dense particle remains trapped within a restricted zone as new pulses of intensity Y cross the bed, with small-scale oscillations in the vertical position. If it is sufficiently dense (such as tracers with ρ > 2.0 g/cm³), it will remain in a nearly balanced position, while if it is within the NGM range, it may alternate positions in the light or dense product zones.
6) A pulse of air with intensity Z > Y traverses the bed, transferring momentum and causing greater dispersion than the original pulse. The higher magnitude of the new pulse increases the porosity of the zones where dense material accumulates (lower zones), clearing a path for the dense particle to reach a lower portion of the bed than before.
7) A new quasi-equilibrium configuration is established under the more intense pulse, in which the dense particle remains in a lower portion of the bed.
A similar representation could be made considering a light particle initially positioned at the bottom of the bed, while an opposite behavior would occur if the injection of less intense pulses were considered. The proposed preliminary mechanism basically considers that pulses that progressively expand the bed assist in the accommodation of particles, resulting in more efficient reaching of their equilibrium positions, from which additional pulses have little effect on their positions in the system. This partially justifies the high stability (i.e., low variation) observed in the distribution and partition of tracers over time when using pulses with increasing flow rate or decreasing frequency.
Another way to interpret the phenomenon is through the reasoning adopted by [18] in his theory of potential energy of jigging. Considering that the reduction of potential energy is the true driving force of bed segregation, the kinetic force induced in the particles by the air pulse serves only to release latent potential energy. A dense particle at the top of a bed (1), viewed in this way, has high potential energy due to its elevated position, requiring a small stimulus (pulse) to release this energy. Once released (2), part of the potential energy, converted into kinetic energy of particle movement, causes it to descend in the bed (3). Positioned at a lower height, the particle then has lower potential energy. This, when released by the air pulse, generates a gentler movement of the particle, which, due to the bed’s compaction resulting from the reduction of potential energy, limits its movement (4 and 5). By injecting a pulse more intense than the initial one, an extra package of kinetic energy is transferred to the particles, especially in the lower portion of the bed, momentarily increasing their potential energy.
It is worth noting that the proposed mechanism should be valid only for operation within a restricted operational range (of pulsation). If the injected pulse were excessively intense, it is assumed that it could cause a remixing of the bed, raising dense particles to upper portions, resulting in an increase in the system’s potential energy. Unfortunately, this possibility was only considered late in the present study and could not be tested, as the amount of material used resulted in a massive bed (46.6 kg), requiring the blower to operate near its maximum capacity (above 90%) to move the bed. In other words, since the bed was very heavy, the blower did not have enough power to simulate an over-pulse situation. Additionally, the proposed mechanism does not consider other phenomena that may be present during the movement of the bed in dry jigging, such as granular convection and wall effects [19]. Finally, the mechanism, like any results analysis, is based on the movement of individual particles (tracers), requiring additional tests to verify if the observed trends are reproduced for large-scale stratification (high proportions of dense and light particles).
4. Conclusions

Among the few existing studies on dry jigging, the focus has been on analyzing stratification considering different case studies, with little attention given to the specific characteristics of the process, such as its pulsation and kinetics. A better understanding of these characteristics could enable the development of new operational strategies to improve the process. In the present study, we aimed to analyze these characteristics, and based on the results obtained, we proposed an alternative strategy of using transient pulses. Therefore, the main conclusions obtained were as follows:
-
The use of density tracers distributed in a base bed proved to be an effective method for analyzing segregation levels in dry jigging, with the advantage of expediting tests and allowing the calibration of partition curves.
-
Detecting pressure drops in the jigging chamber proved to be a promising strategy for monitoring and adjusting air flow and jigging cycles in air jigs, providing insights into the shape of the pulse and the employed jigging cycle.
-
Measuring the useful power required across the entire operational spectrum of the dry jig used indicated that the blower drive represents the highest energy consumption. Based on the data, it was possible to calibrate power vs. air flow curves and predict total consumption (kW or kWh) and specific consumption (kW/kg of processed material).
-
Tests under stationary (fixed) pulsation conditions demonstrated oscillatory and unstable behavior, with tracer distributions and partition indices varying over time, especially in the case of the NGM fraction, thus differing from the kinetics reported in the literature for traditional hydraulic jigs.
-
Tests under transient pulsation conditions indicated two behaviors compared to fixed pulsation: (1) for decreasing flow rate or increasing frequency, there was a discrete reduction in separation quality and a significant increase in partition index fluctuations over time; (2) for increasing flow rate or decreasing frequency, there was a discrete increase in separation quality and a significant reduction in partition index fluctuations over time.
-
Based on the results obtained, a preliminary mechanism was proposed to describe the effect of transient pulsation on particle segregation within the jig bed. The mechanism considers the effect of pulses of varied intensities on bed porosity and the exchange of potential and kinetic energy, following the original model proposed by Mayer [18].
Future work should focus on testing different profiles of transient pulse variation and analyzing their impact on real cases (ores, coals, and waste materials). A proper treatment of the ΔP signal and its correlation with bed stratification may also enable the creation of regulation and control functions for segregation in the jig.

Author Contributions

Conceptualization, W.M.A. and F.LQ.R.; methodology, F.L.Q.R.; validation, F.L.Q.R and W.M.A.; formal analysis, W.M.A. and F.LQ.R.; investigation, F.L.Q.R.; C.O.P. and W.M.A.; data curation, F.L.Q.R.; writing—original draft preparation, W.M.A.; writing—review and editing, W.M.A.; visualization, W.M.A.; supervision, C.O.P.; project administration, C.O.P. and W.M.A.; funding acquisition, C.O.P. and W.M.A. All authors have read and agreed to the published version of the manuscript.

Funding

This research received no external funding.

Data Availability Statement

The original data presented in the study are openly available in the Digital Repository of the Federal University of Rio Grande do Sul in http://hdl.handle.net/10183/257558.

Conflicts of Interest

The authors declare no conflicts of interest.

References

  1. Ambrós, W.M. Jigging: A review of fundamentals and future directions. Minerals 2020, 10, 998. [Google Scholar] [CrossRef]
  2. Burt, R.O. Gravity concentration technology. 1984.
  3. Chelgani, S.C.; Neisiani, A.A. Dry mineral processing; Springer, 2022. [Google Scholar]
  4. Taggart, A.F.; Behre, H.A. Handbook of mineral dressing: Ores and industrial minerals. (No Title) 1945.
  5. Sampaio, C.H.; Tavares, L.M.M. Beneficiamento Gravimétrico: Uma introdução aos processos de concentração mineral e reciclagem de materiais por densidade; Editora da UFRGS, 2005. [Google Scholar]
  6. Ambrós, W.M.; Sampaio, C.H.; Cazacliu, B.G.; Conceição, P.N.; dos Reis, G.S. Some observations on the influence of particle size and size distribution on stratification in pneumatic jigs. Powder Technology 2019, 342, 594–606. [Google Scholar] [CrossRef]
  7. Ambros, W.M.; Sampaio, C.H.; Cazacliu, B.G.; Miltzarek, G.L.; Miranda, L.R. Usage of air jigging for multi-component separation of construction and demolition waste. Waste management 2017, 60, 75–83. [Google Scholar] [CrossRef]
  8. Cazacliu, B.; Sampaio, C.H.; Miltzarek, G.; Petter, C.; Le Guen, L.; Paranhos, R.; Huchet, F.; Kirchheim, A.P. The potential of using air jigging to sort recycled aggregates. Journal of Cleaner Production 2014, 66, 46–53. [Google Scholar] [CrossRef]
  9. Gouri Charan, T.; Chattopadhyay, U.; Singh, K.; Kabiraj, S.; Haldar, D. Beneficiation of high-ash, Indian non-coking coal by dry jigging. Mining, Metallurgy & Exploration 2011, 28, 21–23. [Google Scholar]
  10. Malysz, G.N.; Cappellesso, V.G.; Silvestro, L.; Dal Molin, D.C.C.; Masuero, A.B. Natural and accelerated carbonation in concrete associated with recycled coarse aggregate treated by air jigging technology. Journal of Materials in Civil Engineering 2022, 34, 04022133. [Google Scholar] [CrossRef]
  11. Sampaio, C.; Aliaga, W.; Pacheco, E.; Petter, E.; Wotruba, H. Coal beneficiation of Candiota mine by dry jigging. Fuel Processing Technology 2008, 89, 198–202. [Google Scholar] [CrossRef]
  12. Sampaio, C.H.; Ambrós, W.M.; Cazacliu, B.; Moncunill, J.O.; José, D.S.; Miltzarek, G.L.; Brum, I.A.S.d.; Petter, C.O.; Fernandes, E.Z.; Oliveira, L.F.S. Destoning the moatize coal seam, Mozambique, by Dry Jigging. Minerals 2020, 10, 771. [Google Scholar] [CrossRef]
  13. Wang, Z.; Hall, P.; Miles, N.J.; Wu, T.; Lambert, P.; Gu, F. The application of pneumatic jigging in the recovery of metallic fraction from shredded printed wiring boards. Waste Management & Research 2015, 33, 785–793. [Google Scholar]
  14. Waskow, R.P.; Dos Santos, V.L.; Ambrós, W.M.; Sampaio, C.H.; Passuello, A.; Tubino, R.M. Optimization and dust emissions analysis of the air jigging technology applied to the recycling of construction and demolition waste. Journal of environmental management 2020, 266, 110614. [Google Scholar] [CrossRef] [PubMed]
  15. Warke, S.; Puranik, V. Comparison of energy consumption of ABS and PLA while 3 D printing with fused deposition modeling process. Materials Today: Proceedings 2022, 66, 2098–2103. [Google Scholar] [CrossRef]
  16. Wills, B.A.; Finch, J. Wills’ mineral processing technology: An introduction to the practical aspects of ore treatment and mineral recovery; Butterworth-heinemann, 2015. [Google Scholar]
  17. Coelho, A.; de Brito, J. Environmental analysis of a construction and demolition waste recycling plant in Portugal–Part I: Energy consumption and CO2 emissions. Waste management 2013, 33, 1258–1267. [Google Scholar] [CrossRef]
  18. Mayer, F. Fundamentals of a potential theory of the jigging process. Proc. 7th Int. Miner. Proc. Cong 1964, 75–86. [Google Scholar]
  19. Ambrós, W.M.; Cazacliu, B.G.; Sampaio, C.H. Wall effects on particle separation in air jigs. Powder Technology 2016, 301, 369–378. [Google Scholar] [CrossRef]
Figure 1. Illustrative scheme of the pulsation mechanism and its components in dry jigs.
Preprints 105506 g001
Figure 2. Minimum fluidization velocity of coal (1300 kg/m³) and quartz (2600 kg/m³) particles calculated according to equation (2) for different particle diameters. (a) Fluidization in air (µ = 1.85 x 10⁻⁵ N.s/m²); (b) Fluidization in water (µ = 1.0 x 10⁻³ N.s/m²). The calculation was performed considering a bed of spherical particles with porosity of 0.35. The green arrow relates the equivalent diameter of the quartz bed with minimum fluidization velocity equal to a 10 mm coal bed.
Preprints 105506 g002
Figure 3. (a) Pilot-scale dry jig used in the tests and its main components: control panel (1), air valve (2), FieldLogger recorder (3), pneumatic hoses (4), container (5), and dust suction duct for bag filter (6); (b) Detail of hose insertion ports and illustration of pressure tap points.
Preprints 105506 g003
Figure 4. (a) Manufacturing scheme for high-density tracers (+1.2 g/cm³) by steel sphere insertion and image of a 1.4 g/cm³ tracer; (b) tracers distributed over the stationary bed surface of the jig.
Preprints 105506 g004
Figure 5. Variation of air flow over time from the onset of a pulse at 2.9 m³/s and 85 CPM (time step of 1.4 seconds).
Preprints 105506 g005
Figure 6. Airflow variation in pulses with different blower powers and pulsation frequency of 20 CPM (period of 3 s).
Preprints 105506 g006
Figure 7. Variation of instantaneous ∆P over time (increments of 0.1 s) as the blower airflow rate was increased from 0 to 100% of power (irregular intervals).
Preprints 105506 g007
Figure 8. Consumed active power curve on the air blower of the jig.
Preprints 105506 g008
Figure 9. Partition curves of jigging tests at different pulsation times and conducted at f = 70 CPM and a flow rate of 2.9 m³/s.
Preprints 105506 g009
Figure 10. Variation of tracer concentration in the light product, assuming an initial concentration of 50% (perfect mixture).
Preprints 105506 g010
Figure 11. Variation of NGM content in the light product.
Preprints 105506 g011
Figure 12. Comparison between concentration criterion (CC) for air separation of bed tracer particles and the concentration of tracers of different densities in the light product, considering the test with t = 90 s.
Preprints 105506 g012
Figure 13. Partition curves for transient pulsation with decreasing flow rate (a) and increasing frequency (b).
Preprints 105506 g013
Figure 14. Comparison of Ep values over time.
Preprints 105506 g014
Figure 15. Partition curves for transient pulsation with increasing flow (a) and decreasing frequency (b).
Preprints 105506 g015
Figure 16. Comparison of Ep values over time.
Preprints 105506 g016
Figure 17. Proportions of NGM in the light product under different jigging conditions.
Preprints 105506 g017
Figure 18. Illustration of the sequence of events associated with the proposed mechanism.
Preprints 105506 g018
Table 1. Characteristics of the density tracers used.
Density (g/cm³) Color PLA (g) Steel (g) Steel sphere (mm)
0.4 Silver 1.6 0.1 3
0.6 Light blue 2.4 0.1 3
0.8 White 3.3 0.1 3
1.0 Marble 4.1 0.1 3
1.2 Yellow 2.5 2.5 8.5
1.4 Dark blue 3.4 2.5 8.5
1.6 Green 4.2 2.5 8.5
1.8 Red 2.2 5.4 11
2.0 Orange 3 5.4 11
2.2 Grey 3.8 5.4 11
2.4 Black 4.0 6.3 11.5
Table 2. Transient pulsation conditions variation for the tests with jigging time of 60s.
t (s) Δt (s) Increasing Freq. Decreasing Freq. Increasing Amp. Decreasing Amp.
F (CPM) F (CPM) Flow (%) Flow (%)
0 0 55 85 90 100
15 15 65 75 93.3 96.6
30 15 75 65 96.6 93.3
45 15 85 55 100 90
60 15 - - - -
Table 3. Partition indices of jigging tests at different pulsation times.
Index/time 30 s 60 s 90 s 120 s 150 s 180 s 210 s 240 s 270 s 300 s
ρ 50 (g/cm³) 1.75 1.72 1.72 1.72 1.68 1.69 1.70 1.72 1.70 1.68
Ep 0.17 0.08 0.08 0.12 0.12 0.09 0.09 0.11 0.10 0.09
Table 4. Partition indices for tests with transient pulsation–decreasing flow rate and increasing frequency.
Index/time Decreasing flow rate Increasing frequency
60 s 120 s 180 s 240 s 300 s 60 s 120 s 180 s 240 s 300 s
ρ 50 (g/cm³) 1.72 1.71 1.69 1.71 1.69 1.70 1.73 1.74 1.72 1.75
Ep 0.15 0.07 0.10 0.07 0.10 0.09 0.13 0.12 0.08 0.14
Table 5. Partition indices for tests with transient pulsation–increasing flow rate and decreasing frequency.
Index/time Decreasing flow rate Increasing frequency
60 s 120 s 180 s 240 s 300 s 60 s 120 s 180 s 240 s 300 s
ρ 50 (g/cm³) 1.73 1.71 1.72 1.73 1.73 1.72 1.73 1.74 1.73 1.73
Ep 0.12 0.09 0.10 0.09 0.10 0.12 0.07 0.09 0.08 0.09
Disclaimer/Publisher’s Note: The statements, opinions and data contained in all publications are solely those of the individual author(s) and contributor(s) and not of MDPI and/or the editor(s). MDPI and/or the editor(s) disclaim responsibility for any injury to people or property resulting from any ideas, methods, instructions or products referred to in the content.
Copyright: This open access article is published under a Creative Commons CC BY 4.0 license, which permit the free download, distribution, and reuse, provided that the author and preprint are cited in any reuse.
Prerpints.org logo

Preprints.org is a free preprint server supported by MDPI in Basel, Switzerland.

Subscribe

© 2024 MDPI (Basel, Switzerland) unless otherwise stated