1. Introduction
Against the backdrop of the International Convention for Prevention of Pollution from Ships (MARPOL 73/78) with special reference to Annex VI Prevention of Air Pollution from Ships which aim to address increasing concerns about fuel consumption and emissions such as carbon dioxide (CO2) and nitrogen oxides (NOx), this paper investigates fuel savings on DFDE engines at Liquid Natural Gas (LNG) ships power plant. As the industry is experiencing a surge in growth along with increasing pressure to reduce environmental impact, the focus is shifting to improving the energy efficiency of LNG marine power plants. Through a careful examination of power requirements in different operating modes and an analysis of specific fuel consumption and exhaust emissions, the article aims to determine and achieve the optimal engine configuration load for LNG vessels, considering port safety protocols and regulations. In addition, against the background of the MARPOL, the study evaluates the efficiency of onboard energy management systems, especially in load sharing between engines, in order to propose solutions that meet the objectives of minimizing fuel consumption and emissions in compliance with regulatory requirements.
An earlier research paper [
1] provides a comprehensive analysis of the impact of ship operating modes on reducing exhaust emissions and fuel consumption in LNG energy systems. The study examines the dynamic relationship between power demand, specific fuel consumption and CO
2 and NOx emissions in different operating scenarios that occur in LNG ships and aims to determine the optimal engine configuration for different operating modes based on data from the simulator and test bench, considering safety and port requirements.
The research evaluates the efficiency of built-in Power Management Systems (PMS) that distribute power evenly between engines in the network, regardless of fuel consumption and exhaust emissions, focusing especially on manual load sharing between engines to increase energy efficiency and reduce emission of harmful exhaust gases. A comprehensive analysis of the data and their comparison led to the conclusion that the slightly better solution is to manually distribute the power between the engines.
From the analysis of the various functions of the PMS, it appears that while the PMS performs its intended functions, it may not be the most cost-effective or environmentally friendly option under normal operating conditions in various operating regimes of the vessel or in certain scenarios, such as navigating through rough waters, prolonged maneuvers or extended port calls with multiple engines running at low power. The results of the previous study suggest that a daily optimization of engine utilization in the form of a redistribution of power between the engines is necessary. Sometimes manual redistribution of the load between engines is required to improve fuel efficiency and reduce NOx and CO2 emissions. This gives rise to the idea of developing a optimization model that calculate what the optimum load is for each individual engine, all with the aim of saving fuel.
Currently, there is no reliable algorithm on considered ship power plant that determines the optimal number of engines and their load distribution based on specific operational requirements, taking into account fuel consumption and emissions. This paper presents the benefits of applying an optimization model, developed for the purpose of this article with the aim of fuel saving to improve the energy efficiency of DFDE propulsion systems on LNG ships.
In the paper, four-stroke DFDE engines (type: 8L51/60DF) were considered, for which a series of measurements were carried out under real working conditions and in different operating modes and for which an optimization model was created.
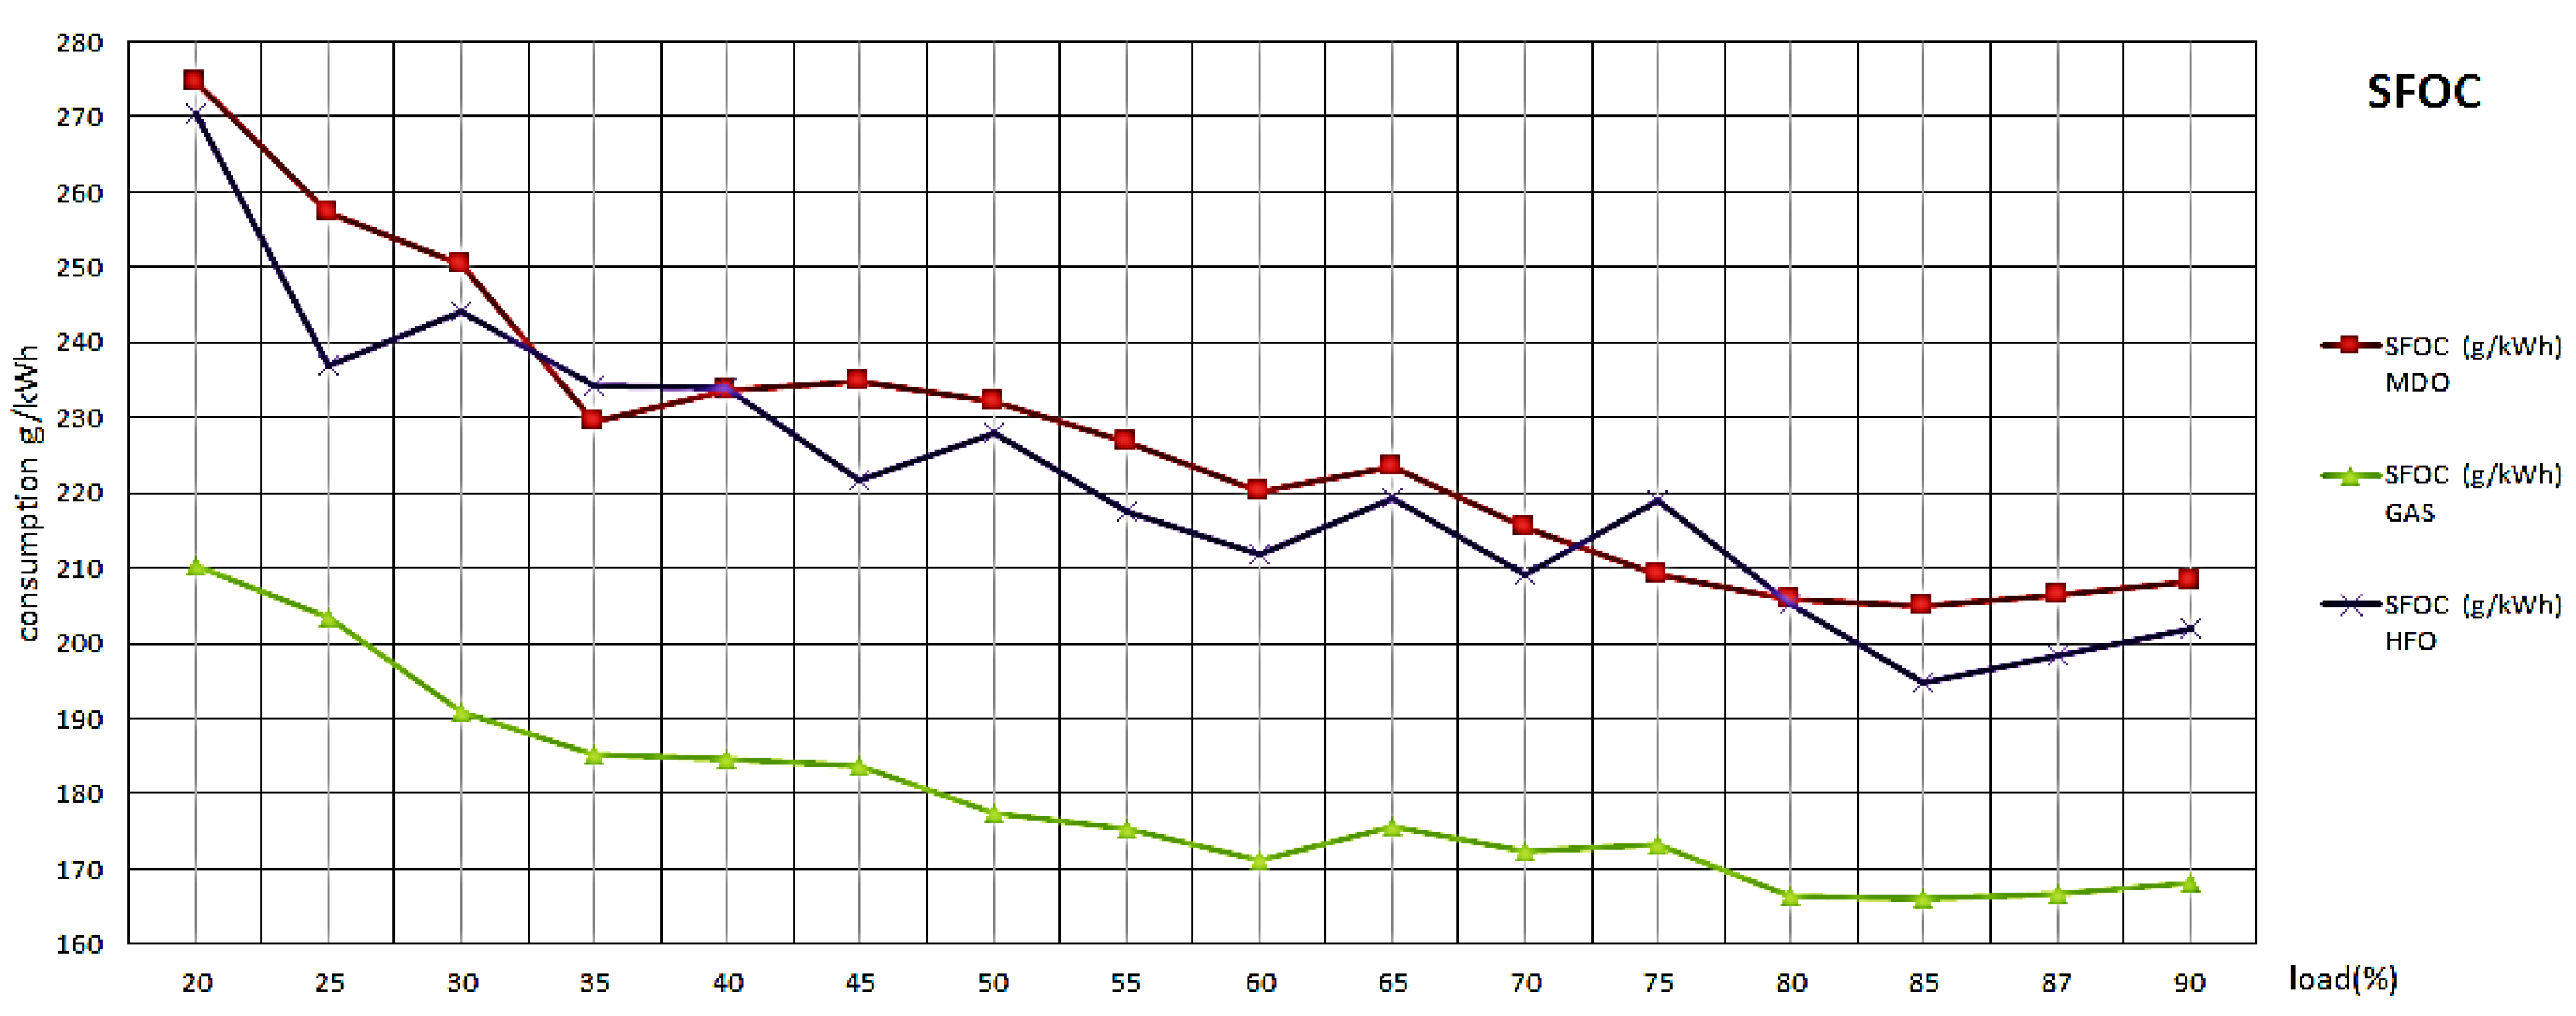
The first chapter of this paper presents a series of specific fuel oil consumption (SFOC) measurements carried out with three different fuel types, Marine Diesel Oil (MDO), Heavy Fuel Oil (HFO) and Liquefied Natural Gas (LNG) at different engine loads.
The second chapter of this paper presents and describes an optimization model whose main objective is to develop an energy optimization strategy for an LNG vessel with minimum fuel consumption, considering three different types of fuel that the vessel can use.
The third chapter of this paper presents the fuel savings(calculated) by using the method of comparison between equal sharing load distribution between the engines by PMS and the optimized proposal at the same loads and in different operating modes of the ship during operation.
The optimization of fuel consumption in ship propulsion systems, with DFDE engines, especially in LNG ships represents a great opportunity to improve operational efficiency and reduce environmental impact. A study by [
2] highlights the potential for improvements in fuel consumption through strategic load sharing between parallel generator sets in onboard power systems. Traditionally, equal load sharing between generators has been the norm to increase resilience to sudden load changes. However, this approach is not necessarily the most economical. Advanced control systems, possibly integrated with energy storage solutions, allow for more dynamic load sharing based on optimal fuel efficiency parameters while maintaining the robustness of the system. In addition to the analytical method for determining optimal loading in terms of fuel efficiency, this underlines the move away from traditional practices towards a more analytical and efficiency-oriented operation of marine propulsion systems. The study also addresses the impact of optimal load distribution on system control and proposes modifications to pendulum characteristics and the inclusion of energy storage to mitigate the effects of load fluctuations and thus stabilize fuel consumption under varying operating conditions. This innovative approach to generator utilization not only paves the way for significant fuel savings, but also contributes to the overarching goal of sustainable ship operation.
In [
3], a comprehensive approach to optimizing the design and operation of diesel-electric propulsion systems in ships is presented, with a focus on improving energy efficiency and minimizing fuel consumption. Using a genetic algorithm, the study attempts to determine the most effective configuration and operation of diesel-electric propulsion systems, considering factors such as the number and type of engines, their power and speed, and the optimal load distribution between them.
The study compares different propulsion layouts (AC and DC networks) to determine the most fuel-efficient setup under both design and non-design conditions. In the design optimization, the engine types and their optimal operating points for a pleasure craft were investigated, aiming for a design speed of 17 knots and investigating further speeds between 10 and 17 knots. The optimization algorithm was used to determine the optimal operating points at these lower speeds and to select the number and operating points of the diesel generators. Two strategies for power management of the propulsion system were considered: one with even load distribution between the generators and another that allows uneven load distribution. The advantages of variable speeds over constant speeds include better utilization of engine efficiency, lower fuel consumption and minimization of service interruptions due to frequent starting and stopping of the generators. The study has shown that diesel-electric systems, especially with variable speed control and uneven load distribution, offer significant advantages in terms of efficiency and fuel consumption, especially at lower speeds.
There are also numerous studies on the topic of DFDE engine optimization, such as [
3,
4,
5,
6,
7] but according to the available literature, no similar approach to the optimization of DFDE power plants and fuel reduction by optimizing load distribution between engines as presented in this paper has been found.
2. Measurements in Real Conditions of Ship Exploitation
As an example of a case study, an LNG vessel with the engine’s characteristics listed below in
Table 1 was selected, on which measurements were taken during the voyage and in different operating states of the vessel. As mentioned above, the recordings were carried out cyclically with three different fuel types (HFO, MDO and LNG) over a period of two months.
2.1. DFDE Power Plant on LNG Ship
The ship's LNG power plant under consideration consists of five main diesel engine generators, the specifications of which are listed in
Table 1.
The electrical and propulsion energy on board is generated by the DFDE engines, which are connected to generators that distribute the electricity for the auxiliary load and propulsion.
The generators can be manually run-up and connected to the main switchboard, but in normal operation the PMS the operation of the generators automatically and divide equal load to all engines connected to the electrical network.
The configuration of the electrical network depends on the ship's operating situation and the operator's experience and is the most common:
normal seagoing 4 or 5 DGs (laden 5, ballast 4),
maneuvering 2 or 3 DGs,
cargo loading/unloading 2 DGs,
port at idle or anchorage 1 DG.
PMS is a computerized system that automatically controls, monitors and manages the operation, connection, and load sharing of generators on the main switchboard.
The load distribution controlled by the PMS is only possible if the load is distributed evenly across the generators on network. The load of the generator can be distributed manually if required, but this option is not available in automatic mode.
2.2. Measurement Results as per Requested Load and Type of Fuels
The measurements were carried out under the actual operating conditions of the ship and in different operating regimes of the ship on all three fuel types (LNG, HFO, and MDO) in accordance with the requirements of Appendix 4 of NOx Technical Code 2008 [
9].
The measurements were carried out in a range of 20-90% engine load at every 10% load. After analyzing the data collected during the measurements on the ship, it was found that it is necessary to optimize the load distribution between the DF gensets connected to the ship's network in order to reduce fuel consumption and therefore also harmful gas emissions. In order to validate the results obtained, repeated measurements were carried out between the points already measured, so that finally the measurement data was obtained in a step of 5% of the engine load and this data was consider when creating the model.
The measurements were taken by switching the load sharing mode to manual mode and gradually increasing the load by 5% to reach the desired measurement point. When the desired measurement point was reached, the load was kept in this mode for at least 10 minutes and when all operating parameters were stable, the recording was started. In this way, each recording point was checked against requirements 6.4.9.2 and 6.4.9.3 of the NOx Technical Code 2008. Furthermore, care was taken to minimize the change in rudder angle as much as possible during the measurement.
In addition to the primary fuel lines, DFDE engines require secondary lines that supply a small amount of fuel, called pilot fuel. This pilot fuel is crucial for ignitions when the engine is operating with LNG - air mixture [
9] and distillate mode [
10] to ensure nozzle cooling. Pilot fuel consumption is considered when calculating the SFOC for each fuel type considered. The operation and efficiency of DFDE engines are well described in the literature [
12,
13,
14,
15,
16,
17,
18,
19,
20].
Figure 1 show graphically the measured data for SFOC. All measurements were carried out in the power range from 20 to 90% engine load and with three types of fuel.
As an example, to prove the hypothesis that the total fuel consumption could be lower than that of engines with an equal load distribution, a calculation was carried out for three selected loads on MDO.
In
Table 2 each mode is associated with an equivalent power output and two operating configurations are also considered. The first option/configuration is engine load sharing according to the PMS where the load is automatically distributed evenly among the number of engines in the network without considering the optimal engine operating point and fuel consumption. In the second option/configuration, the PMS is ignored, and the load is manually adjusted between the engines, so that the loads of the engines are manually adjusted to the optimal operating point (according to the measurement data) and the rest of the load is taken by an engine that would operate at a lower load.
Table 2 shows how the adjusted load configuration leads to daily fuel savings for each load level. The last two columns show the potential daily savings in MT (metric tons) and as a percentage. The greatest percentage saving is seen at the 9000kW level, with over 6% improvement. The table indicates that adjustment of the engine loads to their optimal operating points can lead to significant fuel savings compared to even load sharing managed by the PMS.
Based on the results obtained in
Table 2, the consequence was to carry out a deeper analysis of the measurement results obtained for all three fuels and to develop an optimization model for the purpose of energy and fuel savings on an LNG vessel with a DF power plant load distribution.
3. Optimization Model
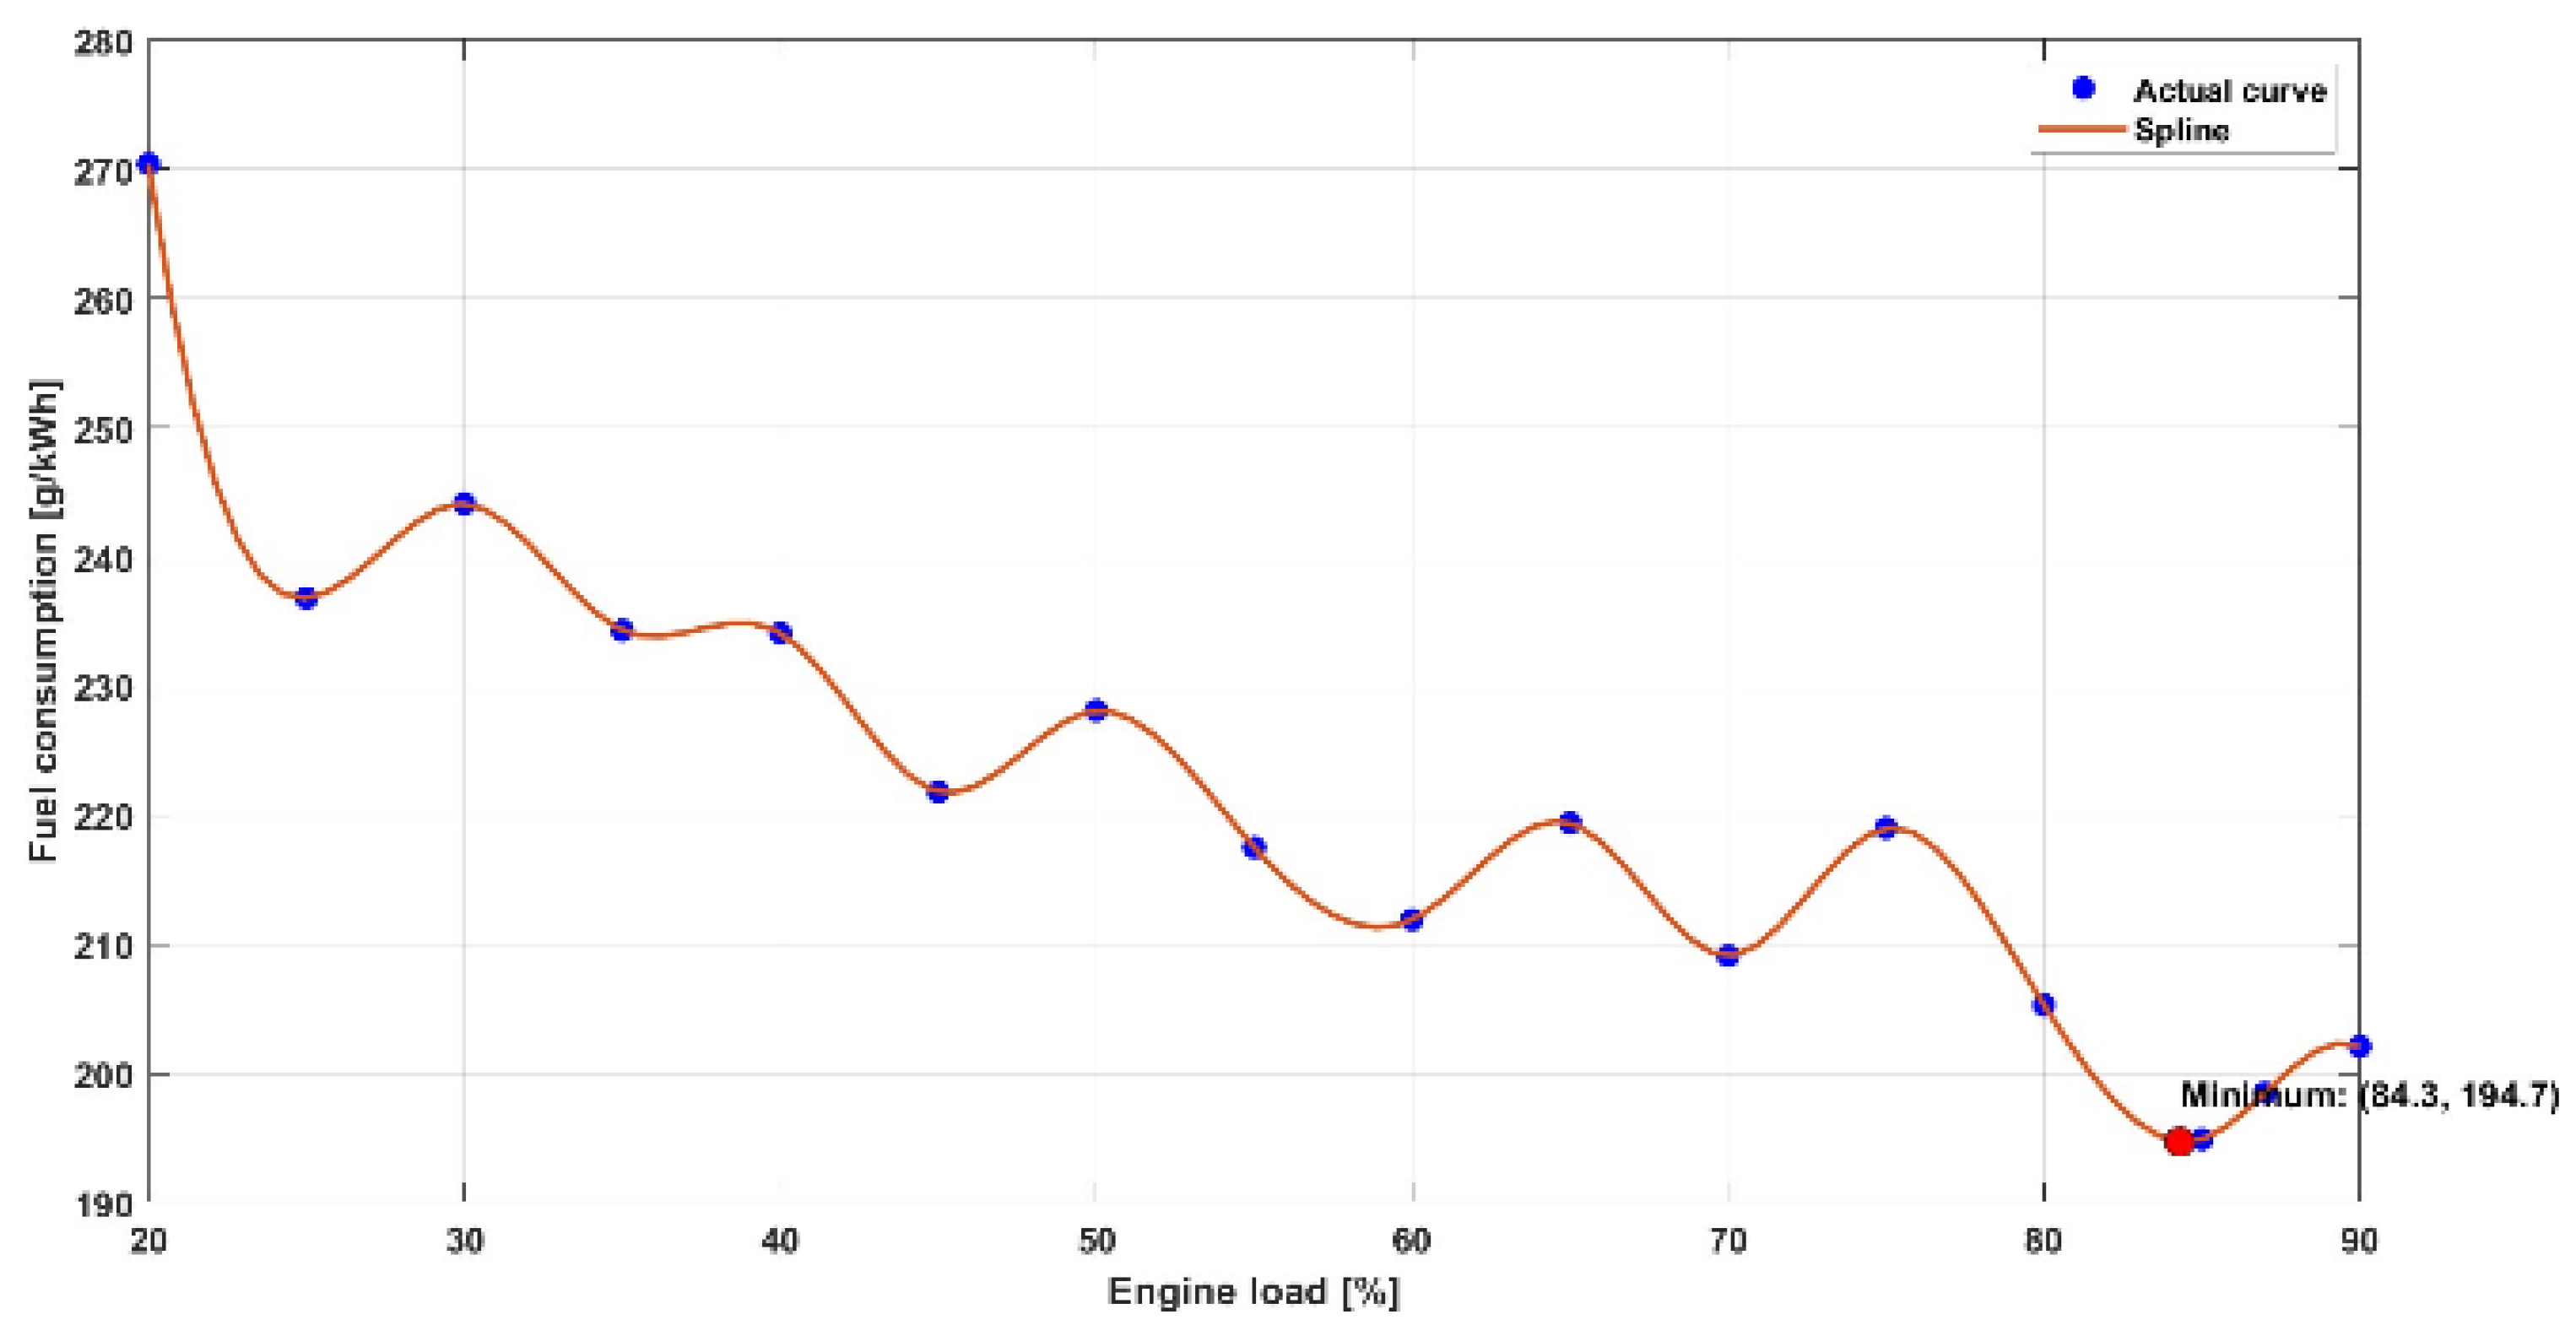
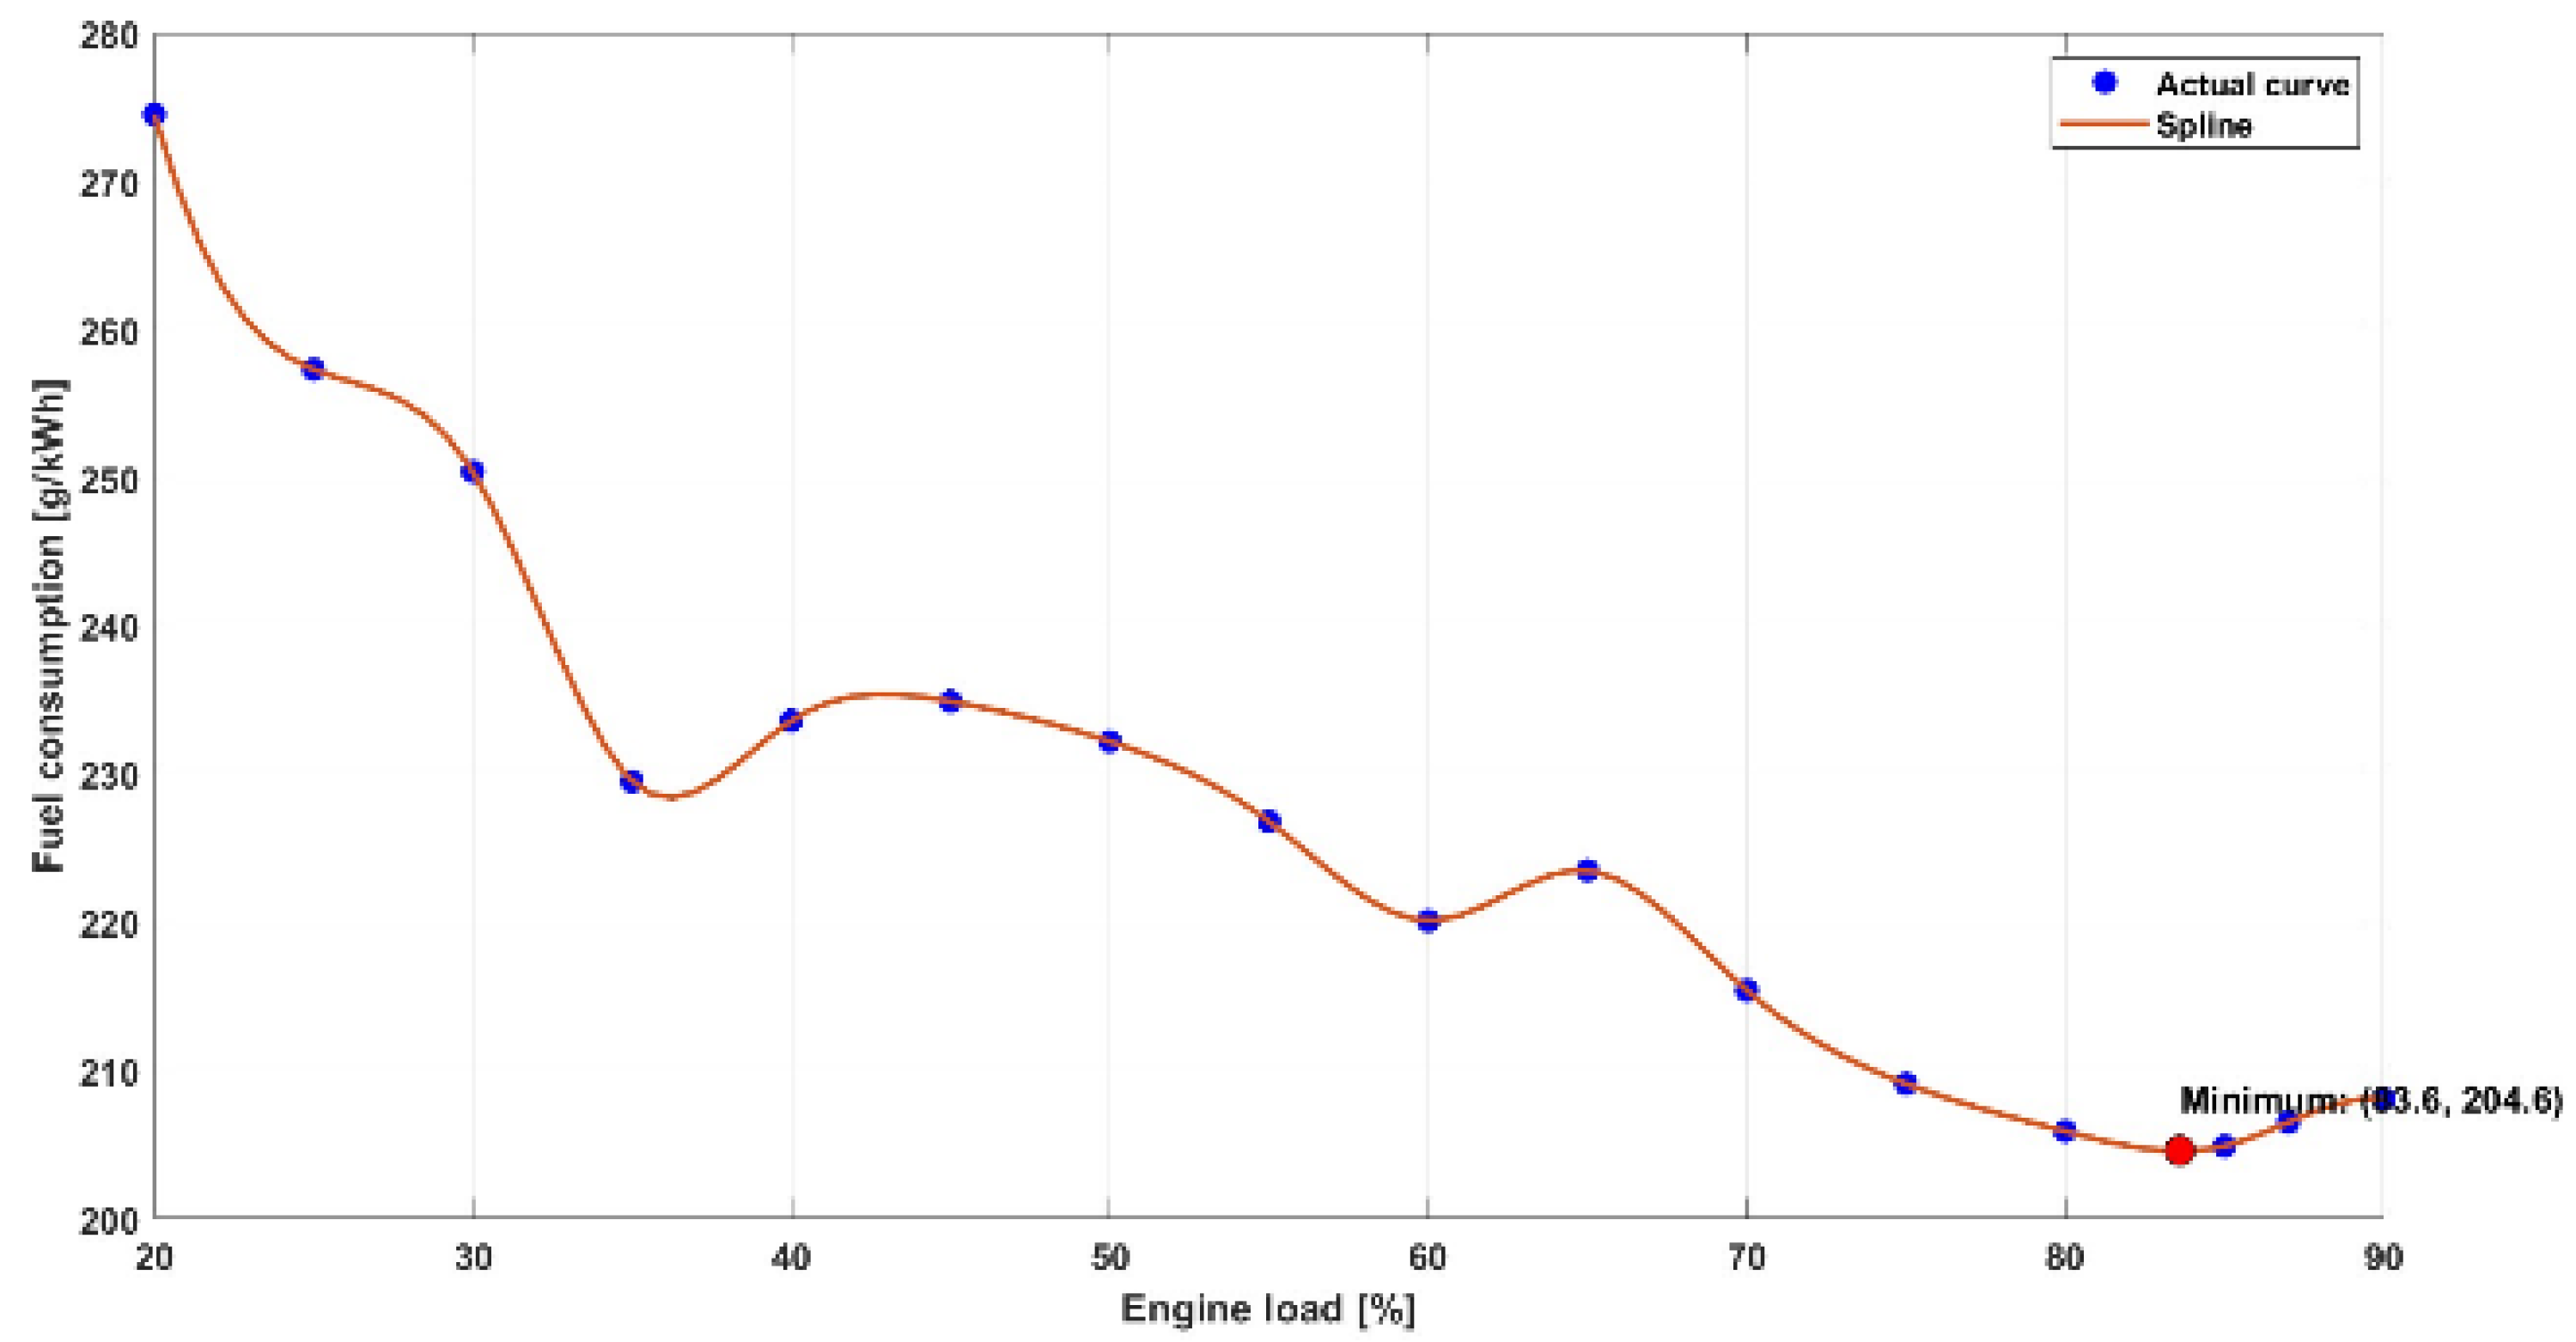
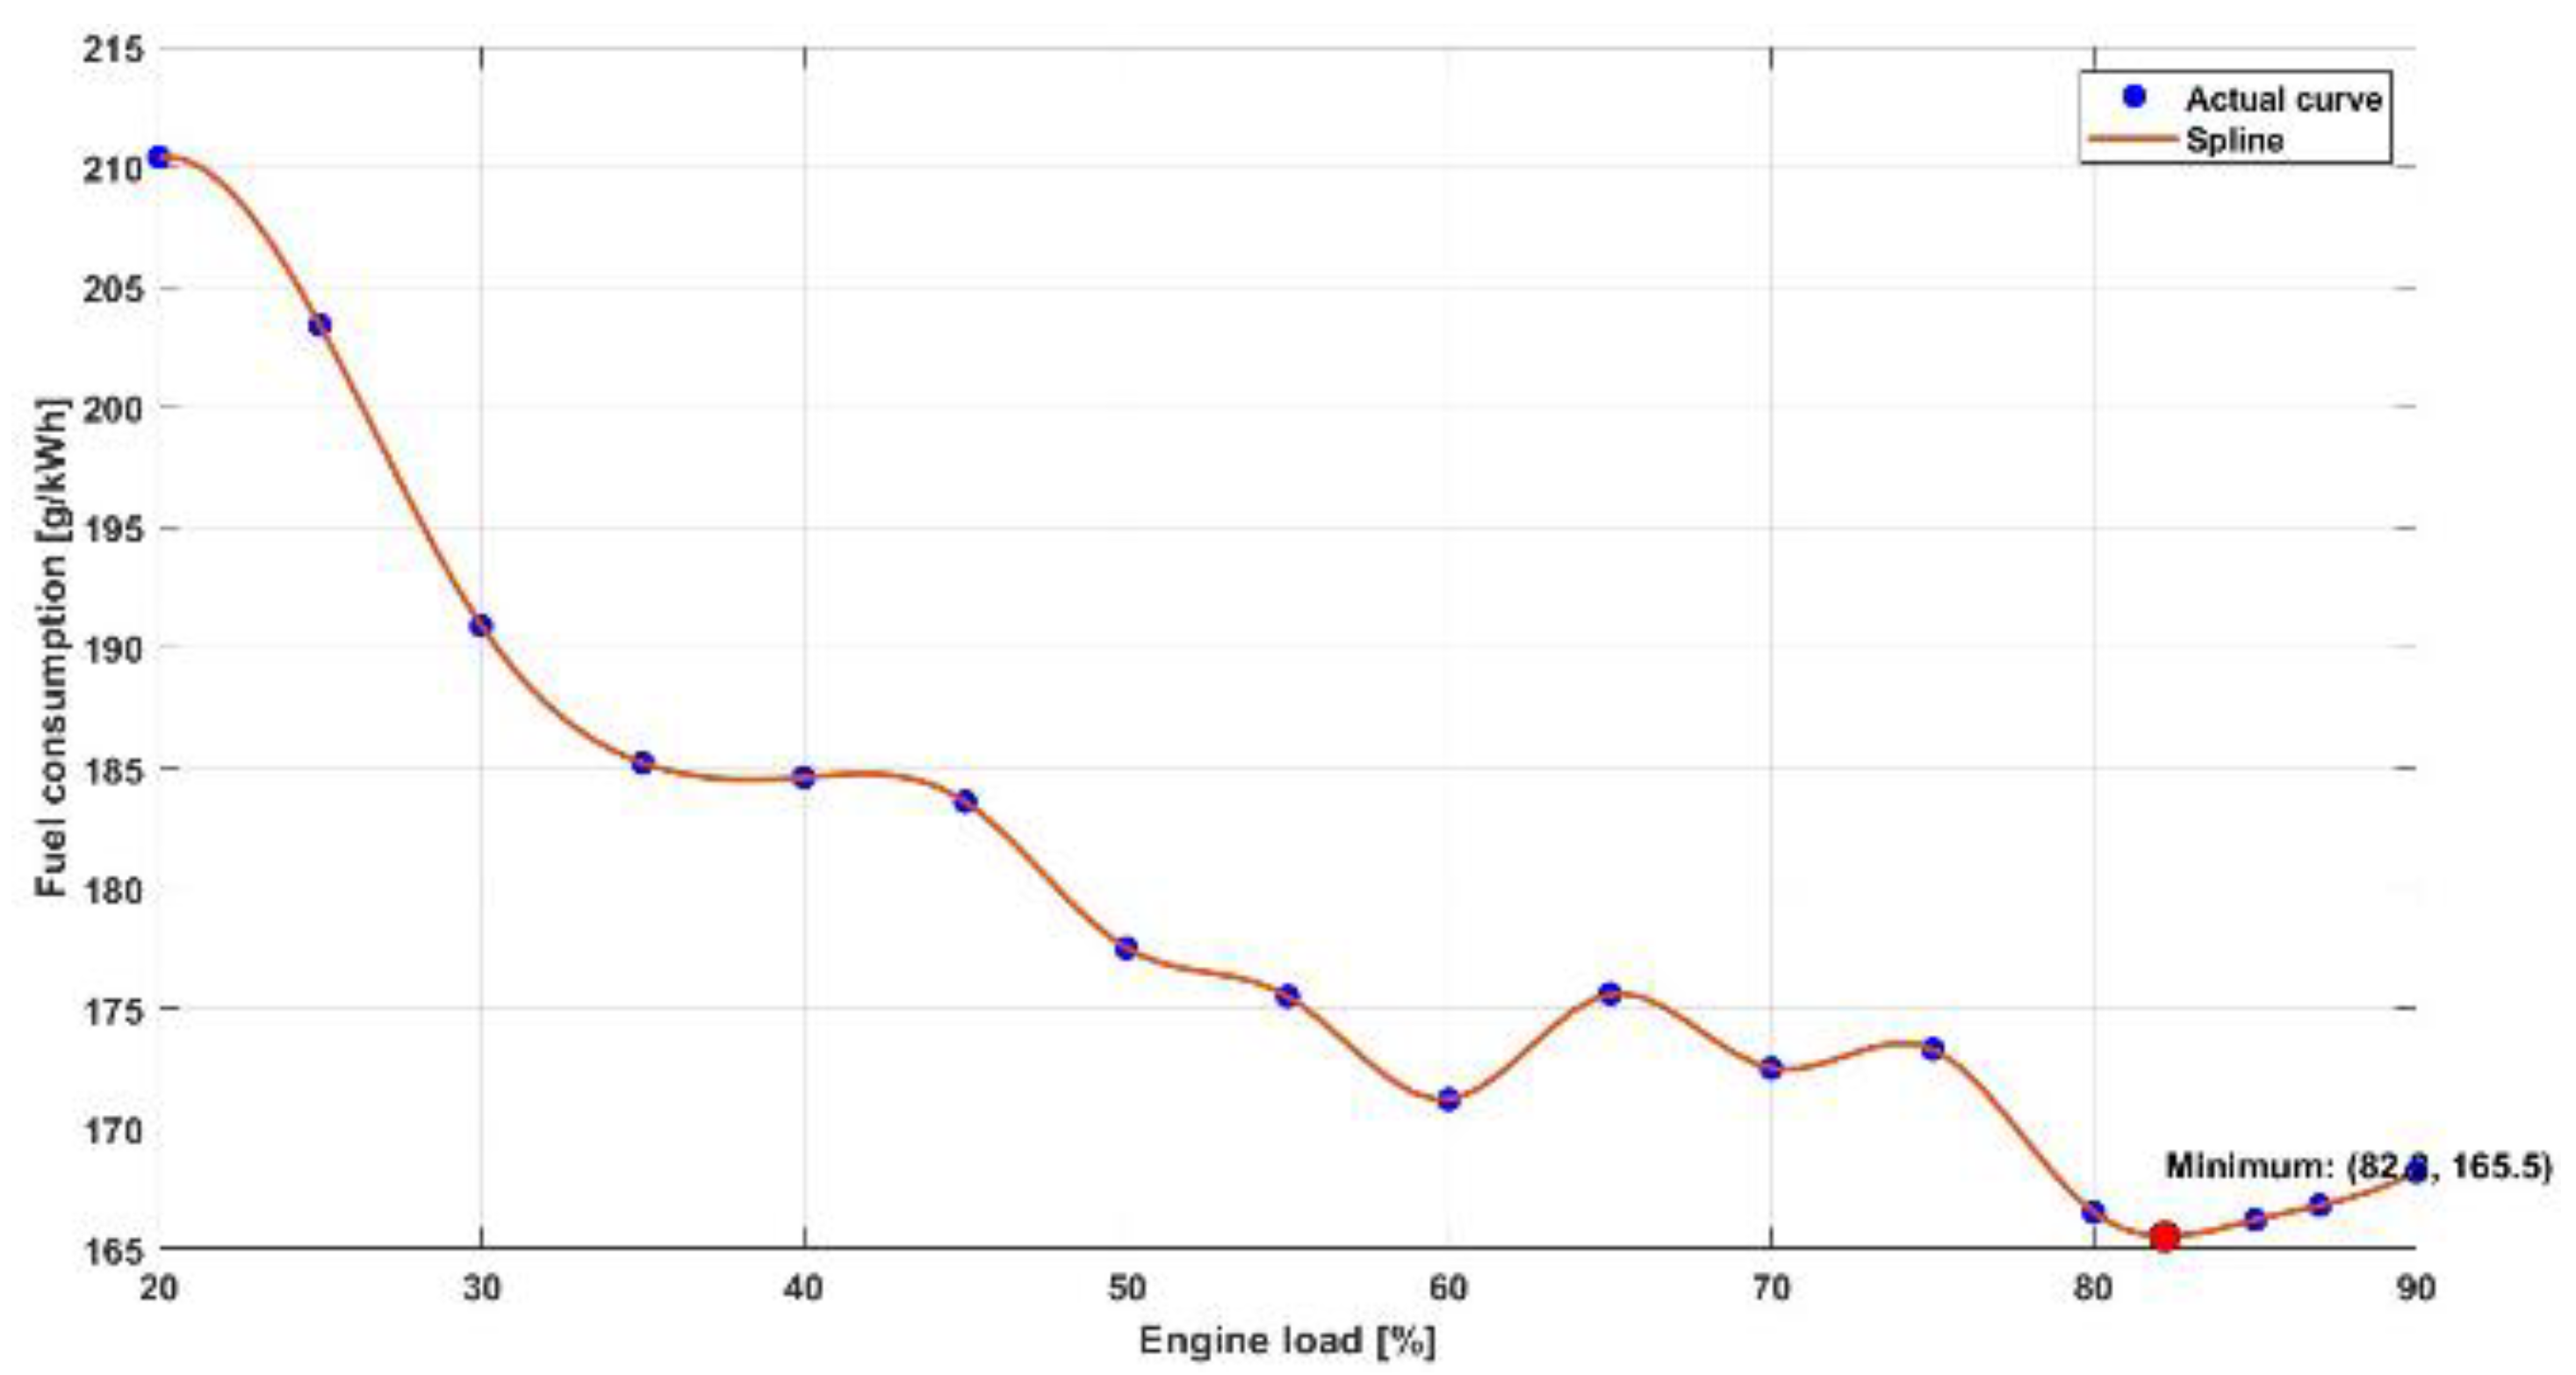
Optimisation model is developed and fed with measured fuel consumption data onboard a ship using different fuels. Since data have been measured in discrete time steps, i.e. at 5% load steps, interpolation must be performed, and such interpolated data must be used to feed the optimisation model to determine the optimal load share between the generators. By using such interpolated data, optimisation model can calculate the load share with higher precision, while for non-interpolated data load share could only be calculated in discrete 5% load steps.
Interpolation is performed in MATLAB using spline interpolation as explained in [
20]. For given set of
n data points (x
i, y
i) where i=1,2,…, n, spline interpolation in MATLAB aims to find a polynomial function S(x) such that:
Interpolated function
S(x) can be mathematically represented as:
where:
MATLAB selects the coefficients
ai, bi, ci and
di such that
S(x) interpolates data points and satisfies the continuity of the first and second derivatives at each point
xi.
The required fuel consumption data for interpolation is obtained in discrete points and a mathematical spline function was used in MATLAB to interpolate and smooth the data points for all 3 fuel types.
Figure 2 show for HFO,
Figure 3 for MDO and
Figure 4 for LNG.
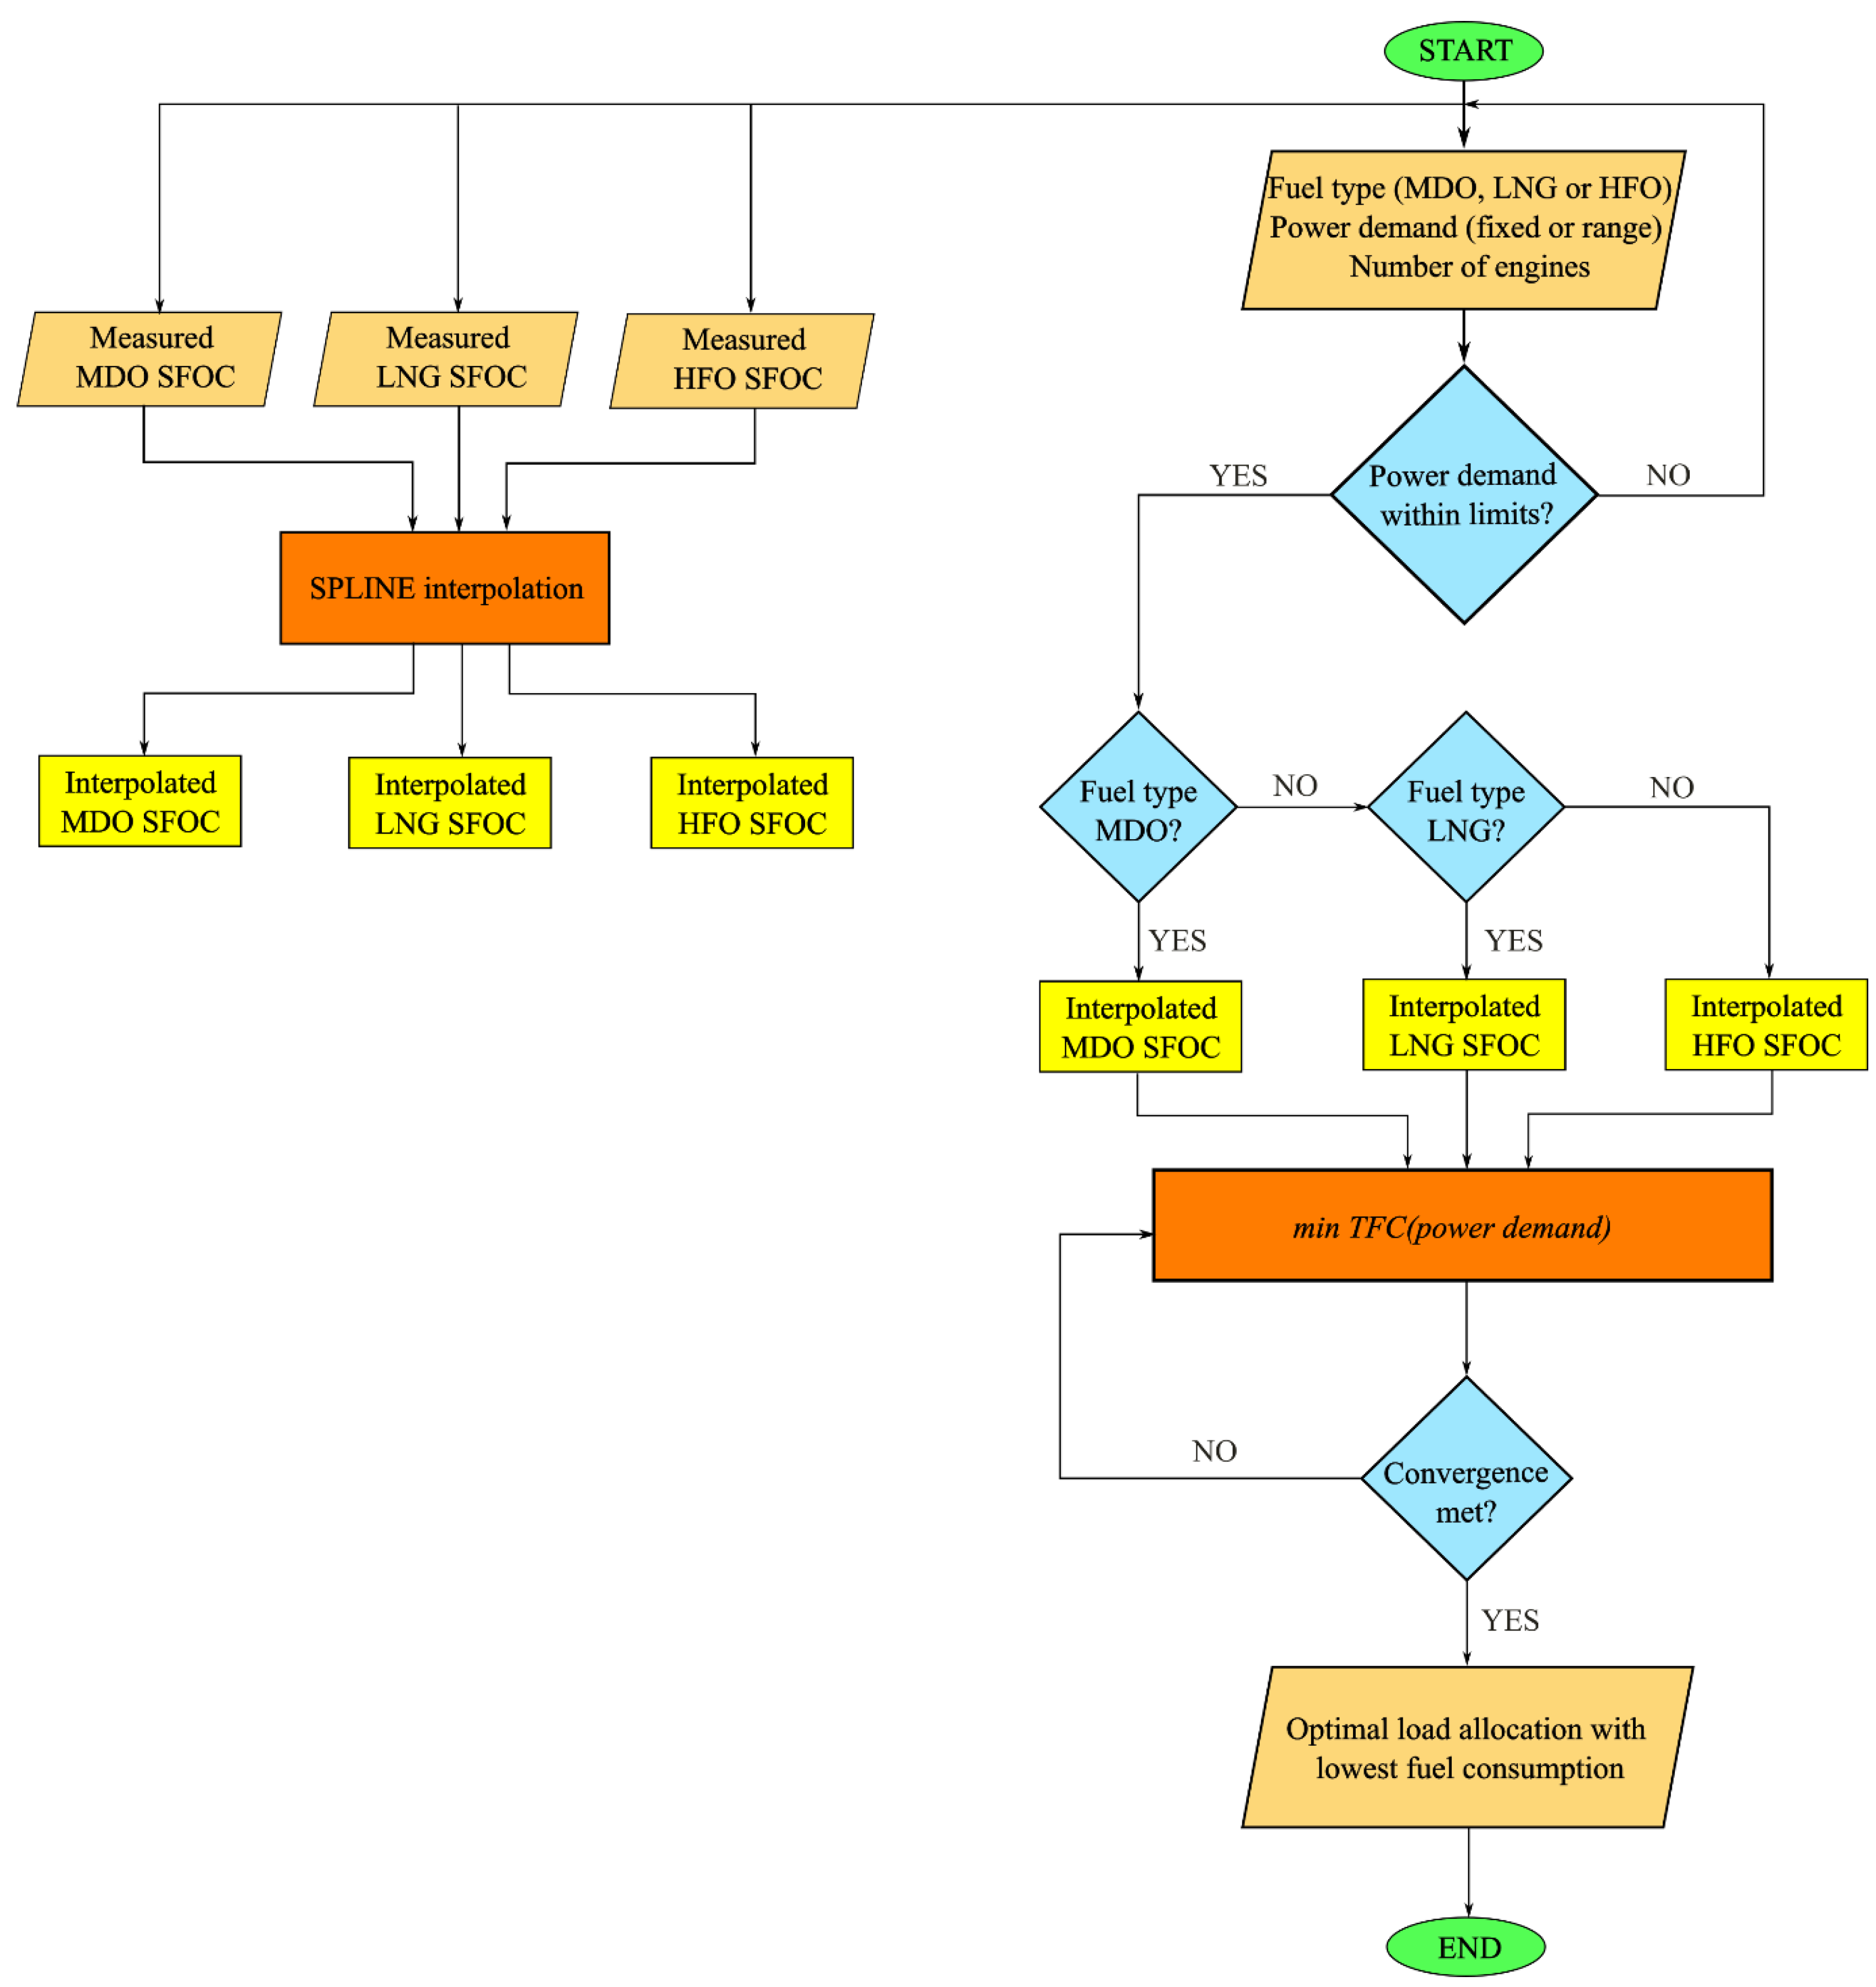
With SFOC being interpolated, it can be fed into the optimization model. Optimization model is developed using MATLAB according to flow chart shown in
Figure 5.
The objective function calculates the total fuel consumption based on previously interpolated SFOC functions for desired type of fuel and aims to minimize fuel consumption while meeting power demand. Constraints are also modelled to ensure that the total load does not exceed sum of rated engine powers connected on grid. Furthermore, load percentage per engine is bounded by lower and upper bounds,
lb and
ub, respectively. The optimization is performed using the
fmincon function, seeking to minimize the total fuel consumption (TFC) while respecting the constraints, as described mathematically:
Function starts with an initial guess of load allocation and iteratively updates it to minimize the TFC function while satisfying specified constraints and bounds. The algorithm continues refining the solution until convergence. Finally, the optimized values of load allocations for given power demand and number of engines is returned as a solution. Besides specific value of demanded power, model can calculate the optimal load allocations for range of power demands. In either case, model provides the total fuel consumption for both the optimized generator load allocation and an equal load allocation scenario for comparison purposes.
4. Results and Discussion
An optimization example was created in MATLAB and presented with the different fuel types and different load’s requirements depending on the ship's operating modes.
4.1. Heavy Fuel Oil (HFO) Optimization Example
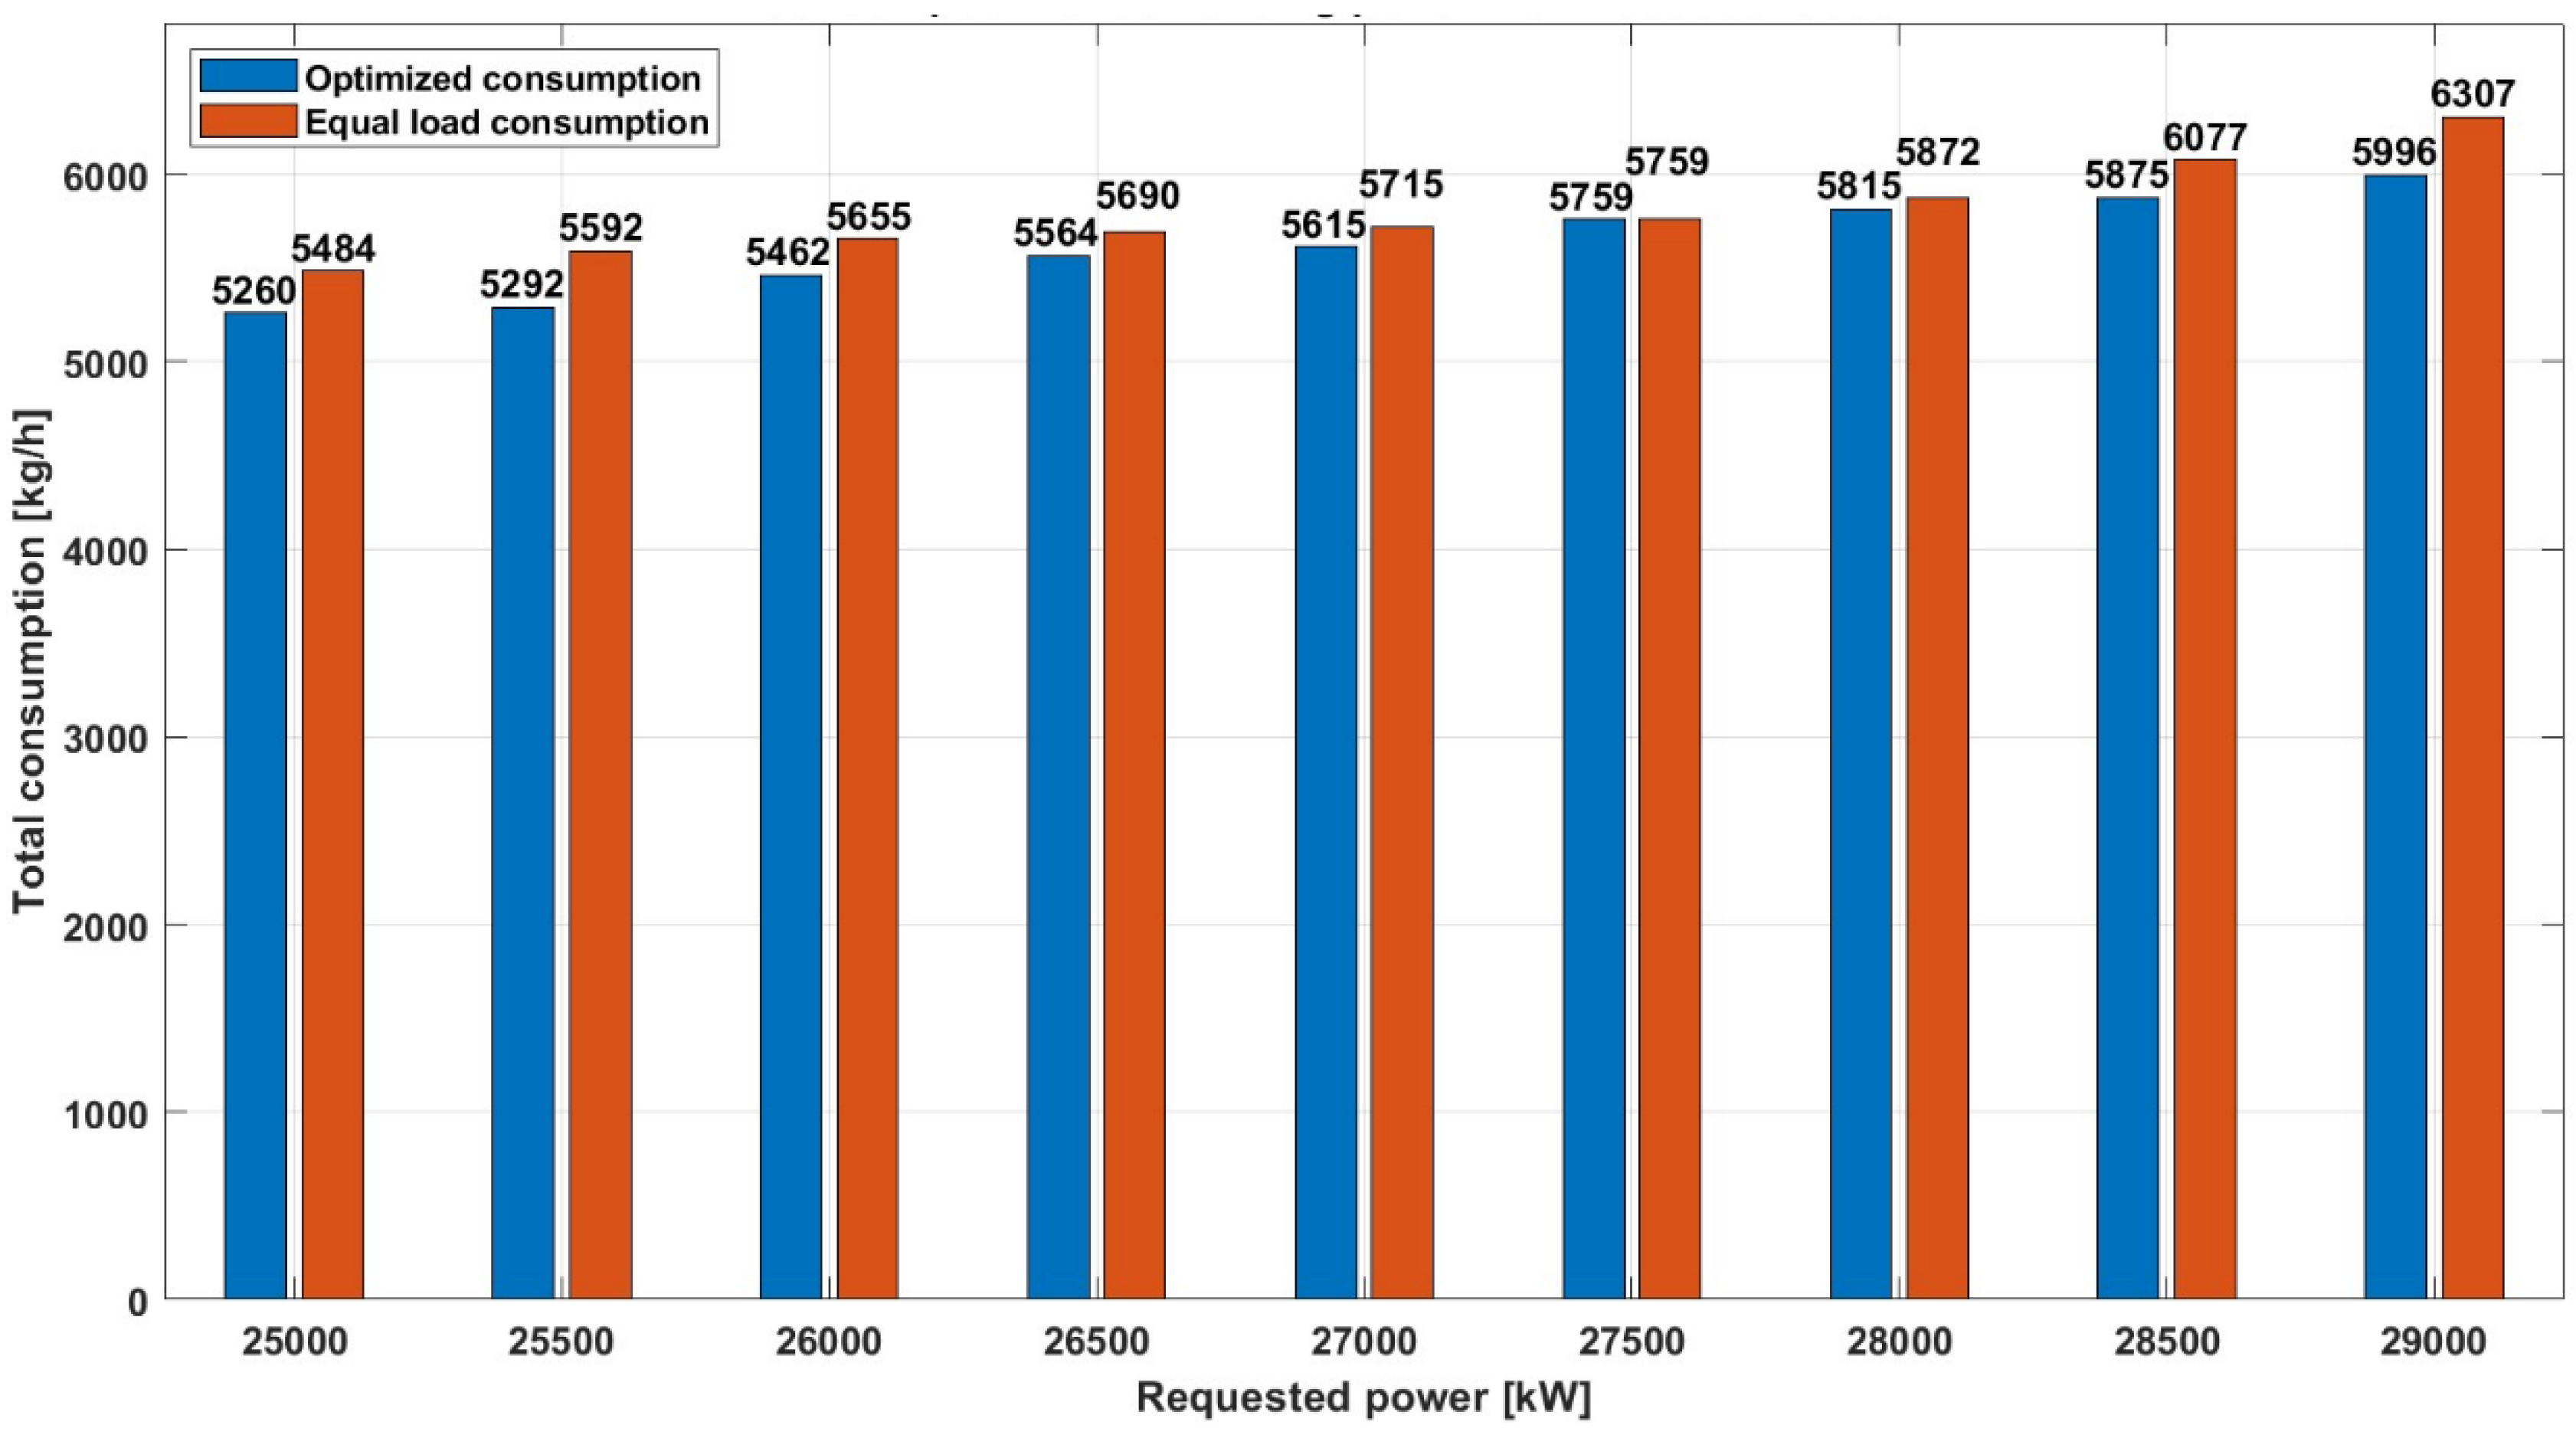
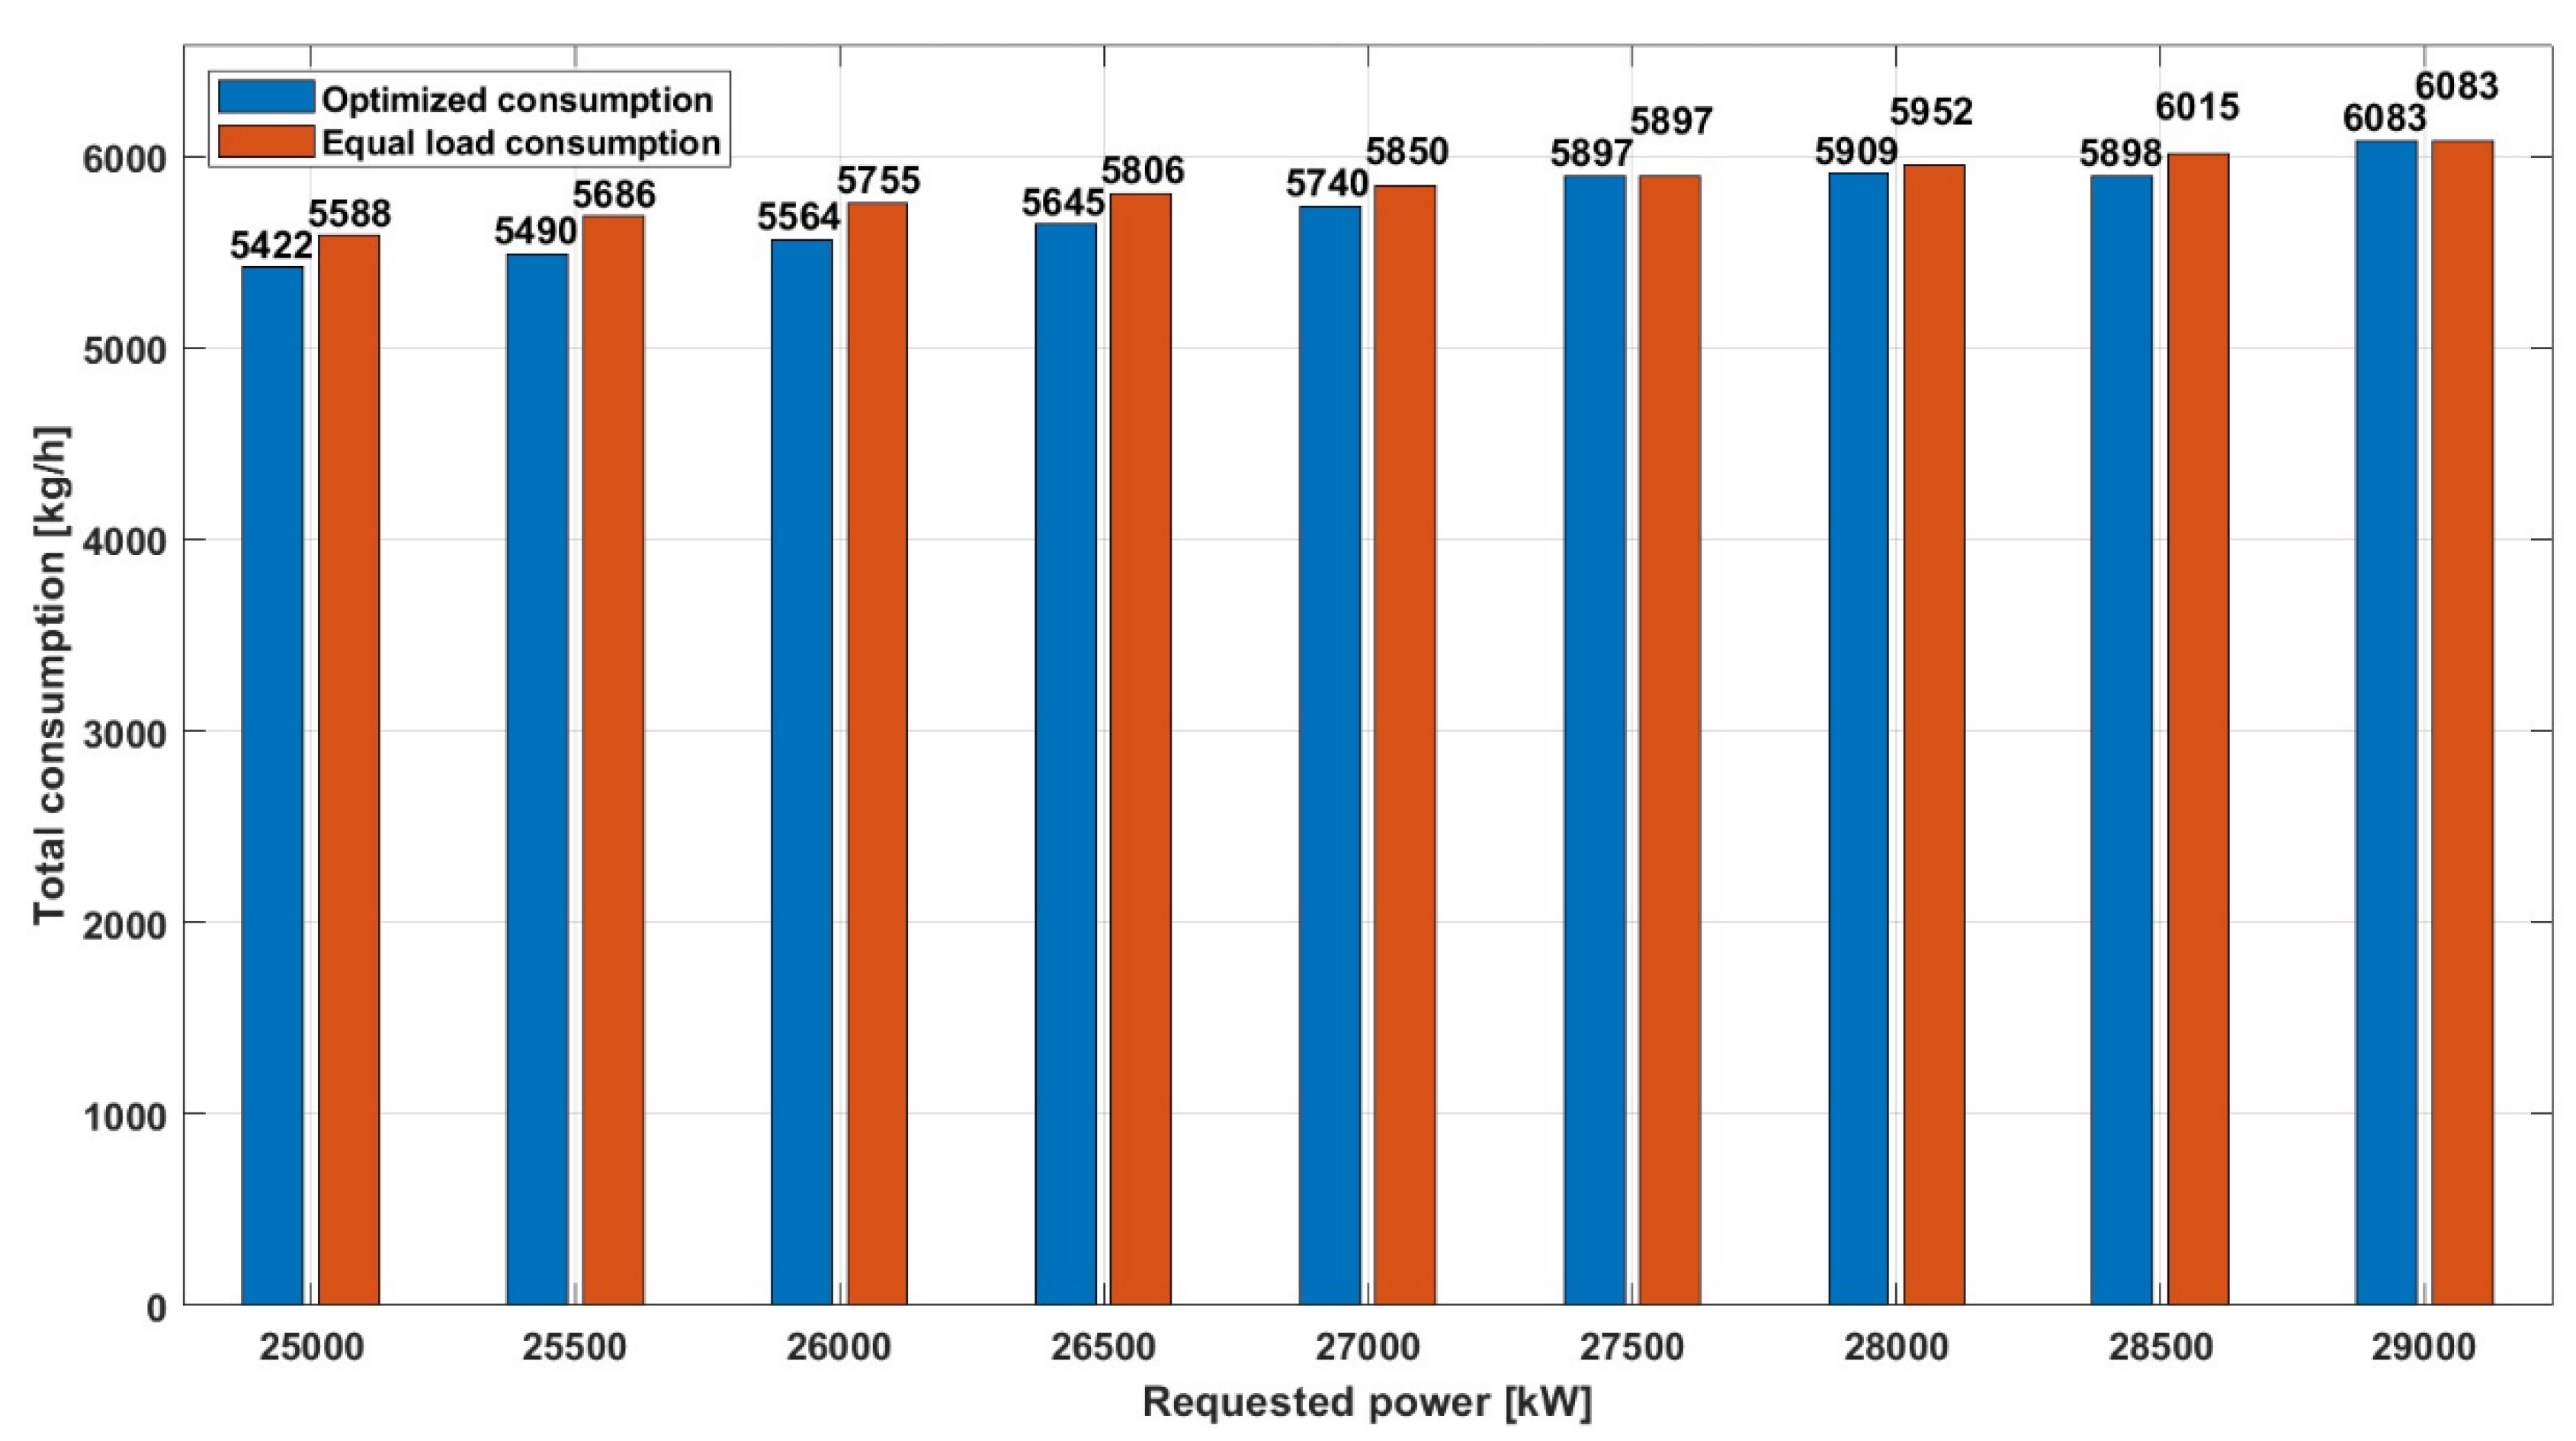
Figure 6 shows the fuel consumption for HFO of a power plant with an output of 25,000 kW to 29,000 kW distributed over five engines, a range that is frequently used under normal ship operating conditions. It illustrates the difference in fuel consumption (kg/h) between two scenarios:
Consumption at the same load (red bars): This is the case when power is evenly distributed across all engines.
Optimized consumption (blue bars): This is the case when an optimization model recommends a specific distribution of power among the engines to achieve better fuel consumption.
The x-axis shows the requested power in kW, ranging from 25,000 kW to 29,000 kW, with steps of 500 kW. The y-axis shows the total fuel consumption in kg/h.
The measurements were carried out with a "145 PROFLOW Series “J” Vane meter " mass flow meter that had a valid calibration with the measurement accuracy within ±0.2%.
From the graph the optimized consumption for each level of requested power always results in a lower fuel consumption compared to a uniform load distribution, except for a power of 27,500 kW, where the consumption is the same in both scenarios. This shows the effectiveness of the optimization model in reducing fuel consumption, which can lead to cost savings and potentially lower environmental impact.
At an output of 25,000 kW, for example, the consumption at the same load is 5,484 kg/h, while the optimized consumption is significantly lower at around 5,260 kg/h, which means that 4.25% less fuel is consumed.
At an output of 29,000 kW, the consumption at the same load is 6,307 kg/h, while the optimized consumption is 5,996 kg/h, which means 5.18% less consumption and shows consistent savings across the entire output range.
The optimization seems to lead to better fuel economy, especially when the requested power increases, which is a valuable insight for operational planning and cost management.
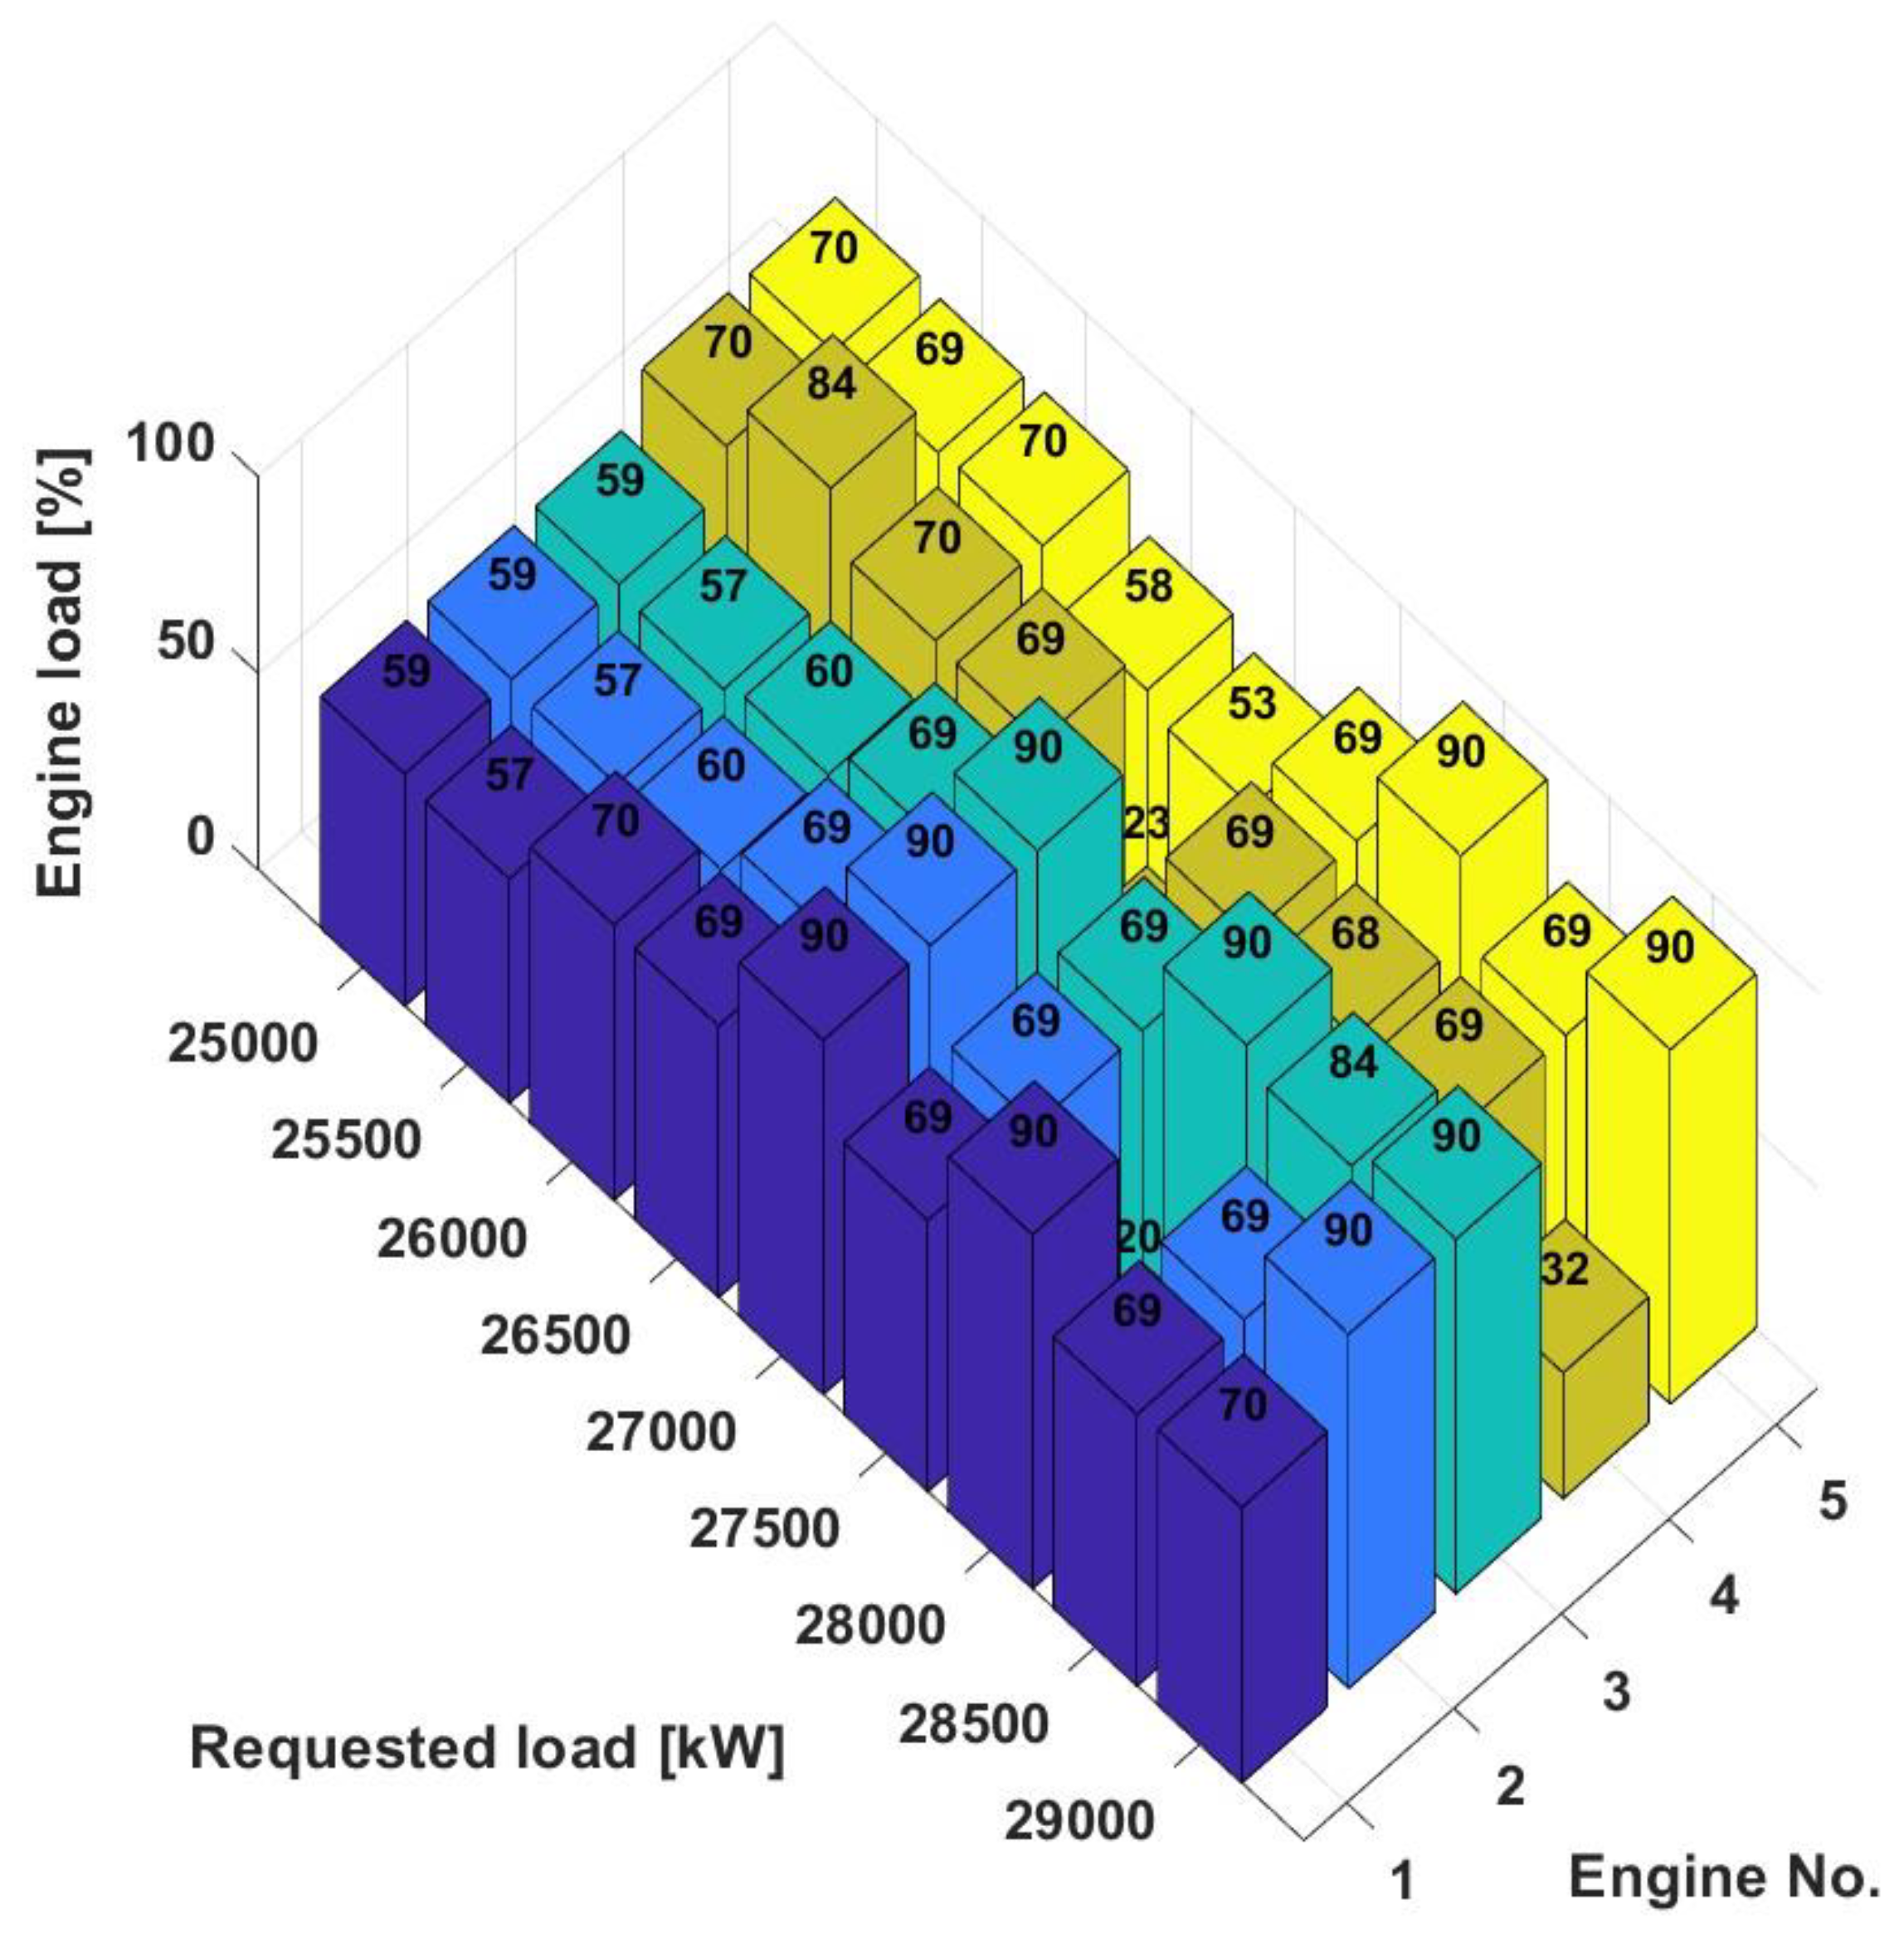
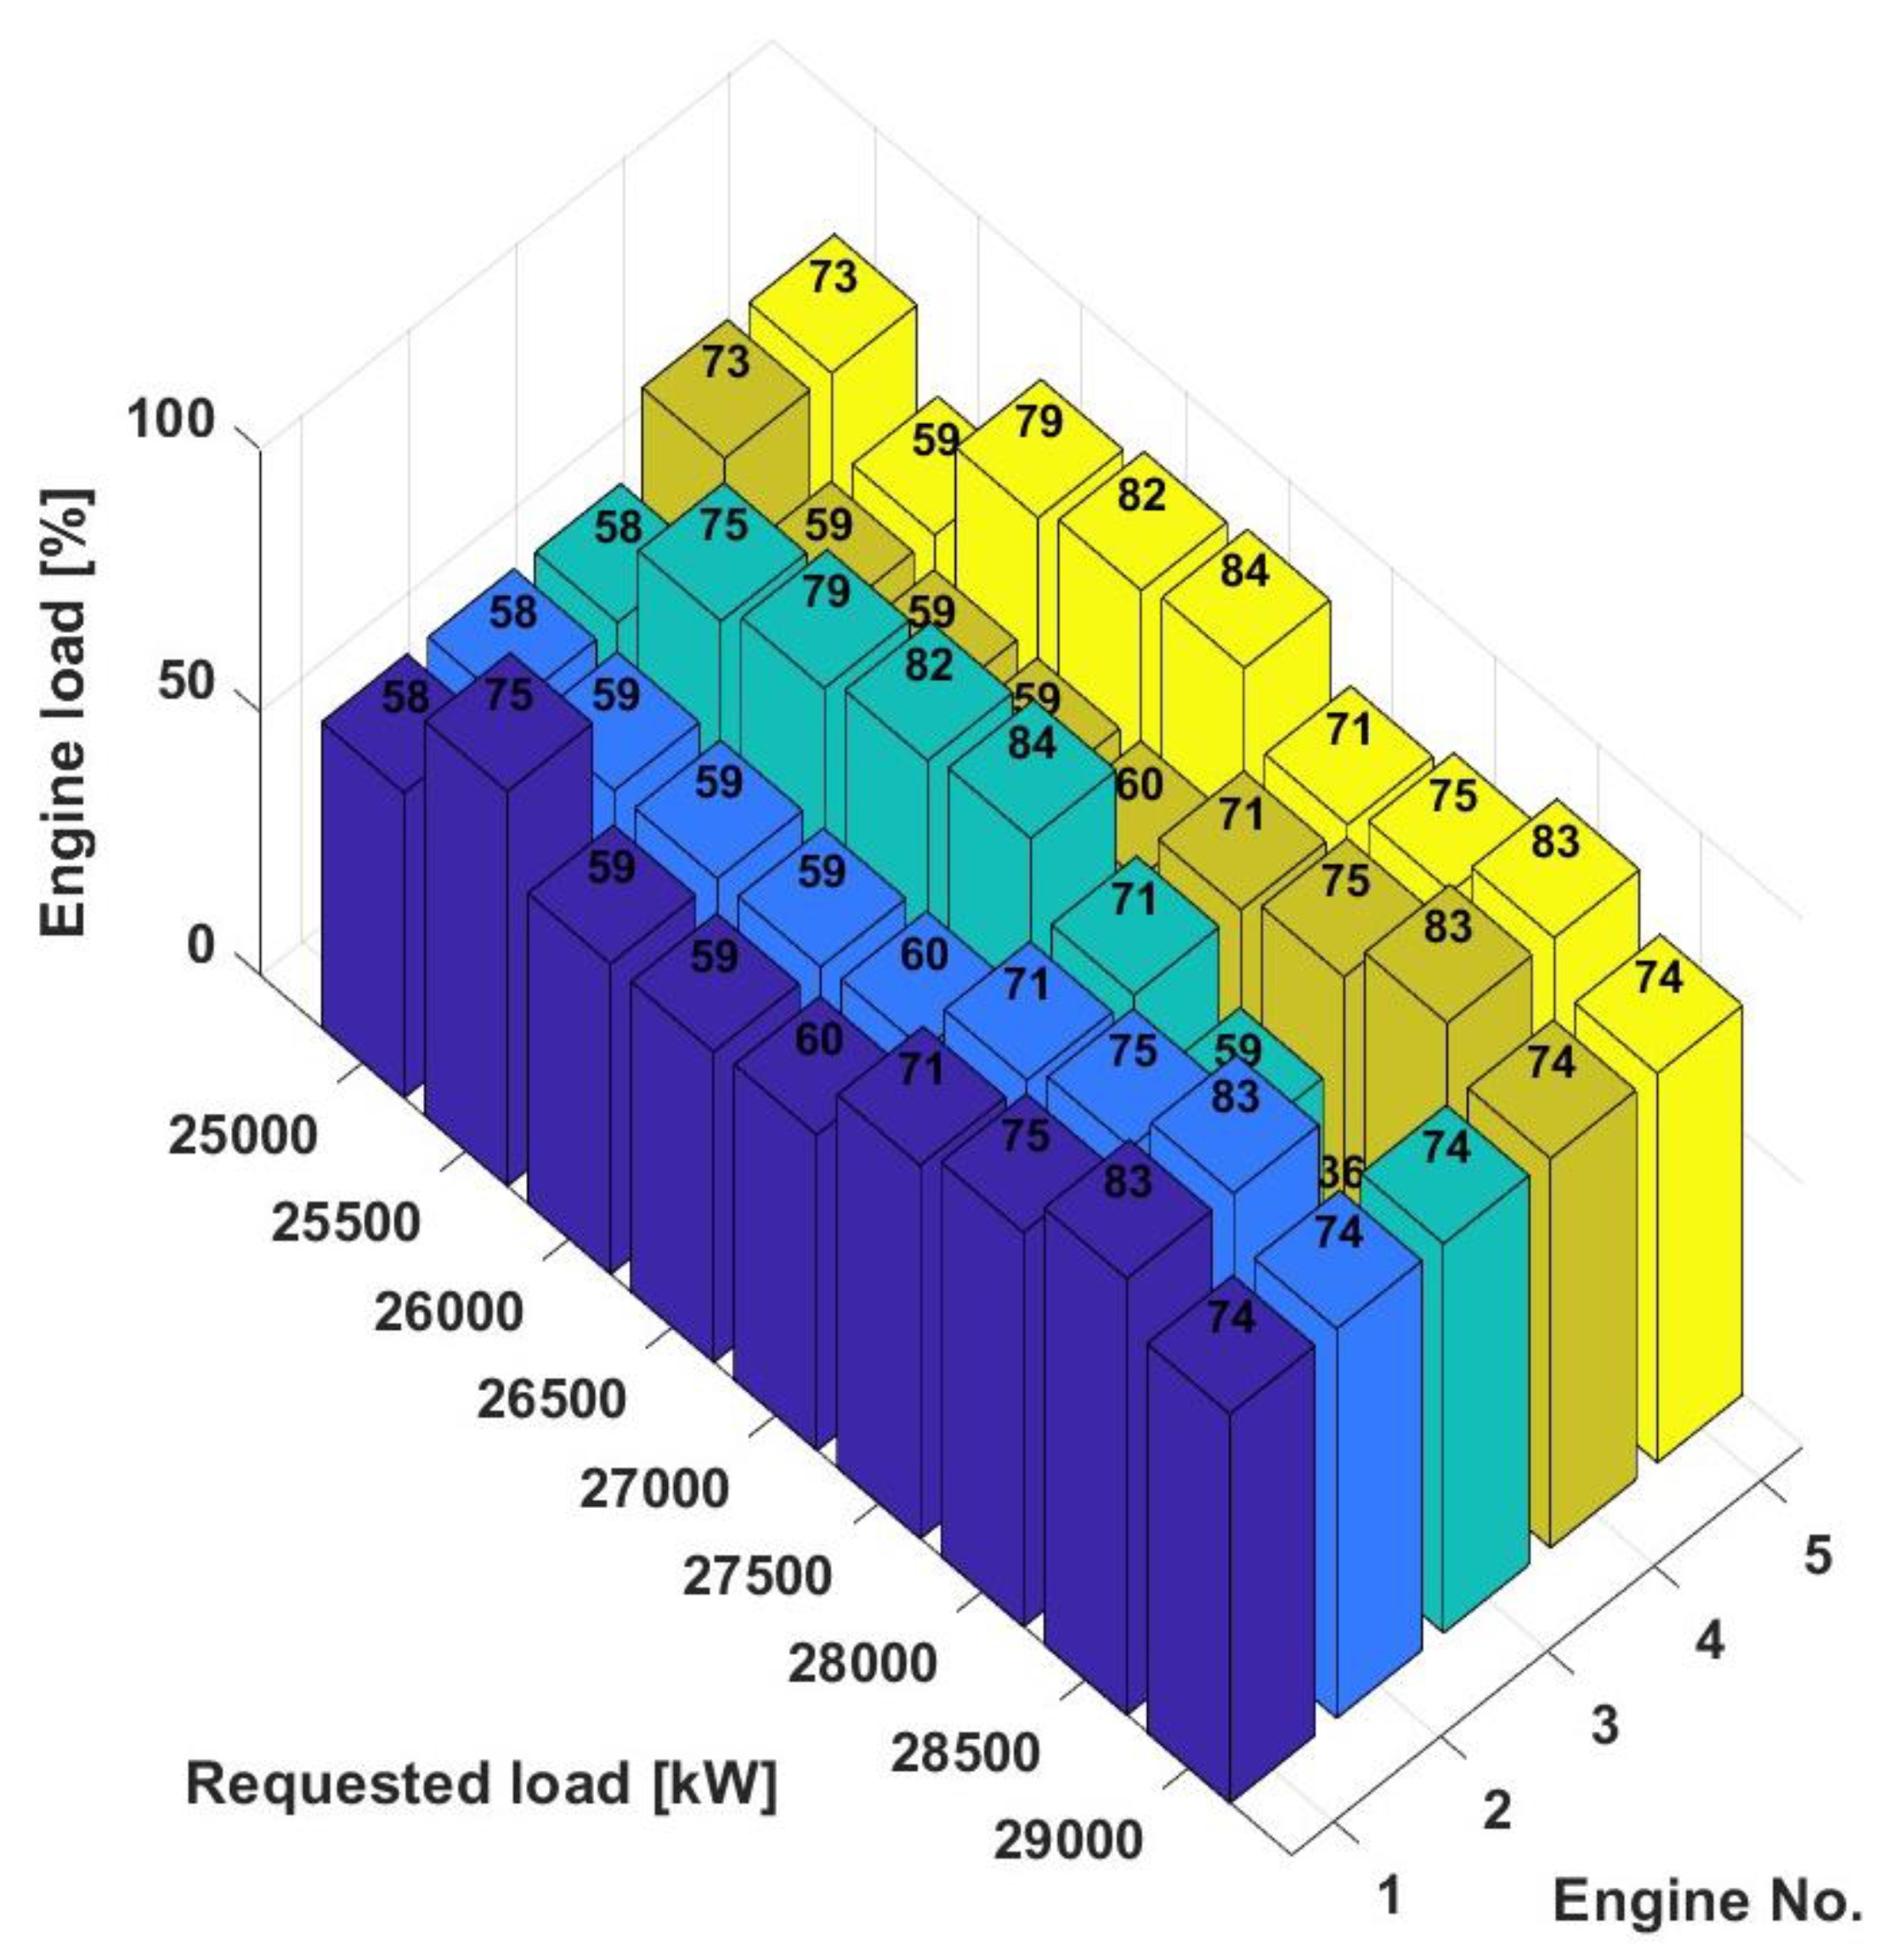
The 3D bar chart below in
Figure 7 shows the percentage distribution of load across five engines in a power plant for a power range of 25,000 kW to 29,000 kW. This type of diagram is used to illustrate how the load is distributed across the individual engines at different requested total outputs. Each colored stack represents the percentage of load assigned to a particular engine at each level of total power requested.
The
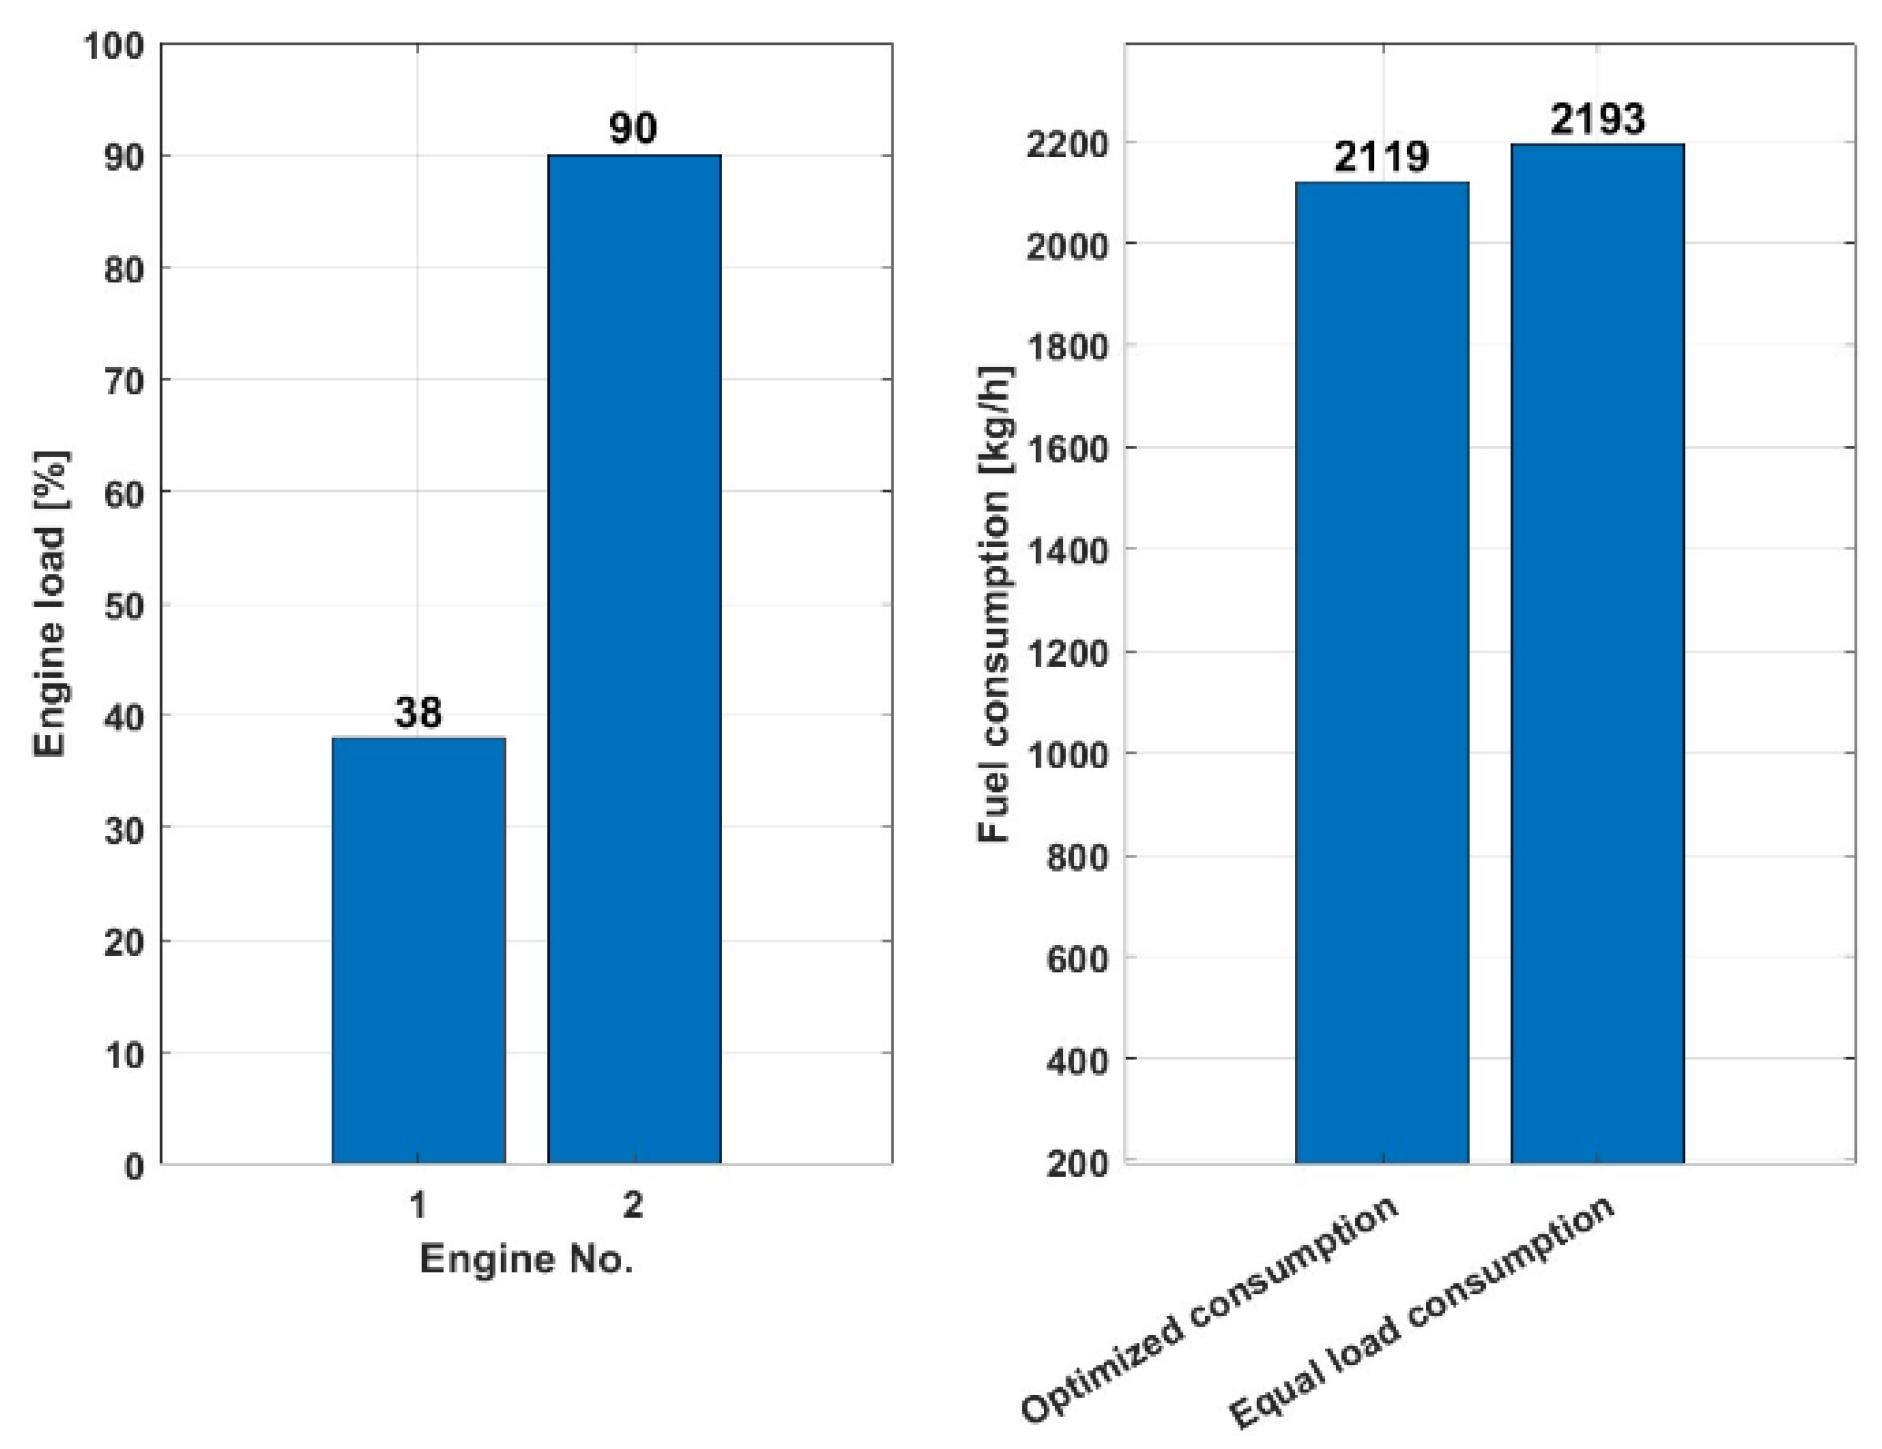
Figure 8 and
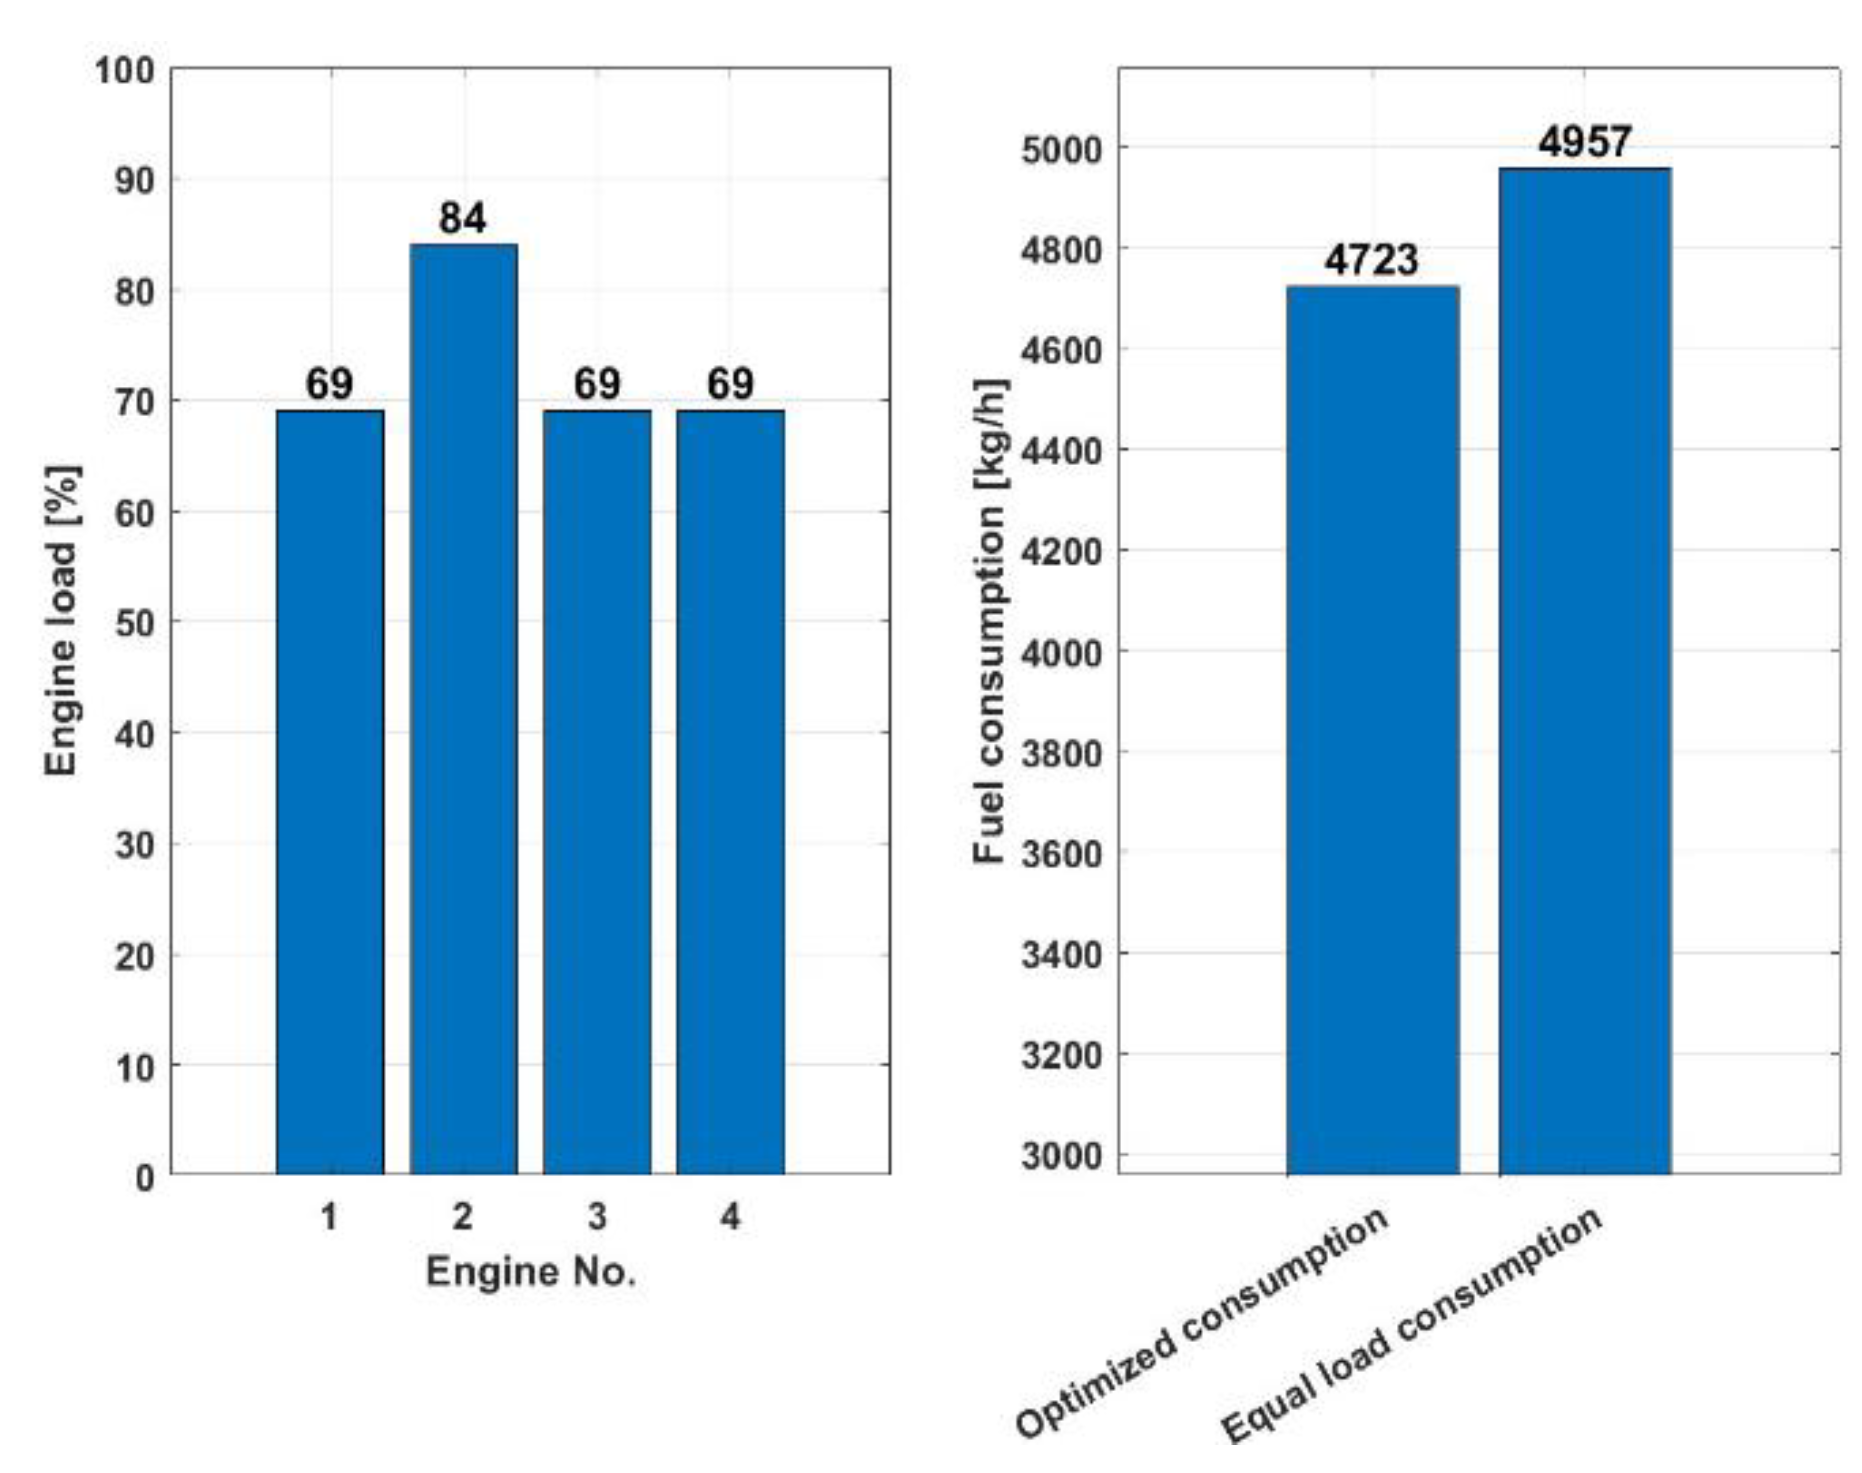
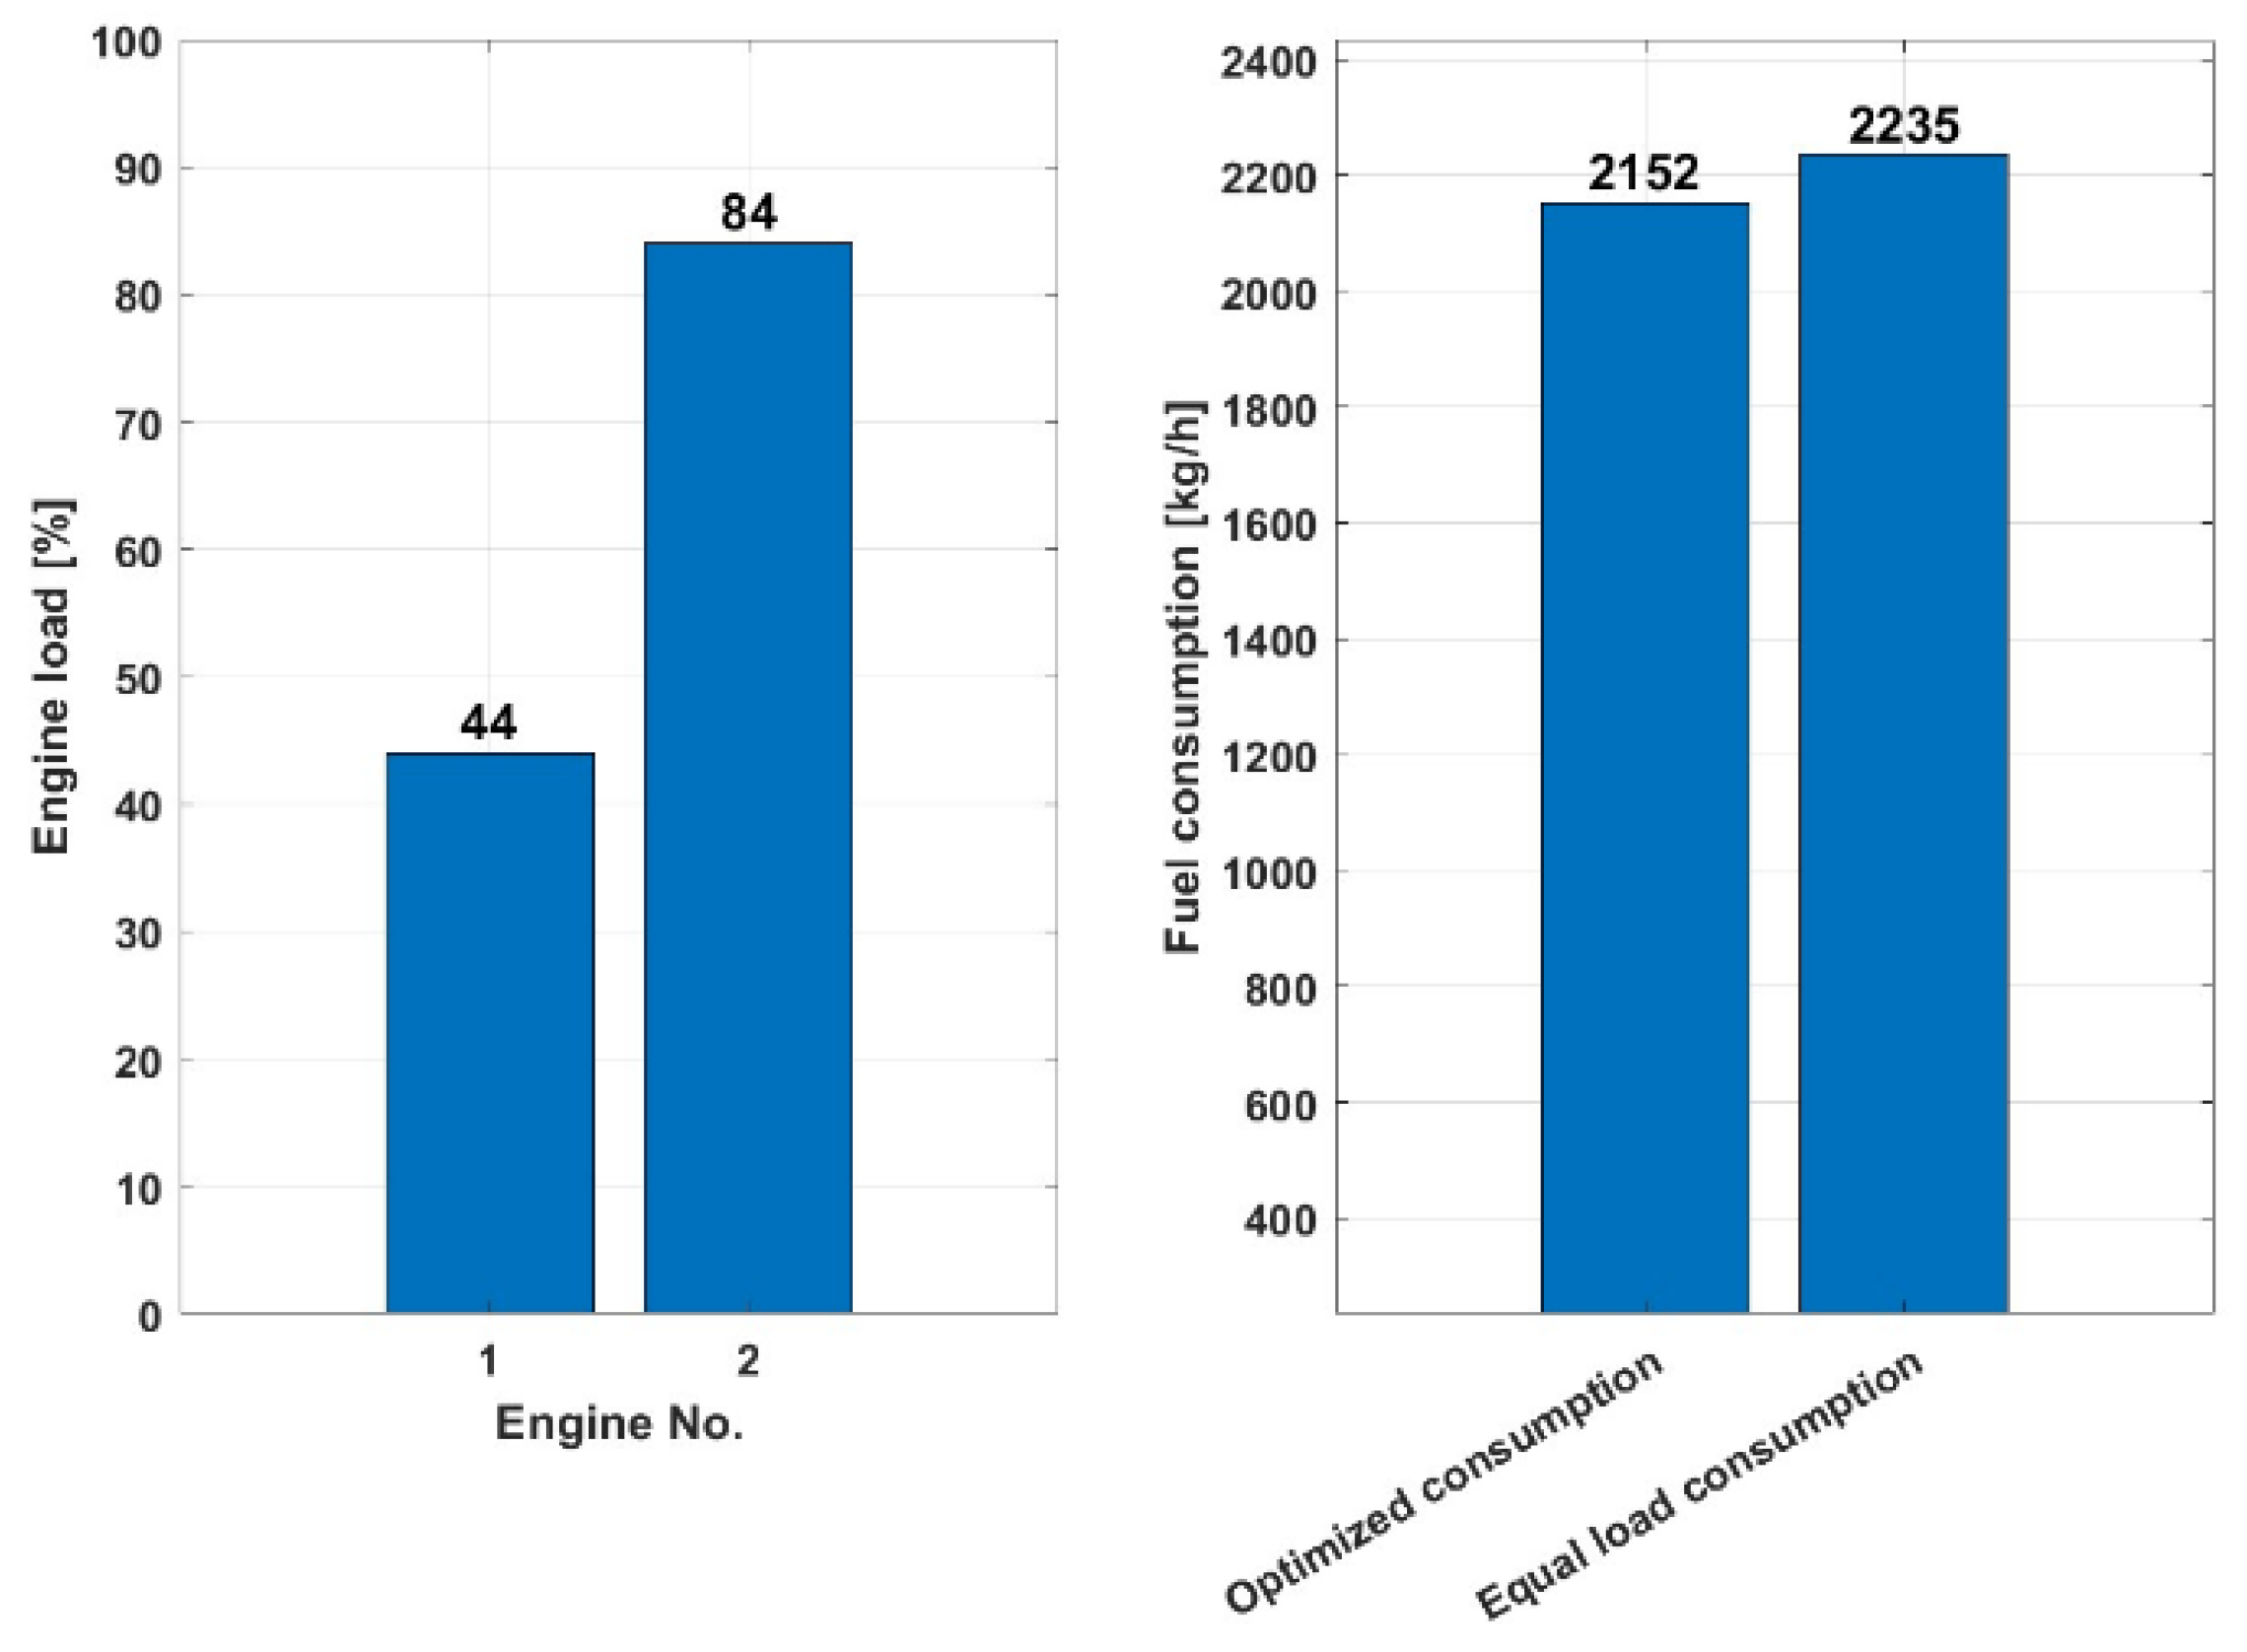
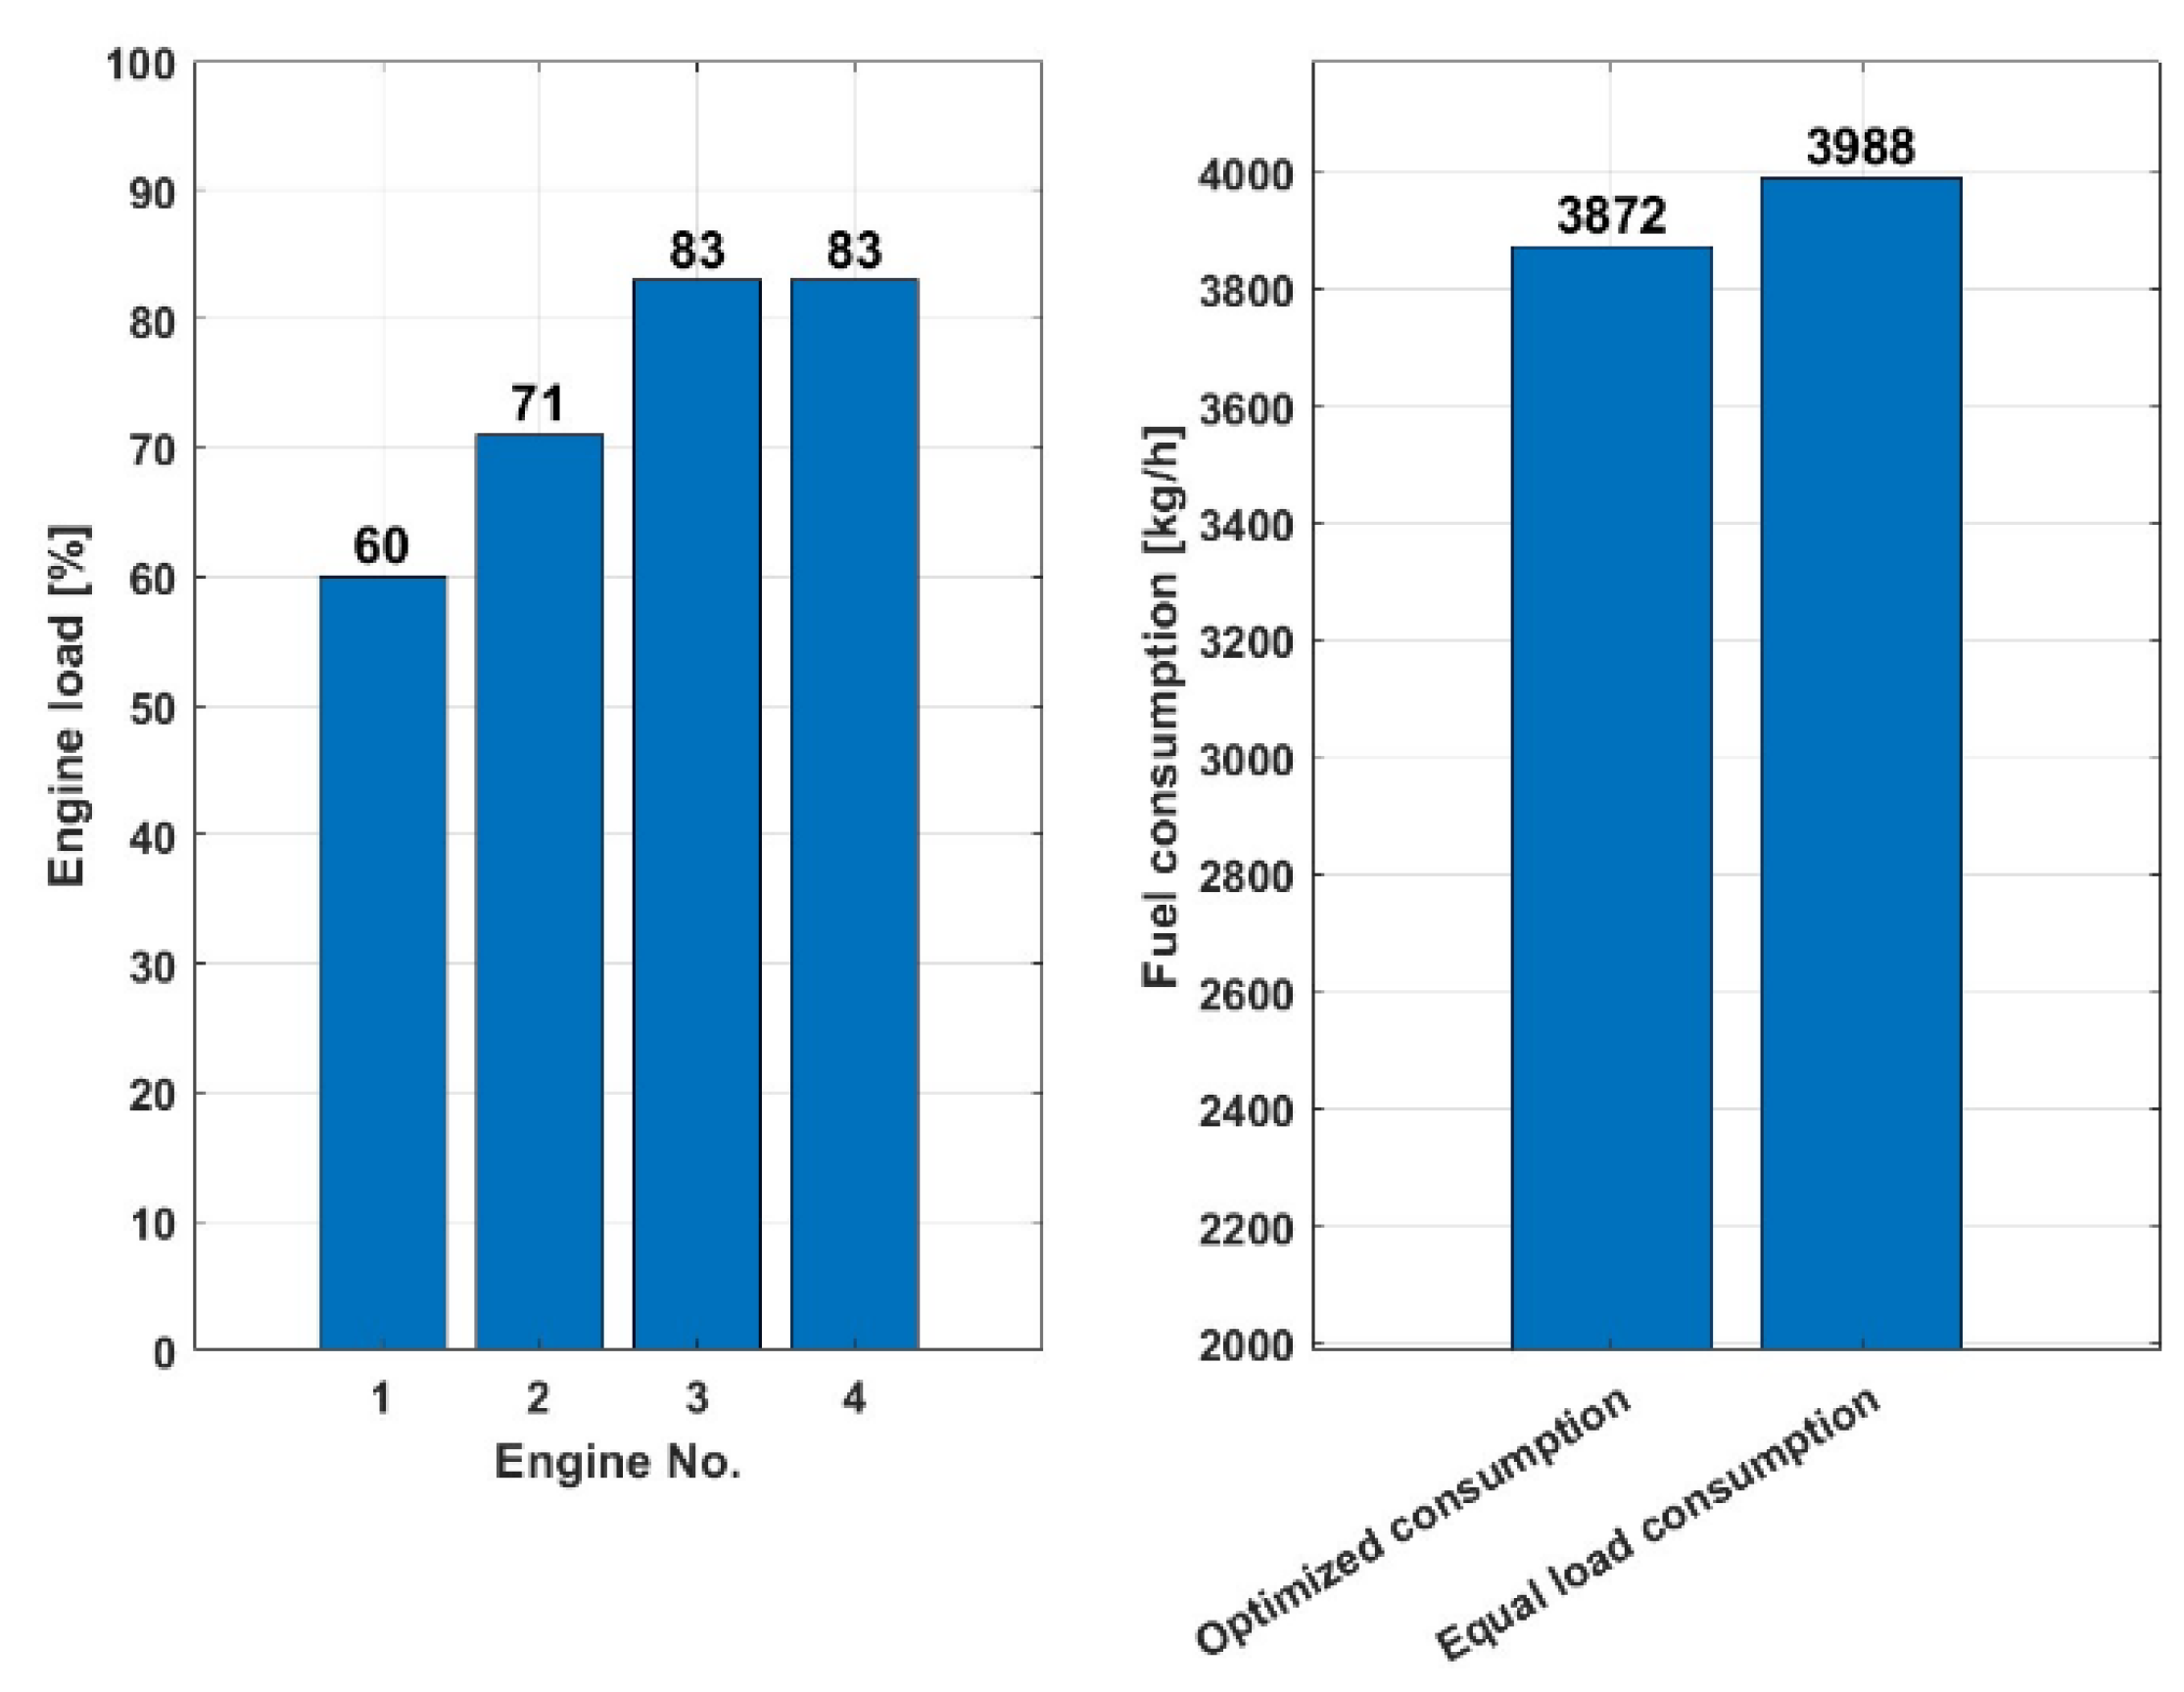
Figure 9 show two bar graphs relating to operation specifically for a fixed total load to make a comparative analysis of fuel consumption for two scenario of load distributions (equal and according to optimization model).
Two load cases were selected for the analysis, which occur most frequently in normal ship's operating modes.
load of 10,000 kW with two engines in use used mostly for port operation (loading unloading cargo) and
load of 23,000 kW with four engines in use used mostly for sea going (laden, ballast).
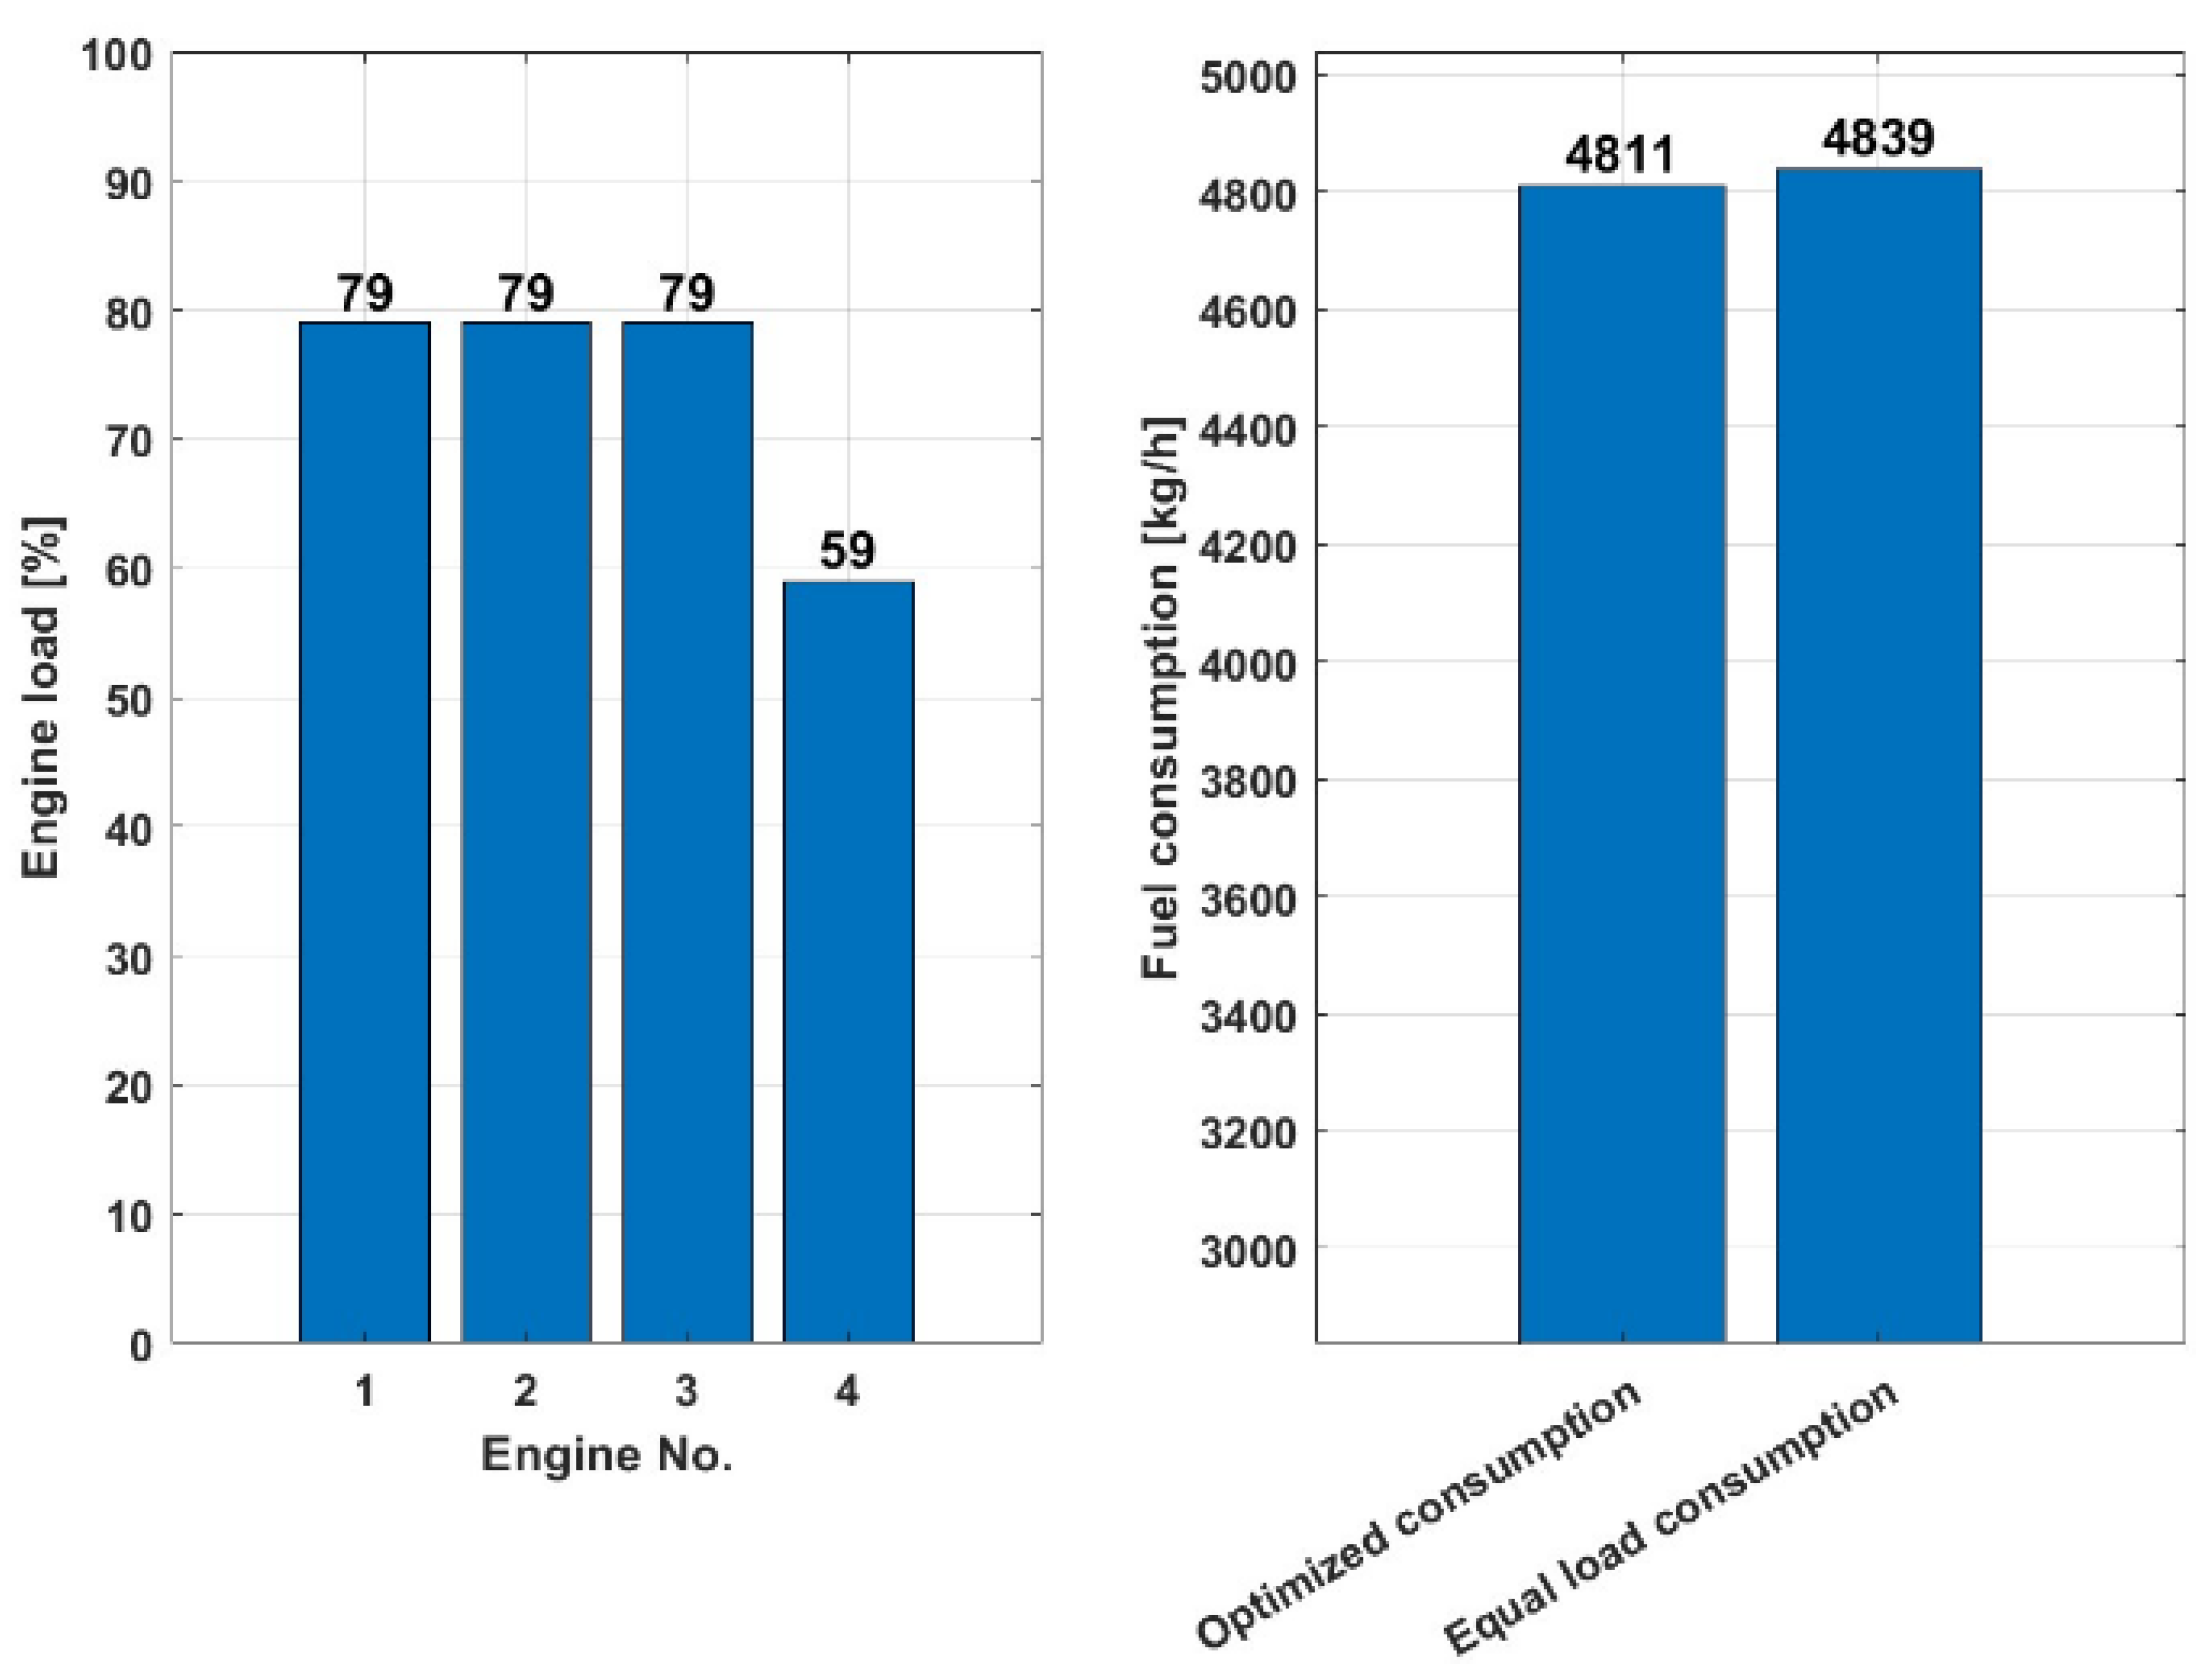
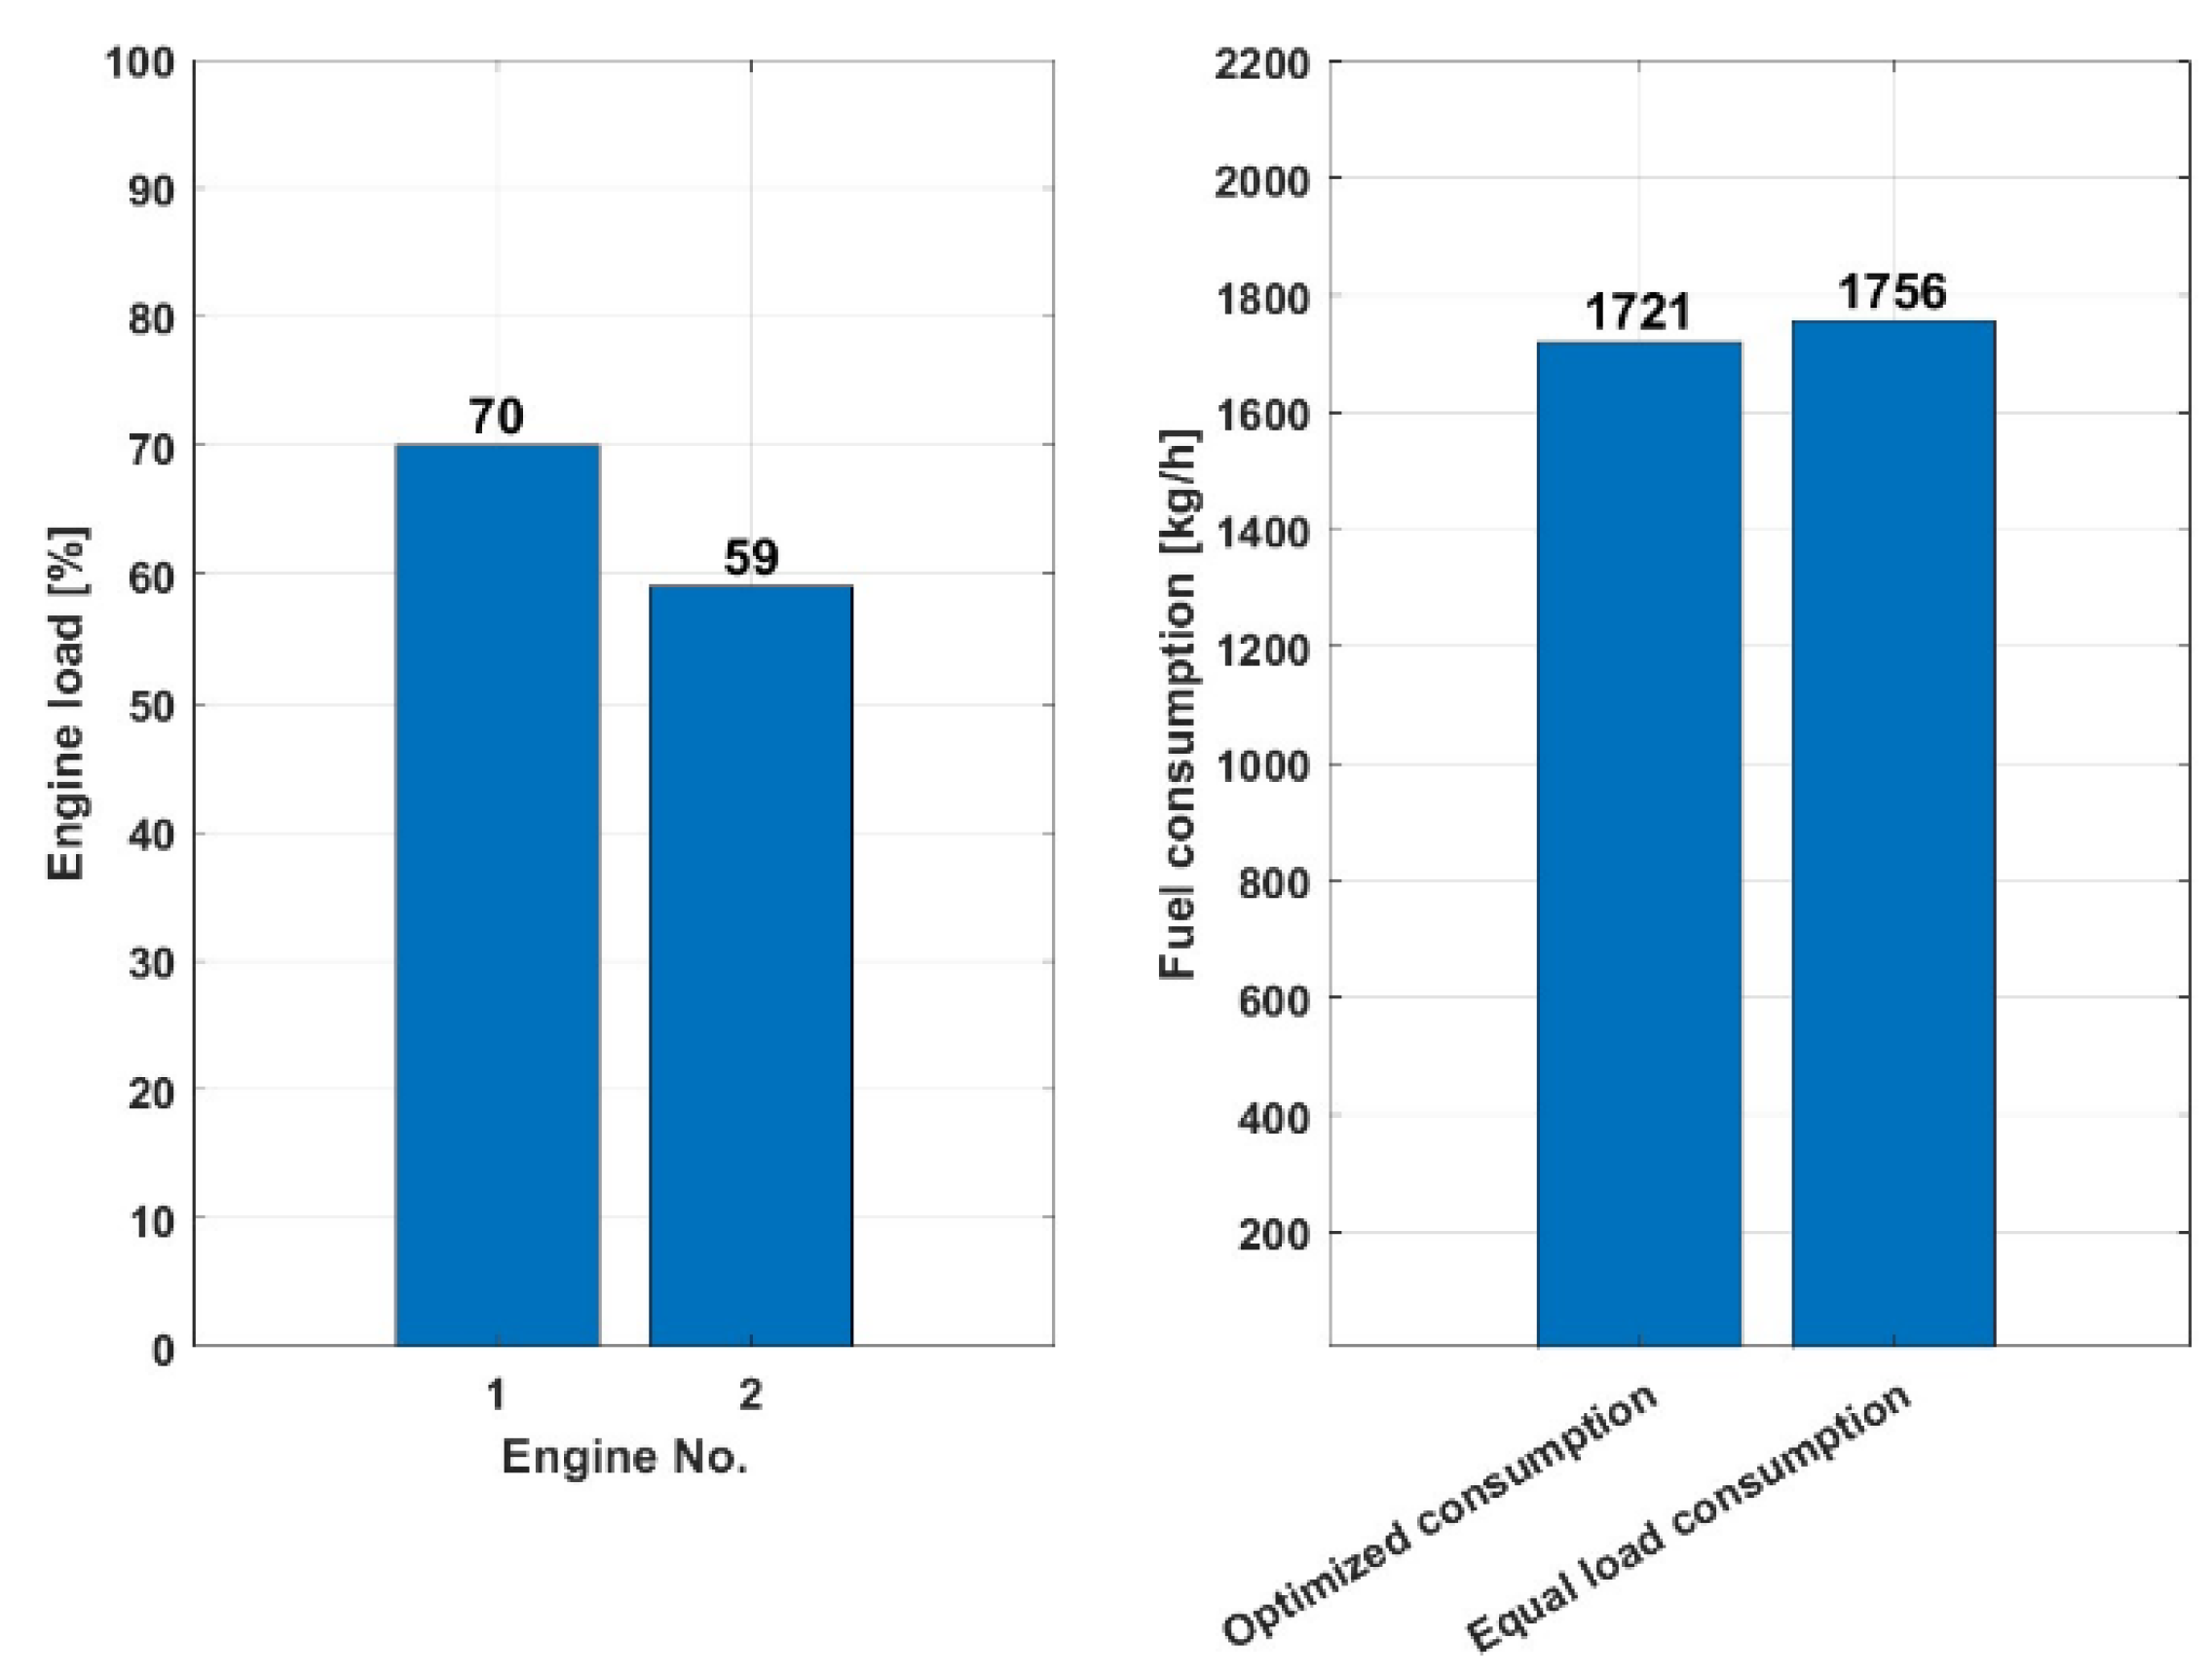
The diagram on the left shows the number of engines used and the percentage utilization of each engine, while the diagram on the right compares fuel consumption (kg/h) between two engine load distribution scenarios: optimized and equal load.
Figure 8 shows for a load of 10,000 kW with two engines used that the optimized consumption scenario consumes 2,119 kg/h of fuel, while the same load sharing consumption scenario consumes 3.37% more, 2,193 kg/h of fuel, indicating that the optimized load sharing is more fuel efficient for the given total load of 10,000 kW, as it consumes less fuel to achieve the same power.
Figure 9 shows that the optimized consumption scenario consumes 4,723 kg/h of fuel for a load of 23,000 kW with four engines, while the same load sharing consumption scenario consumes 4.72% more, 4957 kg/h of fuel, indicating that the optimized load sharing is more fuel efficient for the given total load of 23,000 kW, as it consumes less fuel to achieve the same power.
From the above diagrams, the efficiency of two different load balancing strategies for a given energy demands on a ship's LNG system is compared. From both scenarios (for a higher and a lower power demand of the ship LNG plants), it can be seen that the optimized distribution is more efficient in terms of fuel consumption than an equal distribution of the load among the engines.
4.2. Marine Diesel Oil (MDO) Optimization Example
Figure 10 compares two different strategies for fuel consumption, expressed in kg/h relative to the desired power ranges in kilowatts (kW). One strategy is uniform load consumption, represented by the red bars, which means that the PMS distributes the load evenly among the engines in the network. The other, represented by the blue bars, is an optimized consumption based on the suggestions of an optimization model for load distribution to the engines.
Across all power levels, the optimized consumption is consistently lower than the consumption at the equal load. This indicates that the optimization model, as in the previous case (HFO), also has higher fuel efficiency with MDO fuel, which means that less fuel is consumed for the same power.
The difference in consumption between the two strategies varies across the different power levels. At 25,500 kW, for example, the optimized consumption saves 196 kg/h compared to the consumption at the same load, or in other words, the optimized consumption is 3.57% lower compared to equal load. At higher outputs, such as 28,500 kW, the saving is reduced to 117 kg/h, which means that the optimized consumption is still almost 2% lower compared to equal load. It is noticeable that there is no difference in consumption between the two solutions for only two loads in the given comparison range (27,500kW and 29,000kW). As in the previous comparison case with HFO, the efficiency of the optimization model under different loads and with MDO fuel can also be concluded here.
In addition, the 3D bar chart in
Figure 11 shows the percentage distribution of the load across five engines in a power plant for a power range of 25,000 kW to 29,000 kW to illustrate how the load is distributed across the individual engines at different requested total outputs.
A comparative analysis of the required fixed power of the LNG plant was carried out by setting the load to 10,000 kW and to 23,000 kW.
Figure 12 shows that at a load of 10,000 kW with two engines in operation, the scenario with optimized consumption consumes 2,152 kg/h of fuel, while the scenario with the same load distribution consumes slightly more, namely 2,235 kg/h of fuel. These results show that the consumption with equal load sharing is 3.85% higher than the optimized consumption.
Figure 13 shows that at a load of 23,000 kW with four engines, the optimized consumption scenario consumes 4,811 kg/h of fuel, while the scenario with even load distribution consumes slightly more, namely 4,839 kg/h of fuel. This means that the consumption at equal load sharing is 0.58% higher than the optimized consumption, indicating that the optimized load distribution is more fuel efficient for the given total load of 23,000 kW, as it consumes less fuel to achieve the same power.
As in the previous case with HFO, it can be concluded from the above graphs where MDO fuel was used that the efficiency of two different load balancing strategies for a given load demand indicates that the optimized load balancing for the given total load is more fuel efficient in both analysis cases (10,000 kW and 23,000 kW) as it consumes less fuel to achieve the same performance.
4.3. Liquefied Natural Gas (LNG) Optimization Example
A comparative analysis of consumption for the same power range was carried out for consumption with LNG fuel as in the two previous analyzes to determine the effectiveness of the optimization model for this type of fuel as well.
To facilitate comparison with other fuels, the LNG consumption was recalculated, and the final value was given in g/kWh. The gas density and net calorific value data are taken from the LNG specification as indicated below:
The measurements were carried out with a "Promass 80" mass flow meter, which at the time of measurement had a valid calibration certificate with tolerance within ±0.1%.
As in the two previous comparative cases with HFO and MDO fuel, the efficiency of the optimization model can also be determined in the case of using LNG fuel under different loads and with two scenarios of power distribution between the engines.
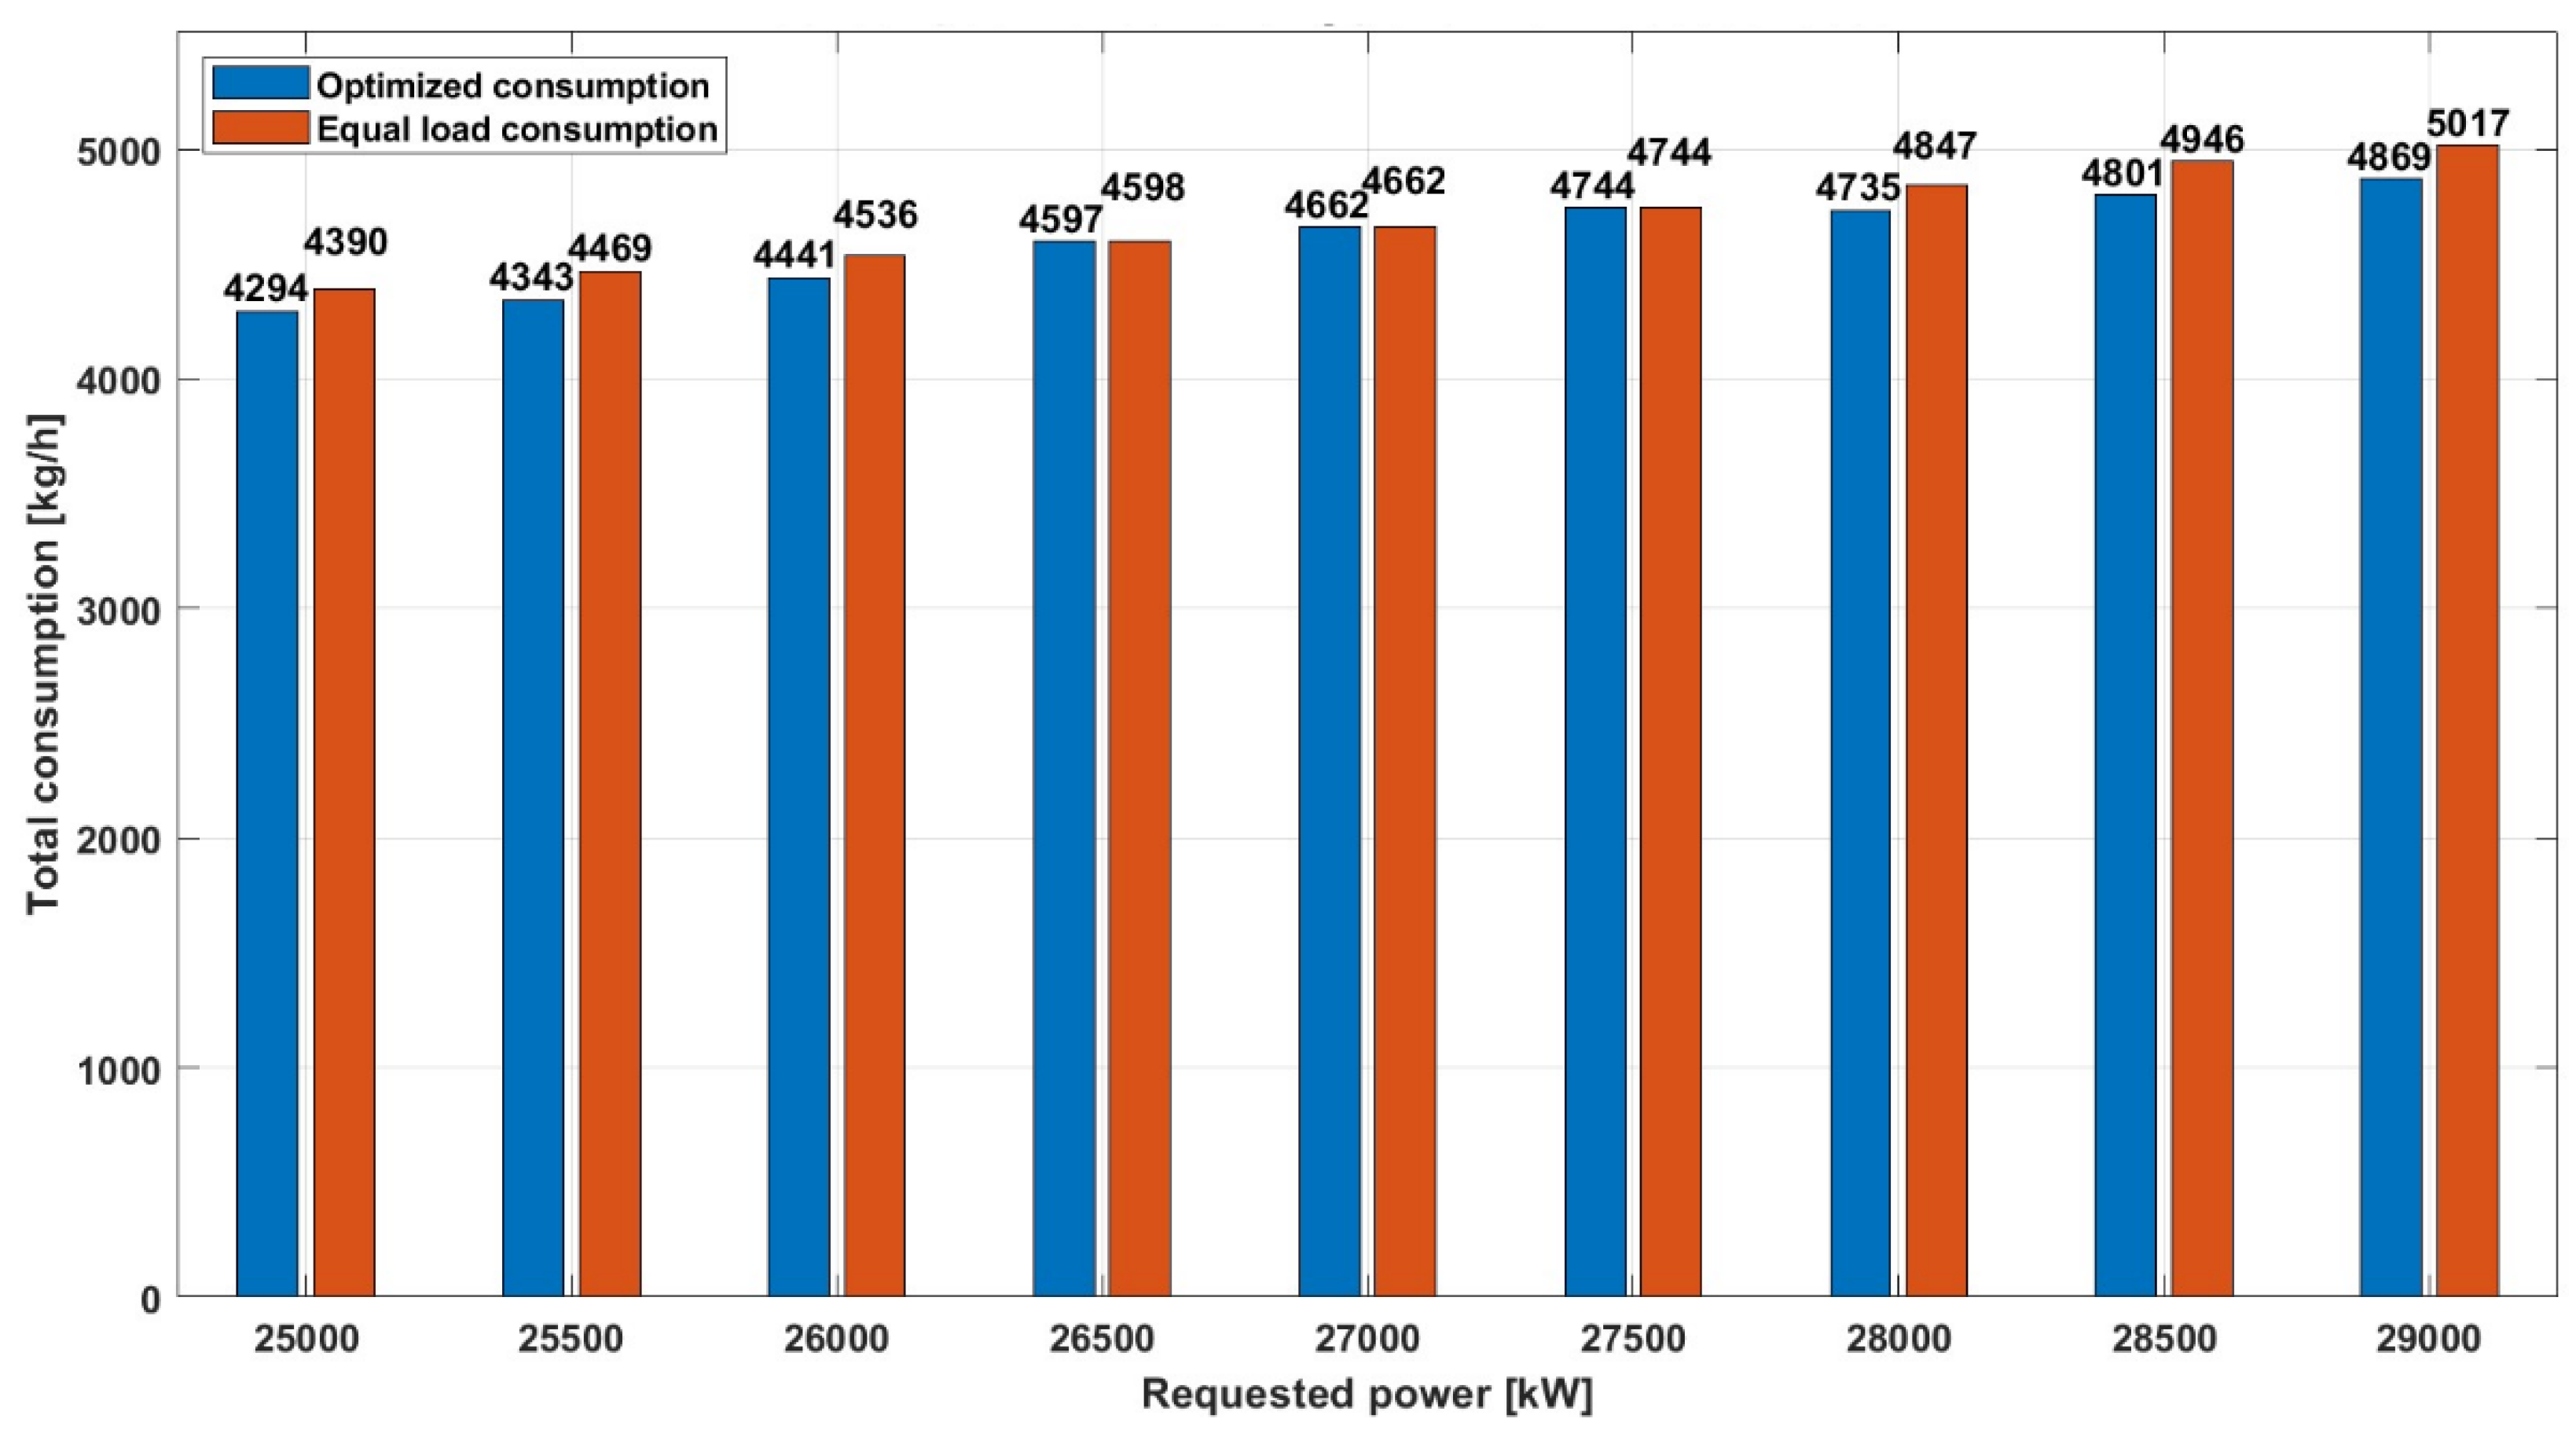
In this case, (
Figure 14) the largest savings are recorded at the lower (25,000 kW – 26,000 kW) and higher load (28,000 kW – 29,000 kW) of the given power range, while at the medium load (27,000 kW) the consumption is similar for both scenarios of the load distribution between the engines.
The biggest difference in this power range occurs at a load of 29,000 kW, where the optimized consumption (5,017 kg/h) consumes 2.94% less fuel compared to the consumption at the equal load (4,869 kg/h).
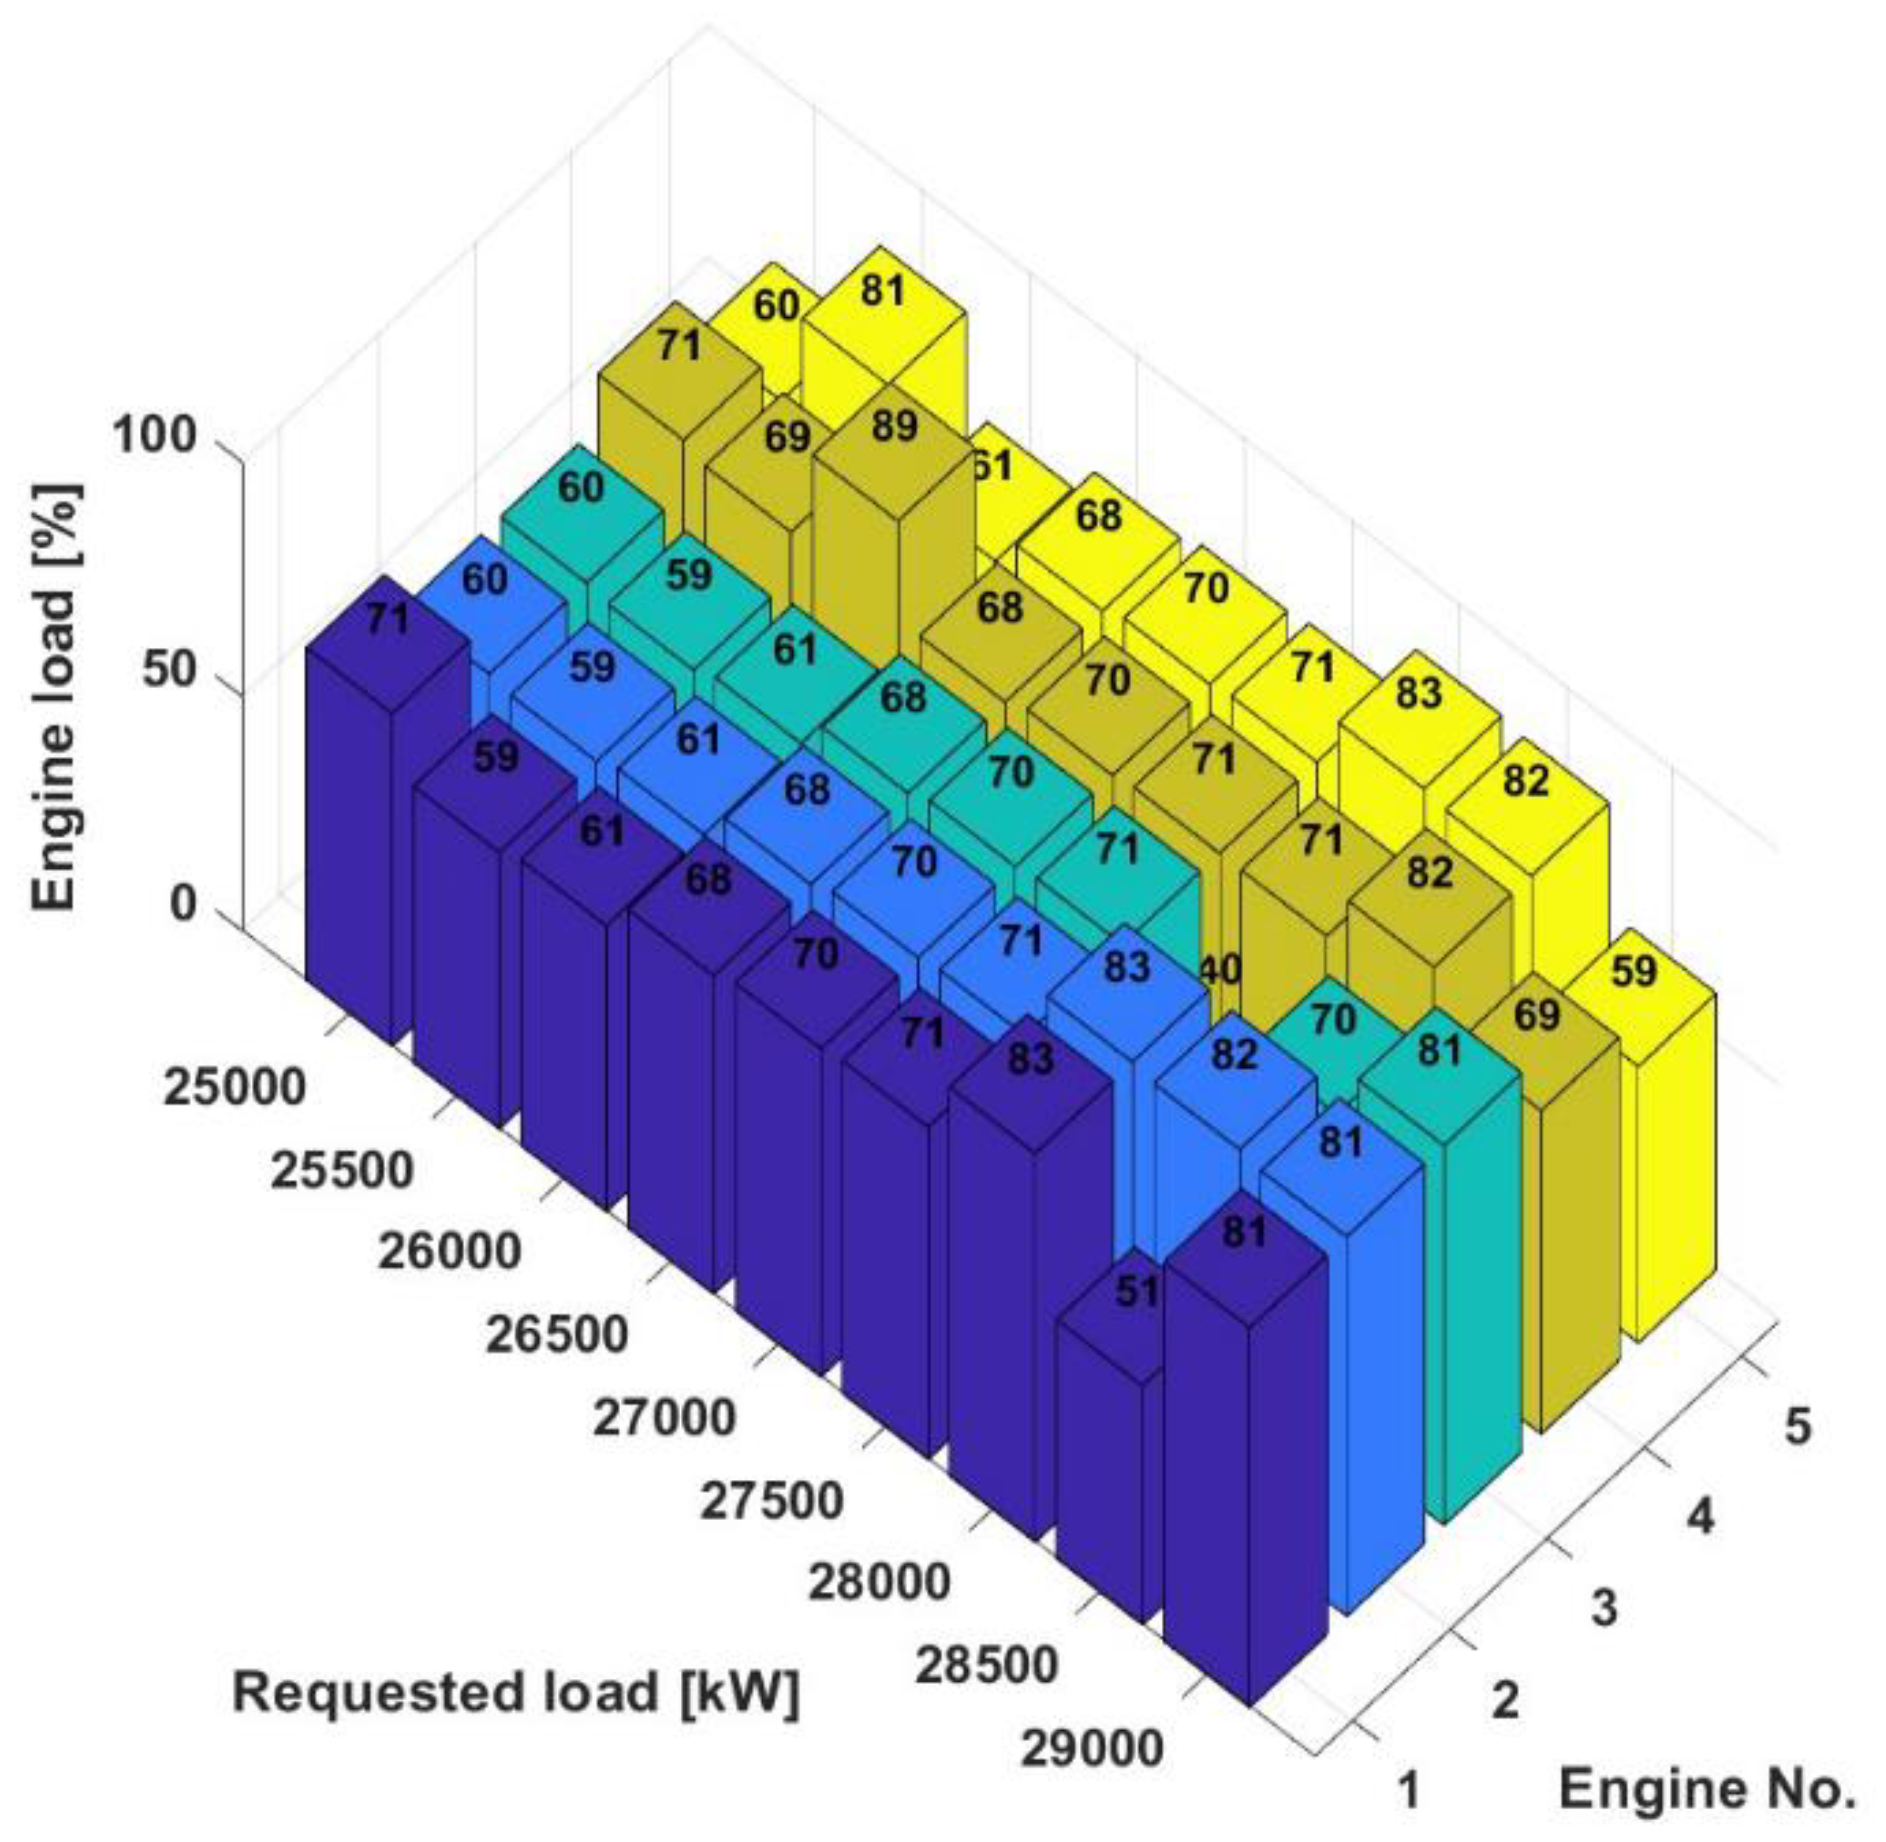
The percentage distribution of the load on the individual engines in the power range from 25,000 kW to 29,000 kW with LNG fuel is shown in the 3D bar chart below (
Figure 15).
In order to perform a comparative evaluation of fuel consumption for the fixed required power of the LNG plant with LNG fuel as in previous examples (HFO and MGO fuel), we will set identical load parameters at 10,000 kW and 23,000 kW for the analysis.
In
Figure 16, with a load of 10,000 kW and the use of two engines, it can be seen that the scenario with optimized consumption consumes 1,721 kg/h of fuel, while the scenario with the equal load sharing consumption consumes slightly more, namely 1,756 kg/h of fuel. This shows that the optimized load distribution is more fuel efficient for the given total load of 10,000 kW, as it consumes almost 2% less fuel to achieve the same power.
Figure 17 shows that with a load of 23,000 kW and four engines in use, the optimized consumption scenario consumes 3,872 kg/h of fuel, while the scenario with the equal load sharing consumption consumes slightly more, namely 3,988 kg/h of fuel. This shows that the optimized load distribution is more fuel efficient for the given total load of 23,000 kW, as it consumes 2.90% less fuel to achieve the same power.
As in the previous case with HFO and MGO, can be conclude from the above graphs where is used LNG fuel that the efficiency of two different load balancing strategies for a given load demand indicates that the optimized load balancing for the given total load is more fuel efficient in both analysis cases (10,000 kW and 23,000 kW) as it consumes less fuel to achieve the same performance.
5. Conclusion
A comprehensive study on optimizing fuel consumption by controlling the load distribution of a single DFDE engine in an LNG ship propulsion system shows significant progress in improving the operational efficiency and environmental performance of marine propulsion systems. The study demonstrates the potential of the optimization model in reducing fuel consumption and thus pollutant emissions in different operating scenarios. By carefully analyzing power requirements and integrating a more dynamic load balancing strategy, the paper not only adheres to but also advocates the broader industry targets set by the EEXI and CII regulations.
The findings of this paper demonstrate the importance of moving away from traditional methods of load balancing, which, while reliable, are not always fuel or environmentally efficient. By tailoring the load to the individual engine, supported by empirical data, it provides a tailored approach that ensures each engine operates close to its optimum efficiency point, reducing unnecessary fuel consumption and therefore harmful emissions.
This work makes a dual contribution: it provides a practical framework for the implementation of advanced energy management systems on LNG ships and sets a benchmark for future research in both optimizing ship energy in the form of fuel consumption and reducing pollutant emissions by improving the model presented in this thesis.
As the maritime industry continues to evolve under increasing environmental scrutiny, the findings of this study will be invaluable in guiding future innovation towards more sustainable and efficient maritime operations.
Author Contributions
Conceptualization, S.M.C. and Z.J.; methodology, S.M.C.; software, S.M.C.; validation, N.A. and Z.J.; formal analysis, S.M.C. and B.L.; investigation, S.M.C. and N.A.; resources, S.M.C.; data curation, S.M.C., Z.J. and N.A.; writing—original draft preparation, S.M.C., Z.J. and N.A.; writing—review and editing, S.M.C., Z.J., B.L. and N.A.; visualization, S.M.C. and N.A.; supervision, Z.J. and B.L.; project administration, S.M.C.; funding acquisition, S.M.C. All authors have read and agreed to the published version of the manuscript.
Funding
This research received no external funding.
Institutional Review Board Statement
Not applicable.
Informed Consent Statement
Not applicable.
Data Availability Statement
Not applicable.
Acknowledgments
This work has been fully supported by the Croatian Science Foundation under the project IP.2020-02-6249. Functional integration of the University of Split, PMFST, PFST, KTFST through the development of the scientific and research infrastructure; (KK.01.1.1.02.0018).
Conflicts of Interest
The authors declare no conflicts of interest.
References
- Martinić-Cezar, S.; Bratić, K.; Jurić, Z.; Račić, N. Exhaust Emissions Reduction and Fuel Consumption from the LNG Energy System Depending on the Ship Operating Modes. Pomorstvo 2022, 36, 338–349. [Google Scholar] [CrossRef]
- Doerry, N. Optimal Generator Set Loading for Energy EE Ciency.
- Shih, Y.C.; Tzeng, Y.A.; Cheng, C.W.; Huang, C.H. Speed and Fuel Ratio Optimization for a Dual-Fuel Ship to Minimize Its Carbon Emissions and Cost. J Mar Sci Eng 2023, 11. [Google Scholar] [CrossRef]
- Pang, B.; Liu, S.; Zhu, H.; Feng, Y.; Dong, Z. Real-Time Optimal Control of an LNG-Fueled Hybrid Electric Ship Considering Battery Degradations. Energy 2024, 296. [Google Scholar] [CrossRef]
- Zhang, B.; Jiang, Y.; Chen, Y. Research on Calibration, Economy and PM Emissions of a Marine LNG–Diesel Dual-Fuel Engine. J Mar Sci Eng 2022, 10. [Google Scholar] [CrossRef]
- Cong, Y.; Gan, H.; Wang, H.; Hu, G.; Liu, Y. Multiobjective Optimization of the Performance and Emissions of a Large Low-Speed Dual-Fuel Marine Engine Based on Mnlr-Mopso. J Mar Sci Eng 2021, 9. [Google Scholar] [CrossRef]
- Bui, K.Q.; Perera, L.P.; Emblemsvåg, J. Life-Cycle Cost Analysis of an Innovative Marine Dual-Fuel Engine under Uncertainties. J Clean Prod 2022, 380. [Google Scholar] [CrossRef]
- IMOResolutions NO x TECHNICAL CODE (2008) Technical Code on Control of Emission of Nitrogen Oxides from Marine Diesel Engines . Available online: https://wwwcdn.imo.org/localresources/en/KnowledgeCentre/IndexofIMOResolutions/MEPCDocuments/MEPC.177(58).pdf (accessed on 22 April 2024).
- Huan, T.; Hongjun, F.; Wei, L.; Guoqiang, Z. Options and Evaluations on Propulsion Systems of LNG Carriers. In Propulsion Systems; IntechOpen, 2019.
- Wärtsilä Wärtsilä 50DF; 2017.
- Mousavi, S.M.; Saray, R.K.; Poorghasemi, K.; Maghbouli, A. A Numerical Investigation on Combustion and Emission Characteristics of a Dual Fuel Engine at Part Load Condition. Fuel 2016, 166, 309–319. [Google Scholar] [CrossRef]
- Cameretti, M.C.; Tuccillo, R.; Simio, L. De; Iannaccone, S.; Ciaravola, U. A Numerical and Experimental Study of Dual Fuel Diesel Engine for Different Injection Timings. Appl Therm Eng 2016, 101, 630–638. [Google Scholar] [CrossRef]
- Wang, B.; Li, T.; Ge, L.; Ogawa, H. Optimization of Combustion Chamber Geometry for Natural Gas Engines with Diesel Micro-Pilot-Induced Ignition. Energy Convers Manag 2016, 122, 552–563. [Google Scholar] [CrossRef]
- Yang, B.; Xi, C.; Wei, X.; Zeng, K.; Lai, M.C. Parametric Investigation of Natural Gas Port Injection and Diesel Pilot Injection on the Combustion and Emissions of a Turbocharged Common Rail Dual-Fuel Engine at Low Load. Appl Energy 2015, 143, 130–137. [Google Scholar] [CrossRef]
- Lounici, M.S.; Loubar, K.; Tarabet, L.; Balistrou, M.; Niculescu, D.C.; Tazerout, M. Towards Improvement of Natural Gas-Diesel Dual Fuel Mode: An Experimental Investigation on Performance and Exhaust Emissions. Energy 2014, 64, 200–211. [Google Scholar] [CrossRef]
- Di Blasio, G.; Belgiorno, G.; Beatrice, C. Effects on Performances, Emissions and Particle Size Distributions of a Dual Fuel (Methane-Diesel) Light-Duty Engine Varying the Compression Ratio. Appl Energy 2017, 204, 726–740. [Google Scholar] [CrossRef]
- Li, W.; Liu, Z.; Wang, Z. Experimental and Theoretical Analysis of the Combustion Process at Low Loads of a Diesel Natural Gas Dual-Fuel Engine. Energy 2016, 94, 728–741. [Google Scholar] [CrossRef]
- Mustafi, N.N.; Raine, R.R.; Verhelst, S. Combustion and Emissions Characteristics of a Dual Fuel Engine Operated on Alternative Gaseous Fuels. Fuel 2013, 109, 669–678. [Google Scholar] [CrossRef]
- Bora, B.J.; Saha, U.K.; Chatterjee, S.; Veer, V. Effect of Compression Ratio on Performance, Combustion and Emission Characteristics of a Dual Fuel Diesel Engine Run on Raw Biogas. Energy Convers Manag 2014, 87, 1000–1009. [Google Scholar] [CrossRef]
- Cuevas Erik and Luque, A. and Luque, A. and E.H. Spline Interpolation. In Computational Methods with MATLAB®; Springer Nature Switzerland: Cham, 2024; pp. 151–177. ISBN 978-3-031-40478-8. [Google Scholar]
Figure 1.
Fuel consumption for three types of fuel.
Figure 1.
Fuel consumption for three types of fuel.
Figure 5.
Optimization model flow chart.
Figure 5.
Optimization model flow chart.
Figure 6.
Comparative analysis of HFO consumption for the power range 25,000-29,000kW.
Figure 6.
Comparative analysis of HFO consumption for the power range 25,000-29,000kW.
Figure 7.
Load distribution (%) by engines for the power range 25,000 – 29,000kW.
Figure 7.
Load distribution (%) by engines for the power range 25,000 – 29,000kW.
Figure 8.
Load distribution between the engines and fuel consumption at 10,000 kW load demand.
Figure 8.
Load distribution between the engines and fuel consumption at 10,000 kW load demand.
Figure 9.
Load distribution between the engines and fuel consumption at 23,000 kW load demand.
Figure 9.
Load distribution between the engines and fuel consumption at 23,000 kW load demand.
Figure 10.
Comparative analysis of MDO consumption for the power range 25,000-29,000kW.
Figure 10.
Comparative analysis of MDO consumption for the power range 25,000-29,000kW.
Figure 11.
Load distribution (%) by engines for the power range 25,000 - 29,000kW.
Figure 11.
Load distribution (%) by engines for the power range 25,000 - 29,000kW.
Figure 12.
Load distribution between the engines and fuel consumption at 10,000 kW load demand.
Figure 12.
Load distribution between the engines and fuel consumption at 10,000 kW load demand.
Figure 13.
Load distribution between the engines and fuel consumption at 23,000 kW load demand.
Figure 13.
Load distribution between the engines and fuel consumption at 23,000 kW load demand.
Figure 14.
Comparative analysis of LNG consumption for the power range 25,000-29,000 kW.
Figure 14.
Comparative analysis of LNG consumption for the power range 25,000-29,000 kW.
Figure 15.
Load distribution (%) by engines for the power range 25,000-29,000kW.
Figure 15.
Load distribution (%) by engines for the power range 25,000-29,000kW.
Figure 16.
Load distribution between the engines and fuel consumption at 10,000 kW load demand.
Figure 16.
Load distribution between the engines and fuel consumption at 10,000 kW load demand.
Figure 17.
Load distribution between the engines and fuel consumption at 23,000 kW load demand.
Figure 17.
Load distribution between the engines and fuel consumption at 23,000 kW load demand.
Table 1.
Specification of DF-8L 51/60 DF @ 100% load.
Table 1.
Specification of DF-8L 51/60 DF @ 100% load.
| Engine parameters |
Specifications |
| Cylinder No (-) |
8 |
| Cylinder diameter (mm) |
510 |
Stroke (mm)
Compression ratio (-)
Speed (rpm/min)
MCR - Power (kW)
Fire order (-)
Mean effective pressure (bar)
Ignition pressure (bar) |
600
13.3
514
8,000
1-4-7-6-8-5-2-3
19
190 |
Table 2.
Results of engine load configurations on MDO.
Table 2.
Results of engine load configurations on MDO.
| LOAD |
Configuration |
SFOC |
Consumption |
(g/kWh)
MDO
|
(MT/day)
MDO
|
Daily savings
(%) (MT) |
| 9,000 kW |
2 engine equally sharing load (2 x 4,500 kW) |
2 x 220.1 |
49.24 |
< 6.28 |
2.91 |
| 2 engine adjusted load (1 x 6,600 kW / 1 x 2,400 kW) |
1 x 204.9 / 1 x 250.4 |
46.33 |
> 5.90 |
| 15,000 kW |
3 engine equally sharing load (3 x 5,000kW) |
3 x 223.5 |
80.97 |
< 4.34 |
3.37 |
| 3 engine adjusted load (2 x 6,600 kW / 1 x 1,800 kW) |
2 x 204.9 / 1 x 257.3 |
77.6 |
> 4.16 |
| 21,600 kW |
4 engine equally sharing load (4 x 5,400 kW) |
4 x 215.4 |
112.77 |
< 2.43 |
2.68 |
| 4 engine adjusted load (3 x 6,600kW / 1 x 1,900 kW) |
3 x 204.9 / 1 x 257.3 |
110.09 |
> 2.37 |
|
Disclaimer/Publisher’s Note: The statements, opinions and data contained in all publications are solely those of the individual author(s) and contributor(s) and not of MDPI and/or the editor(s). MDPI and/or the editor(s) disclaim responsibility for any injury to people or property resulting from any ideas, methods, instructions or products referred to in the content. |
© 2024 by the authors. Licensee MDPI, Basel, Switzerland. This article is an open access article distributed under the terms and conditions of the Creative Commons Attribution (CC BY) license (https://creativecommons.org/licenses/by/4.0/).
