Preprint
Article

Life Cycle Assessment and Sustainability of Energy Storage Options for Solar PV Technologies

Altmetrics

Downloads

96

Views

37

Comments

0

Submitted:

05 May 2024

Posted:

06 May 2024

You are already at the latest version

Alerts
Abstract
The assessment of Photovoltaic (PV) systems, a key component of sustainable energy solutions, is of paramount importance in the pursuit of a greener future. This abstract provides an overview of environmental assessments associated with PV systems, considering their life cycle, energy production, and ecological impact. The study explores various methodologies and tools employed in the evaluation of PV systems’ environmental performance, addressing issues such as material sourcing, manufacturing, installation, and end-of-life disposal. Additionally, it delves into the trade-offs and challenges in achieving sustainability objectives in the solar energy sector. By critically examining the environmental implications of PV systems, this research contributes to informed decision-making and the sustainable integration of solar power into our energy landscape.
Keywords: 
Subject: Engineering  -   Energy and Fuel Technology

1. Introduction

Photovoltaics (PV) offer the major environmental benefits that go along with it: it reduces carbon emissions overall, operates quietly and cleanly, produces no waste or spent fuel, and is well appreciated for its fashionable appearance. However, there are also other environmental problems, like as the availability of raw materials and the substantial acreage requirement for chargers that rely on sunshine.
Let's start by talking about raw materials. It is evident that everything will be OK as long as photovoltaics (PV) continue to rely on silicon solar cells in the future. Silica, which is as abundant as beach sand almost everywhere, is possibly the most common element found outside of Earth. Thankfully, it is also essentially harmless and won't eventually run out. While silicon itself seems amazing, this is not to argue that the other materials used to create silicon photovoltaic modules are limitless or without problems. Since the critically important new forms of sunlight-based cells—primarily Copper Indium Gallium Selenide (CIGS) and cadmium telluride (CdTe)—have lately been discussed in previous sections of the postulation [1], the issue isn't as evident as silicon. Nevertheless, a 2004 analysis by the highly regarded National Renewable Energy Laboratory (NREL) of the US Department of Energy (DOE) was largely comforting. The paper evaluated the required "strength" materials for solar cell manufacturing, additional materials for PV module integration, and "ware" materials for balance-of-framework (BOS) components such as backing structures and roof mountings. An increase in annual PV sales in the USA to 20 GWp by 2050 was the scenario considered [2]. From then on, it looked at the amount of various materials with the degrees of production that are currently occurring globally to establish the rate of development necessary year until 2050. The conclusion reached was that, while the aforementioned scenario wouldn't necessarily result in problems with asset accessibility, things would change if development proceeded more quickly or, conversely, if global creation were to reach 100 GWp/year.
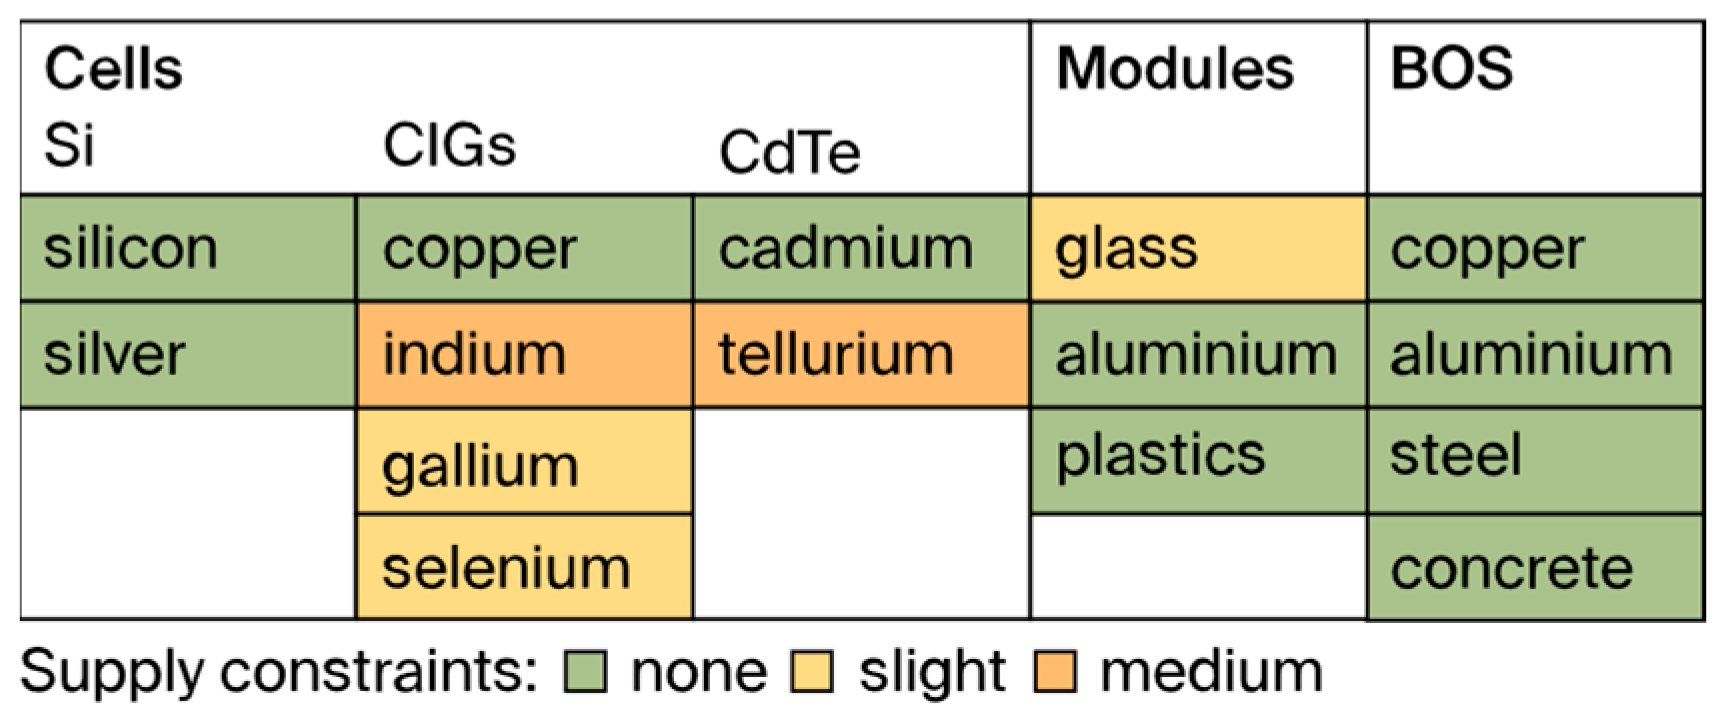
Even if the situation has somewhat altered since 2004 and is certain to evolve more in the years to come, some of the report's most important conclusions are still relevant today [3]. Figure 1 summarizes and color-codes the degree of "supply limitation" in the few materials anticipated to satisfy the anticipated 20 GWp/year requirement.
As one might anticipate, silicon sunlight-based cells are accepted as appropriate, with no concerns expressed either silicon or the silver used to screen-print cell associations. Deficits in tellurium may limit CdTe cells, although shortages in gallium and selenium may limit CIGS cells more than limitations in indium [4]. Happening to PV modules and BOS parts, the main minor concern is the enormous measures of glass required; this isn’t on the grounds that unrefined components would run out, but instead on the grounds that creation limit would have to increment fundamentally on an overall scale to stay aware of PV’s requests. In summary, tellurium and indium, and less so gallium and selenium, are the "claim to fame" elements that really need to be prioritized.

1.1. PV Life Cycle: Environmental Risk

As a solar framework ages, more serious environmental problems arise. These problems begin with the extraction and filtering of raw materials, continue through assembly, setup, and many extended periods of work, and end with the removal or reuse of byproducts [5]. The entire exchange is referred to as a "daily existence cycle," and it is important to understand the implications for the environment. We are currently moving in the direction of something remarkably more expansive, which has significant ramifications for both global energy policy and society as a whole.

1.2. Environmental and Societal Cost

The conventional understanding of "cost" blatantly ignores the effects on society and the environment that all energy production techniques—whether they rely on coal, oil, gas, nuclear, or renewable sources—have [6]. A limited financial perspective on contemporary cycles evaluates everything in terms of money, with the exception of many viewpoints that sound judgment dictates should be considered in any objective assessment of worth. For instance, the "cost" of producing power in thermal energy stations has typically been calculated without accounting for accident or health risks; in contrast, the "cost" of supplying power in coal-fired plants has not been evaluated in light of their unwelcome commitment to an unnatural weather change; and due to wind power, the value of the surrounding environment has not been considered.
There are two main factors that contribute to this obvious stupidity. To begin with, it is challenging to measure and evaluate elements such as safety, security, environmental preservation [7], and scene grandeur using a conventional accounting framework. Although appropriate instruments and ways for consolidating them are still in the early stages of development and recognition, it is widely acknowledged that they are valuable and frequently have a higher value than cash. This is unquestionably essential to undertake since many of the problems we are presently facing stem from the tendency of traditional bookkeeping "to know the cost of everything and the benefit of nothing."
The second defense deals with the pressing consideration of the external expenses associated with energy production. Since the majority of these expenses include an environmental or social component, they are typically viewed as being outside the purview of the energy economy and coming within the purview of society at large [8]. This ought to be achievable financially through fees or ecologically with a reduction in lifestyle. They take precedence over an organization's internal operating expenses, which include salaries for staff, fuel, buildings and equipment, and other expenses that are directly related to the business and have an impact on its main objective. If Earth is viewed as an endless "source" of raw materials and a never-ending "sink" for pollution and waste products, it is quite simple to ignore the expenses associated with space travel [9]. For instance, it is improbable that the pioneers of steam transportation in the 1800s or the designers of the first supersonic commercial aircraft in the 1900s were very concerned about environmental concerns and supersonic explosions. One of the most significant current trends is the growing belief that external costs ought to be factored into circumstances, whether local or national and increasingly global ones. In other words, external expenses should be taken into account and covered by the company or companies that are accountable. The saying "the polluter should pay" is still relevant today.
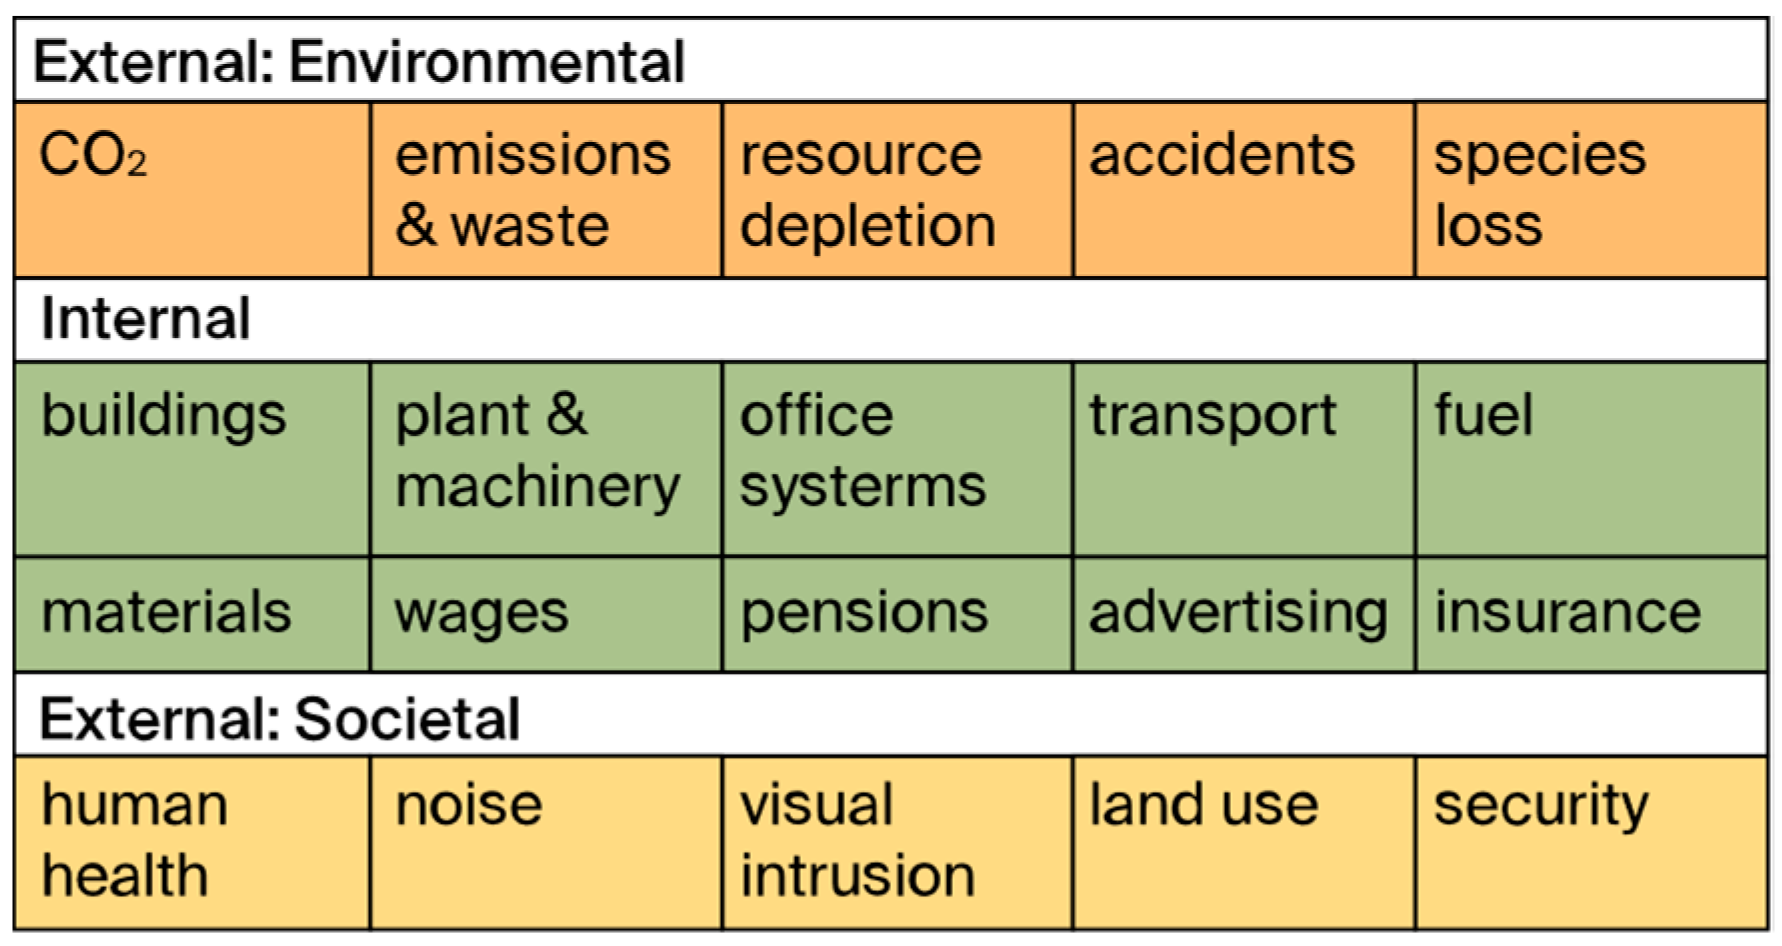
A comprehensive list of the internal and external consumptions associated with contemporary assembly is shown in Figure 2. Despite the fact that there is a great deal of overlap between the two, the external ones—which stand for overall costs or burdens on society—are divided into the environmental and humanistic categories. Internal expenses [10] are directly funded by the group or organization itself and cover a wide variety of goods and services, from labor compensation to designs. The distinction between internal and external costs is not always clear since many items that a company purchases, such gasoline and materials, also have significant "outer" expenses for the time it takes to assemble and deliver them. An accurate assessment of the environmental costs associated with the growth of electricity should consider all major actions and services "from support to grave," regardless of whether they are provided on- or off-site. It goes without saying that this is a difficult task.
One of the intriguing challenges facing the renewable power age is the manner that many of its benefits, such as photovoltaics, stem from avoiding external consumptions and are hence obscured by conventional bookkeeping techniques. Renewable energy sources often result in extremely low carbon dioxide discharges, little pollution, minor noise, and very little risk to life or property, in addition to areas of strength for having support [11]. PV is entitled to these advantages. Nevertheless, when lawmakers and financial experts discuss photovoltaics, the avoidance or reduction of external costs is rarely brought up. Thankfully, environmental life cycle analysis is becoming more and more important to energy experts and government advisors, who are using it to more realistically weigh the benefits and drawbacks of competing technologies. Without a doubt, the PV people group ought to be proactive in refuting out-of-date assumptions on the wider advantages of its innovation.
Putting forward two main points is important. Regardless, there are significant differences between monetary compensation and energy restitution. The former is mostly a financial issue, whereas energy restitution is far more concerned with the environment. The last option is concerned with providing a long-term payback schedule for the capital and support costs (including energy consumption) incurred by a framework. Second, the environmental benefits of a quick restoration phase rely on the continuing energy mix of the nation or nations in question. If the majority of the required energy is provided by coal-consuming power plants, it is more harmful than, say, hydroelectricity [12]. Given this, it is plausible to argue that certain large-scale life-cycle studies conducted in the early years of the new century painted a bleak picture of PV's effects on the environment and human welfare. This was primarily because the phones and modules were expected to be produced using energy derived from petroleum derivatives. A subsequent analysis, on the other hand, represents external costs and advances in PV design accurately, leading to fundamentally more optimistic conclusions.
The market for power-producing solar photovoltaic (PV) systems has recently expanded significantly. According to the most recent data available, 102.4 GW of network-associated photovoltaic boards were established globally in 2018. This amount is the same as the total PV limit that was available in 2012 (100.9 GW). As a result, the total solar power limit that was imposed was 400 GW in 2017 and increased to above 500 GW in 2018 [13]. The major participants are the US, China, India, and Japan. Not quite the previous year, China introduced 44 GW (16% under 2017), India introduced 8.3 GW (16% under 2017), and Japan brought 6.6 GW (8% under 2017). These were the other major backers. The primary country with a consistent introduction of new solar power was the US (10.6% in 2017 and 2018). Australia gained 295% in market share from the previous year to add 5.3 GW in 2018, making it the world's fifth-largest market.
The European Union (EU) took the lead in accomplishing the binding targets of reducing greenhouse gas emissions and other environmental effects associated with the use of non-renewable energy sources, as well as switching from petroleum derivatives to renewable energy sources. The EU intends to expand the use of solar technology in the near future in accordance with the new 32% renewables goal in 2030 (the maximum power introduced in Europe in 2018 was 11.3% GW, which was 21% more than the cap imposed in 2017) [14]. In light of the previous year, the EU displayed a crucial pattern: Compared to 2017, there were larger installations in 22 out of 28 EU markets, and the total solar limit linked to the framework increased to 8.2 GW (37% more than in 2017). A great deal of effort has been completed to enhance PV implementation in the environmental domain as well. As a result, PV innovation is more ecologically friendly than petroleum goods in many impact classes; nonetheless, environmental effects are still a part of its life cycle.
As a result, it's critical to weigh the benefits of using PVs in terms of energy and the environment while taking the life cycles of the frameworks into account. A useful standard method for achieving this goal is the life cycle assessment (LCA) [15], which takes into account the effects on the environment, the main sources of energy consumption (both renewable and non-renewable), the depletion of resources, and outflows over the course of an innovation's entire life cycle.
The Existence Cycle Assessment (LCA) is a “objective method for surveying the energy and environmental burdens connected with an interaction or movement [16]” that determines the energy and materials expected as well as the trash delivered into the environment.

1.3. PV Technology Description

One of the intriguing challenges facing the renewable power age is the manner that many of its benefits, such as photovoltaics, stem from avoiding external consumptions and are hence obscured by conventional bookkeeping techniques. Renewable energy sources often result in extremely low carbon dioxide discharges, little pollution, minor noise, and very little risk to life or property, in addition to areas of strength for having support [11]. PV is entitled to these advantages. Nevertheless, when lawmakers and financial experts discuss photovoltaics, the avoidance or reduction of external costs is rarely brought up. Thankfully, environmental life cycle analysis is becoming more and more important to energy experts and government advisors, who are using it to more realistically weigh the benefits and drawbacks of competing technologies. Without a doubt, the PV people group ought to be proactive in refuting out-of-date assumptions on the wider advantages of its innovation.
Putting forward two main points is important. Regardless, there are significant differences between monetary compensation and energy restitution. The former is mostly a financial issue, whereas energy restitution is far more concerned with the environment. The last option is concerned with providing a long-term payback schedule for the capital and support costs (including energy consumption) incurred by a framework. Second, the environmental benefits of a quick restoration phase rely on the continuing energy mix of the nation or nations in question. If the majority of the required energy is provided by coal-consuming power plants, it is more harmful than, say, hydroelectricity [12]. Given this, it is plausible to argue that certain large-scale life-cycle studies conducted in the early years of the new century painted a bleak picture of PV's effects on the environment and human welfare. This was primarily because the phones and modules were expected to be produced using energy derived from petroleum derivatives. A subsequent analysis, on the other hand, represents external costs and advances in PV design accurately, leading to fundamentally more optimistic conclusions.
The market for power-producing solar photovoltaic (PV) systems has recently expanded significantly. According to the most recent data available, 102.4 GW of network-associated photovoltaic boards were established globally in 2018. This amount is the same as the total PV limit that was available in 2012 (100.9 GW). As a result, the total solar power limit that was imposed was 400 GW in 2017 and increased to above 500 GW in 2018 [13]. The major participants are the US, China, India, and Japan. Not quite the previous year, China introduced 44 GW (16% under 2017), India introduced 8.3 GW (16% under 2017), and Japan brought 6.6 GW (8% under 2017). These were the other major backers. The primary country with a consistent introduction of new solar power was the US (10.6% in 2017 and 2018). Australia gained 295% in market share from the previous year to add 5.3 GW in 2018, making it the world's fifth-largest market.
The European Union (EU) took the lead in accomplishing the binding targets of reducing greenhouse gas emissions and other environmental effects associated with the use of non-renewable energy sources, as well as switching from petroleum derivatives to renewable energy sources. The EU intends to expand the use of solar technology in the near future in accordance with the new 32% renewables goal in 2030 (the maximum power introduced in Europe in 2018 was 11.3% GW, which was 21% more than the cap imposed in 2017) [14]. In light of the previous year, the EU displayed a crucial pattern: Compared to 2017, there were larger installations in 22 out of 28 EU markets, and the total solar limit linked to the framework increased to 8.2 GW (37% more than in 2017). A great deal of effort has been completed to enhance PV implementation in the environmental domain as well. As a result, PV innovation is more ecologically friendly than petroleum goods in many impact classes; nonetheless, environmental effects are still a part of its life cycle.
As a result, it's critical to weigh the benefits of using PVs in terms of energy and the environment while taking the life cycles of the frameworks into account. A useful standard method for achieving this goal is the Life cycle assessment (LCA) [15], which takes into account the effects on the environment, the main sources of energy consumption (both renewable and non-renewable), the depletion of resources, and outflows over the course of an innovation's entire life cycle.
A Life Cycle Assessment (LCA) is a “objective method for surveying the energy and environmental burdens connected with an interaction or movement [16]” that determines the energy and materials expected as well as the trash delivered into the environment.

1.4. Types of PV Cells

The ongoing advancement of photovoltaic innovation aims to improve cell performance, reduce module market costs, and streamline production processes in terms of cost and speed. Solar cells may be created by layering materials that hold light in at least one layer. The main scenario refers to single intersection cells, which are relatively easy to construct but less effective; surprisingly, different setups, or multi-intersections, are more complex and perform better because they have multiple cycles for charge partition and retention [20]. The components and innovations used in PV frameworks' solar cells set them apart. PV cell developments are frequently arranged according to three ages:
  • Undefined silicon (a-Si), cadmium telluride (CdTe) and cadmium sulfide (Cds), copper indium gallium selenide (CIGS)/copper indium selenide (CIS), gallium ar-senide (GaAs), and couple/multi-intersections modules in view of Si are among the materials utilized in the second era of thin-film solar cells;
  • The third era (sometimes referred to as the future) alludes to novel non-silicon based advancements and new idea gadgets, such as color-sharpened solar cells (DSSC), quantum spot (QD) cells, perovskite solar cells (PSC), natural/semi-natural PV boards (OPV), and PSCs.
The development of PV innovation throughout several generations was driven by the desire to increase the expense/benefit ratio. Even with the advancements, original photovoltaics still have high creation costs (between 200 and 500 US dollars per square meter) and limited potential for further reduction (to 150 US dollars per square meter), as a significant portion of the cost is attributed to the quantity of materials needed and the specific techniques in question. Also, the majority of these assembly procedures consume a significant amount of energy [21], which has a big impact on the life cycle outflow factors of the devices. Fascinatingly, devices from the second generation achieve modest production while generating minimal area costs (between 30 and 110 US dollars per square meter). This is achieved by using low-cost fabrication techniques (such as fume testimony, modifying, and so on) and reducing the amount of material needed. As second-generation devices need less energy to assemble than original devices, lower discharge variables should follow if second-generation devices are able to provide higher performance execution than justify their massive scope creation [22]. Finally, the third era presents the opportunity to maintain the benefits of thin film production techniques with respect to energy and the environment, while increasing efficiency well beyond that of the first and second ages (by means of optional energy transformation instruments) and lowering creation costs (which are typically between 40 and 150 US dollars/m2 for the most productive devices).
The use of renewable energy sources in place of petroleum products only helps to advance real, global advancement in the economic and social spheres. This makes it feasible to reject the conventional wisdom that links a nation's financial progress and energy use to an increase in the emissions of substances that deplete the ozone layer [23]. Due to the continuous concern about environmental change and the desire to lessen the negative effects that the usage of conventional petroleum derivatives has on the environment and human well-being, renewable assets are becoming more and more important in global economies.
Although renewable energy innovations have eventually been included into a variety of force supply frameworks, their exceptional features should be taken into account to provide consistent coordination and accelerate the infiltration of these technologies [24]. This is especially clear when it comes to the erratic and variable nature of renewable energy sources, which provide a challenge to the electrical energy framework's changing requirements due to variations in the amount of electricity generated during the day, week, and season. According to power lattice administrators, the term "dispatch capacity" refers to the ability of power to be dispatched upon request in response to market demands. Dispatched age frameworks provide for the tracking of several key performance indicators, such as response time, creation accessibility, age term, realistic age-level upper and lower bounds, and slope rate from one age level to the next. Other considerations to take into account include the area of the renewable energy assets and the limit factor. When renewable energy sources are integrated into power supply companies, they may be used even more efficiently.
As nations strive for cleaner energy advancement focuses on reducing their reliance on petroleum derivatives, energy capacity becomes a fundamental role in dealing with the receipt of renewable energy sources. In this particular scenario, there is a great deal of interest in the impact that capacity advancements have on venture costs and the environment [25].
One of the commercial renewable energy innovations is Solar Thermal Energy (STE), which is produced in the concentrating solar power (CSP) facilities. STE generates power with the use of mirrors that enable the convergence of solar rays at temperatures between 400 and 1000 °C. The interaction's ultimate goal is to power an intensity motor—typically a steam turbine—which generates energy for the electrical framework. Though it is seldom used in crossover activities or coordinated with nuclear power stockpile, STE provides solid limit and dispatchable power upon request [26]. STE is a renewable invention that can guarantee a steady supply of energy and follow market trends. As a result, it can replace power plants that use petroleum products and help achieve a 100% renewable energy supply.
There is still uncertainty regarding these power offices' potential effects on the environment, even though they have been thoroughly examined from a variety of angles. There aren't many exams in the writing, and none of them provide a thorough overview of a CSP office. Piemonte et al., for instance, introduced a novel solar innovation that combines a concentrating solar power (CSP) with an assister biomass burner in order to compare the results and life cycle assessments (LCAs) of other energy advancements, such as gas and heavy oil power plants (information taken from writing). Oró et al. considered the environmental effects of three elective Thermal Energy Storage (TES) frameworks for solar power plants. These frameworks featured reasonable intensity stockpiling using both fluid and strong warm stockpiling medium (liquid salts and high temperature concrete) and dormant intensity stockpiling employing Phase Change Material (PCM). Lalau et al. focused solely on the effects of the stockpiling framework while comparing the environmental effects of an innovative stockpiling framework named "thermocline/Cofalit and liquid salt" with those of a traditional CSP stockpiling innovation called "two tanks/liquid salt" [27]. Whitaker et al. assessed water use, Cumulative Energy Demand (CED), Energy Payback Time (EPBT), and Greenhouse Gas (GHG) discharges for a hypothetical pinnacle CSP project located in the US. The characteristics of the plant were derived from previous studies on liquid salt pinnacle plant designs overseen by Sandia National Laboratories in connection with functioning plant demonstration projects carried out by the National Renewable Energy Laboratory (NREL). Pelay et al.'s LCA covered a hypothetical pinnacle CSP plant with a Rankine power cycle and Thermal Chemical Energy Storage (TCES) using calcium hydroxide. When comparing the LCA to the reference plant without capacity, the increased environmental impact resulting from the TCES framework was considered to be quite negligible. These inventors discovered that standard component libraries, such as Ecoinvent, LCA Food DK, and USA Info Result Data set, were inadequate for the study of force plants due to a lack of knowledge.
2. Literature Review

In 2014, Carlsson et al. conducted a life cycle assessment (LCA) on solar warm frameworks using level plate authorities and empty cylinders [28]. PV-T authorities are not taken into account in these analyses. Several authors developed a simpler LCA device to determine the existence cycle energy and environmental equilibriums of SHC frameworks. The device uses PV modules or conventional solar warm authorities, such as empty cylinder and level plate gatherers, to capture solar energy.
In order to extend the battery's useful life, Li et al. (2011) [29] promoted a direct dispatch strategy that operates the battery according to the simplest possible configuration. Transient breeze power estimations are measured with the use of factual approaches. In order to participate in the current electricity markets, generating units must report their results to the Transmission Framework Administrator (TSO) at least one day in advance. If the dispatch isn't met, the generating unit may be responsible for the lattice controllers' fines. The battery's measurement was also taken care of in the study, using a record capability that was examined in addition to the battery's estimated cost and lifespan.
Nguyen et al. (2015) [30] modified the recently suggested min-max dispatch approach and the lifetime cost capacity in order to further improve the battery limit. Gradually, the battery limit was increased above the minimum determined by applying the min-max technique to determine the lowest cost capabilities. This size of battery was evaluated under estimation errors and SOC control scenarios using continuous breeze speed data. Additional tests are conducted on the deployment of renewable energy systems with memory for batteries.
Small (2013) [31] developed a dispatch method where the energy hoarding is configured to have no net charge inside each restricted period in order to maintain an almost constant power yield. In order to address the half-and-half energy stockpiling framework, a productive power stream control framework was developed and a cross-breed battery and super capacitor mix was considered for the evaluation. When time intervals are shortened, the process may not function as intended because the battery's capacity may be compromised by repeated cycles of charging and discharging.
Risky ingredients used in solar board production, including as HF, SiH4, Cd, H2Se, and AsH3, have been examined by Markvart and Castañer (2003) [32] and linked to explosions, cancerous growths, and other problems. Substances that impact the liver, kidney, focal sensory system, and receptors include diborane, carbon tetra 17 chloride, H2Se, and H2S. These findings include threats to both human health and the working environment for each of the three eras of solar PV advancement.
According to Mcdonald (2010) [33], reuse programs should prioritize monetary gains while appropriately highlighting the Extended Manufacturer Obligation to mitigate the environmental effects of hazardous materials.
Gottesfeld, 2011 [34] has proposed that in order to mitigate the hazardous effects of lead contamination, solar photovoltaic frameworks should be combined with updated battery recovery policies and environmental control initiatives in the leading spot refining, battery assembly, and reusing businesses.
According to Dubey et al. (2014) [35], health risks and hazards associated with the creation process have an impact on people's well-being because of the potentially harmful properties of the materials used, their fixation, how frequently people are exposed to them, and how well their receptor cells may retain them. The main threats to the respiratory system and stomach-related structure are synthetic materials disposed of in landfills, as well as phosphine, arsine, and unintentional gas deliveries. These compounds may be breathed in at the earliest stage, which allows them to join the natural pecking order by drainage. In the unlikely event that it emerges, the Discs layer utilized in the few films also spreads illness. Furthermore, Baharwani et al. (2014) [35] used life cycle assessments (LCAs) to evaluate the environmental impact of photovoltaic power age frameworks throughout the course of their lifespan, taking into account energy reimbursement periods and outflows of substances that deplete the ozone layer. They also discovered that although there are no outflows when solar boards are developing, there are during the operational period.
According to Giacchetta et al. (2013) [36], administrators of PV boards will be able to guarantee asset expansion and prevent a shortage of interesting minerals by using roundabout economic criteria to empower reliable EoL. According to a study by Peng et al. (2013), the evaluation results are affected by variables such as the rate of greenhouse gas outflow, EPBT, and life expectancy energy consumption of photovoltaic systems.
According to Cyrs et al. (2014) [37], the material recovery profit was not precisely equal to the cost of recycling CdTe boards. Because of the tellurium shortage, recycling may prove to be more financially advantageous in the future. Inadequate maintenance of CdTe photovoltaic boards as they near the end of their useful lives and inadequate access controls throughout the recycling process raise health risks that might swiftly outweigh any cost savings.
According to Park & Park, (2014) [38], a mixture of phosphoric corrosive, HNO3, and HF was used to refinish the broken boards. Using a combination of hydrofluoric acid, potassium hydroxide, and nitric corrosive was the main drawing process.

3. Research Methodology

3.1. Experiment Part

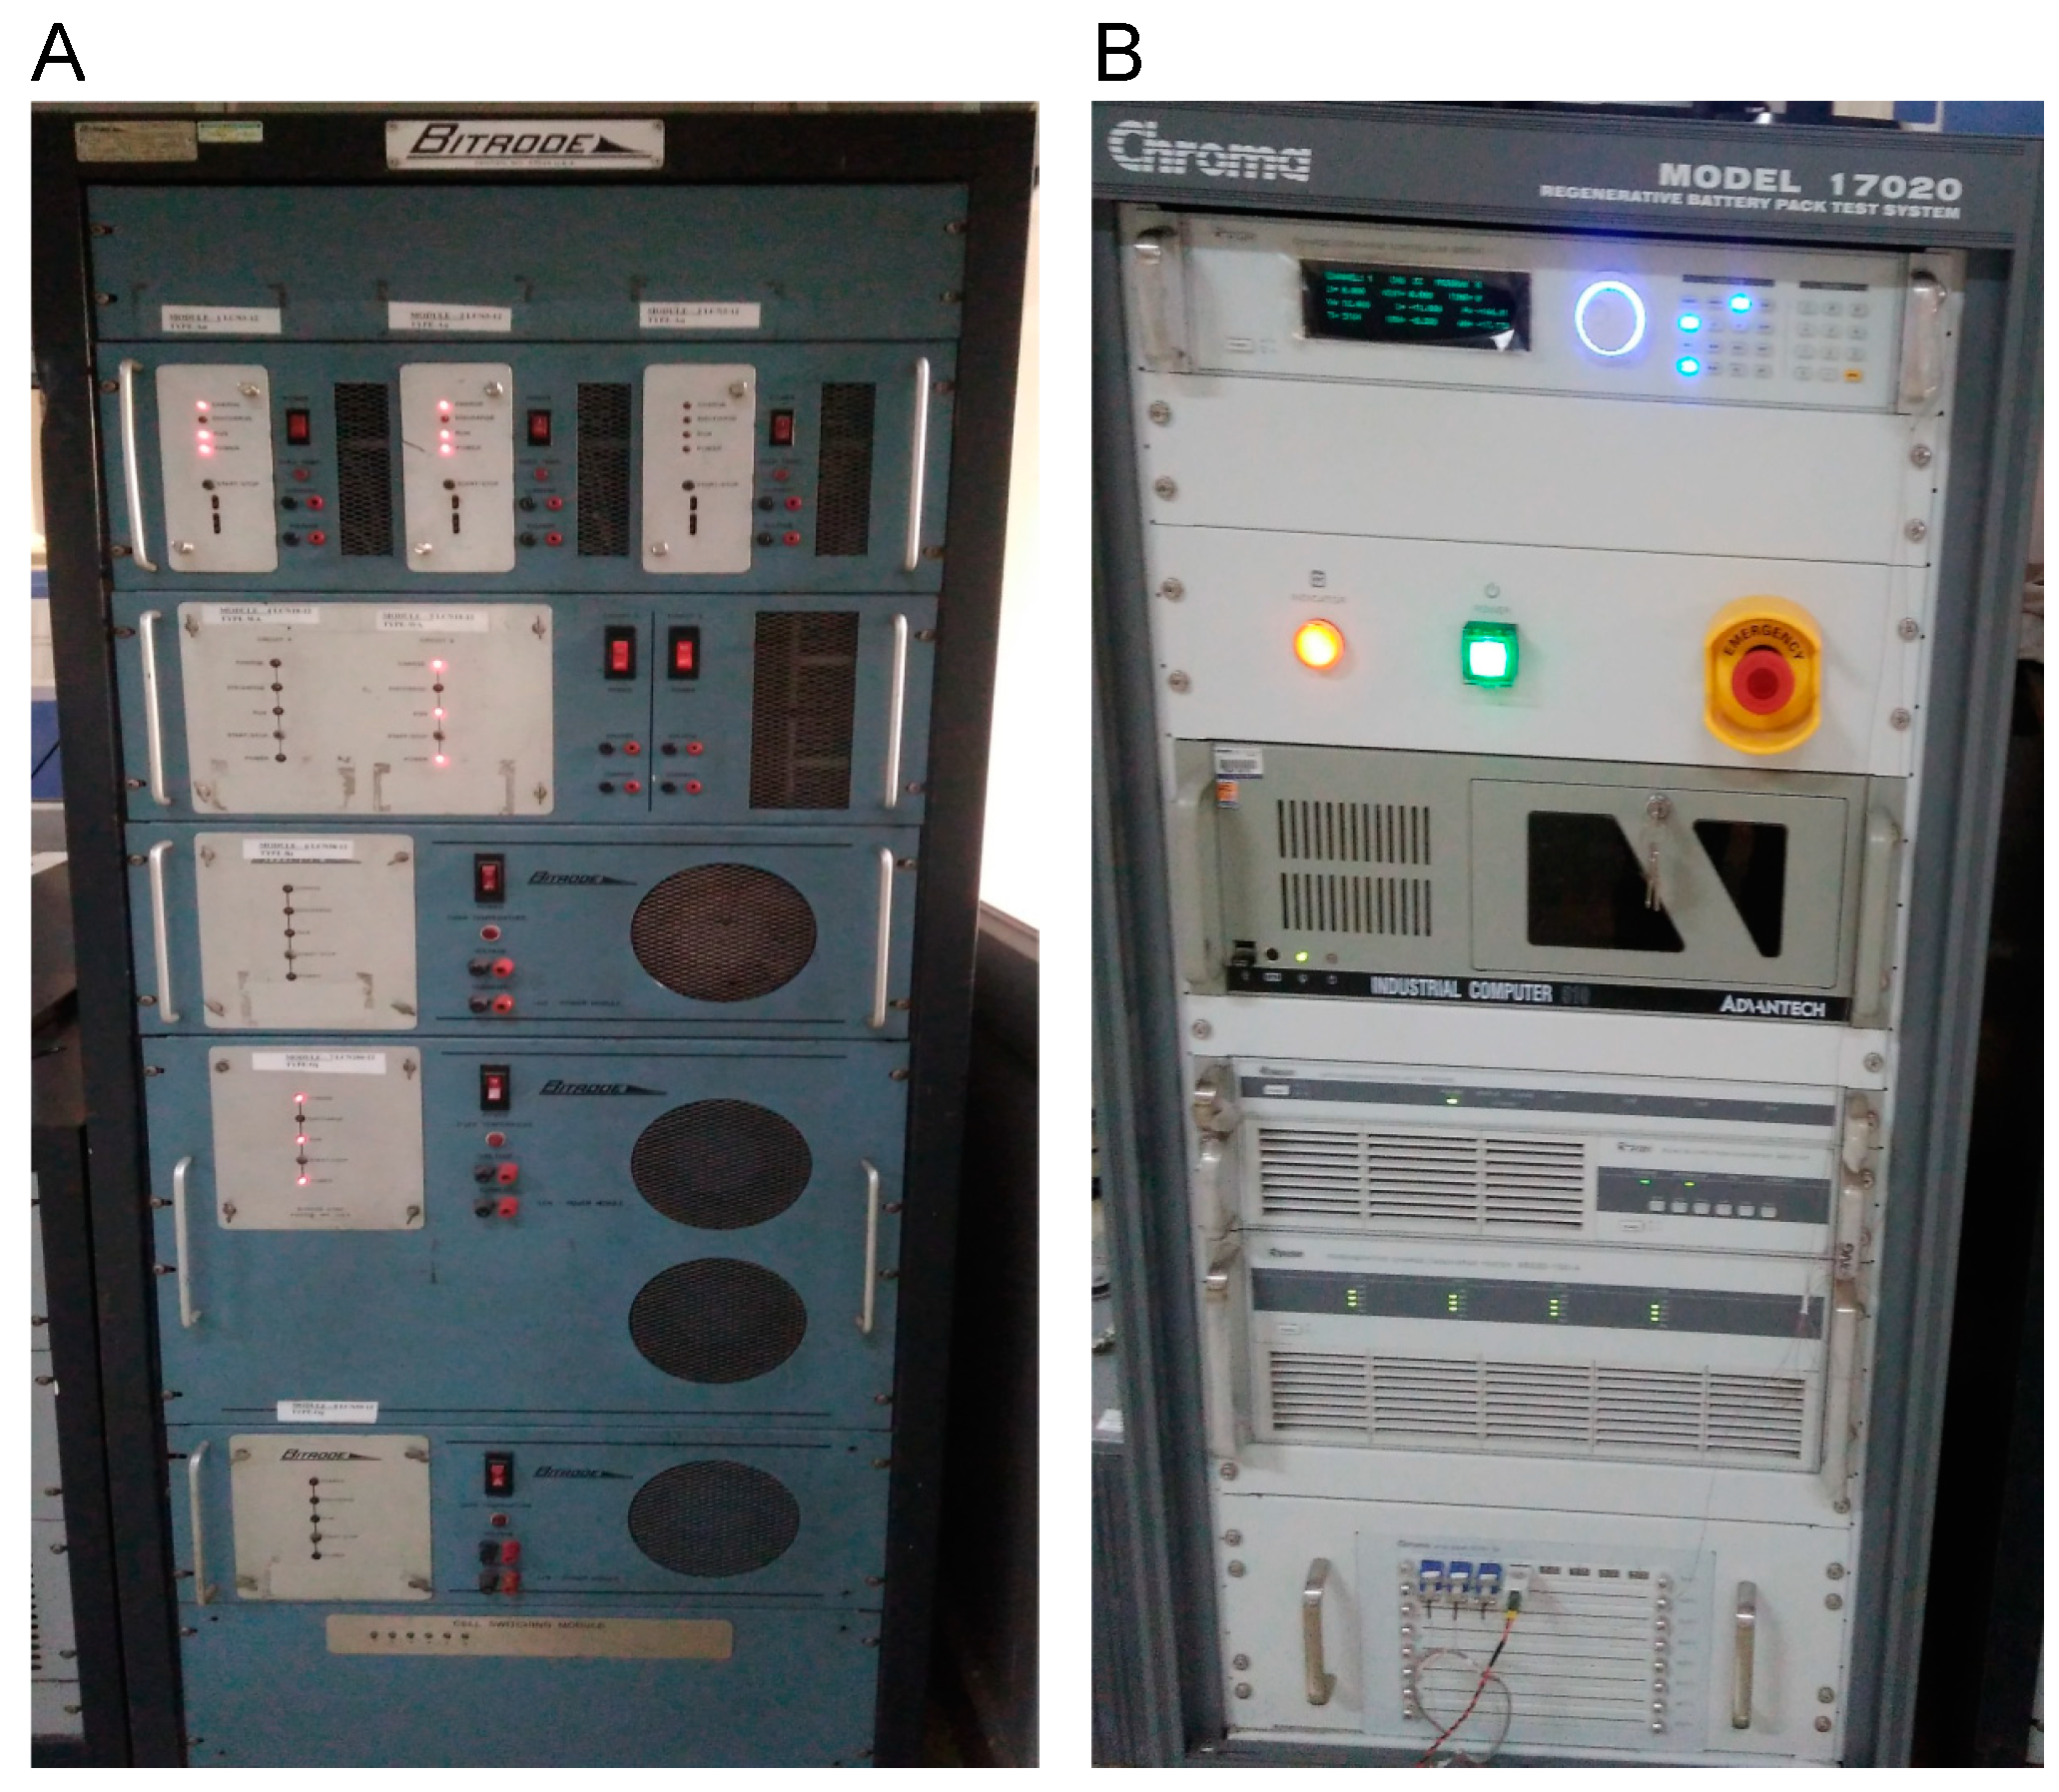
Battery tests were carried out using Bitrode, a schematic depiction of the battery testing apparatus seen in Figure 3A. Bitrode Corporation is the manufacturer of the integrated Regenerative Battery Pack Test System and the battery testing equipment (Bitrode). The business is based in USA's Missourian city of St. Louis.
Bitrode offers user-friendly battery lab systems and runs on the full control software VisuaLCN 1.88. Customers may design and carry out unique battery testing programs with VisuaLCN, enabling them to test batteries automatically. By utilizing user-defined variables, programmers may create multi-step programs. Bitrode lets a single PC manage several circuits. The VisuaLCN client analyzes the data via an Excel spreadsheet, Access database, or built-in graphing tool. Each cycle of the test program can have an endless number of stages added by the user. It collects data from the testing equipment and provides users with rapid access to the data. It retains the data that it collects. The user can revisit the data at any point in the future. The extremely accurate integrated Regenerative Battery Pack Test System (Figure 3B) is utilized for secondary battery module and pack tests. All types of energy storage batteries are tested using this instrument. Numerous tests, including as capacity testing, charge-discharge tests, performance tests, heat tests, cycle simulators, and life cycle testing, may be carried out using these two devices. An environmental climate chamber (Figure 4) is used to simulate the temperature of the batteries. To simulate the outdoors temperature, a climate chamber made of Kaleidoscope was employed. The climatic chamber, a climate simulator, has a precision of ±0.5. The range of humidity with a 20 °C rise and fall in temperature is 10% RH to 98% RH. It has a capacity of 100 to 5000 L and a temperature range of -90 to 180 °C.

3.2. Analysis of Capacity Degradation of Lead Acid Batteries using Simulated Field Charging Condition

To acquire reliable electricity from a solar-powered system, energy storage is needed. Secondary rechargeable batteries are mainly used for this. Lead acid battery technology is the most advanced and advantageous of all battery technologies. Batteries are a necessary part of any solar-powered system. If damaged, it might cause problems and costs for the users and operators of the system.

Testing Methodology

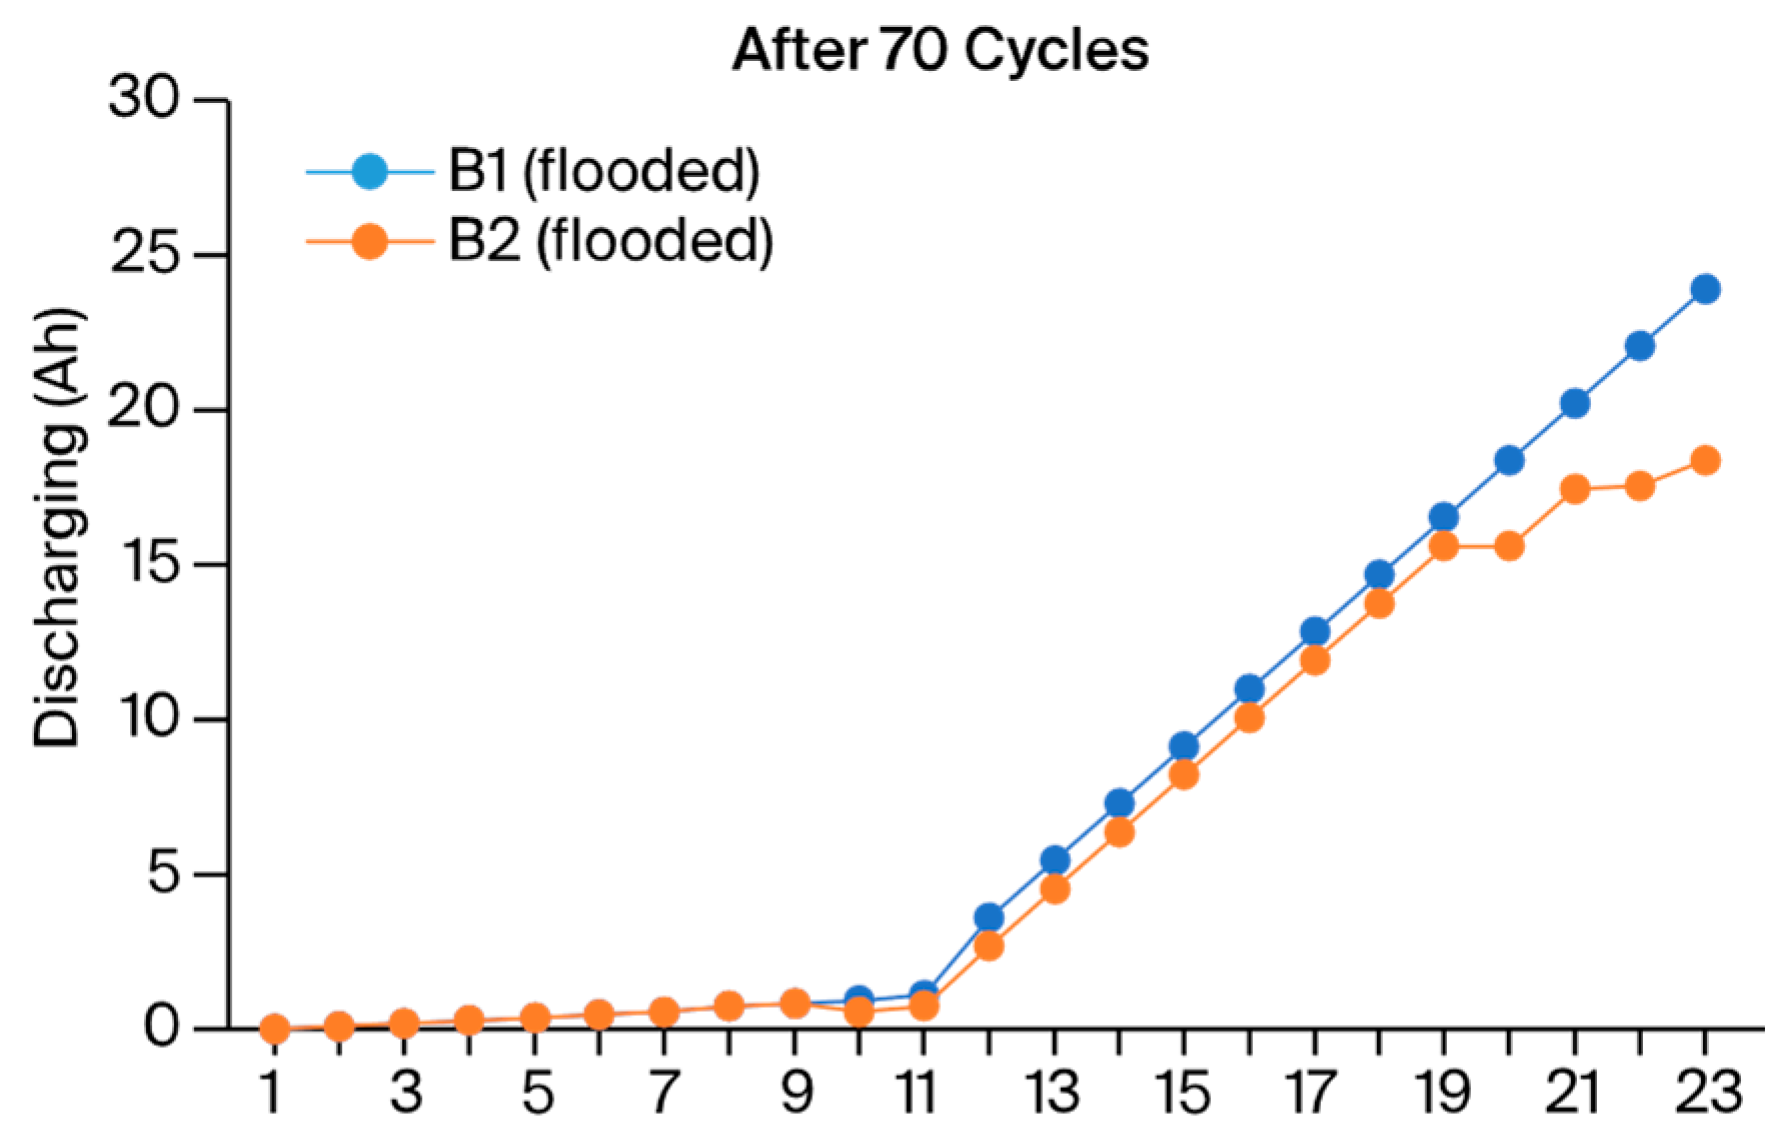
At the National Institute of Solar Energy (NISE), battery capacity tests were carried out using the Bitrode Life cycle network (Figure 3A). The battery is one of the key components of solar stand-alone applications. The amp-hour capacity of a battery changes with the operating conditions. The feature that is most affected is the amp-hour capacity of the battery. The amp-hour capacity of a lead acid battery under simulated field charging settings for recently acquired batteries was examined using the Bitrode LCN battery testing device. The conditions encountered in the field during the sunlight hour prompted the development of the multi-step charging algorithms. The four key processes are the low charge at startup, the gradual charge growth, the peak charge at the C-10 charging rate, and the corresponding progressive charge reduction until the end of charge availability. This displays the battery's simulated charging regime, which is similar to the radiation profile of a regular sunny day. For seventy cycles, the battery was put through a simulated multi-step field charging regime. Two samples of the 12 V, 40 Ah flooded lead acid (B1, B2 flooded) and two samples of the 12 V, 40 Ah VRLA (Valve Regulated Lead Acid) batteries used in the solar street lighting system have been taken for testing. Both types of lead acid batteries underwent capacity testing. Battery capacity tests were carried out in a lab environment with an ambient temperature of 270 C. One testing program (Program-I) was made in compliance with field charging conditions. Two 12 V lead acid battery samples were evaluated in the field: one was flooded (B2 flooded), and the other was a VRLA (B2 VRLA). These settings included a 6-hour discharge at a constant current (C-10 rate) and altering the charging currents to the batteries. Under typical circumstances, the two remaining batteries, B1 VRLA and B1 flooded, were evaluated by charging and discharging them at a constant current (C-10 rate) (Program-II). Six hours is the maximum discharge time for each scenario. Each battery was tested using its unique programmed program for seventy cycles. The data of the batteries assessed under normal settings is compared with the recorded and final data of two different batteries evaluated under field charging conditions. In addition, the capacity variance was calculated using data from the batteries B1 VRLA and B1 flooded.
Figure 5. Capacity (Ah) variation of two (B1, B2 flooded) lead acid batteries discharge for 6 h after 70 cycles (Capellan-Perez, I.; Arto, I.; Polanco-Martinez, J.M.; Gonzalez, 2016).
Preprints 105664 g005

4. Result and Discussion

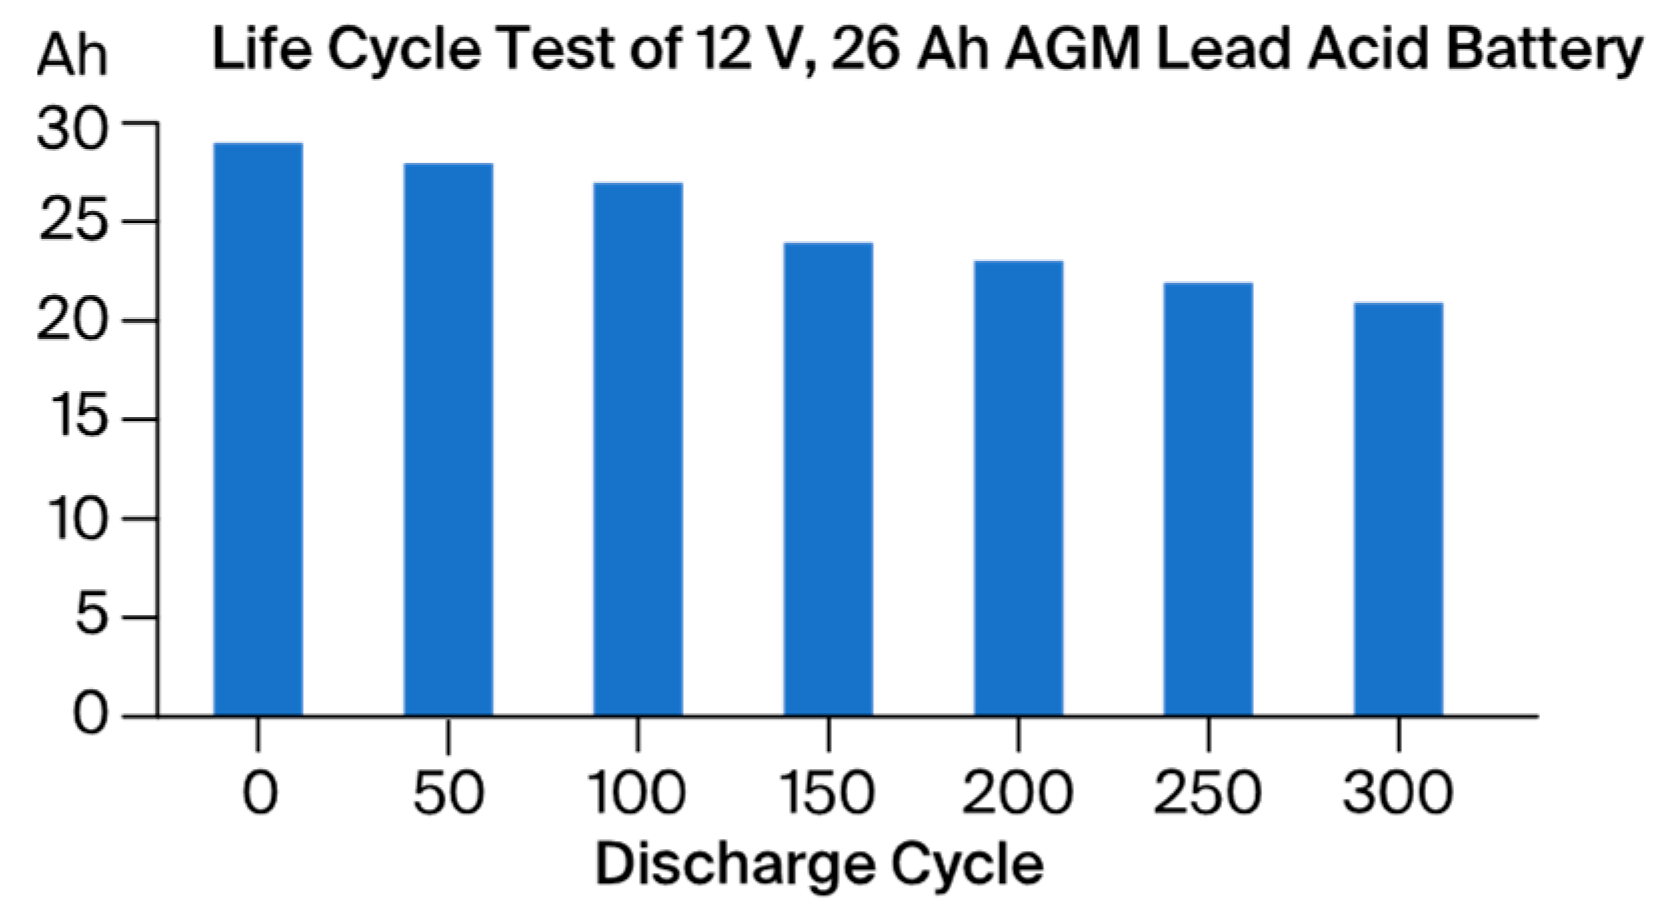
The Bitrode Life Cycle Network Testing apparatus (Figure 5.1) was utilized for the experiments. It comprises a programmable power supply, an integrated data logger, and a load. The equipment satisfies international requirements and is state-of-the-art. Variables such as voltage, current, temperature, time, ampere-hours, and watt-hours can be recorded at predefined intervals. The temperature data of the batteries were also recorded by placing a temperature sensor at their bodies. The exterior temperature of a climate room was maintained at 27 °C (Figure 5.2). This compartment has fittings for attaching the batteries to the testing device. In this experiment, life cycles of twelve-volt, 26-ah AGM (B1) and twelve-volt, 150-ah flooded lead acid (B2) batteries were conducted. Program III and Program IV are two separate programs designed for the corresponding batteries. For each of the two batteries on Bitrode (a battery testing equipment), these two programs have been run using VisuaLCN full control software. Testing was done for a maximum of 300 cycles on both batteries. The low cut-off voltage of 10.5 V and the high cut-off voltage of 14.8 V are set for the AGM lead acid battery, respectively. The battery was charged at a constant current of 2.6 A, and this same steady current is also drained from it during discharge. The high cutoff voltage for flooded lead acid batteries was 14.8 V, while the low cutoff voltage was 10.8 V. A constant 15 amp current was fed into the battery, and this same consistent current is lost during discharge. All tests were conducted at room temperature for the full duration. Both batteries' capacity values were recorded over 300 cycles. For this aim, both of these batteries underwent 300 cycles of testing at a constant C-10 discharge rate.

4.1. Life Cycle Test of Lead-Acid Batteries

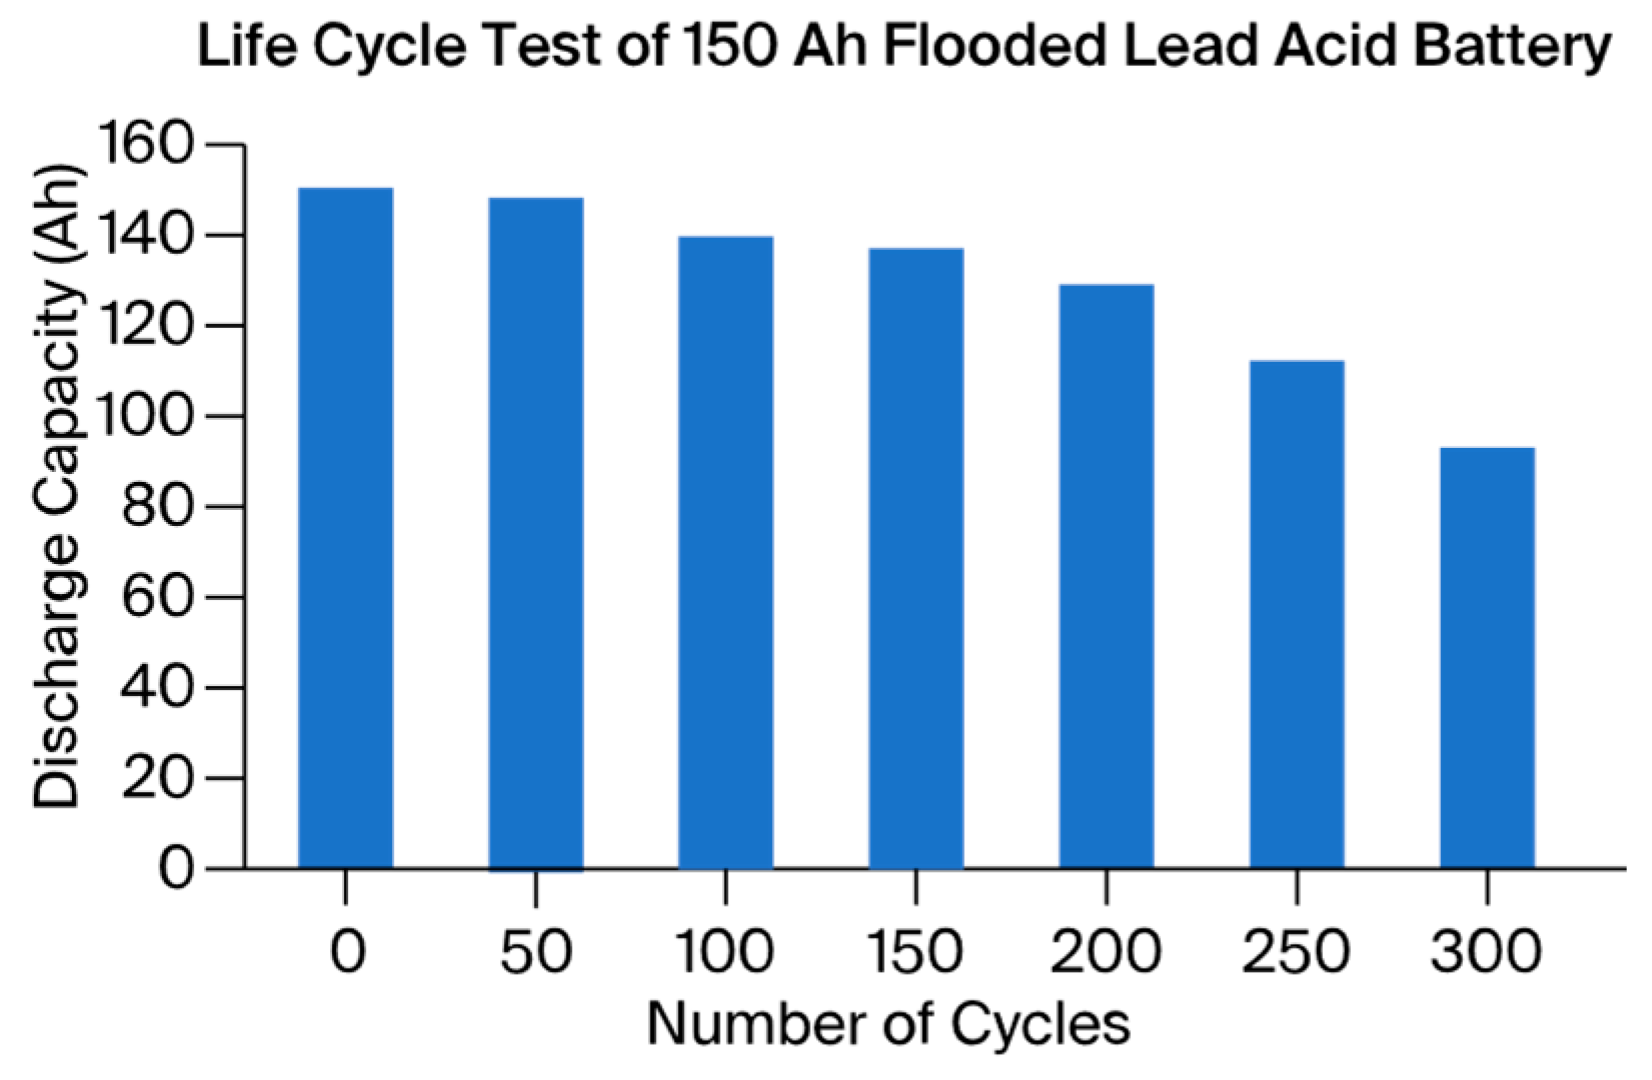
The tests were conducted using the Bitrode Life Cycle Network Testing apparatus (Figure 5.1), which consists of a load, an integrated data logger, and a programmable power supply. The equipment is state-of-the-art and conforms to international standards. Variables such as temperature, time, ampere-hours, watt-hours, voltage, and current may all be recorded at predefined intervals. Battery temperature data were also acquired by placing a temperature sensor at the battery bodies. The outside temperature was maintained at 27 °C within a climate chamber (Figure 5.2). This compartment has the necessary parts to connect the batteries to the testing device. For this study, life cycles were performed on twelve-volt, 26-ah AGM (B1) and twelve-volt, 150-ah flooded lead acid (B2) batteries. Two separate programs (Program III and Program IV) were developed for the respective batteries. These two scripts have been run for each of the two batteries on Bitrode (a battery testing equipment) by VisuaLCN complete control software. The testing was conducted up to 300 cycles for each batteries. The high and low cut-off voltages of the AGM lead acid battery are set at 14.8 V and 10.5 V, respectively. The battery was charged at a steady 2.6 A, and when it is discharged, the same continuous current is drained from it. The high and low cutoff voltages for flooded lead acid batteries were 14.8 V and 10.8 V, respectively. The battery was given a constant 15 amp current, and during discharge, the battery loses this constant current. All of the tests were conducted at room temperature. The capacity values of both batteries were recorded over 300 cycles. For this reason, 300 cycles at a constant C-10 discharge rate were performed on both of these batteries.
Figure 6. Life cycle test of 12 V, 26 Ah AGM Lead acid battery at C-10 rate under normal conditions. (Akinyele, Belikov & Levron, 2017).
Preprints 105664 g006
Figure 7. Life cycle test of 12 V, 150 Ah flooded Lead acid battery at C-10 rate under normal conditions (Akinyele, Belikov & Levron, 2017).
Preprints 105664 g007

4.2. Result

After 300 exercise cycles, the nominal capacity of AGM Lead Acid (B1) and Flooded Lead Acid (B2) batteries decreases by around 80–79% and 75–70%, respectively. "Normal conditions" describes how long the battery lasts. Compared to flooded lead acid batteries, AGM lead acid batteries have a longer cycle life. Throughout the test, the flooded lead acid battery received routine maintenance. When a battery's capacity falls to less than 75–80%, it does not always mean that it is dead. Before their nominal capacities fall to between 50 and 60 percent of their initial rated capacity, batteries have a maximum number of cycles. The outcomes show that after a specific number of complete cycles, we can determine the battery's health.

4.3. Comparison of Lead-Acid and Li-Ion Battery in Solar Power Applications

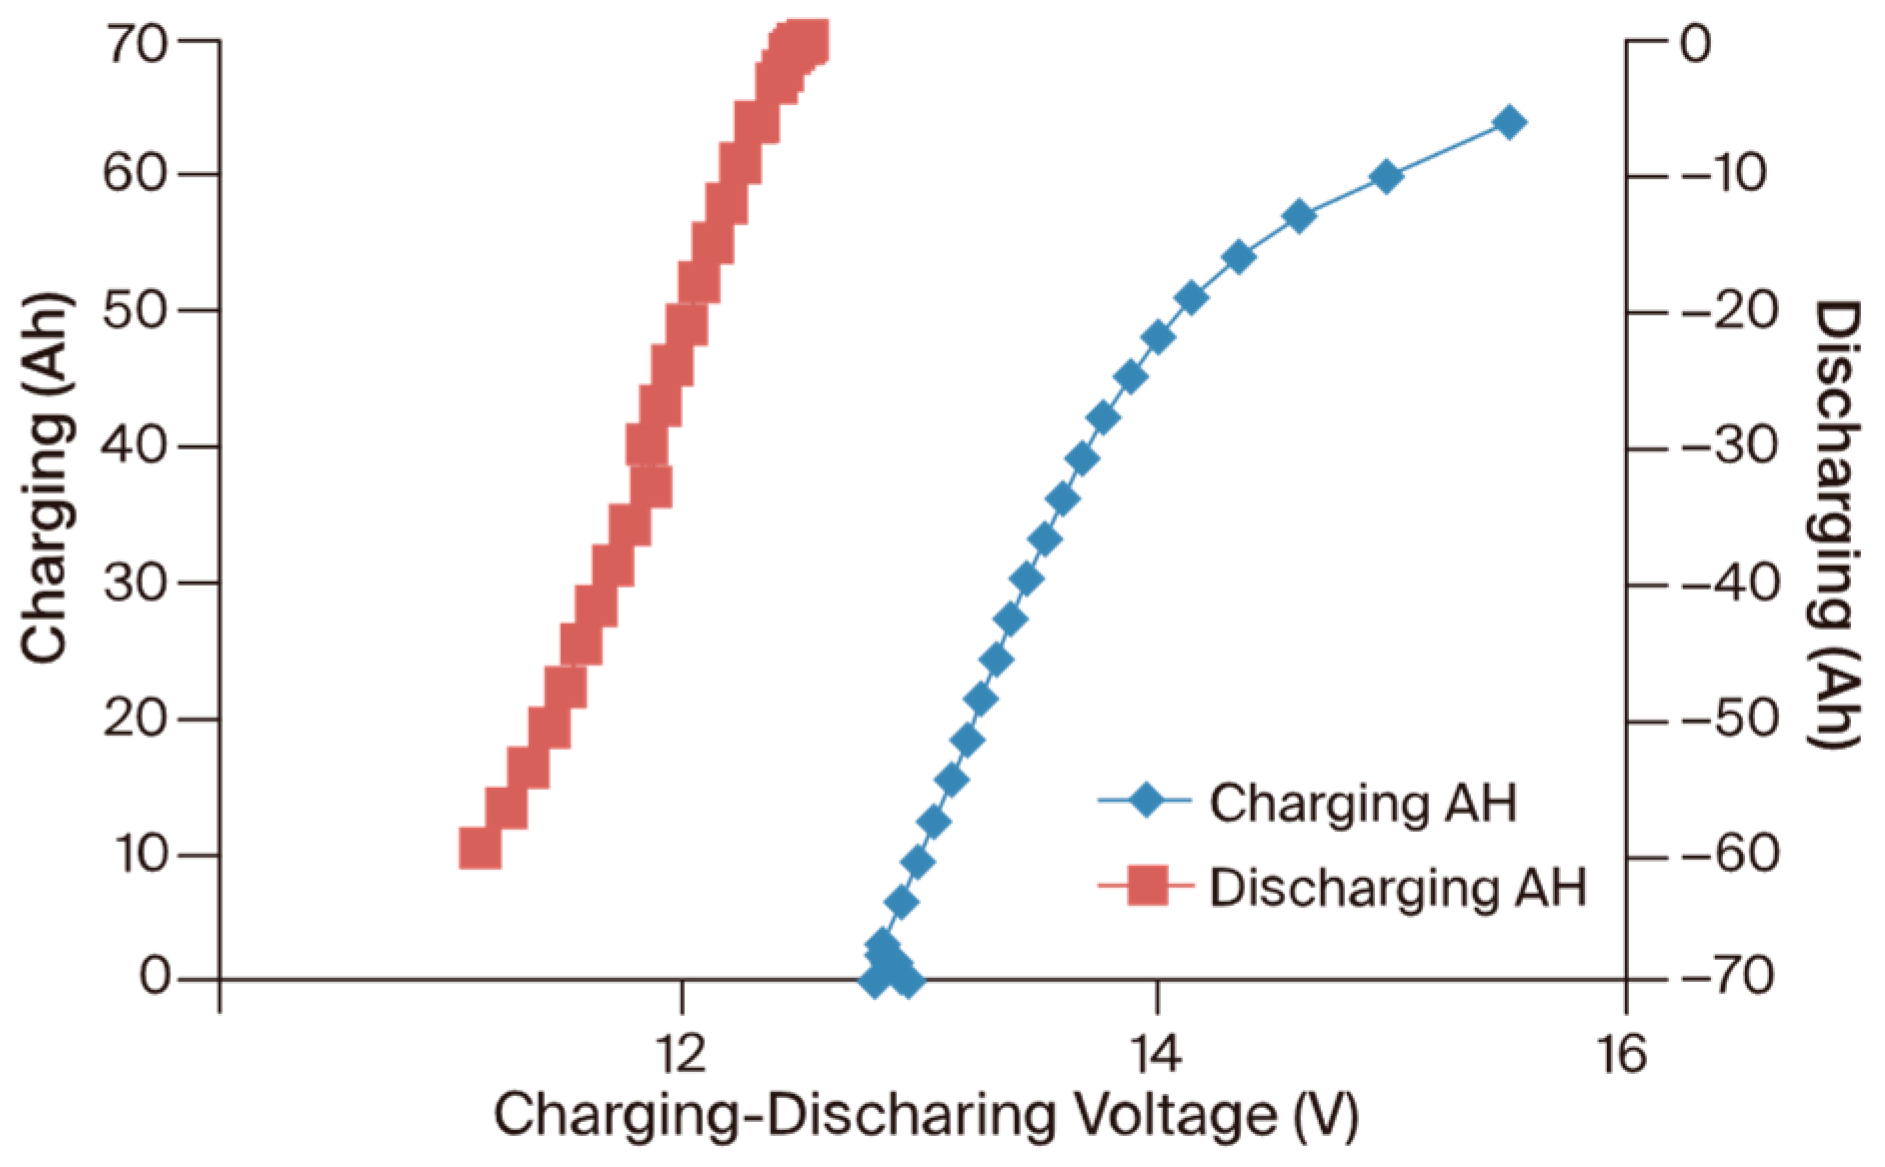
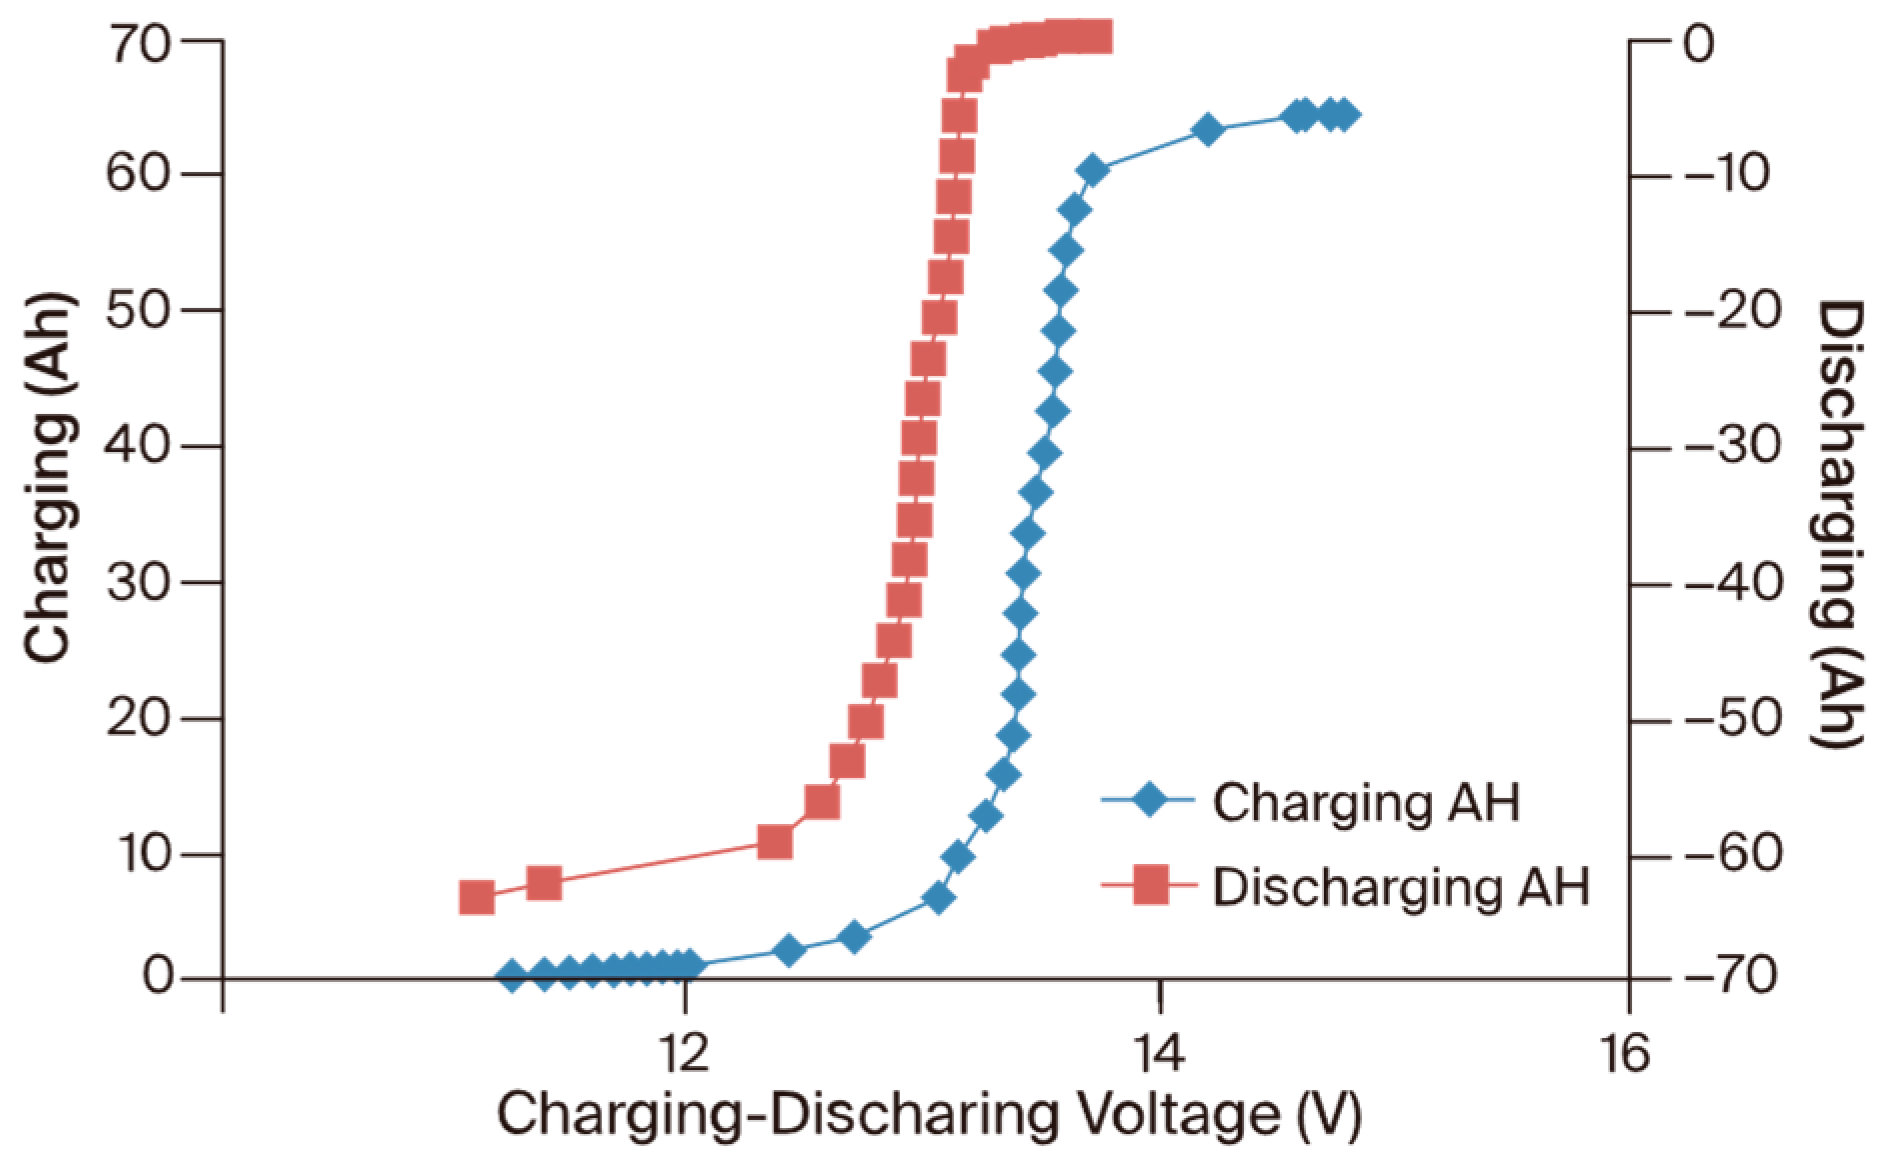
For this comparison study, samples of a 12.8 V, 60 AH Li-ion battery and a 12 V, 60 AH lead acid battery were collected. Both samples were analyzed using Programs V and VI, which were run on the Bitrode Life Cycle Network battery testing device. Batteries were attached to different ports at the same time, and the corresponding testing procedures were performed on them. The experiments were run at a constant C-10 rate at room temperature. Before a certain charge and discharge pattern of amp hours was achieved, both batteries were put through nine to ten cycles of testing. After that, the machine was opened to remove both kinds of samples. Each test result was kept on file by the system.
Figure 8. Charge-Discharge pattern of 12 V, 60 AH Lead acid battery with respect to voltage (Dale & Pereira de Lucena et al., 2013).
Preprints 105664 g008
Figure 9. Charge-Discharge pattern of 12.8 V, 60 AH Li-ion battery with respect to voltage (Dale & Pereira de Lucena et al., 2013).
Preprints 105664 g009

4.4. Effect of Temperature on Flooded Lead-Acid Battery Performance

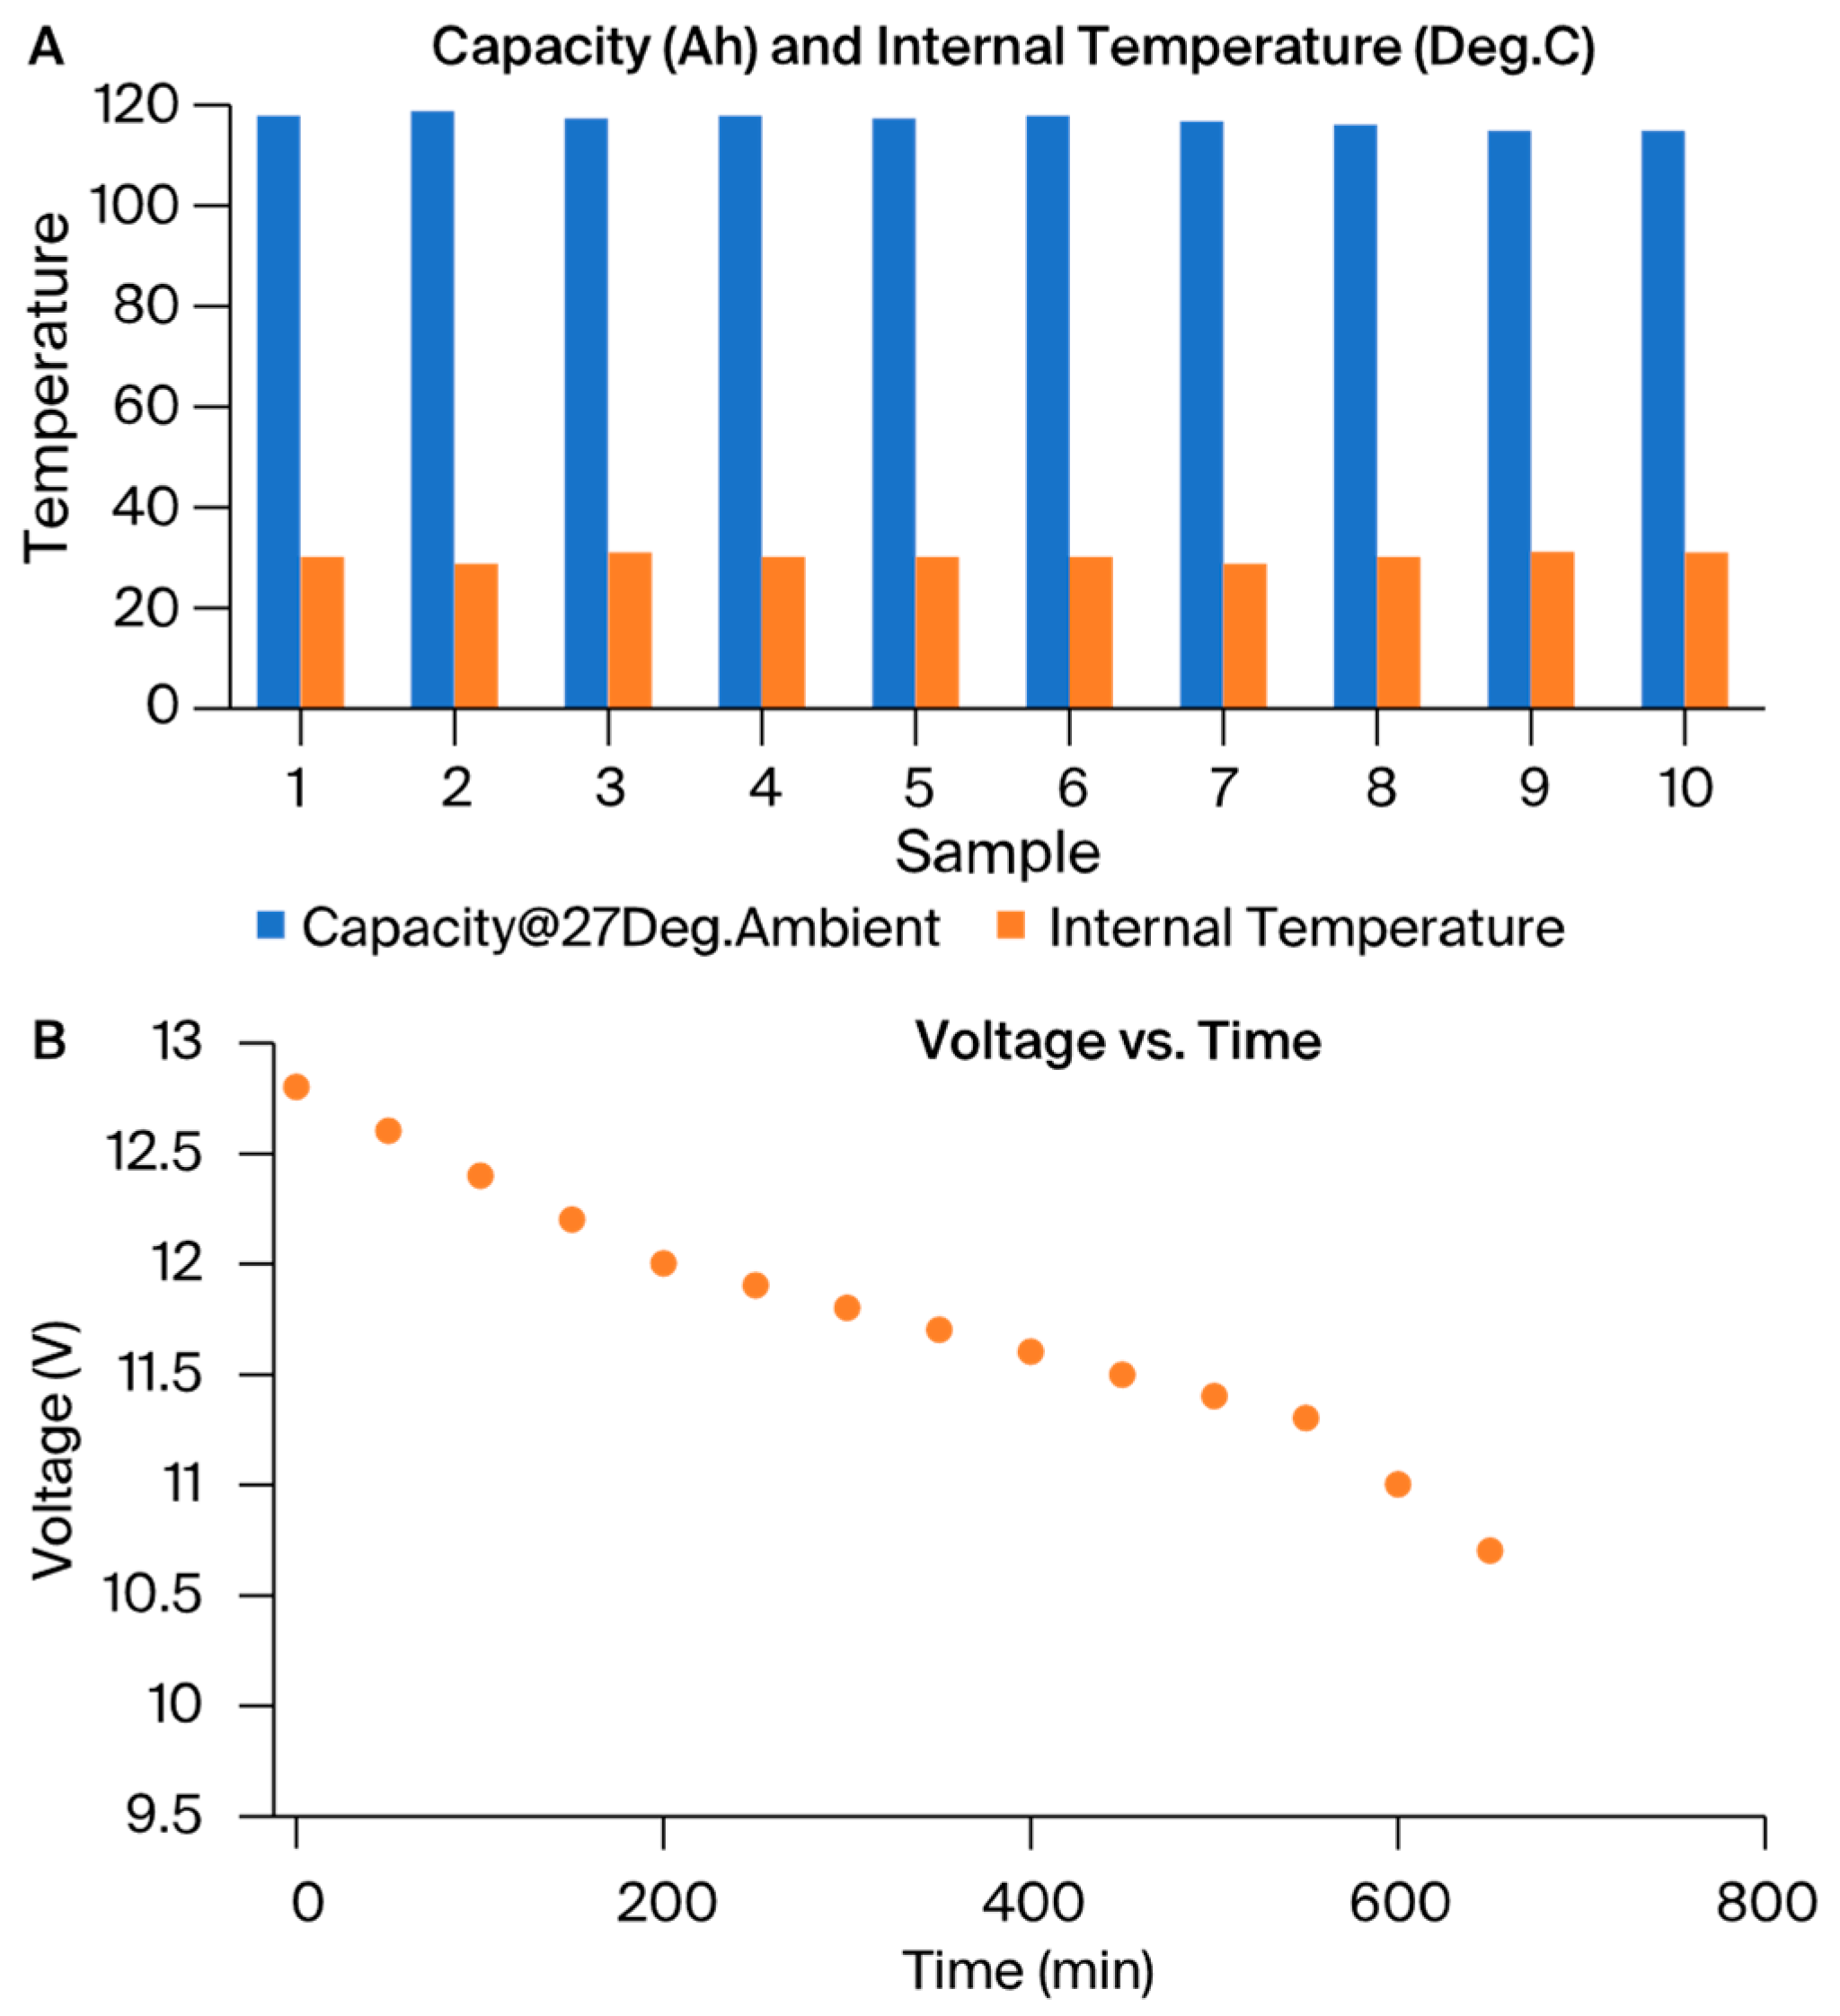
For the experiment, brand-new samples of 12 V 100 Ah flooded lead-acid batteries were utilized. First, 15 randomly selected samples were selected for the capacity test. Of the fifteen samples, only ten were selected for further analysis since their capacity values were very near (Figure 10A,B). The individual cells were tested for capacity and charge efficiency throughout the temperature range of 0–500 °C, in accordance with BIS# criteria. Average values were recorded. Five rounds of capacity analysis and efficiency testing were performed on each sample. At 100 °C intervals, data was gathered. The factors that were being observed were internal temperature, voltage, capacity, efficiency, and current. The capacity and efficiency of the Bitrode LCN machine were tested. This device includes a load bearing, data logging, and power supply, and it is interfaced to a computer for control. To replicate the outside temperature, Kaleidoscope's climatic chamber was utilized.

5. Conclusions and Recommendation

The study showed how battery capacities utilized in solar applications are significantly impacted by charging and discharging patterns. The batteries' performance was entirely dependent on the operating environment. As a result, batteries should be utilized in accordance with the suggested charge-discharge rhythm to get the most out of them. Systems and batteries must be properly maintained while used in the field. Less maintenance is needed for VRLA batteries than for flooded lead-acid batteries. As a result, VRLA batteries ought to be installed or used sporadically in areas where appropriate maintenance is not feasible. It is recommended to adhere to conventional maintenance techniques and practices in order to prolong the life of batteries. The cycle life of VRLA batteries is greater than that of flooded lead-acid batteries. If the battery's capacity falls to less than 80% of its rated capacity, it has reached the end of its cycle life. This can prevent the battery from operating as planned, but it does not ensure that it won't. After attaining cycle life, a battery can be charged and discharged several times before seeing a noticeable decrease in capacity. A battery can only have a longer cycle life with the right operational conditions and maintenance. Before installing a battery in any solar power application, it is important to take into account its capacity, columbic or AH efficiency, voltaic efficiency, energy efficiency or WH efficiency, and self discharge. Environmental implications and production costs are other factors to take into account. In terms of technical parameters, VRLA batteries are superior to flooded lead-acid batteries, although being more costly. When money is not a key factor and proper maintenance is occasionally not possible, VRLA batteries are a great choice. You can use flooded batteries if money is a big issue. Li-ion battery price and production complexity are significant issues, despite the fact that lead acid battery technology is theoretically better than Li-ion battery technology. Temperature is one important aspect that influences battery life. High operating temperatures reduce the life of a battery [39]. Like all chemical reactions, electrochemical processes are greatly influenced by temperature. High temperatures have the potential to extend the battery's life cycle while also increasing reaction pace and instantaneous capacity. The lifespan of a battery is halved for every 10°C rise in temperature. When shipping batteries, self-discharge data could be more useful to the service providers. Furthermore, the data provides the actual watt-hour performance of different systems, providing more precise information to SPV power plant designers. Batteries are the final resort for electricity engineers. If these objects are to have a longer service life, a designer or installer has to be aware of their field performance. The selection, fabrication, and maintenance of a battery are made easier by understanding the expected performance of a certain technology in specific situations. It eliminates the continuous cost of needing to replace batteries on a regular basis and ensures a robust and uninterrupted system [40]. The internal temperature of a battery is one significant element affecting its longevity and performance. It is affected by both the surrounding temperature and the rate of charge/discharge. High interior temperature shortens the battery's service life. The conductance value of a battery provides information on the actual state of charge of the battery, the integrity of the intercellular connections, the specific gravity of the cells, and the ionic conductivity of the electrolyte. The positive plate of a battery may degrade and alter chemically with age, which will negatively impact the battery's performance. The test findings, which are derived from the cells' internal electrical resistance, are an amalgam of the mechanical health of the cells and the electrochemical efficiency or condition of the grid/plate structures. For the remainder of its life, the battery will age as usual, beginning when it is activated during the formation process at the end of the battery production line. Accordingly, conductance may be used to track variations and spot problems with batteries, such long-term undercharging that reduces the battery's performance and short circuits and open circuits. Conductance test measurements become a crucial tool for assessing whether a battery is approaching the end of its usable life. The results of the tests indicate that the conductance technology can be a useful tool for evaluating the condition of recently manufactured or field-tested batteries. Conductance, which has a linear relationship with battery capacity, is a simple indication of battery health. This linear connection is valid even when the batteries are not performing well. Standard load testing methods need time and energy to perform; conductance testing is a rapid and reliable approach to determine battery capacity. While it is impossible to estimate with precision, the capacity can provide a rough idea of the battery's condition. It might be useful for assessing batteries in bulk for tenders or inspections if load testing doesn't seem practical for every sample.

References

  1. Feldt, S.M.; Gibson, E.A.; Wang, G.; Fabregat, G.; Boschloo, G.; Hagfeldt, A. Carbon counter electrodes efficient catalysts for the reduction of Co(III) in cobalt mediated dye-sensitized solar cells. Polyhedron 2014, 82, 154–157. [Google Scholar] [CrossRef]
  2. Fthenakis, V.; Frischknecht, R.; Raugei, M.; Kim, H.C.; Alsema, E.; Held, M.; de Wild-Scholten, M. Task 12—Methodology Guidelines on Life Cycle Assessment of Photovoltaic Electricity, 3rd ed.; International Energy Agency Photovoltaic Power Systems Programme: Paris, France, 2016; ISBN 978-3-906042-38-1. [Google Scholar]
  3. Das, P.D.D.; Srinivasan, P.R.; Sharfuddin, P.D.A. Fossil Fuel Consumption, Carbon Emissions and Temperature Variation in India. Energy Environ. 2011, 22, 695–709. [Google Scholar] [CrossRef]
  4. Rubio, L.M.; Filho, J.P.B.; Henriquez, J.R. Performance of a PV/T Solar Collector in a Tropical Monsoon Climate City in Brazil. IEEE Lat. Am. Trans. 2018, 16, 140–147. [Google Scholar] [CrossRef]
  5. Santoyo-Castelazo, E.; Gujba, H.; Azapagic, A. Life cycle assessment of electricity generation in Mexico. Energy 2011, 36, 1488–1499. [Google Scholar] [CrossRef]
  6. Jacobson, M.Z.; Delucchi, M.A.; Bazouin, G.; Bauer, Z.A.F.; Heavey, C.C.; Fisher, E.; Morris, S.B.; Piekutowski, D.J.Y.; Vencill, T.A.; Yeskoo, T.W. 100% clean and renewable wind, water, and sunlight (WWS) all-sector energy roadmaps for the 50 United States. Energy Environ. Sci. 2015, 8, 2093–2117. [Google Scholar] [CrossRef]
  7. Hou, G.; Sun, H.; Jiang, Z.; Pan, Z.; Wang, Y.; Zhang, X.; Zhao, Y.; Yao, Q. Life cycle assessment of grid-connected photovoltaic power generation from crystalline silicon solar modules in China. Appl. Energy 2016, 164, 882–890. [Google Scholar] [CrossRef]
  8. Leccisi, E.; Raugei, M.; Fthenakis, V. The Energy and Environmental Performance of Ground-Mounted Photovoltaic Systems—A Timely Update. Energies 2016, 9, 622. [Google Scholar] [CrossRef]
  9. Capellan-Perez, I.; Arto, I.; Polanco-Martinez, J.M.; Gonzalez-Eguino, M.; Neumann, M.B. Likelihood of climate change pathways under uncertainty on fossil fuel resource availability. Energy Environ. Sci. 2016, 9, 2482–2496. [Google Scholar] [CrossRef]
  10. El-Bialy, E.; Shalaby, S.; Kabeel, A.; Fathy, A. Cost analysis for several solar desalination systems. Desalination 2016, 384, 12–30. [Google Scholar] [CrossRef]
  11. Tamboli, A.C.; Bobela, D.C.; Kanevce, A.; Remo, T.; Alberi, K.; Woodhouse, M. Low-Cost CdTe/Silicon Tandem Solar Cells. IEEE J. Photovolt. 2017, 7, 1767–1772. [Google Scholar] [CrossRef]
  12. Farjana, S.H.; Huda, N.; Mahmud, M.P.; Saidur, R. Solar process heat in industrial systems-A global review. Renew. Sustain. Energy Rev. 2018, 82, 2270–2286. [Google Scholar] [CrossRef]
  13. Latunussa, C.E.; Ardente, F.; Blengini, G.A.; Mancini, L. Life Cycle Assessment of an innovative recycling process for crystalline silicon photovoltaic panels. Sol. Energy Mater. Sol. Cells 2016, 156, 101–111. [Google Scholar] [CrossRef]
  14. Gerbinet, S.; Belboom, S.; Leonard, A. Life Cycle Analysis (LCA) of photovoltaic panels: A review. Renew. Sustain. Energy Rev. 2014, 38, 747–753. [Google Scholar] [CrossRef]
  15. Espinosa, N.; Hosel, M.; Jorgensen, M.; Krebs, F.C. Large scale deployment of polymer solar cells on land, on sea and in the air. Energy Environ. Sci. 2014, 7, 855–866. [Google Scholar] [CrossRef]
  16. Espinosa, N.; Zimmermann, Y.S.; dos Reis Benatto, G.A.; Lenz, M.; Krebs, F.C. Outdoor fate and environmental impact of polymer solar cells through leaching and emission to rainwater and soil. Energy Environ. Sci. 2016, 9, 1674–1680. [Google Scholar] [CrossRef]
  17. Akinyele, D.; Belikov, J.; Levron, Y. Battery Storage Technologies for Electrical Applications: Impact in Stand-Alone Photovoltaic Systems. Energies 2017, 10, 1760. [Google Scholar] [CrossRef]
  18. Ardente, F.; Beccali, G.; Cellura, M.; Brano, V.L. Life cycle assessment of a solar thermal collector. Renew. Energy 2005, 30, 1031–1054. [Google Scholar] [CrossRef]
  19. Hou, J.; Zhang, W.; Wang, P.; Dou, Z.; Gao, L.; Styles, D. Greenhouse Gas Mitigation of Rural Household Biogas Systems in China: A Life Cycle Assessment. Energies 2017, 10, 239. [Google Scholar] [CrossRef]
  20. Atilgan, B.; Azapagic, A. Life cycle environmental impacts of electricity from fossil fuels in Turkey. J. Clean. Prod. 2015, 106, 555–564. [Google Scholar] [CrossRef]
  21. Mahmud, M.P.; Farjana, S.H. Wind Power Technology Schemes as Renewable Energy in Bangladesh. Int. J. Eng. Adv. Technol. (IJEAT) 2012, 1, 315–319. [Google Scholar]
  22. Righi, S.; Baioli, F.; Dal Pozzo, A.; Tugnoli, A. Integrating Life Cycle Inventory and Process Design Techniques for the Early Estimate of Energy and Material Consumption Data. Energies 2018, 11, 970. [Google Scholar] [CrossRef]
  23. Atilgan, B.; Azapagic, A. Assessing the Environmental Sustainability of Electricity Generation in Turkey on a Life Cycle Basis. Energies 2016, 9, 31. [Google Scholar] [CrossRef]
  24. Kommalapati, R.; Kadiyala, A.; Shahriar, M.T.; Huque, Z. Review of the Life Cycle Greenhouse Gas Emissions from Different Photovoltaic and Concentrating Solar Power Electricity Generation Systems. Energies 2017, 10, 350. [Google Scholar] [CrossRef]
  25. Dale, A.T.; Pereira de Lucena, A.F.; Marriott, J.; Borba, B.S.M.C.; Schaeffer, R.; Bilec, M.M. Modeling Future Life-Cycle Greenhouse Gas Emissions and Environmental Impacts of Electricity Supplies in Brazil. Energies 2013, 6, 3182–3208. [Google Scholar] [CrossRef]
  26. Murphy, D.J.; Carbajales-Dale, M.; Moeller, D. Comparing Apples to Apples: Why the Net Energy Analysis Community Needs to Adopt the Life-Cycle Analysis Framework. Energies 2016, 9, 917. [Google Scholar] [CrossRef]
  27. Mahmud, M.P.; Farjana, S.H. Design and Construction of Refrigerant Charge Level Detecting Device in HVAC/R System with Microcontroller. Int. J. Eng. Adv. Technol. (IJEAT) 2012, 1, 309–314. [Google Scholar]
  28. Carlsson, A.; Rönnbäck, P.; Leiva, J.C.; Martin, A. Life-cycle assessment of solar thermal systems with flat-plate and evacuated tube collectors—A Swedish case study. Renew. Energy 2014, 66, 552–563. [Google Scholar]
  29. Li, C.; Shi, J.; Liu, Y.; Wang, P. A simple dispatch strategy for battery storage system in wind power generation system. Int. J. Electr. Power Energy Syst. 2011, 33, 1209–1217. [Google Scholar]
  30. Nguyen, T.T.; Nguyen, T.A.; Hong, T.D. Optimal battery sizing for battery energy storage system in wind power generation system. Int. J. Electr. Power Energy Syst. 2015, 73, 935–945. [Google Scholar]
  31. Wee, J.H. Power flow control of hybrid battery-supercapacitor energy storage system with zero net charge regulation. IEEE Trans. Smart Grid, 2013, 4, 2165–2173. [Google Scholar]
  32. Markvart, T.; Castañer, L. (Eds.) Overview of Potential Hazards. In Practical Handbook of Photovoltaics: Fundamentals and Applications; Elsevier Advanced Technology: Amsterdam, The Netherlands, 2003. [Google Scholar]
  33. Mcdonald, N.C.; Pearce, J.M. Producer responsibility and recycling solar photovoltaic modules. Energy Policy 2010, 38, 7041–7047. [Google Scholar] [CrossRef]
  34. Gottesfeld, P.; Cherry, C.R. Lead emissions from solar photovoltaic energy systems in China and India. Energy Policy 2011, 39, 4939–4946. [Google Scholar] [CrossRef]
  35. Baharwani, V.; Meena, N.; Dubey, A.; Sharma, D.; Brighu, U.; Mathur, J. Life cycle inventory and assessment of different solar photovoltaic systems. In Proceedings of the 2014 Power and Energy Systems: Towards Sustainable Energy, Bangalore, India, 13–15 March 2014; pp. 1–5. [Google Scholar]
  36. Giacchetta, G.; Leporini, M.; Marchetti, B. Evaluation of the environmental benefits of new high value process for the management of the end of life of thin film photovoltaic modules. J. Clean. Prod. 2013, 51, 214–224. [Google Scholar] [CrossRef]
  37. Cyrs, W.D.; Avens, H.J.; Capshaw, Z.A.; Kingsbury, R.A.; Sahmel, J.; Tvermoes, B.E. Landfill waste and recycling: Use of a screening-level risk assessment tool for end-of-life cadmium telluride (CdTe) thin-film photovoltaic (PV) panels. Energy Policy 2014, 68, 524–533. [Google Scholar] [CrossRef]
  38. Park, J.; Park, N. Wet etching processes for recycling crystalline silicon solar cells from end-of-life photovoltaic modules. RSC Adv. 2014, 4, 34823–34829. [Google Scholar] [CrossRef]
  39. Amponsah, N.Y.; Troldborg, M.; Kington, B.; Aalders, I.; Hough, R.L. Greenhouse gas emissions from renewable energy sources: A review of lifecycle considerations. Renew. Sustain. Energy Rev. 2014, 39, 461–475. [Google Scholar] [CrossRef]
  40. Mahmud, M.P.; Lee, J.; Kim, G.; Lim, H.; Choi, K.B. Improving the surface charge density of a contact-separation-based triboelectric nanogenerator by modifying the surface morphology. Microelectron. Eng. 2016, 159, 102–107. [Google Scholar] [CrossRef]
Figure 1. Colour-coding to denote the degree of ‘supply constraint’.
Preprints 105664 g001
Figure 2. External and internal costs associated with industrial production.
Preprints 105664 g002
Figure 3. (A) Bitrode: Battery testing device comprising of VisuaLCN (Life Cycle Network) Software. (B) Regenerative Battery Pack Test System.
Preprints 105664 g003
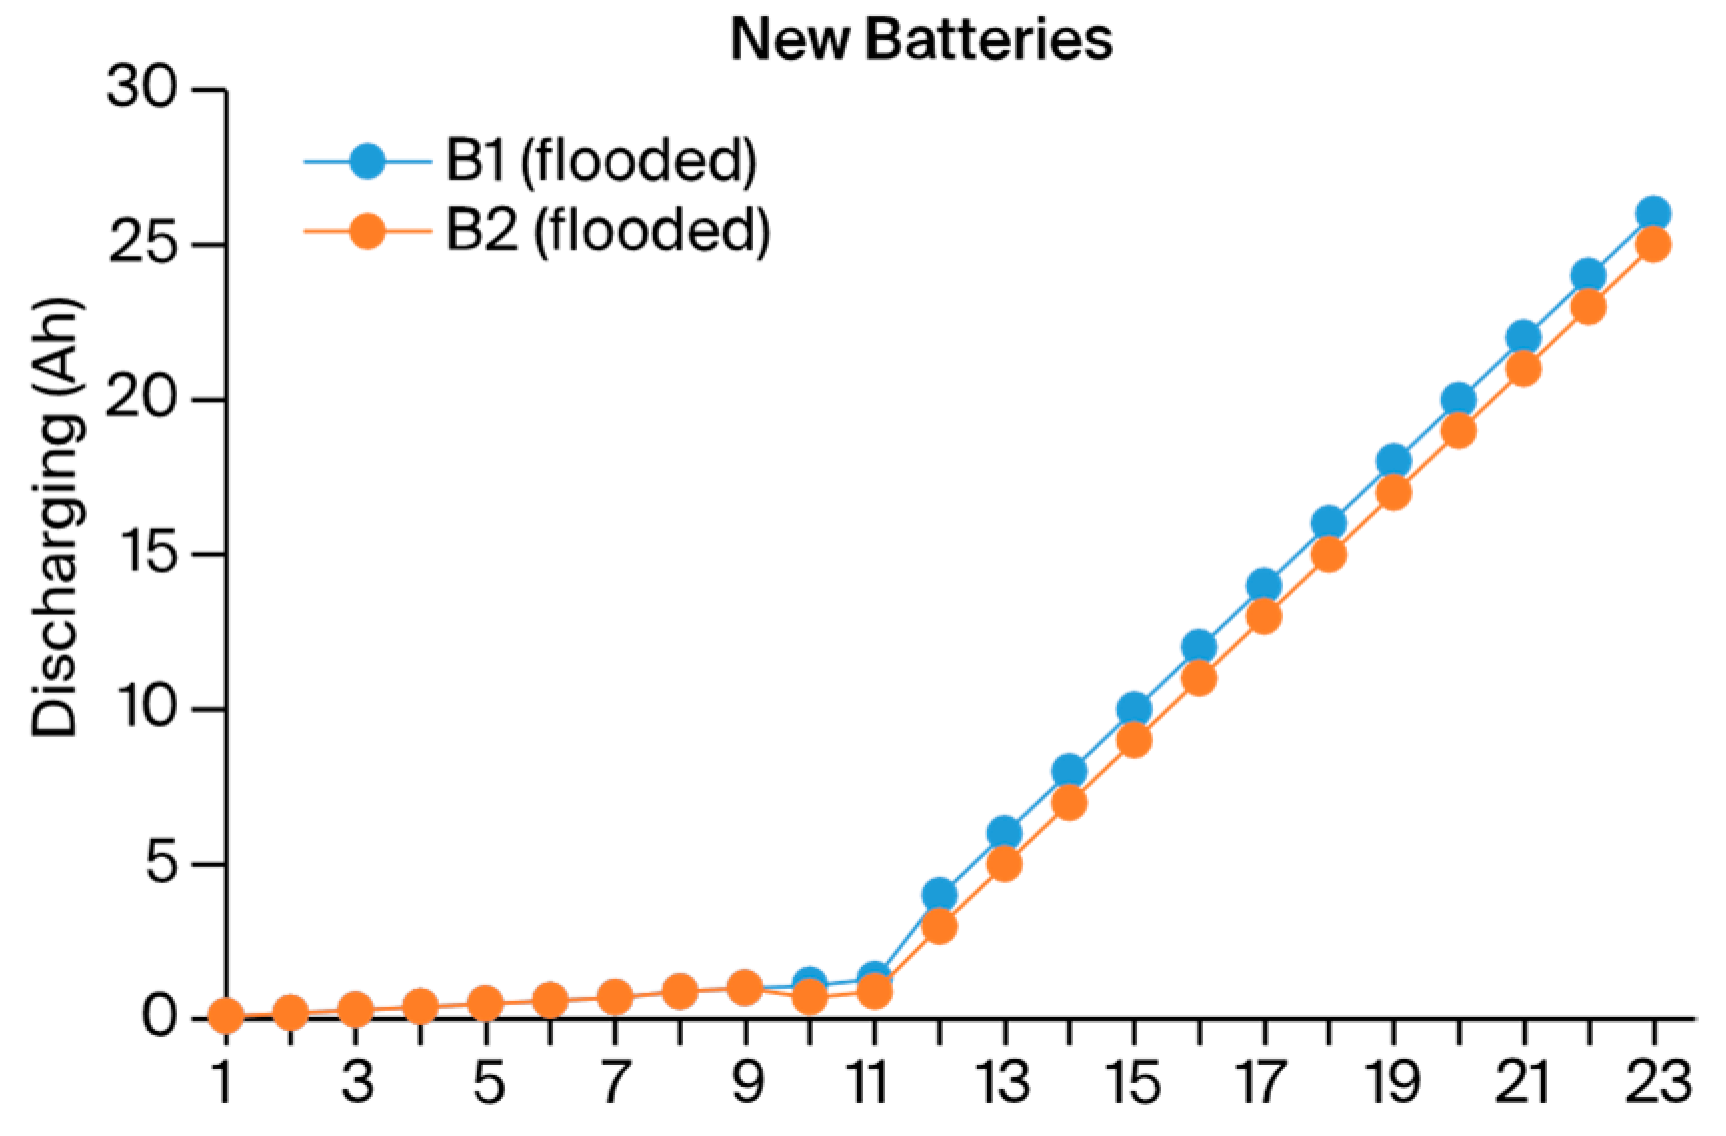
Figure 4. Capacity (Ah) Variation of two (B1, B2 flooded) lead acid batteries during first discharge for 6 h. (Leccisi, Raugei, & Fthenakis 2016).
Preprints 105664 g004
Figure 10. (A): Capacity (Ah) and Internal Temperature (Deg.C) of samples at 270 °C (B): Voltage–time plot at 270 °C (Mahmud, M.P.; Farjana, 2012).
Preprints 105664 g010
Disclaimer/Publisher’s Note: The statements, opinions and data contained in all publications are solely those of the individual author(s) and contributor(s) and not of MDPI and/or the editor(s). MDPI and/or the editor(s) disclaim responsibility for any injury to people or property resulting from any ideas, methods, instructions or products referred to in the content.
Copyright: This open access article is published under a Creative Commons CC BY 4.0 license, which permit the free download, distribution, and reuse, provided that the author and preprint are cited in any reuse.
Prerpints.org logo

Preprints.org is a free preprint server supported by MDPI in Basel, Switzerland.

Subscribe

© 2024 MDPI (Basel, Switzerland) unless otherwise stated