1. Introduction
Phosphorus (P) is essential for various physiological processes in plants, including the constitution of phospholipids, nucleic acid, adenosine triphosphate, enzymes, and plant dry matter [
1,
2]. The application of P-containing fertilizers has been instrumental in increasing global food production, with significant contributions to higher agricultural productivity and global food security [
3,
4]. However, P has to be rationally managed due to its limited and nonrenewable nature [
5,
6]. Generally, plants can only use 10-25% of the P applied to soil, with the remainder becoming unavailable due to poor solubility, strong fixation to metal cation complexes and slow diffusion in soil [
1,
7]. All of these have resulted in low P use efficiency and crop output, along with waterbody eutrophication and soil degradation [
1,
8].
Maize (
Zea mays L.) is an important staple crop in Afghanistan after wheat and rice, with a yearly production of ~0.27 million tons from 0.14 x 10
6 ha of plantation [
9]. However, its productivity lags significantly behind the global average, at a 49% lower rate [
10] due to various factors, including high soil pH, low P and nitrogen (N) availability, organic matter, soil moisture, and fertilizer input, and poor field management [11-13]. While Afghanistan utilizes a total of 7282 tons of P fertilizer (mostly diammonium phosphate) in 2021 to increase crop productivity [
10], current application methods like broadcasting and shallow placement increases the risk of P stratification in soil surface, and soil erosion and water runoff transport concentrated P to water bodies and then eutrophication [14-16].
To reduce P losses in soil surface while improve P use efficiency, deep band placement of P fertilizer is recommended as it increases P availability in root zone [15-17]. Applying fertilizer in moist soil also helps increase nutrient mobility and availability for plant uptake [
18,
19]. This is especially important in semi-arid environments, where high evaporation and temperature reduce soil moisture in the upper soil layer, resulting in restricted nutrient diffusion, lower P availability to root, reduced water use efficiency and consequently, lower crop growth rate and yield [
20,
21]. Additionally, placing chemical fertilizers in soil subsurface could ensure that they remain in moist conditions for a longer period during the crop growth cycle [
20,
21].
The present study hypothesized that deep fertilizer placement could (1) significantly enhance crop nutrient uptake, particularly immobile nutrients like P and consequently, and increase tissue P concentration and accumulation, and (2) increase the fertilizer’s proximity to seeds and/or roots that could result in a better utilization of fertilizer than broadcast or side band. These hypotheses are based on the fact that deep fertilizer placement improves P fertilizer efficiency in soils with high P fixing capacity and provides nutrient access in the early growing season to crop roots for vigorous plant growth and development [
22]. It also encourages root proliferation in nutrient-rich patches [
20], while broadcast or shallow application reduces P availability to crop roots due to lower moisture in surface soil [
18,
23]. Importantly, Grant and Flaten [
17] showed that deep fertilizer of NH
4, urea or (NH
4)
2SO
4 along with P fertilizer increases P uptake compared to individual N or P application.
To test these assumptions, a two-year pot experiment was conducted using nine different combinations of N (kg N ha-1 as urea) and P (kg P ha-1 as superphosphate) fertilization rates (N112P45, N112P60, N112P75, N150P45, N150P60, N150P75, N187P45, N187P60, N187P75 kg ha-1), with three different fertilizer placement methods (deep band, side band, and broadcast). The application corresponded to the growth and productivity of two maize hybrid cultivars of Xida-789 and Xida-211 in 2018 and 2019, respectively. Therefore, this study aimed to determine (1) the ideal NH4+-N and H2PO4--P fertilization rates, (2) a rational fertilizer placement method by comparing the three proposed fertilizer placements of broadcasting, side banding, and deep banding, and then (3) correlations between NH4+-N and H2PO4 rates and placement methods for enhancing crop growth and productivity.
2. Results
2.1. Leaf P Concentration and Accumulation
2.1.1. Leaf P Concentration
Leaf P concentration (g kg
-1) in the no-fertilization control was significantly higher at the V8 (45 DAS) growth stage than at the VT (60 DAS) and R6 (115 DAS) growth stages (
Figure 1A, E and I).
Across various growth stages, leaf P concentration significantly differed for the same N and P fertilization rates and with the same fertilizer placement. Specifically, leaf P was significantly greater at 45 DAS than at 60 DAS and 115 DAS for N112P45, N150P45, N187P45, N187P60 and N112P75 under all placement methods (Figures 1B, C, D, H and J), N112P60, N150P75 under broadcast and side band, and N150P60 and N187P75 under side band (Figures 1F, G, K and L). Meanwhile, the highest significant leaf P concentration was observed at 45 DAS, followed by 60 DAS and the lowest at 115 DAS for N112P60 and N150P75 under deep band, as well as N150P60 and N187P75 under broadcast and deep band (Figures 1F, G, K and L).
Leaf P concentration was not significantly affected by fertilizer placement (broadcast, side band and deep band) when the same N and P fertilization rates (N112P45 and N112P60) were applied at 45 DAS, 60 DAS or 115 DAS. This was observed for N112P75 at 60 DAS and 115 DAS (Figures 1B, F and G), N150P45 at 115 DAS, N150P60 at 60 DAS and 115 DAS, N150P75 at 45 DAS and 115 DAS (Figures 1C, G and K), N187P45 and N187P60 at 60 DAS and 115 DAS, and N187P75 at 45 DAS (Figures 1D, H and L). However, deep band placement resulted in significantly higher leaf P concentration compared to broadcast placement under the combinations of N150P45, N187P45, N150P60 and N187P60 at 45 DAS, N187P75 at 60 DAS and 115 DAS, N112P75 at 45 DAS, and N150P75 at 60 DAS (Figures 1C, D, H, L, J, K).
Across all three placement methods (deep band, side band, and broadcast) at 60 DAS and 115 DAS, leaf P concentration did not differ significantly between the different N fertilization rates (N112, N150 and N187) when combined with the same P fertilization rates (P45 and P60). However, at 45 DAS, leaf P concentration was significantly higher with N187 compared to N112 fertilization across all application methods (Figures 1B, C and D). Similar results were observed for the P60 fertilization rate. Leaf P concentration did not differ significantly among the N fertilization rates under side band and broadcast placements at 60 DAS and 115 DAS except at 45 DAS where N187 resulted in a significantly greater P concentration compared to N112 across all placement methods at 60 DAS and 115 DAS (Figures 1F, G and H). Meanwhile, leaf P concentration was unaffected by different N fertilization rates for the same P75 fertilization rate across all placement methods and all time points at 45 DAS, 60 DAS or 115 DAS (Figures 1J, K and L).
Leaf P concentration increased with increasing P fertilization rates (P45, P60, P75) applied at the same N rate (N112, N150, N187). This effect was observed across various application methods and timings (Figures 1B, F, J, C, G, K, D, H, L). At 45 DAS, P75 resulted in significantly higher leaf P compared to P45 for all N rates and application methods (broadcast, side band, and deep band) except N187 under deep band (Figures 1B, F, J, C, G, K). P60 also showed higher P concentration than P45 for N112 under broadcast, side and deep band at 45 DAS, N150 under side band, and N187 under side band and broadcast (Figures 1B, F, J, C, G, K). At 60 DAS, under broadcast application, P75 maintained a significantly higher P concentration than P45 for all N rates (Figures 1B, F, J). No significant differences in leaf P concentration were observed among P fertilization rates (P45, P60, P75) at later stages (115 DAS) for any N rate or application method (Figures 1B, G, J, C, G, K, D, H, L).
2.1.2. Leaf P Accumulation
The results showed a significant increase in leaf P accumulation (mg plant
-1) over time across all fertilizer treatments (
Figure 2A-L). Both the control group and P and N fertilized groups exhibited the highest leaf P accumulation at 115 DAS and 60 DAS compared to 45 DAS (
Figure 2B-D, F-H and J-L).
Analysis of leaf P concentration revealed a clear pattern of higher accumulation with deep band placement compared to other methods. This was observed at 45 DAS for N112P45, N150P45, N187P45, N112P60 and N112P75 (Figures 2B, C, D, F and J), as was at 60 DAS for N18745 and 115 DAS for N112P45 (Figures 2B, B and D). Similarly, deep band placement led to higher P accumulation than side band and broadcast methods for N150P60, N187P60, N150P75 and N187P75 at 45 DAS, 60 DAS or 115DAS (Figures 2G, H, K and L). At 115 DAS for N150P45, deep band and side band placements resulted in similar P levels (Figures 2C). In contrast, no significant differences were observed across all placement methods for N112P45, N150P45, N112P60 and N112P75 at 60 DAS (Figures 2B, C, F and J), and N187P45, N112P60 and N112P75 at 115 DAS (Figures 2D, F and J).
The rate of P accumulation in maize leaves was not significantly affected by the different N rates (N112, N150, and N187) when P application rate was fixed at P45, regardless of the fertilizer placement method (deep band, side band, or broadcast) and at the time of harvest (45, 60, or 115 DAS) (Figures 2B, C and D). Similar pattern was also observed for P60 fertilization rate under broadcast (at 45, 60, or 115 DAS) and side band (45 DAS and 60 DAS). However, increasing the N fertilization rates did significantly influence leaf P accumulation in N187 and N150 than in N112 under deep band at 45 DAS, 60 DAS and 115 DAS, and in N187 compared to N112 under side band at 115 DAS (Figures 2F, G, and H). At P75 rate, leaf P accumulation was significantly greater in N187 compared to N112 under broadcast and side band placement at 45 DAS and 115 DAS, and across all harvest times (45, 60, and 115 DAS) under deep placement. However, no significant difference in leaf P concentrations between N rates was observed under side band and broadcast at 60 DAS (Figures 2J, K and L). Leaf P accumulation increased significantly with increasing P fertilizer rate (P75) compared to lower rates (P45 and P60) at 45 DAS for N112, N150, and N187 under side band and broadcast, N150 under side band, and N112 under deep band (Figures 2B, F, J, C, G, K, D, H and L). The same trend was also observed at 60 DAS for N112 and N187 under broadcast, and at 115 DAS for N150 under broadcast and deep band, N187 under side band (Figures 2, B, J, C, K, D and L). However, there were no significant differences in P concentration observed between P fertilization rates for N112 at 115 DAS under broadcast and side band applications, nor for N150 at 60 DAS under both broadcast and side band, and for N187 under broadcast at 115 DAS and under side band at 60 DAS (Figures 2C, G, K, D, H, L).
2.2. Stem P Concentration and Accumulation
2.2.1. Stem P Concentration
Stem P concentration (g kg
-1) showed significant decline over time in the no-fertilization control treatment (
Figure 3A, E and I). A similar trend was observed for all N and P fertilizer treatments and placement. Stem P concentration was significantly higher at 45 DAS compared to both 60 and 115 DAS for N112P75, N150P75 and N187P75 under deep band, side band, and broadcast applications (Figures 3J, K and L), as were N150P45 and N187P60 under side band and broadcast (Figures 3C and H), N187P45 under broadcast, N112P60 under deep band and broadcast, N150P60 under side band (Figures 3D, F and G), N112P45 under all placement methods, N150P45 and N187P60 under deep band (Figures 3B, C and H), N187P45 under side band and deep band, N112P60 under side band, and N187P60 under deep band (Figures 3D, F and H).
The effect of fertilizer placement (deep band, side band, and broadcast) on stem P concentration was minimal across all N (N112, N150, N187) and P (P45, P60, P75) fertilization rates at 45, 60, and 115 DAS, with no significant differences observed (Figures 3B-D, F-H and J-L). However, at 45 DAS, deep placement resulted in a significantly higher stem P concentration compared to broadcast placement for the N150P60, N187P60, N150P75 and N187P75 treatments (Figures 3G, H, K and L). Similarly, N fertilization rates (N112, N150, N187) did not significantly affect stem P concentration at any given P fertilization rate (P45, P60, P75) and placement (deep band, side band, broadcast) at 45 DAS, 60 DAS or 115 DAS, with one exception. Under deep placement at 45 DAS, maize fertilized with N187 showed a significantly greater stem P concentration compared to those receiving N112 for the same P60 treatment (Figures 3B-D, F-H and J-L).
Stem P concentration increased significantly with increasing P fertilization rates (P75 > P60 > P45) at specific N rates (N112 and N150) and placement methods. This effect was observed at 45 DAS under broadcast and side band applications (Figures 3B, F, J, C, G, K), and 115 DAS under deep band application for N112, N150 and N187 (Figures 3D, H, and L). In contrast, no significant differences in stem P concentration were found among P rates at N112 and N150 under broadcast and side band applications at 60 DAS and 115 DAS (Figures 3B, C, F, G, J, and K), N187 under broadcast at 45 DAS, 60 DAS and 115 DAS (Figures 3D, H, L), side band and deep band at 60 DAS, and N112 and N150 under deep band at 60 DAS (Figures 3B, F, J, C, G, K, D, H and L).
2.2.2. Stem P Accumulation
Maize grown without fertilizer (control group) showed the highest stem P accumulation (mg plant
-1) at 115 DAS, followed by 60 DAS and then 45 DAS (
Figure 4A, E and I).
Across all fertilization regimes (N and P rates and placement methods), stem P accumulation was significantly higher at 115 DAS and 60 DAS compared to 45 DAS. This pattern was observed for N112P45, N150P45, N187P45, N112P60, N187P60, N112P75 under deep band, side band and broadcast (Figures 4B, C, D, F, H and J), N150P60 and N187P75 under broadcast and side band (Figures 4G and L), and N150P75 under broadcast (Figures 4K). For N150P60 and N187P75 fertilized maize, deep band application resulted in significantly higher stem P accumulation at 115 DAS compared to 60 DAS, which in turn was higher than 45 DAS (Figures 4G, L and K). A similar trend was also observed for N150P75 with side band and deep band placements.
Deep band placement resulted in significantly greater stem P accumulation compared to side band and broadcast applications under N150P60, N187P60, N150P75 and N187P75 at 45 DAS, 60 DAS or 115 DAS (Figures 4G, H, K and L). Similar trend was also observed for N112P45, N112P60 and N112P75 at 45 DAS (Figures 4B, F and J), N150P45 and N187P45 at 45 DAS and 115 DAS (Figures 4C and D). However, no significant difference was found between placement methods (deep band, side band, broadcast) for N112P45, N112P60 and N112P75 at 60 DAS and 115 DAS (Figures 4B, F and J), and N150P45 and N187P45 at 60 DAS (Figures 4C-D).
Among different N rates, stem P accumulation was significantly greater at N187 than N112 for the same P45 under broadcast at 45 DAS; with the same P60 under broadcast at 45 DAS and 115 DAS, under side band at 45 DAS; and with the same P75 under broadcast and side band at 45 DAS (Figures 4B and D, F and H, J and L). Moreover, stem P accumulation was significantly higher at N187 and N150 than N112 for the same P60 under Deep band at 45 DAS, 60 DAS or 115 DAS; and with the same P75 under deep band at 45 DAS, 60 DAS or 115 DAS (Figures 4B-D, F-H and J-L). However, no significant difference was observed among different N rates with the same P45 at 60 DAS and 115 DAS; with the same P60 under broadcast at 60 DAS, and under side band at 60 DAS and 115 DAS; and with the same P75 under broadcast and side band at 60 DAS and 115 DAS under all fertilizer placements (Figures 4B-D, F-H and J-L).
For maize receiving the same amount of N fertilizer, those that received the highest P rate (P75) accumulated more P in their stems compared to those receiving lower P rates (P45 and P60) at 45 DAS. This trend was observed across all fertilizer placement methods (broadcast, side band, and deep band) for N150 and N187 (Figures 4C, G, K, D, H and L). Similarly, for N112, P75 resulted in greater stem P accumulation compared to P45 across all placement methods at 45 DAS (Figures 4B, F, and J). However, at 60 and 115 DAS, the effect of P fertilization rate on stem P accumulation diminished as there were no significant differences between P45, P60, and P75 for any N rate or fertilizer placement method (Figures 4B, C, D, F, G, H, J, K, L).
2.3. Root P Concentration and Accumulation
2.3.1. Root P Concentration
Maize grown without fertilizer (control) showed higher concentrations of P (g kg
-1) in their roots at 60 DAS (
Figure 5A, E and I). Likewise, higher root P concentration at 60 DAS was also observed for several combinations, namely N112P60, N150P75 and N187P75 under broadcast placement (Figures 5C, K and L), N150P45 under broadcast and deep band (Figures 5C), and N112P60 under broadcast (Figures 5F). However, root P concentration did not differ significantly between 60 DAS and 115 DAS for N112P45, N187P45, N150P60 and N187P60 under all three placement methods (Figures 5B, D, G and H); N112P60, N150P75 and N187P75 under side band and deep band (Figures 5F, K and L); N150P45 under side band, and N112P75 under broadcast and deep band (Figures 5C and J).
Fertilizer placement methods (deep band, side band, or broadcast) did not significantly affect root phosphorus concentration at either 60 DAS or 115 DAS for any fertilizer combination tested (N112P45, N150P45, N187P45, N112P60, N150P60, N187P60, N112P75, N150P75 and N187P75) (Figures 5B-D, F-H and J-L).
N fertilizer rate (N112, N150, or N187) also had no significant impact on root P concentration, regardless of the P rate (P45, P60 or P75) at both 60 and 115 DAS. The only exception was a higher concentration observed in N187 compared to N112 for the same P60 rate under deep band placement at 115 DAS (Figures 5F and H). P fertilizer rate (P45, P60, and P75) also did not affect root P concentration when applied with the same N rate (N112, N150 or N187) and placement method at 60 and 115 DAS. The sole exception was a significantly greater concentration in P75 compared to P45 for N150 under deep band at 115 DAS (Figures 5B, F, J, C, G, K and D, H and L).
2.3.2. Root P Accumulation
Maize grown without fertilizer (control) showed no difference in P accumulation (g plant
-1) in their roots 60 DAS and 115 DAS (
Figure 6A, E and I). Fertilizer placement had a significant effect, with deep band placement resulted in maize accumulating higher root P compared to those applied under side band or broadcast placement for N150P60 and N187P60 at 60 DAS and 115 DAS, N150P75 at 60 DAS, N187P75 at 60 DAS and 115 DAS (Figures 6G, H, K and L), N150P45 at 60 DAS and N150P75 at 115 DAS (Figures 6C and K). For the combination of N fertilization rates (N112, N150, N187) with P45, no significant differences in root P accumulation across all placement methods at 60 and 115 DAS (Figures 6B, C, and D). Similarly, root P accumulation was not significantly different among different N fertilization rates for the same P fertilization rate either at P60 or P75 under side band and broadcast at 60 DAS and 115 DAS, but the combination of N187 and N150 rates with P75 and P60 resulted in higher root P accumulation under deep band placement at 60 and 115 DAS (Figures 6F, G, H, J, K and L).
Meanwhile, increasing P fertilizer rates from P45 to P75 did not significantly affect root P accumulation at two different application methods (broadcast and side band) and for three N rates (N112, N150, N187) at 60 and 115 DAS. This was also observed for N112 with deep band application at 45 DAS (Figures 6B, F, J, C, J, K, D, H and L). However, under deep band application, significantly greater root P accumulation was observed in P75 compared to P45 for N150 at both 60 and 115 DAS, and for N187 at 115 DAS (Figures 6C, K, D and L). For N187 at 60 DAS, both P75 and P60 resulted in higher root P accumulation compared to P45 (Figures 6D, H and L).
2.4. Seed P Concentration and Accumulation
2.4.1. Seed P concentration
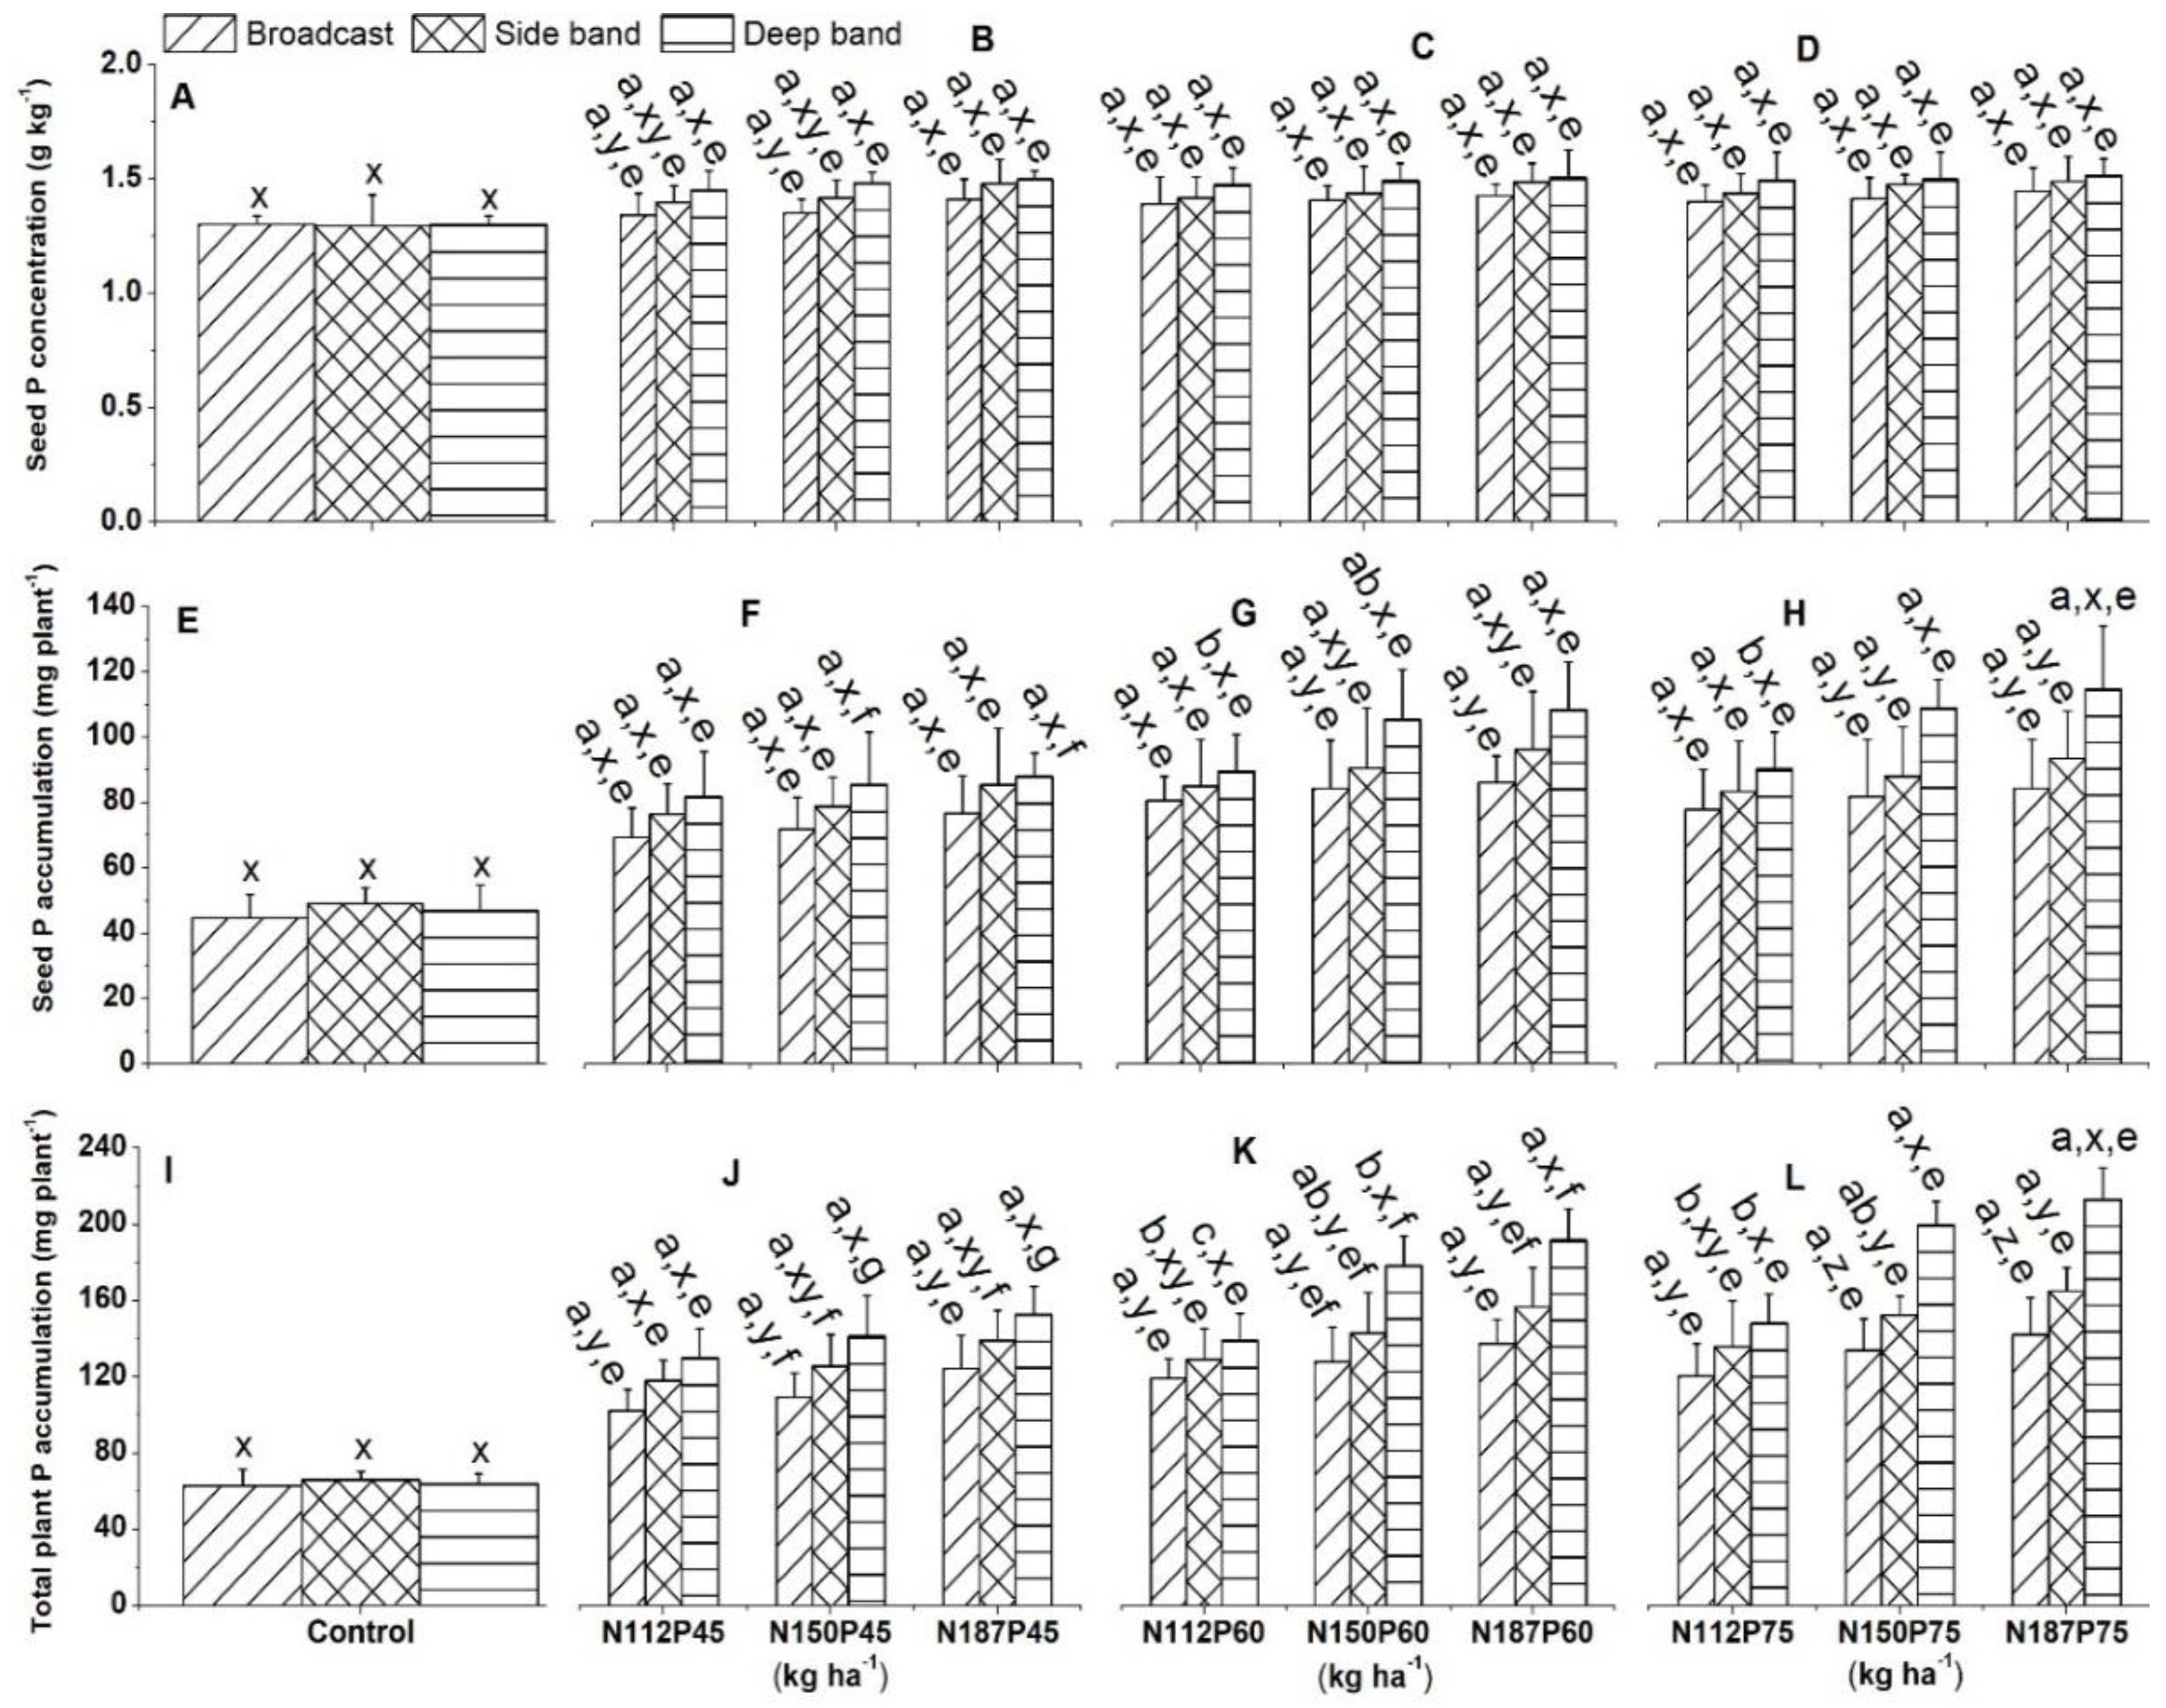
In pots with no fertilizer was applied (control treatment), seed P concentration did not differ significantly between the deep band, side band, and broadcast placements at 115 DAS (
Figure 7A). When fertilizer was applied, seed P concentration was significantly higher with deep band placement compared to broadcast placement for the lower N and P rates (N112P45 and N150P45) (
Figure 7B). However, the effect of deep band placement diminished when the higher N and P rates (N187P45, N112P60, N150P60, N186P60, N112P75, N150P75, N187P75) were applied (Figures 7C and D).
2.4.2. Seed P accumulation
In the control pots without fertilizer, seed P accumulation (mg plant-1) levels were similar at 115 DAS (Figures 7E). Fertilizer application did however affect seed P accumulation. When the same rates of N and P fertilizer were applied, deep band placement resulted in significantly higher seed P accumulation compared to side band and broadcast application for the higher N and P rates (N150P60, N187P60, N150P75, and N187P75) (Figures 7G and H). However, seed P levels were similar across all three placement methods (deep band, side band, broadcast) for the lower N and P rates (N112P45, N150P45, N187P45, N112P60, N112P75) (Figures 7F, G and H).
2.5. Total plant P accumulation
Maize grown in the control pots (no fertilizer) showed no significant difference in total plant P accumulation (sum of leaf, stem, seed, and root, in mg plant-1) with those fertilized under deep band, side band, and broadcast placement (Figures 7I). When fertilizer was applied, deep placement resulted in significantly greater total plant P accumulation compared to broadcast for most fertilizer combinations (N150P45, N187P45, N112P60, N112P75) (Figures 7J, K and L). Interestingly, total plant P accumulation was significantly higher under deep band placement compared to side band and broadcast for fertilizer combinations of N150P75 and N187P75 (Figures 7L).
Total plant P accumulation among N rates (N112, N150, N187) for the same P45 rate was not significantly produced under all placement methods, as well as for the same P60 and P75 under broadcast (Figures 7J). However, total plant P accumulation was significantly greater in N187 than N112 with the same P60 and P75 under side band (Figures 7K and L), while significantly greater total P accumulation was produced in N187 followed by N150 and lower at N112 for the P60 under deep band (
Figure 7K).
Total plant P accumulation among P rates (P45, P60, P75) was significantly greater in P75 than P45 for the same N150 under broadcast and side band, as well as for the same N187 under side band (Figures 7J, K and L). However, significantly greater total P accumulation was produced in P75 followed by P60 and lower in P45 for the same N150 and N187 under deep band (Figures 7J, K and L). No significant difference was observed among different P rates for the same N112 under all placement methods (Figures 7J, K and L).
2.6. Total soil P concentration
Total soil P concentration (g kg
-1) showed varied responses to fertilization rate, placement methods, and sampling day. In the control treatment with no fertilization, no significant differences in P concentration at 60 DAS and at 115 DAS (
Figure 8A, E and I). However, total soil P concentration among different growth days for the same N and P fertilization rate and same fertilizer placement was similar at 60 DAS and 115 DAS for N112P45, N150P45, N187P45 and N187P60 under Deep band, Side band and Broadcast (Figures 8B-D and H), for N112P60, N150P60 and N112P75 under Broadcast and Side band (Figures 8F, G and J), also for N150P75 under Side band (Figures 8K), while total soil P concentration was significantly greater at 60 DAS than at 115 DAS for N112P60, N150P60 and N112P75 under Deep band, also for N187P75 under Deep band, Side band and Broadcast (Figures 8F, G, J, L).
Among different fertilizer placement for the same N and P fertilization rate, total soil P concentration was significantly greater in deep band compared to side band and broadcast placement under all combination of fertilizer rates (N112P45, N150P45, N187P45, N112P60, N150P60, N187P60, N112P75, N150P75 and N187P75) at 60 DAS, while no significant difference was observed between deep band, side band and broadcast under the same N and P fertilization rate at 115 DAS (Figures 8C-D, F-H and J-L). Similarly, no significant difference in soil P concentration between N fertilization rates (N112, N150, N187) when combined with either P45, P60, or P75 at either 60 or 115 DAS (Figures 8C-D, F-H and J-L), regardless of placement method. The only exception was a higher concentration observed with N187 compared to N112 for the P45 rate under broadcast application at 60 DAS (Figures 8C and D).
Total soil P concentration among P rates (P45, P60, P75) was significantly increased at P75 and P60 than P45 for the same N112, N150 and N187 under deep band at 60 DAS (Figures 8B, F, J, C, G, K, D, H and L), as well as at P75 than P45 for the same for the same N112 and N187 under broadcast and side band at 60 DAS (Figures 8B, F, J, D, H and L), and at P75 than P60 and P45 for the same N150 and N187 under broadcast at 60 DAS (Figures 8 G, K, D, H and L). However, total soil P concentration was similar among P rates for the same N rates and same and same placement methods (Figures 8B, F, J, C, G, K, D, H and L).
2.7. Olsen P
In the control pots with no fertilization, Olsen P (mg kg
-1) showed no significant difference at 60 DAS and 115 DAS (
Figure 9A, E and I). Across all fertilization rates and placements, Olsen P was significantly higher at 60 DAS compared to 115 DAS, as observed in N112P45, N150P45, N187P45, N150P60, N187P60, N112P75 and N187P75 under deep band, side band and broadcast (Figures 9B, C, D, G, H, J and L). Similar trend was also observed for N112P60 and N150P75 under broadcast and deep band (Figures 9F and K). However, Olsen P levels at 60 DAS and at 115 DAS were not different for N112P60 and N150P75 under side band application (Figures 9F and K).
When comparing fertilizer placements with the same N and P rates, deep band application resulted in significantly higher Olsen P levels at 60 DAS compared to side band and broadcast applications. This was observed for N112P45, N150P45, N187P45, N112P60, N150P60, N187P60, N112P75, N150P75 and N187P75 at 60 DAS (Figures 9B-D, F-H and J-L). At 115 DAS, deep band placement showed higher Olsen P compared to broadcast application for N112P45, N150P45 and N112P75 (Figures 9B, C and J). However, there were no significant differences in Olsen P levels between deep band, side band, and broadcast at 115 DAS for N187P45, N112P60, N150P60, N187P60, N150P75 and N187P75 (Figures 9D, F, G, H, K and L).
Olsen P levels in the soil were not significantly affected by the different N rates (N112, N150, N187) when applied with the same P rates (P45, P60, P75) and fertilizer placement method (deep band, side band, or broadcast) at 60 and 115 DAS (Figures 9B-D, F-H and J-L). However, at 60 DAS, N187 resulted in significantly higher Olsen P compared to N112 when P45 was applied with broadcast and side band placement (Figures 9B and D).
On the other hand, P fertilization rates significantly influenced Olsen P levels. When the N rate and placement method were constant, Olsen P was significantly higher with P75 application compared to P45 (Figures 9B, F, and J). This was observed for N112 under broadcast at both 60 and 115 DAS, under side band at 115 DAS, and under deep band at 60 DAS. Similarly, N150 and N187 also showed higher Olsen P with P75 compared to P45 under deep band, side band, and broadcast at 115 DAS (Figures 9C, D, F, G, H, and L). However, there were no significant differences in Olsen P among P fertilization rates (P45, P60, P75) for specific combinations of N rate and placement method (Figures 9B, C, F, G, H, J, and K).
2.8. Phosphorus Use Efficiency
Deep fertilizer placement significantly enhanced P uptake by the crop. This was evident in greater phosphorus agronomy efficiency (PAE) and partial factor productivity for applied P (PFPP) compared to broadcast and side band fertilization, particularly under N150P75 and N187P75, and phosphorus use efficiency (PUE) under N150P60, N187P60, N150P75, N187P75. Furthermore, for the same P rate and placement method, increasing N rates from N112 to N150 or N187 significantly enhanced both PUE and PFPP under deep band placement; this trend was not observed with broadcast or side band methods. Interestingly, at constant N rate i.e., N150 and N187, applying lower P rate (P45) resulted in a higher PFPP compared to P60 or P75 under all placement methods.
2.9. Relationships between plant tissue P accumulations and concentrations or between tissue P concentrations or accumulations and soil Olsen-P concentrations
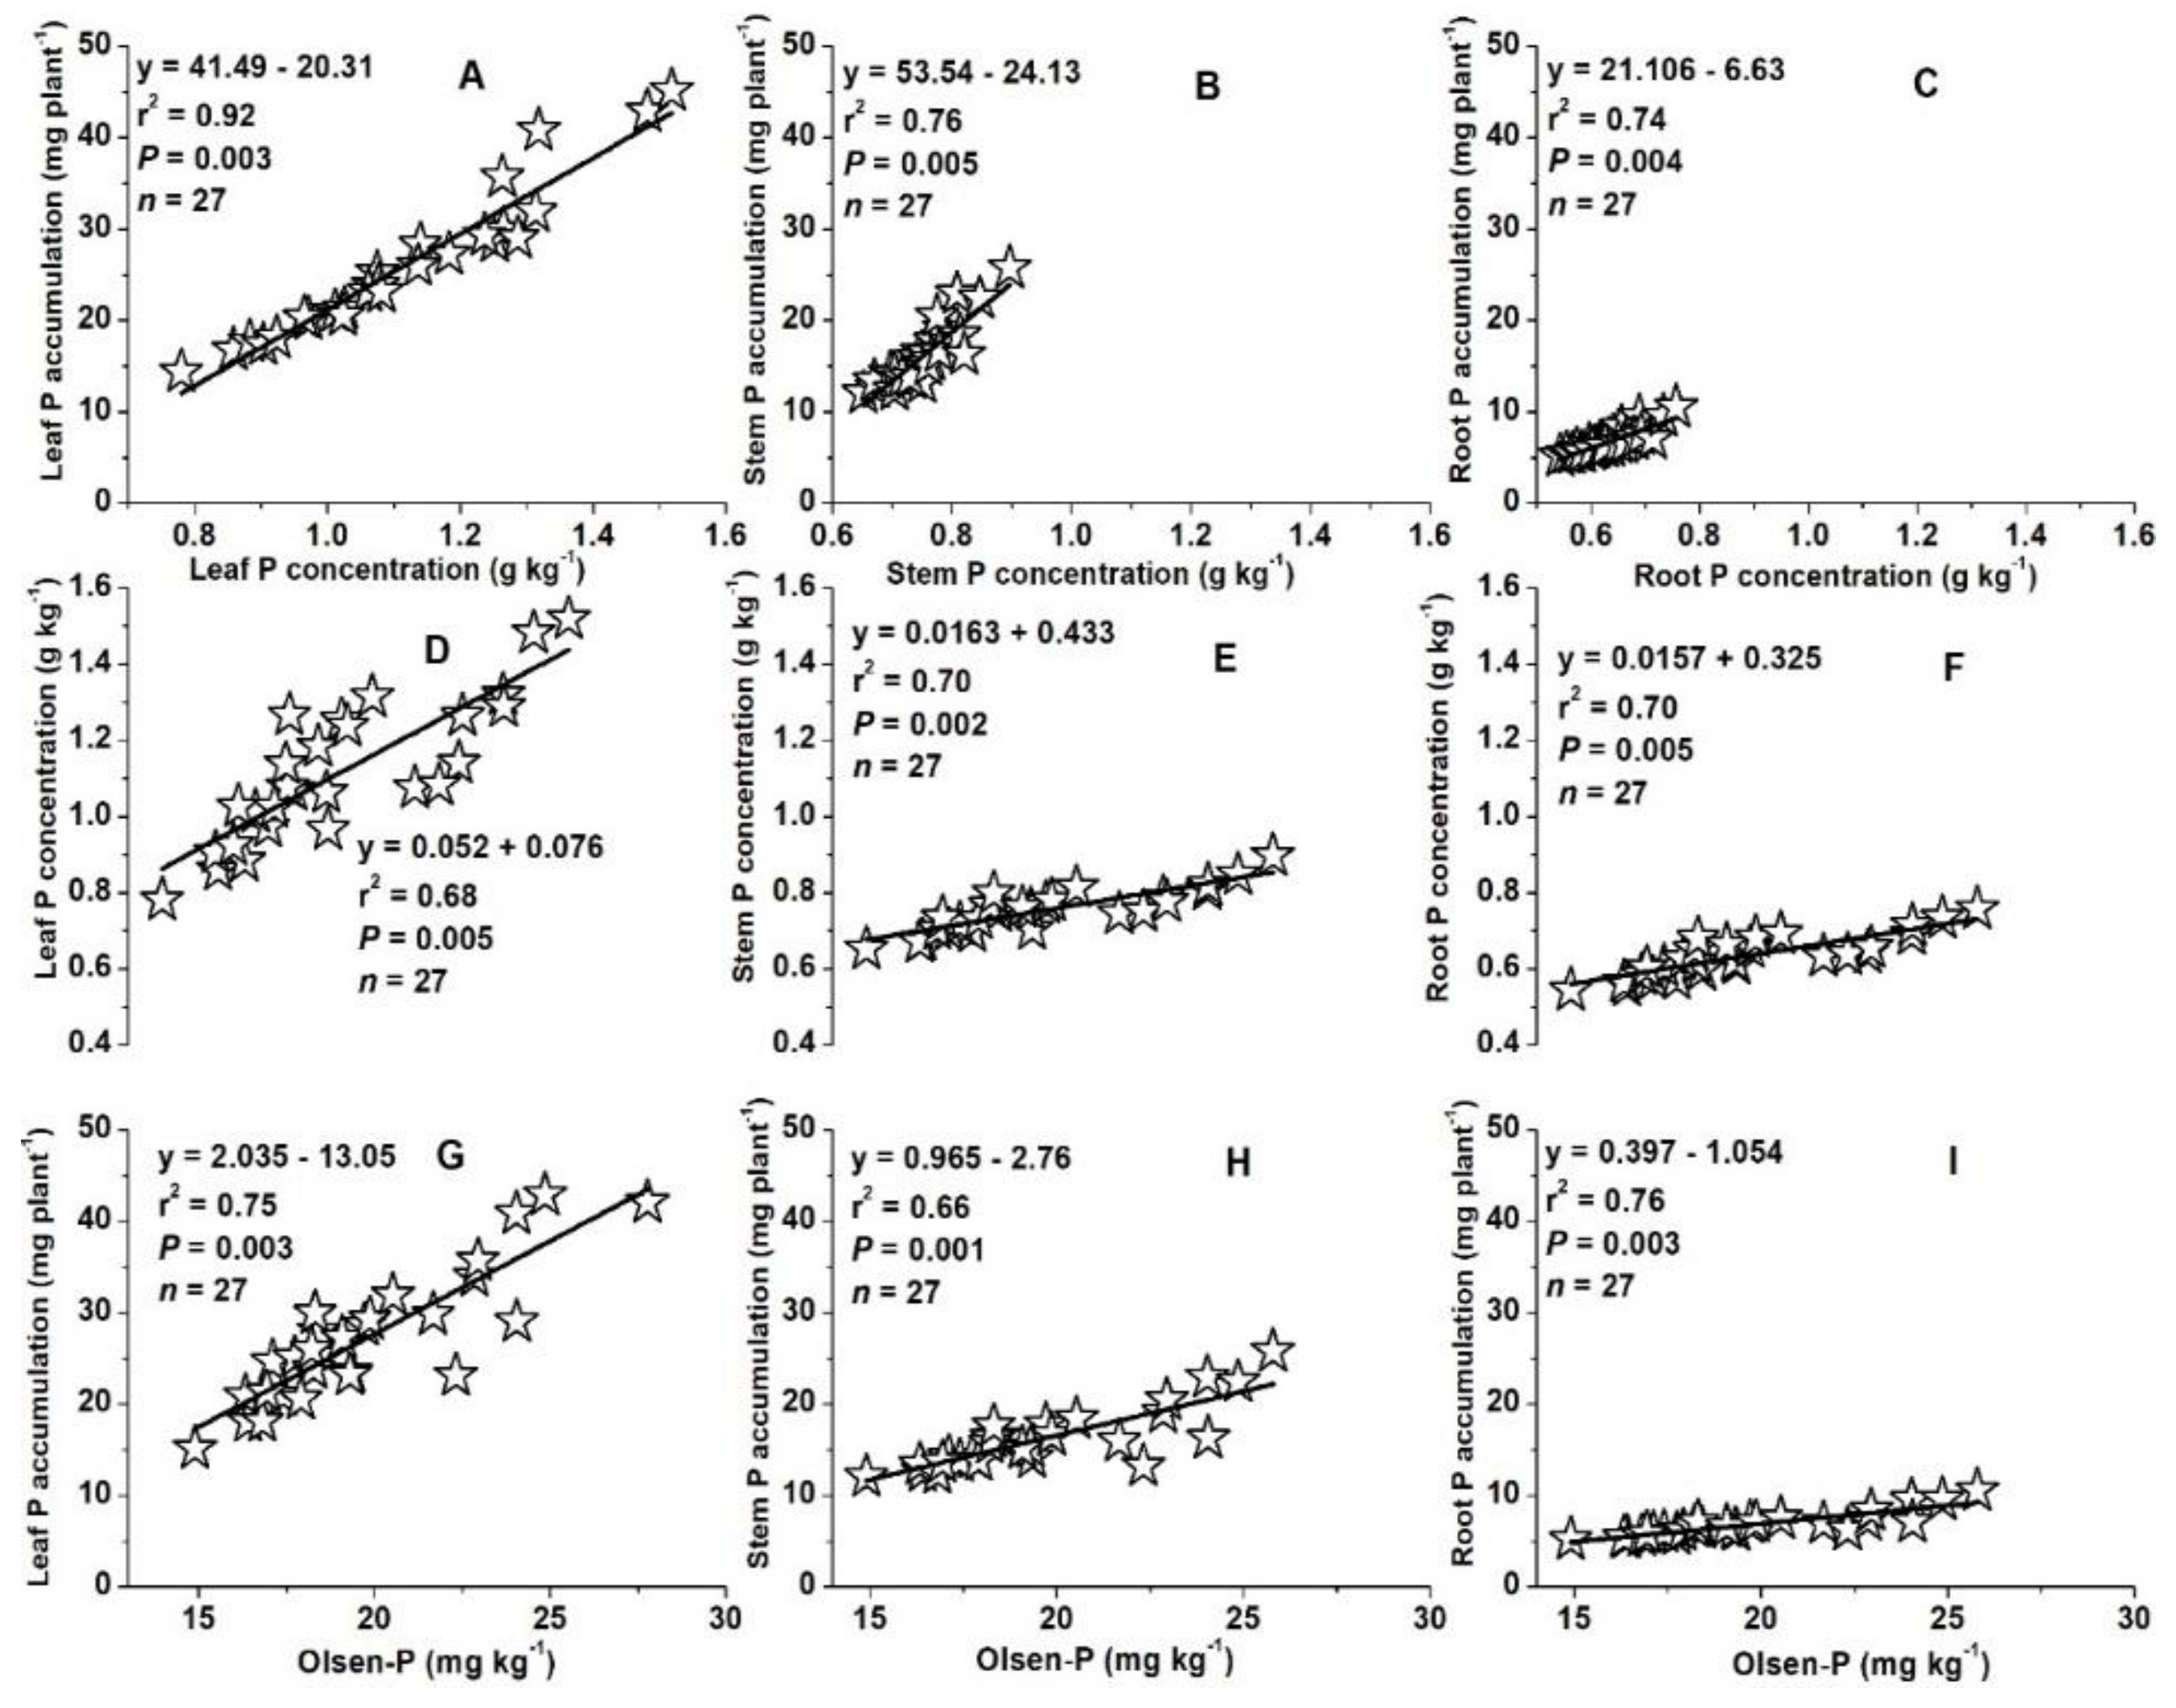
Plant tissue phosphorus (P) concentration and accumulations showed strong positive correlations in leaves, stems, and roots (
r2 =0.92 – 0.76 – 0.74,
P = 0.003 – 0.005 – 0.004) at the VT (tasseling, at 60 DAS) growth stage (
Figure 10A, B and C). Similarly, P concentrations and accumulations in each tissue (leaf, stem, and root P) were positively related to the available soil phosphorus (Olsen-P) at 60 DAS (
r2 = 0.68 – 0.70 – 0.70, 0.75 – 0.66 – 0.76,
P = 0.005 – 0.002 – 0.005, 0.003 – 0.001 – 0.003) (Figures10D – F, H - I).
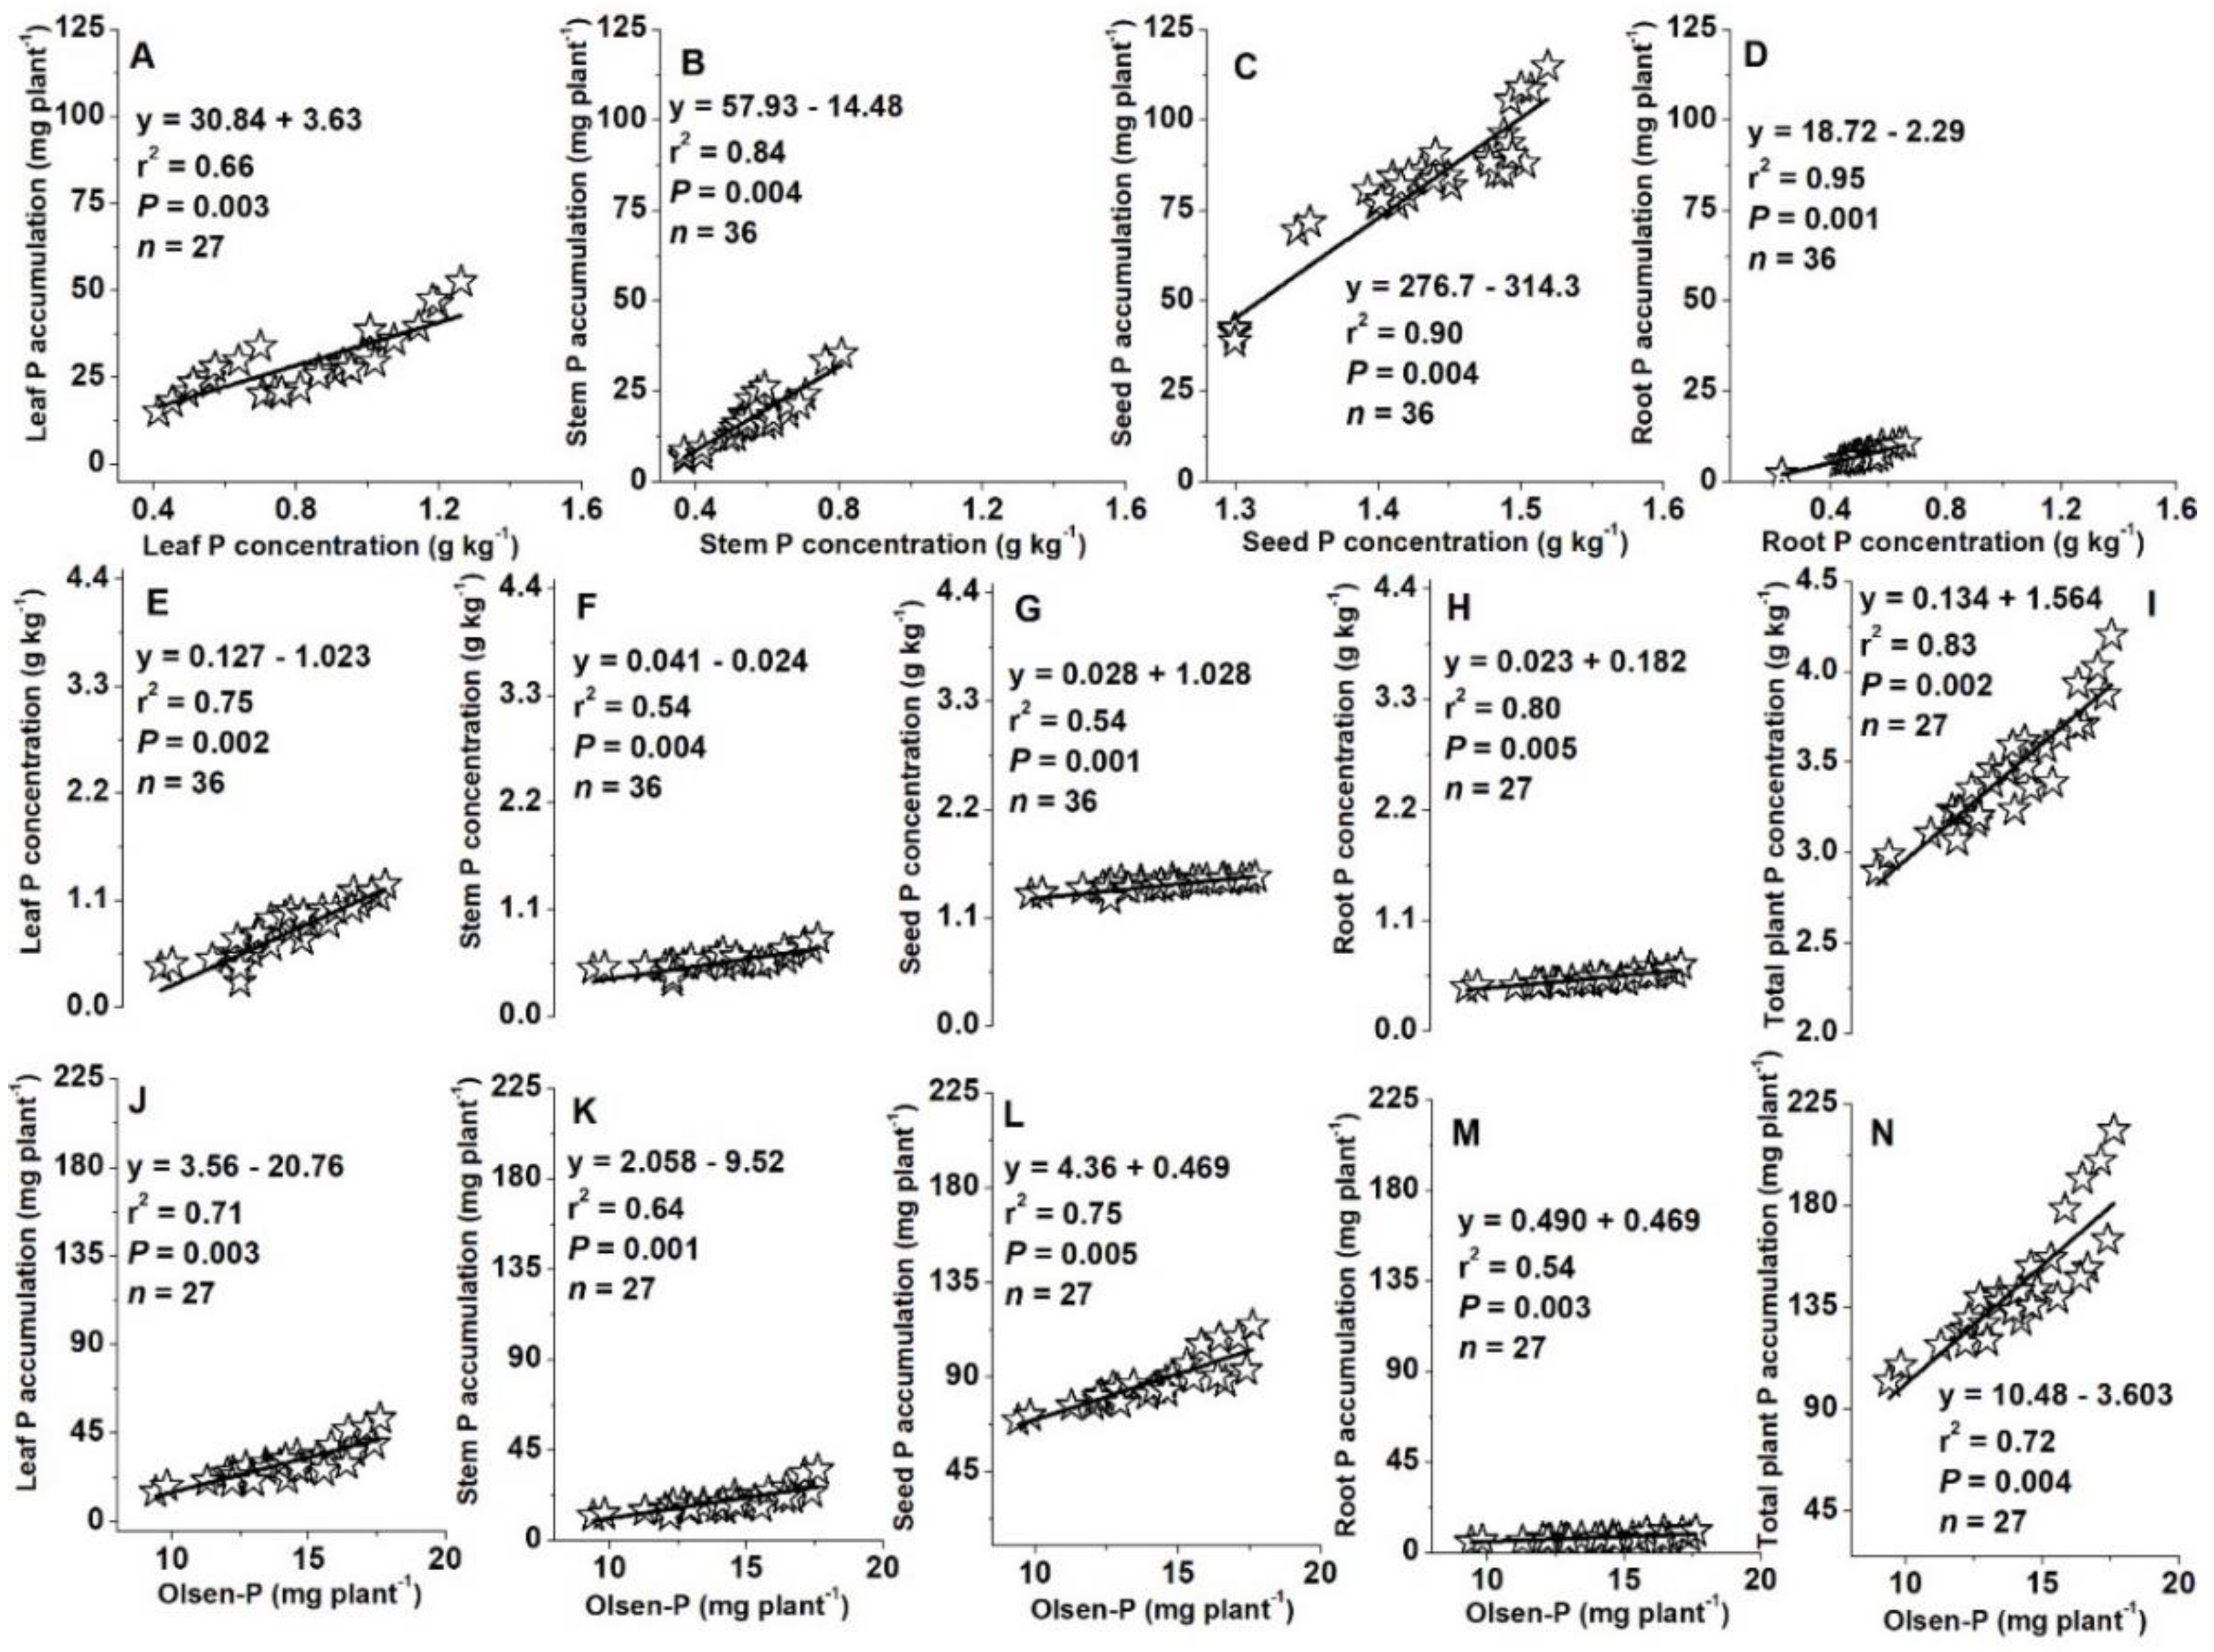
At harvest (115 DAS), positive correlations were also observed between P concentration and accumulation in leaves, stems, seeds, and roots (r
2 = 0.66 – 0.84 – 0.90 – 0.95,
P = 0.003 – 0.004 – 0.004 – 0.001,
Figure 11A, B, C and D). Likewise, Olsen-P concentration in the soil showed positive relationships with P concentrations in all plant tissues (leaf, stem, seed, root) and total plant (leaf + stem + seed + root) at 60 DAS (r
2 = 0.75 – 0.54 – 0.54 – 0.80 – 0.83,
P = 0.002 – 0.004 – 0.001 – 0.005 – 0.002, Figures 11E-I). Finally, Olsen-P concentration also showed positive correlations with P accumulation in all plant tissues and total plant at 115 DAS (r2 = 0.71 – 0.64 – 0.75 – 0.54 -0.72, P = 0.003 – 0.001 – 0.005 – 0.003 – 0.004, Figures 11J-N).
Figure 1.
Effects of phosphorus fertilization rates and fertilizer placements on leaf P concentration of maize in the in the V8 (eight-leaf) growth stage at 45 days after sowing, VT (tasseling) stage at 60 days after sowing, and R6 (physiological maturity or harvest) stage at 115 days after sowing. Differences were showed in Figures (A, E, I) for no-fertilization control treatments between days after sowing; (B-D) between different N fertilization rates and fertilizer placements for the same P45 fertilization rate; (F-H) between different N fertilization rates and fertilizer placements for the same P60 fertilization rate; (J-L) between different N fertilization rates and fertilizer placements for the same P75 fertilization. Data (means ± SE, n = 6) are averaged under three fertilizer placements for the control treatments and under the same N and P fertilizer for the same fertilizer placement since no significant differences were observed between maize varieties and years (2018 and 2019), and followed by different letters indicate significant differences between different growth days for the same N and P fertilization rate and same fertilizer placement or between 45 DAS, 60 DAS, and 115 DAS under the control (a, b, c), between different fertilizer placements for the same growth day and same N and P fertilization rate (x, y), between different N fertilization rates with the same P fertilization rate for the same fertilizer placement and plant growth day (α, β), and between different P fertilization rates with the same N fertilization rate for the same fertilizer placement and plant growth day (e, f) at P < 0.05. Abbreviations: DAS, days after sowing; N, nitrogen; P, phosphorus.
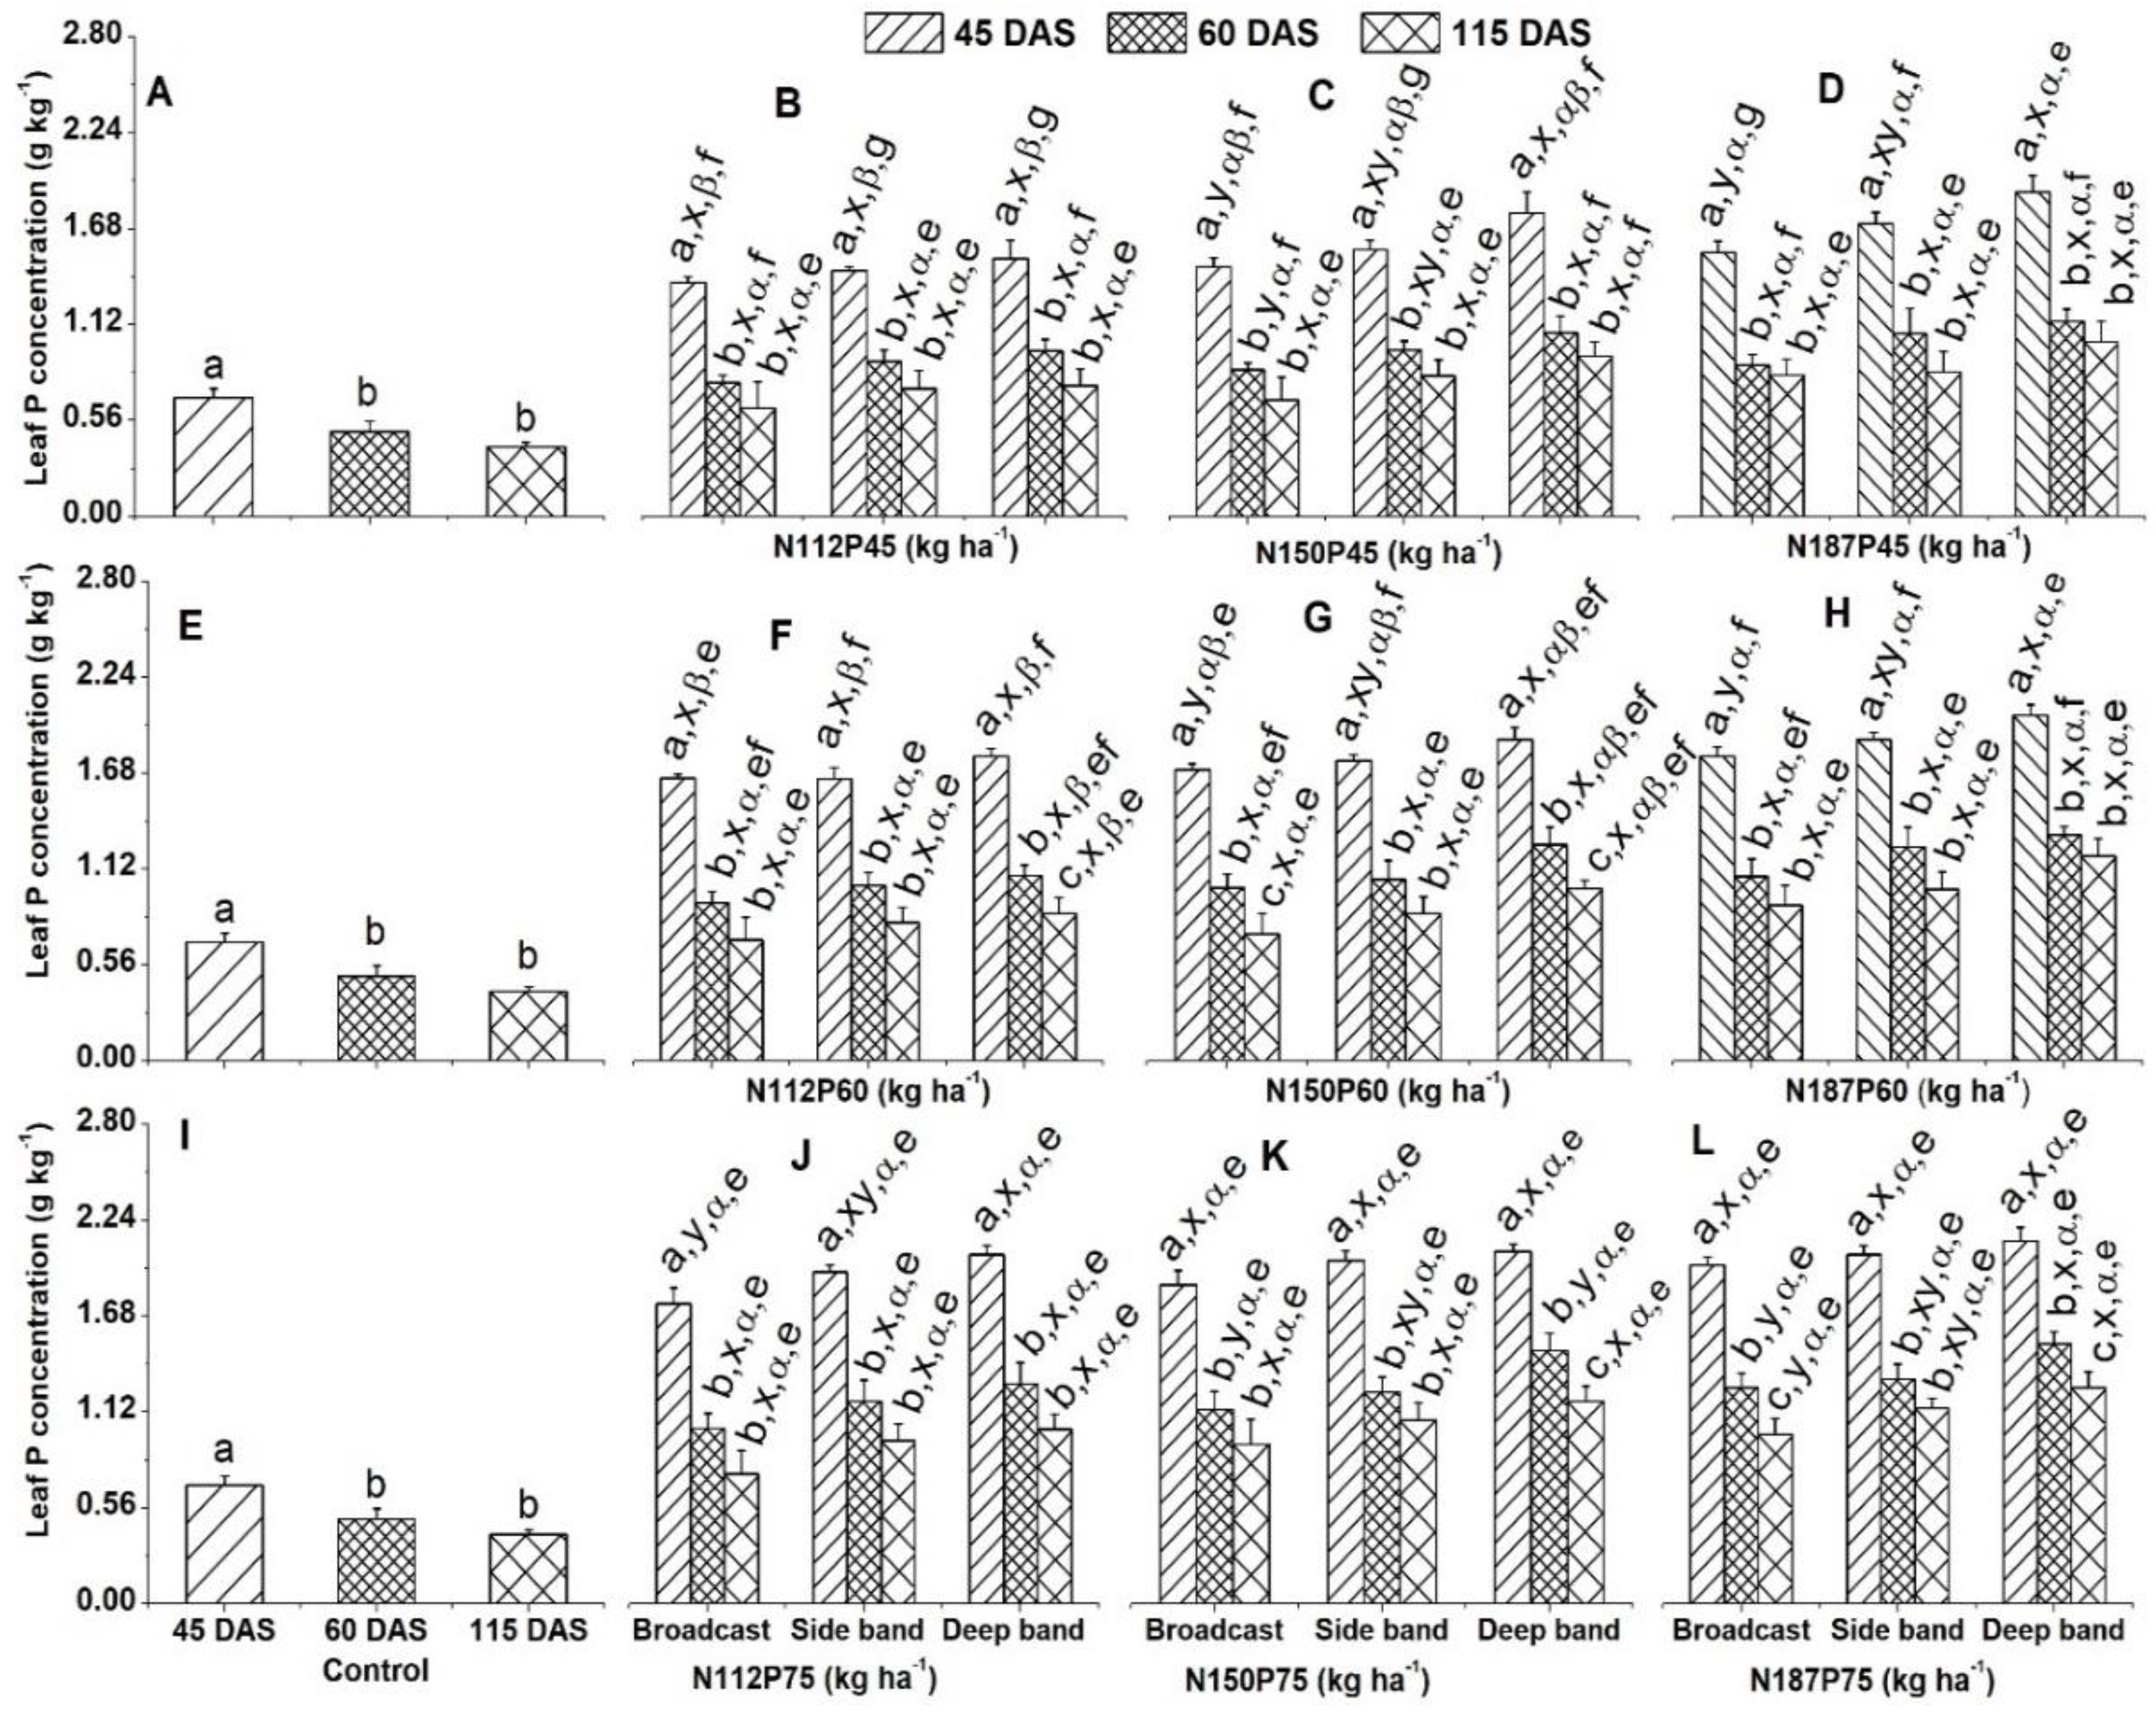
Figure 2.
Effects of phosphorus fertilization rates and fertilizer placements on leaf P accumulation of maize in the V8 (eight-leaf) growth stage at 45 days after sowing, VT (tasseling) stage at 60 days after sowing, and R6 (physiological maturity or harvest) stage at 115 days after sowing. Differences were showed in Figures (A, E, I) for no-fertilization control treatments between days after sowing; (B-D) between different N fertilization rates and fertilizer placements for the same P45 fertilization rate; (F-H) between different N fertilization rates and fertilizer placements for the same P60 fertilization rate; (J-L) between different N fertilization rates and fertilizer placements for the same P75 fertilization. Data (means ± SE, n = 6) are averaged under three fertilizer placements for the control treatments and under the same N and P fertilizer for the same fertilizer placement since no significant differences were observed between maize varieties and years (2018 and 2019), and followed by different letters indicate significant differences between different growth days for the same N and P fertilization rate and same fertilizer placement or between 45 DAS, 60 DAS, and 115 DAS under the control (a, b, c), between different fertilizer placements for the same growth day and same N and P fertilization rate (x, y), between different N fertilization rates with the same P fertilization rate for the same fertilizer placement and plant growth day (α, β), and between different P fertilization rates with the same N fertilization rate for the same fertilizer placement and plant growth day (e, f) at P < 0.05. Abbreviations: DAS, days after sowing; N, nitrogen; P, phosphorus.
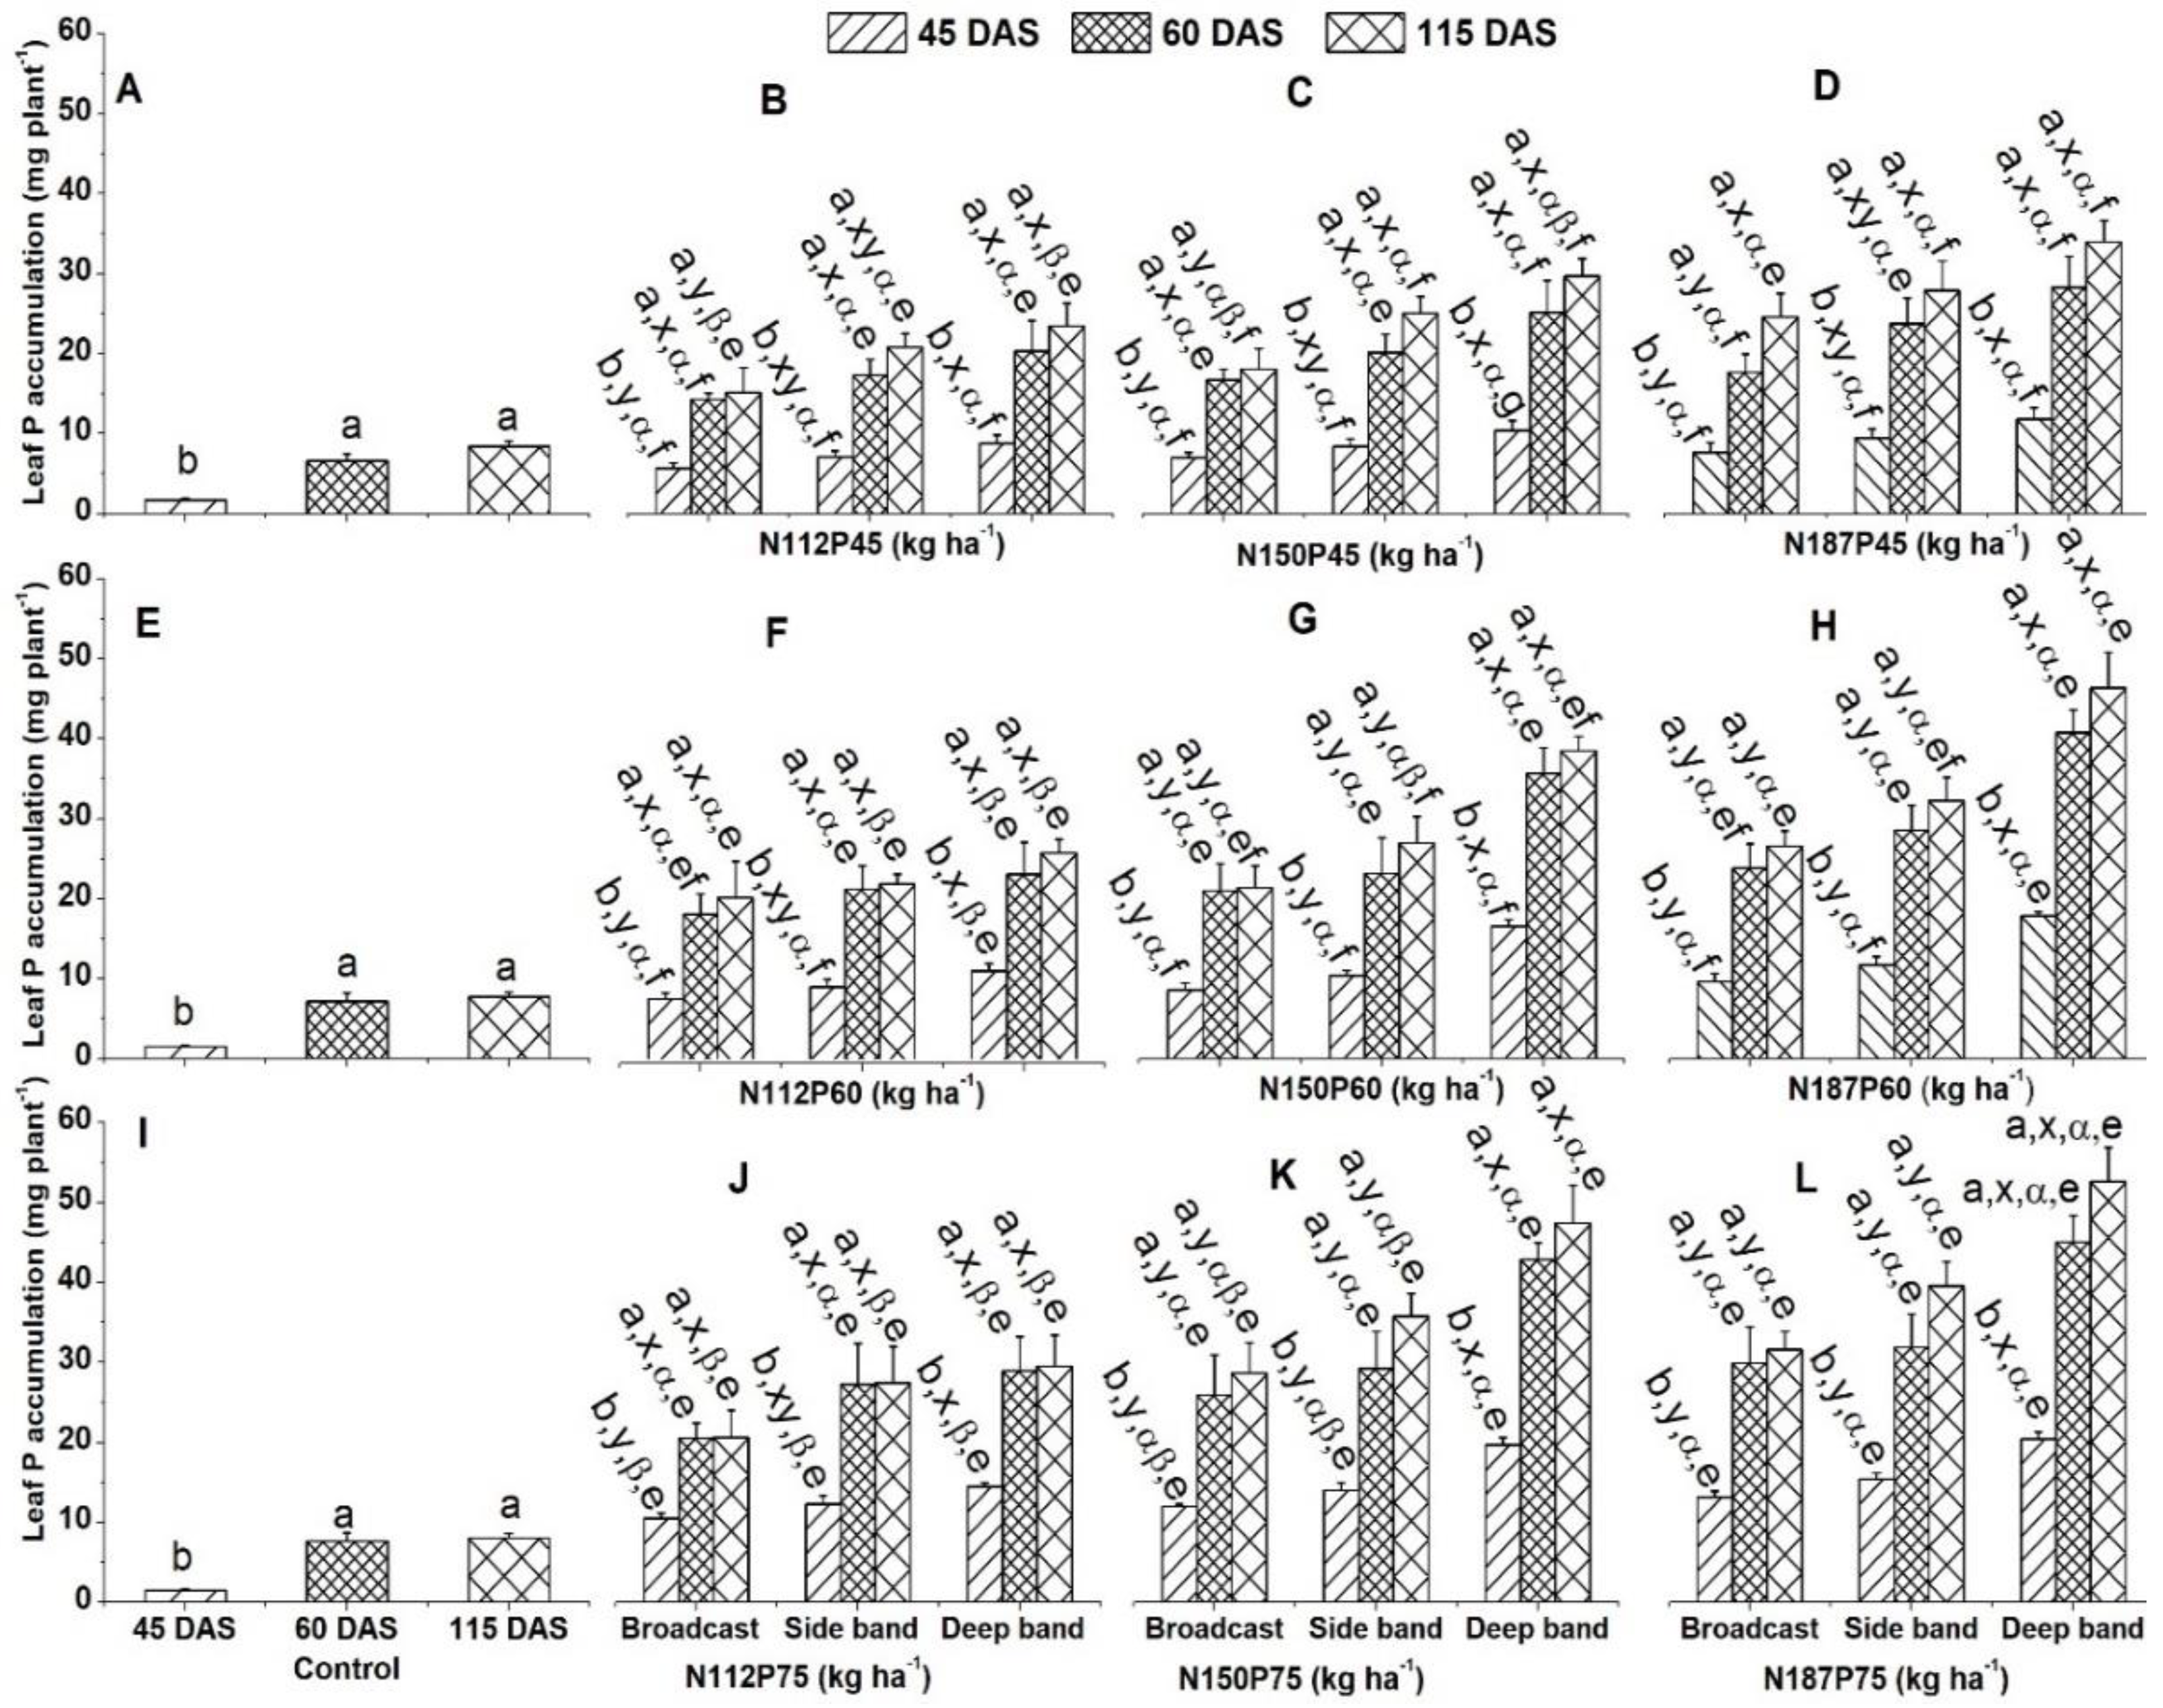
Figure 3.
Effects of phosphorus fertilization rates and fertilizer placements on stem P concentration of maize in the V8 (eight-leaf) growth stage at 45 days after sowing, VT (tasseling) stage at 60 days after sowing, and R6 (physiological maturity or harvest) stage at 115 days after sowing. Differences were showed in Figures (A, E, I) for no-fertilization control treatments between days after sowing; (B-D) between different N fertilization rates and fertilizer placements for the same P45 fertilization rate; (F-H) between different N fertilization rates and fertilizer placements for the same P60 fertilization rate; (J-L) between different N fertilization rates and fertilizer placements for the same P75 fertilization. Data (means ± SE, n = 6) are averaged under three fertilizer placements for the control treatments and under the same N and P fertilizer for the same fertilizer placement since no significant differences were observed between maize varieties and years (2018 and 2019), and followed by different letters indicate significant differences between different growth days for the same N and P fertilization rate and same fertilizer placement or between 45 DAS, 60 DAS, and 115 DAS under the control (a, b, c), between different fertilizer placements for the same growth day and same N and P fertilization rate (x, y), between different N fertilization rates with the same P fertilization rate for the same fertilizer placement and plant growth day (α, β), and between different P fertilization rates with the same N fertilization rate for the same fertilizer placement and plant growth day (e, f) at P < 0.05. Abbreviations: DAS, days after sowing; N, nitrogen; P, phosphorus.
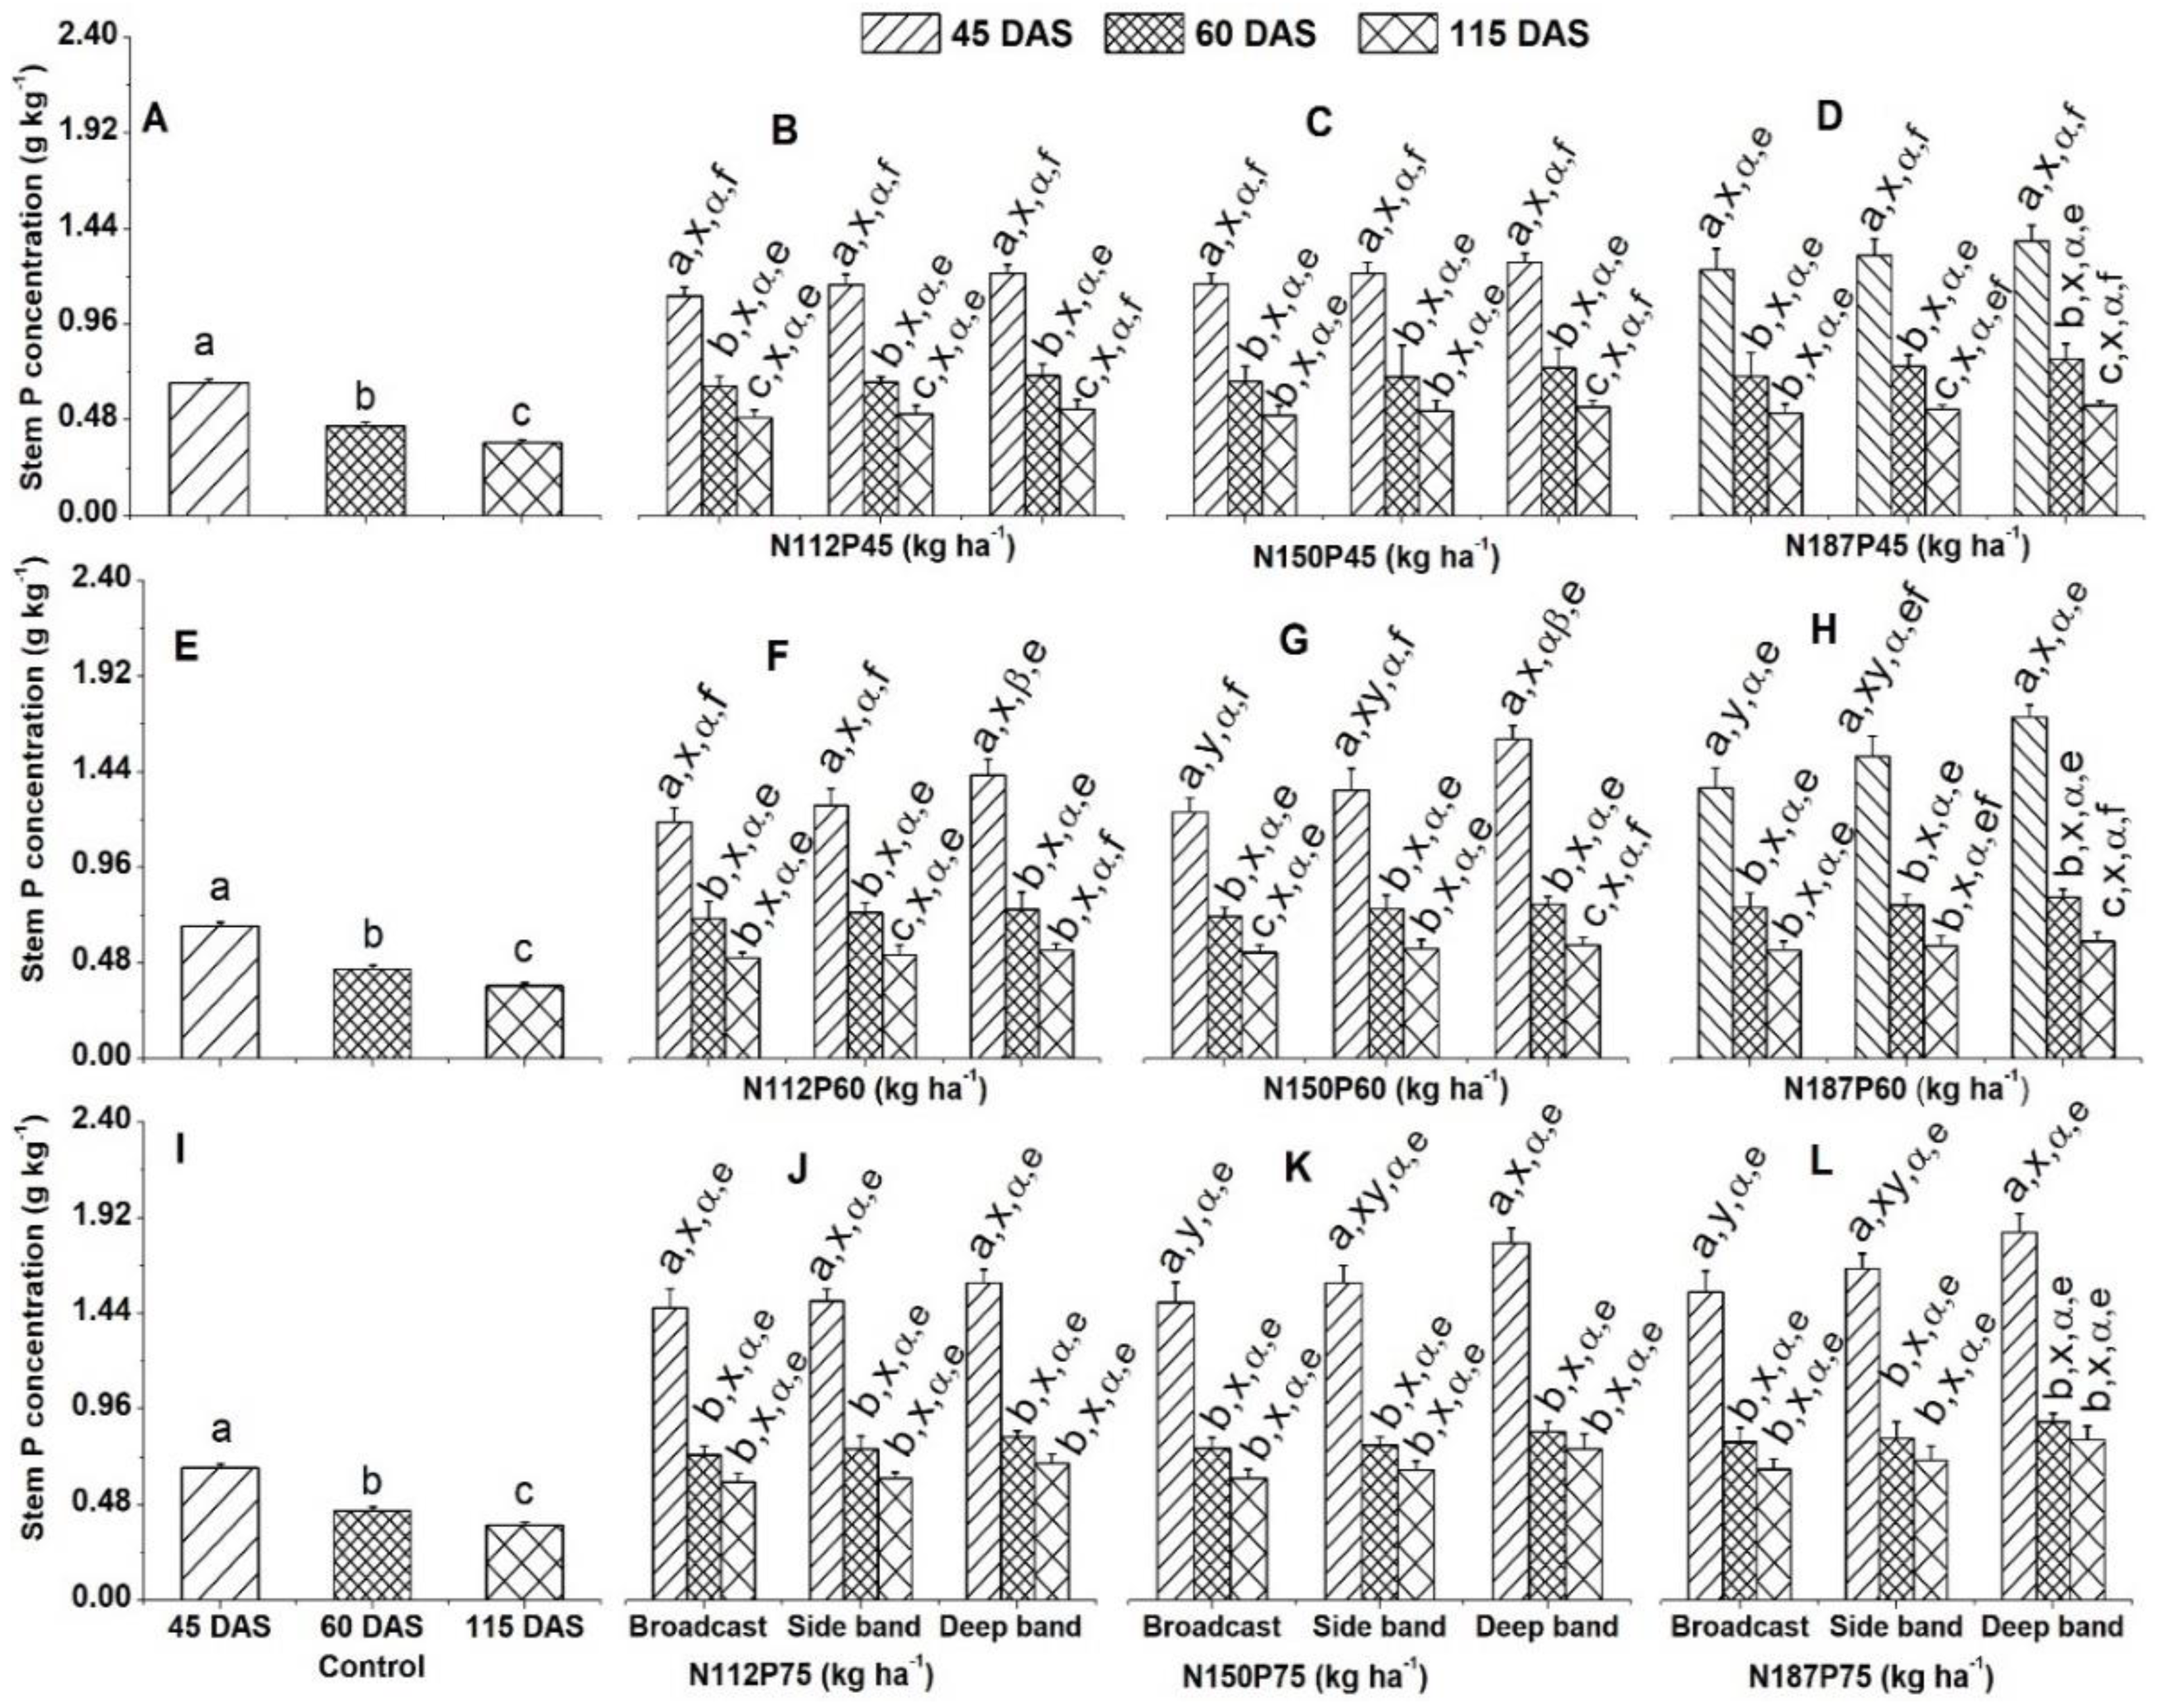
Figure 4.
Effects of phosphorus fertilization rates and fertilizer placements on stem P accumulation of maize in the V8 (eight-leaf) growth stage at 45 days after sowing, VT (tasseling) stage at 60 days after sowing, and R6 (physiological maturity or harvest) stage at 115 days after sowing. Differences were showed in Figures (A, E, I) for no-fertilization control treatments between days after sowing; (B-D) between different N fertilization rates and fertilizer placements for the same P45 fertilization rate; (F-H) between different N fertilization rates and fertilizer placements for the same P60 fertilization rate; (J-L) between different N fertilization rates and fertilizer placements for the same P75 fertilization. Data (means ± SE, n = 6) are averaged under three fertilizer placements for the control treatments and under the same N and P fertilizer for the same fertilizer placement since no significant differences were observed between maize varieties and years (2018 and 2019), and followed by different letters indicate significant differences between different growth days for the same N and P fertilization rate and same fertilizer placement or between 45 DAS, 60 DAS, and 115 DAS under the control (a, b, c), between different fertilizer placements for the same growth day and same N and P fertilization rate (x, y), between different N fertilization rates with the same P fertilization rate for the same fertilizer placement and plant growth day (α, β), and between different P fertilization rates with the same N fertilization rate for the same fertilizer placement and plant growth day (e, f) at P < 0.05. Abbreviations: DAS, days after sowing; N, nitrogen; P, phosphorus.
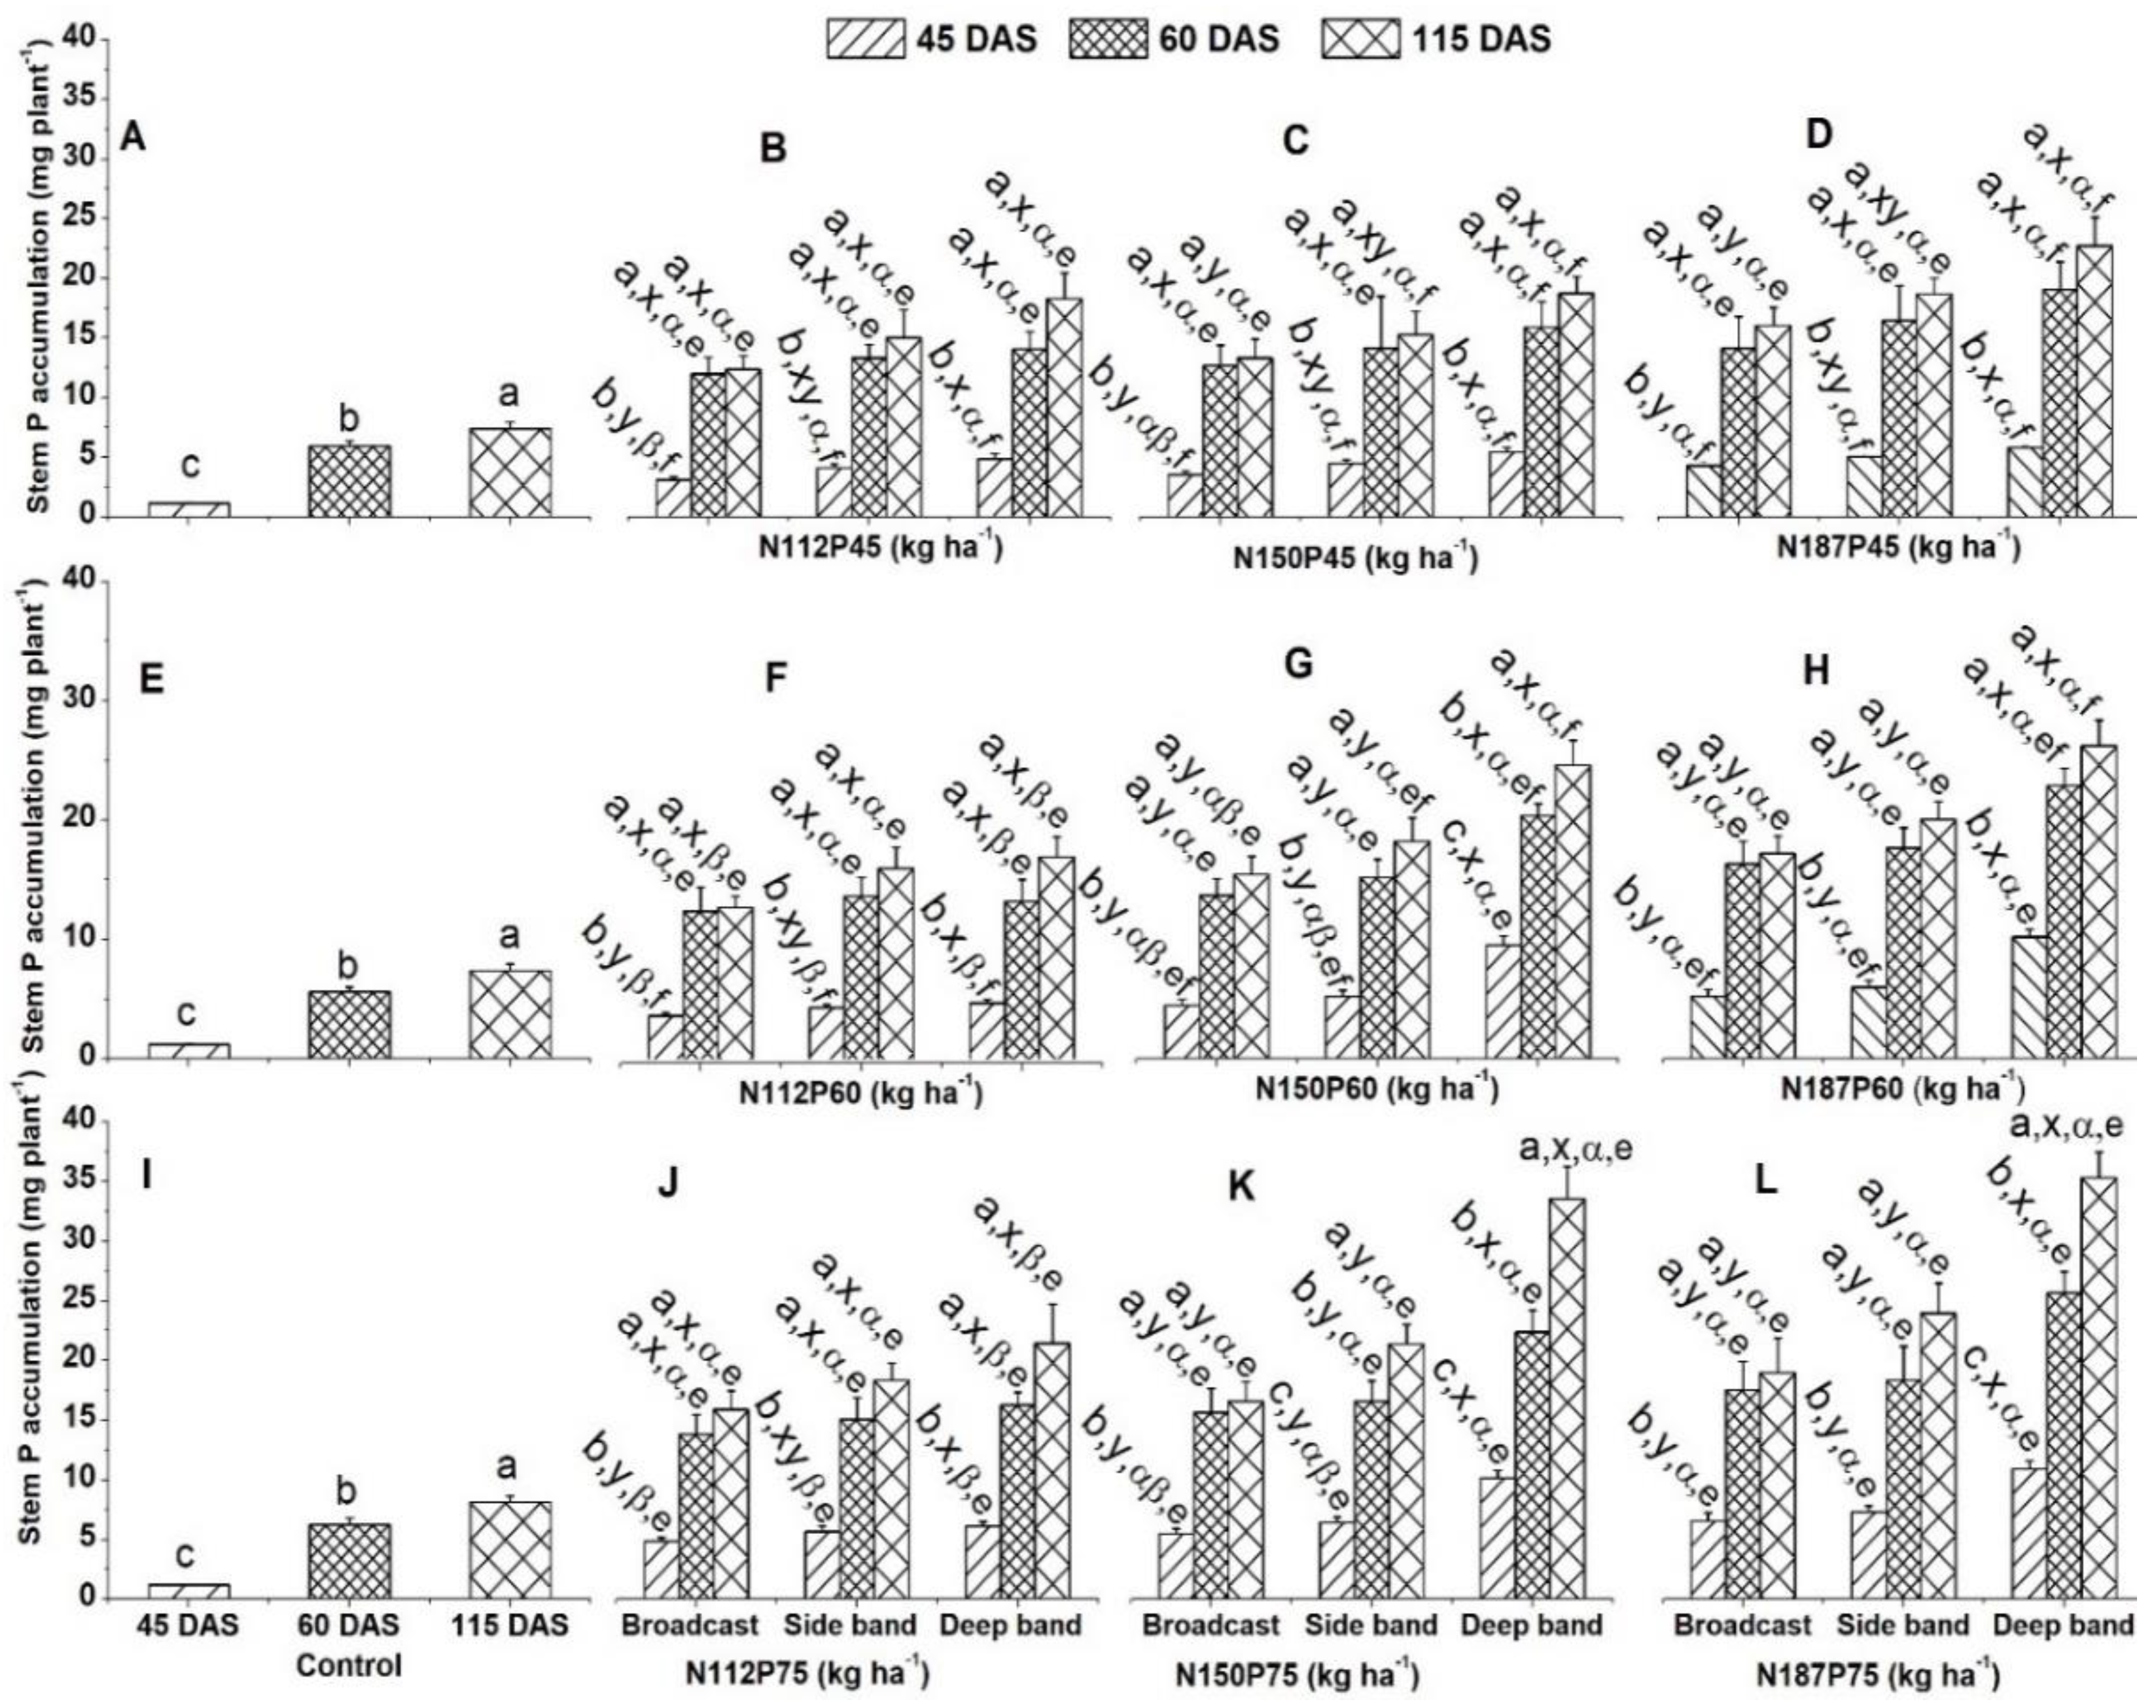
Figure 5.
Effects phosphorus fertilization rates and fertilizer placements on root P concentration of maize in the VT (tasseling) stage at 60 days after sowing, and R6 (physiological maturity or harvest) stage at 115 days after sowing. Differences were showed in Figures (A, E, I) for no-fertilization control treatments between days after sowing; (B-D) between different N fertilization rates and fertilizer placements for the same P45 fertilization rate; (F-H) between different N fertilization rates and fertilizer placements for the same P60 fertilization rate; (J-L) between different N fertilization rates and fertilizer placements for the same P75 fertilization. Data (means ± SE, n = 6) are averaged under three fertilizer placements for the control treatments and under the same N and P fertilizer for the same fertilizer placement since no significant differences were observed between maize varieties and years (2018 and 2019), and followed by different letters indicate significant differences between different growth days for the same N and P fertilization rate and same fertilizer placement or between 45 DAS, 60 DAS, and 115 DAS under the control (a, b, c), between different fertilizer placements for the same growth day and same N and P fertilization rate (x, y), between different N fertilization rates with the same P fertilization rate for the same fertilizer placement and plant growth day (α, β), and between different P fertilization rates with the same N fertilization rate for the same fertilizer placement and plant growth day (e, f) at P < 0.05. Abbreviations: DAS, days after sowing; N, nitrogen; P, phosphorus.
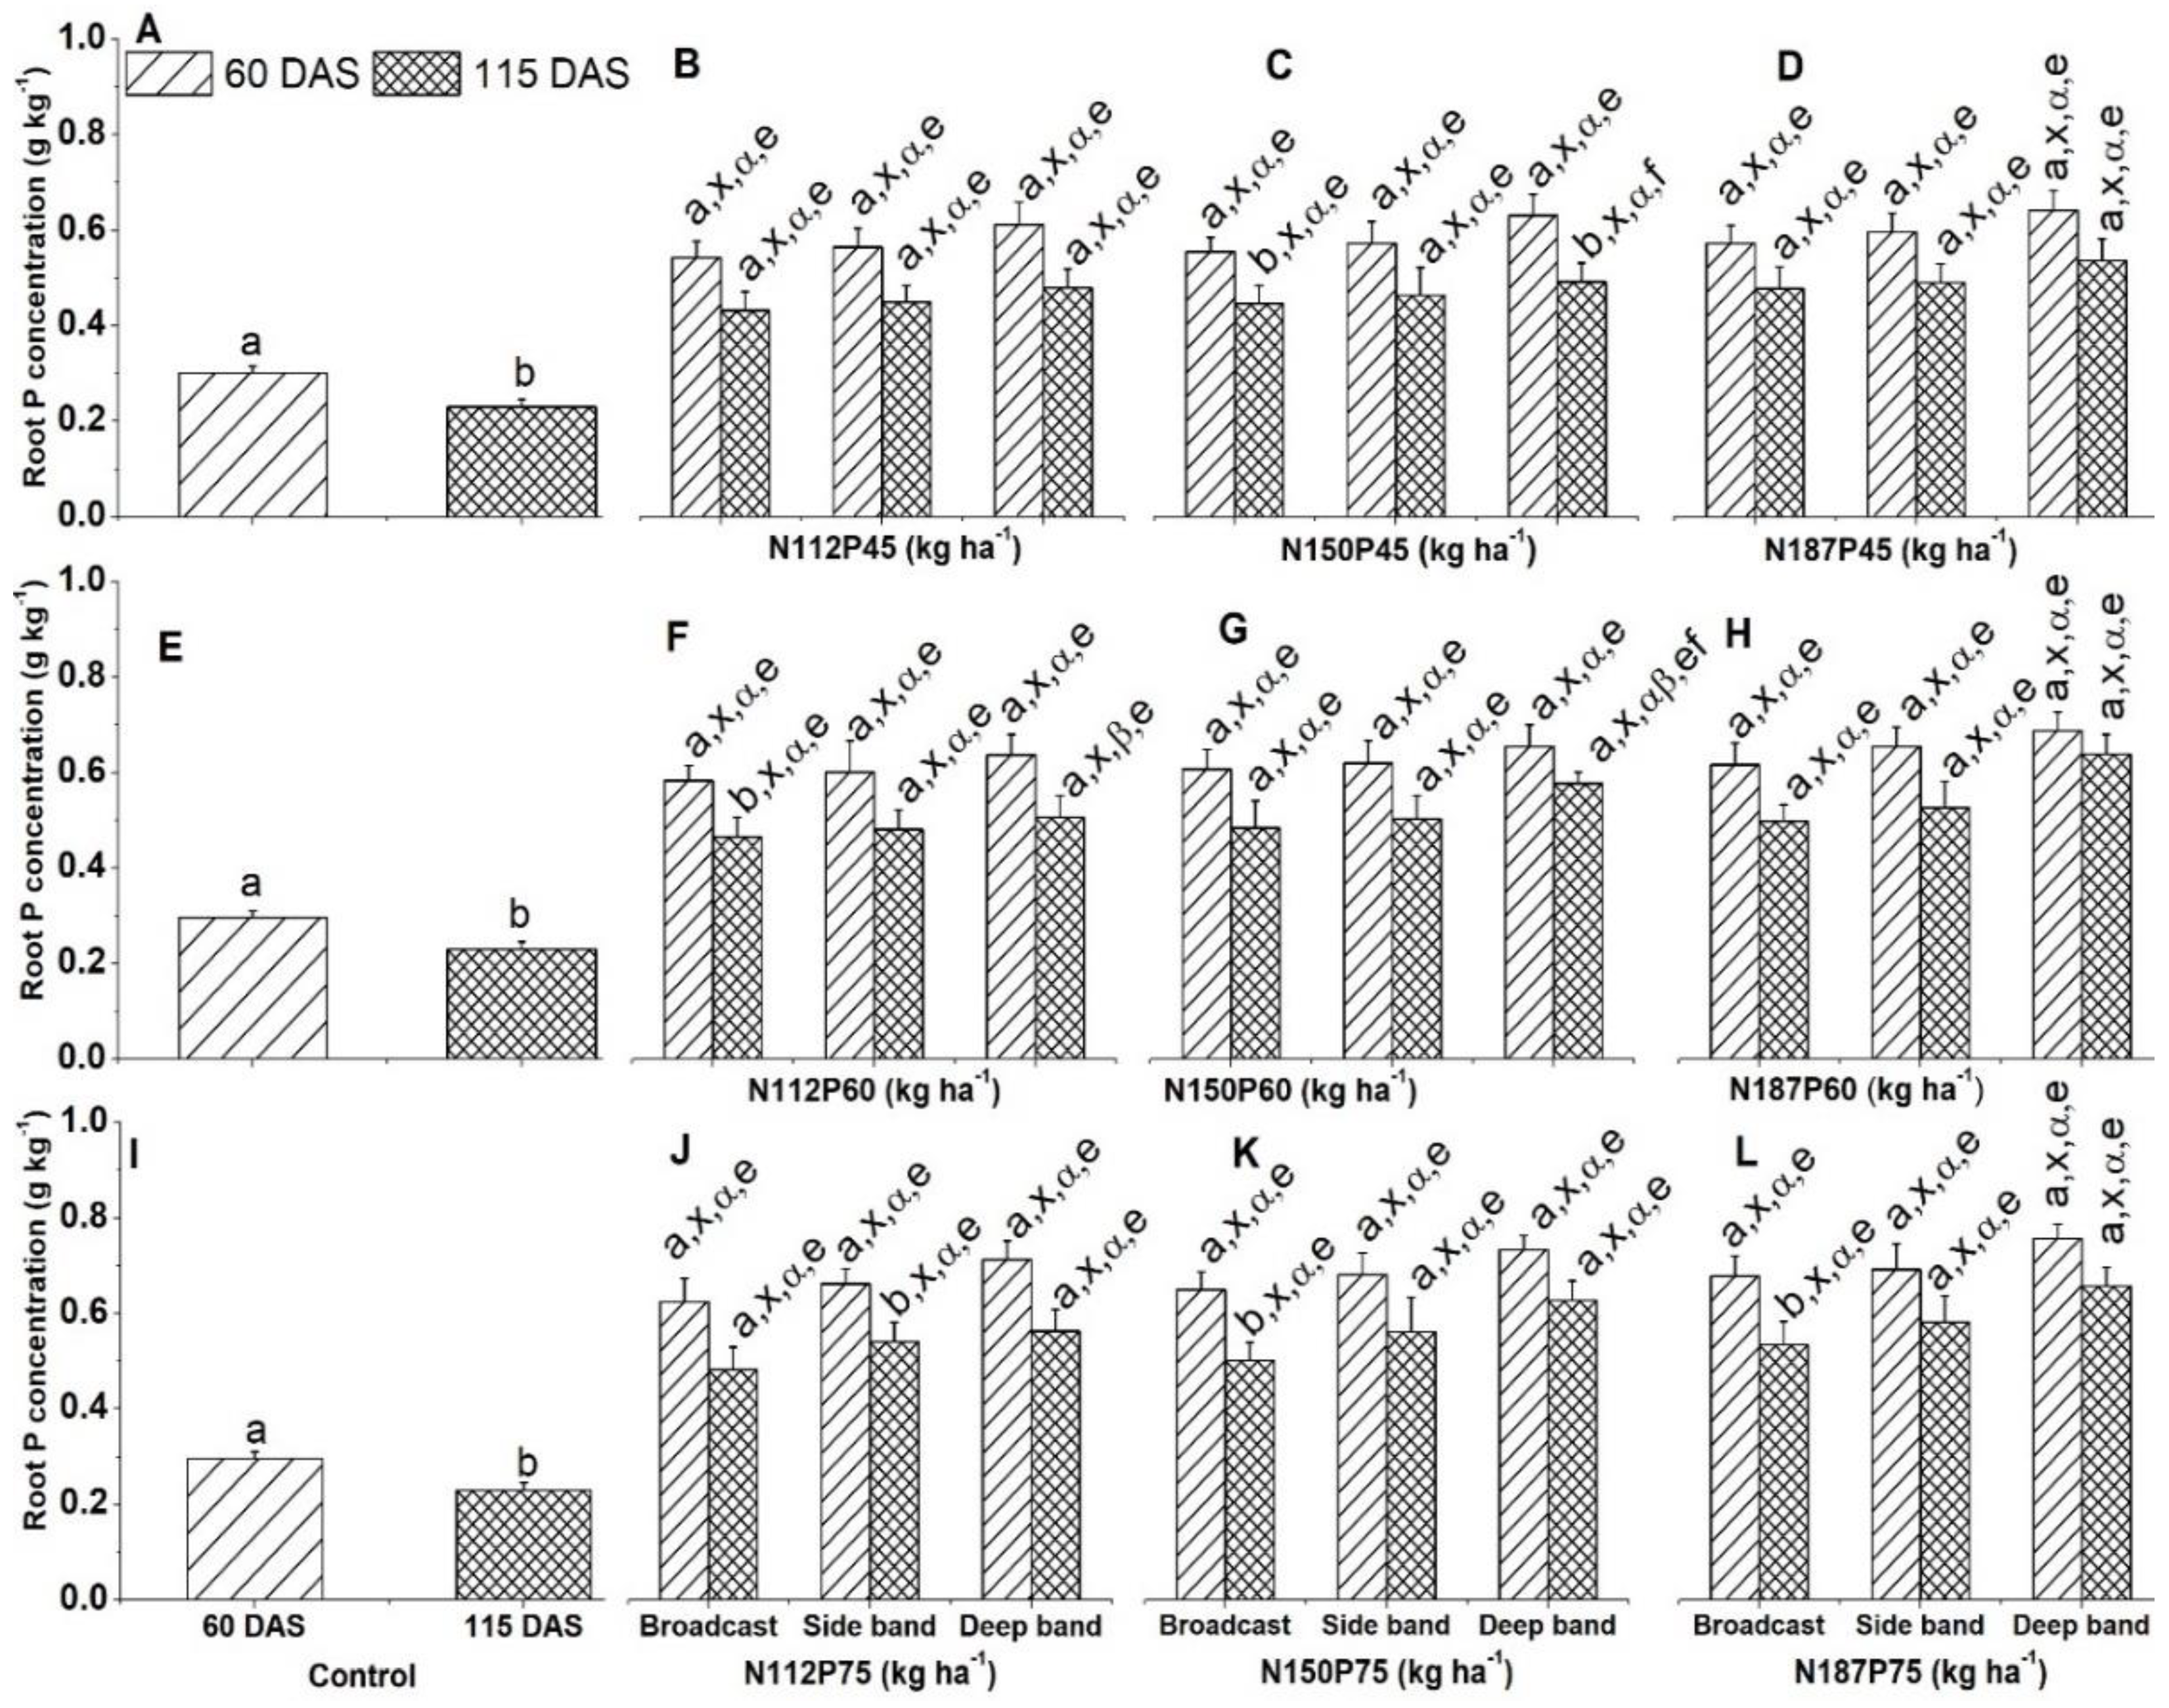
Figure 6.
Effects of phosphorus fertilization rates and fertilizer placements on root P accumulation of maize in the VT (tasseling) stage at 60 days after sowing, and R6 (physiological maturity or harvest) stage at 115 days after sowing. Differences were showed in Figures (A, E, I) for no-fertilization control treatments between days after sowing; (B-D) between different N fertilization rates and fertilizer placements for the same P45 fertilization rate; (F-H) between different N fertilization rates and fertilizer placements for the same P60 fertilization rate; (J-L) between different N fertilization rates and fertilizer placements for the same P75 fertilization. Data (means ± SE, n = 6) are averaged under three fertilizer placements for the control treatments and under the same N and P fertilizer for the same fertilizer placement since no significant differences were observed between maize varieties and years (2018 and 2019), and followed by different letters indicate significant differences between different growth days for the same N and P fertilization rate and same fertilizer placement or between 45 DAS, 60 DAS, and 115 DAS under the control (a, b, c), between different fertilizer placements for the same growth day and same N and P fertilization rate (x, y), between different N fertilization rates with the same P fertilization rate for the same fertilizer placement and plant growth day (α, β), and between different P fertilization rates with the same N fertilization rate for the same fertilizer placement and plant growth day (e, f) at P < 0.05. Abbreviations: DAS, days after sowing; N, nitrogen; P, phosphorus.
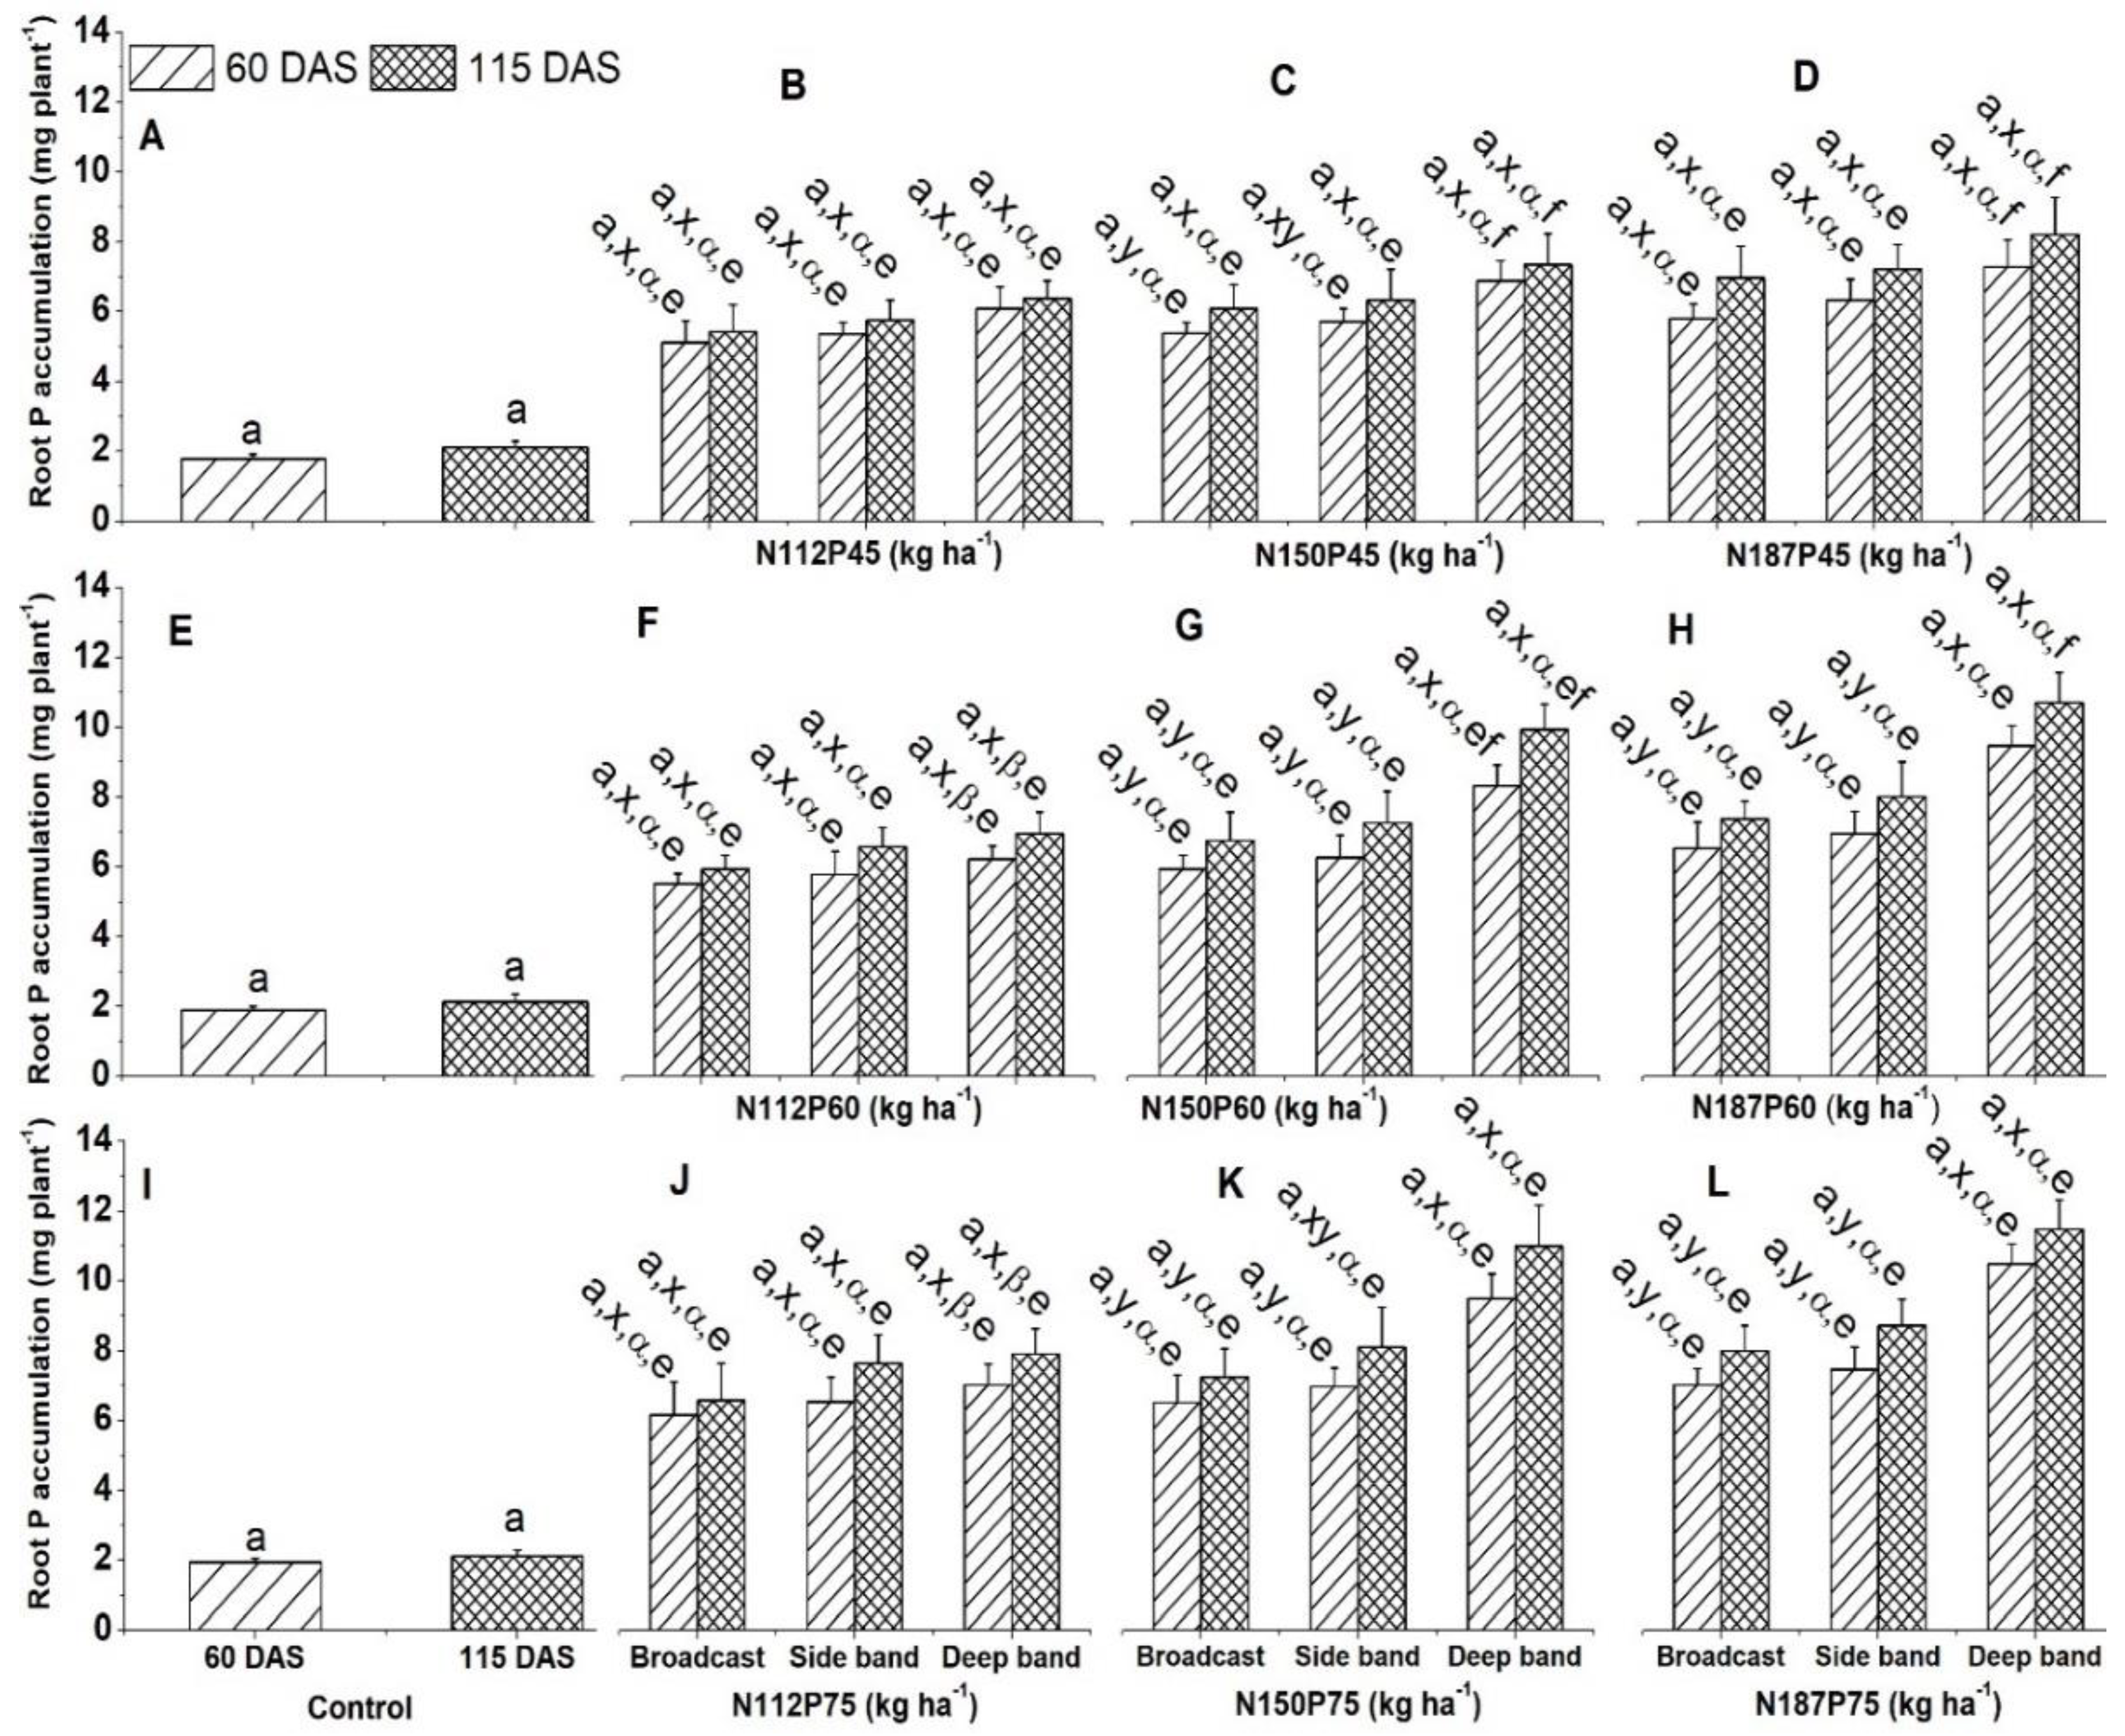
Figure 7.
Effects of phosphorus fertilization rates and fertilizer placement on seed P concentrations (A-D), seed P accumulations (E-H), and total plant (leaf + stem + seed + root) P accumulations (I-L) of maize crop at the R6 (physiological maturity or harvest) stage at 115 days after sowing. Data (means ± SE, n = 6) are averaged under three fertilizer placements for the control treatments and under the same N and P fertilizer for the same fertilizer placement since no significant differences were observed between maize varieties and years (2018 and 2019), and followed by different letters indicate significant differences between different N fertilization rates for the same P fertilization and fertilizer placement (a, b), between different fertilizer placements for the same NP fertilization rate (x, y), and between different P fertilization rates for the same N fertilization and fertilizer placement (e, f) at P < 0.05. Abbreviations: DAS, days after sowing; N, nitrogen; P, phosphorus.
Figure 8.
Effects of phosphorus fertilization rates and fertilizer placements on total soil P concentration of maize in the VT (tasseling) stage at 60 days after sowing, and R6 (physiological maturity or harvest) stage at 115 days after sowing. Differences were showed in Figures (A, E, I) for no-fertilization control treatments between days after sowing; (B-D) between different N fertilization rates and fertilizer placements for the same P45 fertilization rate; (F-H) between different N fertilization rates and fertilizer placements for the same P60 fertilization rate; (J-L) between different N fertilization rates and fertilizer placements for the same P75 fertilization. Data (means ± SE, n = 6) are averaged under three fertilizer placements for the control treatments and under the same N and P fertilizer for the same fertilizer placement since no significant differences were observed between maize varieties and years (2018 and 2019), and followed by different letters indicate significant differences between different growth days for the same N and P fertilization rate and same fertilizer placement or between 45 DAS, 60 DAS, and 115 DAS under the control (a, b, c), between different fertilizer placements for the same growth day and same N and P fertilization rate (x, y), between different N fertilization rates with the same P fertilization rate for the same fertilizer placement and plant growth day (α, β), and between different P fertilization rates with the same N fertilization rate for the same fertilizer placement and plant growth day (e, f) at P < 0.05. Abbreviations: DAS, days after sowing; N, nitrogen; P, phosphorus.
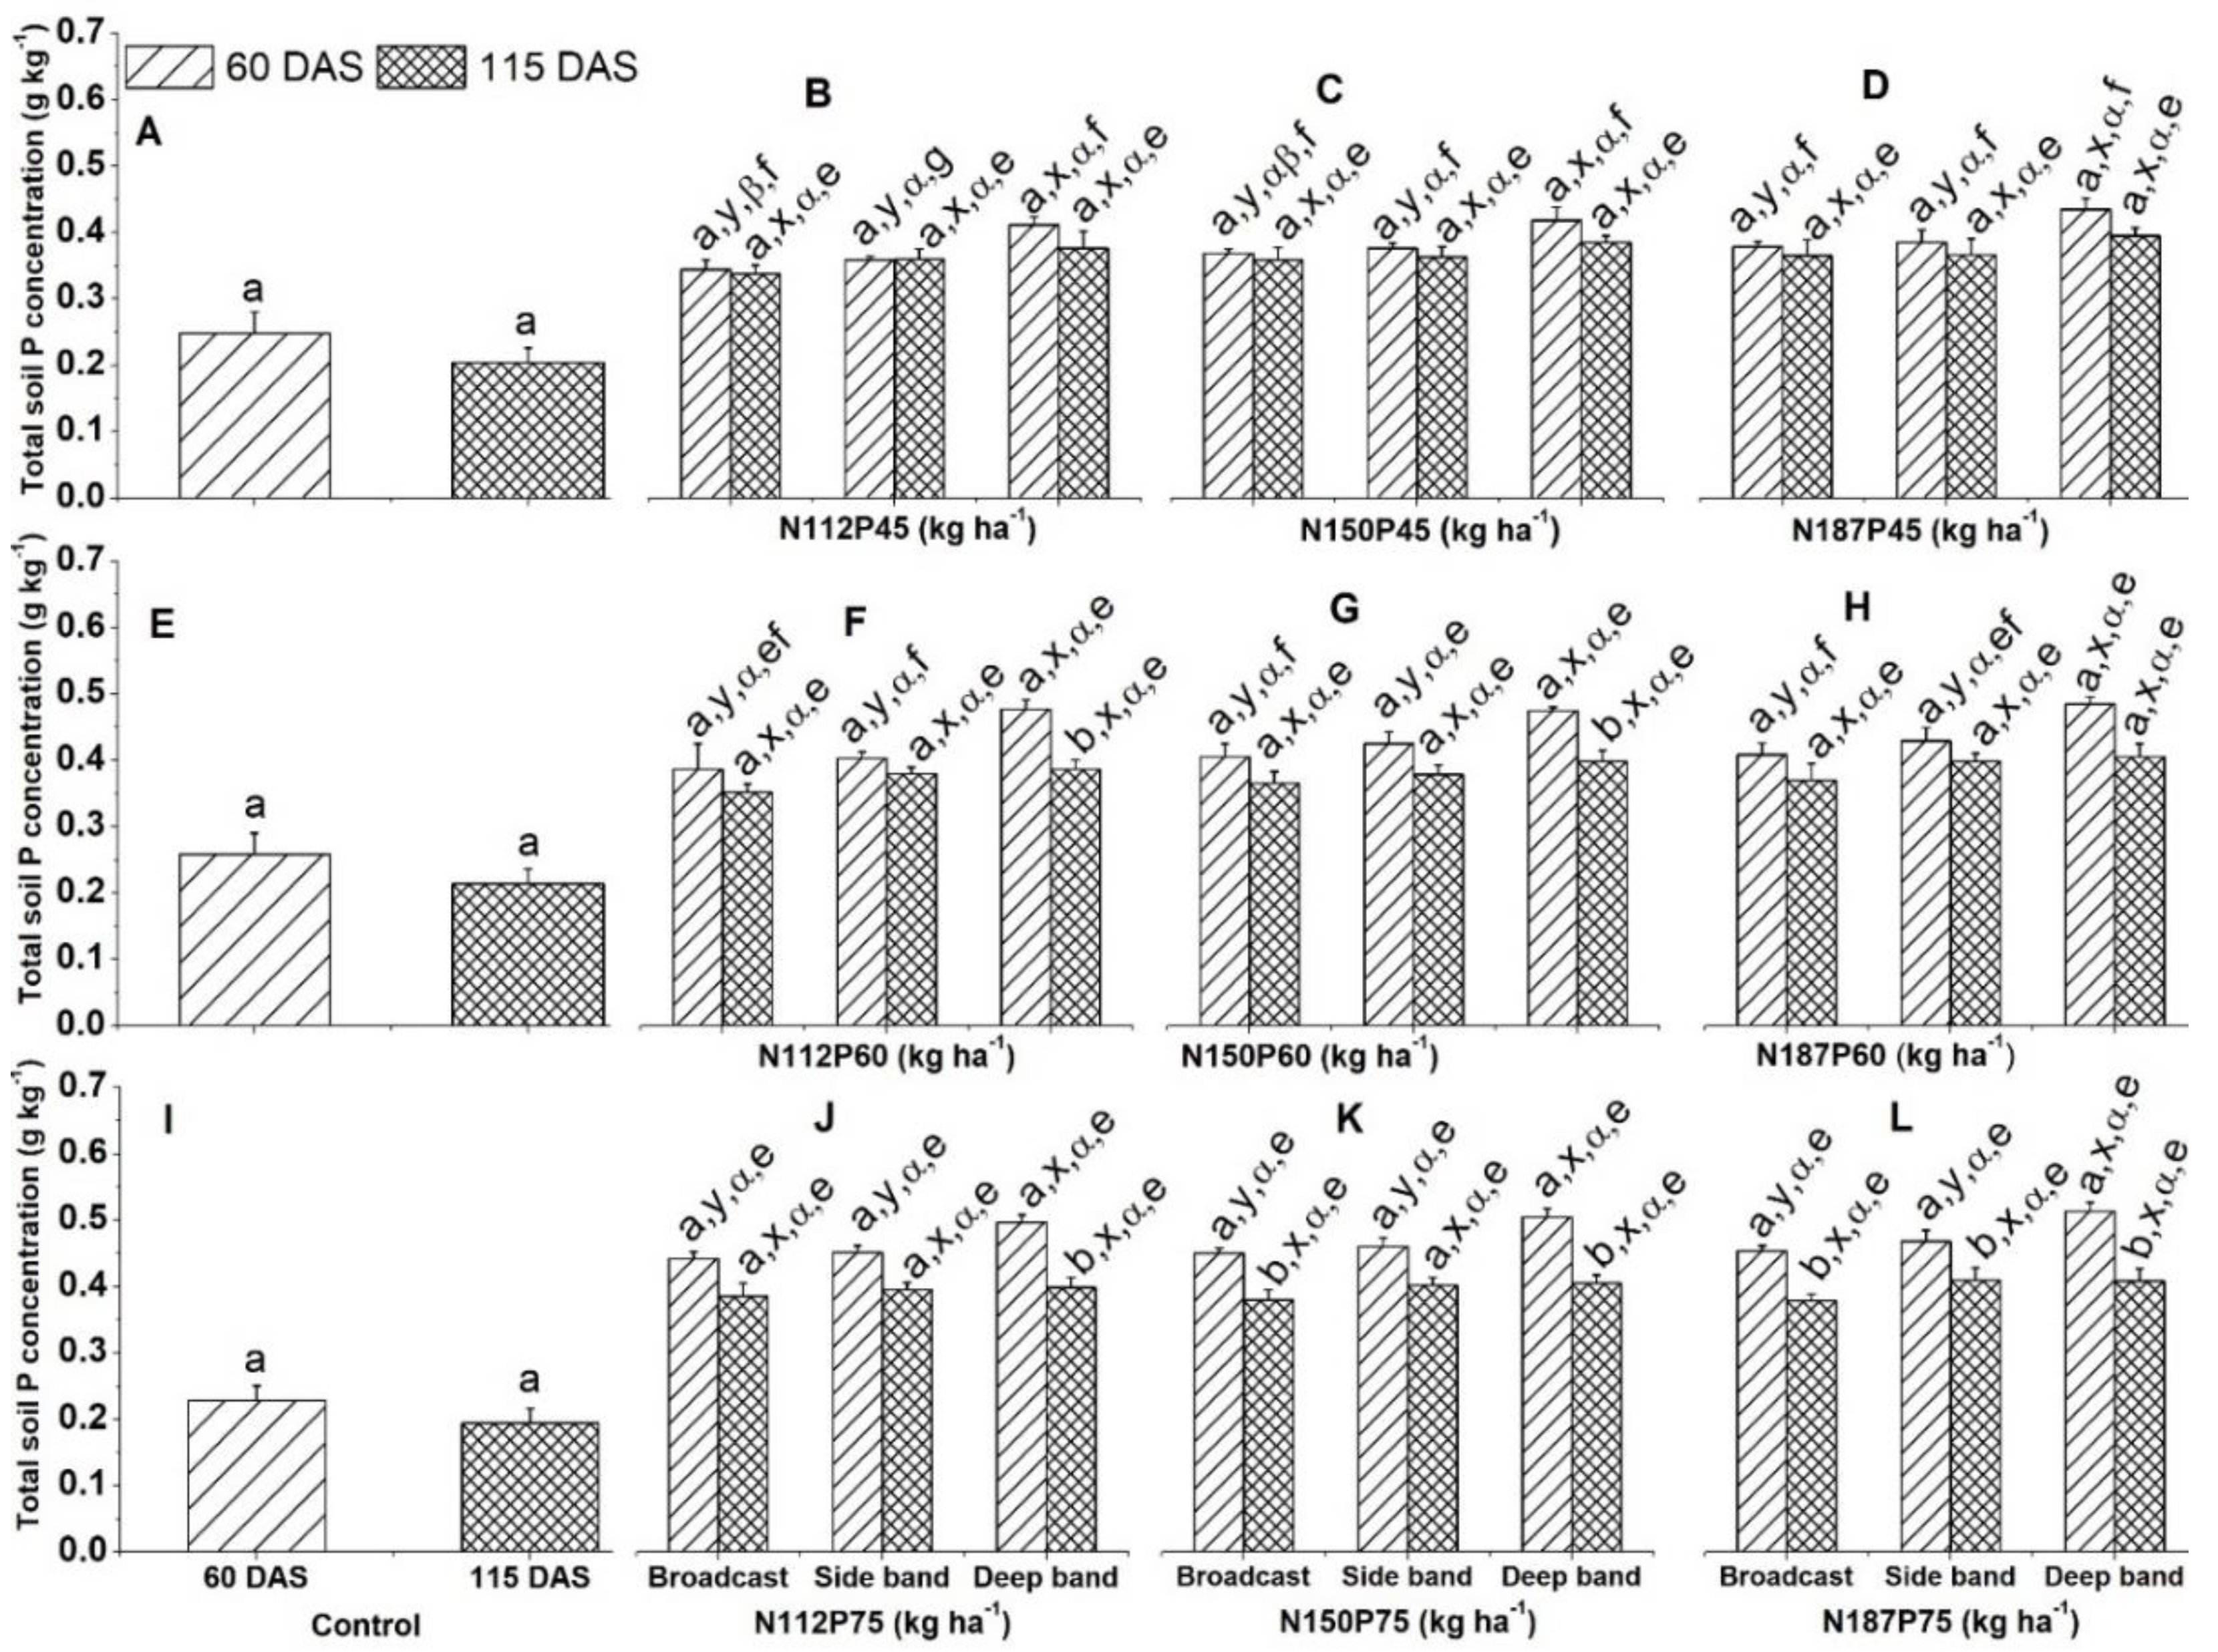
Figure 9.
Effects of phosphorus fertilization rates and fertilizer placements on Olsen-P concentration of maize in the VT (tasseling) stage at 60 days after sowing, and R6 (physiological maturity or harvest) stage at 115 days after sowing. Differences were showed in Figures (A, E, I) for no-fertilization control treatments between days after sowing; (B-D) between different N fertilization rates and fertilizer placements for the same P45 fertilization rate; (F-H) between different N fertilization rates and fertilizer placements for the same P60 fertilization rate; (J-L) between different N fertilization rates and fertilizer placements for the same P75 fertilization. Data (means ± SE, n = 6) are averaged under three fertilizer placements for the control treatments and under the same N and P fertilizer for the same fertilizer placement since no significant differences were observed between maize varieties and years (2018 and 2019), and followed by different letters indicate significant differences between different growth days for the same N and P fertilization rate and same fertilizer placement or between 45 DAS, 60 DAS, and 115 DAS under the control (a, b, c), between different fertilizer placements for the same growth day and same N and P fertilization rate (x, y), between different N fertilization rates with the same P fertilization rate for the same fertilizer placement and plant growth day (α, β), and between different P fertilization rates with the same N fertilization rate for the same fertilizer placement and plant growth day (e, f) at P < 0.05. Abbreviations: DAS, days after sowing; N, nitrogen; P, phosphorus.
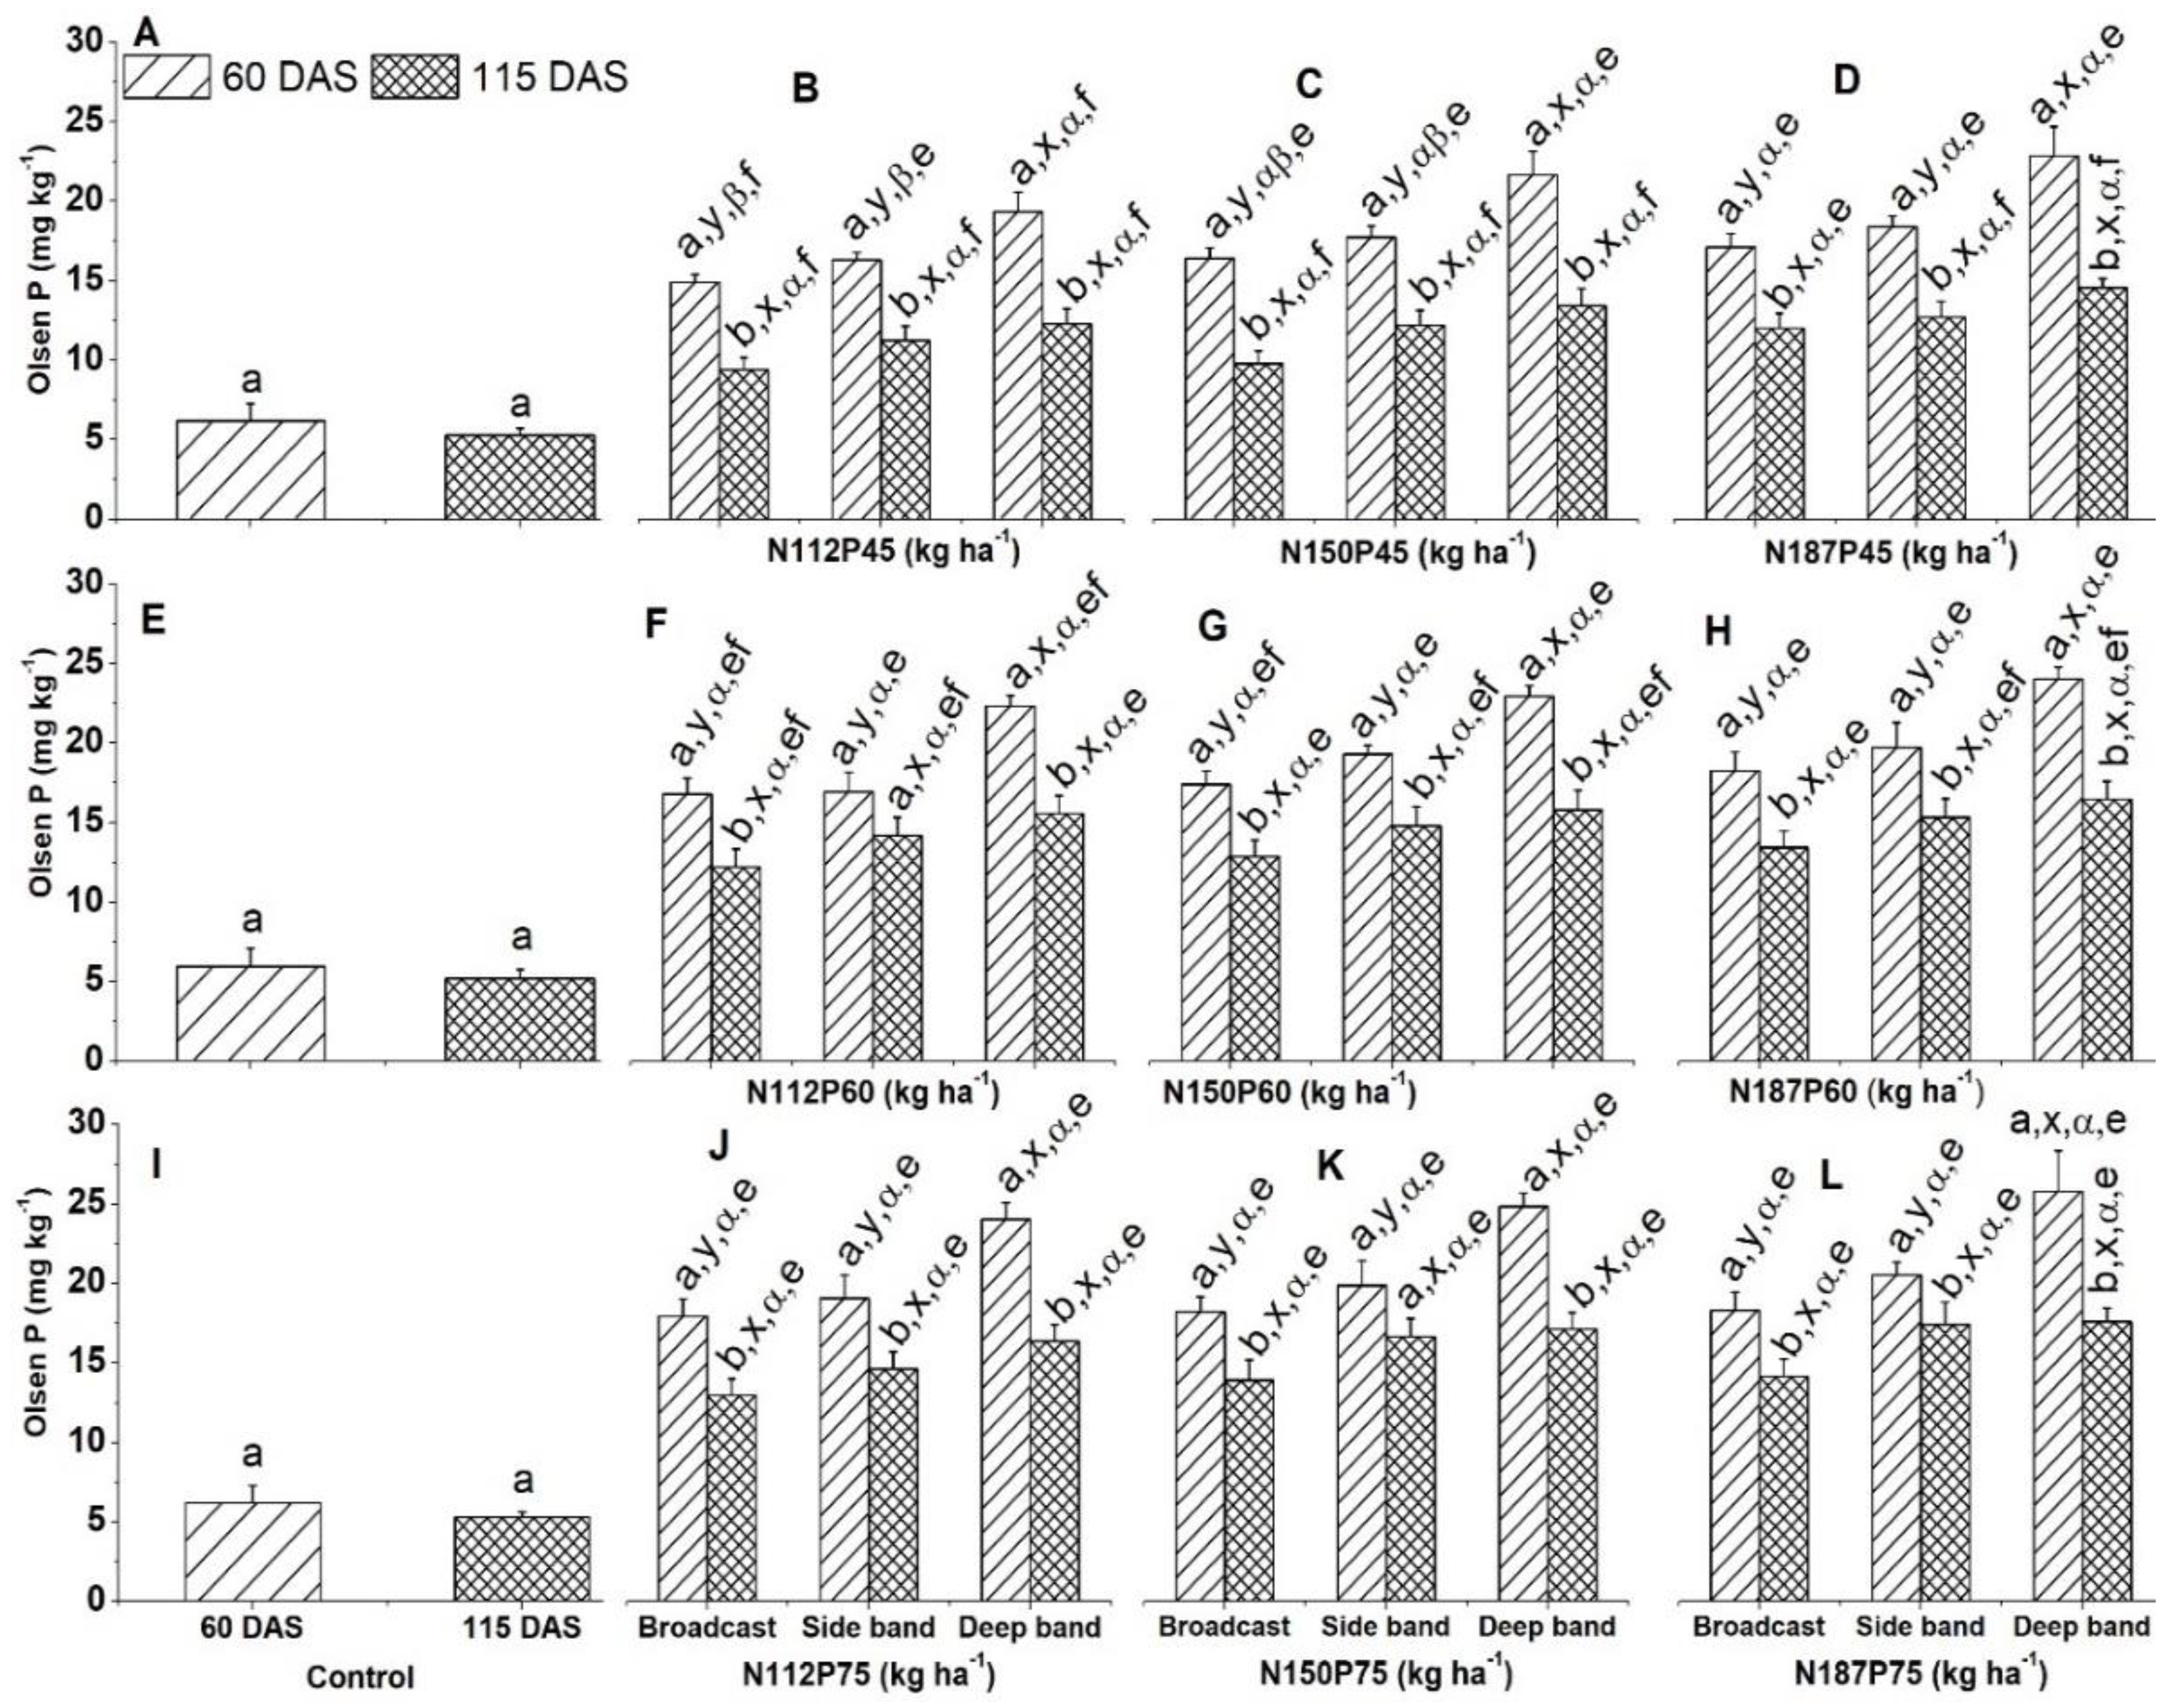
Figure 10.
Relationships between tissue P concentrations and accumulations in leaf (A), stem (B) or root (C) at the VT (tasseling, at 60 days after sowing) growth stage, also between tissue P concentrations or P accumulations in leaf (D, G), stem (E, H) and root (F, I) and Olsen-P concentrations at 60 days after sowing.
Figure 11.
Figure 11. Relationships between tissues P concentration and accumulation in leaf (A), stem (B), seed (C), and root (D) at the R6 (physiological maturity or harvest at 115 days after sowing), between tissue P concentration in leaf (E), stem (F), seed (G), root (H) and total plant (leaf + stem + seed + root; I) and soil Olsen-P at 115 DAS, and between tissue P accumulation in leaf (J), stem (K), seed (L), root (M) and total plant (leaf + stem + seed + root; N) and soil Olsen-P at 115 days after sowing.
Table 1.
Effects of nitrogen (N) and phosphorus (P) fertilization rates and fertilizer placement on phosphorus agronomy efficiency (PAE, kg kg-1), P use efficiency (PUE, %), partial factor productivity of phosphorus (PFPP, kg kg-1 P) of maize.
Table 1.
Effects of nitrogen (N) and phosphorus (P) fertilization rates and fertilizer placement on phosphorus agronomy efficiency (PAE, kg kg-1), P use efficiency (PUE, %), partial factor productivity of phosphorus (PFPP, kg kg-1 P) of maize.
| NP rate |
Placement |
PAE (kg kg-1) |
PUE (%) |
PFPP (kg kg-1 P) |
| N112P45 |
Broadcast |
35.4 ± 9.2 (a,x,e) |
7.7 ± 1.3 (b,x,e) |
76.4 ± 5.4 (a,x,e) |
| Side band |
34.3 ± 5.7 (a,x, e) |
8.0 ± 0.6 (a,x,e) |
63.9 ± 3.0 (a,y,e) |
| Deep band |
23.3 ± 6.0 (a,x, e) |
6.2 ± 1.0 (a,x,e) |
48.9 ± 2.8 (a,z,e) |
| N150P45 |
Broadcast |
37.3 ± 4.8 (a,x,e) |
8.9 ± 1.1 (a,x,e) |
78.0 ± 4.4 (a,x,e) |
| Side band |
38.5 ± 7.5 (a,x,e) |
11.3 ± 1.7 (a,x,e) |
81.3 ± 3.0 (a,x,e) |
| Deep band |
43.5 ± 9.1 (a,x,e) |
13.6 ± 1.9 (a,x,e) |
84.1 ± 5.9 (a,x,e) |
| N187P45 |
Broadcast |
39.3 ± 8.2 (a,x,e) |
11.5 ± 1.7 (a,x,e) |
79.8 ± 4.6 (a,x,e) |
| Side band |
42.3 ± 7.7 (a,x,e) |
13.6 ± 1.6 (a,x,e) |
84.5 ± 6.6 (a,x,e) |
| Deep band |
45.9 ± 7.5 (a,x,e) |
15.6 ± 1.4 (a,x,e) |
86.1 ± 3.2 (a,x,e) |
| N112P60 |
Broadcast |
37.1 ± 7.2 (a,x,e) |
10.0 ± 1.4 (ab,x,f) |
80.1 ± 3.0 (a,x,e) |
| Side band |
34.4 ± 7.8 (a,x,e) |
9.0 ± 1.4 (a,x,e) |
65.6 ± 3.4 (a,y,e) |
| Deep band |
25.9 ± 6.0 (a,x,f) |
7.8 ± 1.1 (a,x,f) |
51.0 ± 3.6 (a,z,f) |
| N150P60 |
Broadcast |
36.2 ± 4.4 (a,x,e) |
9.1 ± 0.9 (a,y,ef) |
65.5 ± 3.9 (b,y,e) |
| Side band |
38.3 ± 4.4 (a,x,e) |
10.7 ± 1.0 (a,y,e) |
69.0 ± 4.2 (b,xy,e) |
| Deep band |
49.5 ± 4.5 (a,x,ef) |
15.2 ± 1.2 (a,x,e) |
77.6 ± 3.2 (a,x,e) |
| N187P60 |
Broadcast |
37.3 ± 3.5 (a,y,e) |
10.3 ± 0.5 (a,y,e) |
66.5 ± 3.2 (b,y,e) |
| Side band |
40.5 ± 5.4 (a,xy,e) |
12.5 ± 1.0 (a,y,e) |
70.9 ± 4.5 (a,xy,e) |
| Deep band |
51.5 ± 3.5 (a,x,e) |
17.0 ± 0.9 (a,x,e) |
79.2 ± 3.4 (a,x,e) |
| N112P75 |
Broadcast |
41.7 ± 8.0 (a,x,e) |
11.7 ± 1.2 (a,x,e) |
82.5 ± 4.4 (a,x,e) |
| Side band |
36.9 ± 5.6 (a,x,e) |
10.2 ± 1.2 (a,x,f) |
66.7 ± 3.1 (a,y,e) |
| Deep band |
31.4 ± 6.6 (a,x,e) |
9.1 ± 0.8 (a,x,f) |
53.5 ± 3.2 (a,z,f) |
| N150P75 |
Broadcast |
25.2 ± 6.0 (a,y,e) |
7.6 ± 0.9 (a,z,e) |
50.5 ± 3.5 (c,y,e) |
| Side band |
27.4 ± 2.5 (a,y,e) |
9.5 ± 0.4 (a,y,ef) |
52.3 ± 3.2 (c,y,e) |
| Deep band |
44.0 ± 3.0 (a,x,e) |
14.5 ± 0.5 (a,x,e) |
64.4 ± 3.2 (b,x,e) |
| N187P75 |
Broadcast |
25.9 ± 4.1 (a,y,e) |
8.5 ± 1.0 (a,z,e) |
51.1 ± 2.8 (c,y,e) |
| Side band |
31.0 ± 2.2 (a,y,e) |
10.8 ± 0.4 (a,y,e) |
55.4 ± 3.5 (b,y,e) |
| Deep band |
46.3 ± 4.6 (a,x,e) |
15.9 ± 0.4 (a,x,e) |
66.4 ± 3.9 (b,x,e) |


