1. Introduction
Cuproptosis is an emerging cell death pathway, and further exploration of its regulatory mechanism in the context of glioblastoma (GBM) is needed [
1] [1]. Our objective was to examine cuproptosis-associated genes (CRGs) and develop a novel prognostic model for GBM.
Gliomas are the most common solid tumours of the central nervous system (CNS) [
2,
3]. Despite the implementation of extensive treatment regimens and recent advancements in therapeutic approaches, glioma treatment remains a significant challenge in the field of medicine[
4,
5]. Glioma includes a variety of subtypes, including glioblastomas, ependymomas, medulloblastomas, astrocytomas, oligodendrogliomas, and glioblastoma multiforme [
6]. The therapeutic approach for glioblastoma has undergone minimal alterations over the past decade [
7], resulting in a persistently unfavourable prognosis characterized by a median survival of approximately 15 months [
8]. An extensive multimodal therapeutic approach encompassing chemotherapy, radiation, and surgical resection (where appropriate) is typically applied, but this treatment regimen significantly decreases patients’ quality of life [
9].
The primary approach for managing glioblastoma (GBM) comprises a multimodal treatment strategy that includes chemotherapy, surgery, and radiation therapy [
10]. Therefore, it is crucial to identify dependable prognostic biomarkers to support the advancement of gene-targeted therapeutics for glioma [
11]. Additionally, the development of novel pharmaceutical compounds is of critical importance. At present, chemotherapeutic agents designed to treat glioma are predominantly administered after the completion of clinical trials involving other malignant tumour types. Nonetheless, further investigation is warranted to ascertain specific therapeutic interventions that efficiently target glioma cells. The CRISPR/Cas9 approach is employed to target and suppress the expression of specific genes in embryos, hence establishing the most effective screening technique for clarifying pathogenesis mechanisms. Drug screening can also be conducted using this method. However, the inherent diversity of glioblastoma limits the effectiveness of this strategy in tackling this particular problem. Similarly, the injection of glioma stem cells (GSCs) into animal embryos for the purpose of creating glioma models does not adequately address the issue of heterogeneity. Consequently, the use of organoids or high-throughput screening might be considered supplementary alternatives.
The primary aim of this study was to examine the association between CRGs and commonly prescribed medications utilized in the treatment of individuals with glioblastoma. Drug sensitivity in individuals diagnosed with glioma is often assessed based on treatment response and the half-maximum inhibitory concentration (IC50) value. One approach for determining the IC50 value of a chemotherapy treatment involves utilizing the "prophytic" R package in conjunction with the necessary dependencies, such as "car, ridge preprocessCore, genefilter, and sva". IC50 values were determined for commonly used anticancer medicines in both high-risk and low-risk populations. Drug testing for glioblastoma multiforme (GBM) is currently a labour-intensive process, which limits its application.
We examined whether lncRNAs associated with cuproptosis are predictive of the prognosis of glioma patients. These findings could contribute to the understanding of the involvement of cuproptosis in the initiation and progression of glioma.
3. Discussion
Copper-rich environments are essential for the survival of living organisms. It plays a crucial role in mitochondrial respiration, iron absorption, and ti-oxidation, among other biological processes. [
12,
13,
14,
15]. Several studies have revealed that copper ions have a dual nature, acting as both vital enzyme cofactors and potential harmful agents [
16]. In particular, elevated copper concentrations can bind lipoic acid-related enzymes connected to the tricarboxylic acid cycle, resulting in cellular death. Tsvetkov et al. (2022) introduced the term "cuproptosis" to describe a distinctive type of cell death that differs from previously identified mechanisms [
17]. A wide range of lncRNAs are found in diverse bodily fluids; they play important roles in a wide range of pathophysiological processes, including screening for human diseases [
18].
Approximately 308,000 cases of brain cancer are diagnosed worldwide every year, 80% of which are gliomas. [
18,
19,
20]. The extreme prevalence of malignant brain lesions in the central nervous system indicates that they are extremely prevalent [
21]. Most malignancies affecting the central nervous system are rapidly expanding, highly fatal malignancies [
22]. Approximately 80% of gliomas are thought to arise from nonneuronal cells, particularly astrocytes, a subtype of glial cell that provides support and protection to neurons. [
23,
24]. This study focused on malignant tumours of the central nervous system to advance research, treatment, and scientific assessment. It is imperative to establish a diagnosis and initiate therapeutic interventions promptly to increase the overall survival rate of patients. In addition, more effective therapeutic interventions need to be explored in the modern medical field, and the underlying mechanisms contributing to tumour proliferation need to be elucidated.
The presence of long noncoding RNAs in central nervous system tissues is considered a marker of tumours in the central nervous system [
25]. In particular, copper ion carrier small molecule anticancer drugs have been used to investigate the prognosis of patients with lung adenocarcinoma. An increasing amount of attention has been given to lncRNAs over the last few years. Studies have shown that long noncoding RNAs, such as linc01140, which interferes with osteosarcoma proliferation and invasion when targeted to miR-139-5p/HOXA9, play crucial roles in tumour progression. [
26]. Numerous malignant tumours, including gastric cancer, cholecystitis, hepatocellular carcinoma, and breast cancer, exhibit aberrant expression of the HXA-AS2 gene [
27,
28]. Nine favourable factors were identified among the 17 lncRNAs studied in this study (AC00783.1, AC00795.2, AC010273.3, AC010319.4, AC021739.2, AC087501.4, AC104623.1, DLGAP1-AS2, PITPNA-AS1, and SOX21-AS1), as were 11 unfavourable factors (AL139243.1, AL35578.1, AL513534.2, AL592295.6, AL691432.4, LINC01574, and TMEM72-AS1). Previous studies have suggested an association between LINC01574 and poor prognosis in gliomas [
29].
Current research has identified 17 lncRNAs associated with cuproptosis prognosis; patients with gliomas were selected for prognostic analysis based on these lncRNAs. A total of 19 transcripts related to cuproptosis were obtained. A combination of LASSO regression and Cox regression analyses was used to identify lncRNAs associated with prognosis in patients with cuprotosis. We also examined the associations of CRLPM with common clinical variables, upstream regulatory mechanisms, immune cell infiltration, and immunotherapy response in glioma patients.
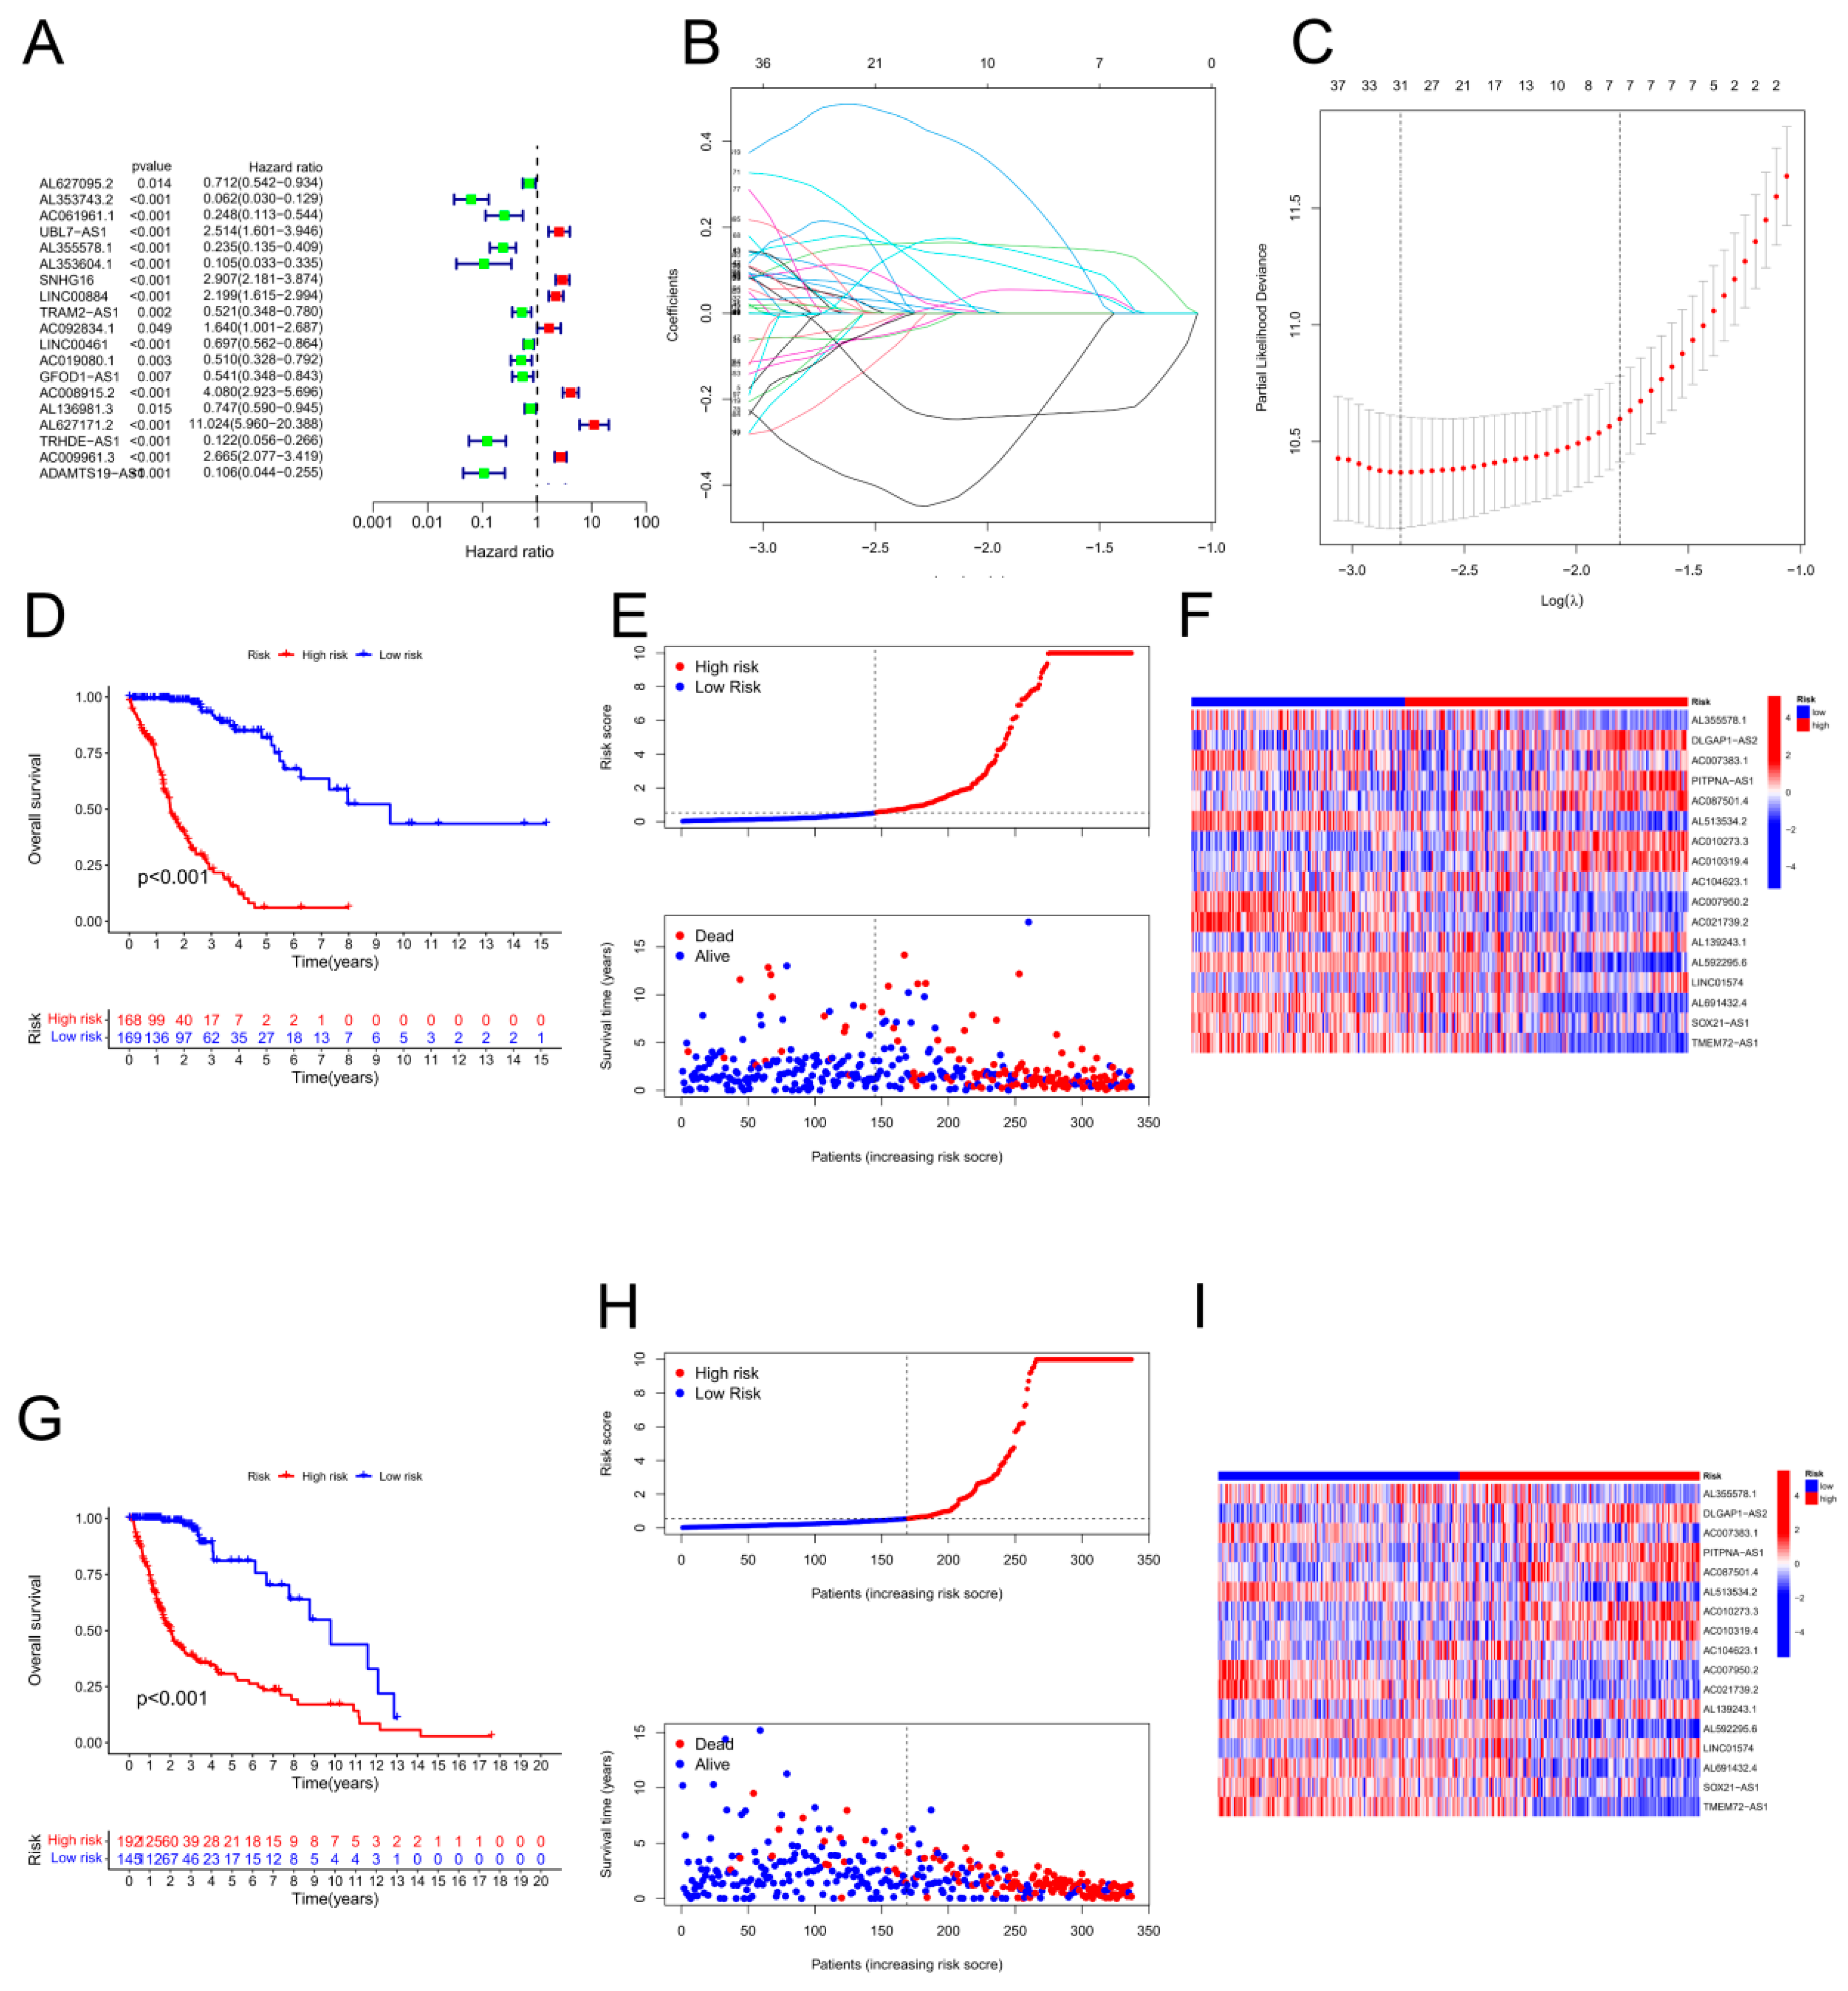
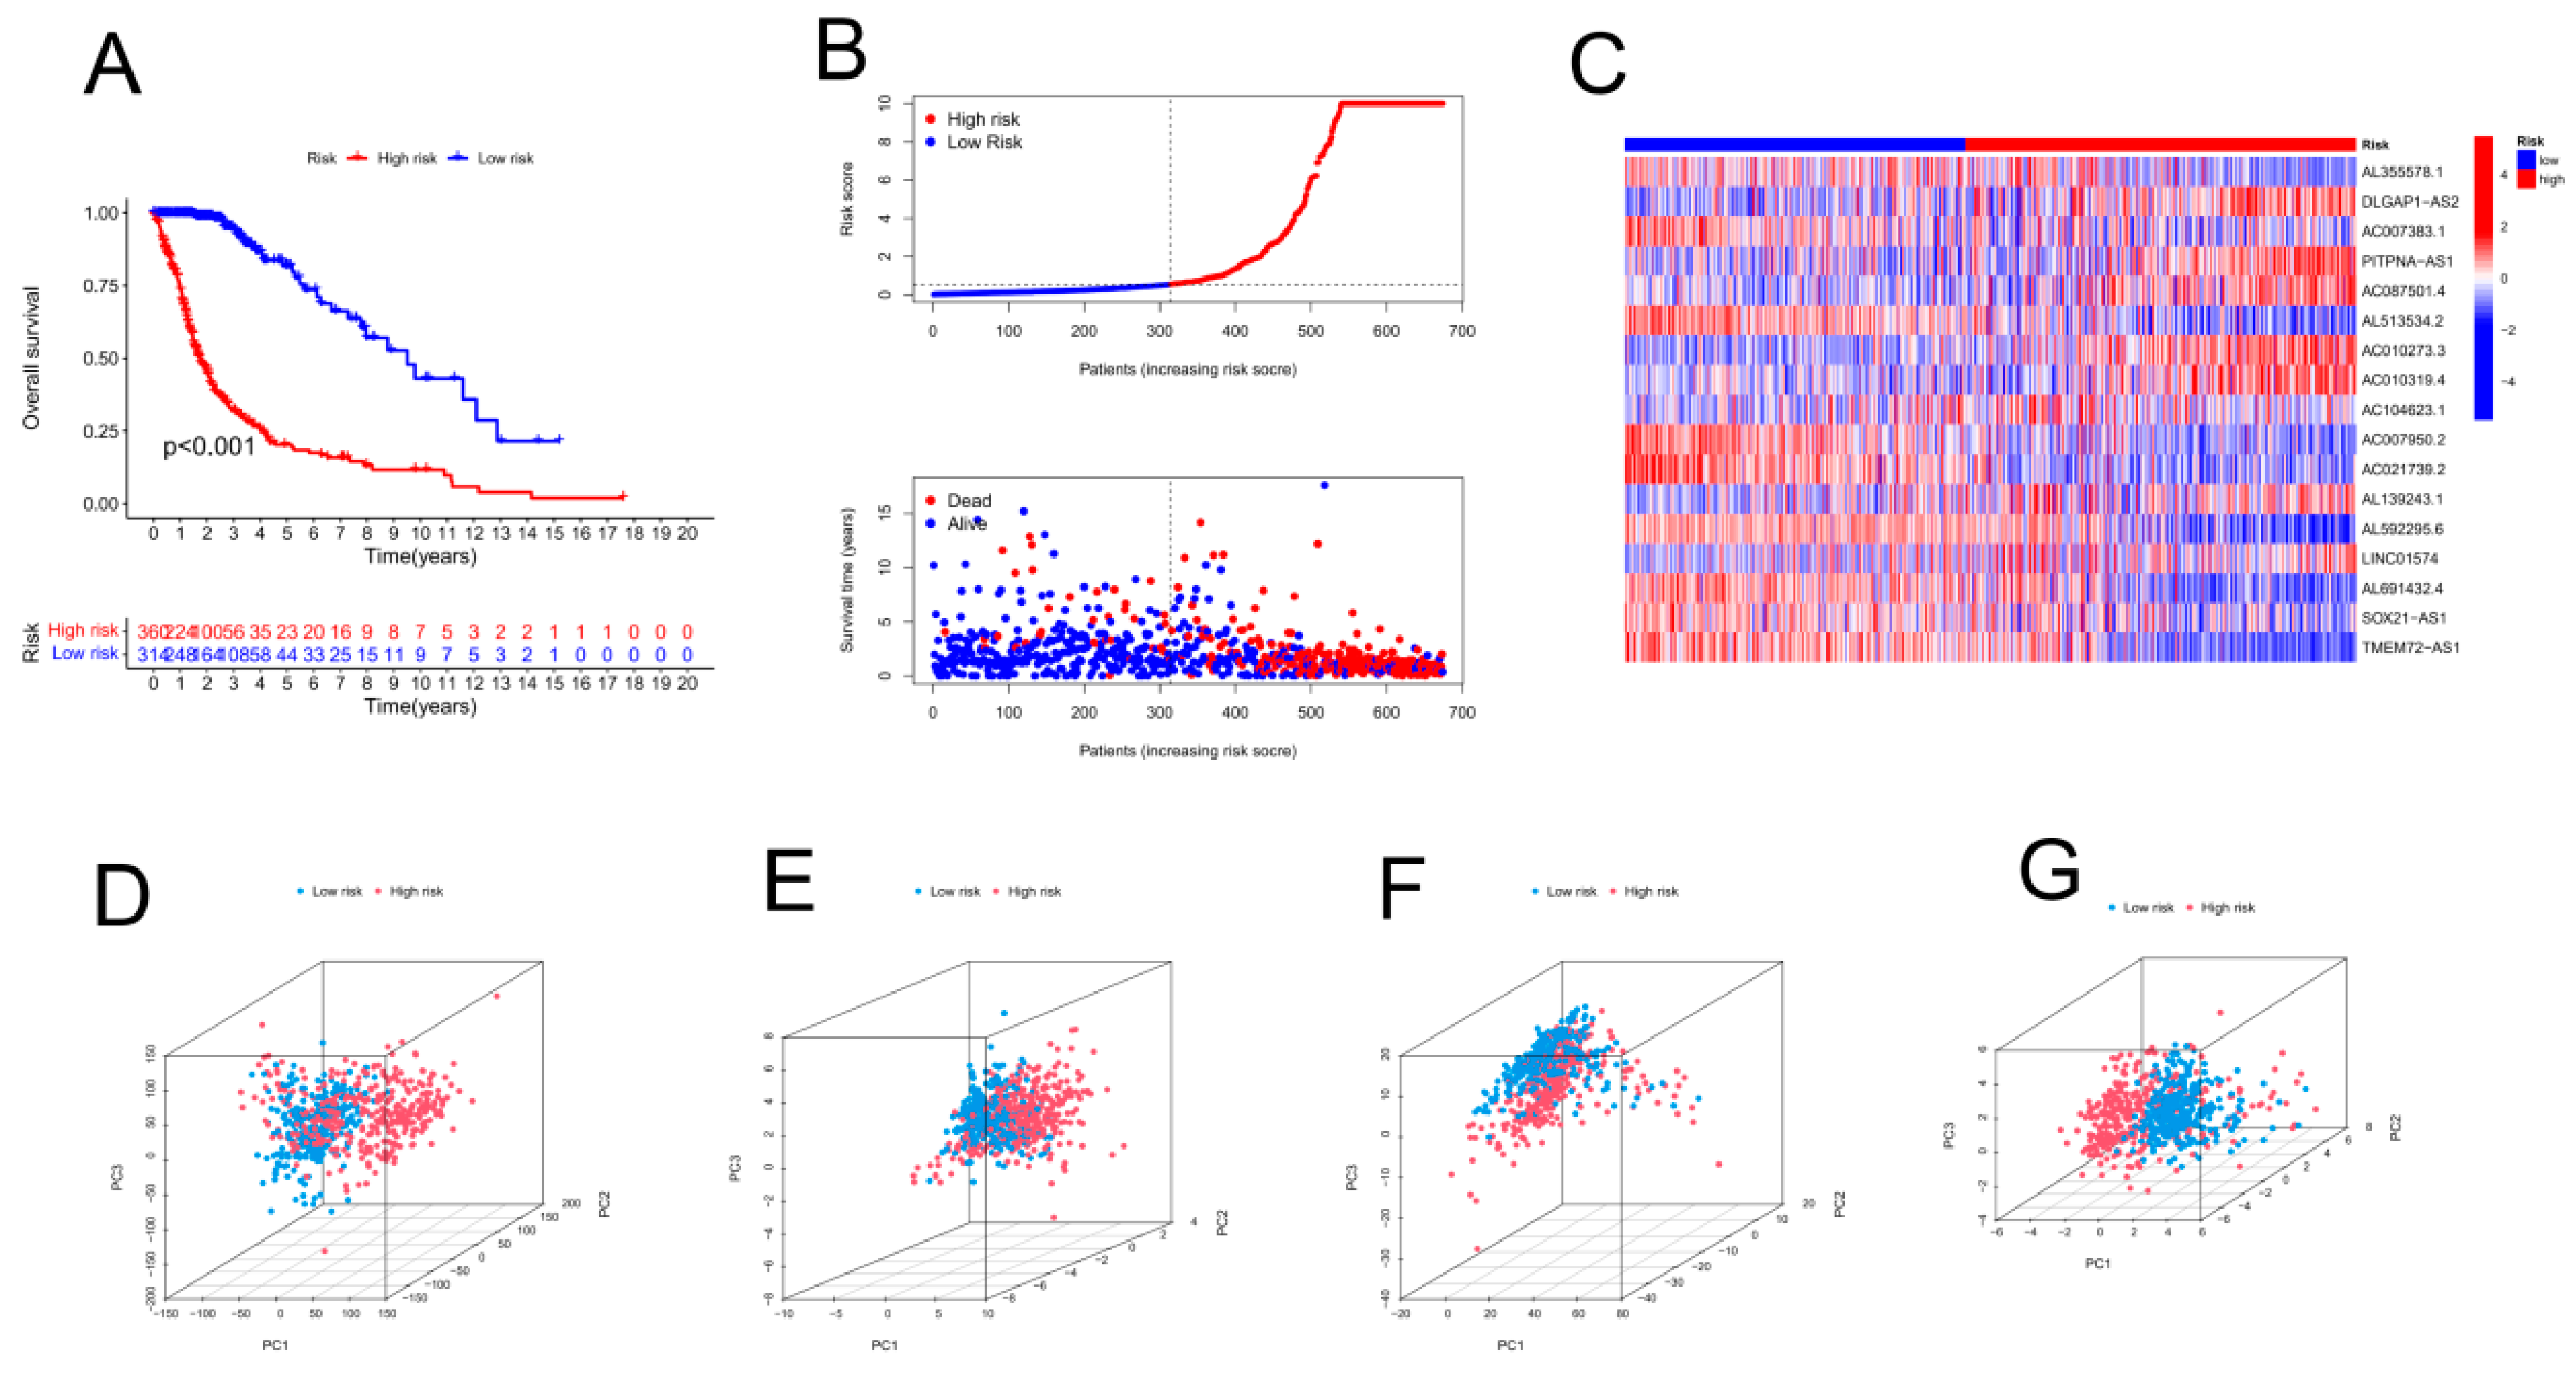
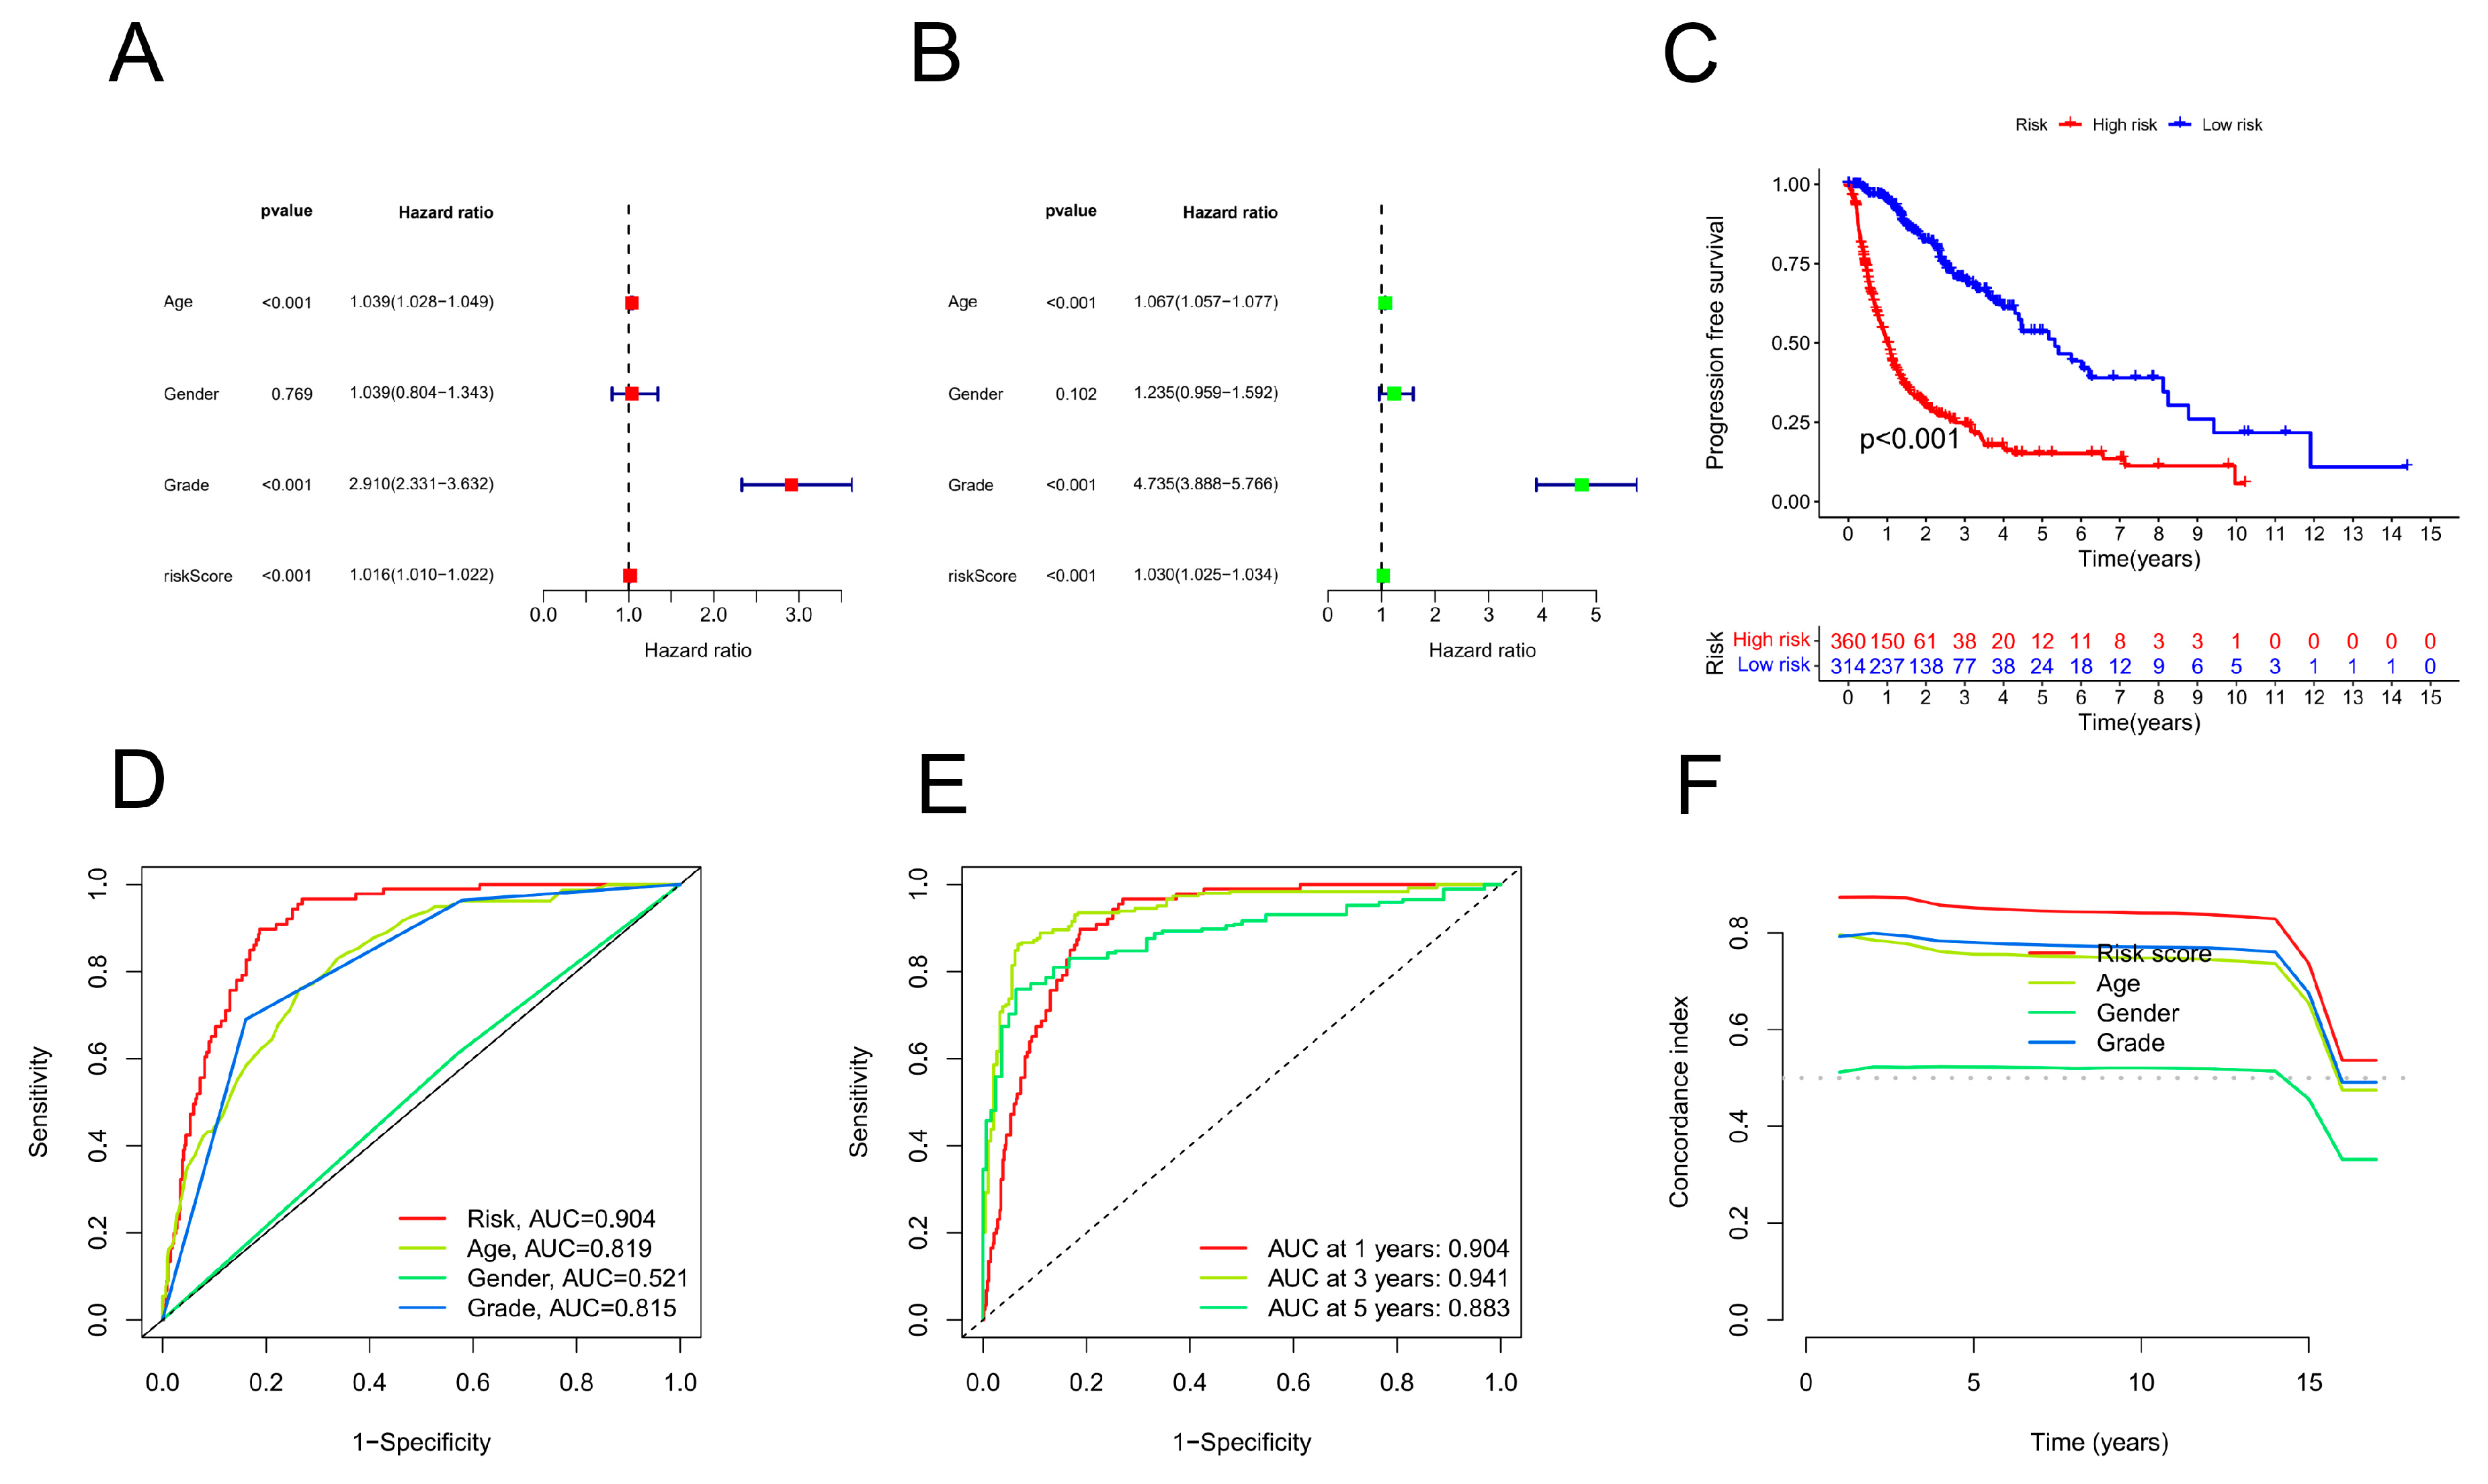
K‒M analysis demonstrated that the OS for those at high risk was inferior to that for those at low risk. Next, the accuracy of the risk model was validated. As shown by the ROC curves, the CRLPM correctly predicted survival at one, three, and five years; all the AUC values exceeded 0.65. Furthermore, PCA distinguished the high-risk group from the low-risk group. Based on glioma patients' distant metastasis, lymph node metastasis, and prognosis, a novel nomogram was developed for predicting PFS.
Additionally, functional enrichment analysis provided valuable insight into the potential biological mechanisms underlying the prognostic effects of CRLPM. An examination of the primary signalling pathways of eight long noncoding RNAs (lncRNAs) was conducted in this study. According to gene ontology (GO) and Kyoto Encyclopedia of Genes and Genomes (KEGG) enrichment analyses, the differentially expressed CRLs were significantly enriched in genes involved in cholesterol metabolism. Numerous signalling pathways, including the complement cascade and coagulation cascade, PPAR and Wnt signalling pathways, PI3K-Akt signalling pathways, and ECM-receptor interactions, as well as neuroactive ligand‒receptor interactions, are associated with salivary secretion.
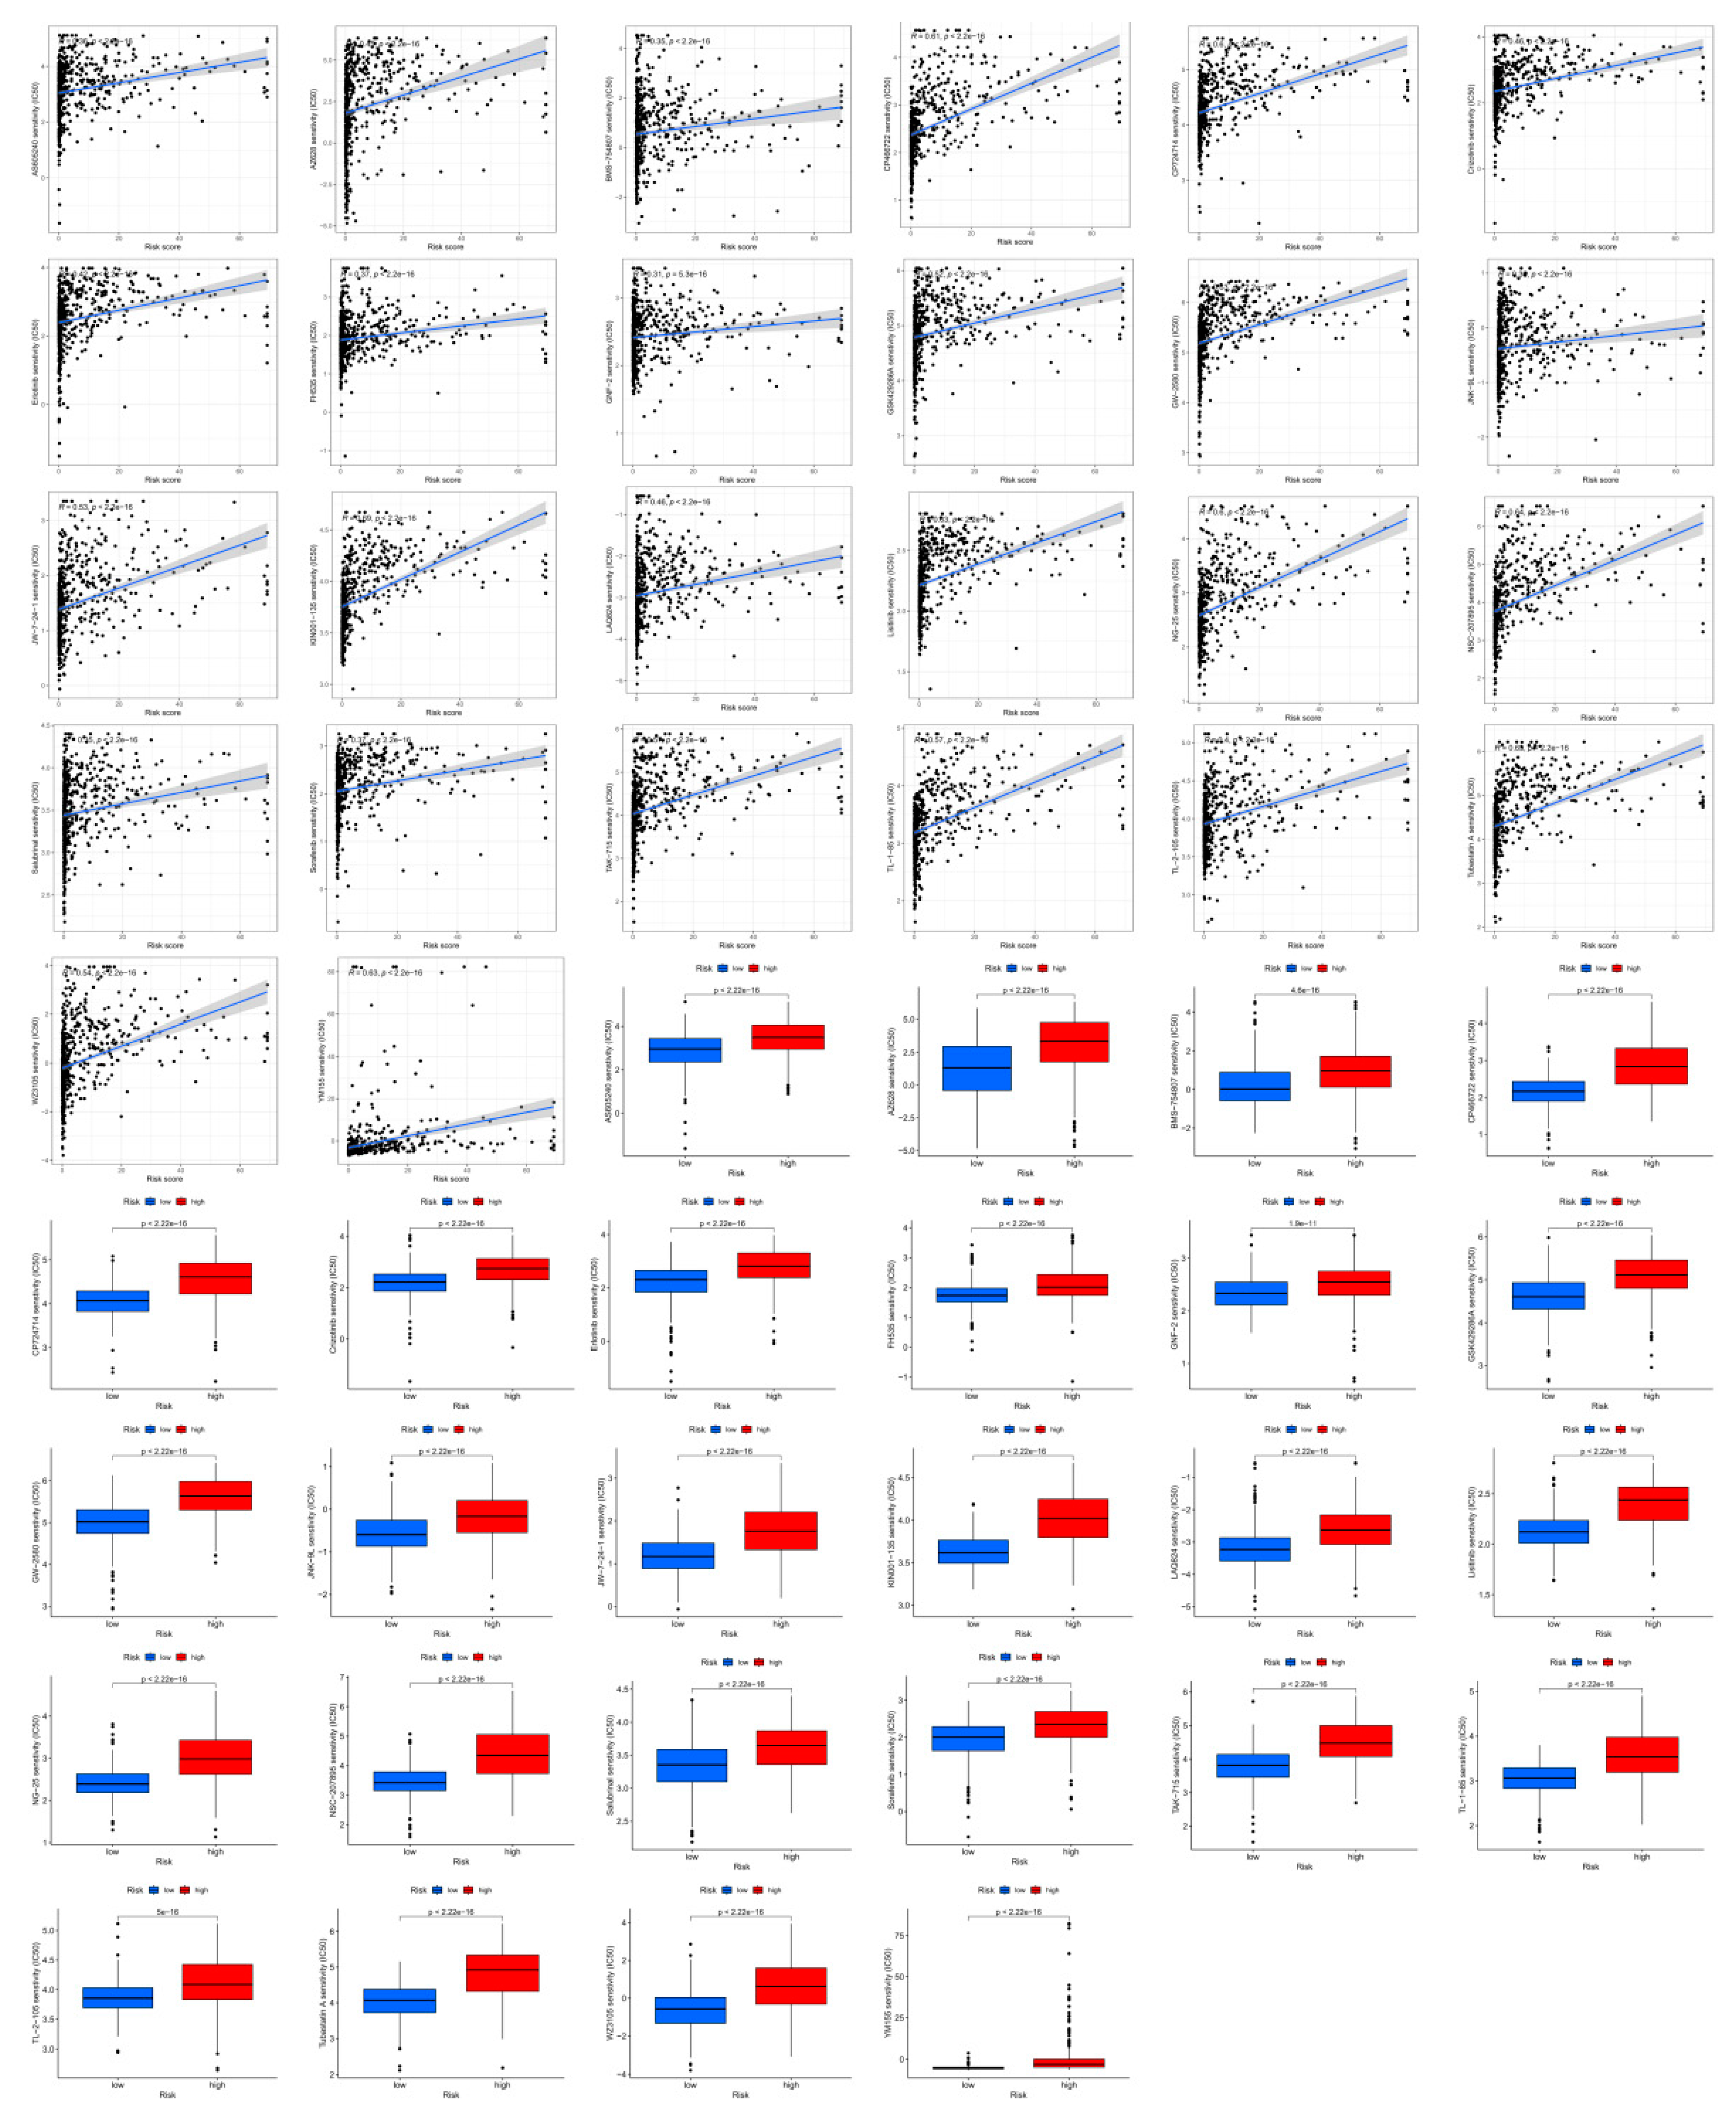
In glioma patients at high risk, the TMB was significantly greater than that in patients at low risk, indicating a superior effect of immunotherapy. Mutations in IDH1 were most frequent among patients with gliomas among the initial 15 genes. Additionally, drug sensitivity analyses were performed based on the CRLPM to guide clinical treatment. For all 36 drugs assessed, significant differences were found between high-risk and low-risk patients in terms of the IC50.
The limitations of our work include the lack of in vitro tissue studies. Second, novel long noncoding RNAs of clinical significance in gliomas require further exploration to identify their molecular mechanisms. The third difference is that this study separated the training set from the test set equally. Through reduced sample differences between the two groups, statistical consistency of clinical measures can be achieved, but parameter estimation can be compromised.
A further limitation is that the analysis of DEGs associated with cuproptosis in glioma patients could not be performed. A larger sample size and a more comprehensive clinical prognostic dataset are recommended for future research, as determined by the TCGA dataset. Additionally, while our predictions were validated using data from public databases, additional biological evidence is required in addition to the statistical evidence we have presented. However, further research is needed to determine the precise mechanism underlying the observed correlations.
Additionally, functional enrichment analysis revealed significant insights into the postulated molecular mechanism that regulates the implicated CRLPM. Cuproptosis signalling pathways were studied for eight long noncoding RNAs (lncRNAs) linked to this process. Gene Ontology (GO) and Kyoto Encyclopedia of Genes and Genomes (KEGG) analyses revealed that the CRLPM gene was the most enriched gene.
Cuproptosis is a promising approach for cancer treatment that may play a significant role in future therapeutic interventions. [
25,
30]. Alternatively, several long noncoding RNAs (lncRNAs) can affect the response to treatment and progression of cancer through a variety of biological processes. Cuproptosis and long noncoding RNAs (lncRNAs) are still poorly understood. Using cuproptosis as a model, this study provides new insights into the development and formation of gliomas. A major objective of this study was to examine cuproptosis indicators that may be employed for assessing glioma prognosis, thus improving its management and treatment. Validation of the findings included the whole dataset as well as the TCGA validation set. However, additional patients should be included in the model to increase its reliability. Preclinical studies are therefore essential for further validation. Furthermore, we will need to perform in vitro and in vivo experiments to validate our findings.
4. Materials and Methods
Patient Data Sources
The RNA sequencing data and clinical information for glioma patients were acquired from the TCGA, which may be accessed at
https://portal.gdc.cancer.gov/. The gene expression profiles and clinical data for glioma patients in the TCGA-GBM-LGG dataset were augmented with additional follow-up information, including age, sex, survival status, and overall survival. Data processing and analysis were performed using R (version 4.1.2) and Perl (Strawberry version) software. The lncRNA annotations were acquired from the GENCODE website, accessible at
http://www.gencodegenes.org/. In addition, genes associated with cuproptosis were identified in accordance with a prior investigation [
17]. The downloaded data were processed in accordance with TCGA regulations.
Nomogram and Calibration
The independent prognostic function of the risk model was examined using univariate and multivariate Cox regression. The survival, regplot, and rms R packages were used to generate a nomogram based on the outcomes of univariate and multivariate Cox regressions. Using the rms package, line graphs of 1-, 3-, and 5-year OS rates for glioma patients were constructed based on risk scores and clinical characteristics. The Hosmer–Lemeshow test was used to construct a calibration curve, which confirmed the effectiveness of the developed nomogram models for making predictions.
Univariate Cox Survival Analysis
Using the coxph function from the R package, we performed a univariate Cox survival analysis on the genes associated with cuproptosis. In addition, we performed further analysis of numerous cuproptosis-associated genes that were deemed significant for the prognosis of glioma patients, with a significance threshold of 0.05. Univariate and multivariate Cox regressions were used to determine whether the risk score model could independently predict patient prognosis.
Functional Enrichment Analysis
Principal component analysis (PCA) was employed to classify the expression profiles of compression-associated long noncoding RNAs (lncRNAs) in glioma specimens, aiming to visually depict the spatial arrangement of samples with diverse risk levels. The correlations between the variables of the samples were visualized using 3D scatter plots. A genetic analysis of differentially expressed genes (DEGs) was performed using the glm method of the "edgeR" R package. With each log fold change (log2FC) set to 1, the false discovery rate (FDR) was set at 0.05. Furthermore, gene ontology (GO) analysis was performed to determine the distinct genes among the low- and high-risk groups to investigate essential DEGs in three categories: biological process (BP), cell component (CC), and molecular function (MF). Differential Kyoto Encyclopedia of Genes and Genomes (KEGG) pathways related to cellular components, biological processes, and molecular functions were also screened, with an FDR of 0.05.
Investigation of the Correlation between Clinical Stage and the Prognostic Risk Score
To determine whether the risk score can be used as an independent predictor of prognosis, both univariate and multivariate models were implemented using Cox regression analysis. Using the R programming language, histograms were generated to predict glioma patient survival at 1, 3, and 5 years in the TCGA cohort. Risk scores and clinicopathologic factors were used to generate histograms.
The Development of a Prognostic Model and Histopathological Analysis of Cuproptosis in Gliomas
The R programming language's "caret" function was used to randomize the samples into training and validation groups. Univariate Cox proportional hazard regression analysis was performed on each long noncoding RNA associated with cuproptosis using the survival R package. To prevent overfitting, we used the “glmnet” package in R, which uses least absolute shrinkage and selection operator-penalized Cox regression. We determined the optimal and minimum penalty criteria through ten cross-validation runs before performing a series of stepwise Cox regression analyses to generate a cuproptosis-related lncRNA prognostic model (CRLPM). A prognostic model based on the LASSO method was used to determine the risk associated with an individual patient.
Model Validation
Patients in the validation and training cohorts were categorized into high-risk and low-risk groups based on their median risk scores and corresponding coefficients. K‒M analysis was used for both the training and validation sets to determine the prognostic performance of the risk score model. Furthermore, the CRLPM was assessed using the area under the curve (AUC) and receiver operating characteristic (ROC) curves. R packages for time ROC and survival ROC were used to calculate the statistical measures. Principal component analysis (PCA) was also used by the researchers to evaluate the risk models. With the help of the R platform's scatterplot3D tool, the results of the PCA were visualized. Survivminer is a package built in the R programming language that provides incremental tools. C-indices were used to assess the accuracy of risk models based on "survival," "rms," "dplyr," and "pec.". Validating the model on full cohorts was primarily intended to authenticate and verify its accuracy and reliability.
TIDE
To assess the infiltration and function of tumour-infiltrating immune cells, the single-sample gene set enrichment analysis (ssGSEA) algorithm function package in the R software genome variation analysis package was used to explore the relationship between the CRLPM risk score and immune cell infiltration. Based on the simulated tumour immune escape mechanism (
http://tide.dfci.harvard.edu), a heatmap was created; next, the tumour immune dysfunction and exclusion (TIDE) algorithm was utilized to predict the immunotherapy response. [
31]. In general, we examined the impact of immunotherapy in high- and low-risk populations using the TIDE algorithm.
Estimation of the Tumour Mutational Burden
In malignant tumours, the tumour mutational burden (TMB) is a measurement of how many mutations are present. We used the R package "maftools" in this study to analyse mutation data from The Cancer Genome Atlas (TCGA). An analysis of the relationship between the TMB and risk score in patients with gliomas is shown in the cascade diagram.
Pathway Enrichment Analysis and Gene Set Enrichment Analysis
Using the R package "limma," we identified differentially expressed genes (DEGs) between high- and low-risk patients. Considering the log2-fold change, DEGs must have a false discovery rate less than 0.05. The KEGG and Gene Ontology databases were used for analysis of molecular functions and critical signalling pathways. ClusterProfiler, org.Hs.egdb, and enrichplot were used for this analysis.
Drug Sensitivity
A measure of drug efficacy or treatment effectiveness is the half-maximal inhibitory concentration (IC50). In this study, we examined the correlation between the CRG risk score and the sensitivity of gliomas to commonly prescribed medications. Several R packages, including "pRRophetic" and its dependent programs, including "car, ridge preprocessCore, genefilter, and sva", were used to evaluate drug sensitivity in individuals with gliomas. Using the Wilcoxon signed rank test, we calculated the difference between the high-risk and low-risk groups in terms of the IC50 values for common antineoplastic drugs.
Statistical Analysis
For analysis of the bioinformatics data, we used R version 4.1.3. To determine whether the groups differed significantly, we used a Wilcoxon rank-sum test. The data were analysed using the Perl programming language (version). To analyse the differences between two or more groups, Student's t test and one-way ANOVA were used. Using Kaplan‒Meier analysis, we assessed and compared the overall survival rates of two distinct patient cohorts. Cox regression analysis, LASSO analysis, and univariate analysis were used to assess the prognostic value of the signature. To assess the correlation of gene expression, Pearson correlation analysis was used. The dependability and sensitivity of the prognostic signature were studied using receiver operating characteristic (ROC) curves and areas under the curve (AUCs). Statistical significance was determined by a p value of 0.05.
5. Conclusions
Globally, gliomas rank among the most prevalent malignant tumours, and their inherent heterogeneity complicates their pathophysiology. In this way, many biomarkers could be integrated into a unified model, and their predictive precision could be evaluated, thus enhancing treatment regimen customization and effectiveness, immunological significance, and the ability to assess the responsiveness to specific drugs.
We systematically analysed the prognostic value of cuproptosis-related lncRNAs in gliomas. Several lncRNAs associated with cuproptosis have demonstrated high levels of accuracy in predicting patient outcomes during glioma treatment. Furthermore, 17 cuproptosis-related lncRNAs were found to be reliable for predicting the clinical outcome of patients with colon adenocarcinoma. Further investigation of the interactions between cuproptosis-related lncRNAs and glioma is warranted based on our findings. A further benefit of this study is that three specific lncRNAs associated with cuproptosis were identified, which could serve as potential targets for the treatment of gliomas.
As a result, we demonstrated that a novel therapeutic approach can be used to tailor treatment for glioma patients and predict the response to immunotherapy. A total of eight long noncoding RNAs (lncRNAs) implicated in cuproptosis have been proposed as potential therapeutic targets for gliomas.
Figure 1.
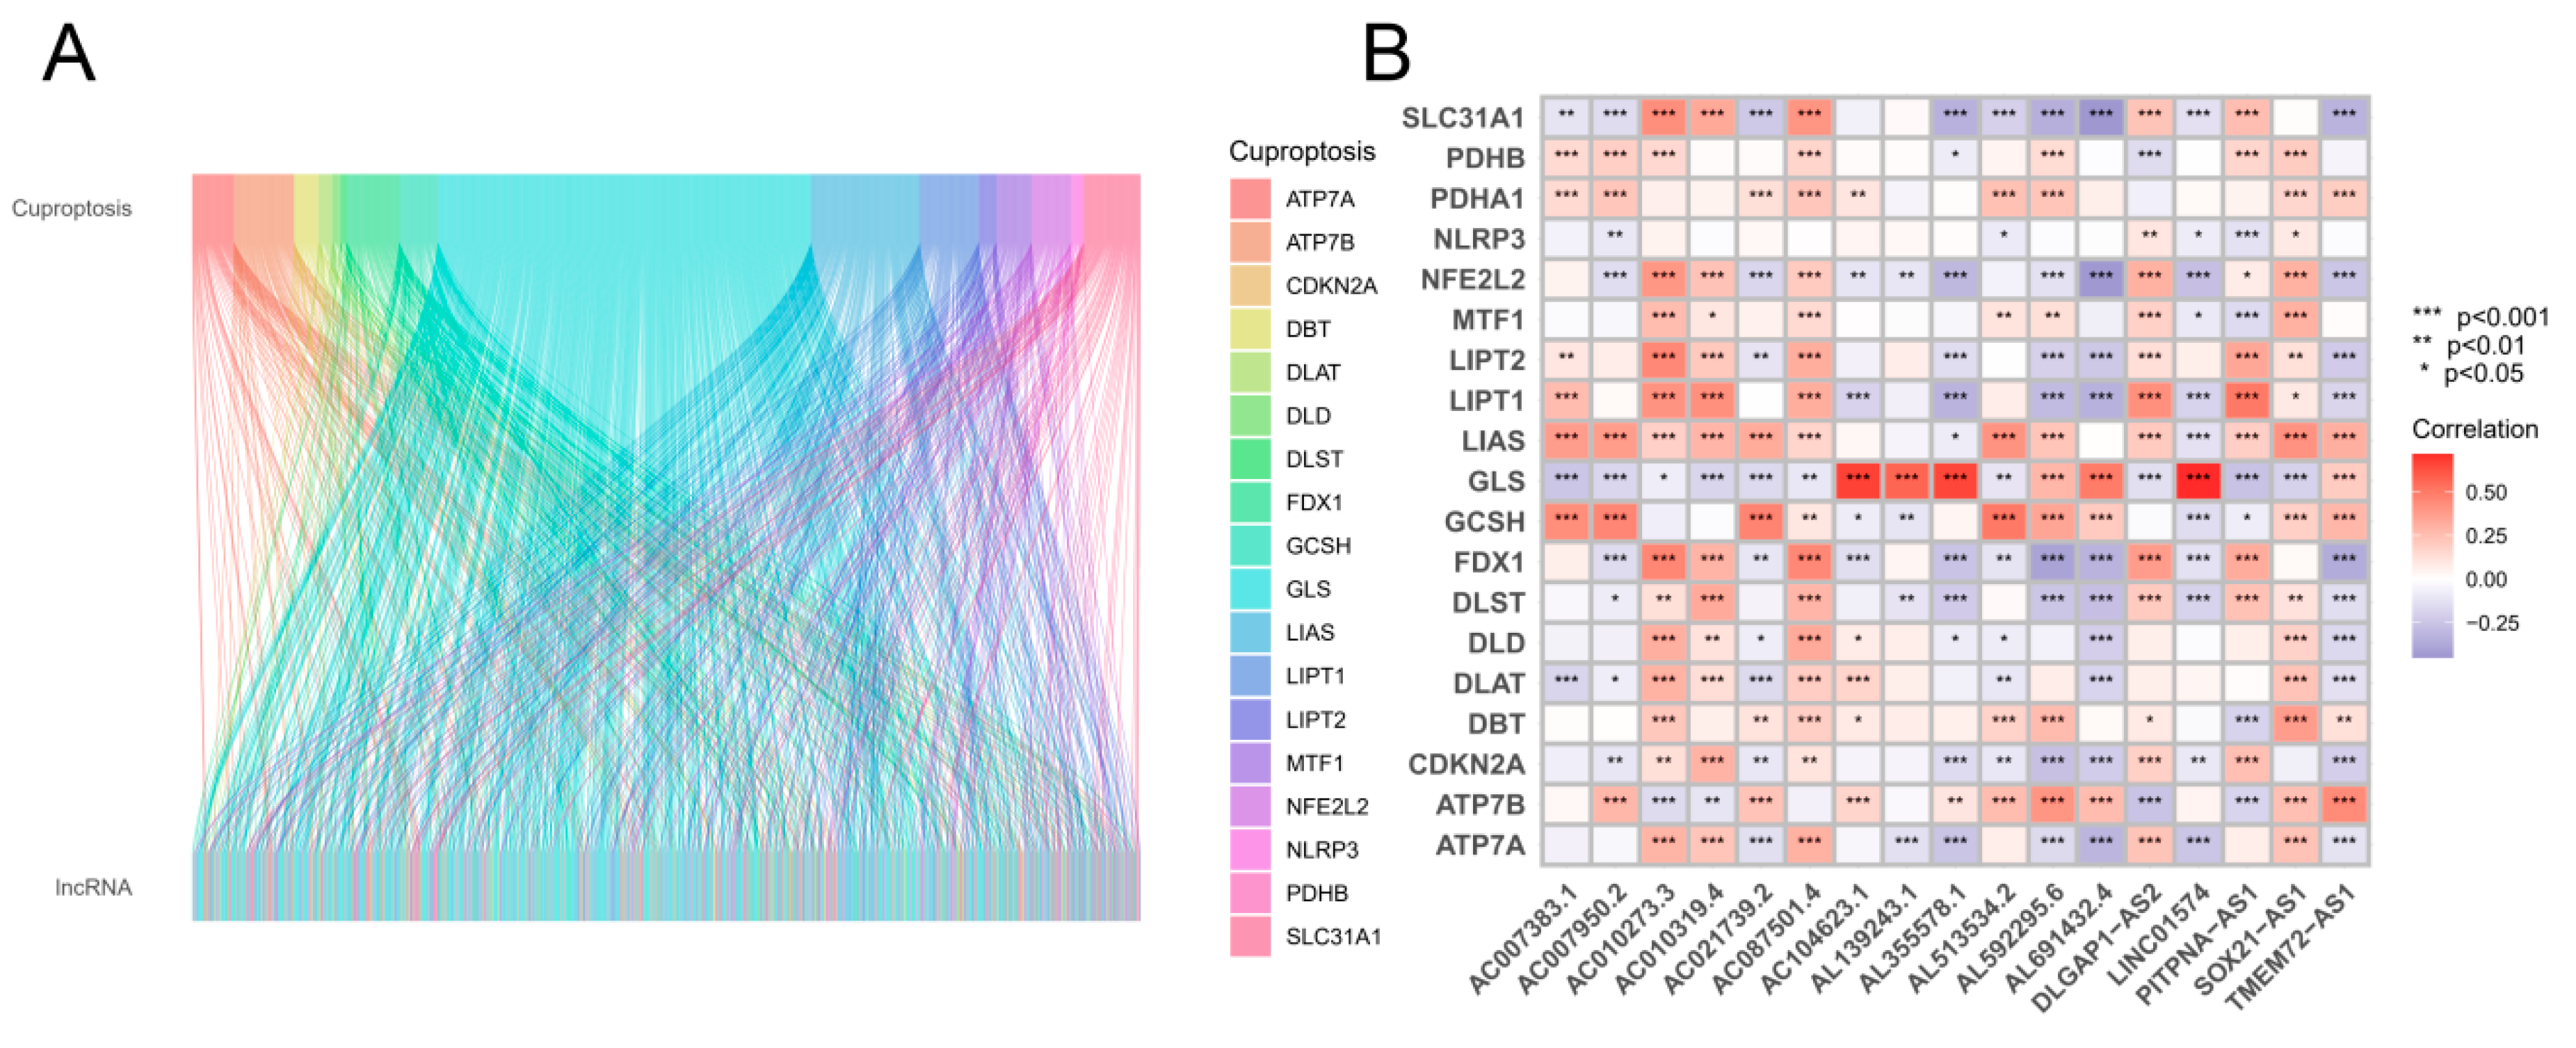
Sankey diagram and heatmap. (A) According to the Sankey diagram, 1177 cuproptosis-related long noncoding RNAs (lncRNAs) coexpressed with 19 cuproptosis-related genes are shown. (B) The correlation between 19 genes associated with cuproptosis and 17 long noncoding RNAs associated with prognosis. *p < 0.05, **p < 0.01, and ***p < 0.001.
Figure 2.
The development of a prognostic cuprotosis-associated long noncoding RNA (lncRNA) risk model for gliomas. (A) Univariate Cox regression analysis of lncRNAs associated with cuproptosis. (B–C) For the construction of prognostic models, LASSO Cox regression analysis was used. (D) Survival curves for the high-risk and low-risk groups based on Kaplan‒Meier curves. (E) The distribution of risk scores and survival status among patients with GBM. (F) Prognostic markers and overall survival heatmap. (G) Kaplan‒Meier survival curves from the validation cohort. (H) Risk score distribution and survival status of the validation cohort. (I) Validation cohort heatmap showing prognostic markers and overall survival.
Figure 3.
Validation of the risk model within the entire cohort and principal component analysis. (A) Kaplan–Meier curves for survival analysis in the entire cohort. (B) Survival status of the entire cohort based on risk score distribution. (C) Overall survival and prognostic markers for the entire cohort in a heatmap. PCA was performed by using the following genes as a proxy for risk: (D) all genes, (E) cuproptosis-related genes, (F) cuproptosis-related long noncoding RNAs (lncRNAs), and (G) cuproptosis-related lncRNAs.
Figure 4.
Prognostic analysis of overall survival for gliomas (GBMs). (A) Univariate Cox analysis was conducted. Age, stage, and risk score were statistically significant. (B) Statistical significance was found for age, stage, and risk score in a multivariate Cox analysis. (C) PFS curves based on the Kaplan‒Meier method. (D) On the basis of the TimeROC curve, 1-, 3-, and 5-year OS was predicted for GBM patients. (E) ROC curve analysis demonstrated that the risk model was more accurate than other clinical parameters in predicting patient outcome. (F) According to the C-index, the risk model was more accurate than other clinical parameters for predicting mortality.
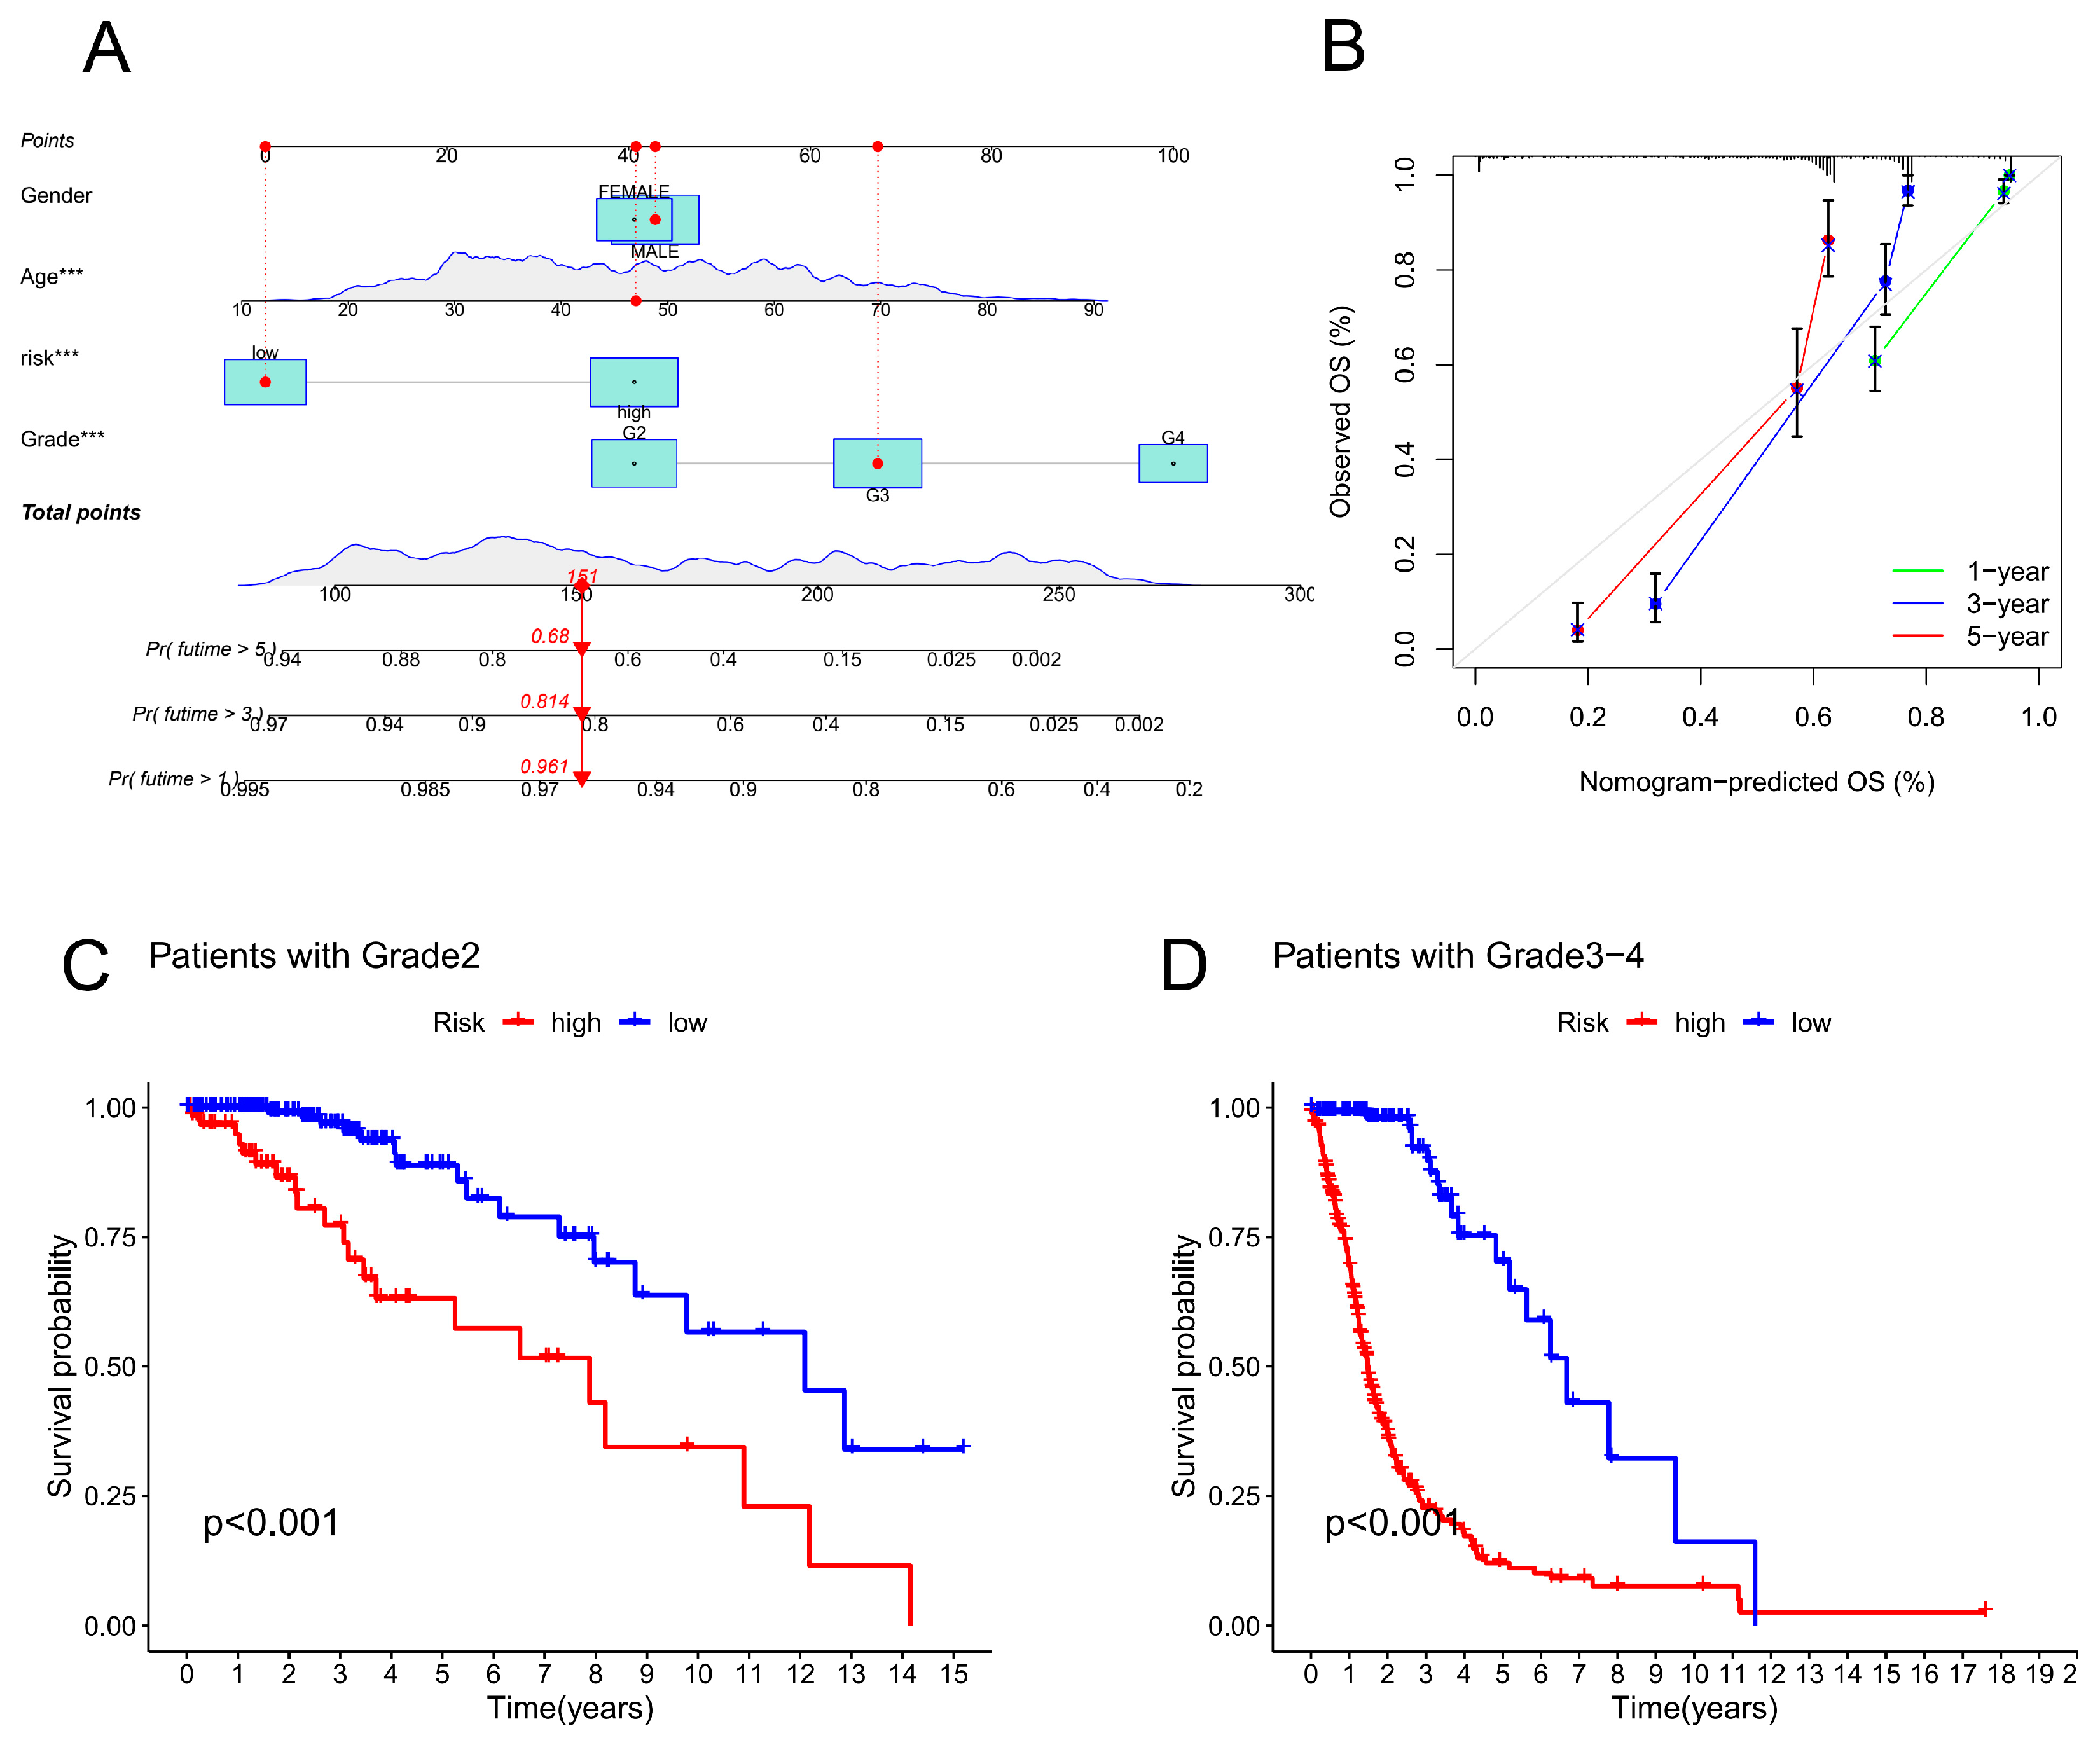
Figure 5.
Evaluation of the CRLPM-based nomogram. (A) CRLPM was used to construct the nomogram for predicting prognosis. (B) Predictions of survival over 1, 3, and 5 years are based on calibration curves. (C) Patients with stage II cancer and Kaplan–Meier curves. (D) Kaplan‒Meier curves for patients with stage III through IV disease.
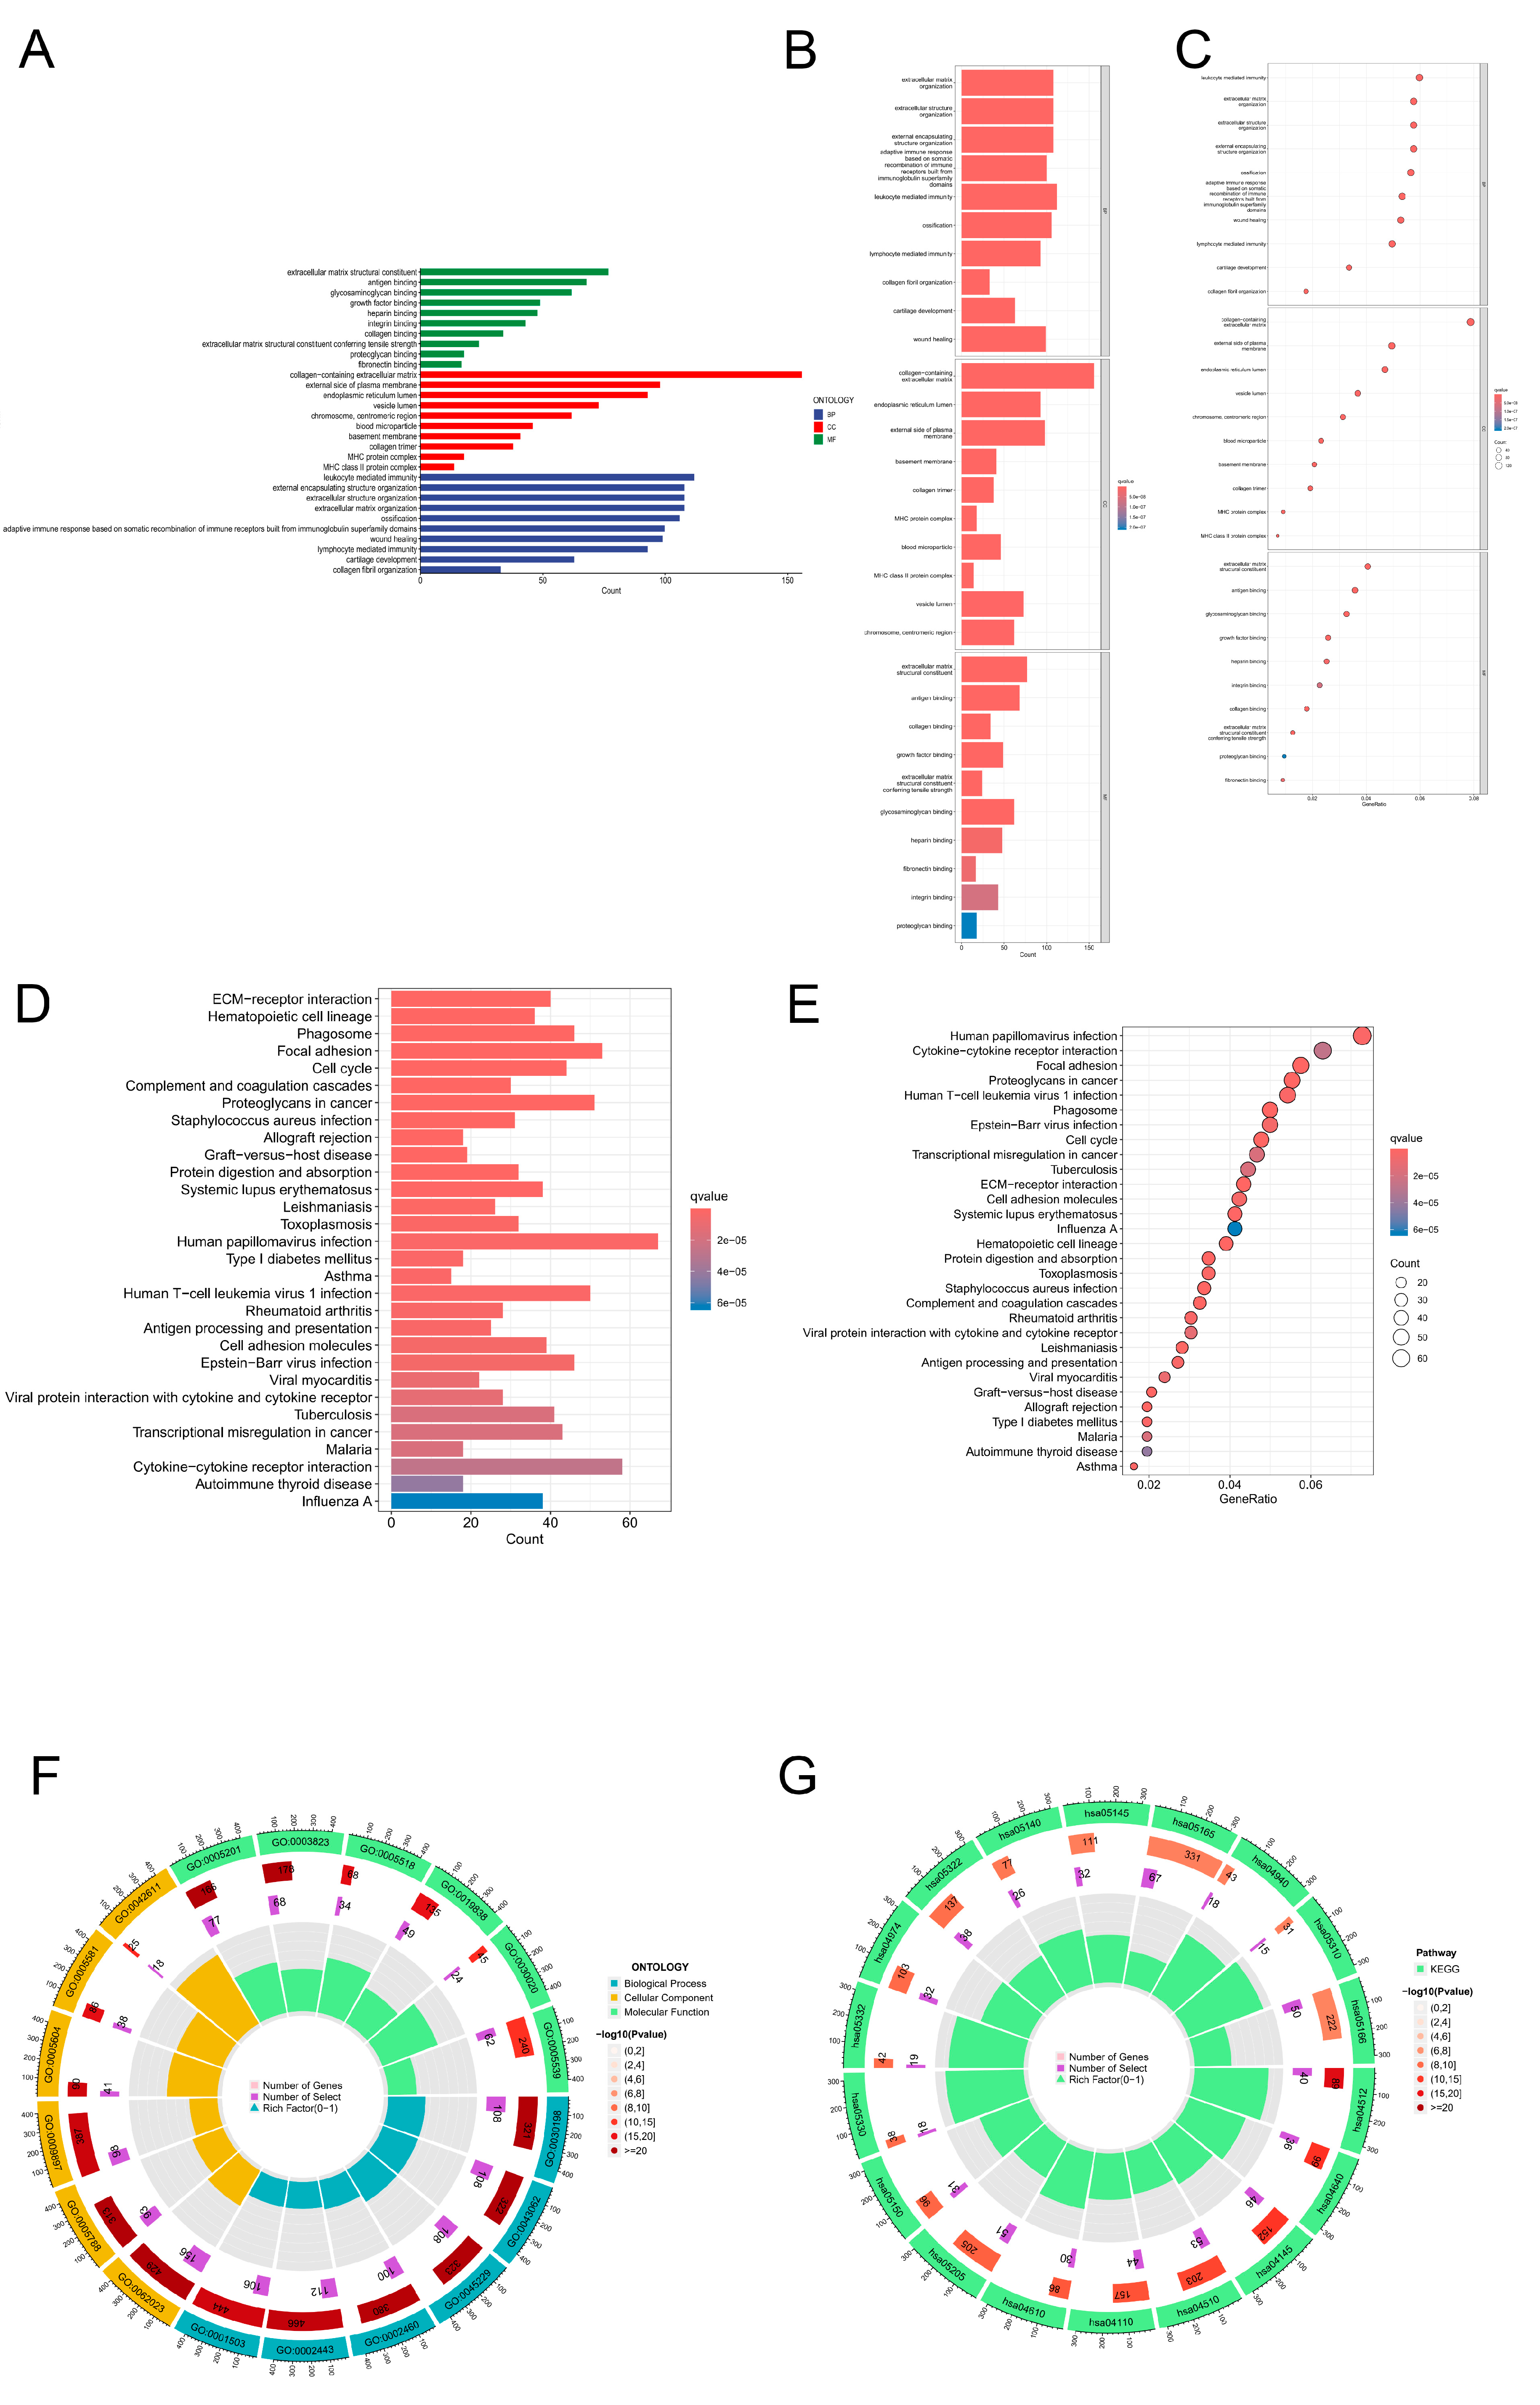
Figure 6.
Gene Ontology (GO) and Kyoto Encyclopedia of Genes and Genomes (KEGG) enrichment analyses. (A) A bar plot showing the top 30 enriched GO terms by category is shown below. (B) Bar plot of the top 30 enriched GO terms by categorys. (C) Bubble plot of the top 30 GO enrichment terms. (D) Bar plot of the top 30 enriched KEGG terms. (E) Bubble chart of the top 30 enriched KEGG terms. (F) Circle diagram of KEGG enrichment analysis of biological processes, cellular components, and molecular functions. (G) Circle diagram of GO enrichment analysis of biological processes, cellular components, and molecular functions.
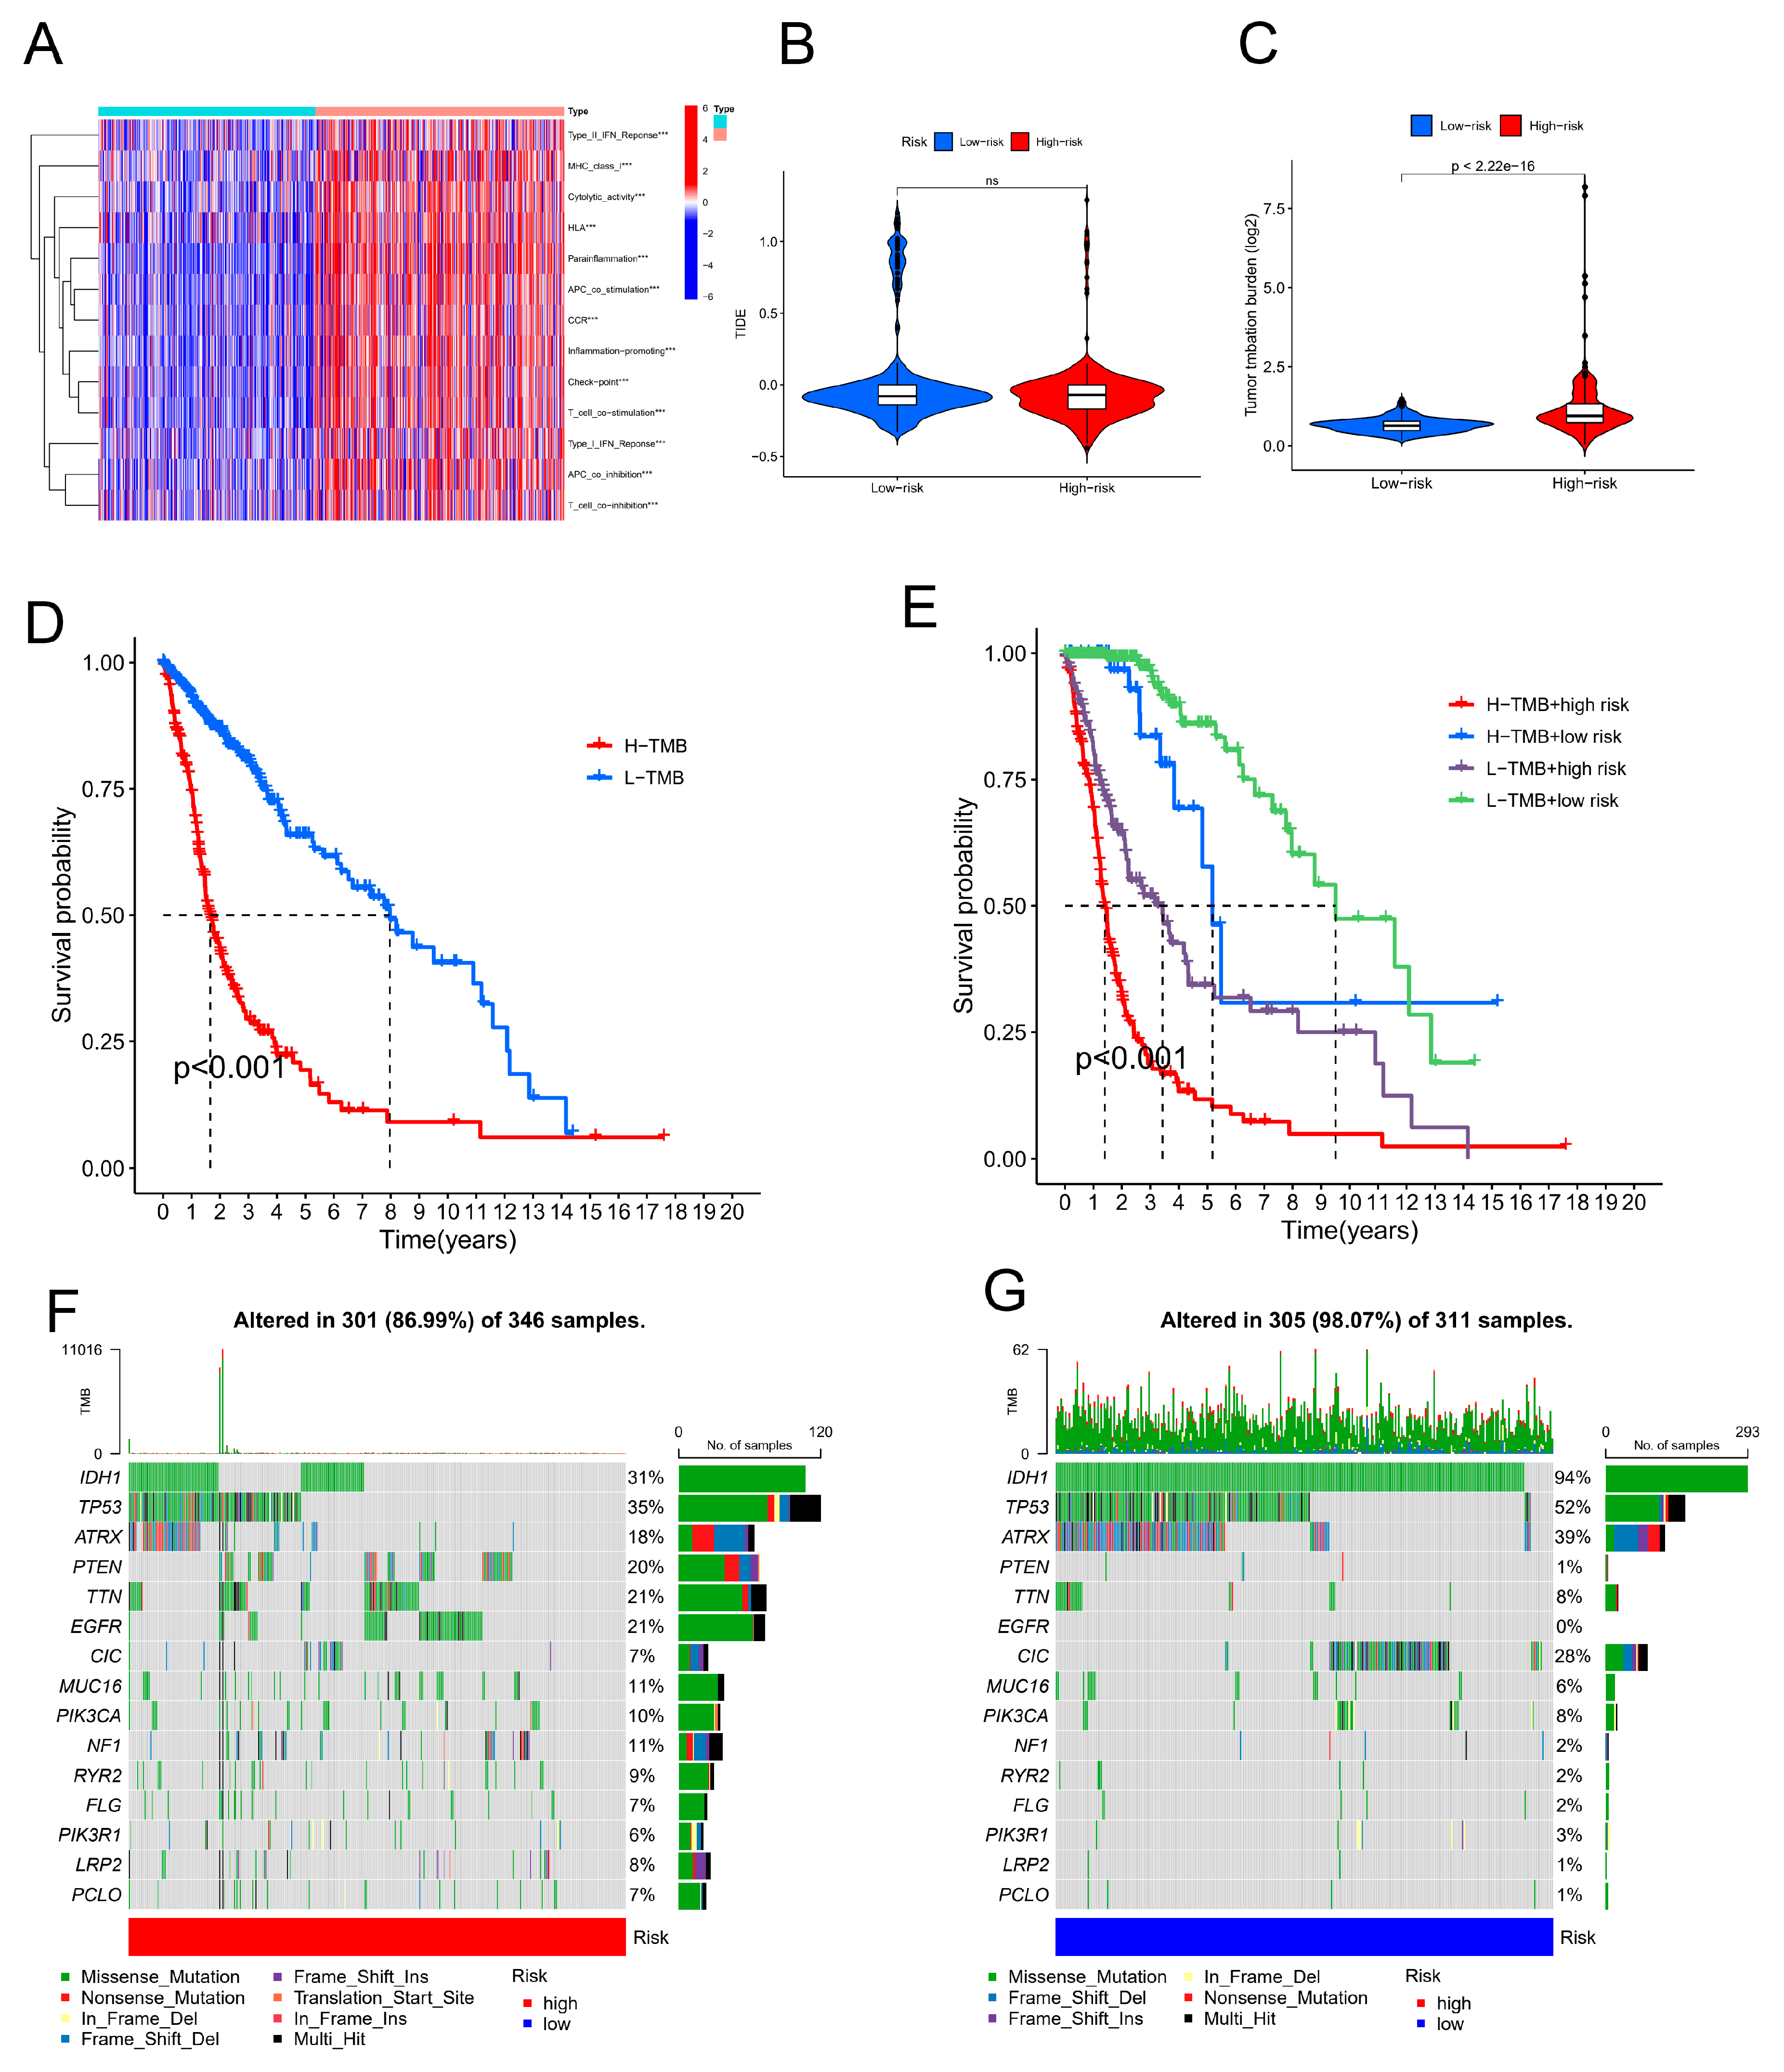
Figure 7.
The immunological landscape of glioblastoma (GBM) patients and their cancer mutation burden (TMB). (A) An analysis of single-sample gene set enrichment algorithms selected from the highest-risk and lowest-risk groups in GBM was conducted to create a heatmap showing tumour-infiltrating lymphocytes. *p < 0.05, **p < 0.01, and ***p < 0.001. (B) TIDE prediction scores for the high-risk vs. low-risk groups. (C) TMB differences between the high- and low-risk groups in GBM patients. (D) Survival analysis of the high- and low-TMB groups. (E) Combined TMB risk and survival curve of patients with GBM. (F) The top 15 mutated genes in the high-risk group of GBM patients are plotted in a waterfall graph. (G) The top 15 mutated genes in patients at low risk of GBM are shown in a waterfall plot.
Figure 8.
Drug sensitivity (IC50) correlated with high- and low-risk patients with glioma.
Figure 8.
Drug sensitivity (IC50) correlated with high- and low-risk patients with glioma.
