Submitted:
06 May 2024
Posted:
07 May 2024
You are already at the latest version
Abstract
Keywords:
1. Introduction
- i
- A brief assessment of the literature on India’s manufacturing industries.
- ii
- A quick explanation of ISM-MCDM DEMATEL’s approaches and their specific applications
- iii
- A case study of the Indian manufacturing sector in which ISM and DEMATEL approaches are used to determine the individual relationships and impacts amongst certain obstacles. The whole studied work is presented in the conclusion section.
2. Theoretical Background
2.1. Scarcity of LCSCM Techniques in Industry Visions and Missions
2.2. Lack of Industry Leadership and Support
2.3. Inadequate Experience and Application Knowledge
2.4. Random Industrial System
2.5. Scarcity of Industrial Resources
2.6. Suppliers’ Grasp of the LCSCM System Is Limited.
2.7. Less Technological Applicability in Industry
2.8. Less Consideration for Low-Carbon Management
2.9. Less Government Support
2.10. Less Financial Support for This System
2.11. Competitive Market Challenge & System Uncertainty
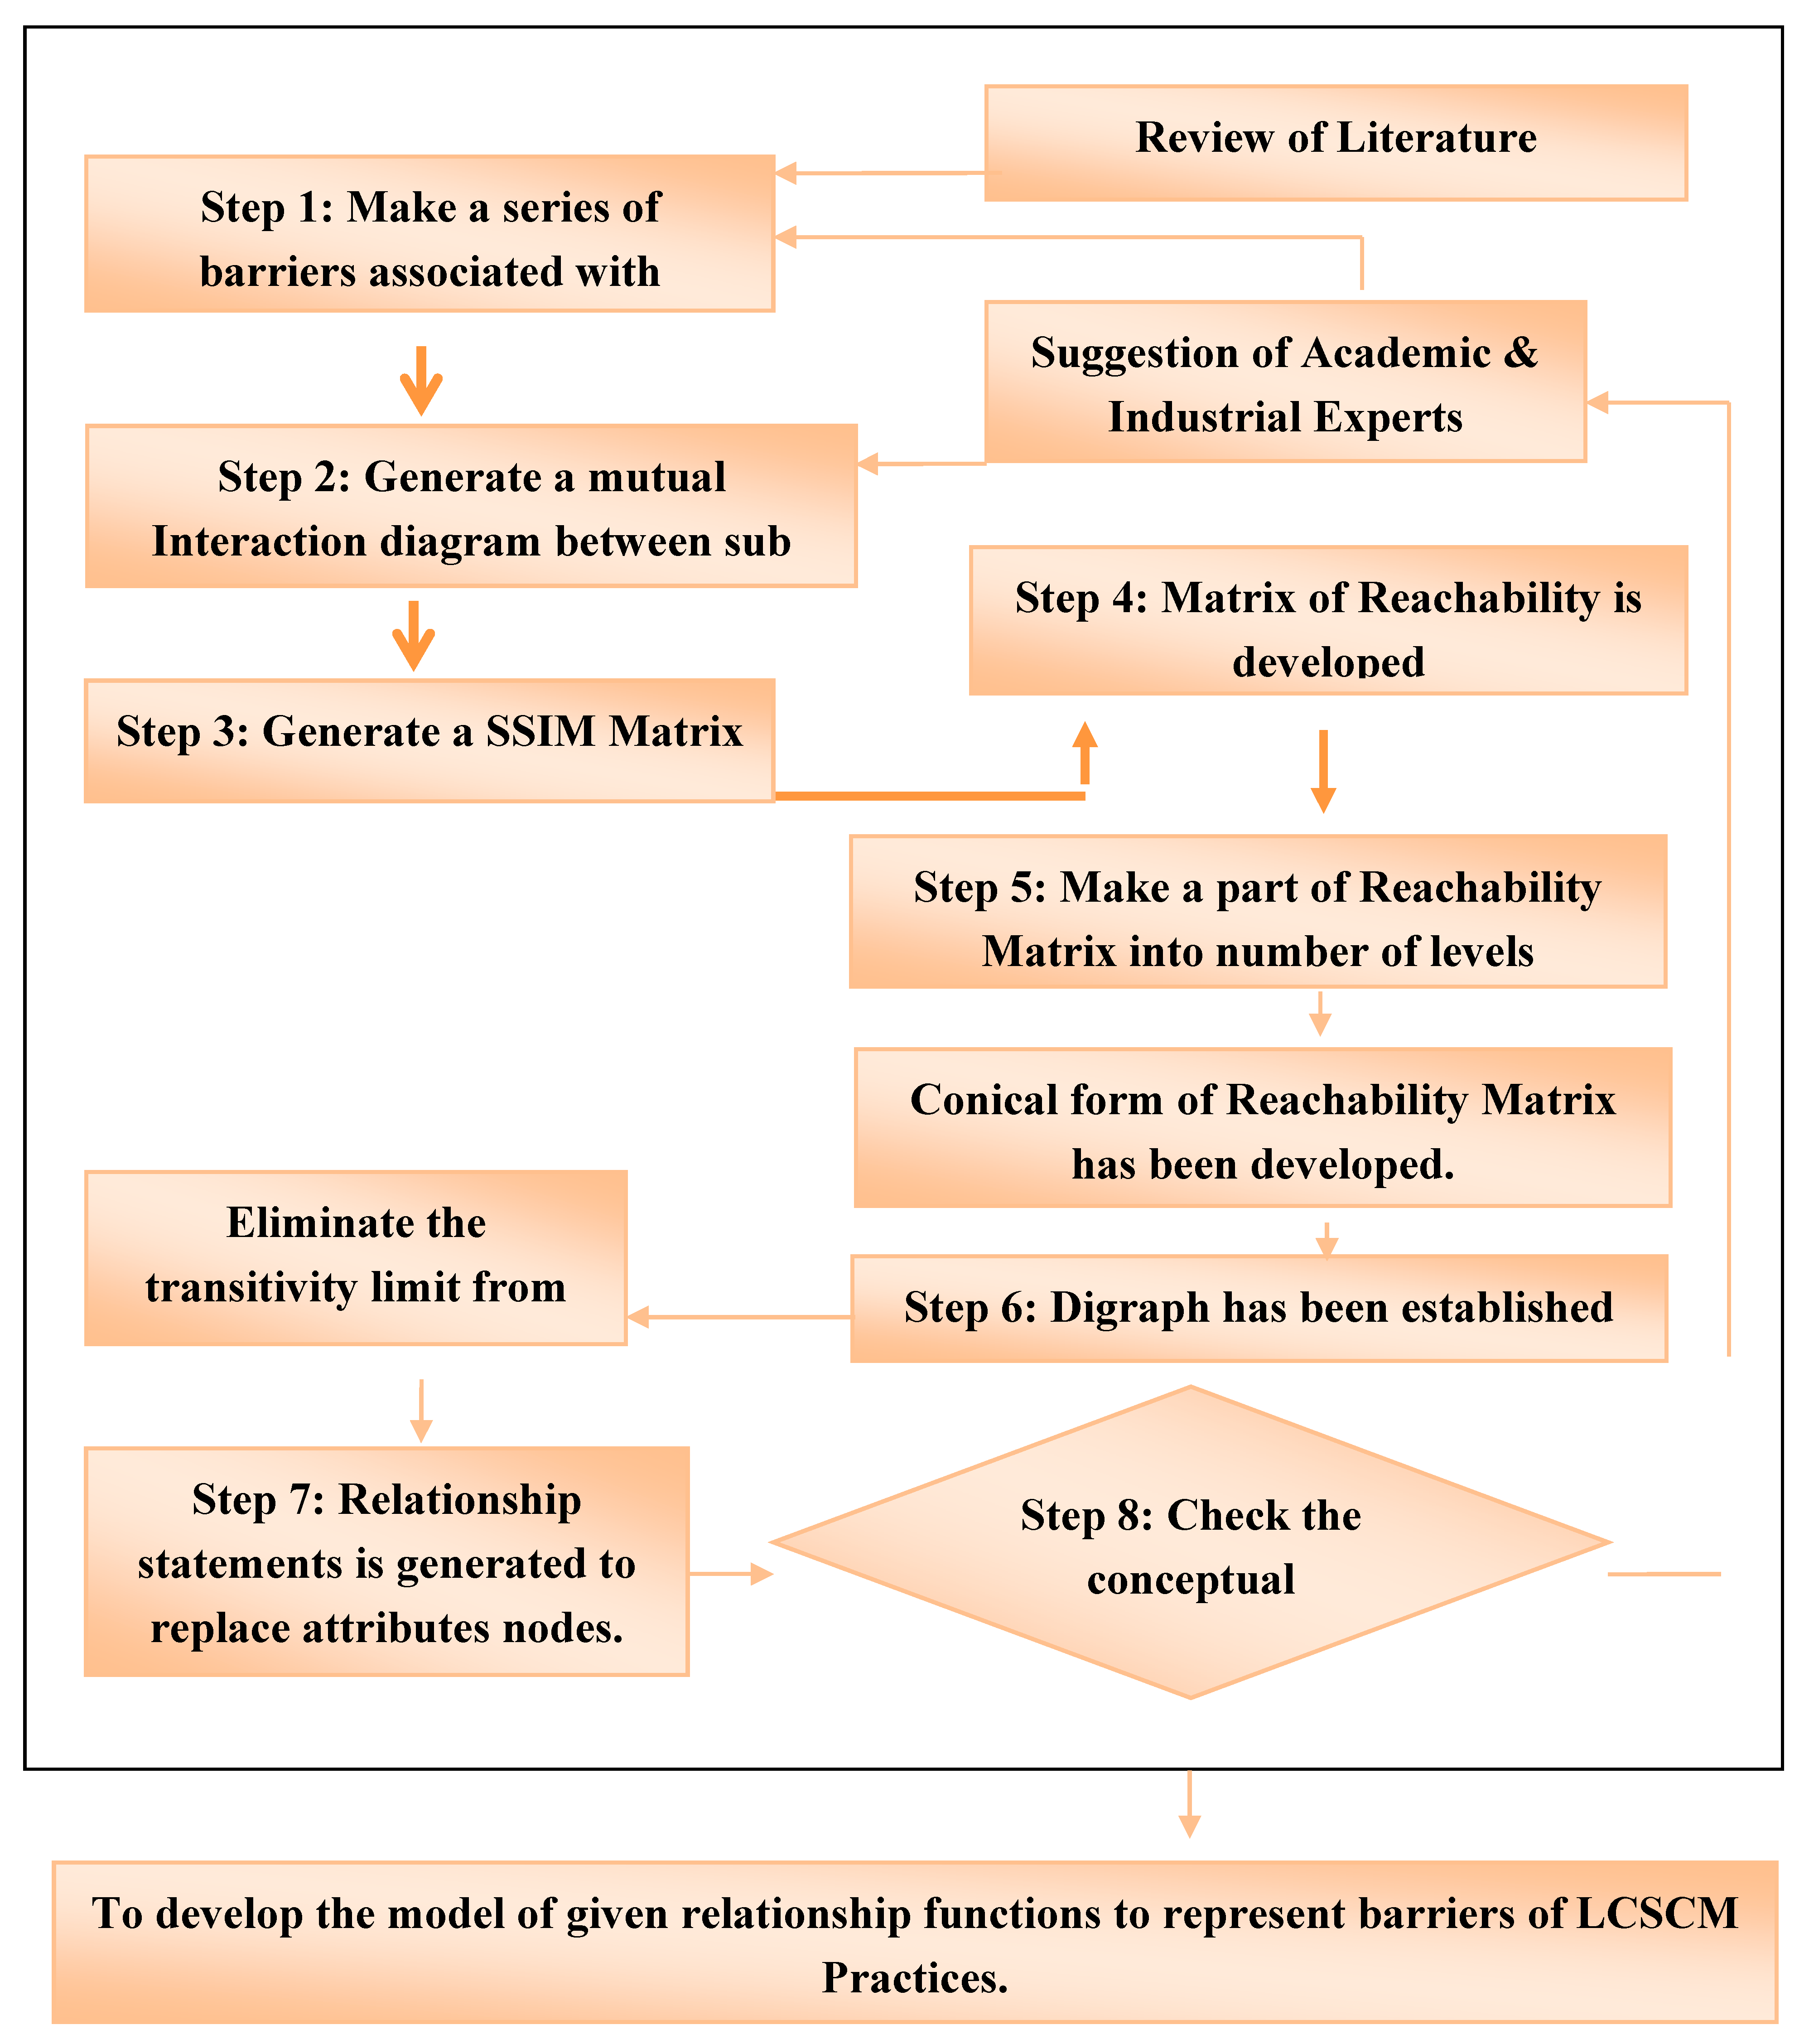
3. Interpretive Structural Modeling (ISM) Technique
Parts of ISM Technique
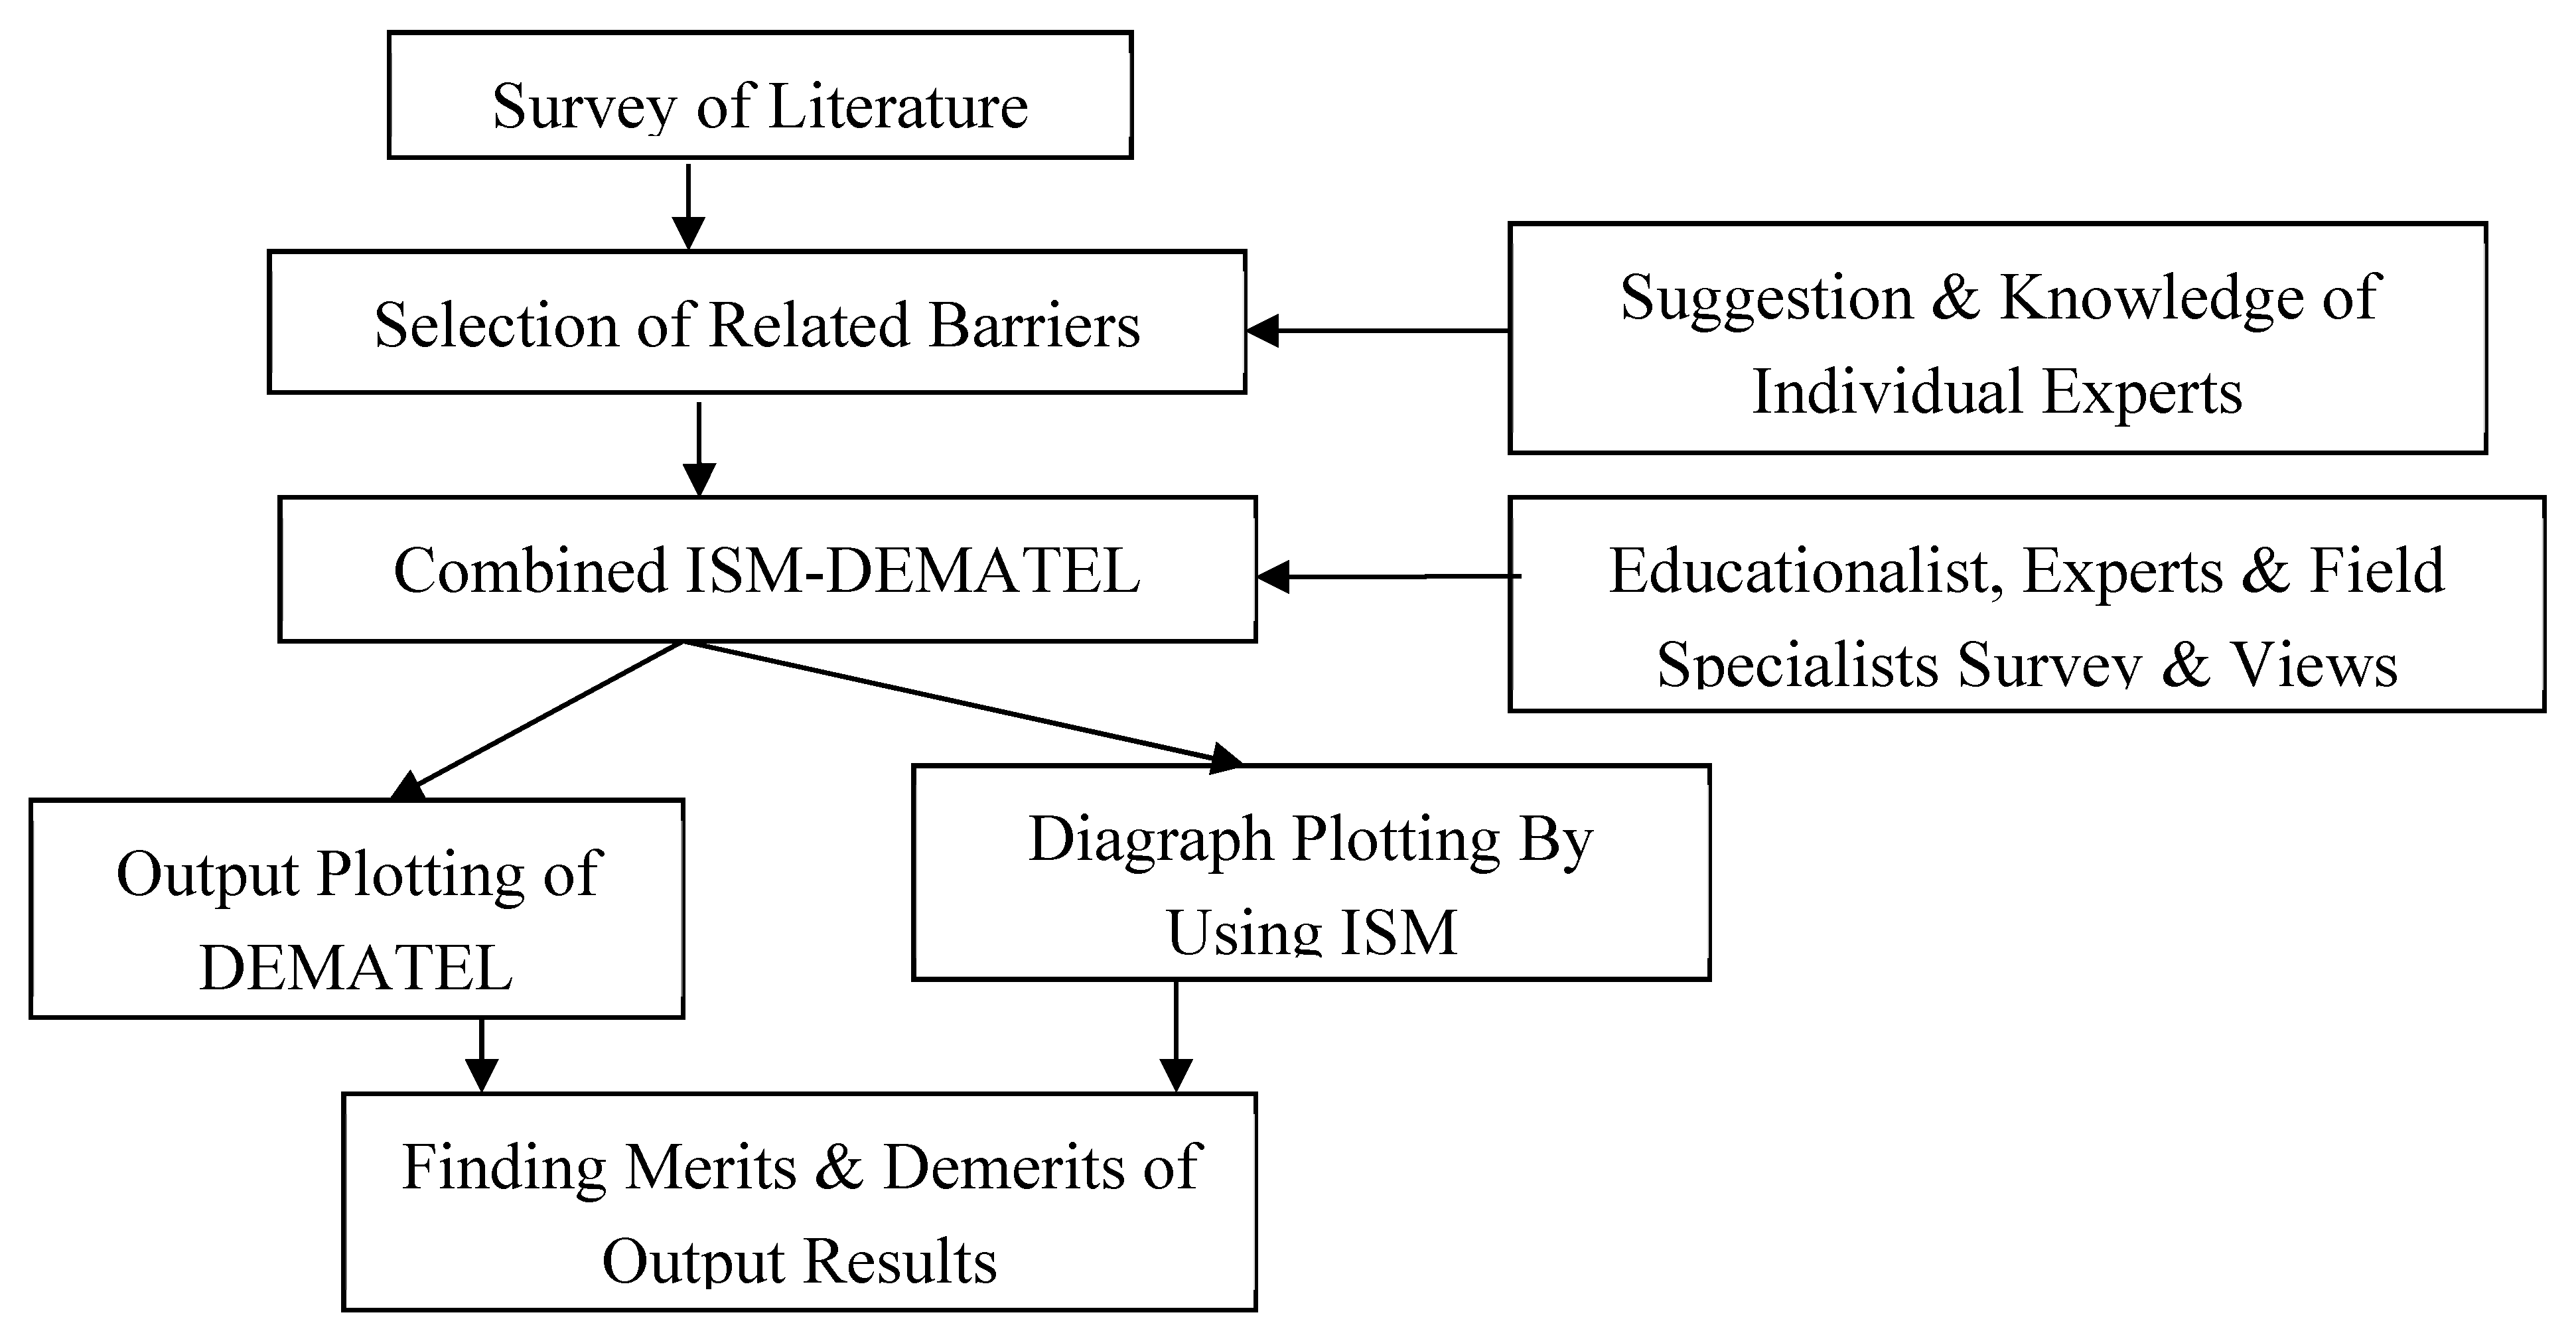
4. ISM-DEMATEL
- Both ISM and DEMATEL approaches are used to determine the cause-effect connection between all relevant decision factors.
- When this combination approach is used, the generated connection becomes very simple to grasp.
- The entire approach is designed in such a way that the ISM technique may create binary data between elements such as (0, 1), and with the analysis of these data, cause and effect relationships can be simply prepared.
4.1. Data Collection Technique and Self-Interrelation Matrix
4.2. Starting Reachability of Matrix
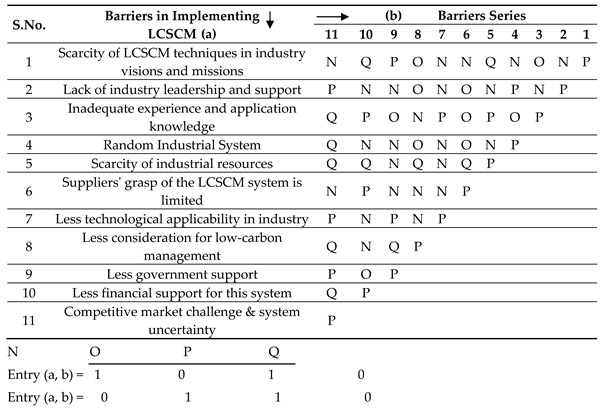
- If the value of (a, b) in the self-interaction matrix is N, the value of (a, b) in the access matrix will be shown as 1 and the value of (b, a) will be shown as 0; in N (1,7) in the self-interaction matrix, ’1’ is placed in the position (1,7) and ’0’ is placed in the position (7,1) again in the starting access matrix.
- If the value of (a, b) in the self-interaction matrix is O, the value of (a, b) in the access matrix will be shown by 0 and the value of (b, a) will be shown by 1; in O (2,11) in the self-interaction matrix, ’0’ is placed in the position (2,11) and ’1’ is placed in the position (11,2) again in the starting access matrix.
- If the value of (a, b) in the self-interaction matrix is P, (a, b) value in the access matrix will be shown by 1 and (a, b) value will also be given by 1; in P (4,11) in the self-interaction matrix, ’1’ is placed in position (4,11) and ’1’ is placed in position (11,4) in the starting accessible matrix.
- If the value of (a, b) in the self-interaction matrix is Q, the value of (a, b) in the access matrix will be shown by 0 and the value of (a, b) will also be given by 0; in Q (8,12) in the self-interaction matrix, ’0’ is placed in the position (8,12) and ’0’ is placed in the position (12,8) in the starting accessible matrix.
| S.No. | Barriers in implementing LCSCM | Barriers Series | ||||||||||
|---|---|---|---|---|---|---|---|---|---|---|---|---|
| 1 | 2 | 3 | 4 | 5 | 6 | 7 | 8 | 9 | 10 | 11 | ||
| 1 | Scarcity of LCSCM techniques in industry visions and missions | 1 | 1 | 0 | 1 | 0 | 1 | 1 | 0 | 1 | 0 | 1 |
| 2 | Lack of industry leadership and support | 0 | 1 | 1 | 1 | 1 | 0 | 1 | 0 | 1 | 1 | 1 |
| 3 | Inadequate experience and application knowledge | 1 | 0 | 1 | 0 | 1 | 0 | 1 | 1 | 0 | 1 | 0 |
| 4 | Random Industrial System | 0 | 1 | 1 | 1 | 1 | 0 | 1 | 0 | 1 | 1 | 0 |
| 5 | Scarcity of industrial resources | 0 | 0 | 1 | 0 | 1 | 0 | 1 | 0 | 1 | 0 | 0 |
| 6 | Suppliers’ grasp of the LCSCM system is limited | 0 | 1 | 1 | 1 | 0 | 1 | 1 | 1 | 1 | 1 | 1 |
| 7 | Less technological applicability in industry | 0 | 0 | 1 | 0 | 0 | 0 | 1 | 1 | 1 | 1 | 1 |
| 8 | Less consideration for low-carbon management | 1 | 1 | 0 | 1 | 0 | 0 | 0 | 1 | 0 | 1 | 0 |
| 9 | Less government support | 1 | 0 | 1 | 0 | 0 | 0 | 1 | 0 | 1 | 0 | 1 |
| 10 | Less financial support for this system | 0 | 0 | 1 | 0 | 0 | 1 | 0 | 0 | 1 | 1 | 0 |
| 11 | Competitive market challenge & system uncertainty | 0 | 1 | 0 | 0 | 0 | 0 | 1 | 0 | 1 | 0 | 1 |
4.3. Group-Wise Formation into Levels
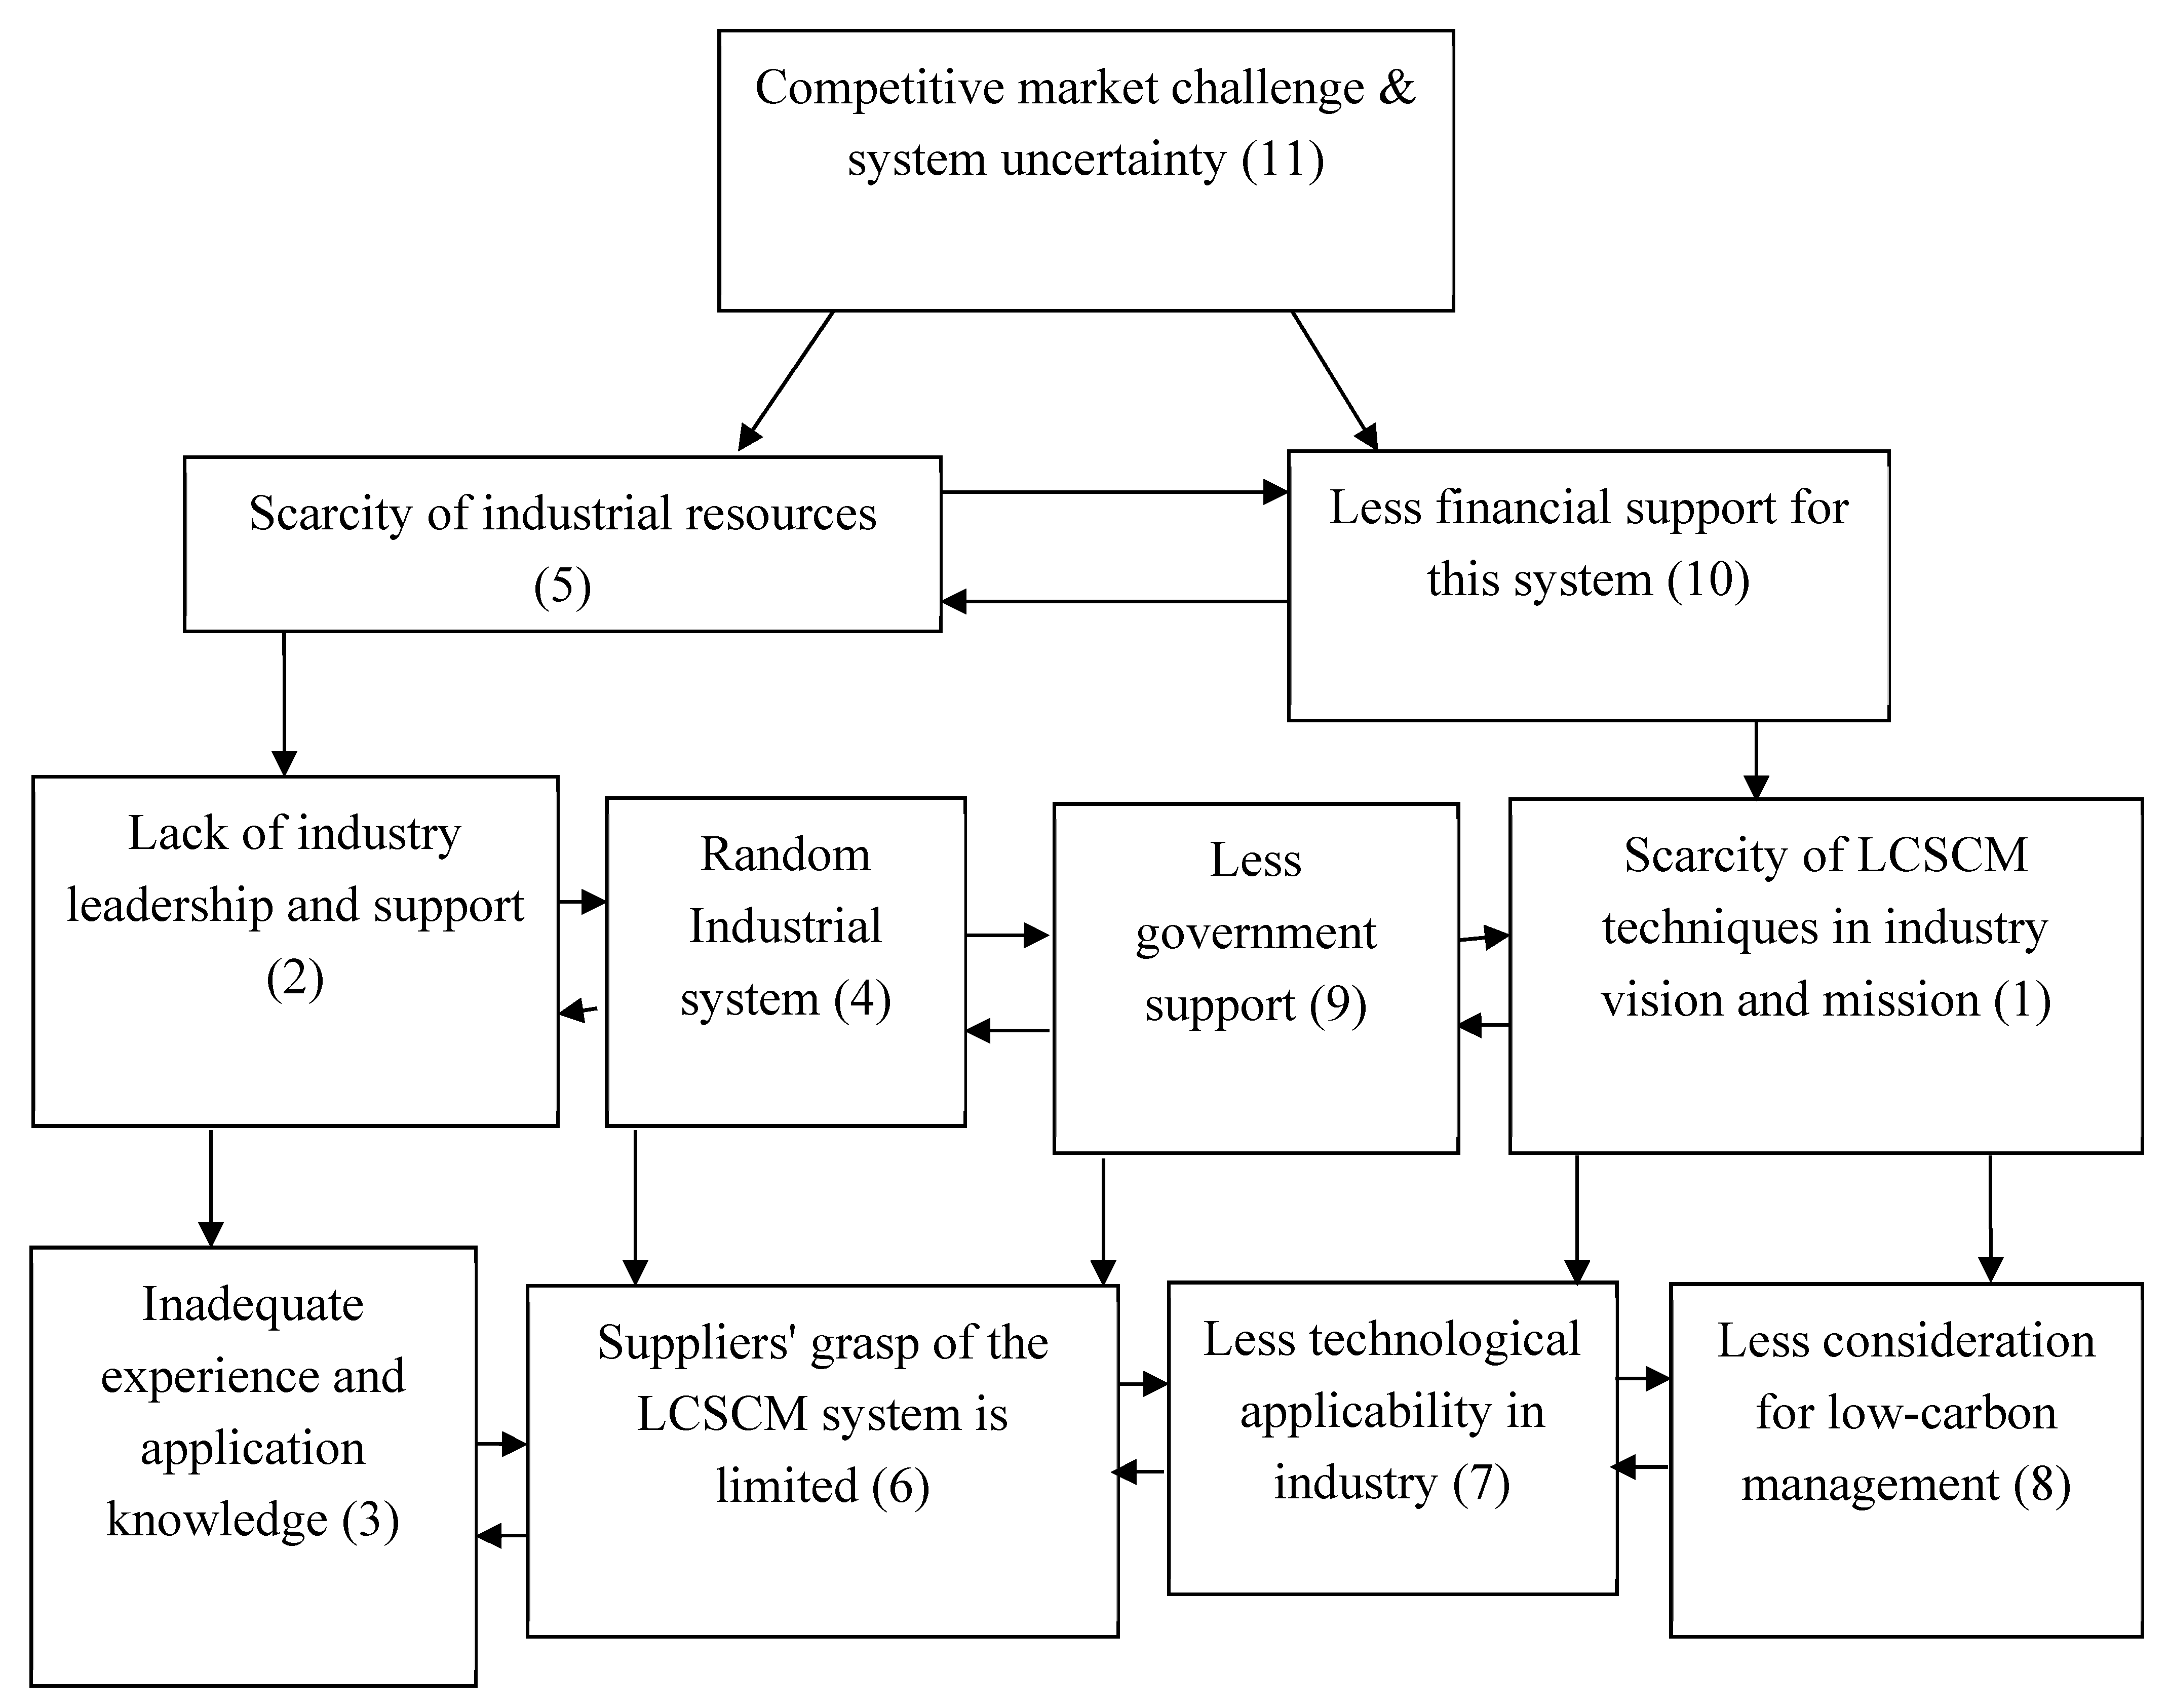
4.4. Formulation of ISM Model
5. MICMAC Analysis
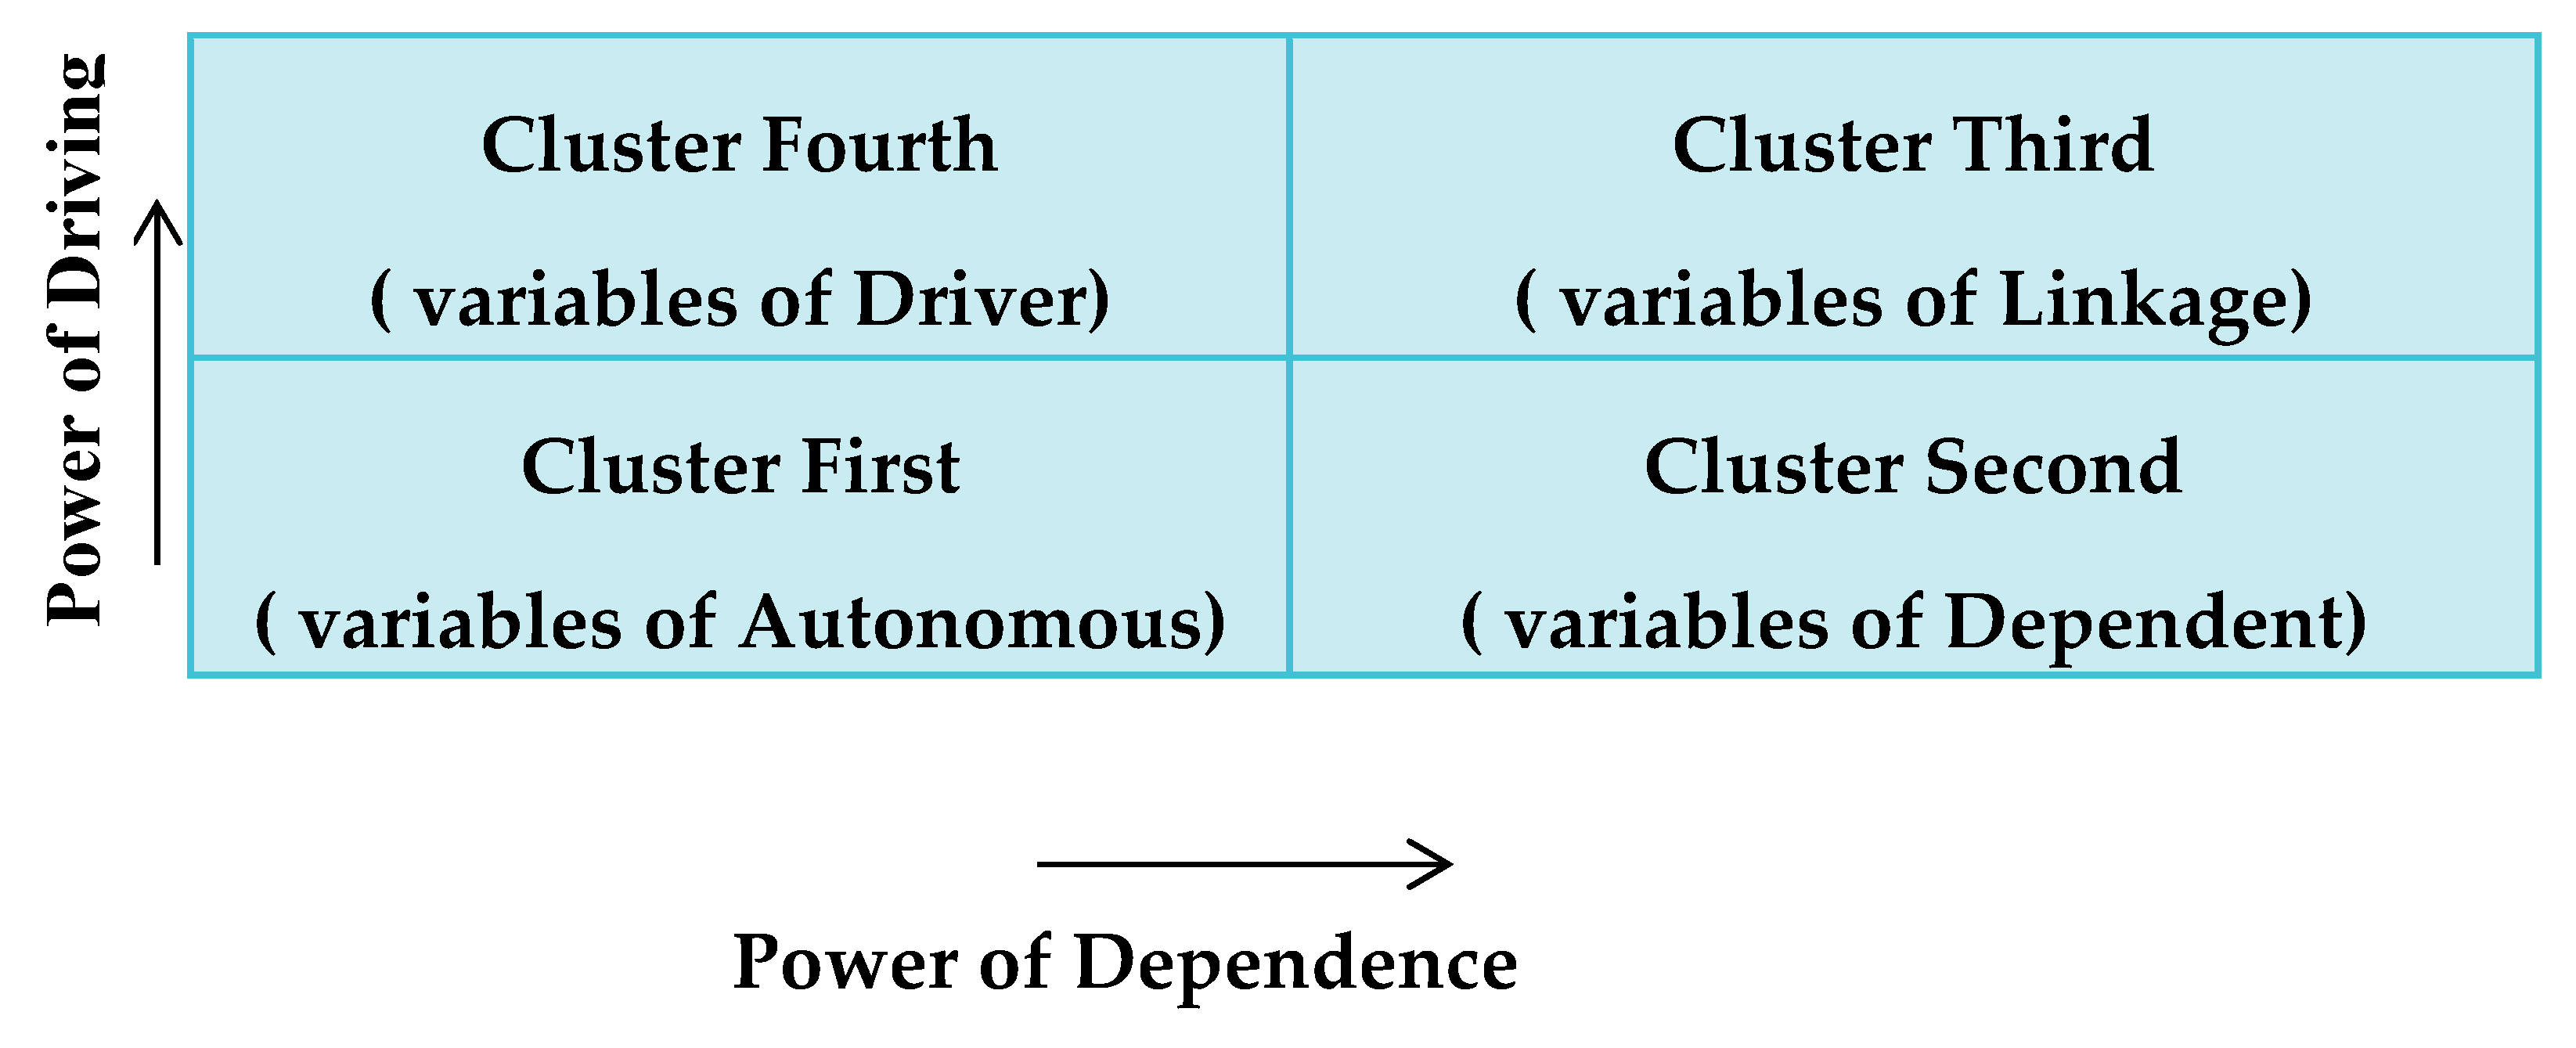
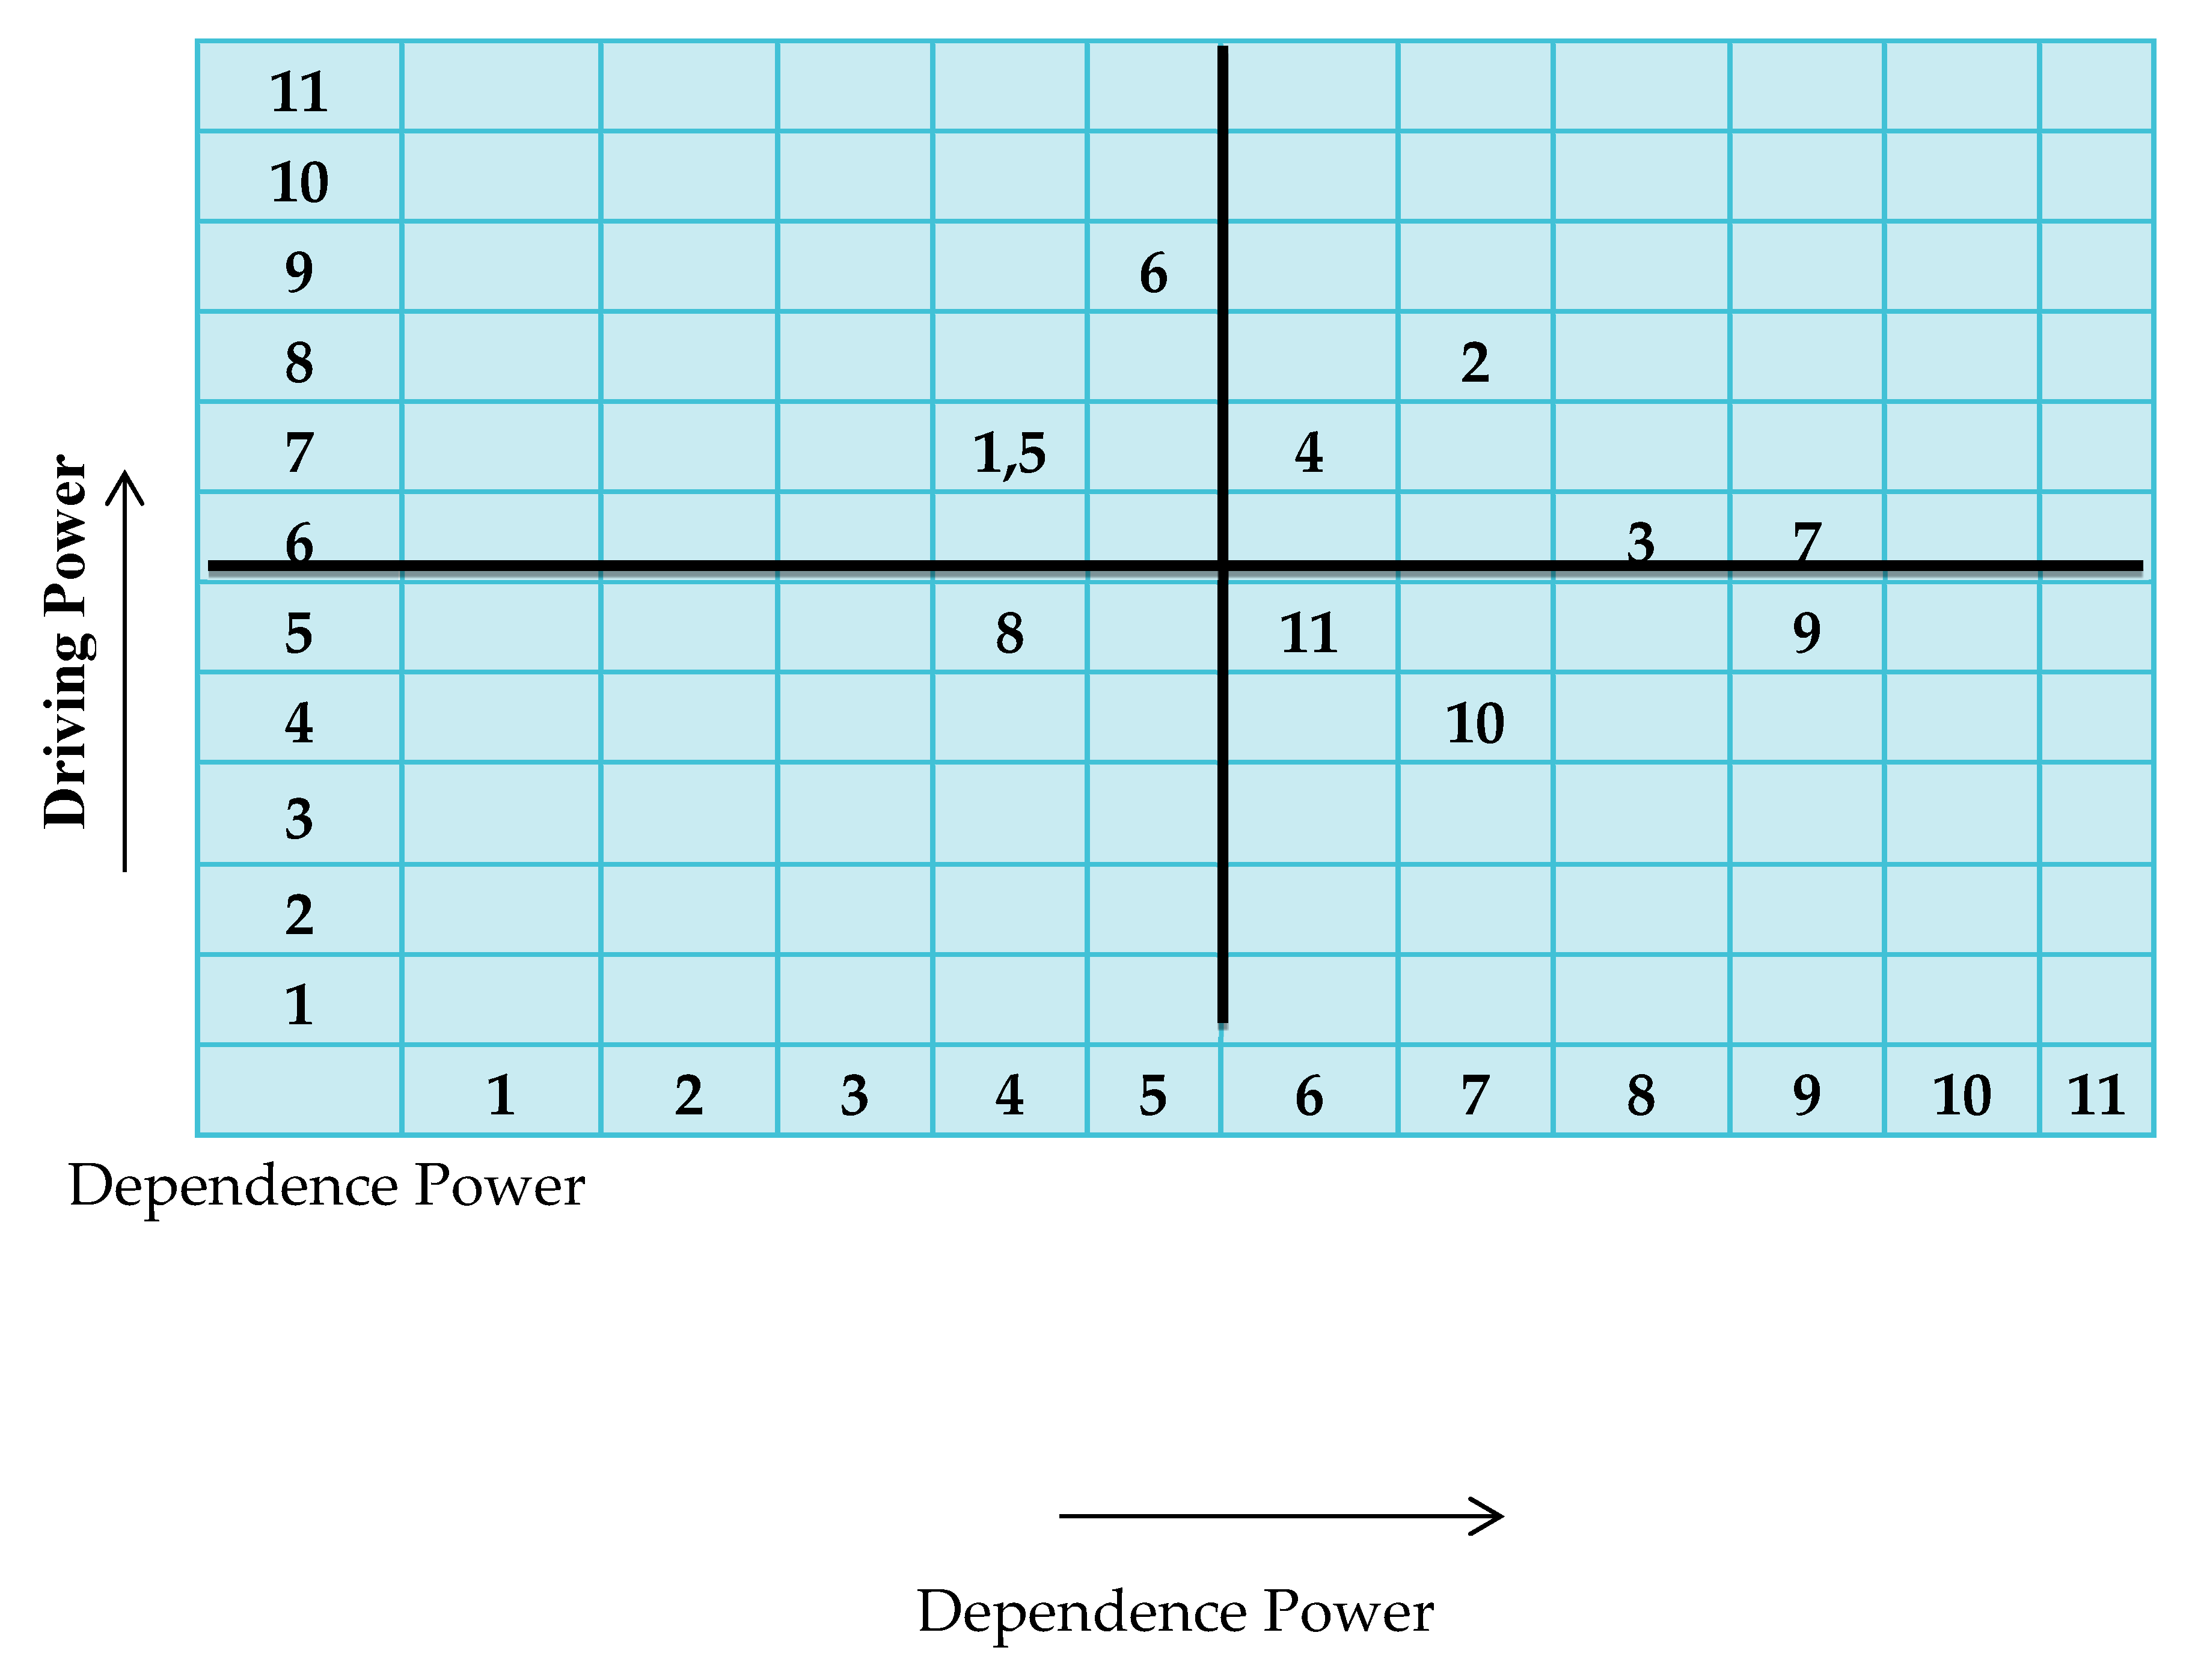
- Autonomous elements (first sectorial segment) have a low impact of driving and reliance power. All of these pieces can be detached from the overall structure. In the current work, just one barrier exists in this area, which is a less consideration for low-carbon management (K8).
- The second sectorial component, known as dependent variables. It demonstrates a low influence of driving power and a significant impact of dependent power. In the current study, only three barriers are identified in this region: less government support (K9), less financial support for this system (K10), competitive market challenge, and system uncertainty (K11).
- The third sectorial portion, titled linkage variables, demonstrates a strong influence of driving power and a high impact of reliance power. In the current study, four barriers are identified in this sectorial part: a lack of industrial leadership and support (K2), inadequate experience and application knowledge (K3), random industrial system (B4), and less technological applicability in industry (K7).
- The fourth and last section of the MICMAC diagram, which is an independent variable, demonstrates the strong strength of driving and the weak power of reliance. In the current investigation, three hurdles are identified in this sectorial section: Scarcity of LCSCM techniques in industry visions and missions (K1), Scarcity of industrial resources (K5), and Suppliers’ grasp of the LCSCM system is limited (K6).
6. Decision Making Trial and Evaluation Laboratory (DEMATEL)
6.1. Part 1: Scale Formatting & Development of DRM (Direct Relationship Matrix)
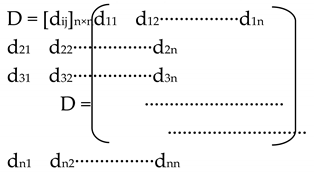
6.2. Part 2: Preparation of (NDRM) Normalized Direct Relation Matrix
6.3. Part 3: Formation of TRM (Total Relation Matrix)
6.4. Part 4: Construction of a Table Showing Addition of Row Sum and Column Sum and Subtraction of Row Sum and Column Sum of Total Relation Matrix

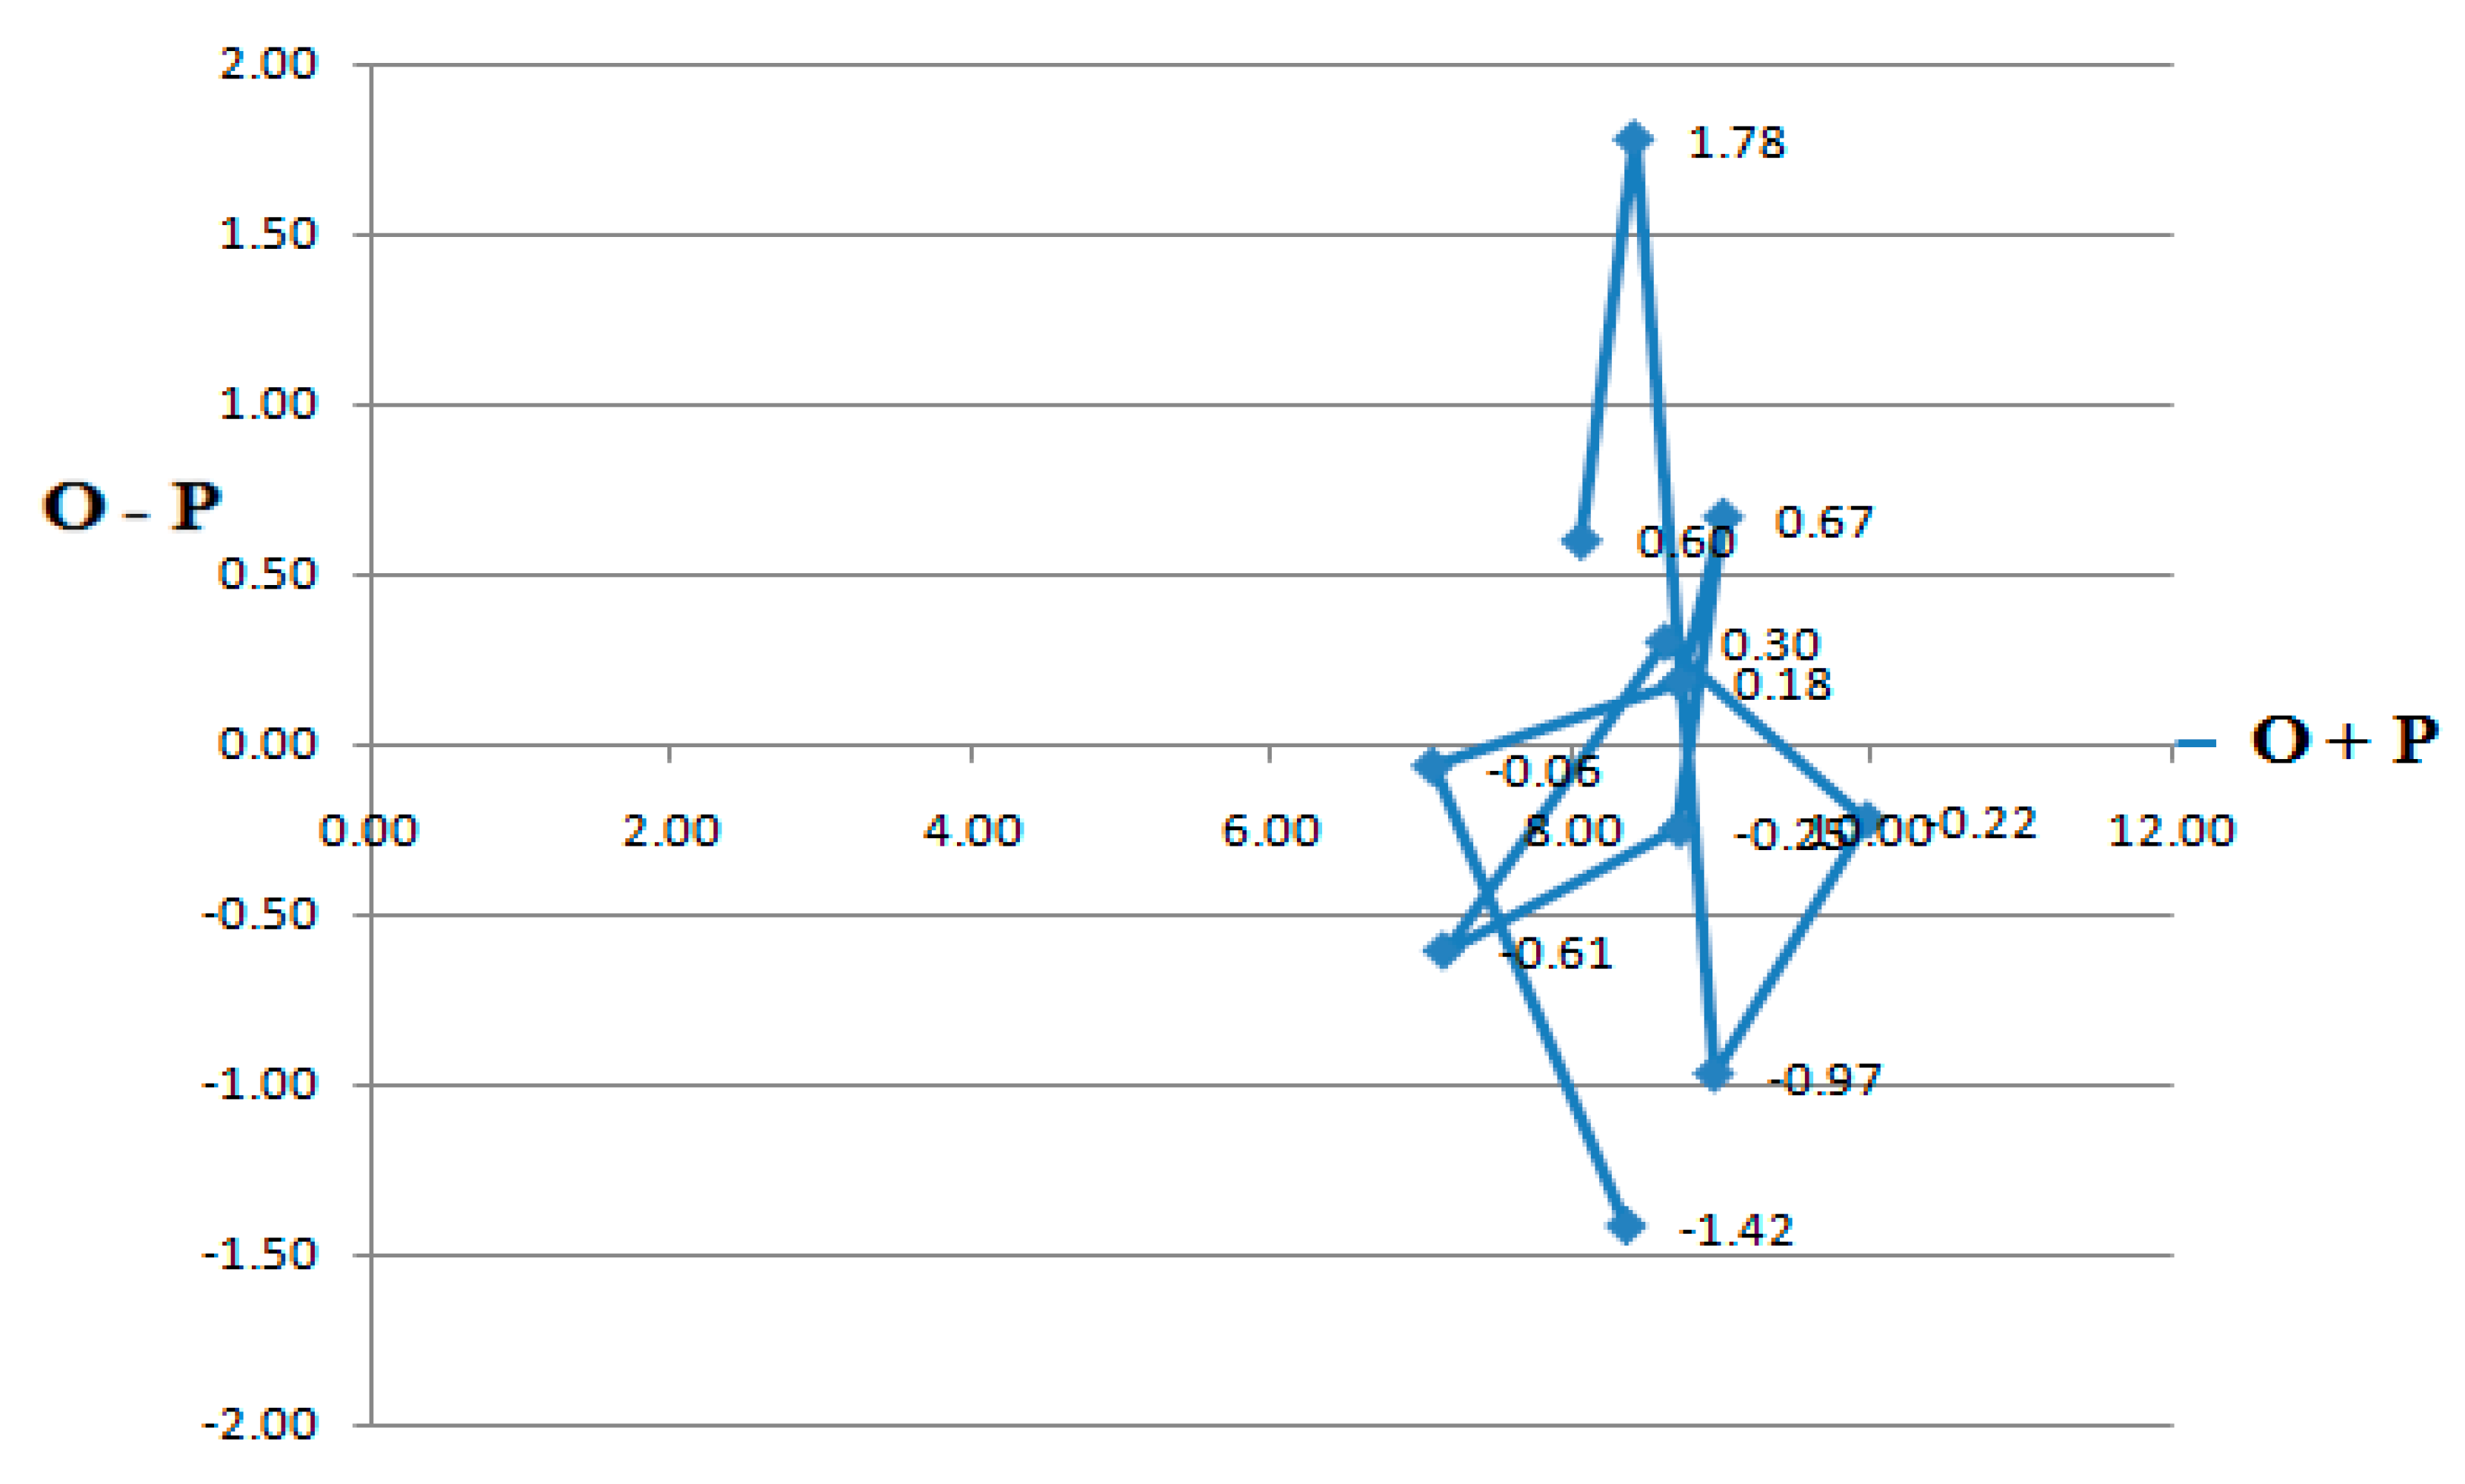
| O + P | O – P |
|---|---|
| 8.06 | 0.60 |
| 8.41 | 1.78 |
| 8.94 | -0.97 |
| 9.96 | -0.22 |
| 8.62 | 0.30 |
| 7.14 | -0.61 |
| 8.71 | -0.25 |
| 9.00 | 0.67 |
| 8.71 | 0.18 |
| 7.07 | -0.06 |
| 8.36 | -1.42 |
6.5. Part 5: Formulate Casual Relation Data
7. Conclusions and Managerial Implications
Author Contributions
Funding
Availability of Data and Material (Data Transparency)
Code Availability (Software Application or Custom Code)
Acknowledgements
Conflicts of Interest/Competing Interests
Ethics Approval
Consent for Participate
Consent for Publication
References
- Qian, C.; Wang, S.; Liu, X.; Zhang, X. Low-Carbon Initiatives of Logistics Service Providers: The Perspective of Supply Chain Integration. Sustainability 2019, 11, 3233. [Google Scholar] [CrossRef]
- Flynn, B.B.; Huo, B.; Zhao, X. The impact of supply chain integration on performance: A contingency and configuration approach. J. Oper. Manag. 2010, 28, 58–71. [Google Scholar] [CrossRef]
- Damert, M.; Feng, Y.; Zhu, Q.; Baumgartner, R.J. Motivating low-carbon initiatives among suppliers: The role of risk and opportunity perception. Resour. Conserv. Recycl. 2018, 136, 276–286. [Google Scholar] [CrossRef]
- Zhu, Q.; Geng, Y. Drivers and barriers of extended supply chain practices for energy saving and emission reduction among Chinese manufacturers. J. Clean. Prod. 2013, 40, 6–12. [Google Scholar] [CrossRef]
- Herold, D.M.; Lee, K.-H. Carbon management in the logistics and transportation sector: an overview and new research directions. Carbon Manag. 2017, 8, 79–97. [Google Scholar] [CrossRef]
- Dubey, R.; Gunasekaran, A. Shortage of sustainable supply chain talent: an industrial training framework. Ind. Commer. Train. 2015, 47, 86–94. [Google Scholar] [CrossRef]
- Das, C.; Jharkharia, S. Low carbon supply chain: a state-of-the-art literature review. J. Manuf. Technol. Manag. 2018, 29, 398–428. [Google Scholar] [CrossRef]
- Christopher, M. Managing Supply Chain Complexity: Identifying the Requisite Skills. Supply Chain Forum: Int. J. 2012, 13, 4–9. [Google Scholar] [CrossRef]
- Cottrill K. Are You Prepared for the Supply Chain Talent Crisis?MIT Center for Transportation and Logistics, Cambridge, MA 2010, pp. 1-11. 19 May. Available online: www.Distributiongroup.com/articles/0211mit (accessed on 19 May 2014).
- Abreu MCSd, FreitasARPd, Rebouças SMDP. Conceptual model for corporate climate change strategy development. Empirical evidence from the energy sector. J. Clean. Prod. 2017 165, 382–392.
- Allison PD. Measures of fit for logistic regression. Proceedings of the SAS Global Forum 2014.
- Alves, M.W.F.M.; Jabbour, A.B.L.d.S.; Kannan, D.; Jabbour, C.J.C. Contingency theory, climate change, and low-carbon operations management. Supply Chain Manag. Int. J. 2017, 22, 223–236. [Google Scholar] [CrossRef]
- Kottala, S. Sustainable Supply Chain Management Practices: An Environmental Perspective in Indian Manufacturing Companies. International Journal of Advanced Information Science and Technology 2016. 46. 74 - 82. [CrossRef]
- Long, T.B.; Young, W. An exploration of intervention options to enhance the management of supply chain greenhouse gas emissions in the UK. J. Clean. Prod. 2016, 112 Pt 3, 1834–1848. [Google Scholar] [CrossRef]
- Altuntas, S.; Selim, H.; Dereli, T. A fuzzy DEMATEL-based solution approach for facility layout problem: a case study. Int. J. Adv. Manuf. Technol. 2014, 73, 749–771. [Google Scholar] [CrossRef]
- Busch, J.; Foxon, T.J.; Taylor, P.G. Designing industrial strategy for a low carbon transformation. Environ. Innov. Soc. Transitions 2018, 29, 114–125. [Google Scholar] [CrossRef]
- Anadon, L.D.; Chan, G.; Harley, A.G.; Matus, K.; Moon, S.; Murthy, S.L.; Clark, W.C. Making technological innovation work for sustainable development. Proc. Natl. Acad. Sci. 2016, 113, 9682–9690. [Google Scholar] [CrossRef] [PubMed]
- Choudhary M & Seth, N. Integration of green practices in supply chain environment: The practices of inbound, operational, outbound and LCSCM. International Journal of Engineering Science and Technology 2011; 3(6), 4995-4993. ISSN: 0975-5462.
- Agarwal G &Vijayvargy, L. Green Supplier Assessment in Environmentally Responsive Supply Chains through Analytical Network Process. Proceedings of International Multi Conference of Engineers and Computer Scientists, Hong Kong, 14-16 March, 2012; 2, 1- 6. ISSN: 2078-0966.
- Narkhede, B.E.; Raut, R.D.; Roy, M.; Yadav, V.S.; Gardas, B. Implementation barriers to lean-agile manufacturing systems for original equipment manufacturers: an integrated decision-making approach. Int. J. Adv. Manuf. Technol. 2020, 108, 3193–3206. [Google Scholar] [CrossRef]
- Çakır, S. Selecting the best supplier at a steel-producing company under fuzzy environment. Int. J. Adv. Manuf. Technol. 2017, 88, 1345–1361. [Google Scholar] [CrossRef]
- Fuchs, S.J.; Espinoza, D.N.; Lopano, C.L.; Akono, A.-T.; Werth, C.J. Geochemical and geomechanical alteration of siliciclastic reservoir rock by supercritical CO2-saturated brine formed during geological carbon sequestration. Int. J. Greenh. Gas Control. 2019, 88, 251–260. [Google Scholar] [CrossRef]
- Shaharudin, M.S.; Fernando, Y.; Jabbour, C.J.C.; Sroufe, R.; Jasmi, M.F.A. Past, present, and future low carbon supply chain management: A content review using social network analysis. J. Clean. Prod. 2019, 218, 629–643. [Google Scholar] [CrossRef]
- Jolly, S.; Raven, R.; Romijn, H. Upscaling of business model experiments in off-grid PV solar energy in India. Sustain. Sci. 2012, 7, 199–212. [Google Scholar] [CrossRef]
- Shashank, G.; Sairam, D.; Reddy, B.R.; Afreed, K.; Sridharan, R. Analysis of enablers and barriers in adopting electric vehicles in India: DEMATEL - ISM approach. 2020 International Conference on System, Computation, Automation and Networking (ICSCAN). LOCATION OF CONFERENCE, IndiaDATE OF CONFERENCE; pp. 1–7.
- Mangla, S.K.; Kumar, P.; Barua, M.K. Risk analysis in green supply chain using fuzzy AHP approach: A case study. Resour. Conserv. Recycl. 2015, 104, 375–390. [Google Scholar] [CrossRef]
- Markkula, A.; Moisander, J. Discursive Confusion over Sustainable Consumption: A Discursive Perspective on the Perplexity of Marketplace Knowledge. J. Consum. Policy 2012, 35, 105–125. [Google Scholar] [CrossRef]
- Sharma, V.; Raut, R.D.; Mangla, S.K.; Narkhede, B.E.; Luthra, S.; Gokhale, R. A systematic literature review to integrate lean, agile, resilient, green and sustainable paradigms in the supply chain management. Bus. Strat. Environ. 2020, 30, 1191–1212. [Google Scholar] [CrossRef]
- Hassan, I.U.; Asghar, S. A Framework of Software Project Scope Definition Elements: An ISM-DEMATEL Approach. IEEE Access 2021, 9, 26839–26870. [Google Scholar] [CrossRef]
- Vinodh, S.; Balagi, T.S.S.; Patil, A. A hybrid MCDM approach for agile concept selection using fuzzy DEMATEL, fuzzy ANP and fuzzy TOPSIS. Int. J. Adv. Manuf. Technol. 2016, 83, 1979–1987. [Google Scholar] [CrossRef]
- Rajesh, R.; Ravi, V. Analyzing drivers of risks in electronic supply chains: a grey–DEMATEL approach. Int. J. Adv. Manuf. Technol. 2017, 92, 1127–1145. [Google Scholar] [CrossRef]
| S.No. | Barrier | Barriers Description | Classification |
|---|---|---|---|
| 1 | Scarcity of LCSCM techniques in industry visions and missions. | A scarcity of LCSCM practices in industry vision. | Internal |
| A scarcity of LCSCM procedures in industry missions. | |||
| 2 | Lack of industry leadership and support. | A lack of upper-level organizational support for the LCSCM system’s deployment. | Internal |
| A lack of middle-level and senior-level leadership and regular monitoring. | |||
| 3 | Inadequate experience and application knowledge. | A lack of experience among industry managers in applying and implementing the LCSCM system. | Internal |
| Inadequate expertise of corporate management to adopt and implement the LCSCM system. | |||
| 4 | Random Industrial system | Industries are profit-driven rather than vision-driven. | Internal |
| Inadequate use of the LCSCM system from raw materials to completed goods. | |||
| A lack of industrial norms and a lack of social responsibility. | |||
| 5 | Scarcity of industrial resources. | Use less resource to achieve zero waste. | Internal/External |
| Less use of the LCSCM system and increased waste production. | |||
| 6 | Suppliers’ grasp of the LCSCM system is limited. | Less collaboration with suppliers and stakeholders for LCSCM engagement. | Internal |
| Less communication and information exchange about the supply chain management system. | |||
| 7 | Less technological applicability in industry. | Less use of technology for environmental protection inside the organization. | Internal |
| Less reliance on technology in the industrial waste management and recycling system. | |||
| 8 | Less consideration for low-carbon management. | Less LCSCM system training. | External |
| There are very few external assessments for its long-term viability. | |||
| A lower certification standard, such as ISO 9001. | |||
| 9 | Less government support. | Less government opposition to their engagement in the industrial system. | Internal/External |
| The government created a poor procedure for their suitable application to adopt LCSCM. | |||
| 10 | Less financial support for this system. | Significant investment in LCSCM system with limited industrial budget. | Internal/External |
| There is a sluggish return on large investments. | |||
| 11 | Competitive market challenge & system uncertainty. | There is fierce rivalry in the industrial industry. | External |
| Market uncertainty as a result of project delays and cancellations | |||
| Economic crisis caused by industry variety. |
| S.No. | Barriers in implementing LCSCM | Barriers Series | ||||||||||
| 1 | 2 | 3 | 4 | 5 | 6 | 7 | 8 | 9 | 10 | 11 | ||
| 1 | Scarcity of LCSCM techniques in industry visions and missions | 1 | 1 | 0 | 1 | 0 | 1 | 1 | 0 | 1 | 0 | 1 |
| 2 | Lack of industry leadership and support | 0 | 1 | 1 | 1 | 1 | 0 | 1 | 0 | 1 | 1 | 1 |
| 3 | Inadequate experience and application knowledge | 1 | 0 | 1 | 0 | 1 | 0 | 1 | 1 | 0 | 1 | 0 |
| 4 | Random Industrial System | 0 | 1 | 1 | 1 | 1 | 0 | 1 | 0 | 1 | 1 | 0 |
| 5 | Scarcity of industrial resources | 0 | 1* | 1 | 1* | 1 | 1* | 1 | 0 | 1 | 0 | 0 |
| 6 | Suppliers’ grasp of the LCSCM system is limited | 0 | 1 | 1 | 1 | 0 | 1 | 1 | 1 | 1 | 1 | 1 |
| 7 | Less technological applicability in industry | 0 | 0 | 1 | 0 | 0 | 0 | 1 | 1 | 1 | 1 | 1 |
| 8 | Less consideration for low-carbon management | 1 | 1 | 0 | 1 | 0 | 0 | 0 | 1 | 0 | 1 | 0 |
| 9 | Less government support | 1 | 0 | 1 | 0 | 0 | 0 | 1 | 0 | 1 | 0 | 1 |
| 10 | Less financial support for this system | 0 | 0 | 1 | 0 | 0 | 1 | 0 | 0 | 1 | 1 | 0 |
| 11 | Competitive market challenge & system uncertainty | 0 | 1 | 0 | 0 | 0 | 1* | 1 | 0 | 1 | 0 | 1 |
| S.No. | Barriers in implementing LCSCM | Barriers Series | Power of Driving | ||||||||||
| 1 | 2 | 3 | 4 | 5 | 6 | 7 | 8 | 9 | 10 | 11 | |||
| 1 | Scarcity of LCSCM techniques in industry visions and missions | 1 | 1 | 0 | 1 | 0 | 1 | 1 | 0 | 1 | 0 | 1 | 7 |
| 2 | Lack of industry leadership and support | 0 | 1 | 1 | 1 | 1 | 0 | 1 | 0 | 1 | 1 | 1 | 8 |
| 3 | Inadequate experience and application knowledge | 1 | 0 | 1 | 0 | 1 | 0 | 1 | 1 | 0 | 1 | 0 | 6 |
| 4 | Random Industrial System | 0 | 1 | 1 | 1 | 1 | 0 | 1 | 0 | 1 | 1 | 0 | 7 |
| 5 | Scarcity of industrial resources | 0 | 1* | 1 | 1* | 1 | 1* | 1 | 0 | 1 | 0 | 0 | 7 |
| 6 | Suppliers’ grasp of the LCSCM system is limited | 0 | 1 | 1 | 1 | 0 | 1 | 1 | 1 | 1 | 1 | 1 | 9 |
| 7 | Less technological applicability in industry | 0 | 0 | 1 | 0 | 0 | 0 | 1 | 1 | 1 | 1 | 1 | 6 |
| 8 | Less consideration for low-carbon management | 1 | 1 | 0 | 1 | 0 | 0 | 0 | 1 | 0 | 1 | 0 | 5 |
| 9 | Less government support | 1 | 0 | 1 | 0 | 0 | 0 | 1 | 0 | 1 | 0 | 1 | 5 |
| 10 | Less financial support for this system | 0 | 0 | 1 | 0 | 0 | 1 | 0 | 0 | 1 | 1 | 0 | 4 |
| 11 | Competitive market challenge & system uncertainty | 0 | 1 | 0 | 0 | 0 | 1* | 1 | 0 | 1 | 0 | 1 | 5 |
| Power of Dependence | 4 | 7 | 8 | 6 | 4 | 5 | 9 | 4 | 9 | 7 | 6 | 69/69 | |
| Barrier Sr. No. | Group of Reachability | Group of Antecedent | Group of Common Place | Level |
|---|---|---|---|---|
| 1 | 1,2,4,6,7,9,11 | 1,3,8,9 | 1,9 | III |
| 2 | 2,3,4,5,7,9,10,11 | 1,2,4,5,6,8,11 | 2,4,5,11 | III |
| 3 | 1,3,5,7,8,10 | 2,3,4,5,6,7,9,10 | 3,5,7,10 | IV |
| 4 | 2,3,4,5,7,9,10 | 1,2,4,5,6,8 | 2,4,5 | III |
| 5 | 2,3,4,5,6,7,9 | 2,3,4,5 | 2,3,4,5 | II |
| 6 | 2,3,4,6,7,8,9,10,11 | 1,5,6,10,11 | 6,10,11 | IV |
| 7 | 3,7,8,9,10,11 | 1,2,3,4,5,6,7,9,11 | 3,7,9,11 | IV |
| 8 | 1,2,4,8,10, | 3,6,7,8 | 8 | IV |
| 9 | 1,3,7,9,11 | 1,2,4,5,6,7,9,10,11 | 1,7,9,11 | III |
| 10 | 3,6,9,10 | 2,3,4,6,7,8,10 | 3,6,10 | II |
| 11 | 2,6,7,9,11 | 1,2,6,7,9,11 | 2,6,7,9,11 | I |
| S. No. | Levels | Barriers Group |
|---|---|---|
| 1. | 1st | Competitive market challenge & system uncertainty(11) |
| 2. | 2nd | Scarcity of industrial resources (5) Less financial support for this system (10) |
| 3. | 3rd | Scarcity of LCSCM techniques in industry visions and missions (1) Lack of industry leadership and support (2) Random Industrial system (4) Less government support (9) |
| 4. | 4th | Inadequate experience and application knowledge (3) Suppliers’ grasp of the LCSCM system is limited (6) Less technological applicability in industry (7) Less consideration for low-carbon management (8) |
| Applied Term | Abbreviation | Value of Fuzzy Scale |
|---|---|---|
| Not Necessary | NNY | (0, 0, 0.11) |
| Less Necessary | LNY | (0, 0.21, 0.41) |
| Moderate Necessary | MNY | (0.21, 0.41, 0.61) |
| Necessary | NY | (0.41, 0.61, 0.81) |
| Greater Necessary | GNY | (0.61, 0.81, 1.1) |
| Coefficients | K1 | K2 | K3 | K4 | K5 | K6 | K7 | K8 | K9 | K10 | K11 |
|---|---|---|---|---|---|---|---|---|---|---|---|
| K1 | 0 | NNY | LNY | MNY | NY | LNY | MNY | GNY | LNY | NNY | GNY |
| K2 | LNY | 0 | MNY | LNY | MNY | GNY | NNY | GNY | GNY | LNY | |
| K3 | MNY | NNY | 0 | GNY | MNY | NNY | NY | LNY | MNY | MNY | NNY |
| K4 | NNY | LNY | NY | 0 | NY | GNY | LNY | GNY | LNY | NNY | GNY |
| K5 | NY | MNY | GNY | LNY | 0 | LNY | NNY | NY | NNY | MNY | NY |
| K6 | MNY | NNY | LNY | MNY | NNY | 0 | MNY | LNY | GNY | LNY | NNY |
| K7 | NNY | GNY | NY | NNY | LNY | MNY | 0 | NNY | MNY | MNY | GNY |
| K8 | NY | LNY | MNY | GNY | MNY | NNY | GNY | 0 | LNY | NNY | NY |
| K9 | LNY | NNY | GNY | LNY | GNY | LNY | LNY | NY | 0 | NY | LNY |
| K10 | GNY | MNY | LNY | NY | NNY | NY | NNY | LNY | NNY | 0 | NNY |
| K11 | NNY | NY | NNY | MNY | LNY | MNY | MNY | NNY | NY | LNY | 0 |
| Coefficients | K1 | K2 | K3 | K4 | K5 | K6 | K7 | K8 | K9 | K10 | K11 |
|---|---|---|---|---|---|---|---|---|---|---|---|
| K1 | .00 | .04 | .21 | .41 | .61 | .21 | .41 | .84 | .21 | .04 | .84 |
| K2 | .21 | .00 | .41 | .61 | .21 | .41 | .84 | .04 | .84 | .84 | .21 |
| K3 | .41 | .04 | .00 | .84 | .41 | .04 | .61 | .21 | .41 | .41 | .04 |
| K4 | .04 | .21 | .61 | .00 | .61 | .84 | .21 | .84 | .21 | .04 | .84 |
| K5 | .61 | .41 | .84 | .21 | .00 | .21 | .04 | .61 | .04 | .41 | .61 |
| K6 | .41 | .04 | .21 | .41 | .04 | .00 | .41 | .21 | .84 | .21 | .04 |
| K7 | .04 | .84 | .61 | .04 | .21 | .41 | .00 | .04 | .41 | .41 | .84 |
| K8 | .61 | .21 | .41 | .84 | .41 | .04 | .84 | .00 | .21 | .04 | .61 |
| K9 | .21 | .04 | .84 | .21 | .84 | .21 | .21 | .61 | .00 | .61 | .21 |
| K10 | .84 | .41 | .21 | .61 | .04 | .61 | .04 | .21 | .04 | .00 | .04 |
| K11 | .04 | .61 | .04 | .41 | .21 | .41 | .41 | .04 | .61 | .21 | .00 |
| Coefficients | K1 | K2 | K3 | K4 | K5 | K6 | K7 | K8 | K9 | K10 | K11 |
|---|---|---|---|---|---|---|---|---|---|---|---|
| K1 | .00 | .01 | .04 | .09 | .13 | .04 | .09 | .18 | .04 | .01 | .18 |
| K2 | .04 | .00 | .09 | .13 | .04 | .09 | .18 | .01 | .18 | .18 | .04 |
| K3 | .09 | .01 | .00 | .18 | .09 | .01 | .13 | .04 | .09 | .09 | .01 |
| K4 | .01 | .04 | .13 | .00 | .13 | .18 | .04 | .18 | .04 | .01 | .18 |
| K5 | .13 | .09 | .18 | .04 | .00 | .04 | .01 | .13 | .01 | .09 | .13 |
| K6 | .09 | .01 | .04 | .09 | .01 | .00 | .09 | .04 | .18 | .04 | .01 |
| K7 | .01 | .18 | .13 | .01 | .04 | .09 | .00 | .01 | .09 | .09 | .18 |
| K8 | .13 | .04 | .09 | .18 | .09 | .01 | .18 | .00 | .04 | .01 | .13 |
| K9 | .04 | .01 | .18 | .04 | .18 | .04 | .04 | .13 | .00 | .13 | .04 |
| K10 | .18 | .09 | .04 | .13 | .01 | .13 | .01 | .04 | .01 | .00 | .01 |
| K11 | .01 | .13 | .01 | .09 | .04 | .09 | .09 | .01 | .13 | .04 | .00 |
| Coefficients | K1 | K2 | K3 | K4 | K5 | K6 | K7 | K8 | K9 | K10 | K11 | ROW SUM |
|---|---|---|---|---|---|---|---|---|---|---|---|---|
| K1 | 0.279 | 0.277 | 0.423 | 0.470 | 0.440 | 0.335 | 0.430 | 0.482 | 0.367 | 0.272 | 0.556 | 4.330 |
| K2 | 0.379 | 0.302 | 0.536 | 0.568 | 0.418 | 0.443 | 0.551 | 0.385 | 0.544 | 0.495 | 0.474 | 5.096 |
| K3 | 0.342 | 0.248 | 0.360 | 0.515 | 0.384 | 0.293 | 0.424 | 0.352 | 0.367 | 0.326 | 0.374 | 3.985 |
| K4 | 0.332 | 0.328 | 0.542 | 0.444 | 0.472 | 0.487 | 0.439 | 0.513 | 0.421 | 0.311 | 0.578 | 4.867 |
| K5 | 0.419 | 0.339 | 0.540 | 0.462 | 0.328 | 0.341 | 0.377 | 0.447 | 0.345 | 0.356 | 0.505 | 4.459 |
| K6 | 0.294 | 0.194 | 0.341 | 0.369 | 0.267 | 0.222 | 0.335 | 0.297 | 0.405 | 0.248 | 0.298 | 3.268 |
| K7 | 0.284 | 0.417 | 0.483 | 0.395 | 0.343 | 0.375 | 0.340 | 0.298 | 0.422 | 0.372 | 0.500 | 4.229 |
| K8 | 0.418 | 0.342 | 0.509 | 0.587 | 0.444 | 0.349 | 0.546 | 0.360 | 0.406 | 0.309 | 0.564 | 4.835 |
| K9 | 0.358 | 0.268 | 0.558 | 0.456 | 0.492 | 0.337 | 0.391 | 0.454 | 0.315 | 0.395 | 0.426 | 4.448 |
| K10 | 0.394 | 0.273 | 0.340 | 0.439 | 0.272 | 0.366 | 0.293 | 0.318 | 0.279 | 0.207 | 0.323 | 3.503 |
| K11 | 0.231 | 0.326 | 0.324 | 0.385 | 0.298 | 0.328 | 0.354 | 0.261 | 0.394 | 0.278 | 0.290 | 3.469 |
| COLUMN SUM | 3.730 | 3.313 | 4.955 | 5.090 | 4.158 | 3.877 | 4.480 | 4.166 | 4.265 | 3.568 | 4.888 | 46.489/ 46.489 |
| S.No. | ISM | DEMATEL |
|---|---|---|
| 1 | Scarcity of LCSCM techniques in industry visions and missions (K1) | Scarcity of LCSCM techniques in industry visions and missions (K1) |
| 2 | Lack of industry leadership and support (K2) | Lack of industry leadership and support (K2) |
| 3 | Less consideration for low-carbon management (K8) | Less consideration for low-carbon management (K8) |
| 4 | Less government support (K9) | Less government support (K9) |
| 5 | Inadequate experience and application knowledge (K3) | Scarcity of industrial resources (K5) |
| 6 | Suppliers’ grasp of the LCSCM system is limited (K6) | |
| 7 | Random Industrial system(K4) | |
| 8 | Less technological applicability in industry (K7) |
Disclaimer/Publisher’s Note: The statements, opinions and data contained in all publications are solely those of the individual author(s) and contributor(s) and not of MDPI and/or the editor(s). MDPI and/or the editor(s) disclaim responsibility for any injury to people or property resulting from any ideas, methods, instructions or products referred to in the content. |
© 2024 by the authors. Licensee MDPI, Basel, Switzerland. This article is an open access article distributed under the terms and conditions of the Creative Commons Attribution (CC BY) license (http://creativecommons.org/licenses/by/4.0/).


