
You are currently viewing a beta version of our website. If you spot anything unusual, kindly let us know.
Preprint
Article
Bridging the Gap: Leveraging Informal Software Architecture Artifacts for Structured Model Creation
Altmetrics
Downloads
98
Views
49
Comments
0
A peer-reviewed article of this preprint also exists.


This version is not peer-reviewed
Abstract
This study addresses the prevalent gap between formal and informal architectural methodologies in software engineering. Recognizing the potential of informal architecture artifacts in analytical processes, we introduce a groundbreaking methodology that efficiently transforms these informal components into structured formal models. This method facilitates a deeper understanding and utilization of informal diagrams and enhances analytical capabilities through graph analysis techniques. By leveraging user-friendly tools like Draw.io, the methodology democratizes the modeling process, making sophisticated architectural analyses accessible to a broader spectrum of professionals without requiring deep expertise in formal methods. The innovative aspects of this methodology lie in its ability to streamline the transformation process, significantly improving both the efficiency and effectiveness of model creation and analysis. These enhancements are demonstrated through a practical application involving a sample architecture diagram, where the resulting model is thoroughly analyzed using advanced graph analysis tools like Python's NetworkX library and Neo4j. This approach bridges the theoretical and practical divides in software architecture and sets a new standard for integrating informal artifacts into systematic engineering workflows. In addition, considerations for Artificial Intelligence developments are discussed.
Keywords:
Subject: Computer Science and Mathematics - Software
1. Introduction
In the evolving landscape of software engineering, a significant gap persists between the theoretical methodologies proposed in research and the pragmatic approaches applied in practice. Research often emphasizes the rigor of formal methods, which are meticulously structured and aim to ensure semantic clarity and programmatic integrity [1,2]. However, these methods require a deep understanding of specialized modeling languages and tools [3], creating a barrier to widespread adoption due to the niche expertise required.
Conversely, informal methods predominate in the practical realm. Engineers frequently rely on natural-language documents, wikis, and simple boxes-and-lines diagrams due to their ease of use and accessibility [4]. Despite their popularity, these informal methods suffer significant drawbacks, including structure, formatting, and syntax inconsistencies, which complicate further analysis and integration into formal systems [5,6].
This paper introduces an innovative methodology that bridges this divide by transforming informal, often chaotic architectural diagrams into structured, formal models. Our approach leverages the user-friendly diagramming tool Draw.io (also available online as diagrams.net) to extract data from informal boxes-and-lines diagrams. This data is then structured into graph-like constructs compatible with advanced analysis tools such as Python's NetworkX library and Neo4j. This method not only democratizes the creation of formal models, making them accessible to a broader range of professionals without specialized training in formal methods but it also enhances the efficiency and effectiveness of architectural analyses.
We present a series of techniques that represent an evolution in handling architectural artifacts—optimizing the transformation process to be more intuitive and less resource-intensive. Our methodology is demonstrated through a sample analysis that showcases the complete workflow, from the initial extraction of data from informal diagrams to their integration into a structured model ready for formal analysis. This approach not only addresses the current gaps in practice but also pushes the boundaries of current software engineering methodologies by introducing a scalable, cost-effective solution that maintains the integrity and utility of formal modeling in a way that is aligned with everyday engineering practices. In addition, this is just an initial step to generate cases and then use the capabilities of “interpretation” of Large Language Models and advanced pattern recognition machines to build an even more powerful methodology.
2. Background
2.1. Architecture Diagrams
What constitutes an architecture diagram does not always have a clear definition [7]. Architecture generally shows many views of a system. Diagrams are used in software architecture to communicate various aspects of the system using different viewpoints to represent different perspectives. This section will describe some of those views with simplified visual examples to demonstrate the variety of architectural views and their purpose.
2.2. Behavioral (Activity) Diagrams
UML (Unified Modeling Language) is a visual language for modeling software systems [8]. SysML (Systems Modeling Language) is a similar language describing complex systems [9]. One type of diagram used in UML is the activity diagram, which describes the behavior of a piece of system functionality [8,9].
This activity diagram (Figure 1) serves as a blueprint, delineating the sequence of actions during a software application's login procedure. It portrays interactions simplified without sacrificing the technical depth required for accurate interpretation. Key actions such as 'POST username and password to API,' 'validate request,' and 'generate token' are articulated distinctly, ensuring stakeholders across various technical proficiencies can comprehend and analyze the process effectively. Moreover, the diagram incorporates decision logic, epitomized by the conditional evaluation that leads to different outcomes—a 401 response for failure and a 200 response with a token for successful authentication—thus fostering an understanding of the behavioral logic embedded within the system's architecture.
2.2. Logical Network Diagrams
Network diagrams typically show the logical and sometimes physical segmentation of a network. This network diagram (Figure 2) illustrates an architecture that efficiently segregates various components of an organization’s IT infrastructure across different network zones, optimizing performance and security. It visually divides the network into distinct sections, including enterprise networks, a data center with application servers, a manufacturing facility, residential private networks, and an enterprise cloud, each serving a unique role within the broader network ecosystem.
Multiple client computers are connected in the enterprise networks, indicating a typical office setup. The data center is the core hub that houses application servers and a central database, emphasizing its role in data storage and application management. It is connected to enterprise and manufacturing facility clients, demonstrating centralized access to computational resources.
Residential private networks connect through a VPN, highlighting the security measures for remote access, which is increasingly relevant in modern network designs that accommodate telecommuting. The enterprise cloud section, encased within a Virtual Private Cloud (VPC), features redundant application servers behind a load balancer, illustrating high availability and fault tolerance strategies essential for maintaining continuous service delivery.
2.3. Cloud Architecture Diagrams
Cloud architecture diagrams are frequently used to communicate the cloud computing services used in a system and the connections between those services. Like a network diagram, a cloud architecture shows logical network connections. However, a cloud architecture diagram tends to focus more on logical data flow and specific use of cloud technologies.
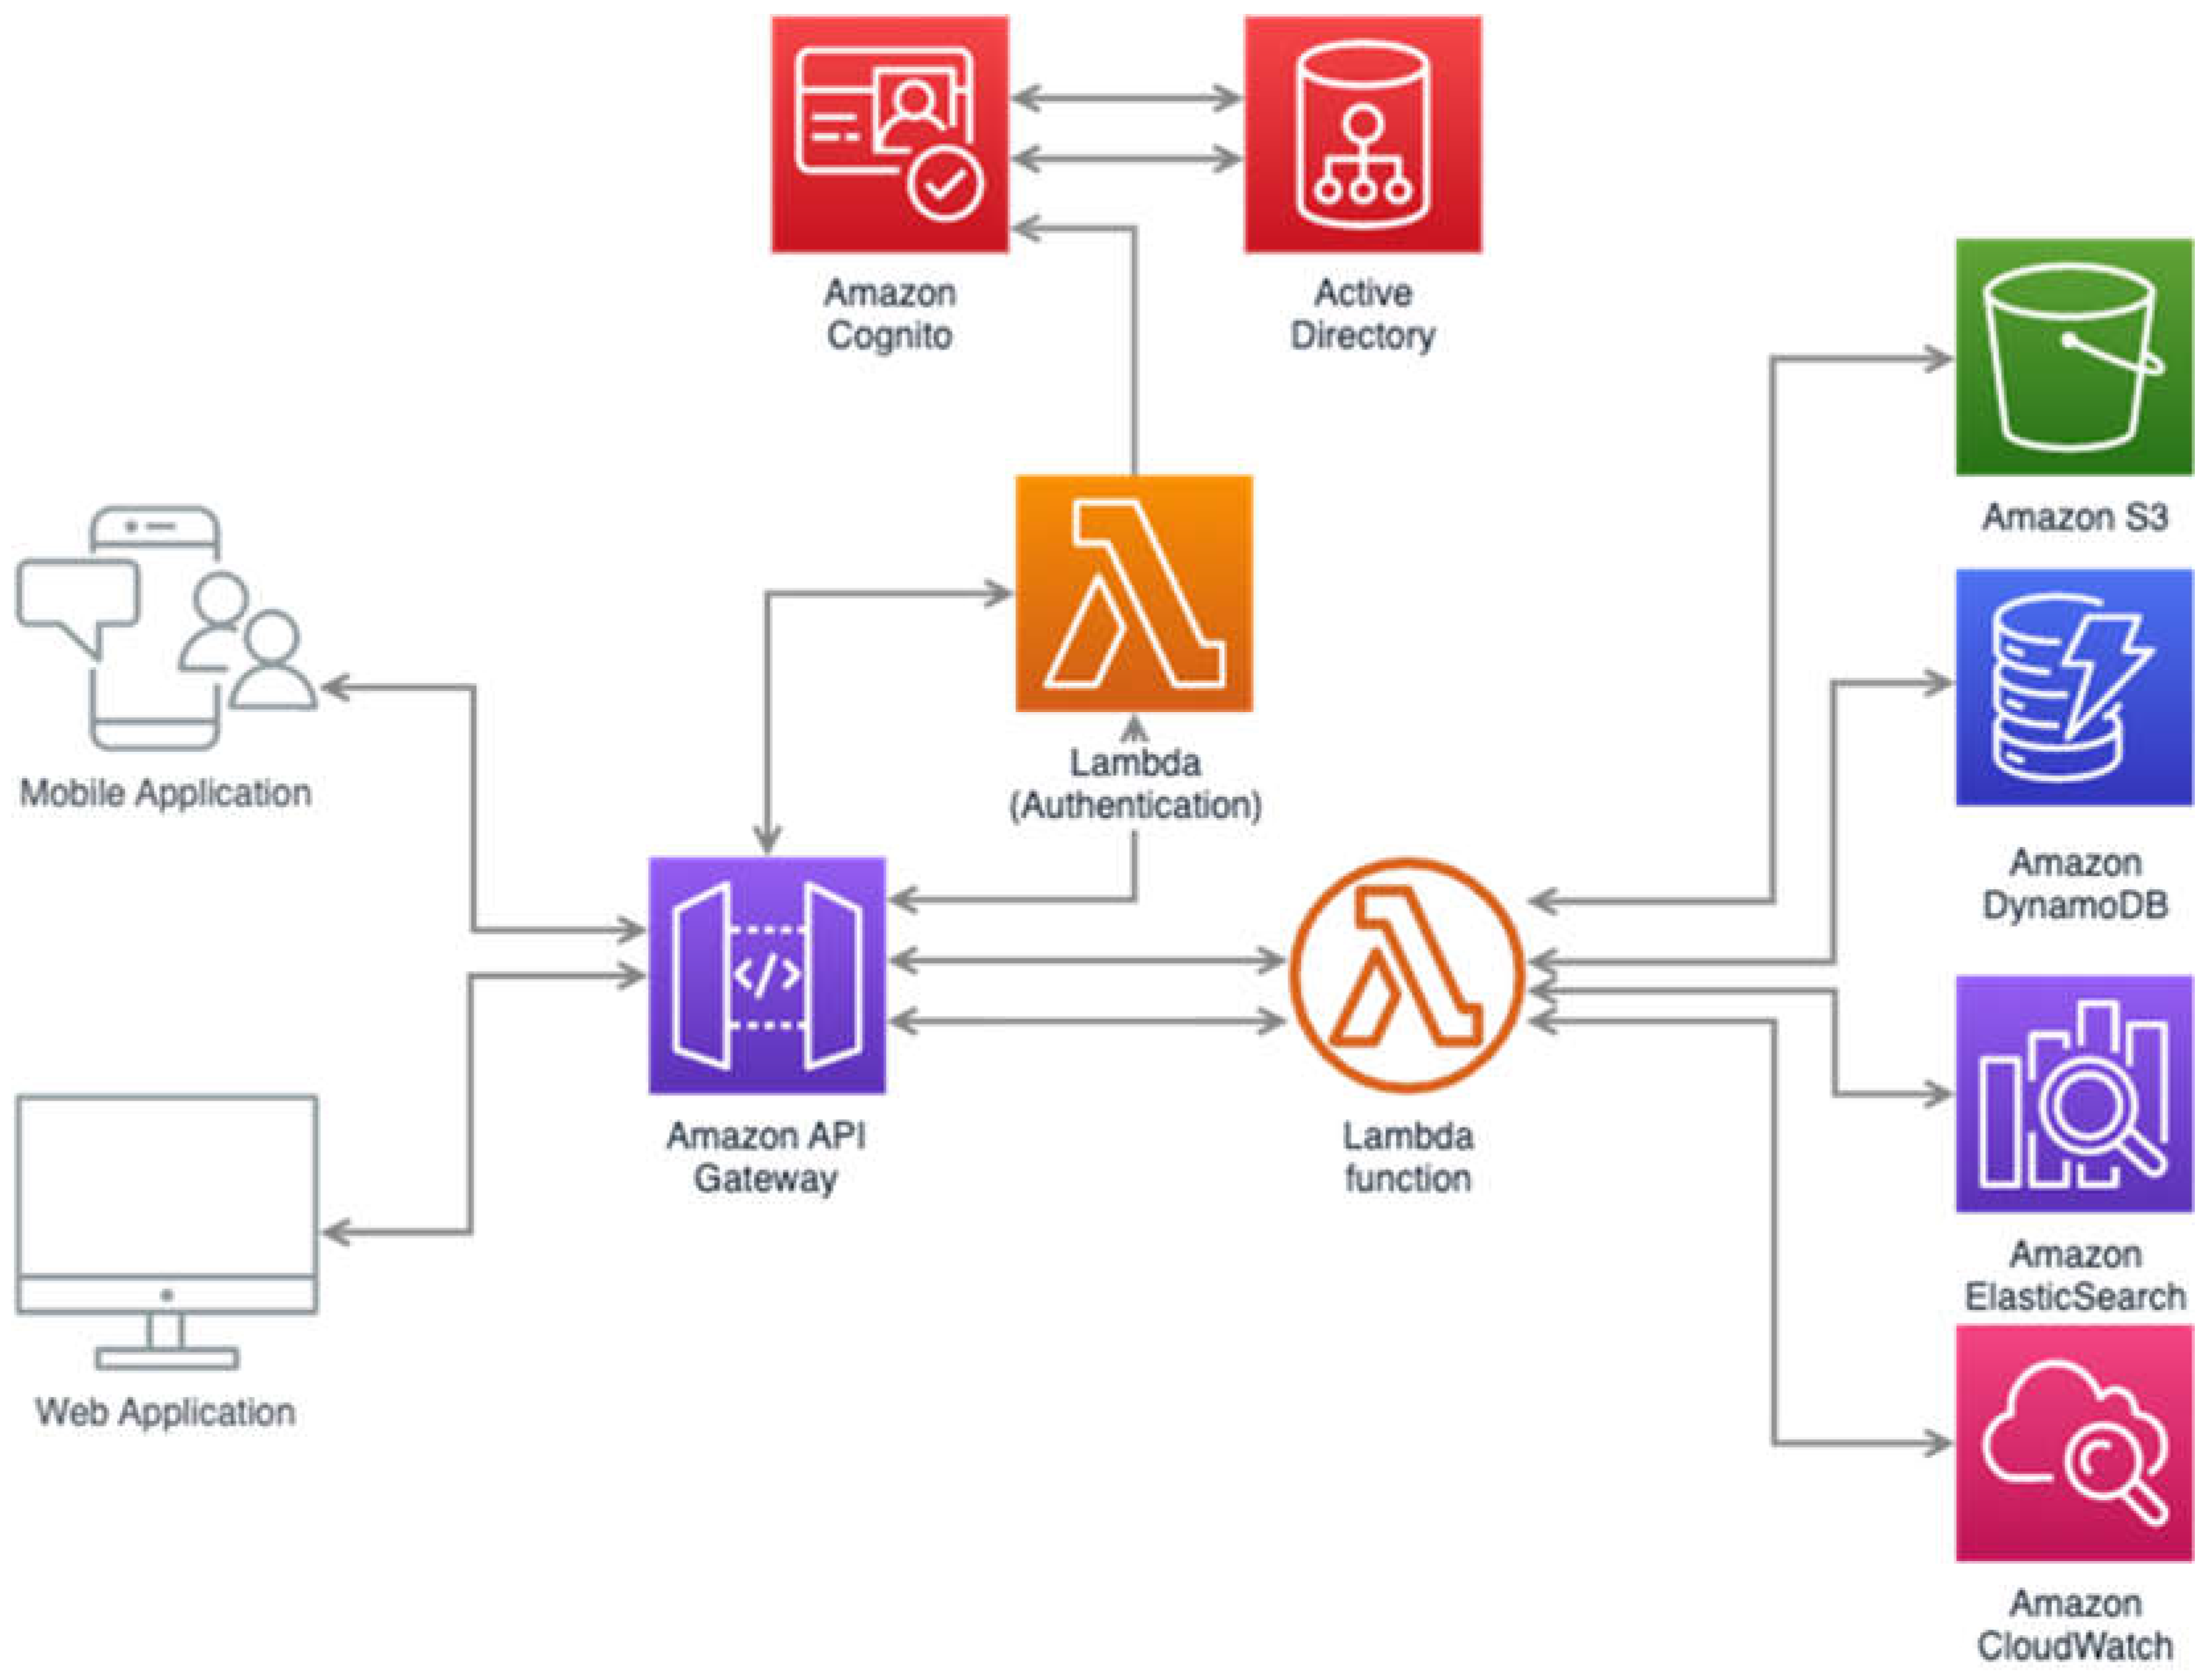
For example, in Figure 1, the provided cloud architecture diagram effectively delineates the integration and interaction of cloud services within a sophisticated AWS-based infrastructure. Central to this architecture is the Amazon API Gateway, which serves as the primary conduit through which mobile and web applications communicate, ensuring streamlined interactions across various services. Authentication is robustly managed through AWS Lambda functions that interface with Amazon Cognito and Active Directory, providing a secure and flexible authentication system suitable for diverse user environments.
This diagram also highlights the orchestration of multiple AWS services to enhance functionality and performance. Amazon S3, DynamoDB, and Elasticsearch handle data storage and processing, ensuring high availability and quick access to data. Amazon CloudWatch is integrated for comprehensive monitoring and operational health checks, demonstrating the system's ability to efficiently maintain performance and reliability. This architectural visualization showcases the system’s operational workflows and emphasizes the strategic use of cloud technologies to optimize data flow and resource management within the cloud ecosystem.
Figure 3.
A sample informal diagram of a cloud infrastructure architecture.
2.4. Structural Diagrams
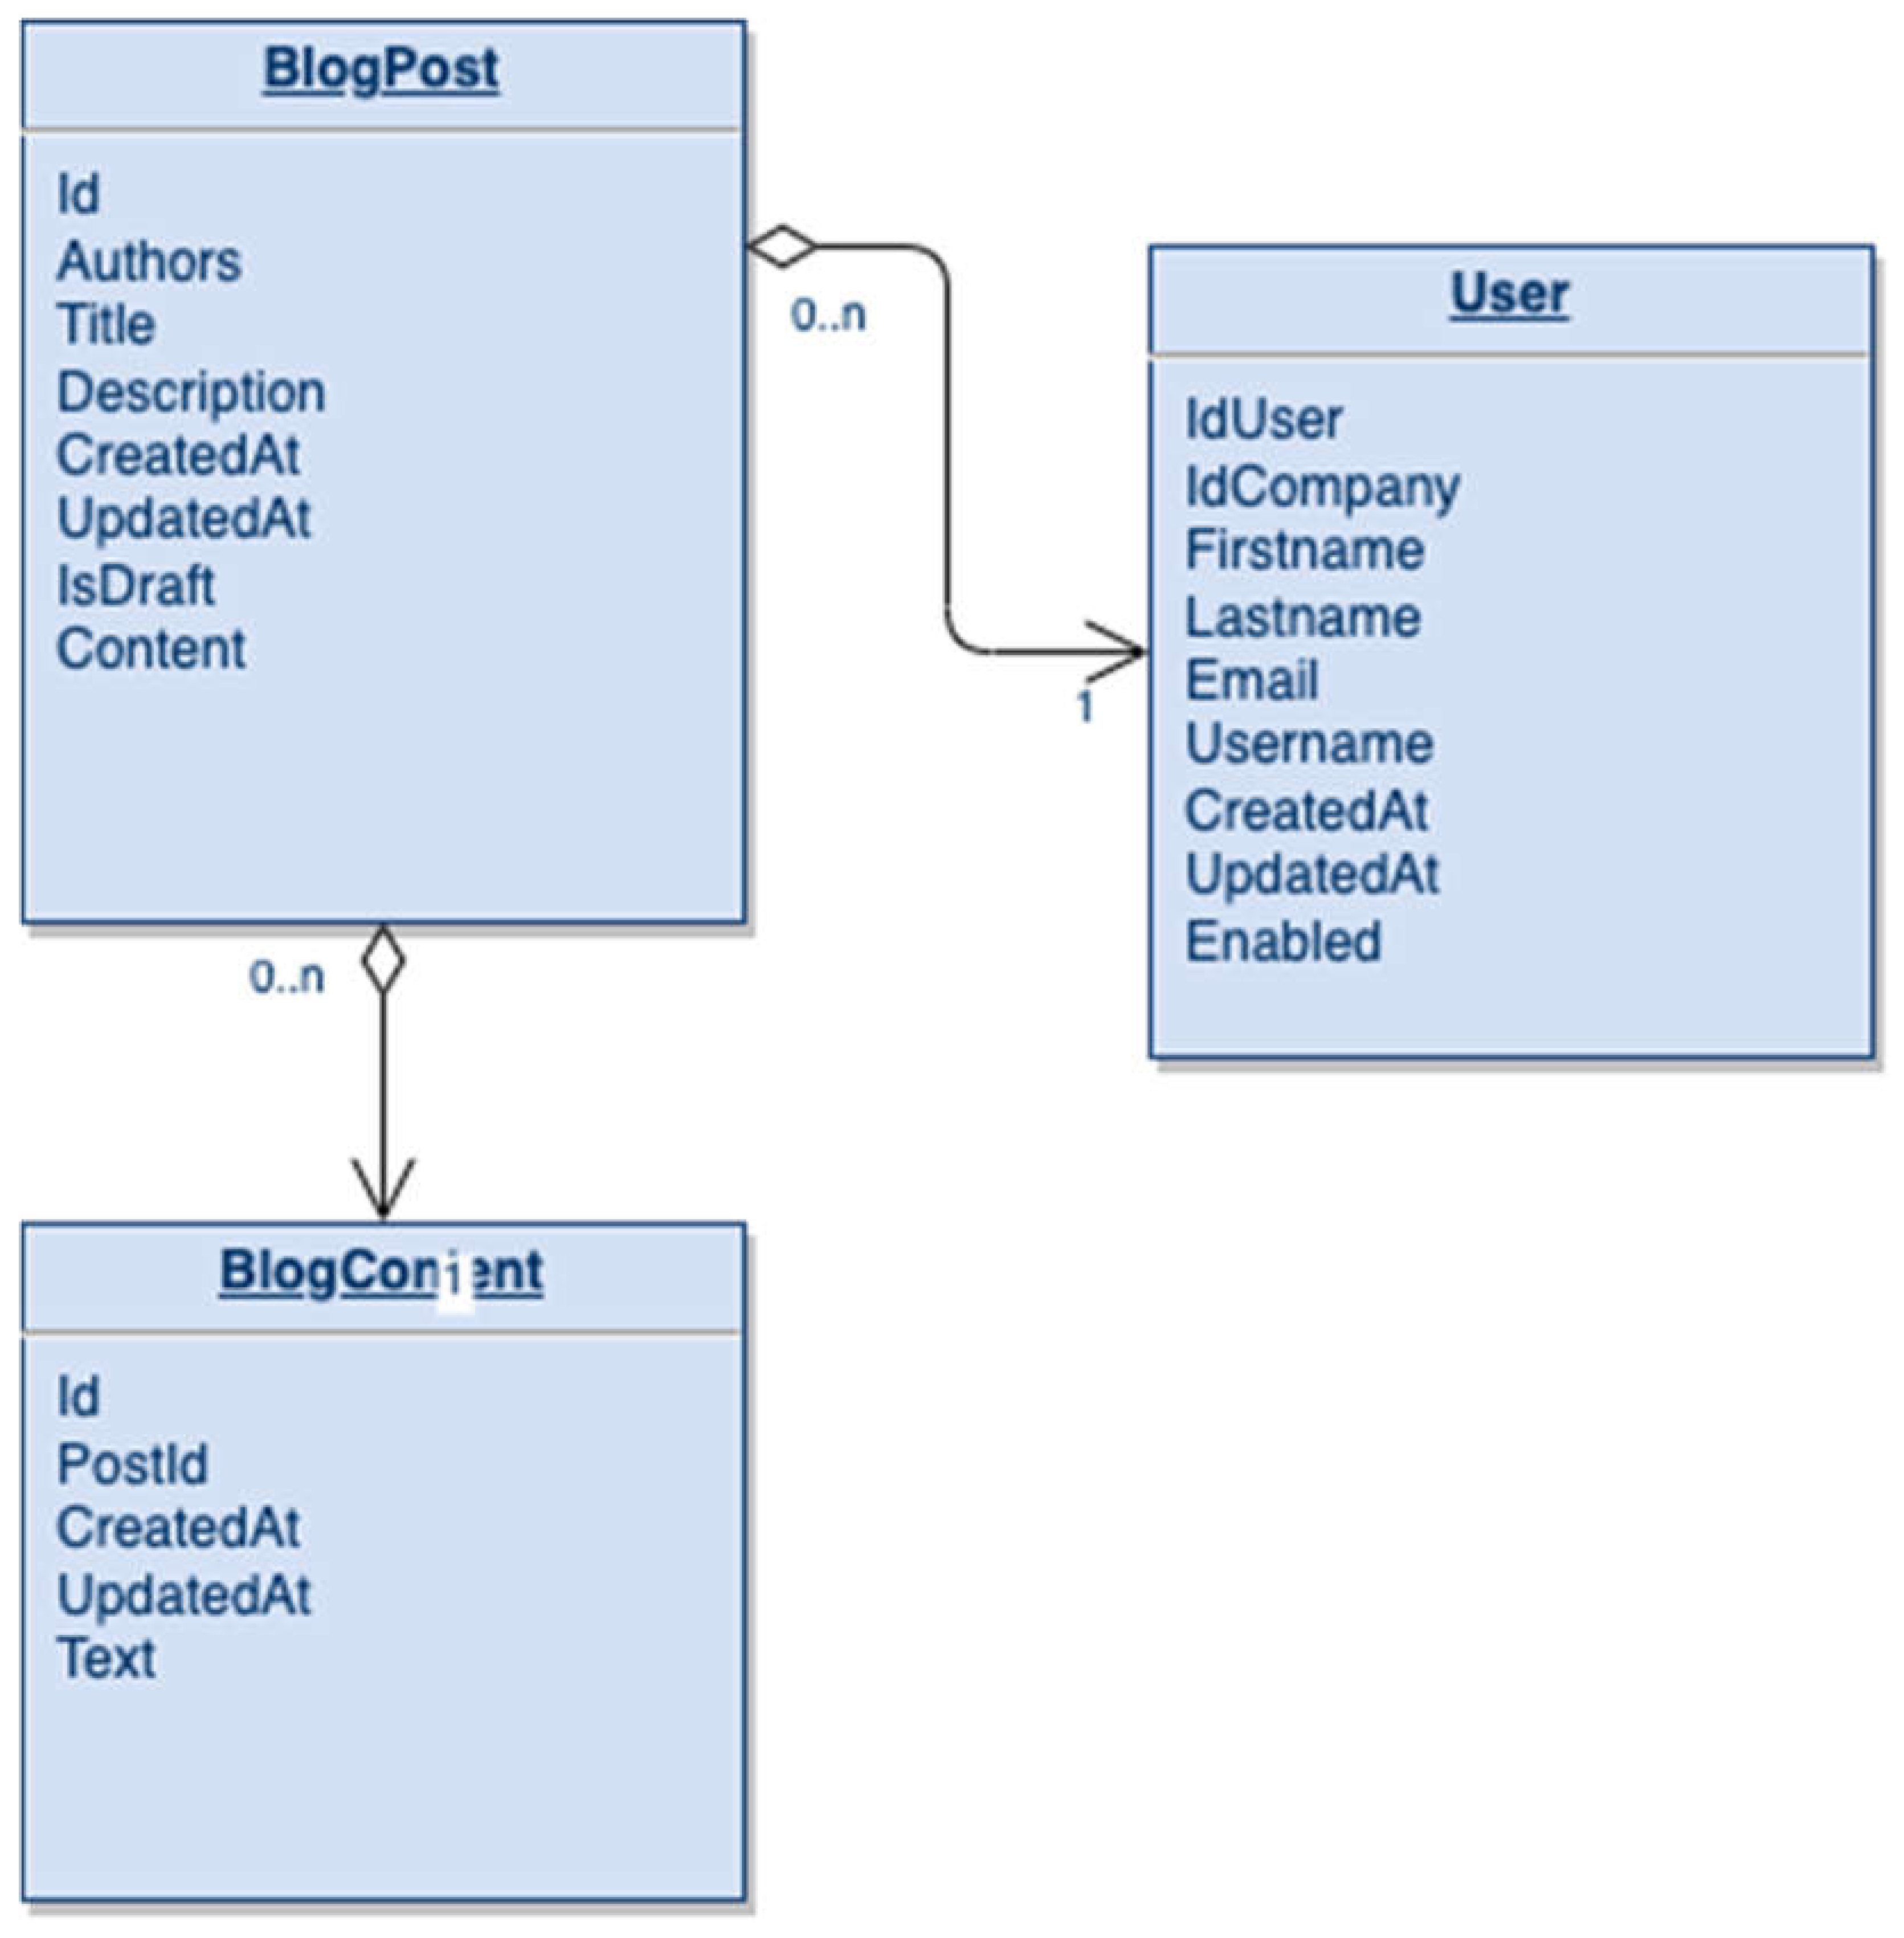
An Entity Relationship Diagram (ERD) communicates the structure and relationships between data tables [8]. For example, the ERD example (Figure 4) outlines the data relationships within a blog management system featuring three primary entities: User, BlogPost, and BlogContent. The User entity stores comprehensive user details and has a one-to-many relationship with the BlogPost entity, indicating that a single user can author multiple blog posts. Each blog post includes attributes like title, description, and content status (draft or published) and can be associated with multiple BlogContent records, which handle potentially large or segmented text elements of each post. This ERD effectively showcases the structured data interactions fundamental to the platform’s operation, emphasizing how content is authored, stored, and updated.
This diagram style has different syntaxes depending on the language (e.g., UML, SysML), but the general purpose is the same [8,9]. This type of diagram shows the objects or data entities in a system. It can be used to represent database tables or class relationships. Similar diagrams can be used in cyber-physical domains using SysML to show the logical structure of a system [8].
2.5. Other Diagram Types
There are many other types of diagrams used in software and systems engineering. These sometimes overlap in purpose or syntax and lack consistency in notation. The examples above are illustrative examples of the variety of these diagram types in syntax and purpose.
- Sequence Diagrams
- Use Case Diagrams
- Deployment Diagrams
- Component Diagrams
- State Machine Diagrams
- Class Diagrams
- Package Diagrams
It should be noted that the methodology presented in this paper is intended as a general solution to data extraction and modeling rather than a solution to a single diagram type.
3. Tooling
3.1. Diagrams.net (Draw.io) and MxGraph
Several different tools are available for creating diagrams. One of these is Diagrams.net (formerly Draw.io), a web-based diagramming tool that can generate a variety of general-purpose diagrams [10]. In addition to the web-based version of the tool, there is also a desktop version (branded as Draw.io Desktop) [11] and a Visual Studio Code (VSCode) extension [12,13], which is an unofficial version of the tool that allows software developers to edit diagrams directly in Visual Studio Code.
The .drawio format is a readily parsable XML file based on MxGraph, and XML format for storing graph data structures [14]. Other formats were explored so the diagrams could be readily embedded in Markdown files. Importantly, the files need to be parsable so that data can still be extracted from the diagram.
3.2. Draw.io VSCode Integration
One method explored for diagramming is using the Draw.io VSCode extension by Henning Dieterichs [12]. This extension embeds the Draw.io application into VSCode so that files with extensions *.drawio, *.drawio.svg, or *.drawio.png will be opened in a Draw.io tab rather than an ASCII text file.
3.3. Other Tool Considerations & Tool Selection
Microsoft Visio, Lucidchart, and Gliffy were other tools considered for this method. Draw.io was selected for its accessibility and open-source nature.
Both the desktop tool and the VSCode extension were used to generate diagrams. Draw.io was chosen for this analysis due to its widespread use, general purpose use case, and open-source nature.
4. Methodology
This section outlines the general method for creating structured models from informal Draw.io diagrams. The drawio.png file format will be the primary focus for its practical use in documentation [15].
- Begin with a Draw.io diagram, saved as a .drawio.png file. Those wishing to reproduce this method may use the image below as it uses this format. In this case, a simple activity diagram is used.
Figure 5.
A sample activity diagram.
- 2.
- Extract the MxFile data from the image. The MxFile XML is stored as metadata in the image. This can be extracted and converted into a usable format.
- 3.
- Convert to JSON (optional). As an intermediate step, the method used in this paper converts the MxFile XML to JSON. This is done primarily for the convenience of working with JSON over XML and can be skipped if needed.
- 4.
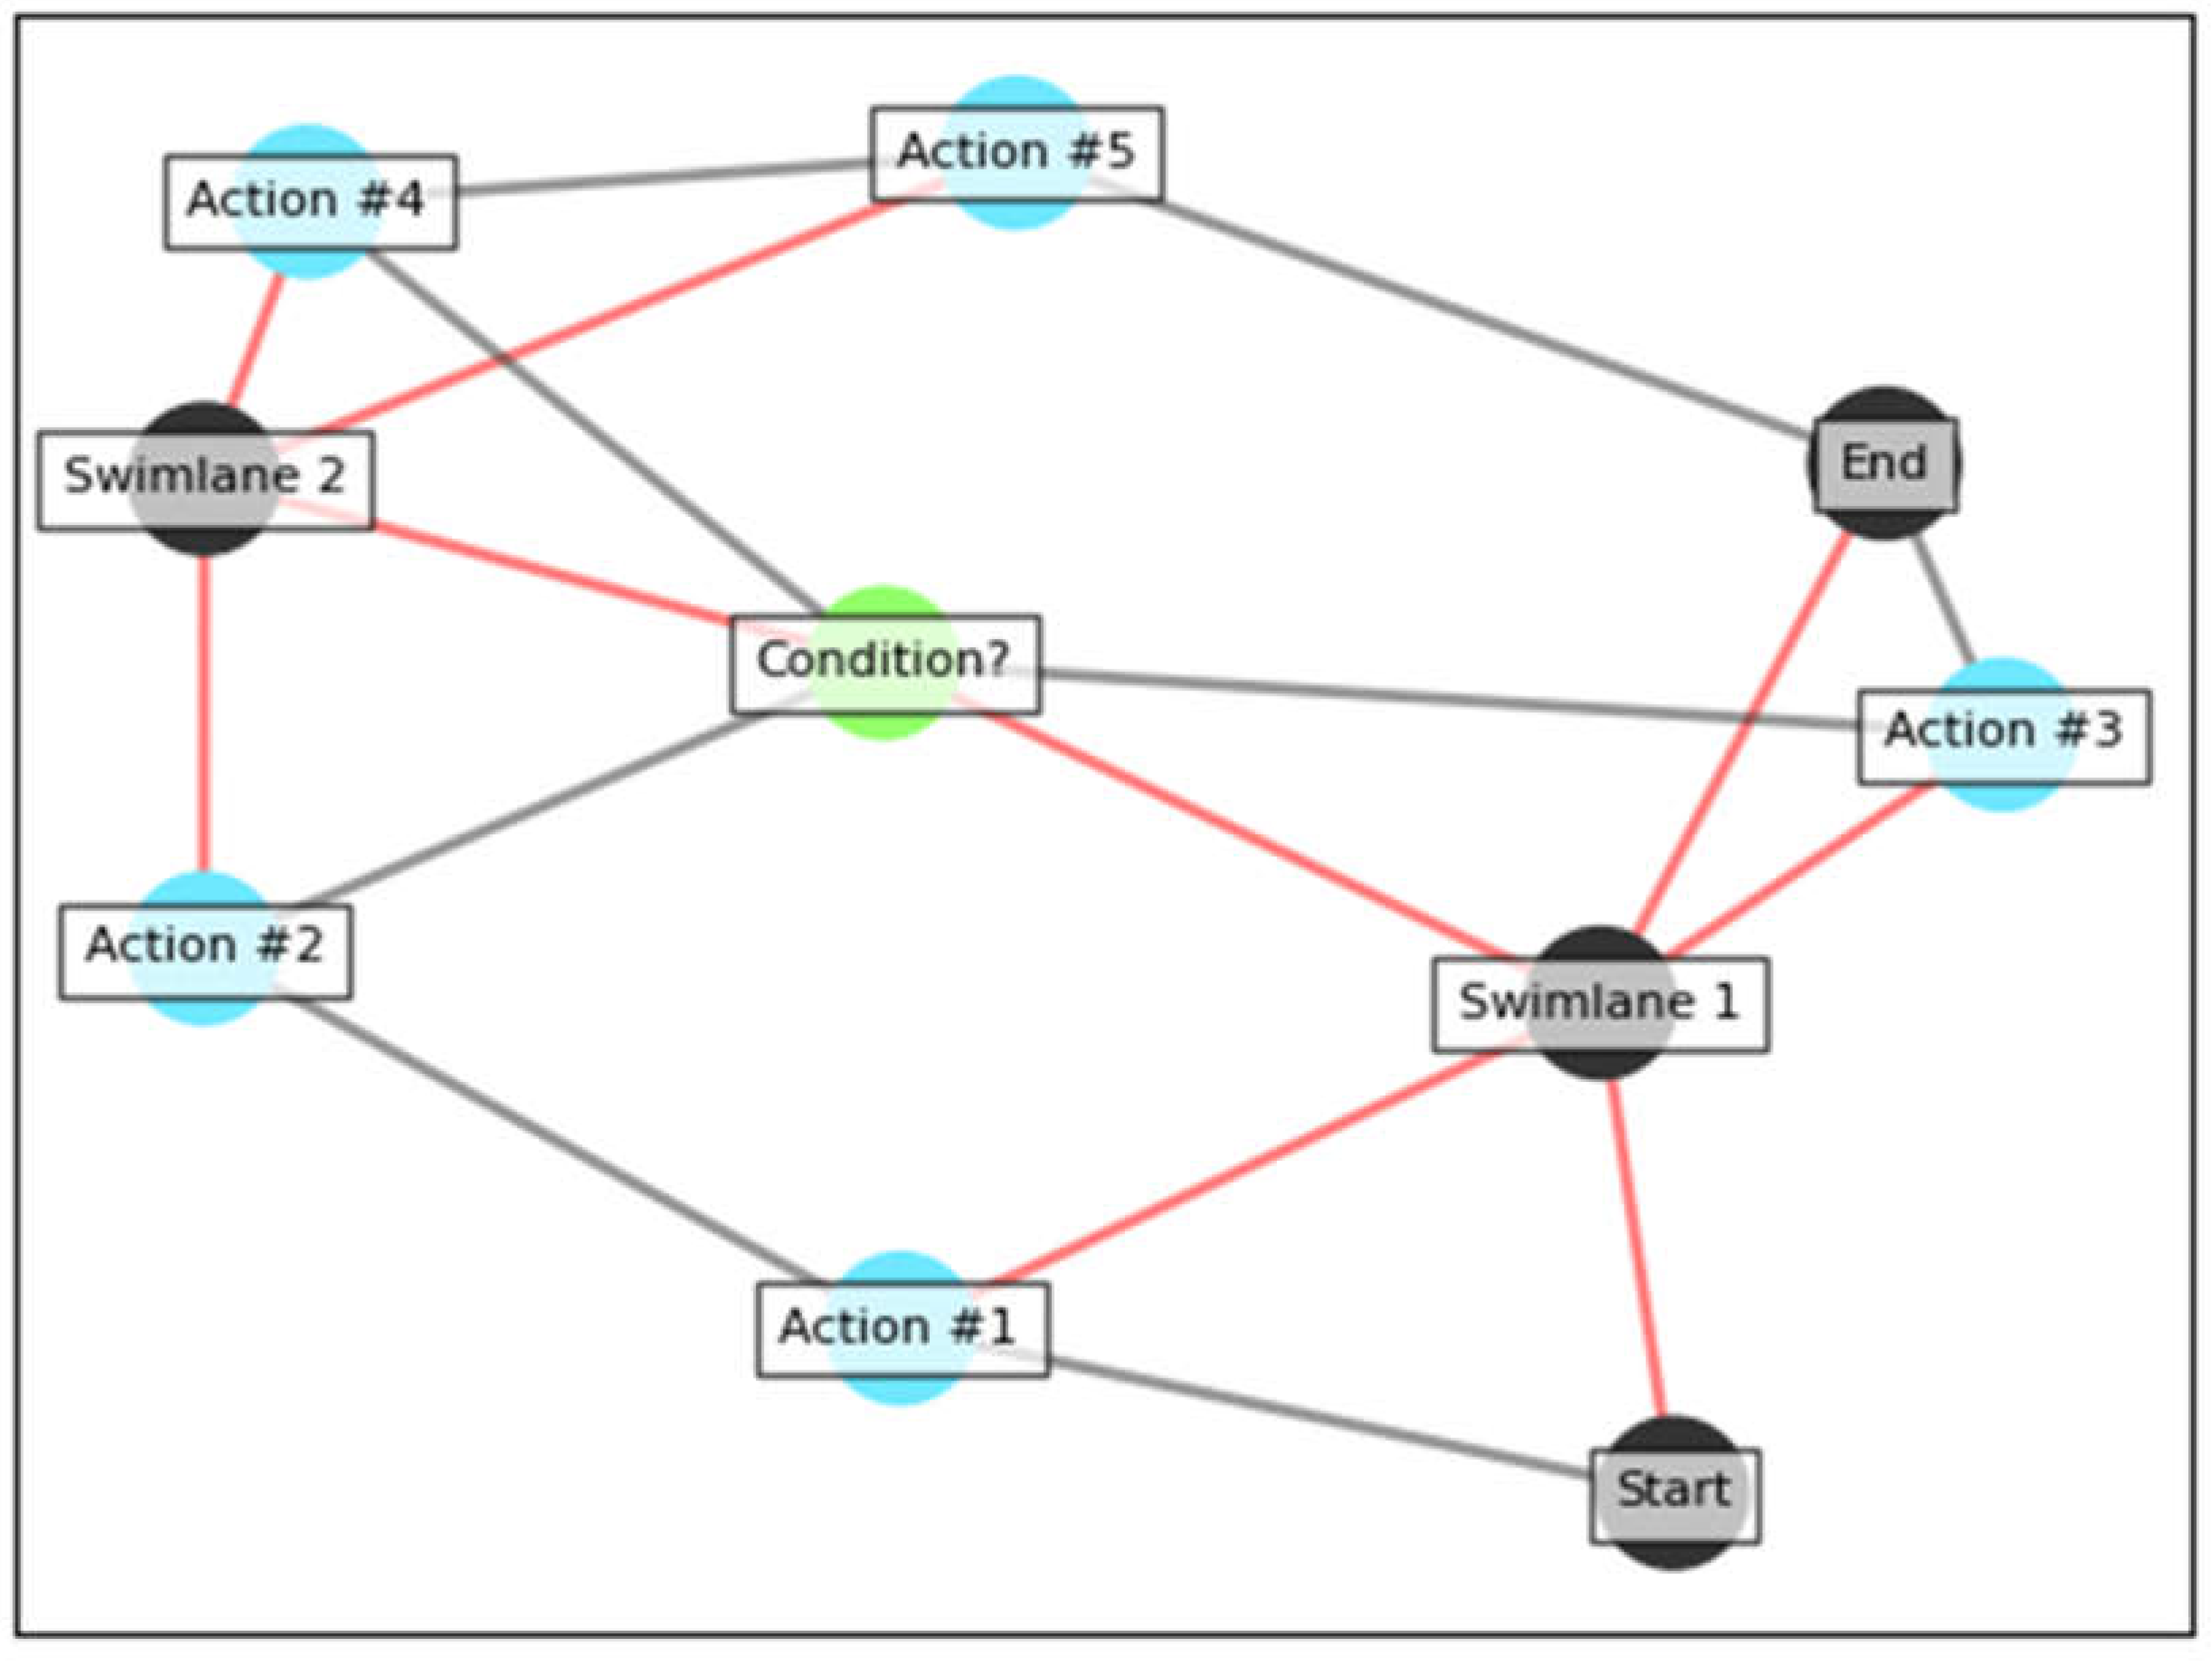
- Convert to NetworkX. Next, data is converted into a usable model. The primary method used for the demonstration is Draw.io, but there are no technical limitations to the format at this point. With a NetworkX model, a usable format is available for analysis or visualization.
Figure 6.
A NetworkX model of the sample activity diagram
- 5.
- Infer Additional Information (optional). A final step is to infer additional information that might be useful in a model that was not present in the original diagram. This is discussed in detail later in this paper.
The remaining sections of this paper will cover each of these stages in detail. First data extraction and format conversion is discussed, then inferences. Finally, an end-to-end example is shown which demonstrates indexing, query, and analysis concepts.
5. Extracting Data from Informal Artifacts
5.1. File Formats
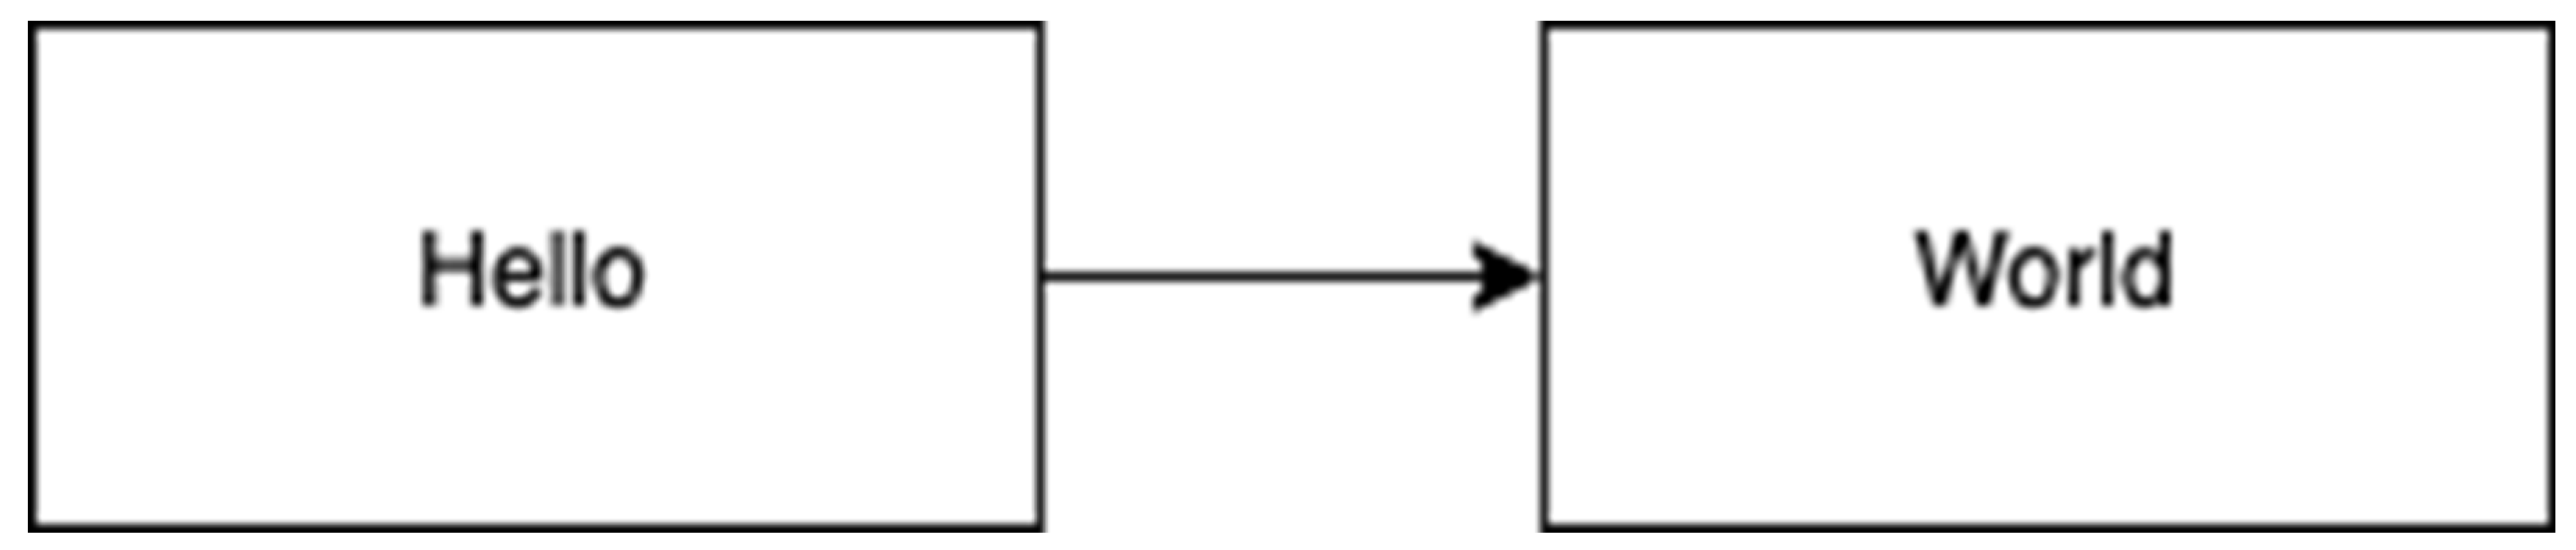
A simple “Hello, World” diagram is used as an illustrative example to break down each file format. This sample diagram contains two nodes labeled “Hello” and “World,” shown below. The “Hello” node has a data property called name with a value of foo. While this is ultimately a simple example, it will be used to show the contents of each file type in detail.
Figure 7.
The Hello World diagram.
5.2. The .drawio File Format
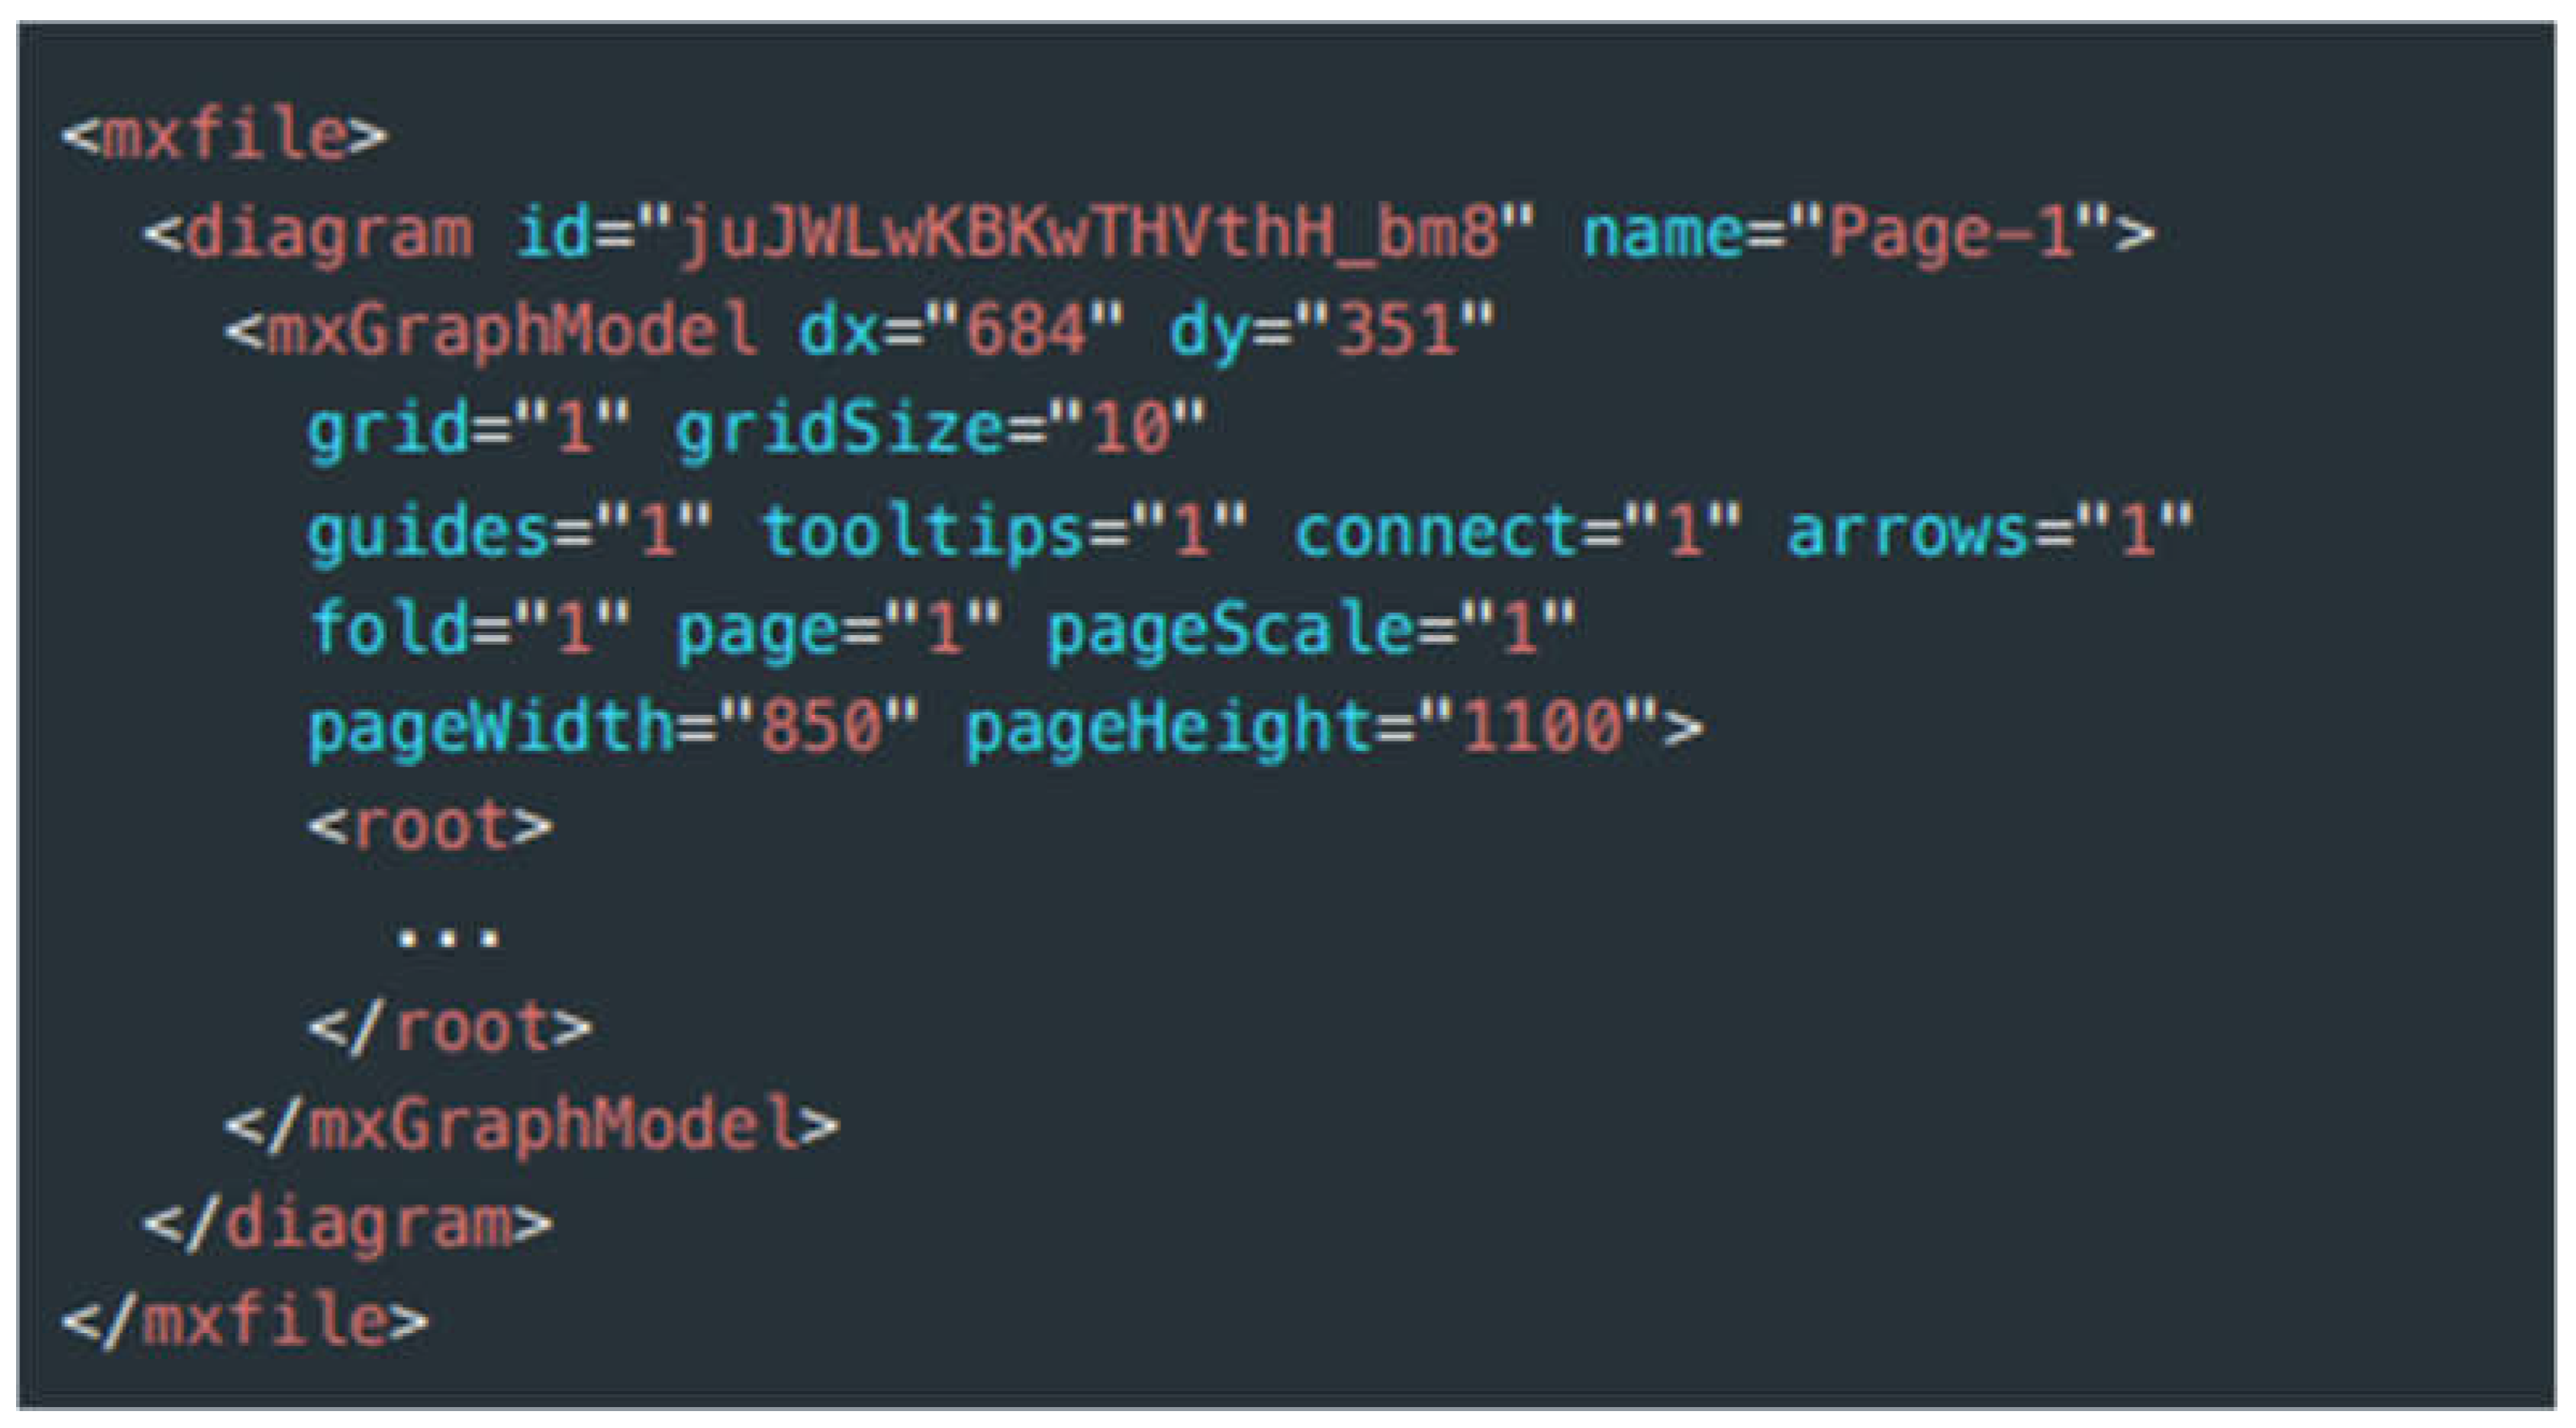
Draw.io uses the MxGraph library to store graph data [14]. The full format is shown in Appendix B. MxGraph stores data in MxFiles, which are XML documents, as shown in the hello.drawio XML code snippet below.
Figure 8.
This is the format of. drawio files.
5.3. The .drawio.svg File Format
The .drawio.svg format encodes the diagram as an SVG file, which is an XML document that describes the geometry and style of an image. The mxfile is stored as a string in the content attribute on the top-level SVG tag, this data for the Hello World example is shown below:
Figure 9.
Data for the Hello World Example.
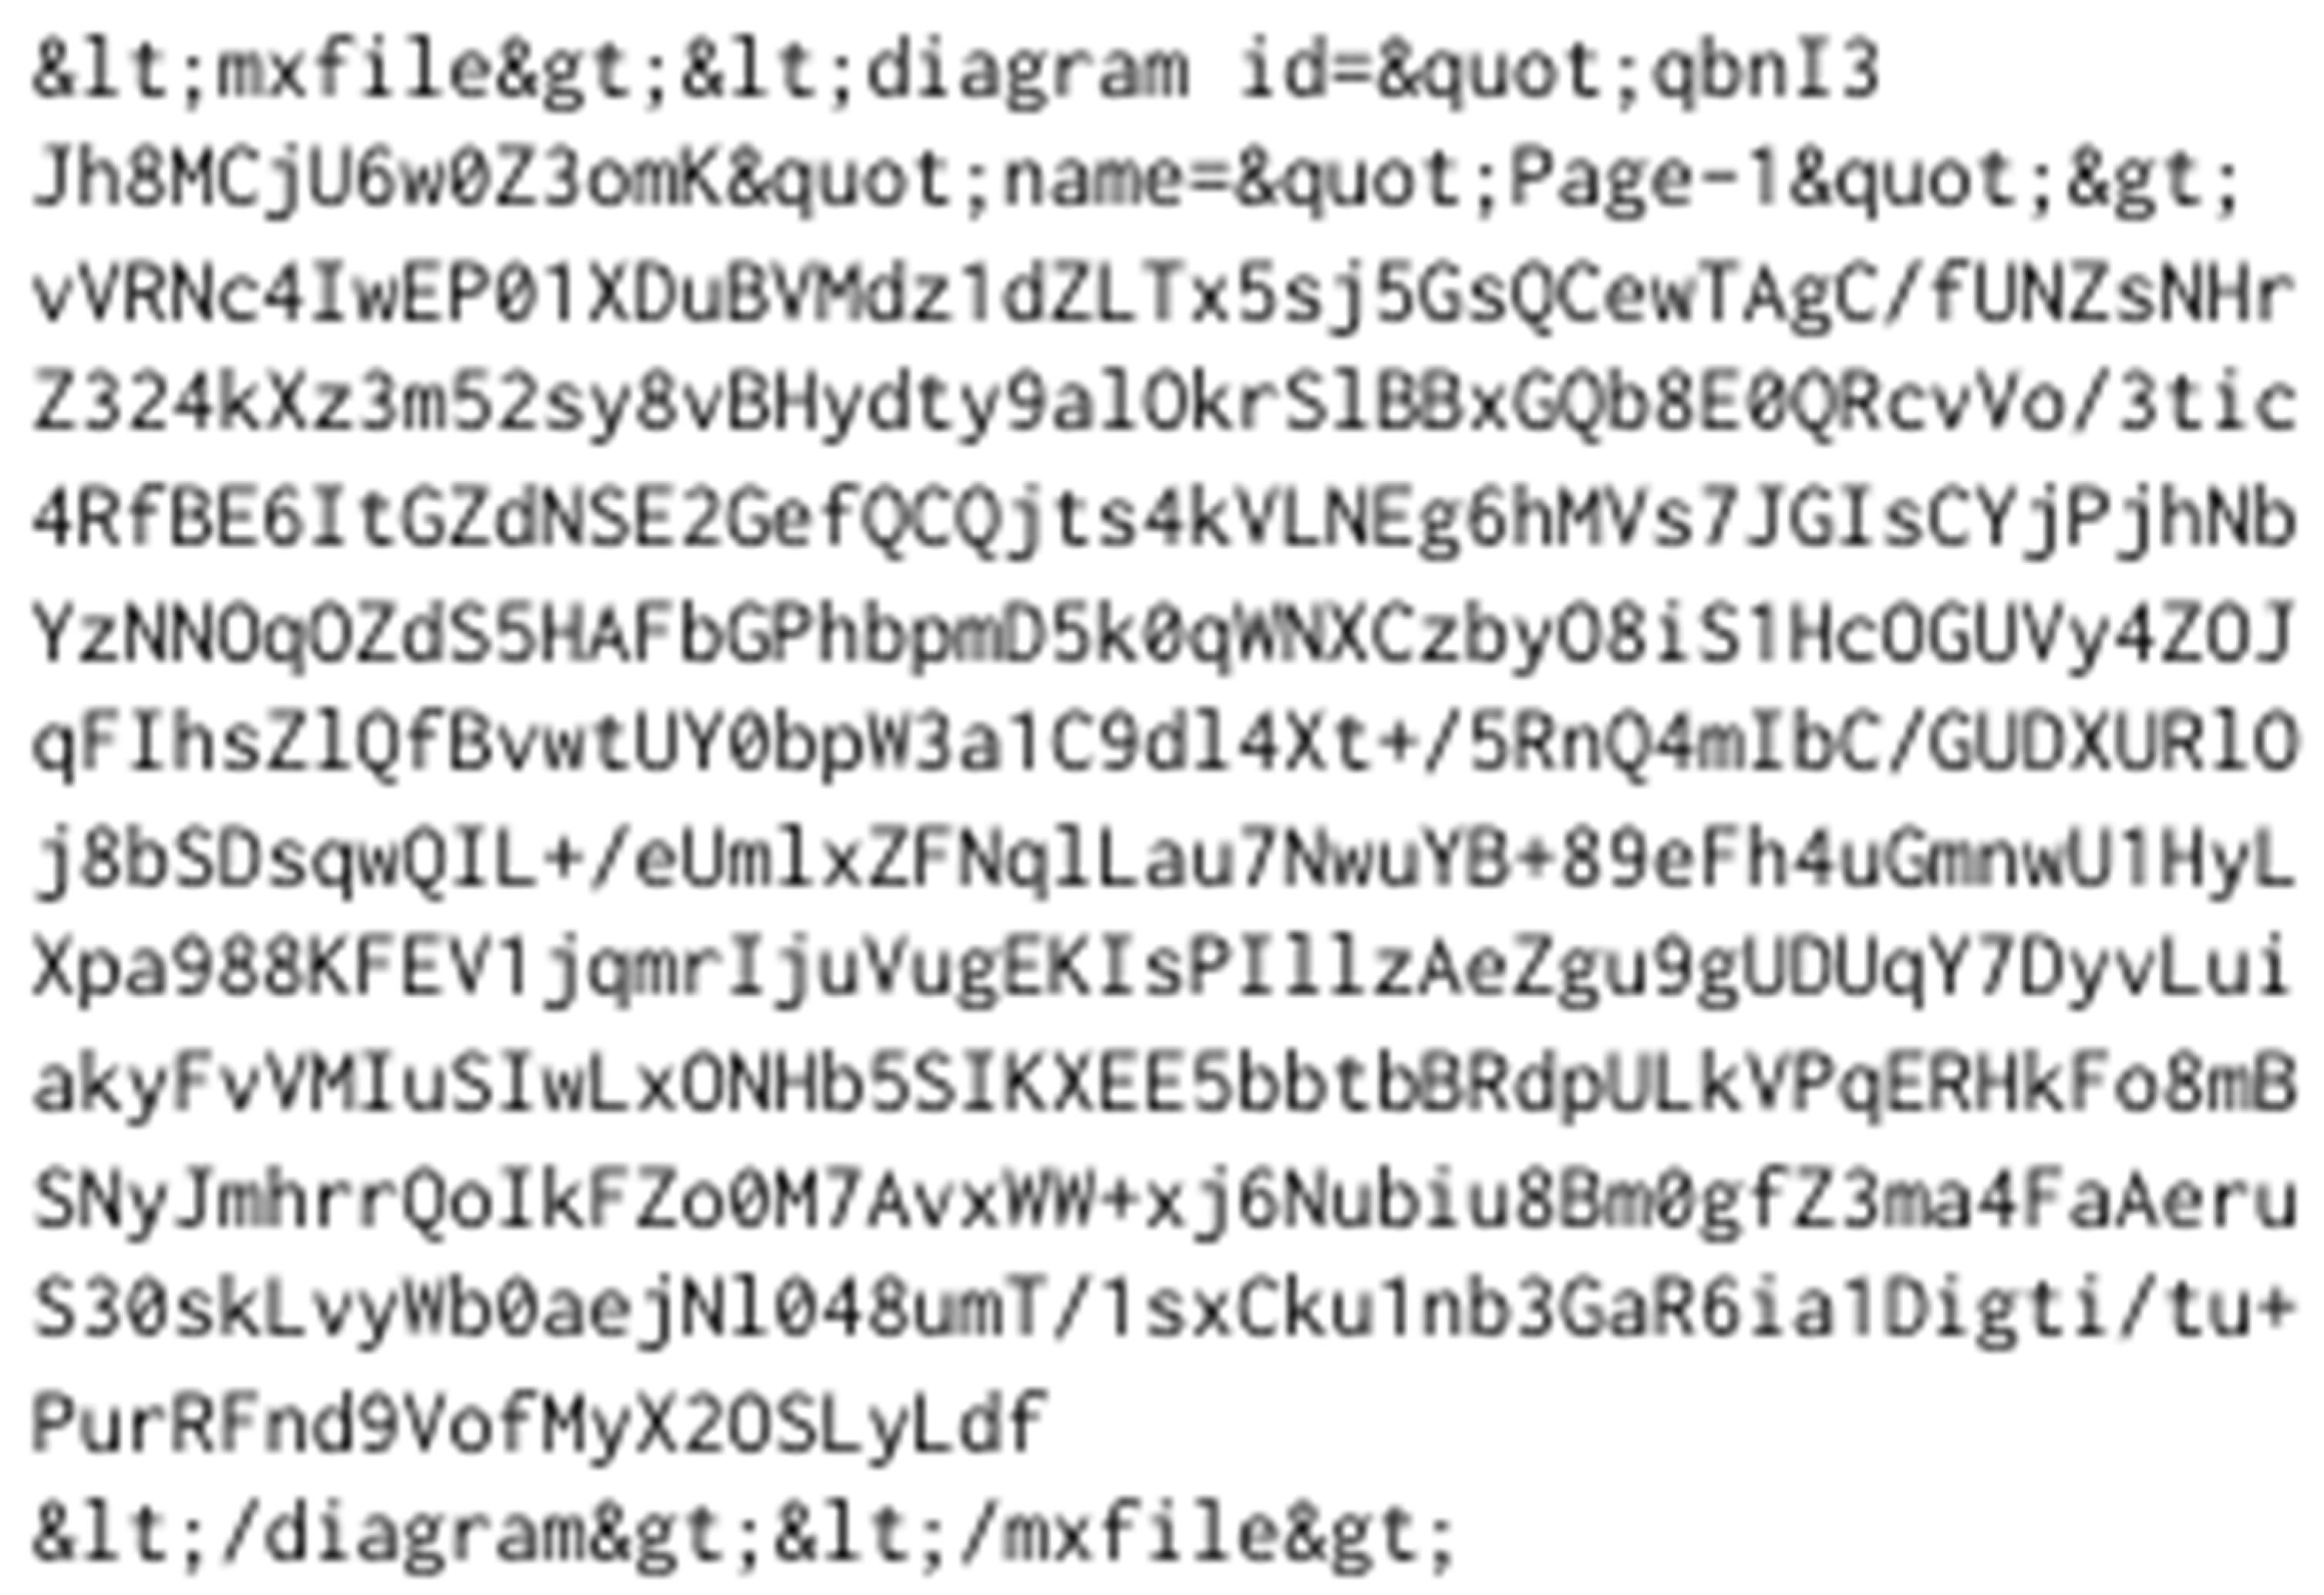
The data value in the content attribute contains escaped HTML. Unescaping the HTML gives an MxFile; however, the data is still encoded. The data is URL encoded, then deflated, and base-64 encoded. Reversing this encoding gives the MxGraph XML, as shown in Fig. X.
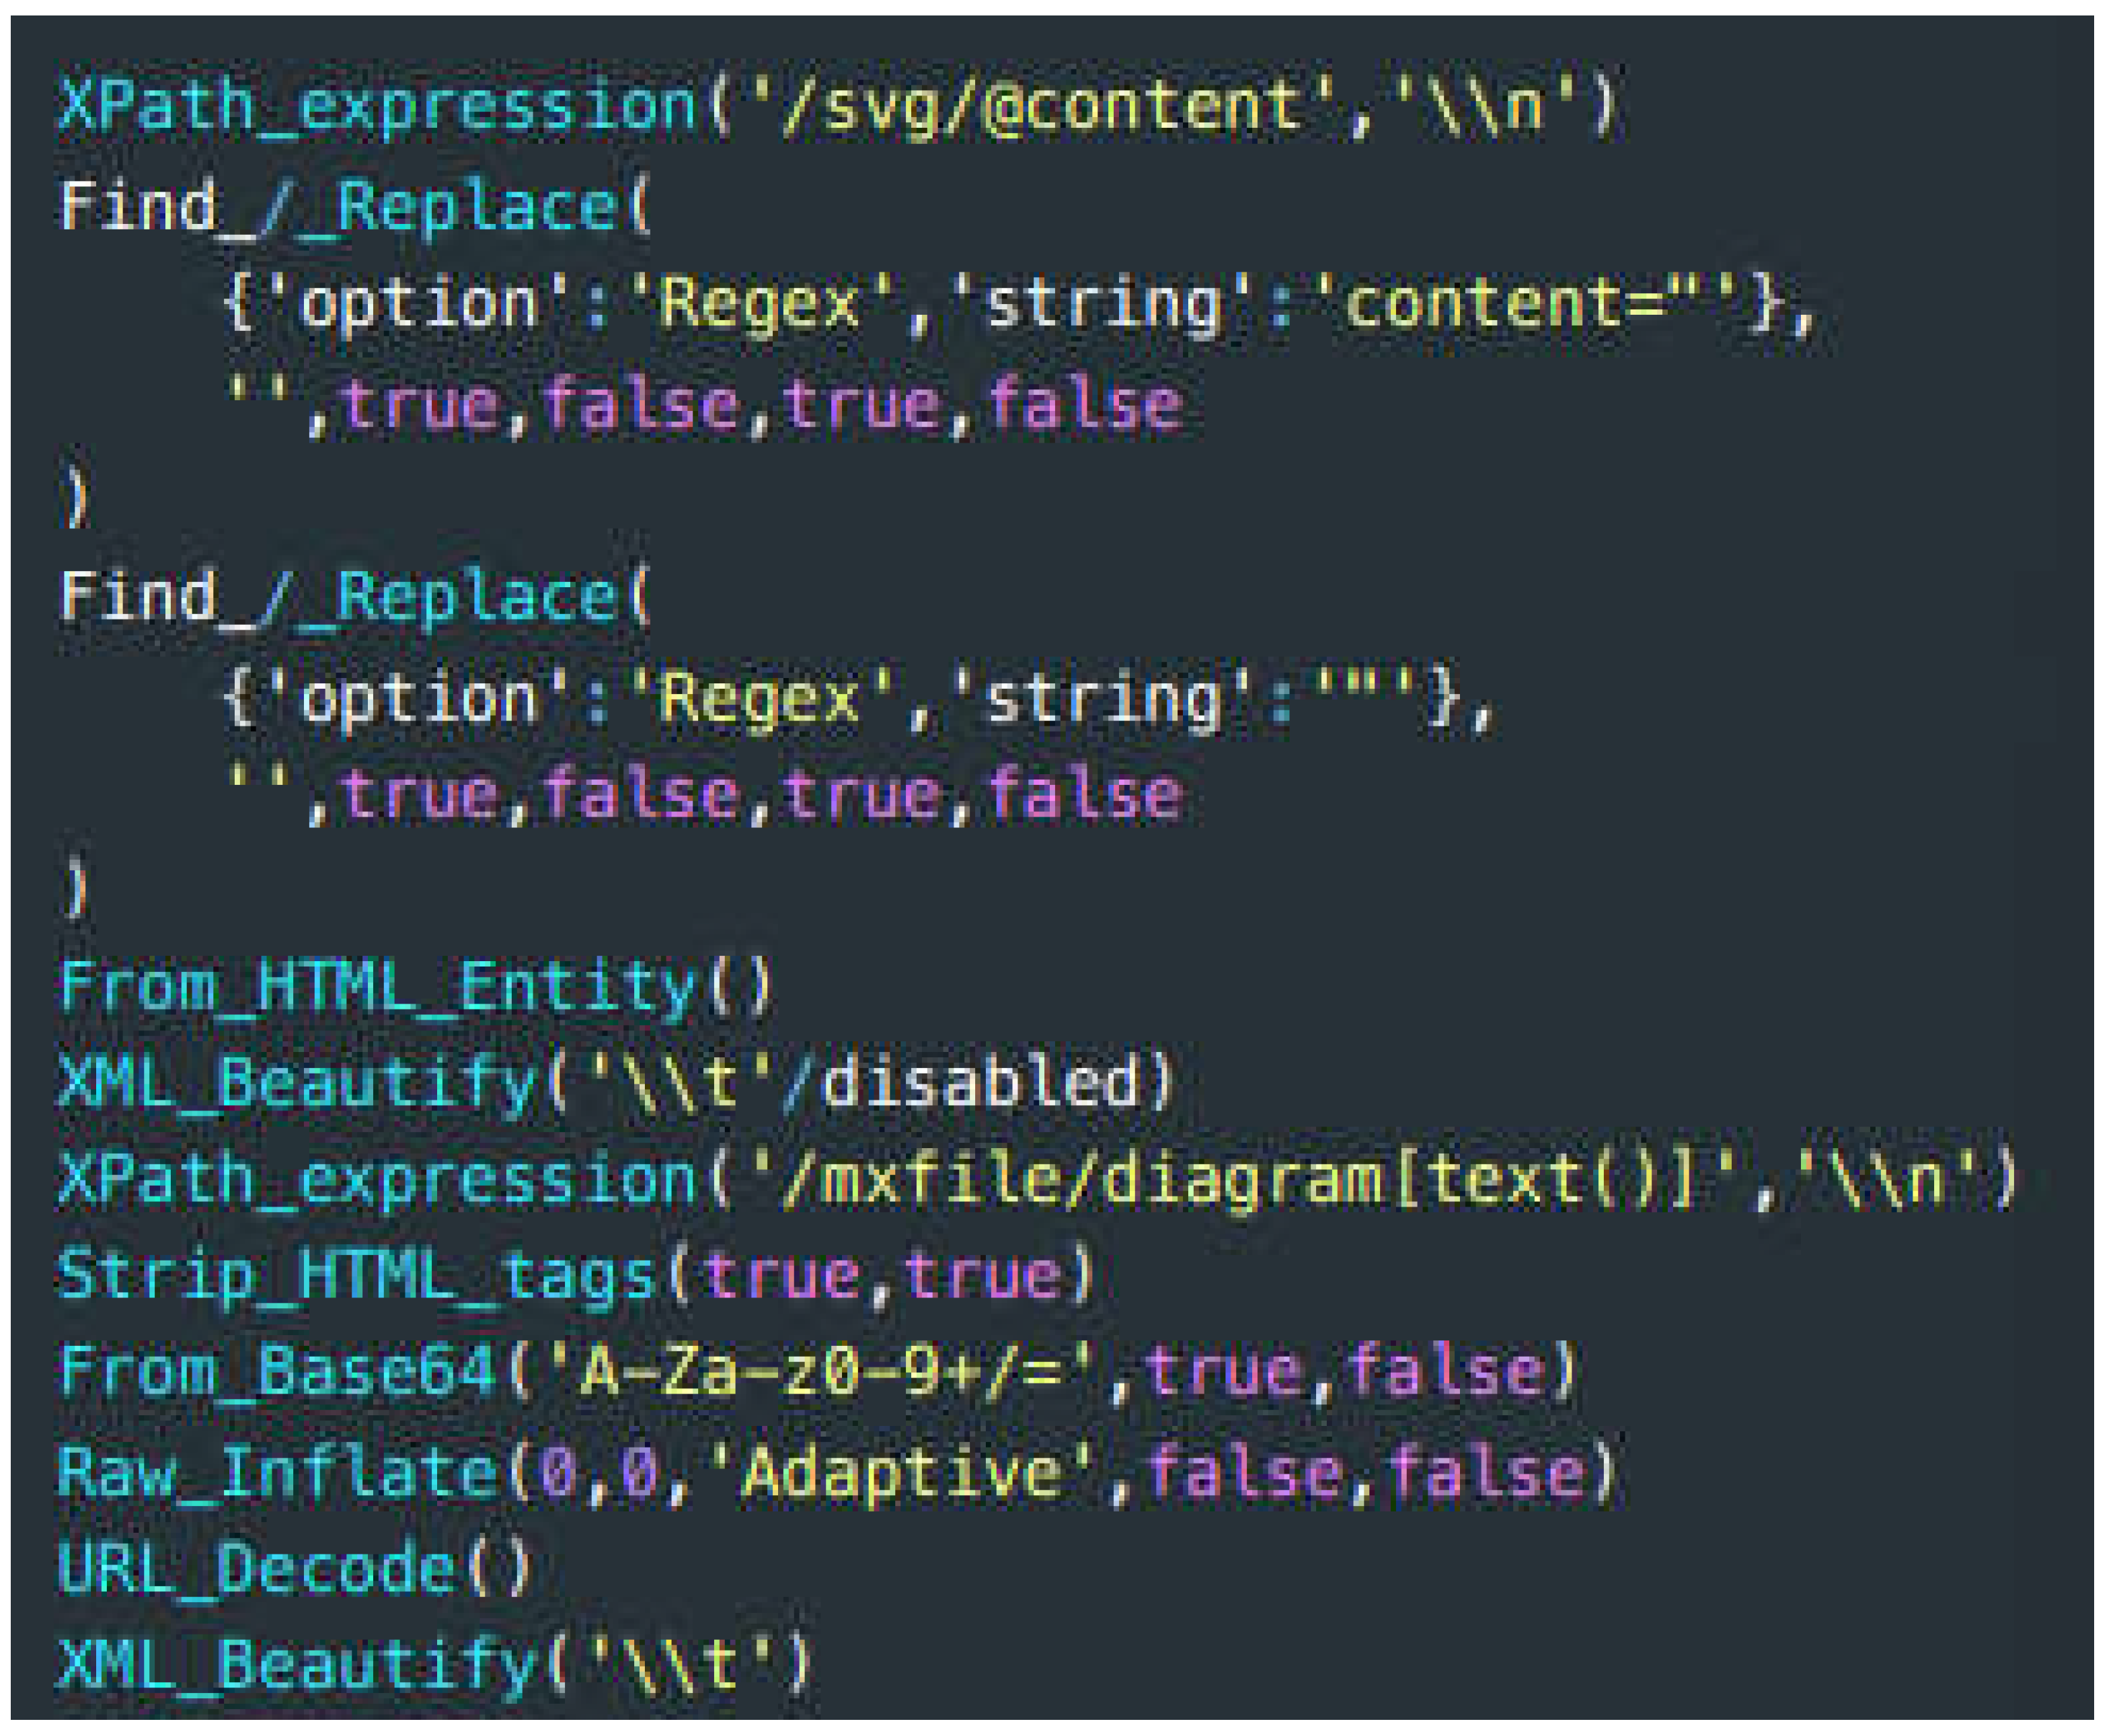
The tool CyberChef [16] was used to represent the complete extraction method in a platform agnostic way. The CyberChef recipe for converting the original SVG file to the MxGraph XML data is:
Figure 10.
The CyberChef recipe for converting the original SVG file to the MxGraph XML data.
5.4. The .drawio.png File Format
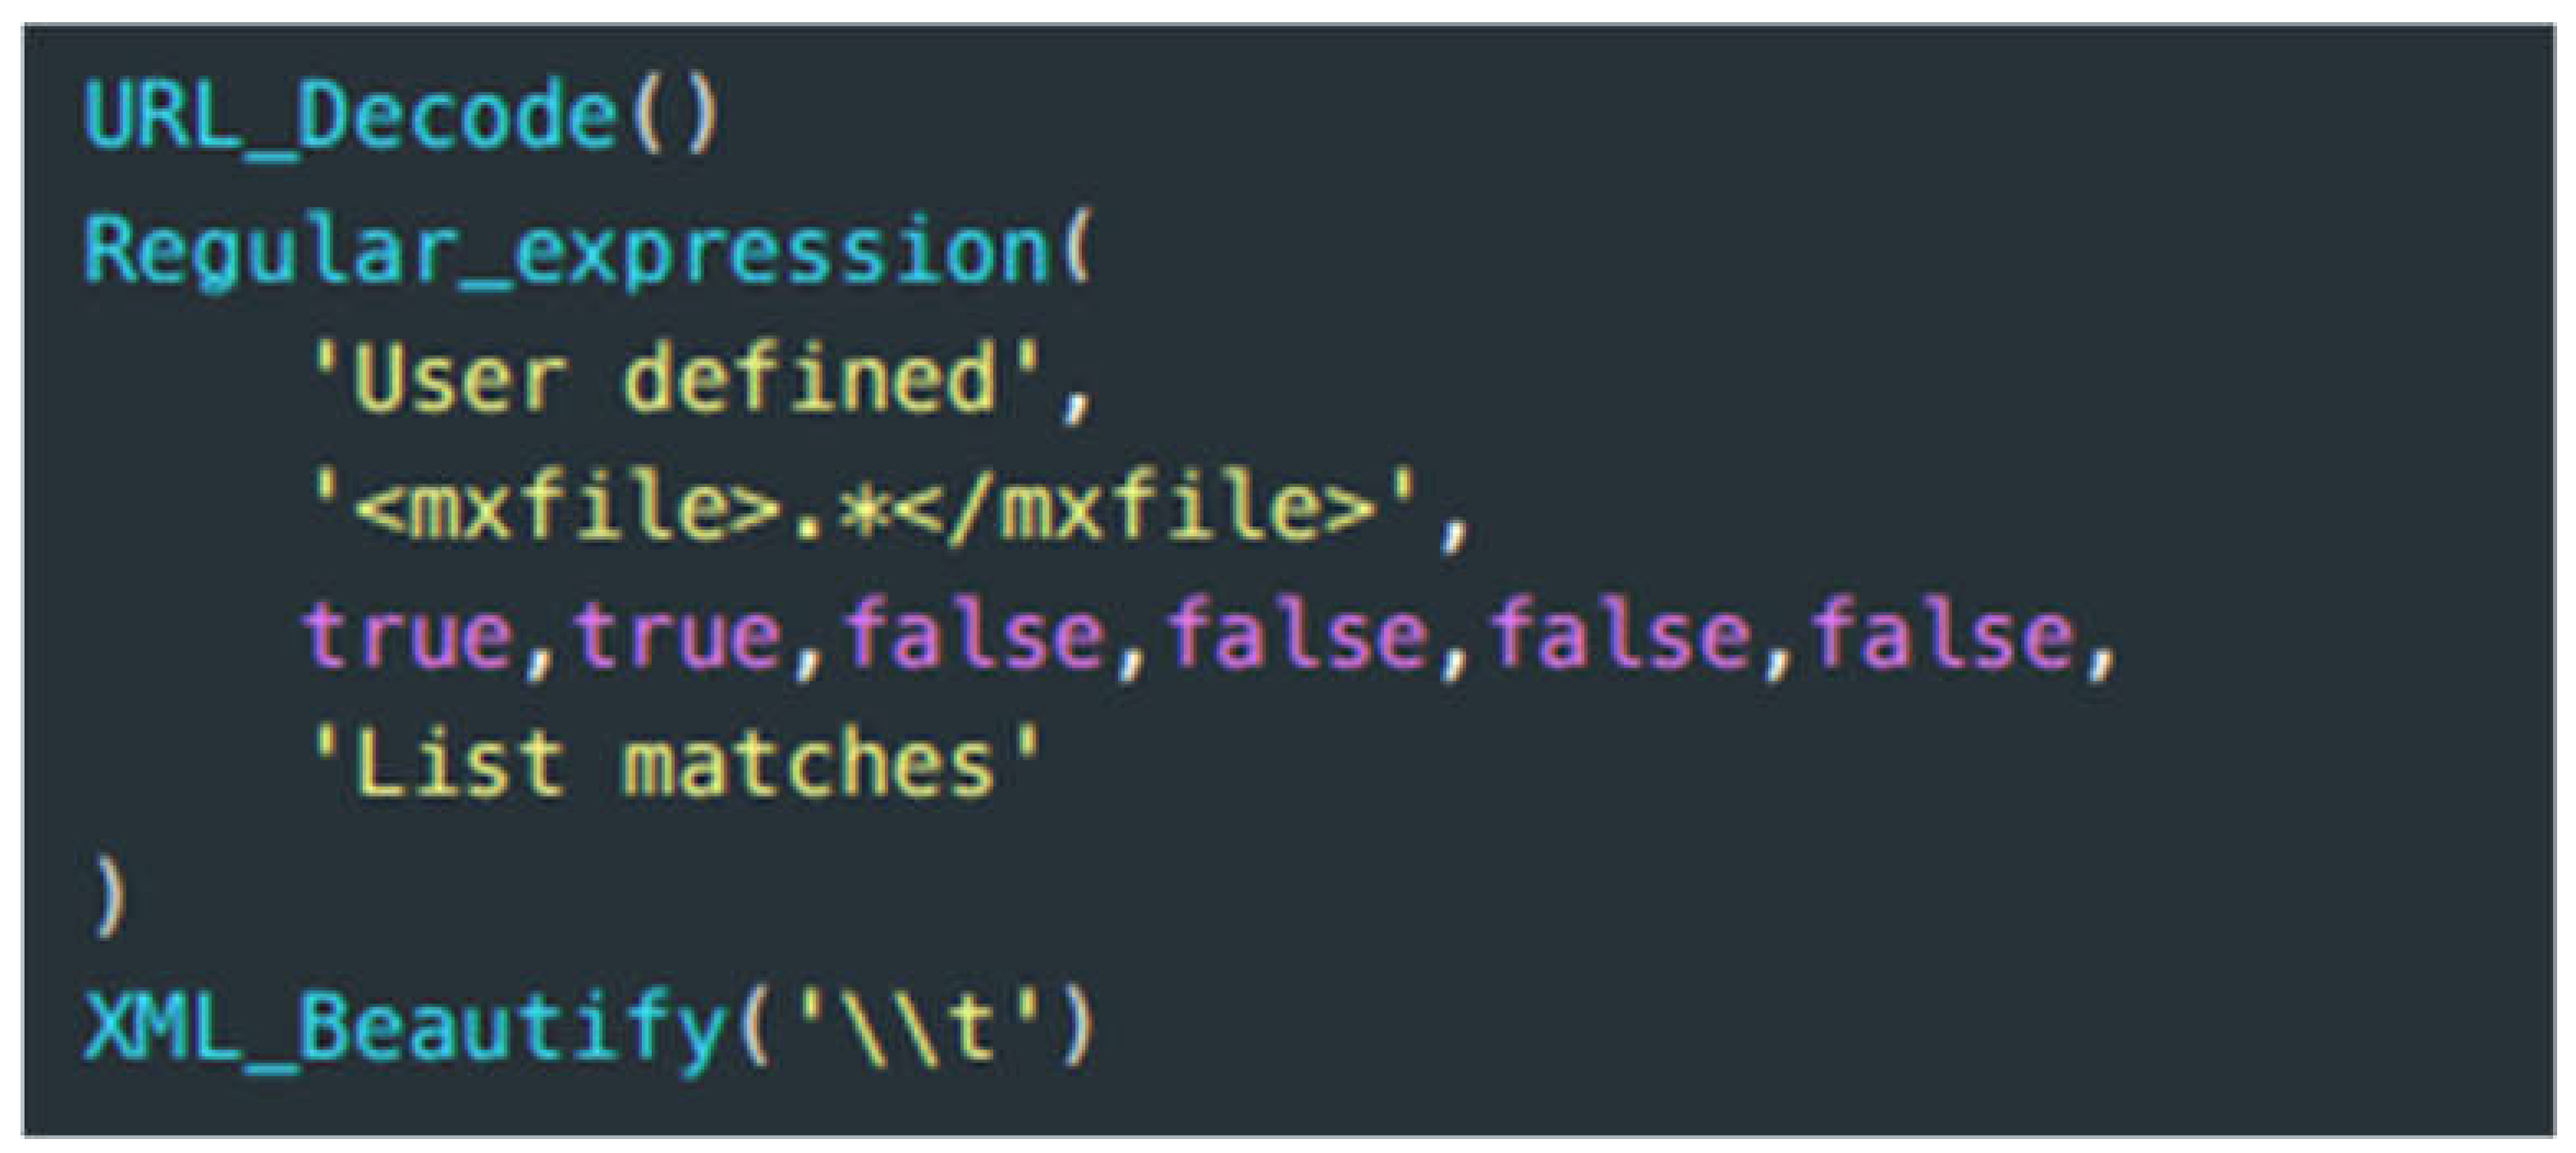
This was a bit simpler and seems to lend itself better to document generation. The PNG is URL encoded, so a simple URL decode returns the Mxfile XML data in the PNG, which can then be extracted using a simple RegEx.
The cyberchef recipe to extract the MxFile is this:
Figure 11.
The cyberchef recipe to extract the MxFile.
6. Extracting Data from PNGs
6.1. Extracting the MxFile
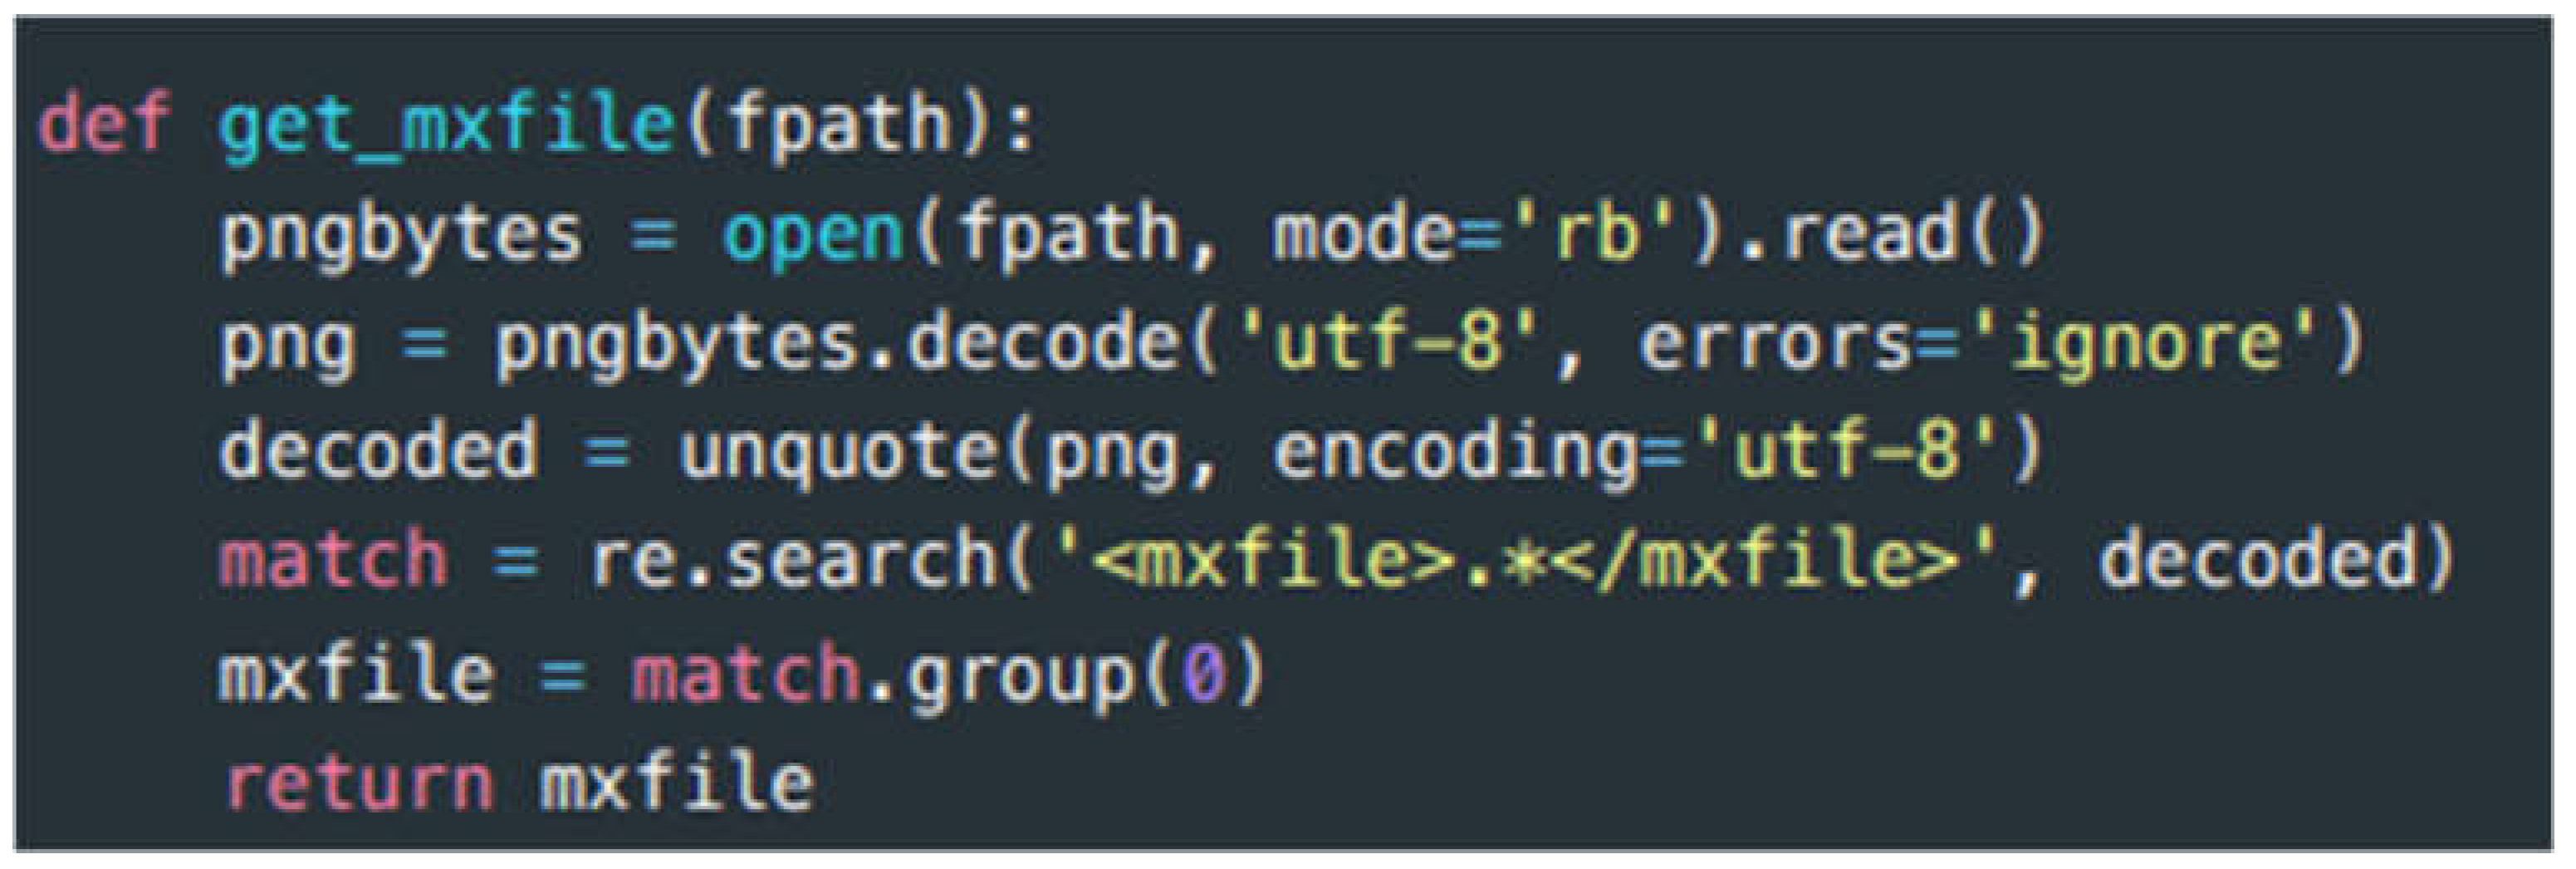
The following function takes as input a file path (called fpath) pointing to a .drawio.png file and returns the MxFile XML as a string.
Figure 12.
Python Code for getting the_Mxfile function.
6.2. Converting to JSON
The Python code to convert this into JSON is as follows:
Figure 13.
Python code to convert to JSON.
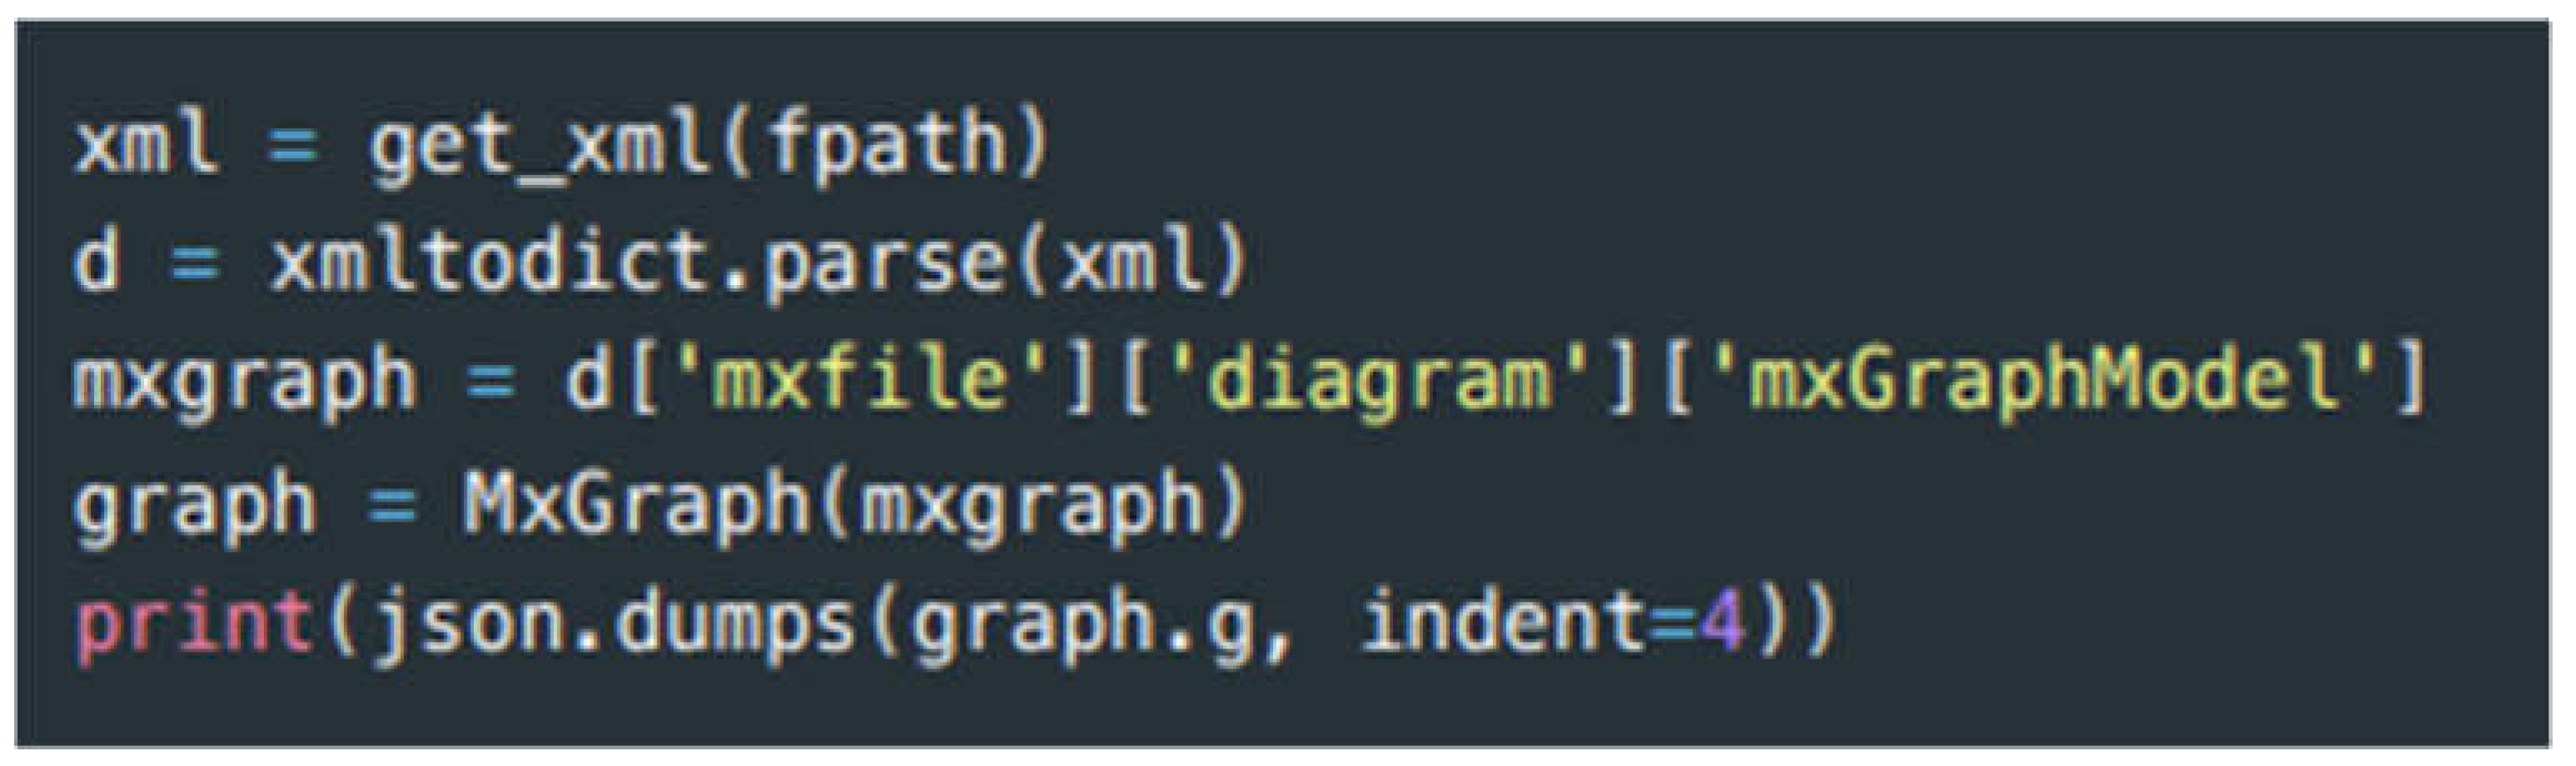
This uses a custom MxGraph class which contains the logic for parsing the MxGraph into a flattened list of dictionaries.
7. Creating Models
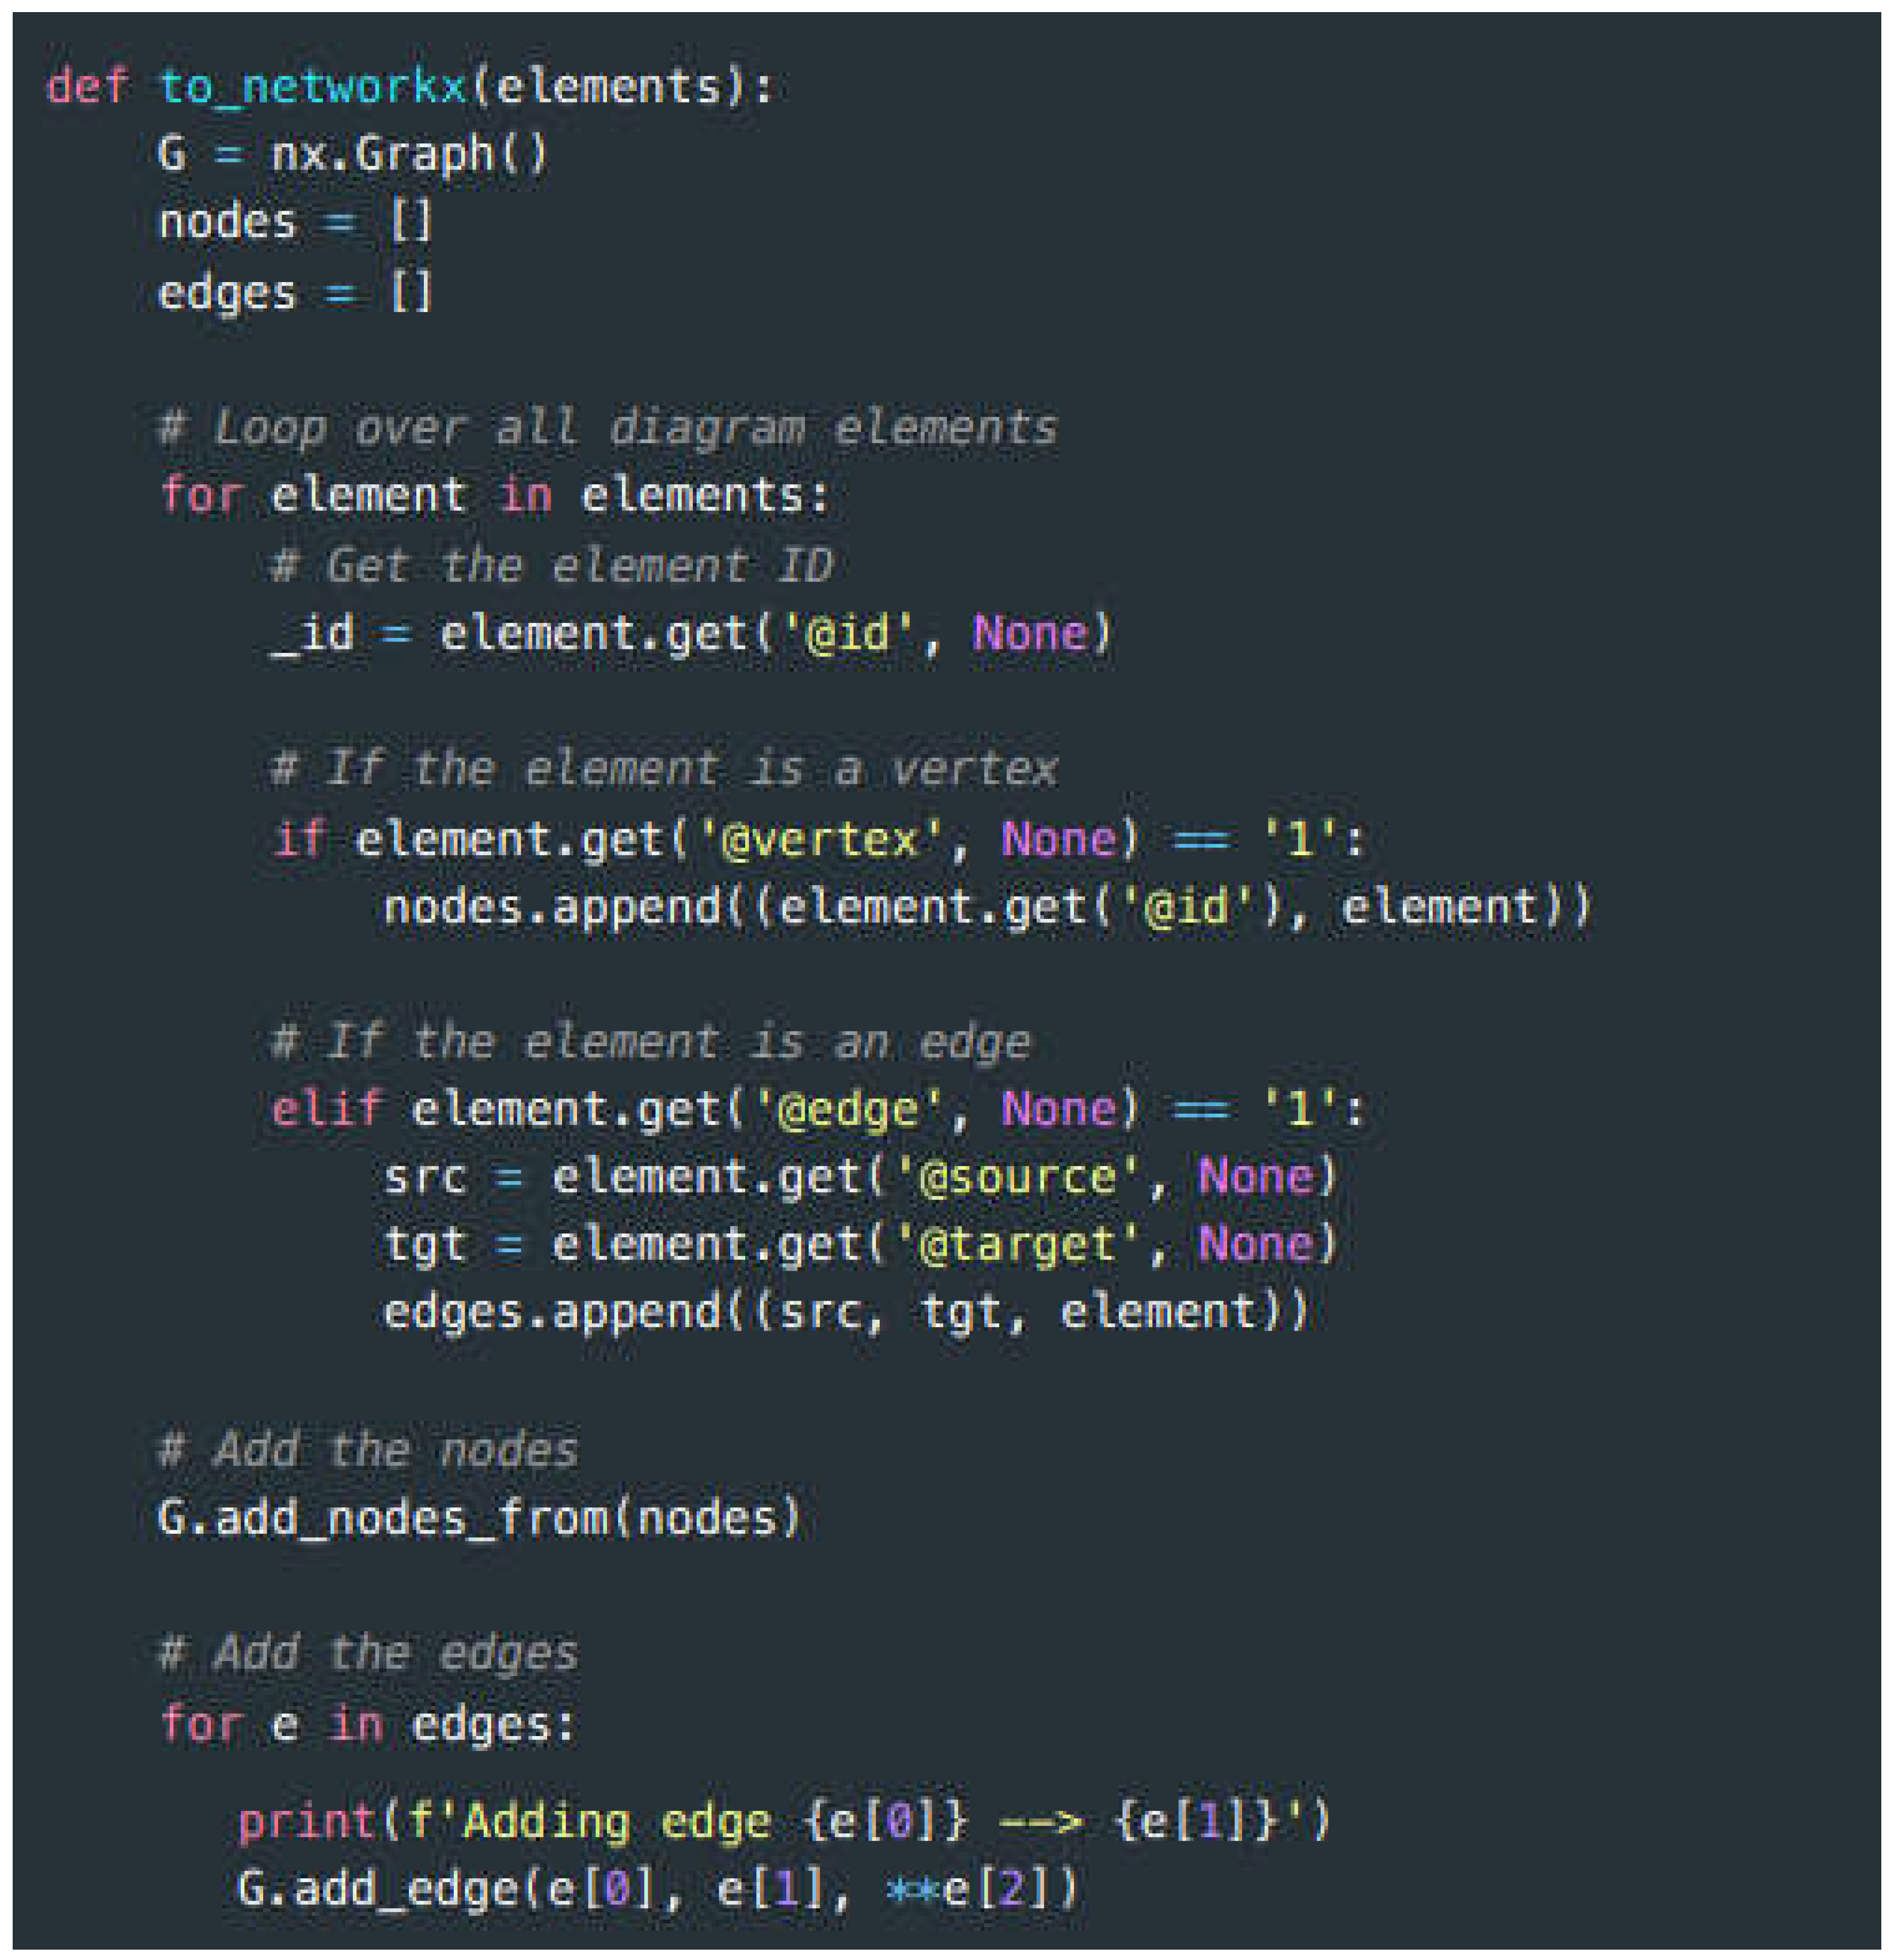
NetworkX converts the MxFile contents to a more usable format. It provides functionality for working with graph data structures, such as traversal and analysis, and visualization capabilities.
The following Python code demonstrates how to convert the MxFile contents to NetworkX. In short, all diagram elements are traversed and identified as either a node or an edge. The appropriate NetworkX functions are used to add the elements to a NetworkX graph. Note that the below code snippet simplifies the actual code to illustrate the methodology. The algorithm used in practice captures node label information, style, and coloring. The complete code is available online.
Figure 14.
Python code to convert the MxFile contents to NetworkX.
8. Inferring Information
After extracting data from the diagram and converting to a NetworkX graph, the graph can be analyzed to infer information not contained in the diagram data. This section discusses several of these concepts with examples.
8.1. Geometric Inferences
Consider the previous network or behavior diagrams. In each diagram, there are geometric relationships (i.e., one diagram element is inside another). This is shown as network enclaves or subnets in the network diagram or swimlanes in the activity diagram.
If there are no explicit relationships between the diagram elements inside a container and the container itself, it is possible to identify and create those with simple geometric filtering using the following pseudocode:
Figure 15.
Pseudocode for simple geometric filtering.
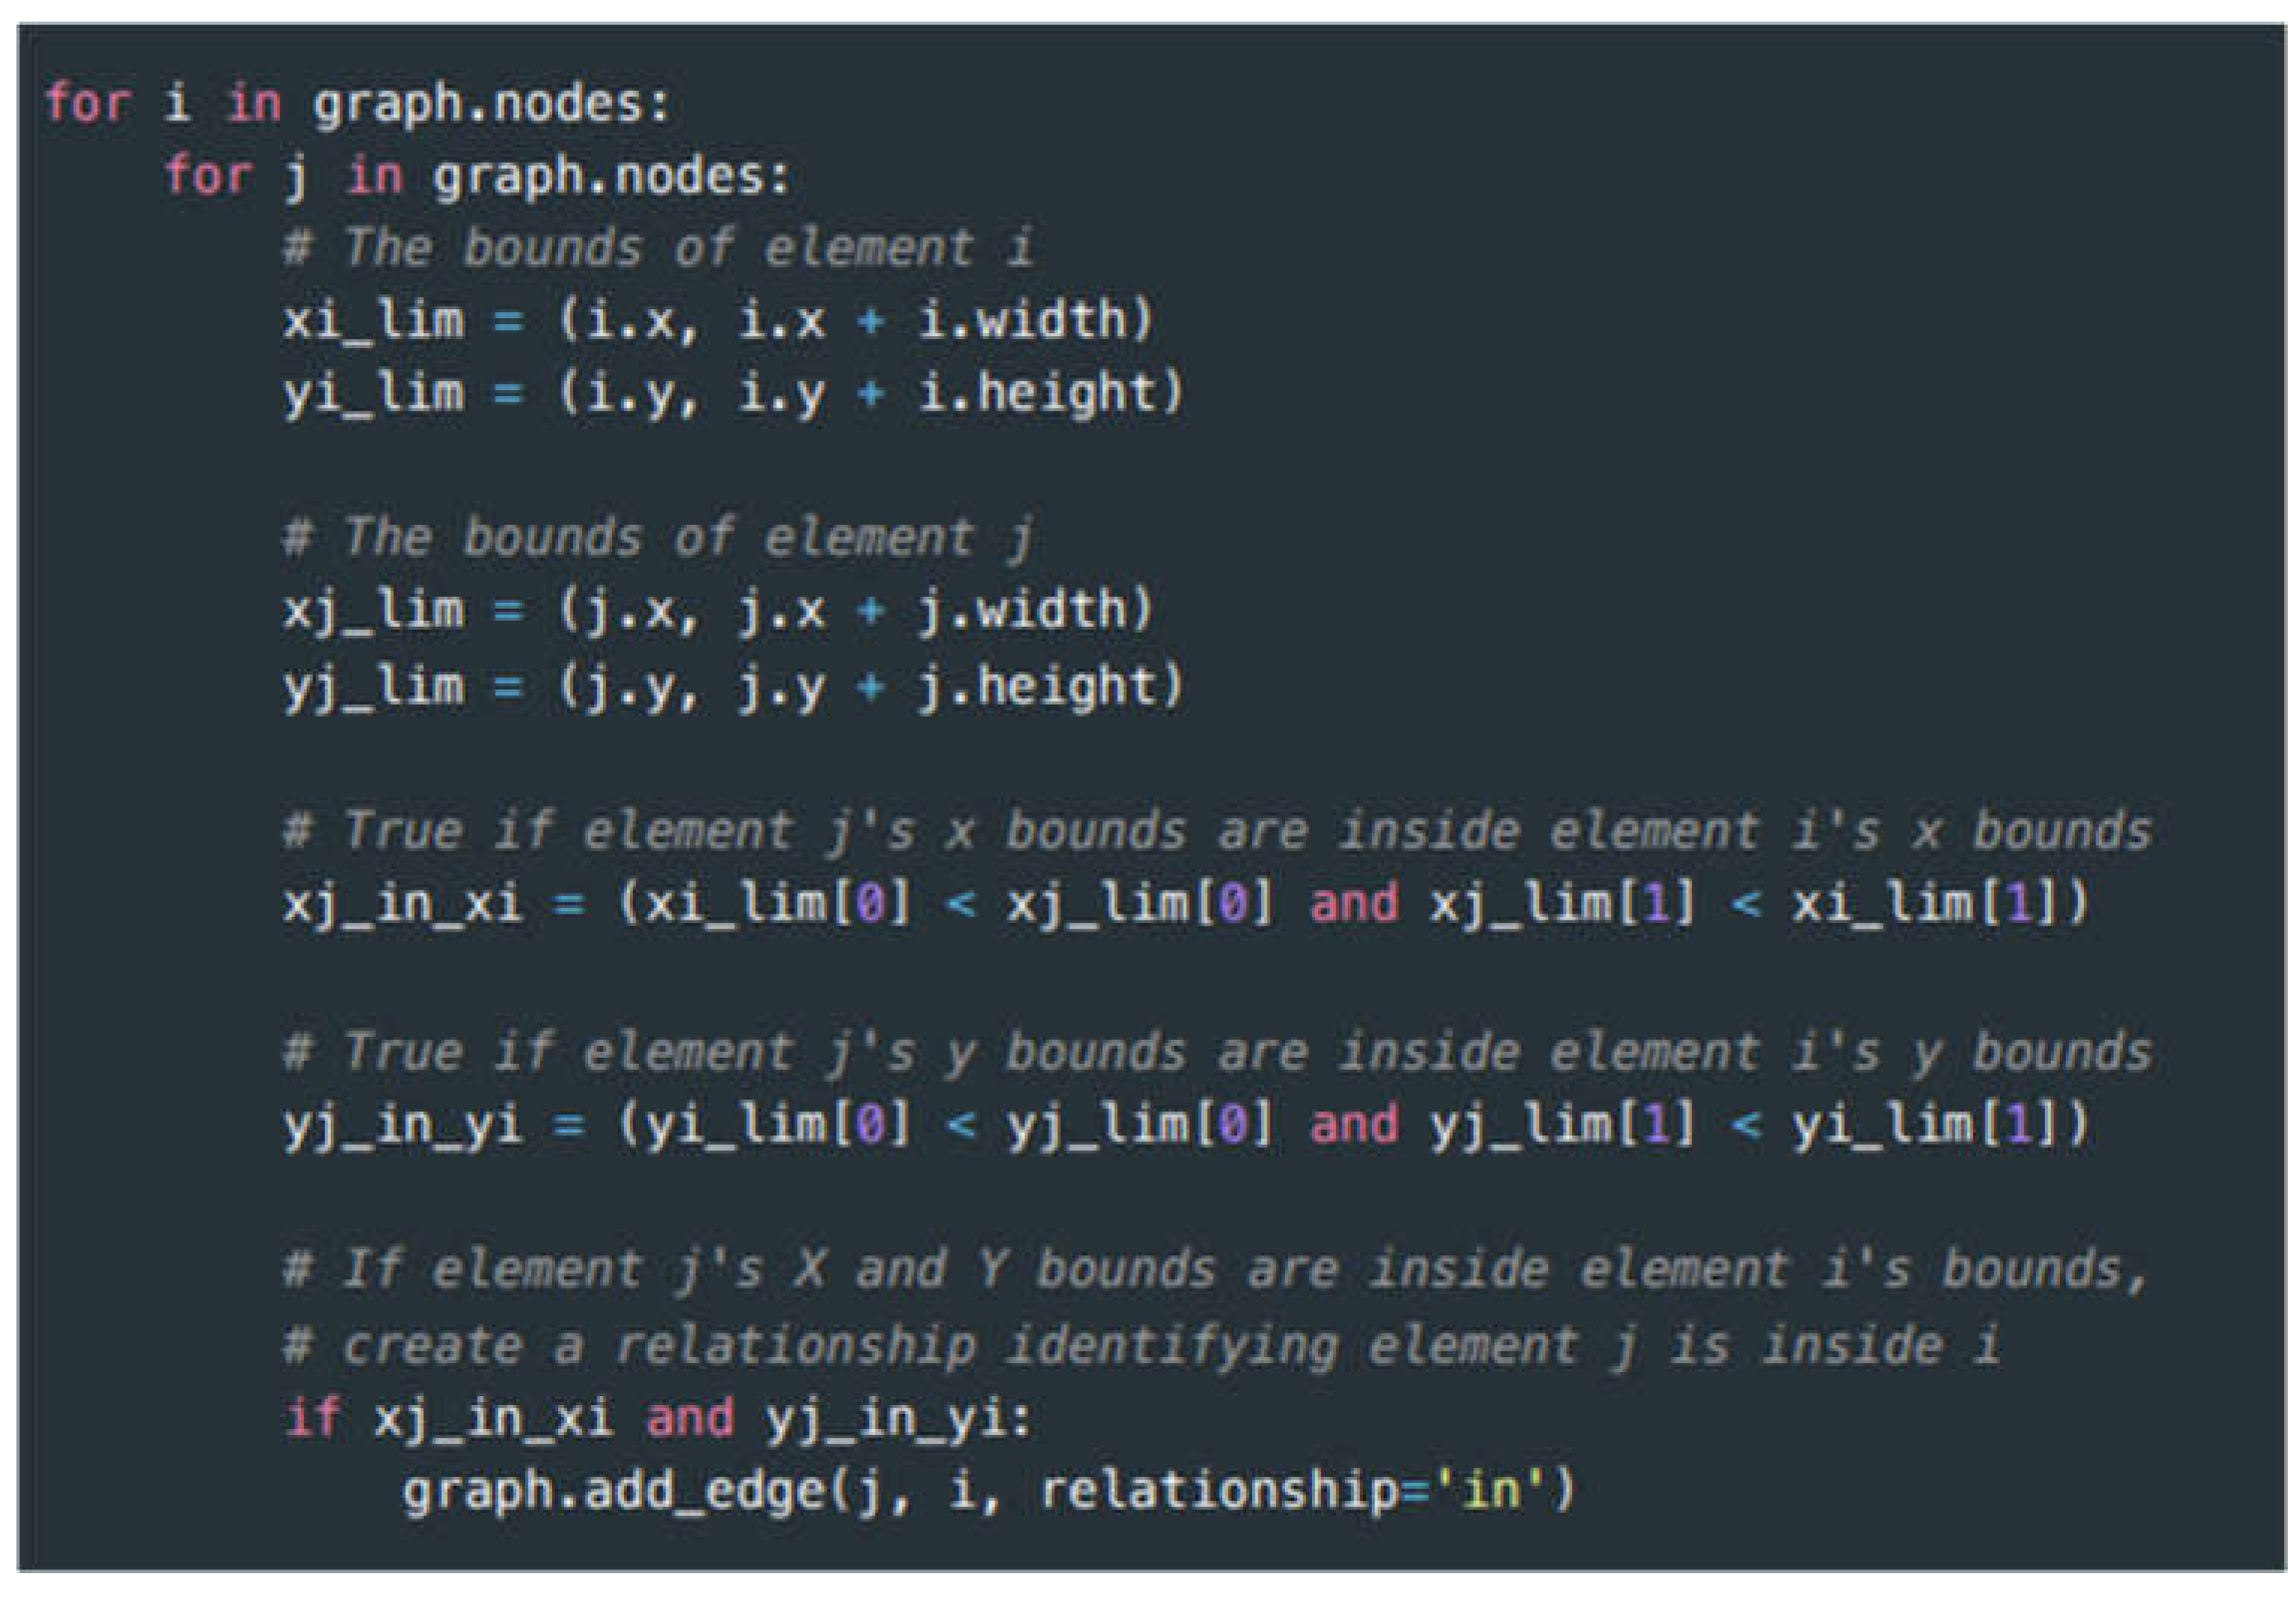
In this example, the graph is analyzed for nodes that are inside other nodes. By comparing each node to each other node, elements whose bounds lie entirely within the bounds of another element are identified. If this condition is true, an in relationship is added between those two elements. While this may be an inefficient approach to this problem at scale, diagrams are designed to be visual and therefore should not reach a scale where this becomes a computationally hard problem.
8.2. Parent-Child Relationships
A similar approach can be applied to identifying parent-child relationships in the diagram. This is applicable when there is a hierarchical link between two elements rather than a relationship link. For example, in MxGraph certain elements can be nested inside other elements differently from the geometric approach above. MxGraph uses a parent attribute on a graph element to indicate this. This often applies to swimlanes or other grouping elements.
To capture these relationships, the following Python code is used:
Figure 16.
Python code to capture parent-child relationships.
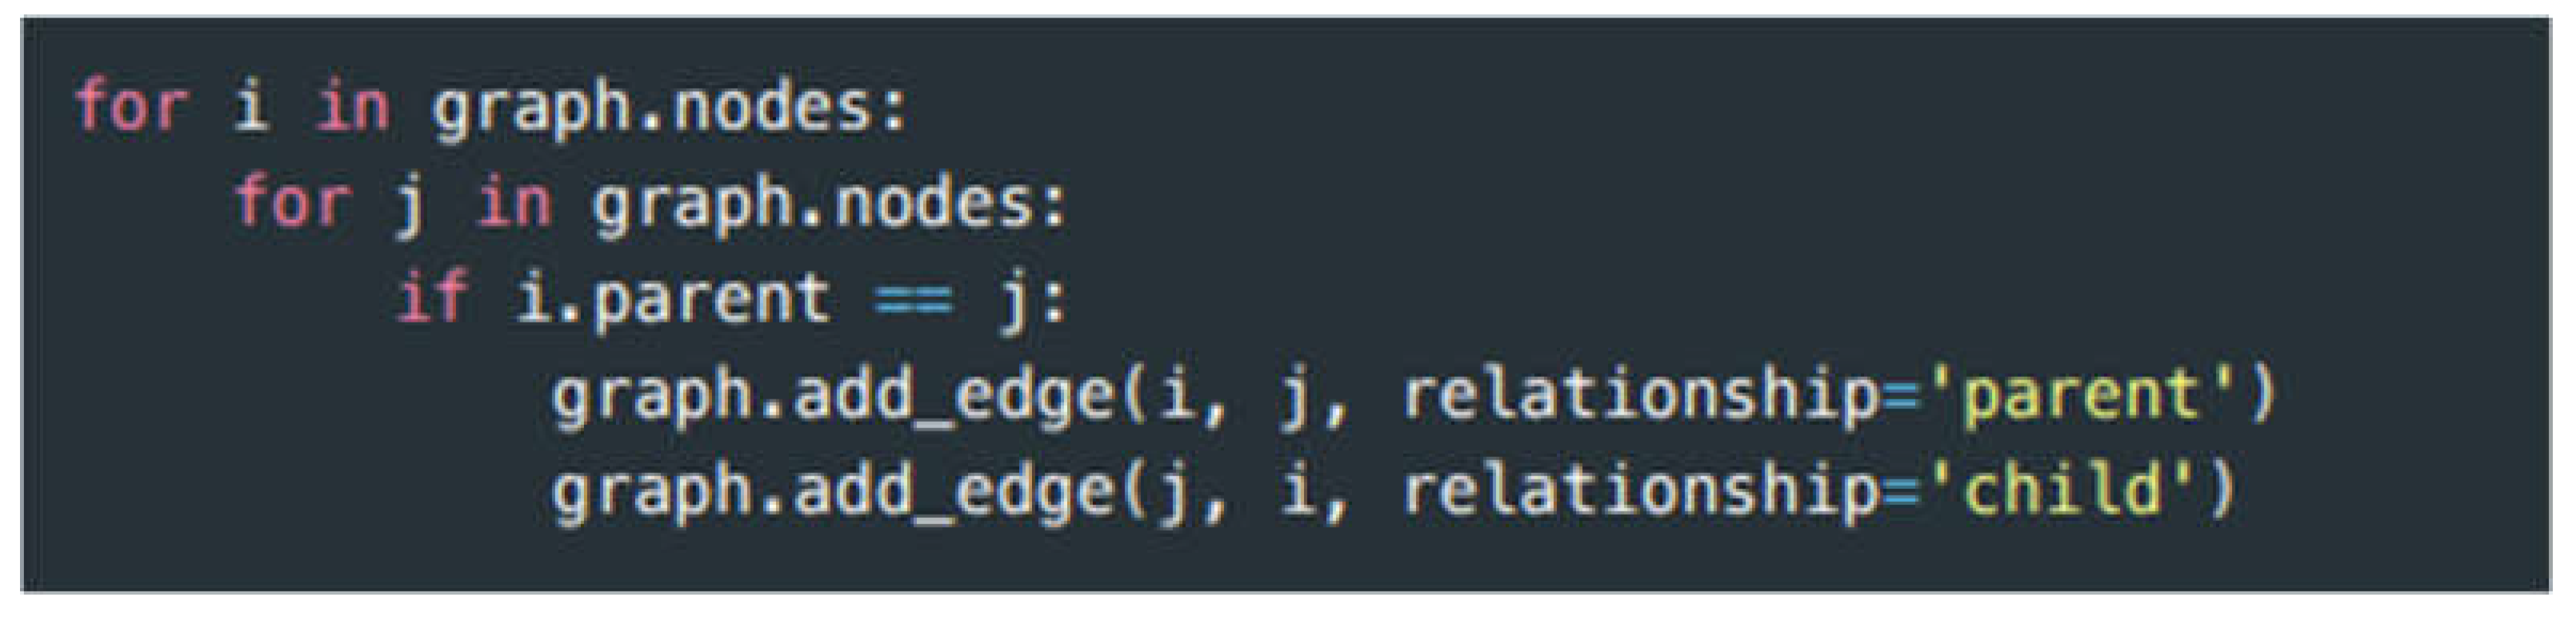
In this case, a complementary bi-directional relationship is created between the two elements.
8.3. Other Inferences
- Traversing intermediate connections. Another example is traversing intermediate connections. This could address the need to understand the relationships in a diagram while traversing the graph (e.g. element A is linked to B is linked to C). It will be shown later in this paper that by leveraging modern graph databases, this sort of pattern can be identified without the need for making the inference manually.
- Grouping by proximity. Grouping related elements together based on proximity, within some specified tolerance, has also been suggested.
- Element type identification. Identifying different types of diagram elements can also be useful. This can be done either by adding data fields to elements or considering element style.
- Edge types / edge labels. The demonstrated approach ignores edge labels in MxGraph due to the added complexity and distraction for the core method being presented. In MxGraph, edge labels are vertices making their role in the graph more complex. In future work, it is recommended that this be reconciled and edge labels.
9. End-to-End Example
In this section, an end-to-end example begins with an architecture diagram and uses the data extraction methods presented to generate models that can be queried. Analysis techniques are demonstrated to answer representative real-world questions and provide insight into a system.
9.1. Creating the Model
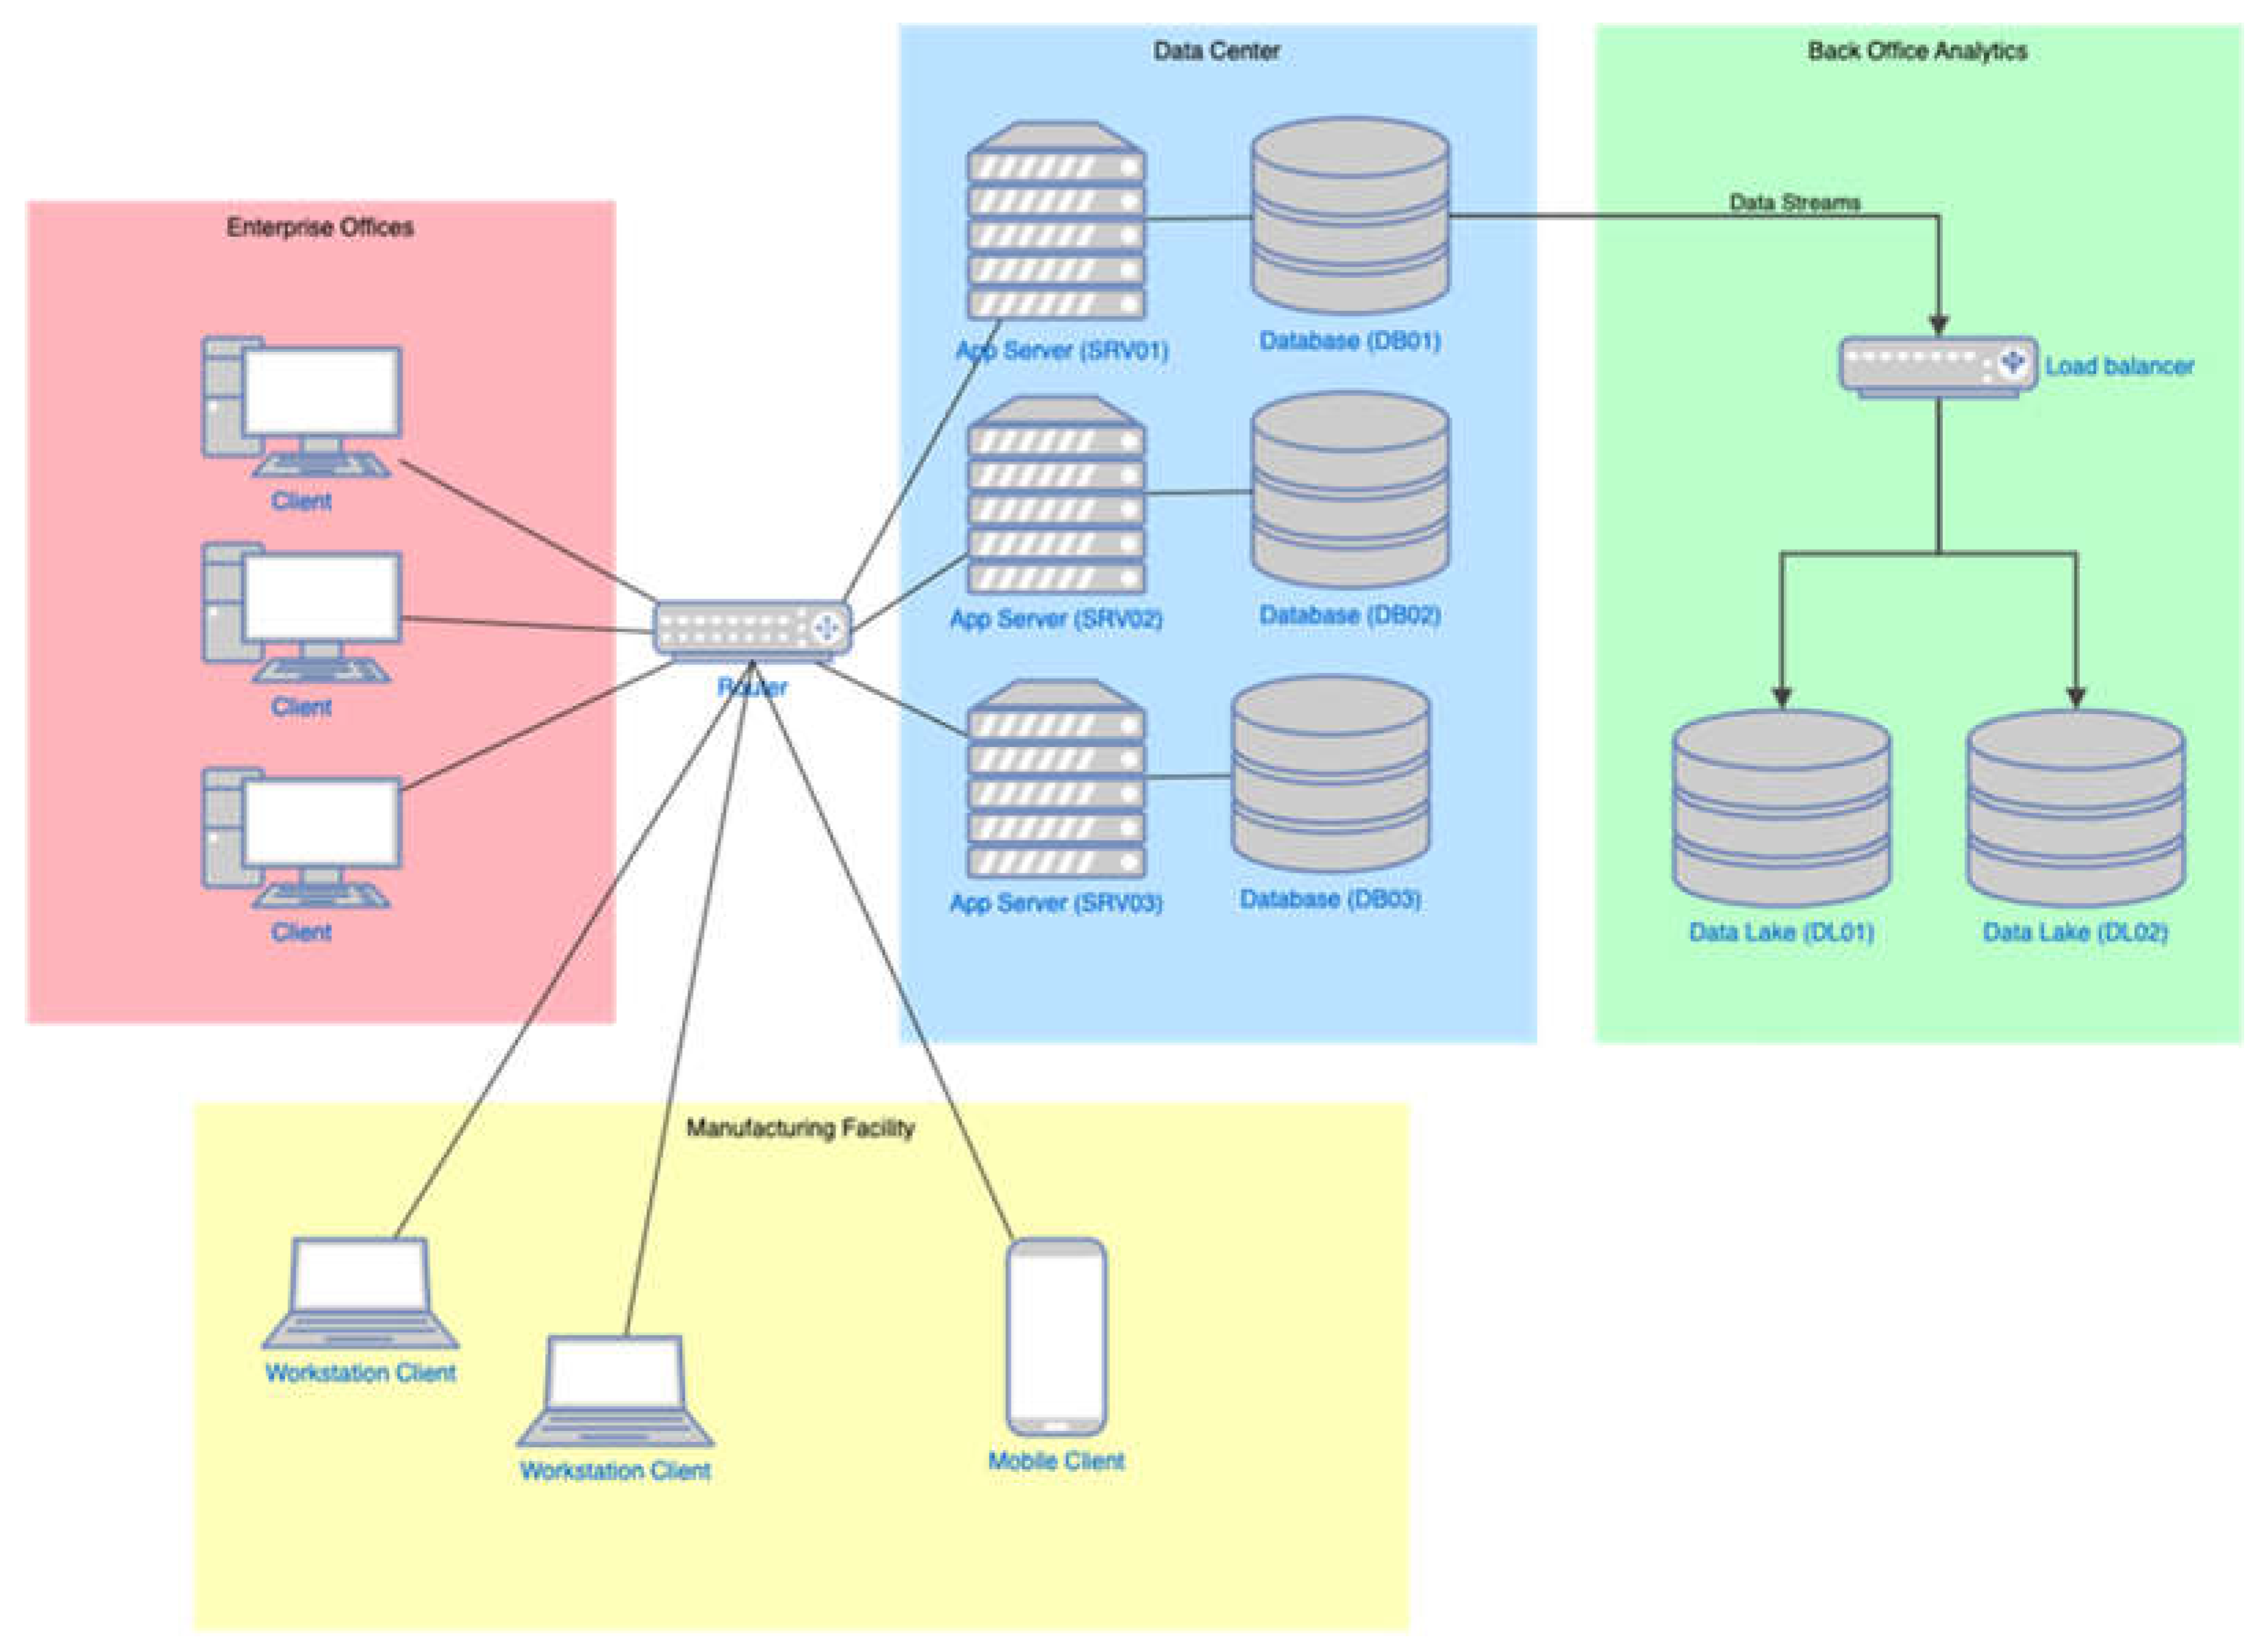
This network diagram (Figure 17) provides a detailed visualization of the infrastructure typically deployed in a small business, segmenting the network into four distinct enclaves: Enterprise Offices, Manufacturing Facility, Data Center, and Cloud-Based Back-Office Analytics. The Enterprise Offices are connected through a router, illustrating the flow of information from multiple client computers within the office environment. This setup is essential for the day-to-day operations of office staff, providing them access to centralized data and applications hosted on-site.
The diagram further shows the Data Center, which houses multiple application servers and databases, labeled as SRV01, SRV02, SRV03, and DB01, DB02, and DB03, respectively, indicating a robust setup for handling various business applications and data storage needs. Back-office analytics is handled in the cloud, featuring a load-balanced environment with data lakes for advanced data processing and analytics. This separation highlights the specialized use of cloud resources for handling large-scale data processing separate from the everyday operational data, optimizing performance and scalability. Additionally, the Manufacturing Facility is depicted with fewer details, showing connections between workstation and mobile clients, emphasizing its operational independence but integration into the broader network architecture.
Figure 17.
Simplified representation of a network that might be used in a small business.
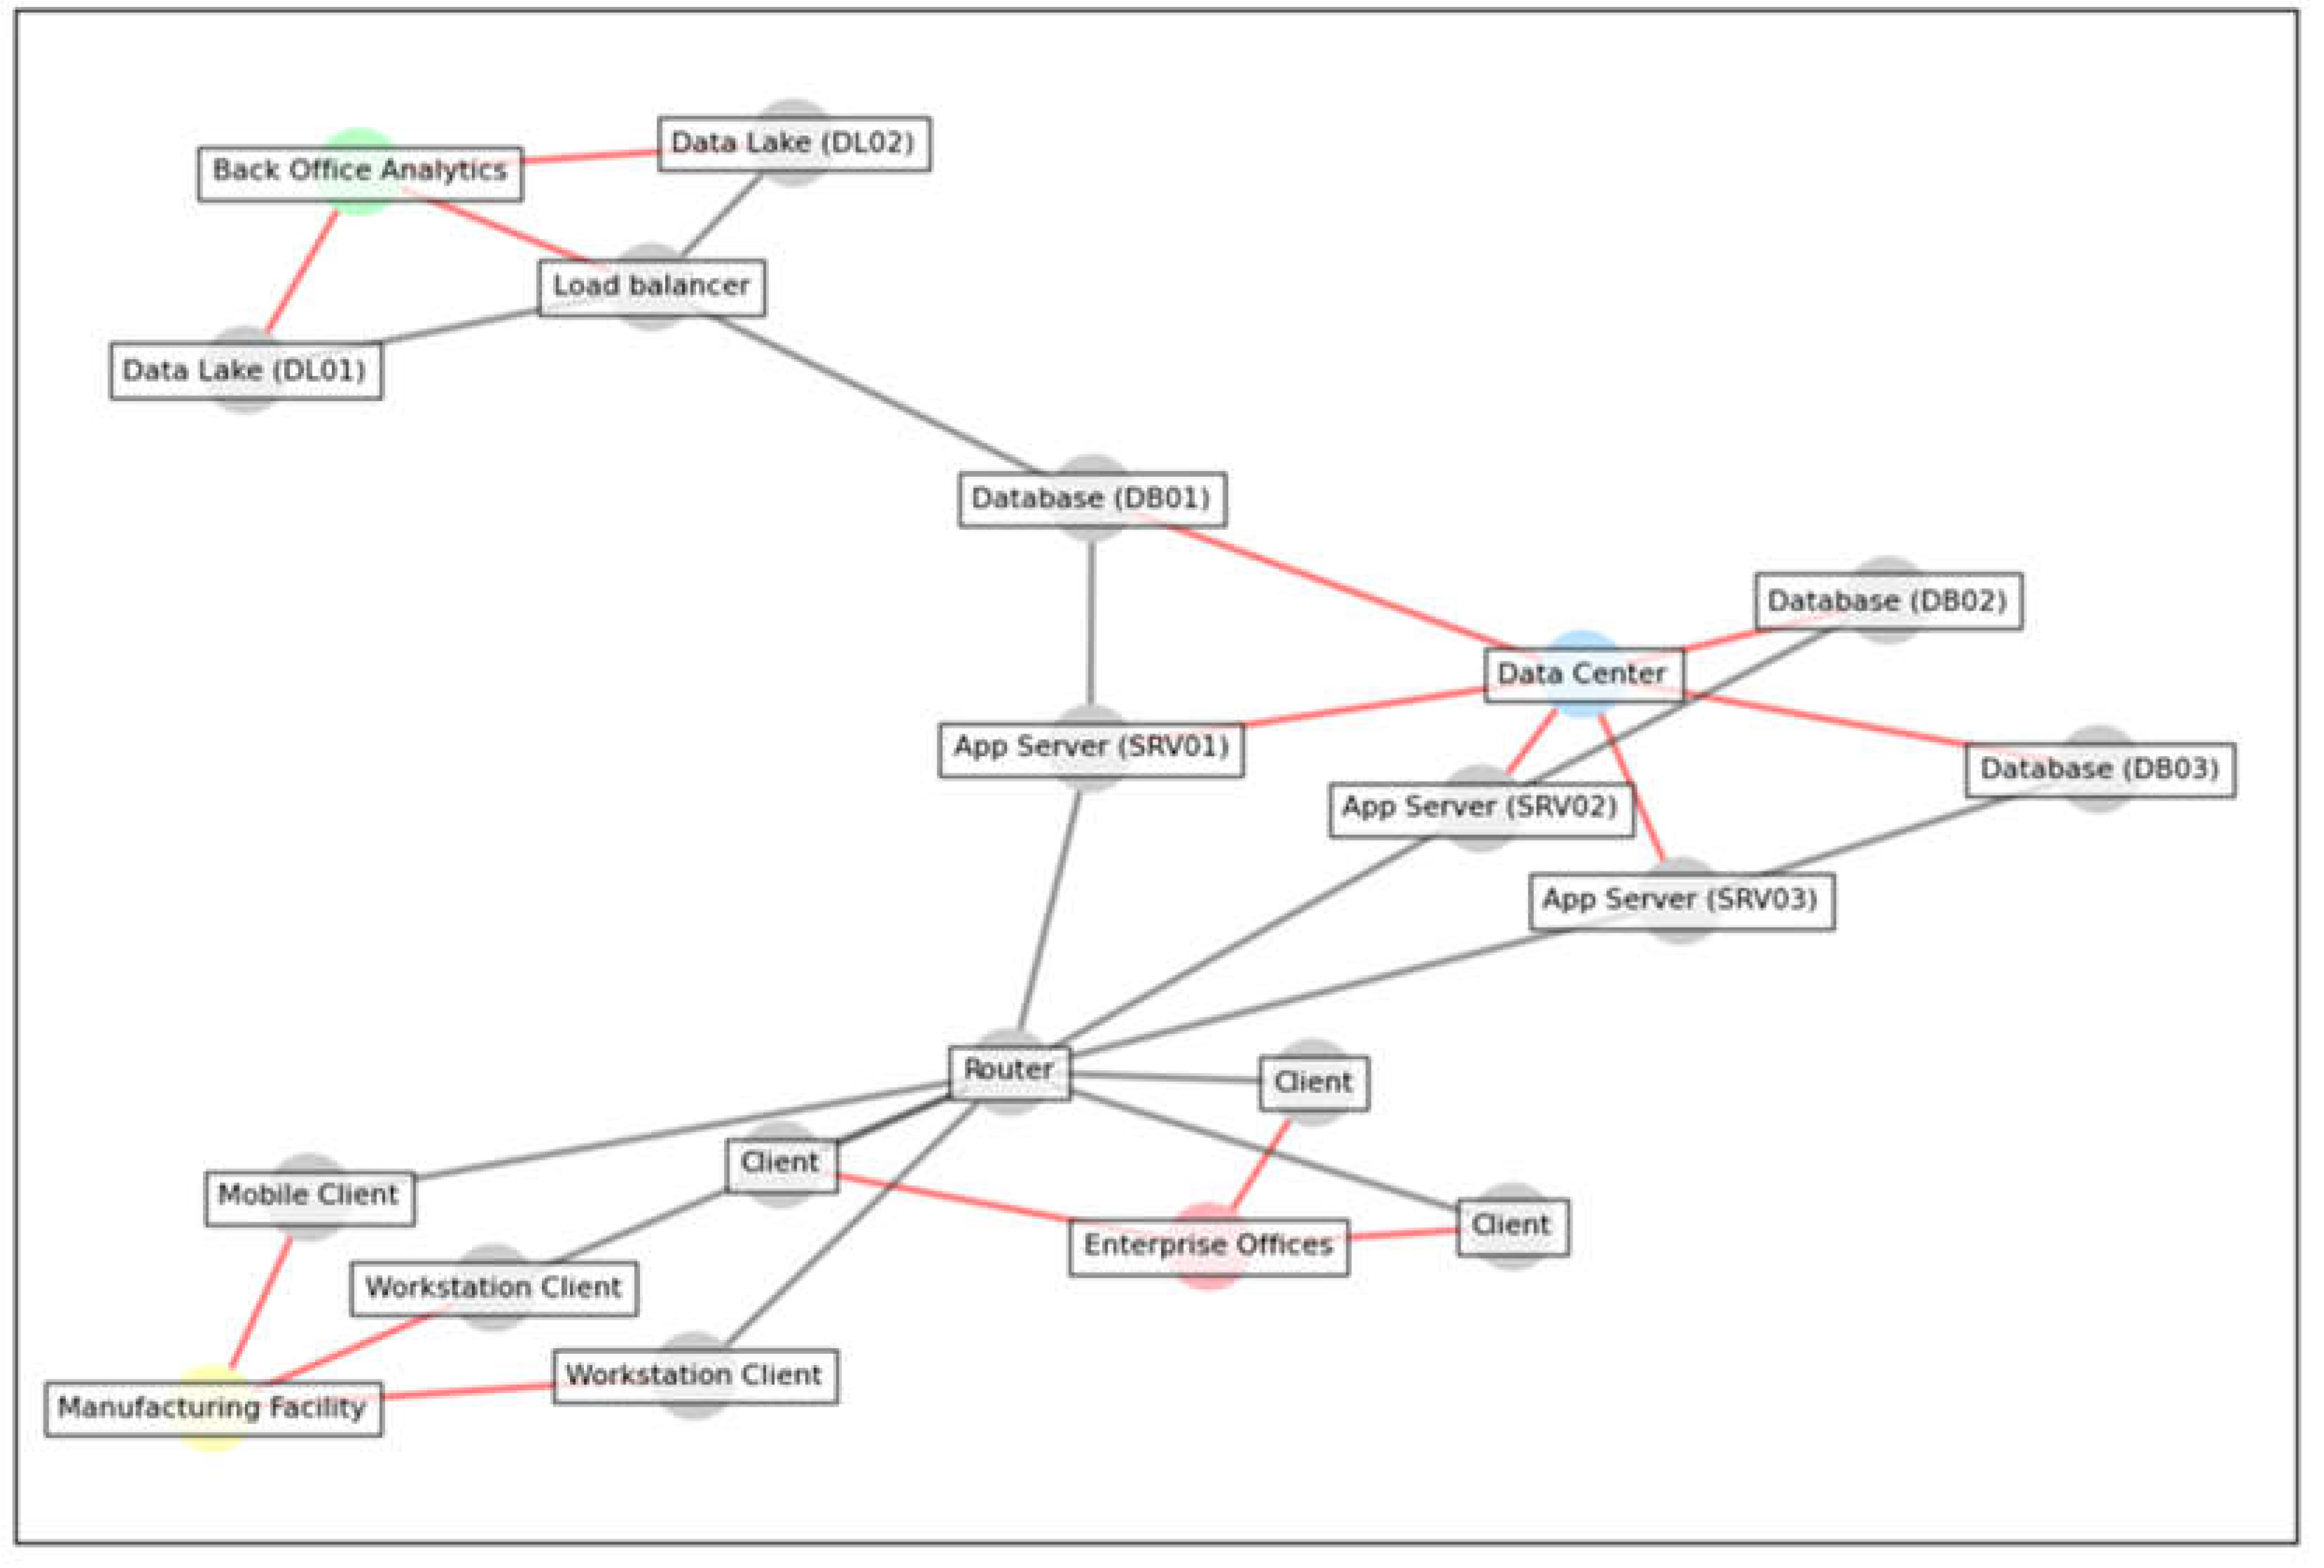
This example will demonstrate how one might analyze a network to understand interactions between systems, analyze impacts, or assess risk. Next, the diagram is converted to a NetworkX graph, and additional information is inferred, as described in the previous sections. The edges colored red are the inferred relationships that capture the geometric containment (“in” relationships”) of diagram elements inside the network enclaves. In the following sections, this information is used to show how to query the model.
Figure 18.
Inferred relationships of diagram elements inside network enclaves.
9.2. Indexing with Graph Databases
Indexing the graph using a Graph database allows for more complex queries to be performed using the Cypher query language. The image below shows a simple representation of the graph in Neo4j.
Graph databases are optimized for indexing and querying graphs [17]. For this paper, Neo4j Community Edition was chosen because it is widely accessible and easy to set up. The Cypher query language was intuitive and well-suited to the types of analyses intended for this example. In this case, a simple match query (e.g., MATCH (n) RETURN n) returns all elements in the graph. The following section explores more complex queries that leverage Cypher’s pattern-matching capability to answer questions about the system.
Figure 19.
Simple representation of the graph in Neo4j.

9.3. Querying with Cypher
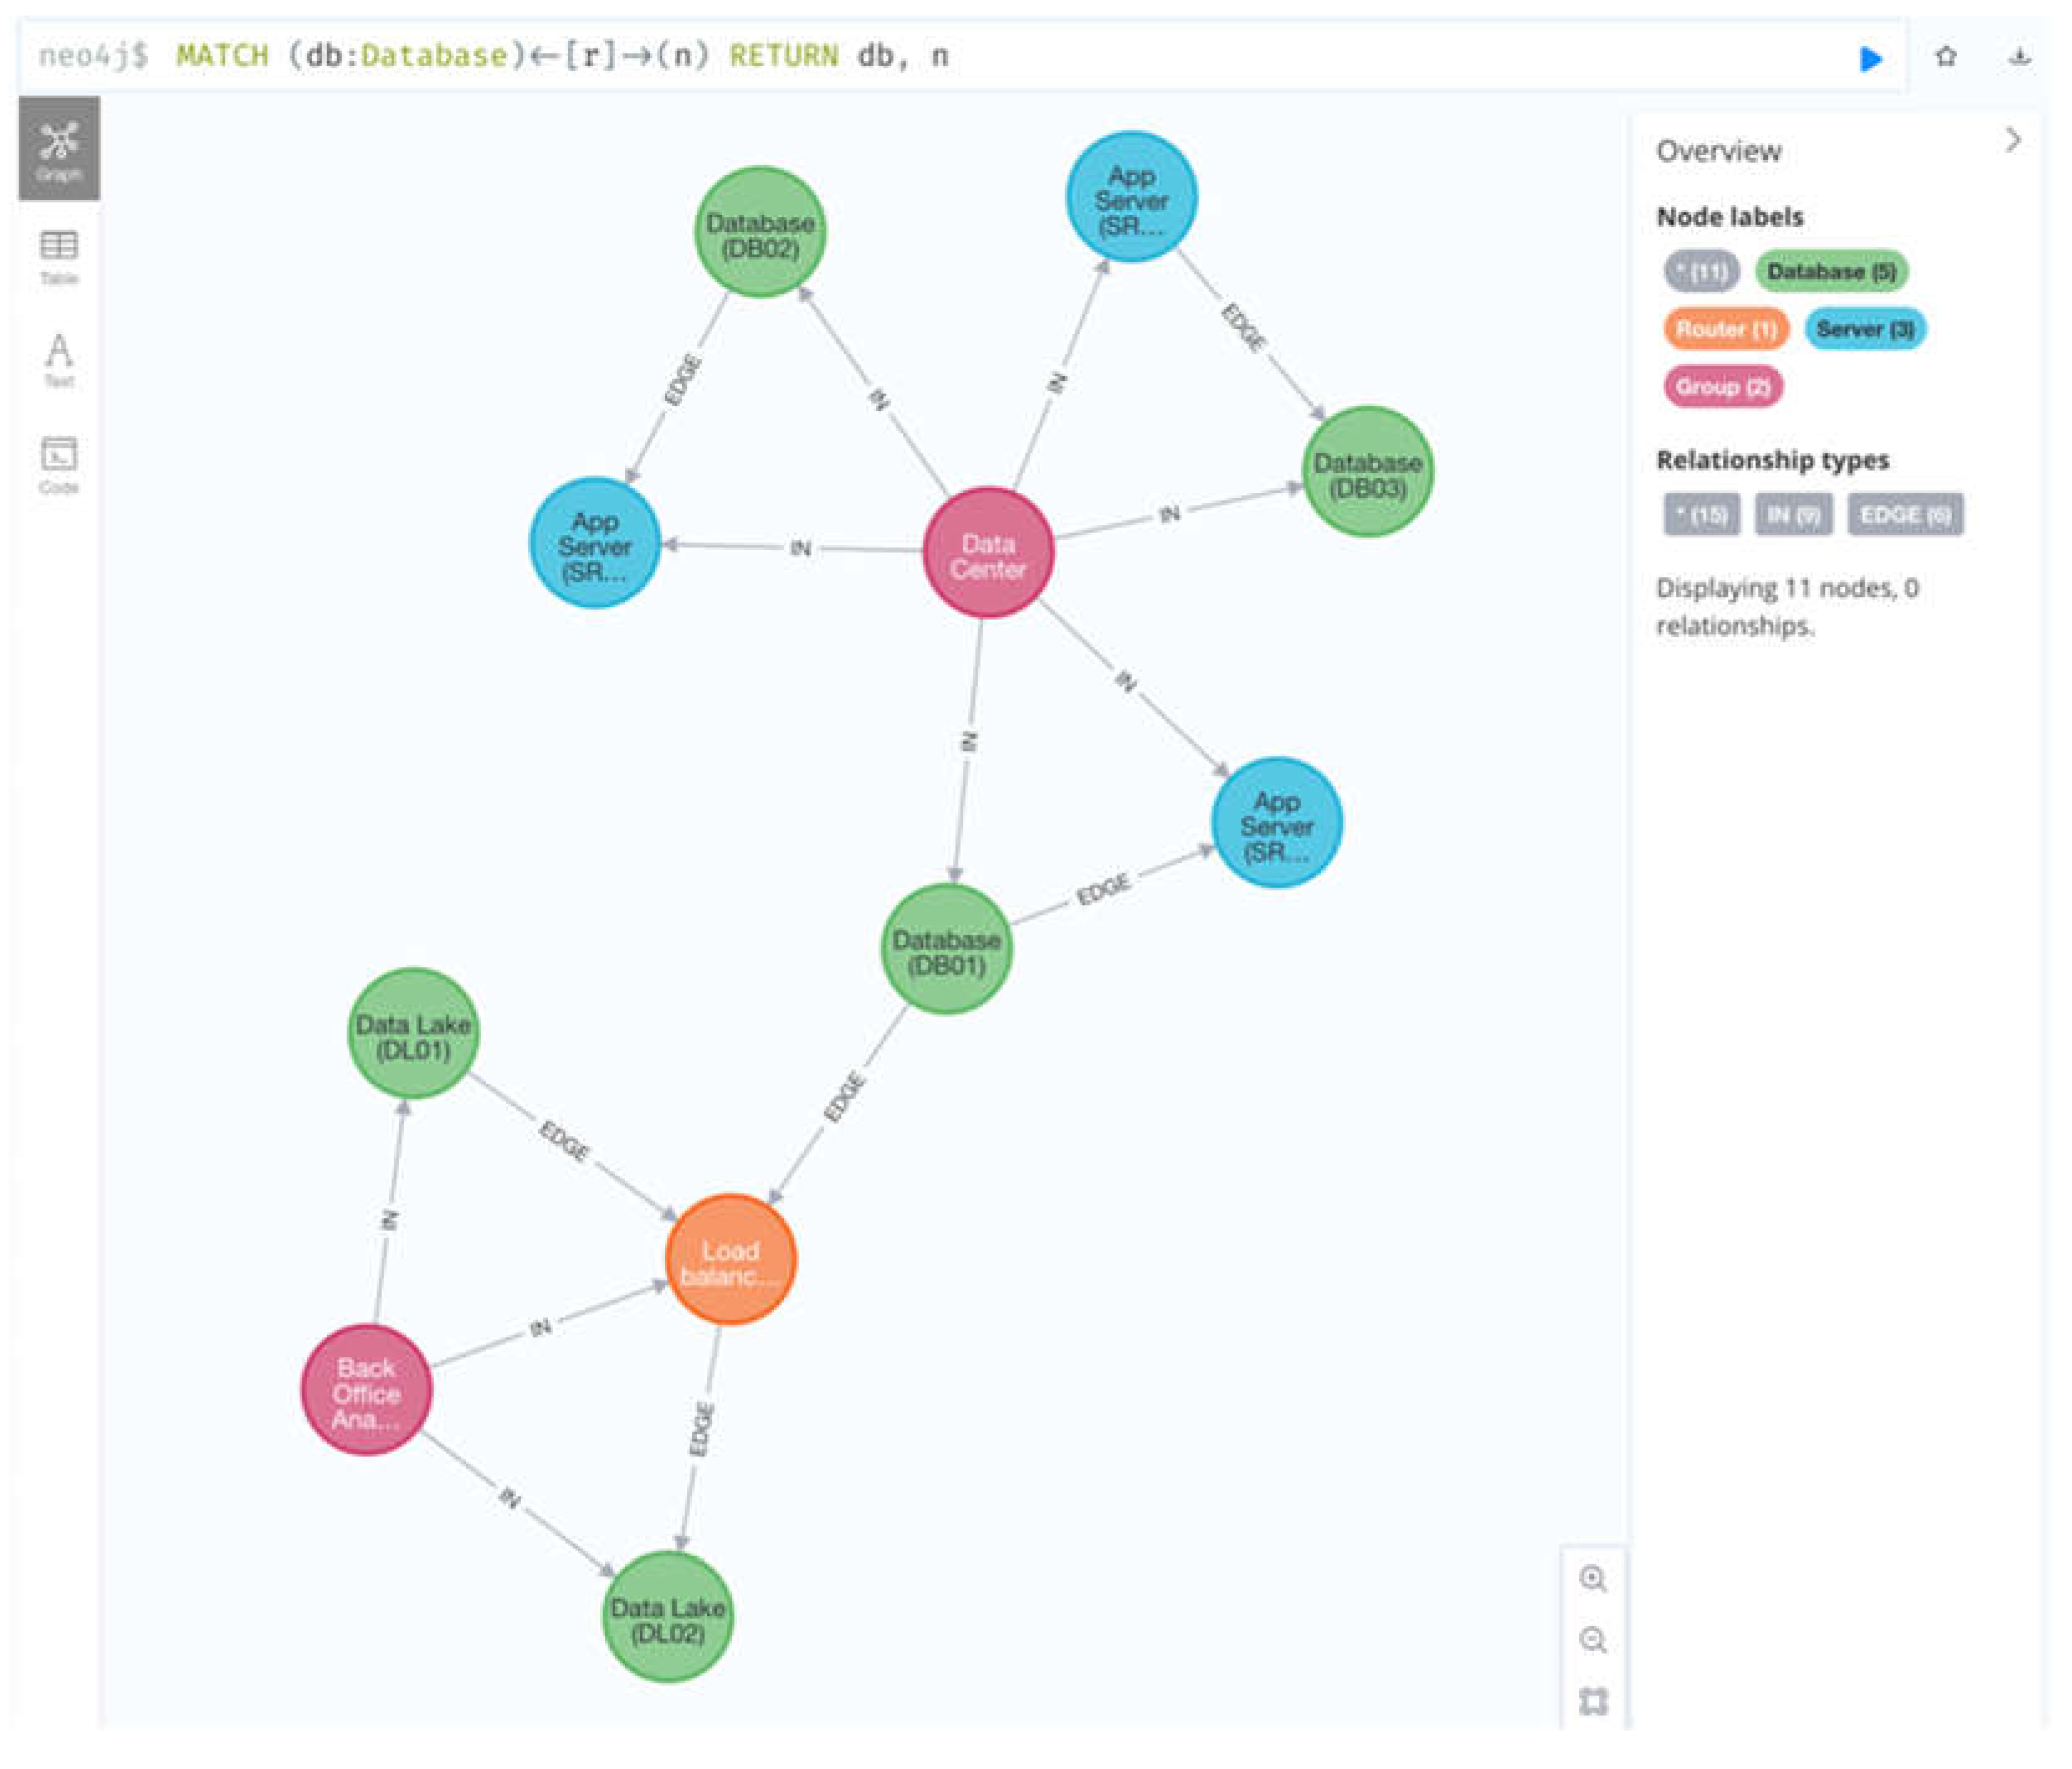
The following query demonstrates how to query the model for all databases and nodes they are connected to.
MATCH (db:Database)<-[r]->(n) RETURN db, n
This query returns all nodes of type Database (e.g., (db:Database)) and all nodes they connect to (e.g. (n)) with no regard for the relationship direction (e.g. <-[r]->). This yields the following results.
Figure 20.
Get all databases in the system.
Consider a more practical scenario where an enterprise has identified a critical or sensitive asset. The graph model can be used to identify high-risk components in the architecture (e.g nodes that connect to that asset directly or indirectly). The Cypher query below demonstrates how to do this.
Figure 21.
Python Code for the Cypher query.
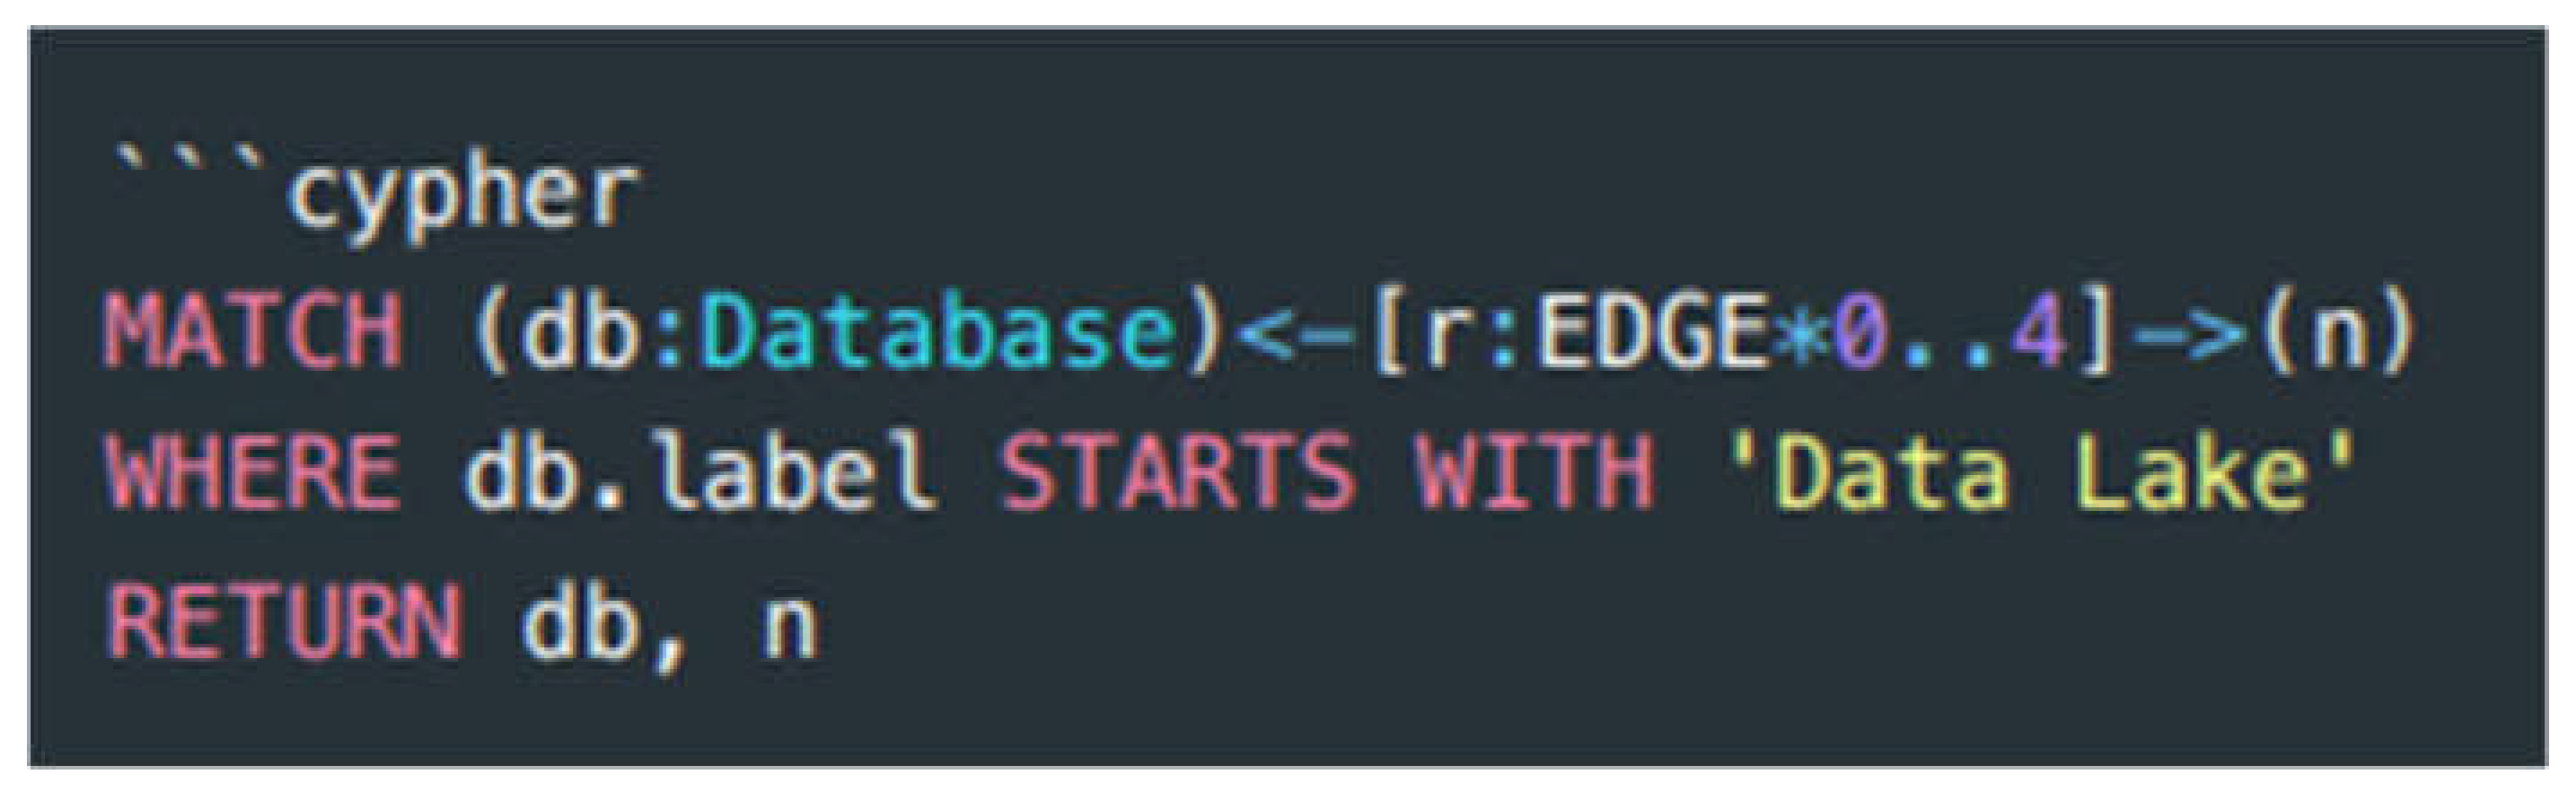
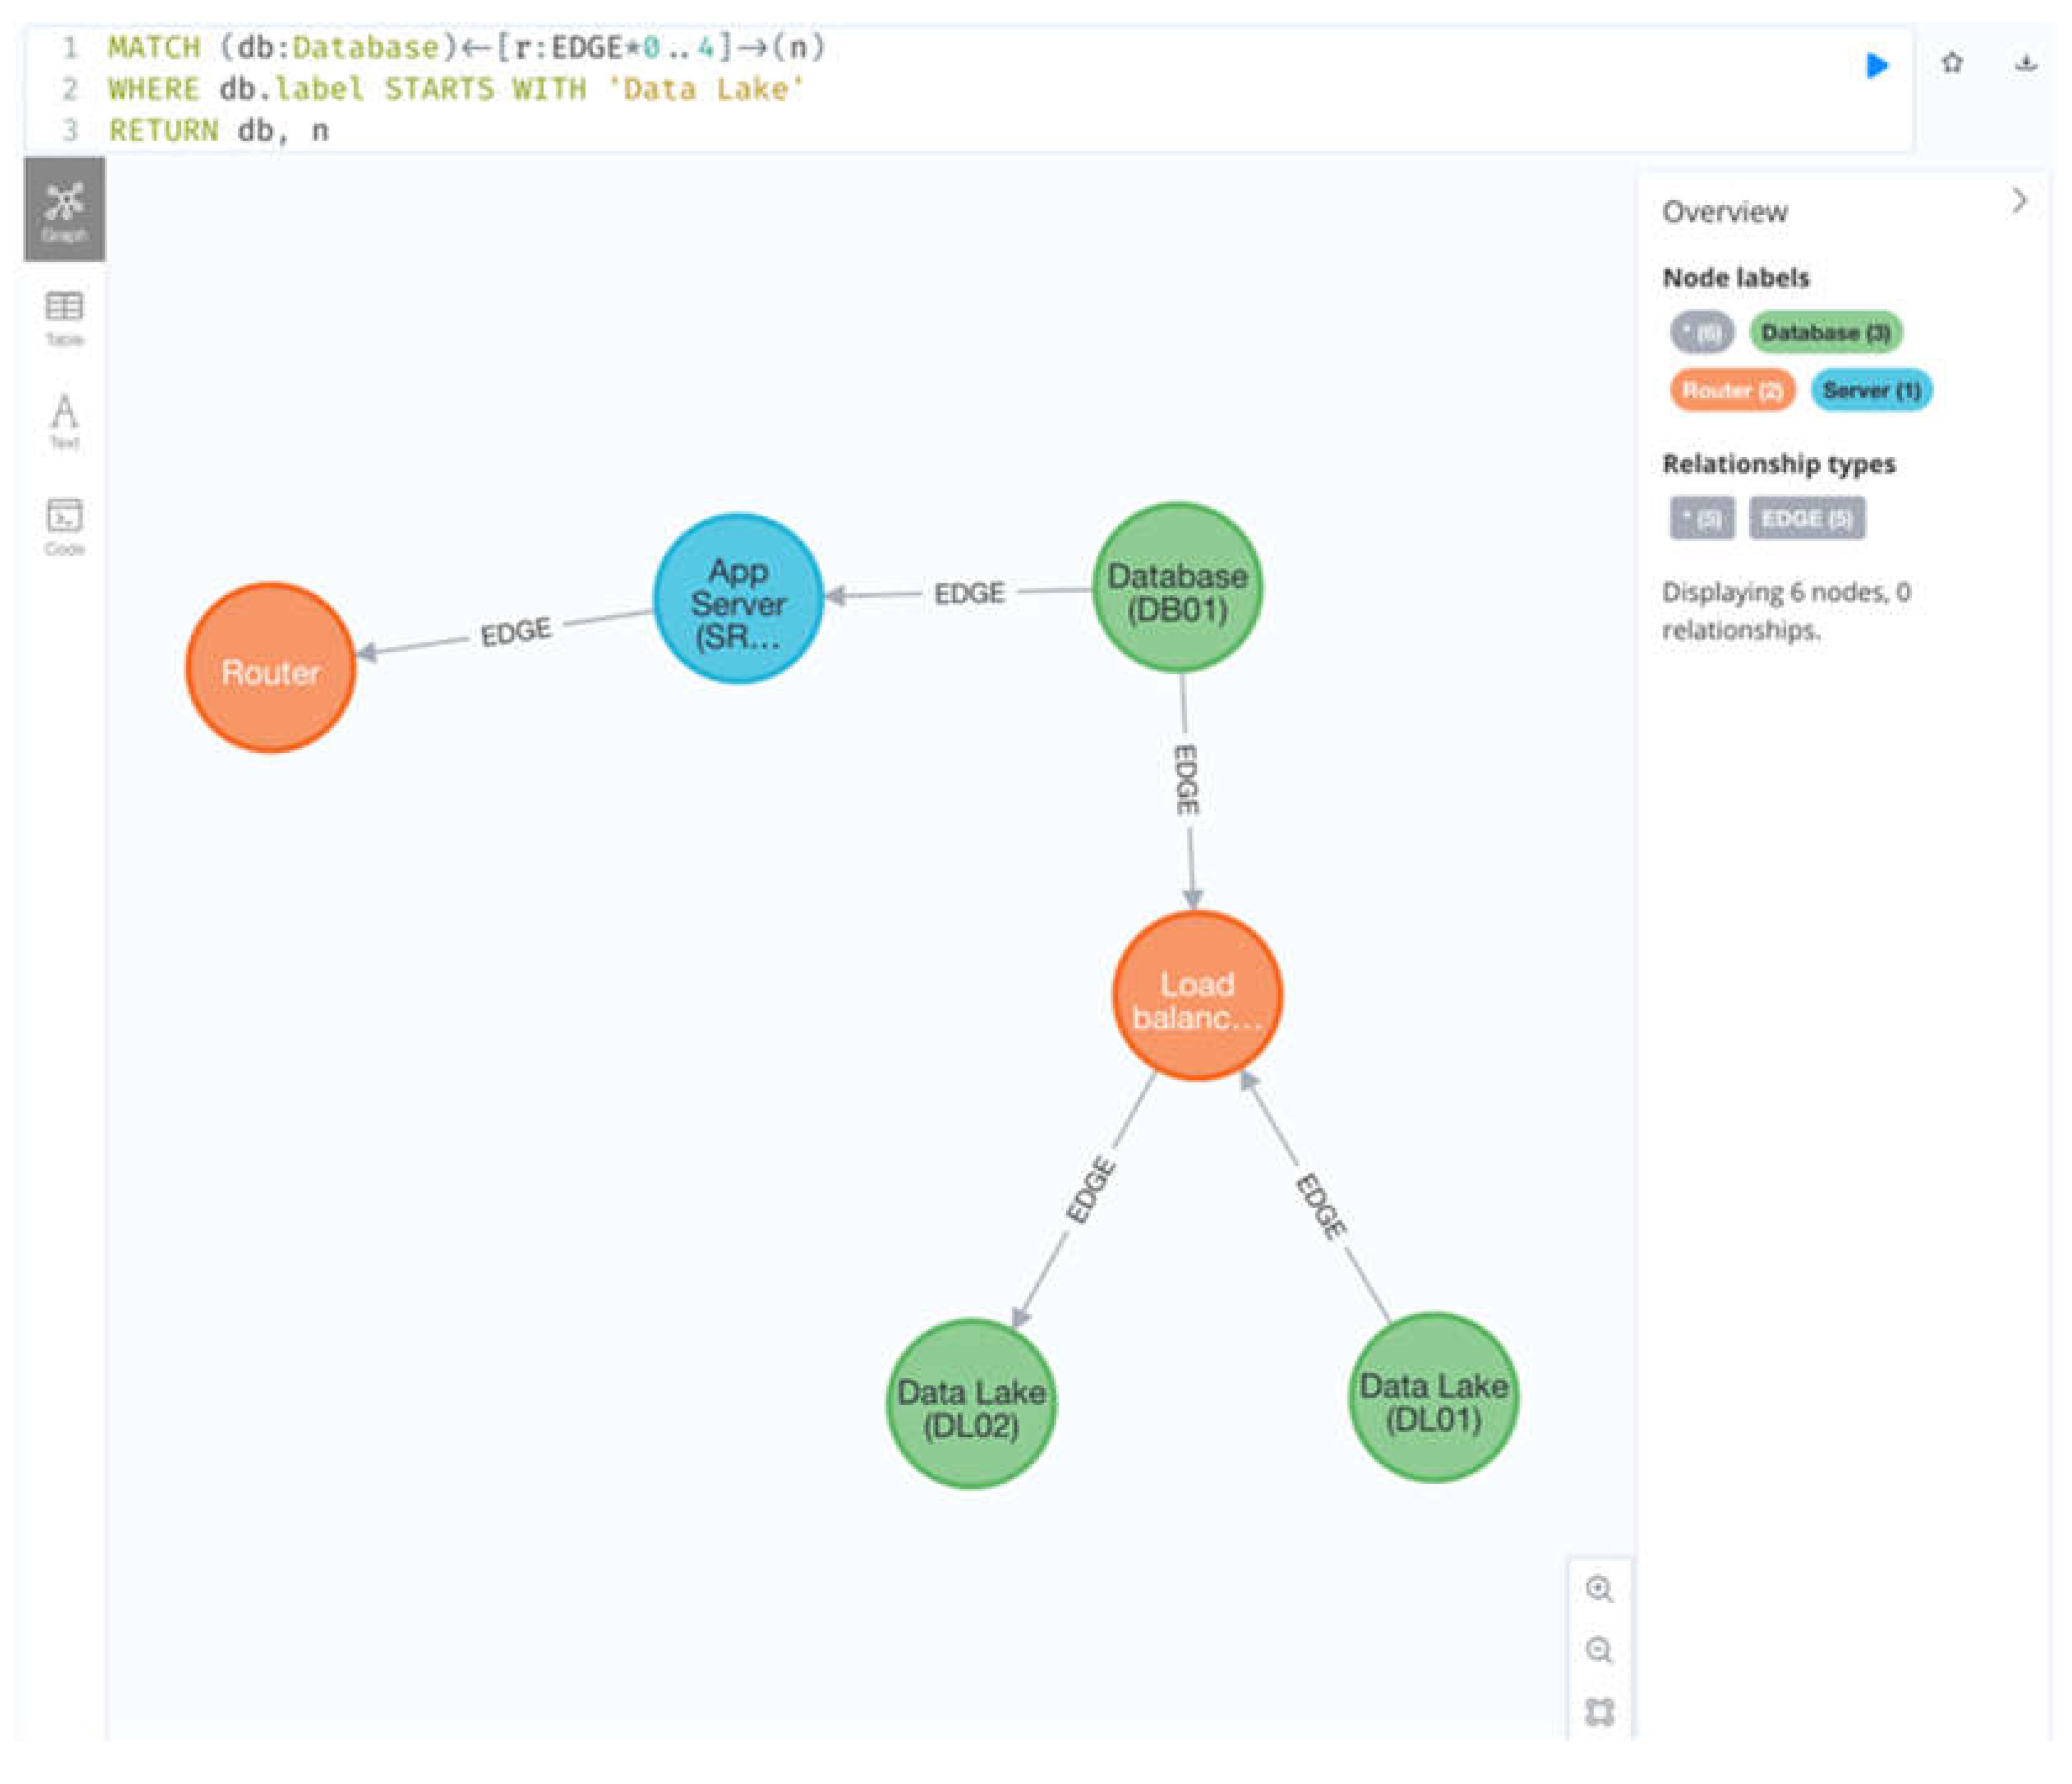
In this case, a similar MATCH pattern is used, with one notable exception: the relationship is specified as a variable-length path (e.g. r:EDGE*0..4) and only includes the EDGE type (ignoring the inferred IN relationships shown in previous sections). The query then applies a WHERE condition to limit the database match to only the high-value asset.
Figure 22.
Get all items up to four steps from the data lake.
10. Results
A general method for creating models from informal architecture diagrams generated with Draw.io was presented. The method was effective for creating models that can be queried to analyze a system's characteristics.
This method contributes to systems and software architecture knowledge by providing a methodology for addressing the gap between formal and informal architectural artifacts [18]. While clear gaps remain in the need to keep implemented systems aligned with their architecture [5], this method makes creating formal architecture artifacts easier and more accessible to implementation teams based on their current workflows that leverage informal documents rather than formal architectures [19].
It is important to note that trends in modeling are moving towards more text-based code-like formats, as demonstrated with the initial release of SysML 2.0 [20]. This is designed to make MBSE (Model-Based Systems Engineering) models more semantic and executable and allow them to follow processes reminiscent of software engineering.
11. Next Steps: Incorporating Artificial Intelligence to Enhance the Methodology
Integrating advanced computational techniques, particularly artificial intelligence (AI), can markedly influence the evolution of software engineering methodologies. The methodology described here to transform informal software architecture diagrams into formal models can also utilize the latest AI technologies to bridge significant gaps in traditional methods.
11.1. Methodology Evolution and Optimization
Our methodology can leverage AI to evolve and optimize the transformation process of architectural artifacts. This approach significantly enhances the efficiency and effectiveness of converting informal diagrams into structured, formal models by employing large language models [21] and advanced pattern recognition systems, such as those utilizing transfer learning [22] from networks like ResNet-50 [23]. This automation will speed up the process and reduce human error and the subjectivity of manual interpretation. The methodology proposed in this paper can be used to build a massive learning book that includes structured and unstructured data.
11.2. Machine Learning Integration
The integration of machine learning algorithms facilitates the automatic recognition and classification of elements within informal diagrams, which can be particularly nebulous and unstructured. For example, machine learning models can be trained to identify and categorize diagrammatic components into predefined classes, streamlining the data extraction and transformation process. This application of AI supports a more thorough and nuanced analysis of architectural diagrams, enhancing the precision and reliability of the resulting formal models.
11.3. Innovative Aspects and Improvements
This future incorporation of AI will introduce several innovative aspects:
- Automation of Model Transformation: AI largely automates transforming diagrams, reducing the time and resource investment required and allowing engineers to focus on more strategic tasks.
- Enhanced Analysis Capability: AI enhances the capability to analyze complex diagrams by interpreting intricate patterns and relationships that may not be immediately apparent to human analysts.
- Scalability and Adaptability: AI algorithms can quickly adapt to new types of diagrams and scale to handle large datasets, which is crucial for enterprises with extensive systems architectures.
11.4. Practical Applications and Future Work
This AI-enhanced methodology can be applied across various domains, including—but not limited to—automotive, aerospace, and IT infrastructure, where complex systems modeling is crucial. Future work will focus on introducing these AI models to handle an even broader array of diagram types and exploring their integration with other tools and platforms used within the industry.
12. Conclusions
This paper presented a method for creating models from informal architectural artifacts. While this paper has demonstrated that the problem is feasible, much work remains. First, we need to explore the feasibility of this approach with other tools. While Draw.io is a popular tool, it is not the only tool used to create informal diagrams. Second, intelligent inferences about the diagram should be further explored. Further intelligence can make this a far more practical technique for analysis. One such approach beyond the inferences presented in this paper is to consider applying this technique at scale with many diagrams describing a system and exploring the ability to link common elements across diagrams. Finally, we don’t see a path toward industry adoption without easy-to-use, robust software tooling. We view that as a critical step towards adopting this technique in practice rather than a research novelty. Artificial intelligence, particularly pattern recognition and large language models, has tremendous potential to support and enhance the methodology.
Author Contributions
Mr. Joshua Kaplan contributed to the conceptualization and methodology. Dr. Luis Rabelo reviewed, enhanced, edited, and added the future of Artificial Intelligence.
Institutional Review Board Statement
Not Applicable.
Data Availability Statement
The complete source code for this paper is publicly available at https://github.com/josh-kaplan/extracting-data-from-diagrams. Additional follow-on content will be published at https://jdkaplan. com/papers/informal-architecture.
Conflicts of Interest
The authors declare no conflicts of interest.
References
- Basili, V.; Briand, L.; Bianculli, D.; Nejati, S.; Pastore, F.; Sabetzadeh, M. Software Engineering Research and Industry: A Symbiotic Relationship to Foster Impact. IEEE Software 2018, 35, 44-49. [CrossRef]
- M. Richards and N. Ford. Fundamentals of Software Architecture. O'Reilly Media, Inc. https://learning.oreilly.com/library/view/fundamentals-ofsoftware/9781492043447/.
- E. Carroll and R. Malins. Systematic Literature Review: How is Model-Based Systems Engineering Justifed?. Sandia National Laboratories. 2016. [CrossRef]
- M. Ozkaya. Do the informal & formal software modeling notations satisfy practitioners for software architecture modeling? Information and Software Technology 2018, 95, 15-33. [CrossRef]
- J. Keim, Y. Schneider, and A. Koziolek. Towards consistency analysis between formal and informal software architecture artefacts. In Proceedings of the 2019 IEEE/ACM 2nd International Workshop on Establishing the Community-Wide Infrastructure for Architecture-Based Software Engineering (ECASE), 27-27 May 2019, 2019; pp. 6-12.doi: https://ieeexplore.ieee.org/document/8815606.
- Ali, N.; Baker, S.; O’Crowley, R.; Herold, S.; Buckley, J. Architecture consistency: State of the practice, challenges and requirements. Empirical Software Engineering 2018, 23, 224-258. [CrossRef]
- M. Fowler. Software Architecture Guide. https://martinfowler.com/architecture/.
- Object Management Group. OMG® Uni ed Modeling Language® (OMG UML®), Versionb2.5.1. 2023. https://www.omg.org/spec/UML/2.5.1/PDF.
- Object Management Group. OMG Systems Modeling Language™ (SysML®), Version 2.0 Beta, Part 1 Language Specification. 2023. https://www.omg.org/spec/SysML/2.0/Beta1/Language/PDF.
- JGraph Ltd.. draw.io. July 2023. https://www.drawio.com/.
- JGraph Ltd.. Github - jgraph/drawio-desktop (Source Code). July 2023. https://github.com/jgraph/drawio-desktop.
- Henning Dieterichs. Github - hediet/vscode-drawio (Source Code). July 2023. https://github.com/hediet/vscode-drawio.
- Henning Dieterichs. Draw.io Integration - Visual Studio Marketplace. July 2023.https://marketplace.visualstudio.com/items?itemName=hediet.vscode-drawio.
- JGraph Ltd. MxGraph. https://jgraph.github.io/mxgraph/.
- J. Kaplan. Agile Architecture in Practice. 2023. https://jdkaplan.com/articles/agile-architecture-in-practice.
- GCHQ. CyberChef. https://gchq.github.io/CyberChef/.
- Robinson, J. Webber, and E. Eifrim. Graph Databases, 2nd Edition. O'Reilly Media, Inc.. 2015. https://learning.oreilly.com/library/view/graph-databases-2nd/9781491930885/.
- Kassab, M.; Mazzara, M.; Lee, J.; Succi, G. Software architectural patterns in practice: an empirical study. Innovations in Systems and Software Engineering 2018, 14, 263-271. [CrossRef]
- Schilling, R.D.; Aier, S.; Winter, R. Designing an Artifact for Informal Control in Enterprise Architecture Management. In Proceedings of the ICIS, 2019, Munich, Germany, Dec 15-18, 2019.
- Object Management Group. OMG Systems Modeling Language™ (SysML®), Version 2.0 Beta. 2023. https://www.omg.org/spec/SysML/2.0/Beta1.
- Zhang, T.; Ladhak, F.; Durmus, E.; Liang, P.; McKeown, K.; Hashimoto, T.B. Benchmarking Large Language Models for News Summarization. Transactions of the Association for Computational Linguistics 2024, 12, 39-57. [CrossRef]
- Hosna, A.; Merry, E.; Gyalmo, J.; Alom, Z.; Aung, Z.; Azim, M.A. Transfer learning: a friendly introduction. Journal of Big Data 2022, 9, 102. [CrossRef]
- Zhang, L.; Bian, Y.; Jiang, P.; Zhang, F. A Transfer Residual Neural Network Based on ResNet-50 for Detection of Steel Surface Defects. Applied Sciences 2023, 13, 5260.
Figure 1.
A semi-formal UML activity diagram.
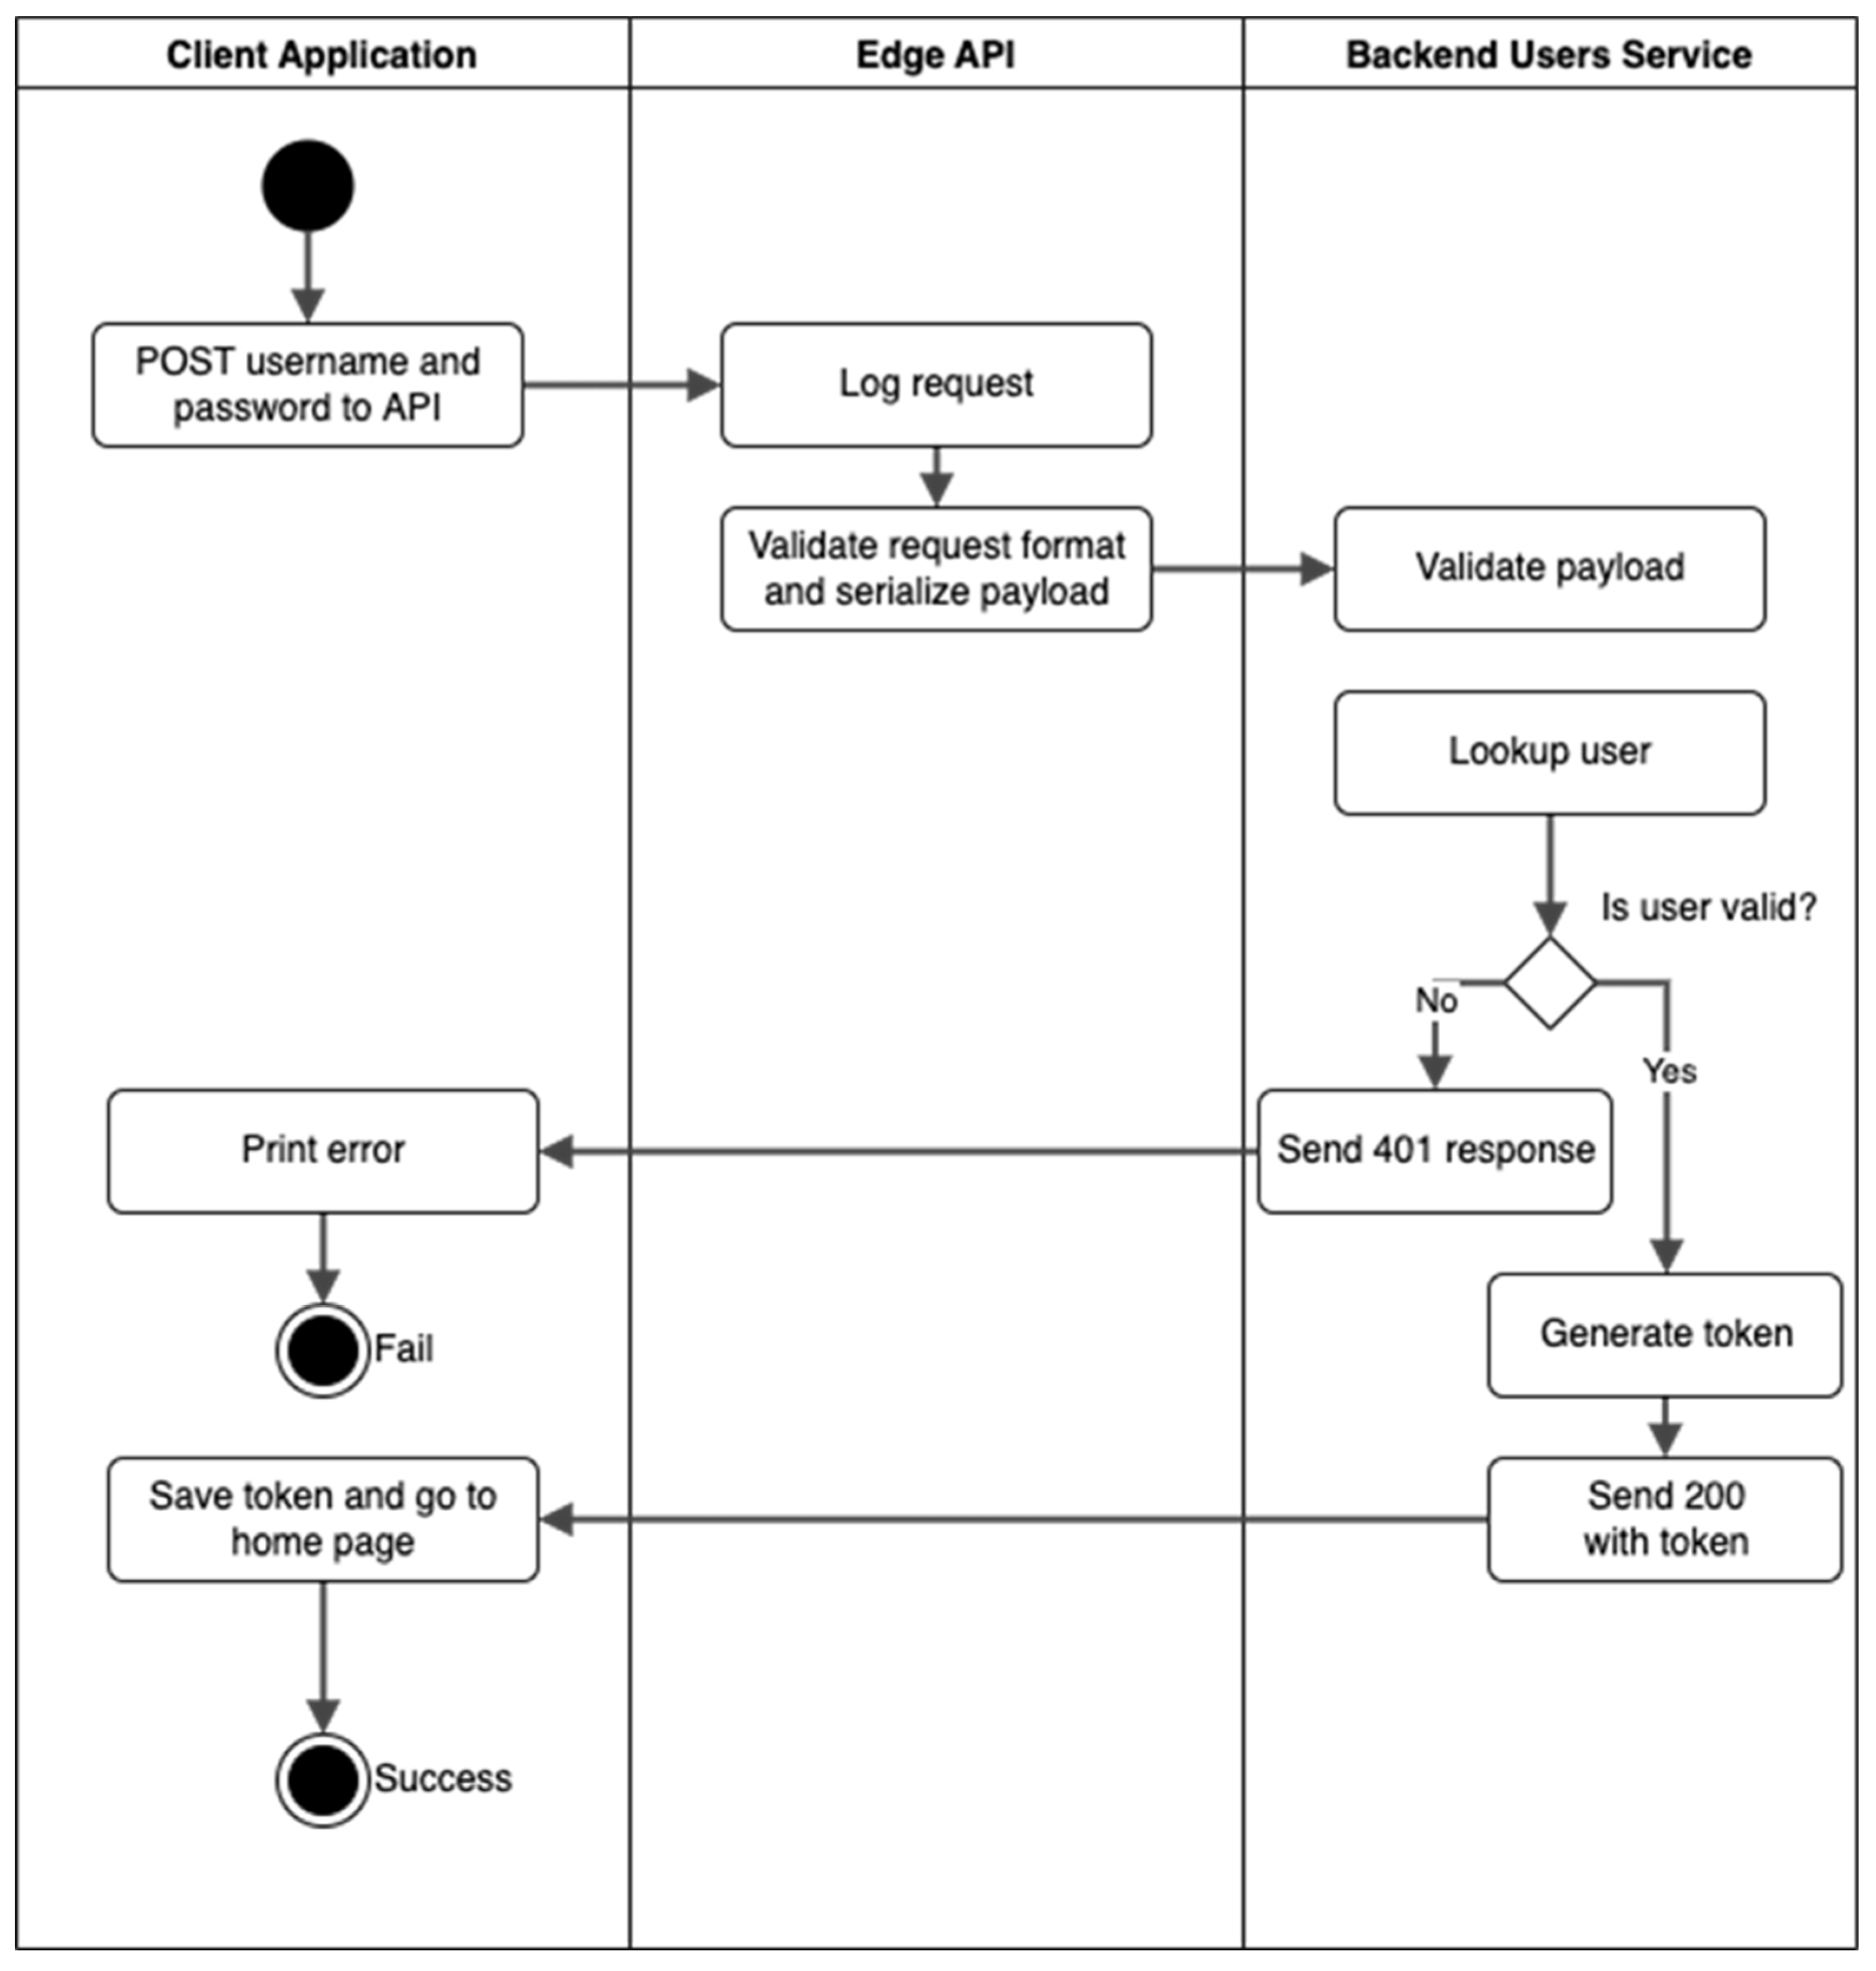
Figure 2.
A sample diagram of a network.
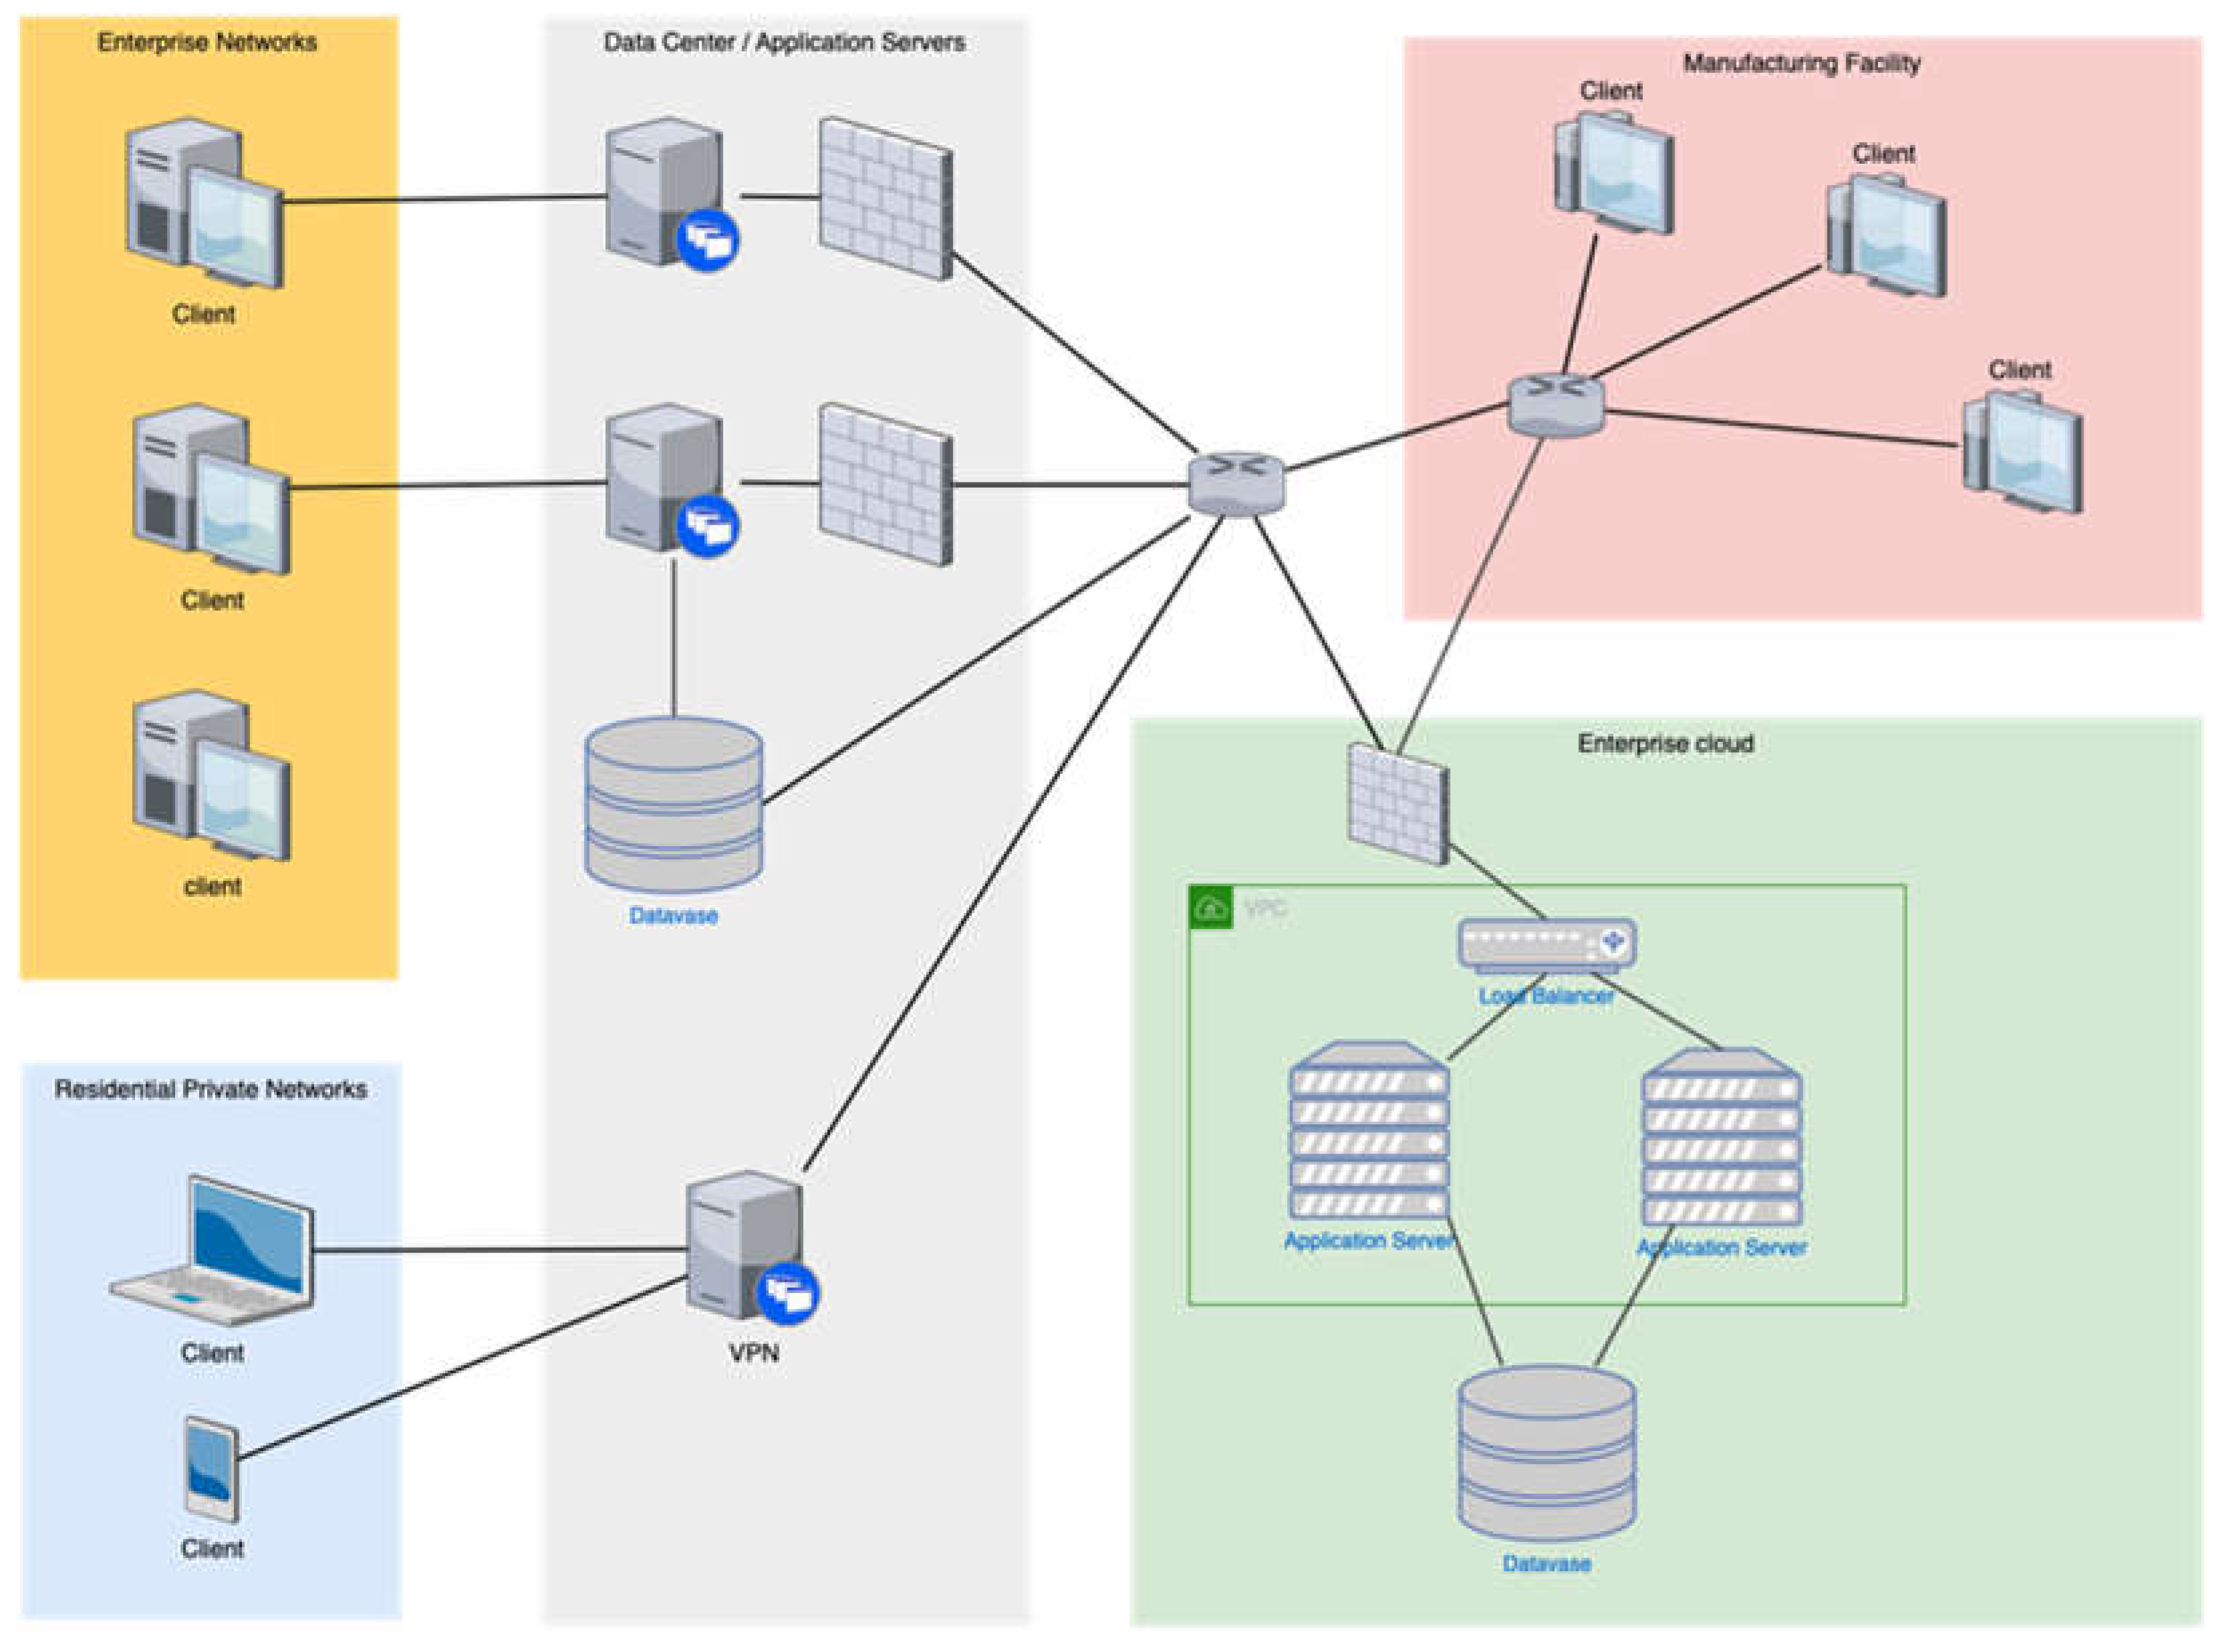
Figure 4.
A sample diagram of a database schema.
Disclaimer/Publisher’s Note: The statements, opinions and data contained in all publications are solely those of the individual author(s) and contributor(s) and not of MDPI and/or the editor(s). MDPI and/or the editor(s) disclaim responsibility for any injury to people or property resulting from any ideas, methods, instructions or products referred to in the content. |
© 2024 by the authors. Licensee MDPI, Basel, Switzerland. This article is an open access article distributed under the terms and conditions of the Creative Commons Attribution (CC BY) license (http://creativecommons.org/licenses/by/4.0/).
Copyright: This open access article is published under a Creative Commons CC BY 4.0 license, which permit the free download, distribution, and reuse, provided that the author and preprint are cited in any reuse.
Submitted:
05 May 2024
Posted:
07 May 2024
You are already at the latest version
Alerts
A peer-reviewed article of this preprint also exists.
This version is not peer-reviewed
Submitted:
05 May 2024
Posted:
07 May 2024
You are already at the latest version
Alerts
Abstract
This study addresses the prevalent gap between formal and informal architectural methodologies in software engineering. Recognizing the potential of informal architecture artifacts in analytical processes, we introduce a groundbreaking methodology that efficiently transforms these informal components into structured formal models. This method facilitates a deeper understanding and utilization of informal diagrams and enhances analytical capabilities through graph analysis techniques. By leveraging user-friendly tools like Draw.io, the methodology democratizes the modeling process, making sophisticated architectural analyses accessible to a broader spectrum of professionals without requiring deep expertise in formal methods. The innovative aspects of this methodology lie in its ability to streamline the transformation process, significantly improving both the efficiency and effectiveness of model creation and analysis. These enhancements are demonstrated through a practical application involving a sample architecture diagram, where the resulting model is thoroughly analyzed using advanced graph analysis tools like Python's NetworkX library and Neo4j. This approach bridges the theoretical and practical divides in software architecture and sets a new standard for integrating informal artifacts into systematic engineering workflows. In addition, considerations for Artificial Intelligence developments are discussed.
Keywords:
Subject: Computer Science and Mathematics - Software
1. Introduction
In the evolving landscape of software engineering, a significant gap persists between the theoretical methodologies proposed in research and the pragmatic approaches applied in practice. Research often emphasizes the rigor of formal methods, which are meticulously structured and aim to ensure semantic clarity and programmatic integrity [1,2]. However, these methods require a deep understanding of specialized modeling languages and tools [3], creating a barrier to widespread adoption due to the niche expertise required.
Conversely, informal methods predominate in the practical realm. Engineers frequently rely on natural-language documents, wikis, and simple boxes-and-lines diagrams due to their ease of use and accessibility [4]. Despite their popularity, these informal methods suffer significant drawbacks, including structure, formatting, and syntax inconsistencies, which complicate further analysis and integration into formal systems [5,6].
This paper introduces an innovative methodology that bridges this divide by transforming informal, often chaotic architectural diagrams into structured, formal models. Our approach leverages the user-friendly diagramming tool Draw.io (also available online as diagrams.net) to extract data from informal boxes-and-lines diagrams. This data is then structured into graph-like constructs compatible with advanced analysis tools such as Python's NetworkX library and Neo4j. This method not only democratizes the creation of formal models, making them accessible to a broader range of professionals without specialized training in formal methods but it also enhances the efficiency and effectiveness of architectural analyses.
We present a series of techniques that represent an evolution in handling architectural artifacts—optimizing the transformation process to be more intuitive and less resource-intensive. Our methodology is demonstrated through a sample analysis that showcases the complete workflow, from the initial extraction of data from informal diagrams to their integration into a structured model ready for formal analysis. This approach not only addresses the current gaps in practice but also pushes the boundaries of current software engineering methodologies by introducing a scalable, cost-effective solution that maintains the integrity and utility of formal modeling in a way that is aligned with everyday engineering practices. In addition, this is just an initial step to generate cases and then use the capabilities of “interpretation” of Large Language Models and advanced pattern recognition machines to build an even more powerful methodology.
2. Background
2.1. Architecture Diagrams
What constitutes an architecture diagram does not always have a clear definition [7]. Architecture generally shows many views of a system. Diagrams are used in software architecture to communicate various aspects of the system using different viewpoints to represent different perspectives. This section will describe some of those views with simplified visual examples to demonstrate the variety of architectural views and their purpose.
2.2. Behavioral (Activity) Diagrams
UML (Unified Modeling Language) is a visual language for modeling software systems [8]. SysML (Systems Modeling Language) is a similar language describing complex systems [9]. One type of diagram used in UML is the activity diagram, which describes the behavior of a piece of system functionality [8,9].
This activity diagram (Figure 1) serves as a blueprint, delineating the sequence of actions during a software application's login procedure. It portrays interactions simplified without sacrificing the technical depth required for accurate interpretation. Key actions such as 'POST username and password to API,' 'validate request,' and 'generate token' are articulated distinctly, ensuring stakeholders across various technical proficiencies can comprehend and analyze the process effectively. Moreover, the diagram incorporates decision logic, epitomized by the conditional evaluation that leads to different outcomes—a 401 response for failure and a 200 response with a token for successful authentication—thus fostering an understanding of the behavioral logic embedded within the system's architecture.
2.2. Logical Network Diagrams
Network diagrams typically show the logical and sometimes physical segmentation of a network. This network diagram (Figure 2) illustrates an architecture that efficiently segregates various components of an organization’s IT infrastructure across different network zones, optimizing performance and security. It visually divides the network into distinct sections, including enterprise networks, a data center with application servers, a manufacturing facility, residential private networks, and an enterprise cloud, each serving a unique role within the broader network ecosystem.
Multiple client computers are connected in the enterprise networks, indicating a typical office setup. The data center is the core hub that houses application servers and a central database, emphasizing its role in data storage and application management. It is connected to enterprise and manufacturing facility clients, demonstrating centralized access to computational resources.
Residential private networks connect through a VPN, highlighting the security measures for remote access, which is increasingly relevant in modern network designs that accommodate telecommuting. The enterprise cloud section, encased within a Virtual Private Cloud (VPC), features redundant application servers behind a load balancer, illustrating high availability and fault tolerance strategies essential for maintaining continuous service delivery.
2.3. Cloud Architecture Diagrams
Cloud architecture diagrams are frequently used to communicate the cloud computing services used in a system and the connections between those services. Like a network diagram, a cloud architecture shows logical network connections. However, a cloud architecture diagram tends to focus more on logical data flow and specific use of cloud technologies.
For example, in Figure 1, the provided cloud architecture diagram effectively delineates the integration and interaction of cloud services within a sophisticated AWS-based infrastructure. Central to this architecture is the Amazon API Gateway, which serves as the primary conduit through which mobile and web applications communicate, ensuring streamlined interactions across various services. Authentication is robustly managed through AWS Lambda functions that interface with Amazon Cognito and Active Directory, providing a secure and flexible authentication system suitable for diverse user environments.
This diagram also highlights the orchestration of multiple AWS services to enhance functionality and performance. Amazon S3, DynamoDB, and Elasticsearch handle data storage and processing, ensuring high availability and quick access to data. Amazon CloudWatch is integrated for comprehensive monitoring and operational health checks, demonstrating the system's ability to efficiently maintain performance and reliability. This architectural visualization showcases the system’s operational workflows and emphasizes the strategic use of cloud technologies to optimize data flow and resource management within the cloud ecosystem.
Figure 3.
A sample informal diagram of a cloud infrastructure architecture.
2.4. Structural Diagrams
An Entity Relationship Diagram (ERD) communicates the structure and relationships between data tables [8]. For example, the ERD example (Figure 4) outlines the data relationships within a blog management system featuring three primary entities: User, BlogPost, and BlogContent. The User entity stores comprehensive user details and has a one-to-many relationship with the BlogPost entity, indicating that a single user can author multiple blog posts. Each blog post includes attributes like title, description, and content status (draft or published) and can be associated with multiple BlogContent records, which handle potentially large or segmented text elements of each post. This ERD effectively showcases the structured data interactions fundamental to the platform’s operation, emphasizing how content is authored, stored, and updated.
This diagram style has different syntaxes depending on the language (e.g., UML, SysML), but the general purpose is the same [8,9]. This type of diagram shows the objects or data entities in a system. It can be used to represent database tables or class relationships. Similar diagrams can be used in cyber-physical domains using SysML to show the logical structure of a system [8].
2.5. Other Diagram Types
There are many other types of diagrams used in software and systems engineering. These sometimes overlap in purpose or syntax and lack consistency in notation. The examples above are illustrative examples of the variety of these diagram types in syntax and purpose.
- Sequence Diagrams
- Use Case Diagrams
- Deployment Diagrams
- Component Diagrams
- State Machine Diagrams
- Class Diagrams
- Package Diagrams
It should be noted that the methodology presented in this paper is intended as a general solution to data extraction and modeling rather than a solution to a single diagram type.
3. Tooling
3.1. Diagrams.net (Draw.io) and MxGraph
Several different tools are available for creating diagrams. One of these is Diagrams.net (formerly Draw.io), a web-based diagramming tool that can generate a variety of general-purpose diagrams [10]. In addition to the web-based version of the tool, there is also a desktop version (branded as Draw.io Desktop) [11] and a Visual Studio Code (VSCode) extension [12,13], which is an unofficial version of the tool that allows software developers to edit diagrams directly in Visual Studio Code.
The .drawio format is a readily parsable XML file based on MxGraph, and XML format for storing graph data structures [14]. Other formats were explored so the diagrams could be readily embedded in Markdown files. Importantly, the files need to be parsable so that data can still be extracted from the diagram.
3.2. Draw.io VSCode Integration
One method explored for diagramming is using the Draw.io VSCode extension by Henning Dieterichs [12]. This extension embeds the Draw.io application into VSCode so that files with extensions *.drawio, *.drawio.svg, or *.drawio.png will be opened in a Draw.io tab rather than an ASCII text file.
3.3. Other Tool Considerations & Tool Selection
Microsoft Visio, Lucidchart, and Gliffy were other tools considered for this method. Draw.io was selected for its accessibility and open-source nature.
Both the desktop tool and the VSCode extension were used to generate diagrams. Draw.io was chosen for this analysis due to its widespread use, general purpose use case, and open-source nature.
4. Methodology
This section outlines the general method for creating structured models from informal Draw.io diagrams. The drawio.png file format will be the primary focus for its practical use in documentation [15].
- Begin with a Draw.io diagram, saved as a .drawio.png file. Those wishing to reproduce this method may use the image below as it uses this format. In this case, a simple activity diagram is used.
Figure 5.
A sample activity diagram.
- 2.
- Extract the MxFile data from the image. The MxFile XML is stored as metadata in the image. This can be extracted and converted into a usable format.
- 3.
- Convert to JSON (optional). As an intermediate step, the method used in this paper converts the MxFile XML to JSON. This is done primarily for the convenience of working with JSON over XML and can be skipped if needed.
- 4.
- Convert to NetworkX. Next, data is converted into a usable model. The primary method used for the demonstration is Draw.io, but there are no technical limitations to the format at this point. With a NetworkX model, a usable format is available for analysis or visualization.
Figure 6.
A NetworkX model of the sample activity diagram
- 5.
- Infer Additional Information (optional). A final step is to infer additional information that might be useful in a model that was not present in the original diagram. This is discussed in detail later in this paper.
The remaining sections of this paper will cover each of these stages in detail. First data extraction and format conversion is discussed, then inferences. Finally, an end-to-end example is shown which demonstrates indexing, query, and analysis concepts.
5. Extracting Data from Informal Artifacts
5.1. File Formats
A simple “Hello, World” diagram is used as an illustrative example to break down each file format. This sample diagram contains two nodes labeled “Hello” and “World,” shown below. The “Hello” node has a data property called name with a value of foo. While this is ultimately a simple example, it will be used to show the contents of each file type in detail.
Figure 7.
The Hello World diagram.
5.2. The .drawio File Format
Draw.io uses the MxGraph library to store graph data [14]. The full format is shown in Appendix B. MxGraph stores data in MxFiles, which are XML documents, as shown in the hello.drawio XML code snippet below.
Figure 8.
This is the format of. drawio files.
5.3. The .drawio.svg File Format
The .drawio.svg format encodes the diagram as an SVG file, which is an XML document that describes the geometry and style of an image. The mxfile is stored as a string in the content attribute on the top-level SVG tag, this data for the Hello World example is shown below:
Figure 9.
Data for the Hello World Example.
The data value in the content attribute contains escaped HTML. Unescaping the HTML gives an MxFile; however, the data is still encoded. The data is URL encoded, then deflated, and base-64 encoded. Reversing this encoding gives the MxGraph XML, as shown in Fig. X.
The tool CyberChef [16] was used to represent the complete extraction method in a platform agnostic way. The CyberChef recipe for converting the original SVG file to the MxGraph XML data is:
Figure 10.
The CyberChef recipe for converting the original SVG file to the MxGraph XML data.
5.4. The .drawio.png File Format
This was a bit simpler and seems to lend itself better to document generation. The PNG is URL encoded, so a simple URL decode returns the Mxfile XML data in the PNG, which can then be extracted using a simple RegEx.
The cyberchef recipe to extract the MxFile is this:
Figure 11.
The cyberchef recipe to extract the MxFile.
6. Extracting Data from PNGs
6.1. Extracting the MxFile
The following function takes as input a file path (called fpath) pointing to a .drawio.png file and returns the MxFile XML as a string.
Figure 12.
Python Code for getting the_Mxfile function.
6.2. Converting to JSON
The Python code to convert this into JSON is as follows:
Figure 13.
Python code to convert to JSON.
This uses a custom MxGraph class which contains the logic for parsing the MxGraph into a flattened list of dictionaries.
7. Creating Models
NetworkX converts the MxFile contents to a more usable format. It provides functionality for working with graph data structures, such as traversal and analysis, and visualization capabilities.
The following Python code demonstrates how to convert the MxFile contents to NetworkX. In short, all diagram elements are traversed and identified as either a node or an edge. The appropriate NetworkX functions are used to add the elements to a NetworkX graph. Note that the below code snippet simplifies the actual code to illustrate the methodology. The algorithm used in practice captures node label information, style, and coloring. The complete code is available online.
Figure 14.
Python code to convert the MxFile contents to NetworkX.
8. Inferring Information
After extracting data from the diagram and converting to a NetworkX graph, the graph can be analyzed to infer information not contained in the diagram data. This section discusses several of these concepts with examples.
8.1. Geometric Inferences
Consider the previous network or behavior diagrams. In each diagram, there are geometric relationships (i.e., one diagram element is inside another). This is shown as network enclaves or subnets in the network diagram or swimlanes in the activity diagram.
If there are no explicit relationships between the diagram elements inside a container and the container itself, it is possible to identify and create those with simple geometric filtering using the following pseudocode:
Figure 15.
Pseudocode for simple geometric filtering.
In this example, the graph is analyzed for nodes that are inside other nodes. By comparing each node to each other node, elements whose bounds lie entirely within the bounds of another element are identified. If this condition is true, an in relationship is added between those two elements. While this may be an inefficient approach to this problem at scale, diagrams are designed to be visual and therefore should not reach a scale where this becomes a computationally hard problem.
8.2. Parent-Child Relationships
A similar approach can be applied to identifying parent-child relationships in the diagram. This is applicable when there is a hierarchical link between two elements rather than a relationship link. For example, in MxGraph certain elements can be nested inside other elements differently from the geometric approach above. MxGraph uses a parent attribute on a graph element to indicate this. This often applies to swimlanes or other grouping elements.
To capture these relationships, the following Python code is used:
Figure 16.
Python code to capture parent-child relationships.
In this case, a complementary bi-directional relationship is created between the two elements.
8.3. Other Inferences
- Traversing intermediate connections. Another example is traversing intermediate connections. This could address the need to understand the relationships in a diagram while traversing the graph (e.g. element A is linked to B is linked to C). It will be shown later in this paper that by leveraging modern graph databases, this sort of pattern can be identified without the need for making the inference manually.
- Grouping by proximity. Grouping related elements together based on proximity, within some specified tolerance, has also been suggested.
- Element type identification. Identifying different types of diagram elements can also be useful. This can be done either by adding data fields to elements or considering element style.
- Edge types / edge labels. The demonstrated approach ignores edge labels in MxGraph due to the added complexity and distraction for the core method being presented. In MxGraph, edge labels are vertices making their role in the graph more complex. In future work, it is recommended that this be reconciled and edge labels.
9. End-to-End Example
In this section, an end-to-end example begins with an architecture diagram and uses the data extraction methods presented to generate models that can be queried. Analysis techniques are demonstrated to answer representative real-world questions and provide insight into a system.
9.1. Creating the Model
This network diagram (Figure 17) provides a detailed visualization of the infrastructure typically deployed in a small business, segmenting the network into four distinct enclaves: Enterprise Offices, Manufacturing Facility, Data Center, and Cloud-Based Back-Office Analytics. The Enterprise Offices are connected through a router, illustrating the flow of information from multiple client computers within the office environment. This setup is essential for the day-to-day operations of office staff, providing them access to centralized data and applications hosted on-site.
The diagram further shows the Data Center, which houses multiple application servers and databases, labeled as SRV01, SRV02, SRV03, and DB01, DB02, and DB03, respectively, indicating a robust setup for handling various business applications and data storage needs. Back-office analytics is handled in the cloud, featuring a load-balanced environment with data lakes for advanced data processing and analytics. This separation highlights the specialized use of cloud resources for handling large-scale data processing separate from the everyday operational data, optimizing performance and scalability. Additionally, the Manufacturing Facility is depicted with fewer details, showing connections between workstation and mobile clients, emphasizing its operational independence but integration into the broader network architecture.
Figure 17.
Simplified representation of a network that might be used in a small business.
This example will demonstrate how one might analyze a network to understand interactions between systems, analyze impacts, or assess risk. Next, the diagram is converted to a NetworkX graph, and additional information is inferred, as described in the previous sections. The edges colored red are the inferred relationships that capture the geometric containment (“in” relationships”) of diagram elements inside the network enclaves. In the following sections, this information is used to show how to query the model.
Figure 18.
Inferred relationships of diagram elements inside network enclaves.
9.2. Indexing with Graph Databases
Indexing the graph using a Graph database allows for more complex queries to be performed using the Cypher query language. The image below shows a simple representation of the graph in Neo4j.
Graph databases are optimized for indexing and querying graphs [17]. For this paper, Neo4j Community Edition was chosen because it is widely accessible and easy to set up. The Cypher query language was intuitive and well-suited to the types of analyses intended for this example. In this case, a simple match query (e.g., MATCH (n) RETURN n) returns all elements in the graph. The following section explores more complex queries that leverage Cypher’s pattern-matching capability to answer questions about the system.
Figure 19.
Simple representation of the graph in Neo4j.
9.3. Querying with Cypher
The following query demonstrates how to query the model for all databases and nodes they are connected to.
MATCH (db:Database)<-[r]->(n) RETURN db, n
This query returns all nodes of type Database (e.g., (db:Database)) and all nodes they connect to (e.g. (n)) with no regard for the relationship direction (e.g. <-[r]->). This yields the following results.
Figure 20.
Get all databases in the system.
Consider a more practical scenario where an enterprise has identified a critical or sensitive asset. The graph model can be used to identify high-risk components in the architecture (e.g nodes that connect to that asset directly or indirectly). The Cypher query below demonstrates how to do this.
Figure 21.
Python Code for the Cypher query.
In this case, a similar MATCH pattern is used, with one notable exception: the relationship is specified as a variable-length path (e.g. r:EDGE*0..4) and only includes the EDGE type (ignoring the inferred IN relationships shown in previous sections). The query then applies a WHERE condition to limit the database match to only the high-value asset.
Figure 22.
Get all items up to four steps from the data lake.
10. Results
A general method for creating models from informal architecture diagrams generated with Draw.io was presented. The method was effective for creating models that can be queried to analyze a system's characteristics.
This method contributes to systems and software architecture knowledge by providing a methodology for addressing the gap between formal and informal architectural artifacts [18]. While clear gaps remain in the need to keep implemented systems aligned with their architecture [5], this method makes creating formal architecture artifacts easier and more accessible to implementation teams based on their current workflows that leverage informal documents rather than formal architectures [19].
It is important to note that trends in modeling are moving towards more text-based code-like formats, as demonstrated with the initial release of SysML 2.0 [20]. This is designed to make MBSE (Model-Based Systems Engineering) models more semantic and executable and allow them to follow processes reminiscent of software engineering.
11. Next Steps: Incorporating Artificial Intelligence to Enhance the Methodology
Integrating advanced computational techniques, particularly artificial intelligence (AI), can markedly influence the evolution of software engineering methodologies. The methodology described here to transform informal software architecture diagrams into formal models can also utilize the latest AI technologies to bridge significant gaps in traditional methods.
11.1. Methodology Evolution and Optimization
Our methodology can leverage AI to evolve and optimize the transformation process of architectural artifacts. This approach significantly enhances the efficiency and effectiveness of converting informal diagrams into structured, formal models by employing large language models [21] and advanced pattern recognition systems, such as those utilizing transfer learning [22] from networks like ResNet-50 [23]. This automation will speed up the process and reduce human error and the subjectivity of manual interpretation. The methodology proposed in this paper can be used to build a massive learning book that includes structured and unstructured data.
11.2. Machine Learning Integration
The integration of machine learning algorithms facilitates the automatic recognition and classification of elements within informal diagrams, which can be particularly nebulous and unstructured. For example, machine learning models can be trained to identify and categorize diagrammatic components into predefined classes, streamlining the data extraction and transformation process. This application of AI supports a more thorough and nuanced analysis of architectural diagrams, enhancing the precision and reliability of the resulting formal models.
11.3. Innovative Aspects and Improvements
This future incorporation of AI will introduce several innovative aspects:
- Automation of Model Transformation: AI largely automates transforming diagrams, reducing the time and resource investment required and allowing engineers to focus on more strategic tasks.
- Enhanced Analysis Capability: AI enhances the capability to analyze complex diagrams by interpreting intricate patterns and relationships that may not be immediately apparent to human analysts.
- Scalability and Adaptability: AI algorithms can quickly adapt to new types of diagrams and scale to handle large datasets, which is crucial for enterprises with extensive systems architectures.
11.4. Practical Applications and Future Work
This AI-enhanced methodology can be applied across various domains, including—but not limited to—automotive, aerospace, and IT infrastructure, where complex systems modeling is crucial. Future work will focus on introducing these AI models to handle an even broader array of diagram types and exploring their integration with other tools and platforms used within the industry.
12. Conclusions
This paper presented a method for creating models from informal architectural artifacts. While this paper has demonstrated that the problem is feasible, much work remains. First, we need to explore the feasibility of this approach with other tools. While Draw.io is a popular tool, it is not the only tool used to create informal diagrams. Second, intelligent inferences about the diagram should be further explored. Further intelligence can make this a far more practical technique for analysis. One such approach beyond the inferences presented in this paper is to consider applying this technique at scale with many diagrams describing a system and exploring the ability to link common elements across diagrams. Finally, we don’t see a path toward industry adoption without easy-to-use, robust software tooling. We view that as a critical step towards adopting this technique in practice rather than a research novelty. Artificial intelligence, particularly pattern recognition and large language models, has tremendous potential to support and enhance the methodology.
Author Contributions
Mr. Joshua Kaplan contributed to the conceptualization and methodology. Dr. Luis Rabelo reviewed, enhanced, edited, and added the future of Artificial Intelligence.
Institutional Review Board Statement
Not Applicable.
Data Availability Statement
The complete source code for this paper is publicly available at https://github.com/josh-kaplan/extracting-data-from-diagrams. Additional follow-on content will be published at https://jdkaplan. com/papers/informal-architecture.
Conflicts of Interest
The authors declare no conflicts of interest.
References
- Basili, V.; Briand, L.; Bianculli, D.; Nejati, S.; Pastore, F.; Sabetzadeh, M. Software Engineering Research and Industry: A Symbiotic Relationship to Foster Impact. IEEE Software 2018, 35, 44-49. [CrossRef]
- M. Richards and N. Ford. Fundamentals of Software Architecture. O'Reilly Media, Inc. https://learning.oreilly.com/library/view/fundamentals-ofsoftware/9781492043447/.
- E. Carroll and R. Malins. Systematic Literature Review: How is Model-Based Systems Engineering Justifed?. Sandia National Laboratories. 2016. [CrossRef]
- M. Ozkaya. Do the informal & formal software modeling notations satisfy practitioners for software architecture modeling? Information and Software Technology 2018, 95, 15-33. [CrossRef]
- J. Keim, Y. Schneider, and A. Koziolek. Towards consistency analysis between formal and informal software architecture artefacts. In Proceedings of the 2019 IEEE/ACM 2nd International Workshop on Establishing the Community-Wide Infrastructure for Architecture-Based Software Engineering (ECASE), 27-27 May 2019, 2019; pp. 6-12.doi: https://ieeexplore.ieee.org/document/8815606.
- Ali, N.; Baker, S.; O’Crowley, R.; Herold, S.; Buckley, J. Architecture consistency: State of the practice, challenges and requirements. Empirical Software Engineering 2018, 23, 224-258. [CrossRef]
- M. Fowler. Software Architecture Guide. https://martinfowler.com/architecture/.
- Object Management Group. OMG® Uni ed Modeling Language® (OMG UML®), Versionb2.5.1. 2023. https://www.omg.org/spec/UML/2.5.1/PDF.
- Object Management Group. OMG Systems Modeling Language™ (SysML®), Version 2.0 Beta, Part 1 Language Specification. 2023. https://www.omg.org/spec/SysML/2.0/Beta1/Language/PDF.
- JGraph Ltd.. draw.io. July 2023. https://www.drawio.com/.
- JGraph Ltd.. Github - jgraph/drawio-desktop (Source Code). July 2023. https://github.com/jgraph/drawio-desktop.
- Henning Dieterichs. Github - hediet/vscode-drawio (Source Code). July 2023. https://github.com/hediet/vscode-drawio.
- Henning Dieterichs. Draw.io Integration - Visual Studio Marketplace. July 2023.https://marketplace.visualstudio.com/items?itemName=hediet.vscode-drawio.
- JGraph Ltd. MxGraph. https://jgraph.github.io/mxgraph/.
- J. Kaplan. Agile Architecture in Practice. 2023. https://jdkaplan.com/articles/agile-architecture-in-practice.
- GCHQ. CyberChef. https://gchq.github.io/CyberChef/.
- Robinson, J. Webber, and E. Eifrim. Graph Databases, 2nd Edition. O'Reilly Media, Inc.. 2015. https://learning.oreilly.com/library/view/graph-databases-2nd/9781491930885/.
- Kassab, M.; Mazzara, M.; Lee, J.; Succi, G. Software architectural patterns in practice: an empirical study. Innovations in Systems and Software Engineering 2018, 14, 263-271. [CrossRef]
- Schilling, R.D.; Aier, S.; Winter, R. Designing an Artifact for Informal Control in Enterprise Architecture Management. In Proceedings of the ICIS, 2019, Munich, Germany, Dec 15-18, 2019.
- Object Management Group. OMG Systems Modeling Language™ (SysML®), Version 2.0 Beta. 2023. https://www.omg.org/spec/SysML/2.0/Beta1.
- Zhang, T.; Ladhak, F.; Durmus, E.; Liang, P.; McKeown, K.; Hashimoto, T.B. Benchmarking Large Language Models for News Summarization. Transactions of the Association for Computational Linguistics 2024, 12, 39-57. [CrossRef]
- Hosna, A.; Merry, E.; Gyalmo, J.; Alom, Z.; Aung, Z.; Azim, M.A. Transfer learning: a friendly introduction. Journal of Big Data 2022, 9, 102. [CrossRef]
- Zhang, L.; Bian, Y.; Jiang, P.; Zhang, F. A Transfer Residual Neural Network Based on ResNet-50 for Detection of Steel Surface Defects. Applied Sciences 2023, 13, 5260.
Figure 1.
A semi-formal UML activity diagram.
Figure 2.
A sample diagram of a network.
Figure 4.
A sample diagram of a database schema.
Disclaimer/Publisher’s Note: The statements, opinions and data contained in all publications are solely those of the individual author(s) and contributor(s) and not of MDPI and/or the editor(s). MDPI and/or the editor(s) disclaim responsibility for any injury to people or property resulting from any ideas, methods, instructions or products referred to in the content. |
© 2024 by the authors. Licensee MDPI, Basel, Switzerland. This article is an open access article distributed under the terms and conditions of the Creative Commons Attribution (CC BY) license (http://creativecommons.org/licenses/by/4.0/).
Copyright: This open access article is published under a Creative Commons CC BY 4.0 license, which permit the free download, distribution, and reuse, provided that the author and preprint are cited in any reuse.
Category-Theoretic Formulation of the Model-Based Systems Architecting Cognitive-Computational Cycle
Yaniv Mordecai
et al.
Applied Sciences,
2021
A Methodology for Generating Systems Architectural Glimpse Statements Using the 5W1H Maxim
Orfefs Voutyras
et al.
Computers,
2021
Requirements Elicitation for an Assistance System for Complexity Management in Product Development of SMEs during COVID-19: A Case Study
Jan-Phillip Herrmann
et al.
Computers,
2021


MDPI Initiatives
Important Links
© 2024 MDPI (Basel, Switzerland) unless otherwise stated