Submitted:
04 May 2024
Posted:
07 May 2024
You are already at the latest version
Abstract
Keywords:
1. Introduction
2. Methodology
2.1. Search of academic articles
2.2. Review of peer reviewed articles
2.3. Selection of academic articles
2.4. Data Records
3. Results
3.1. Gold
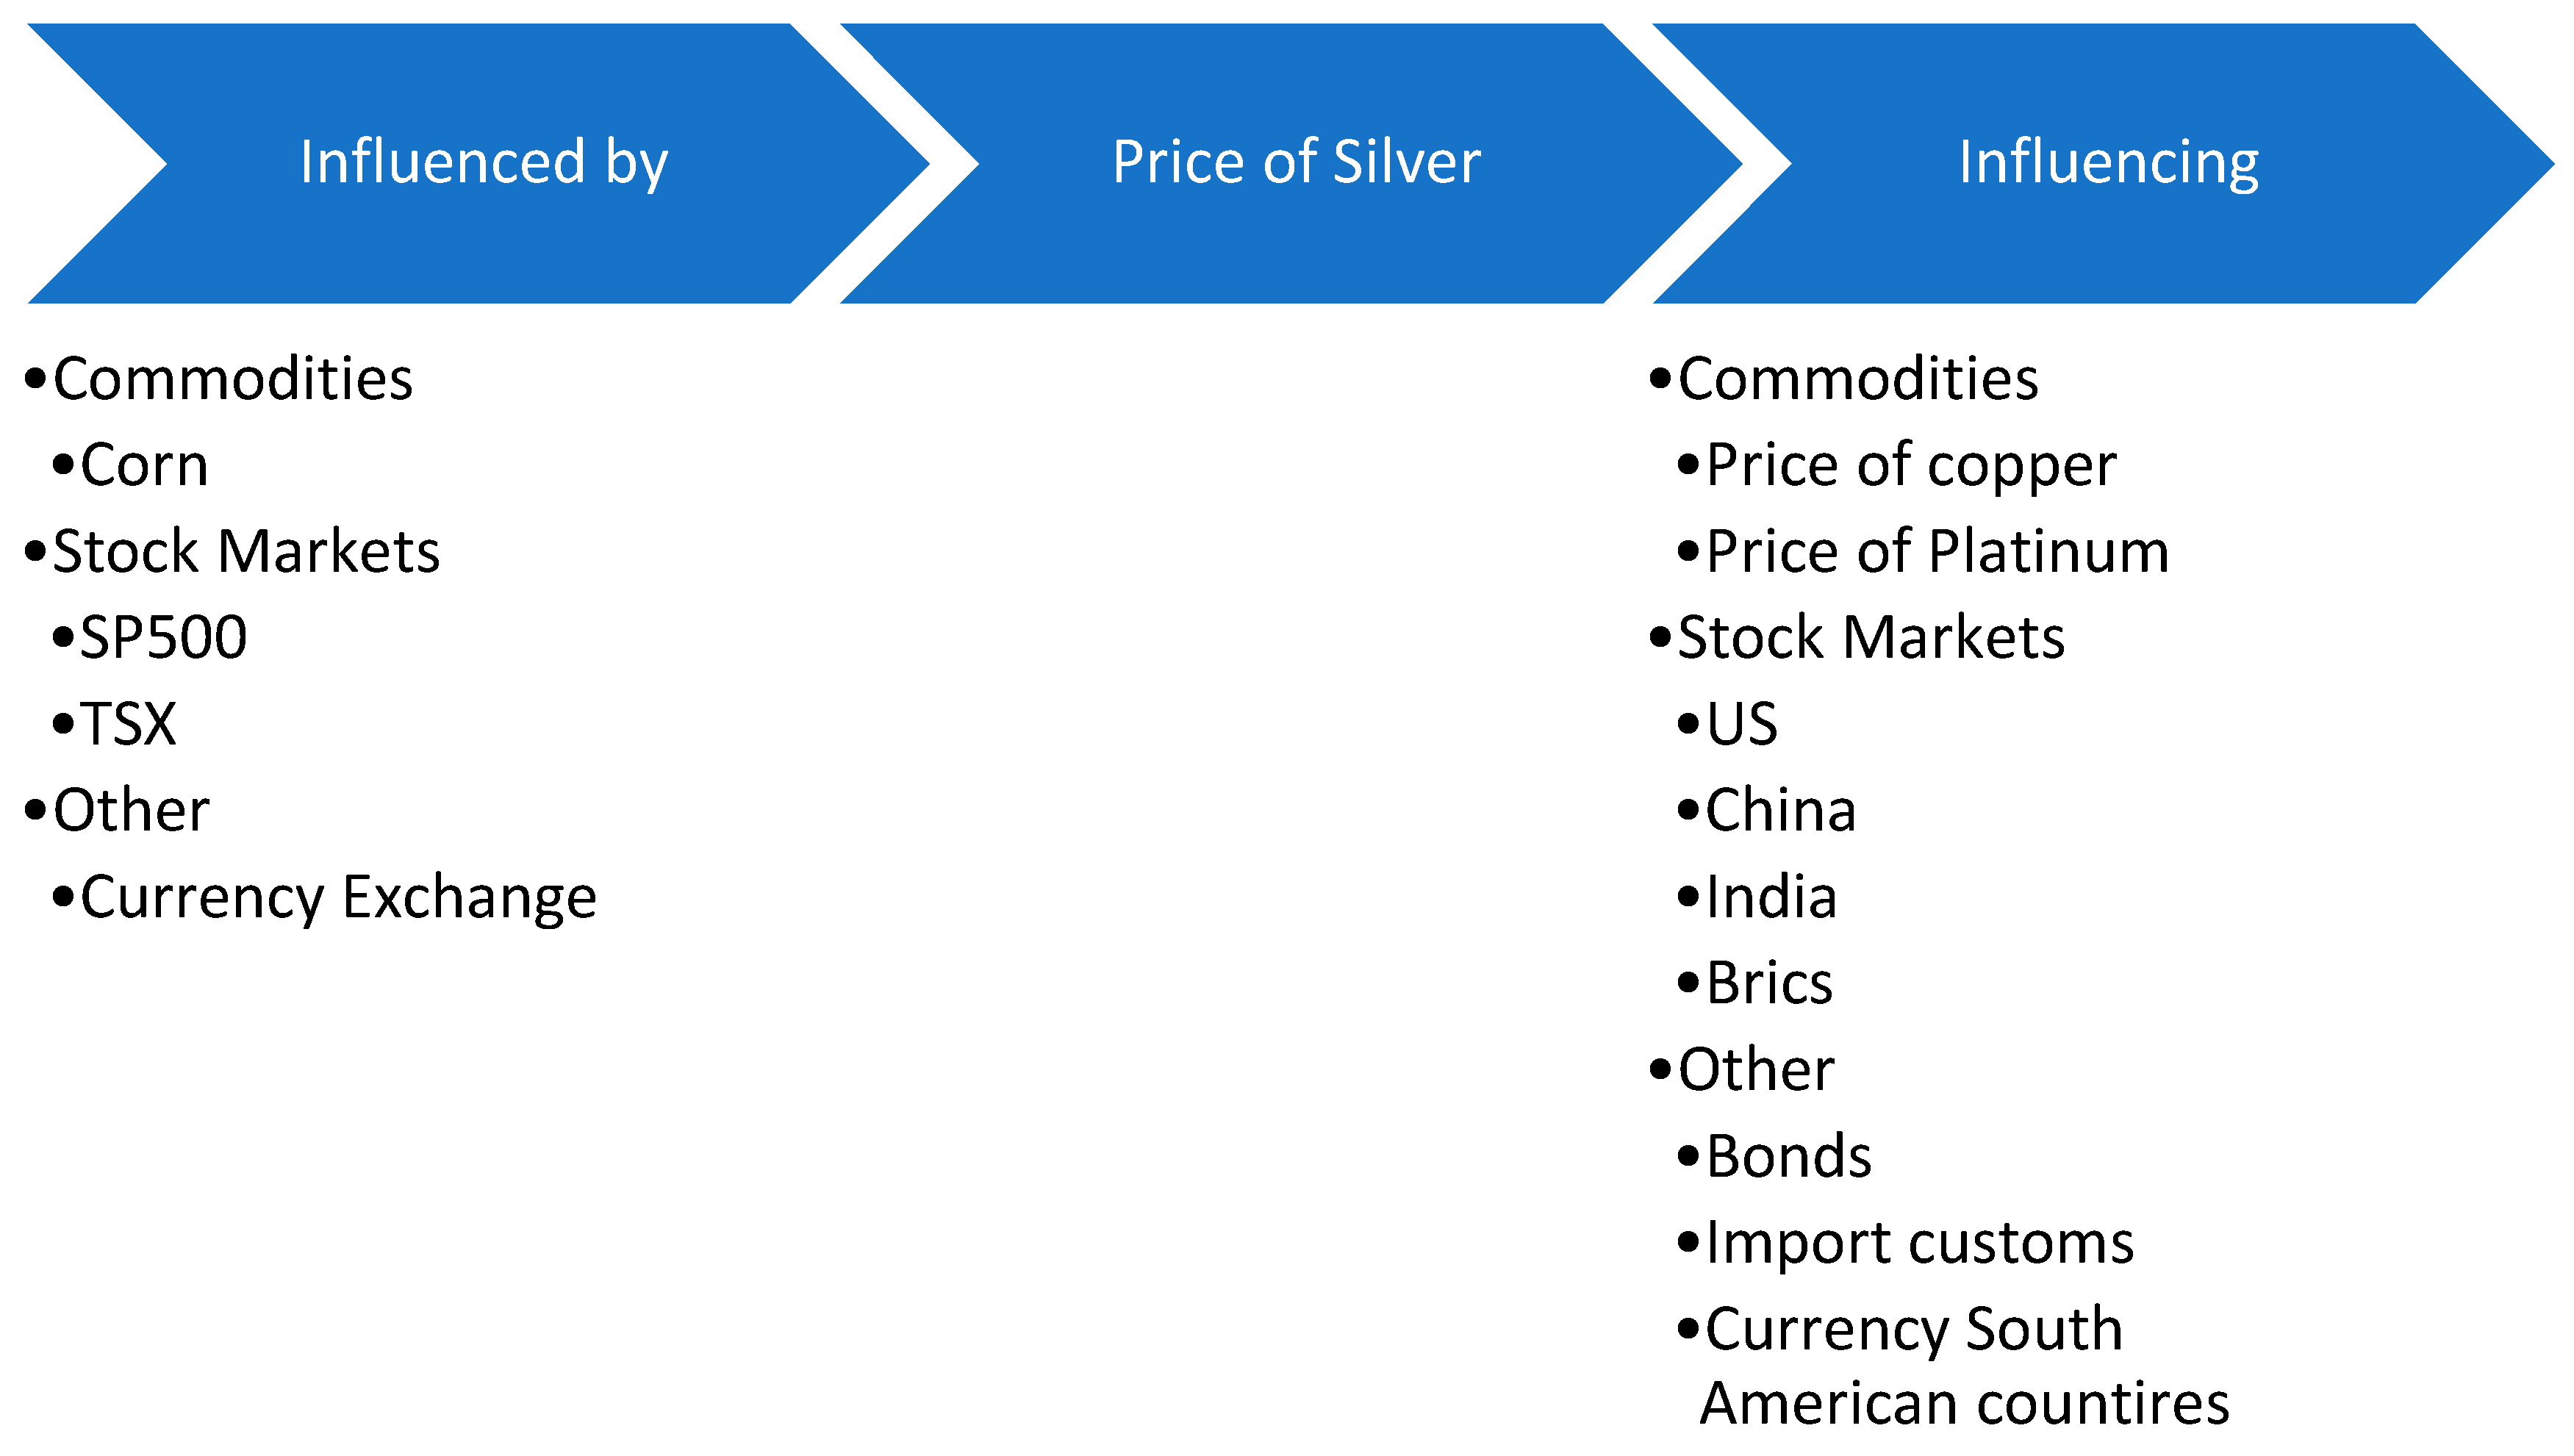
3.2. Silver
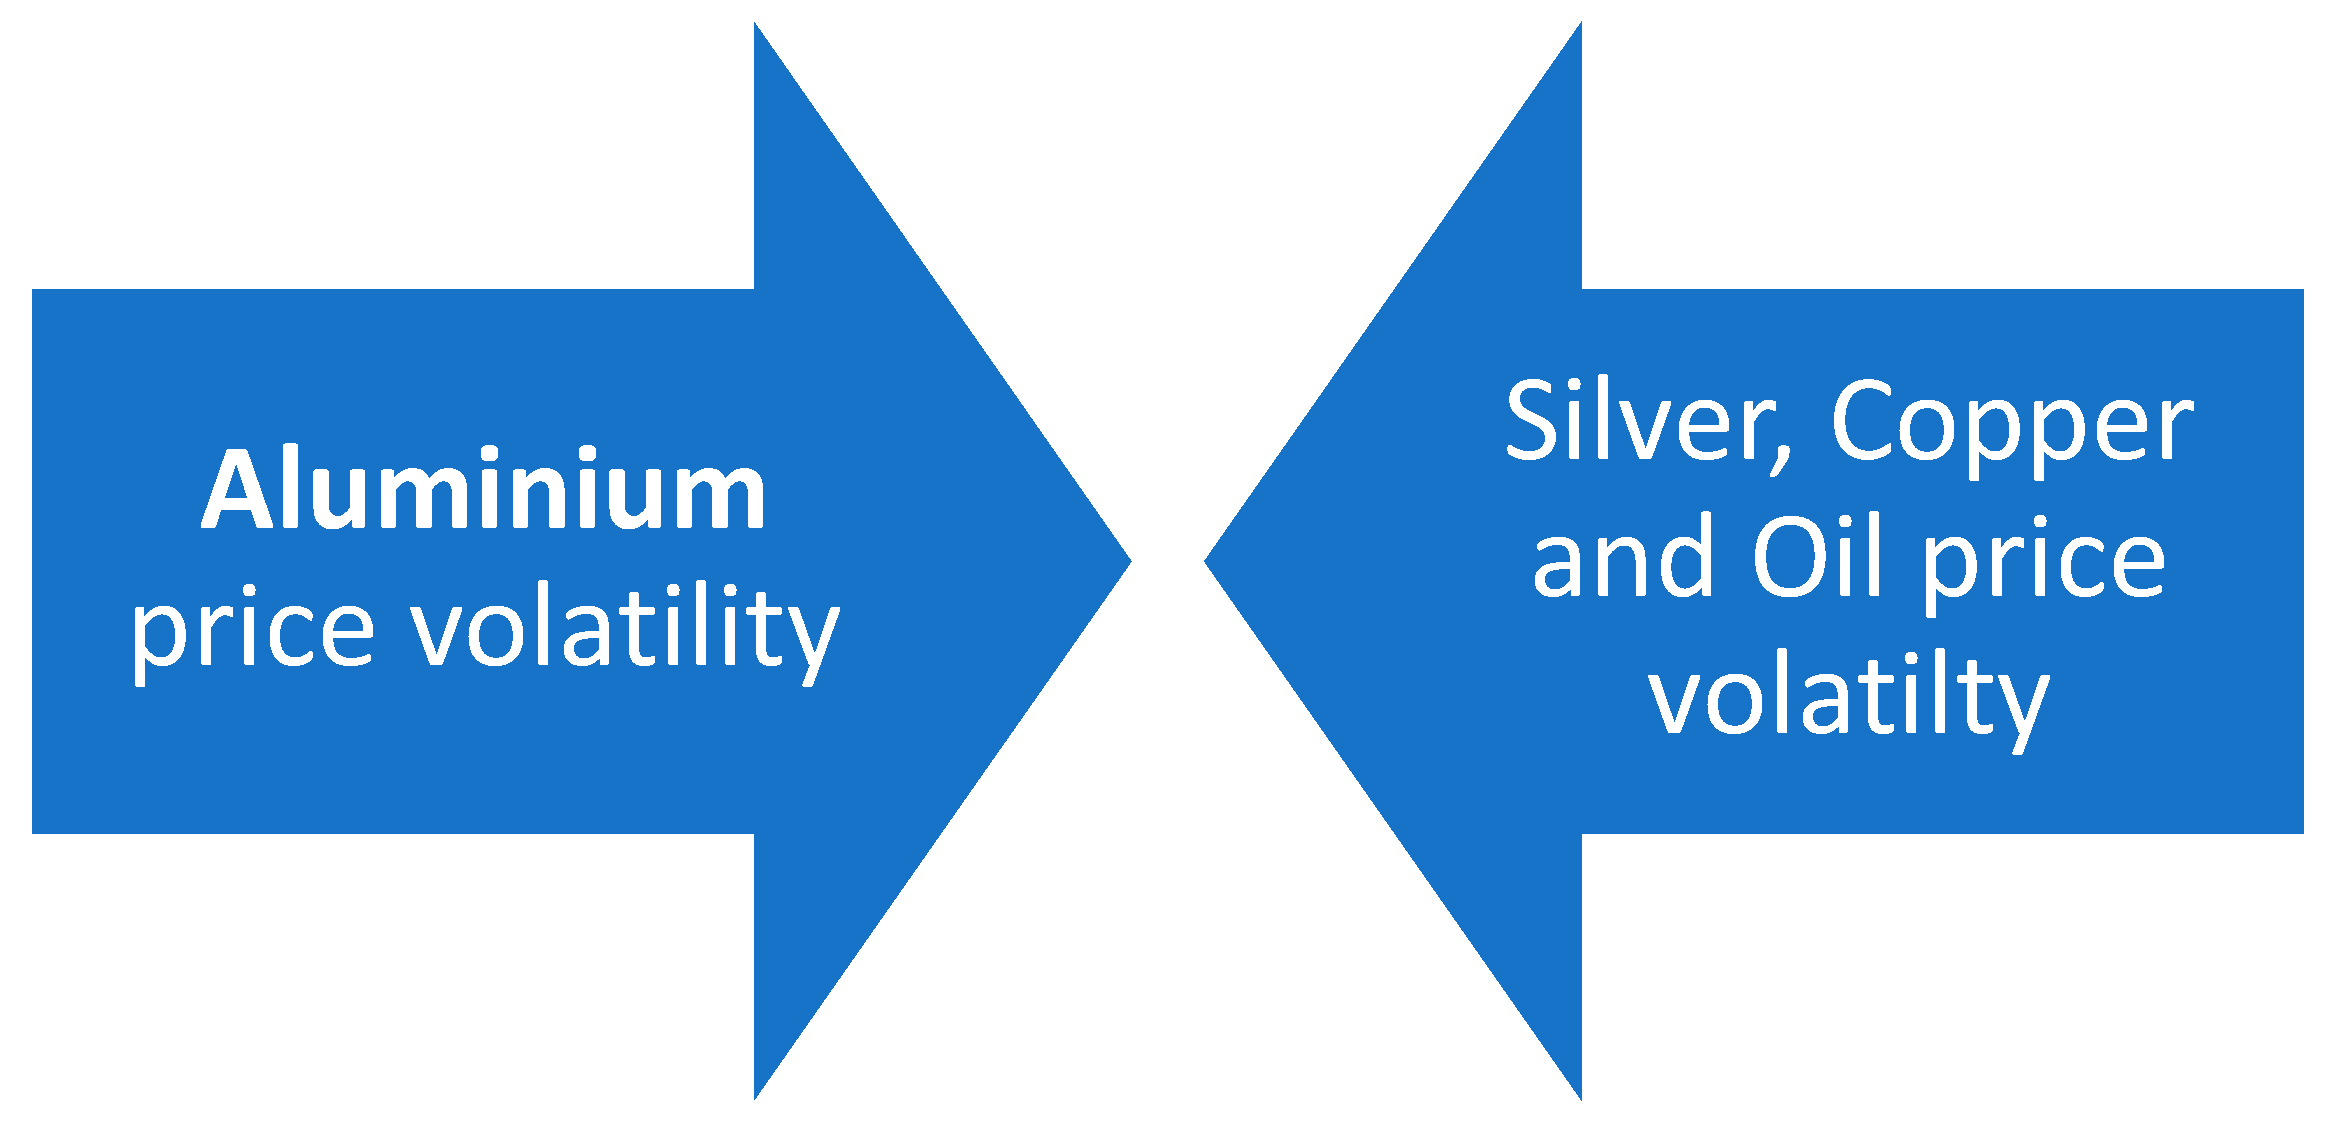
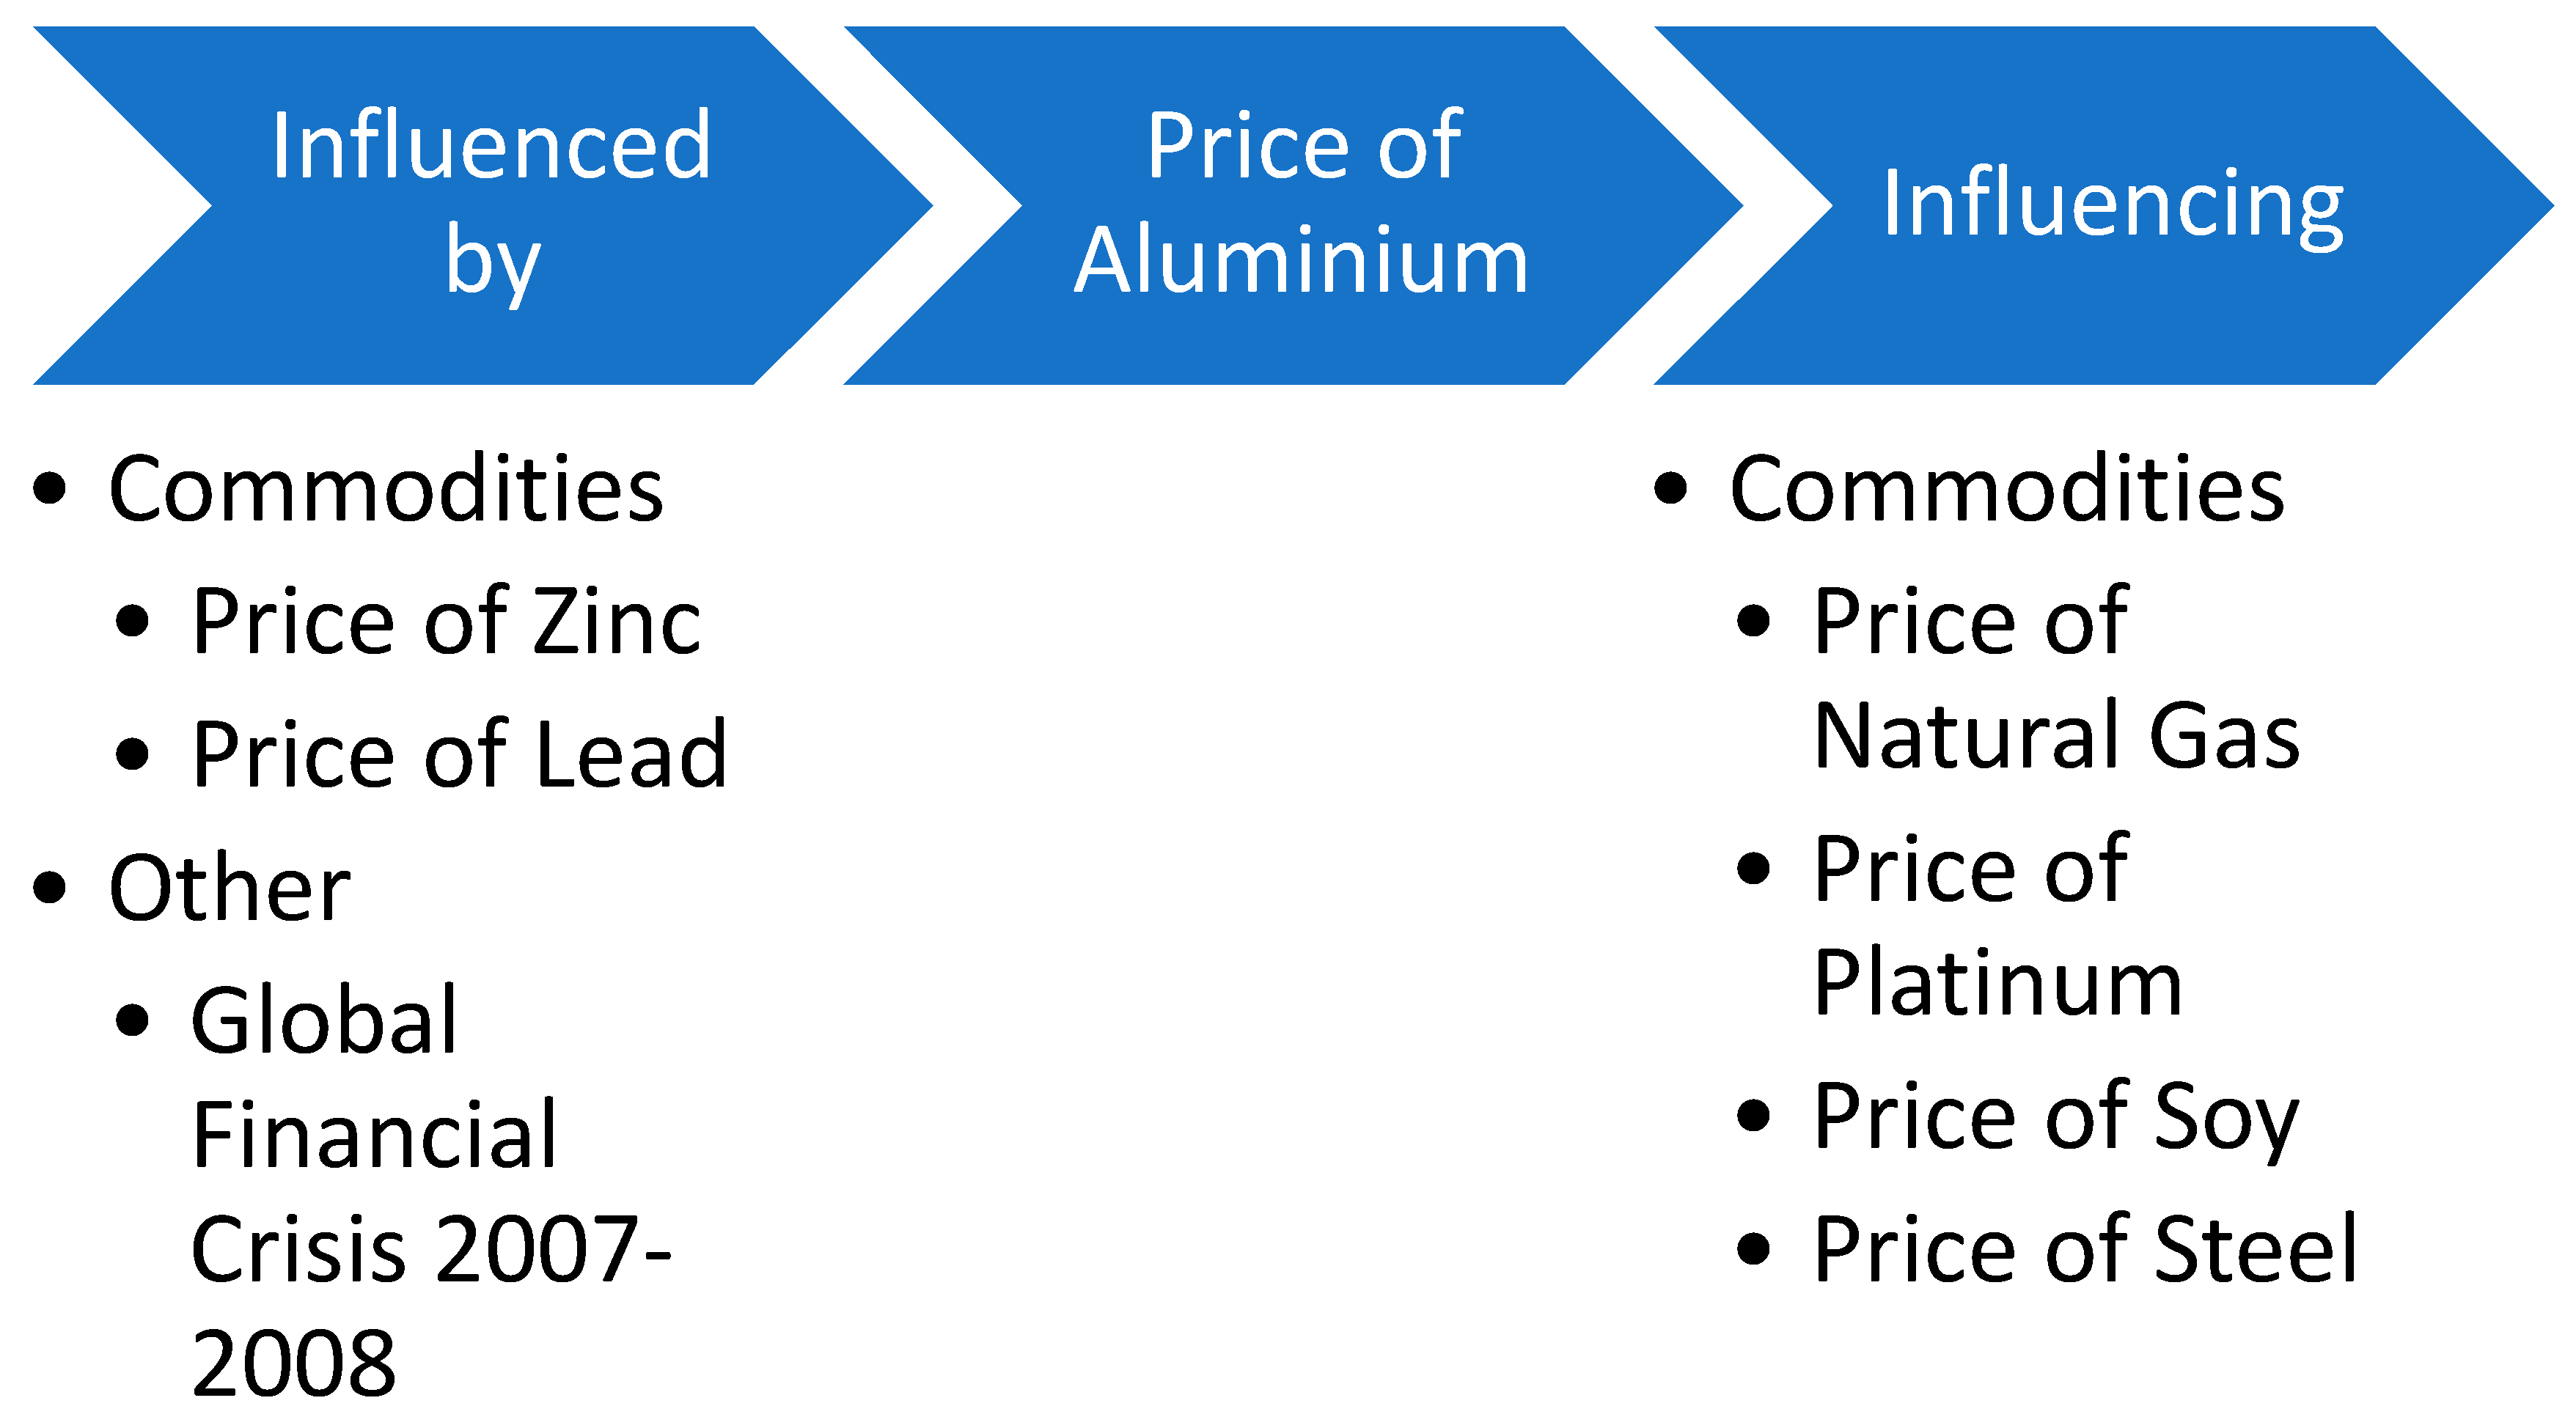
3.3. Aluminium
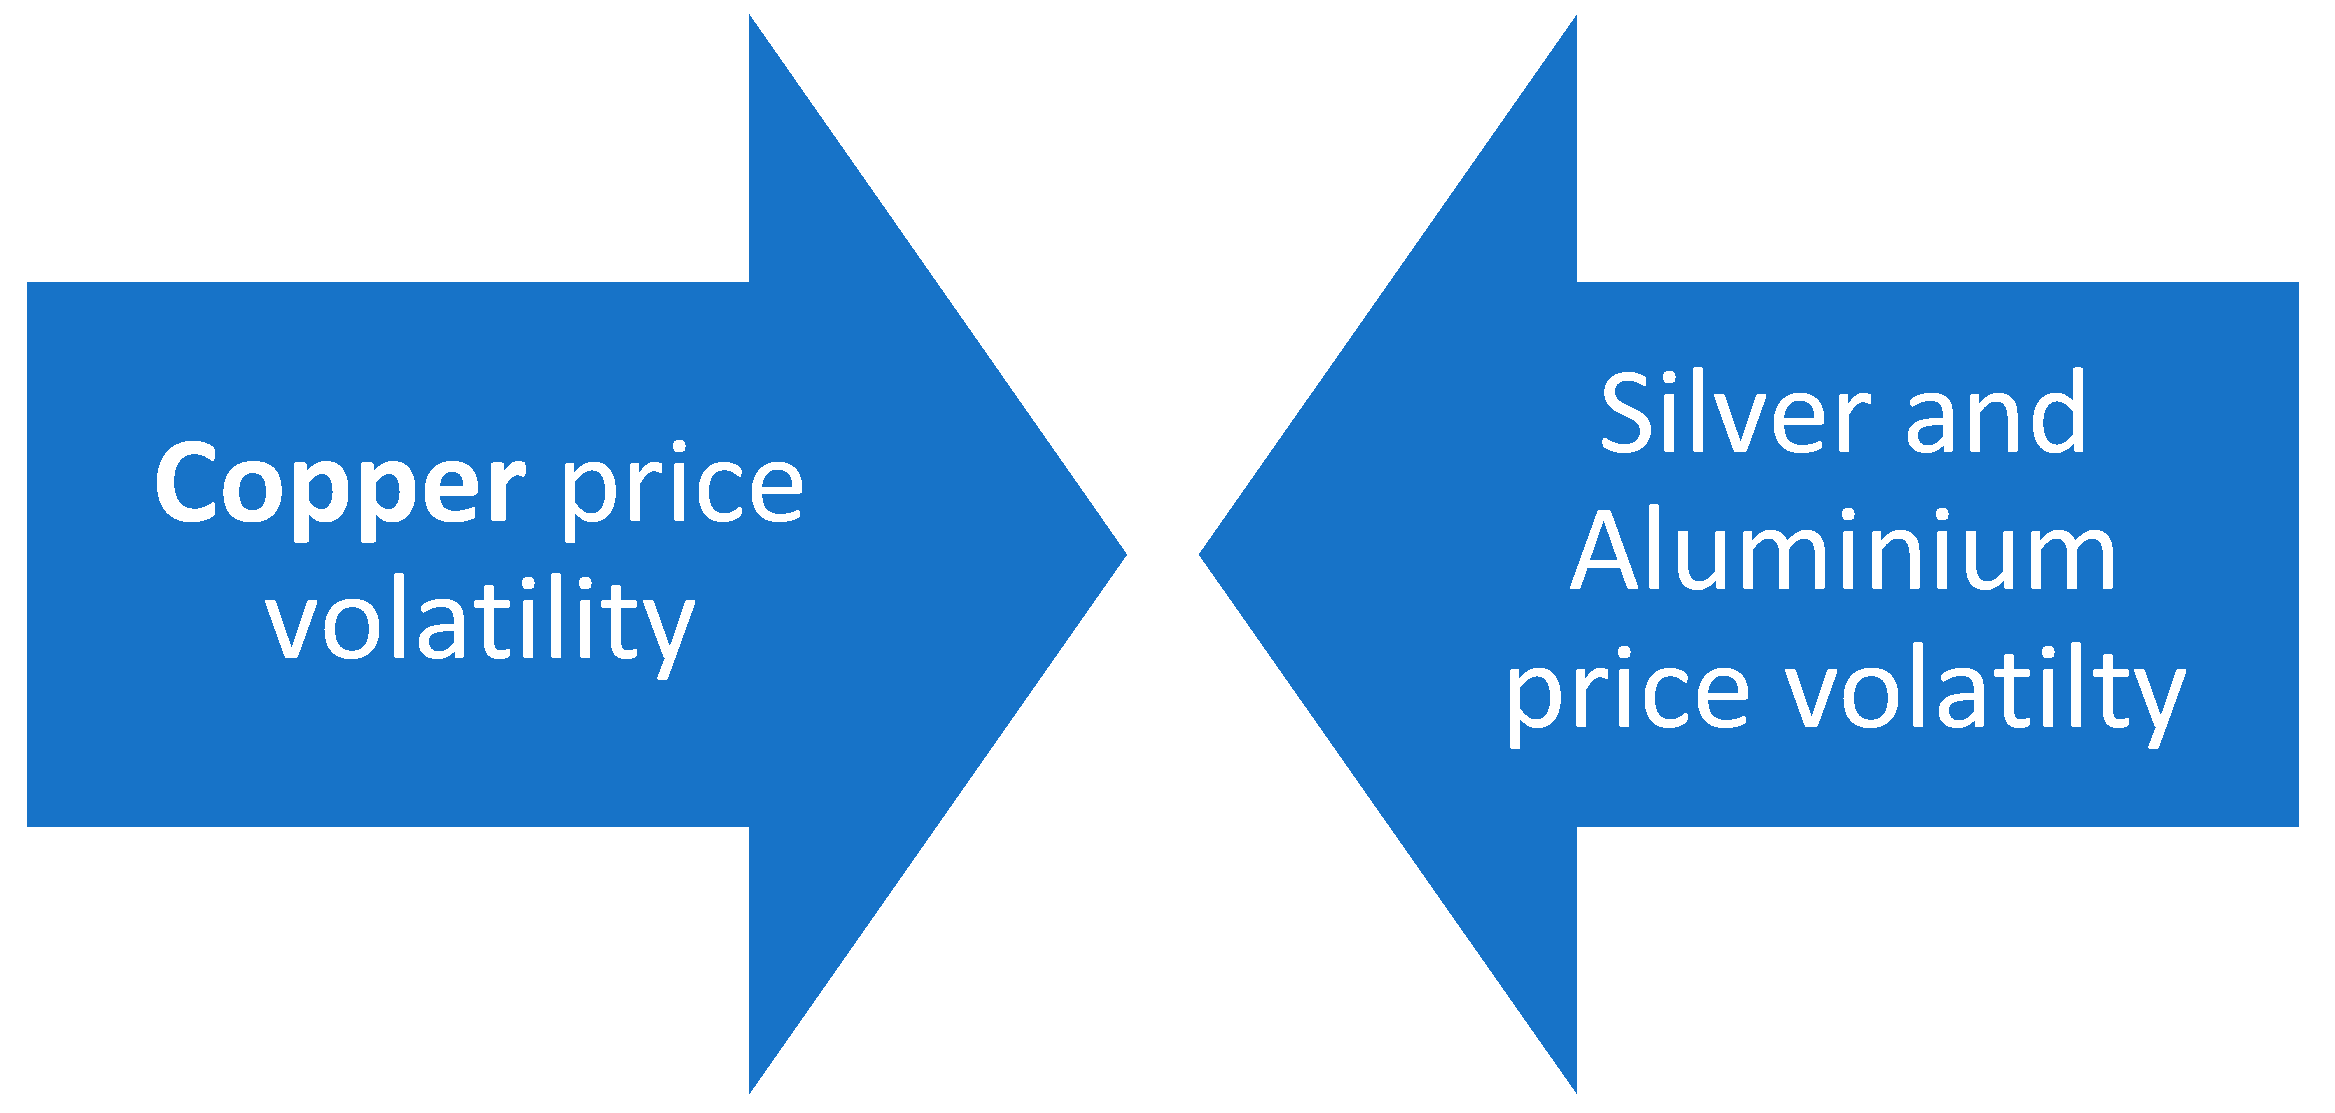
3.4. Copper
3.5. Platinum
3.6. Oil
3.7. Natural Gas
3.8. Soy
3.9. Corn
3.10. Wheat
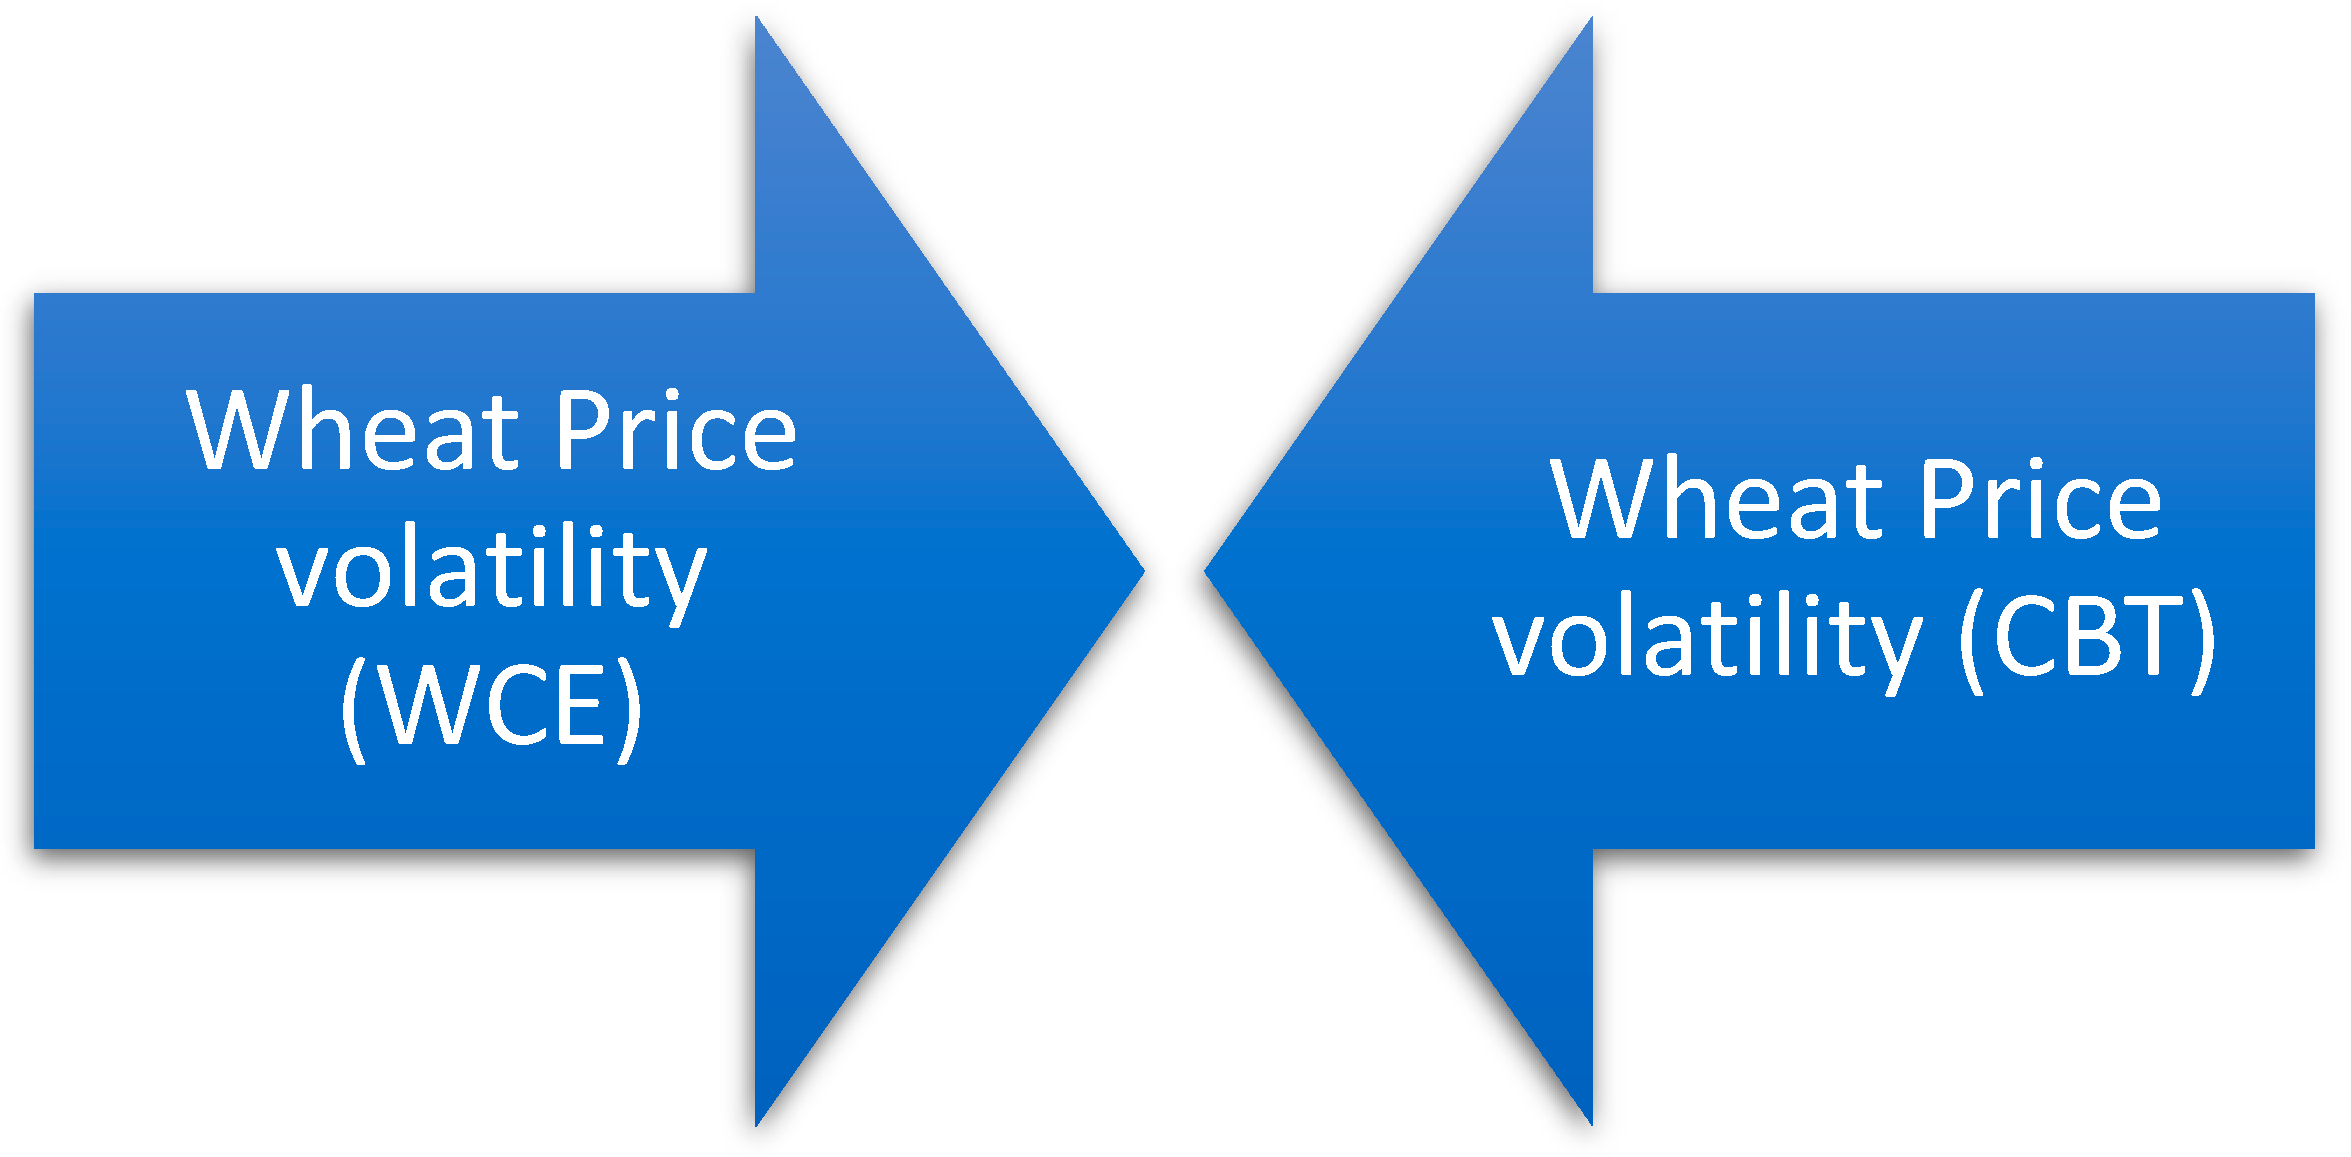
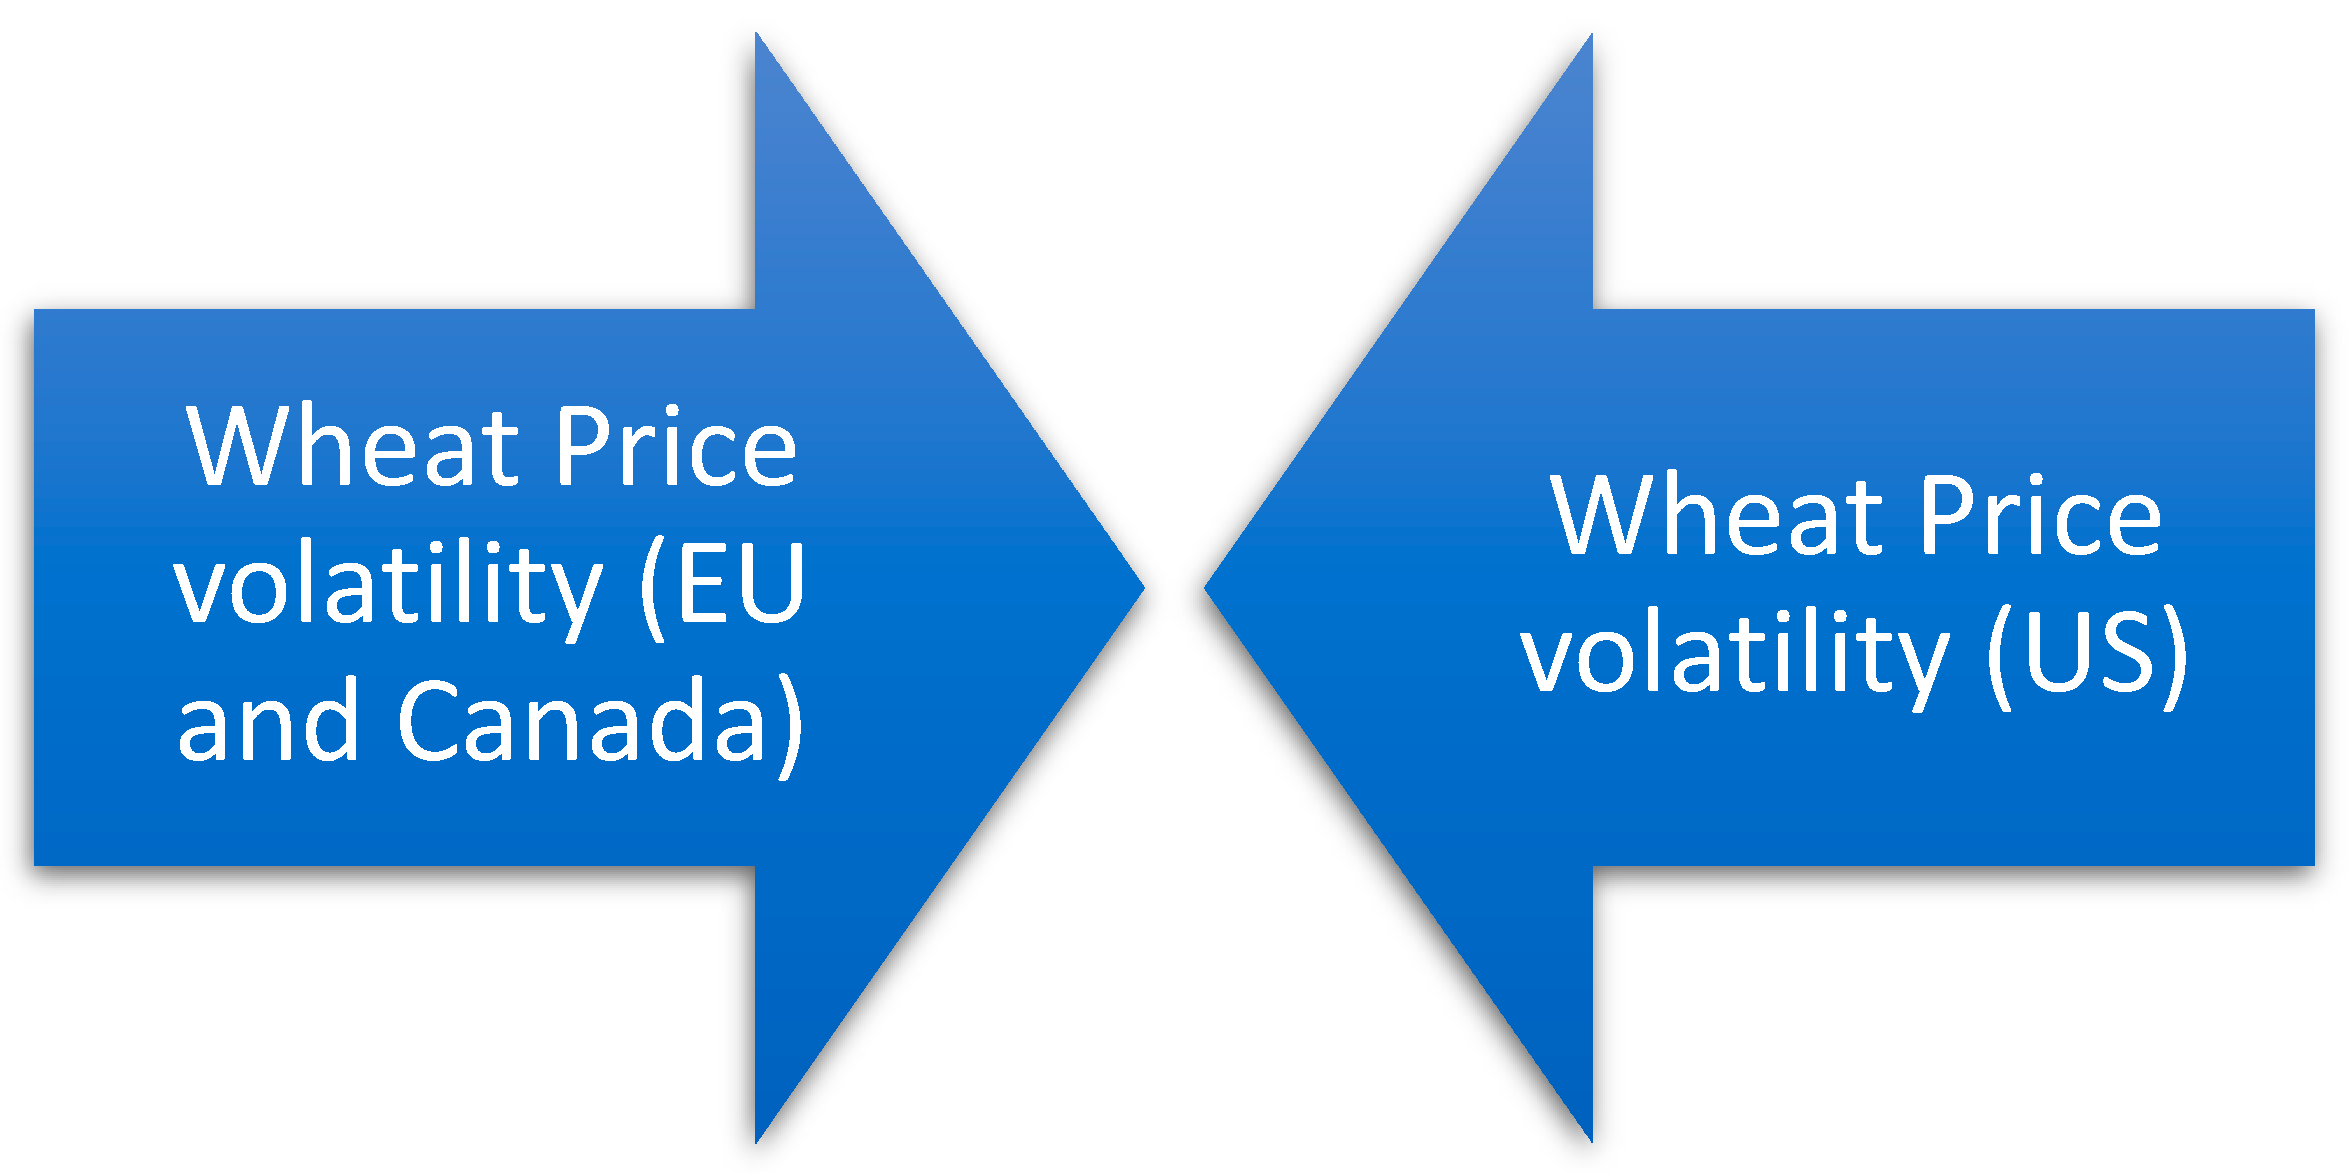
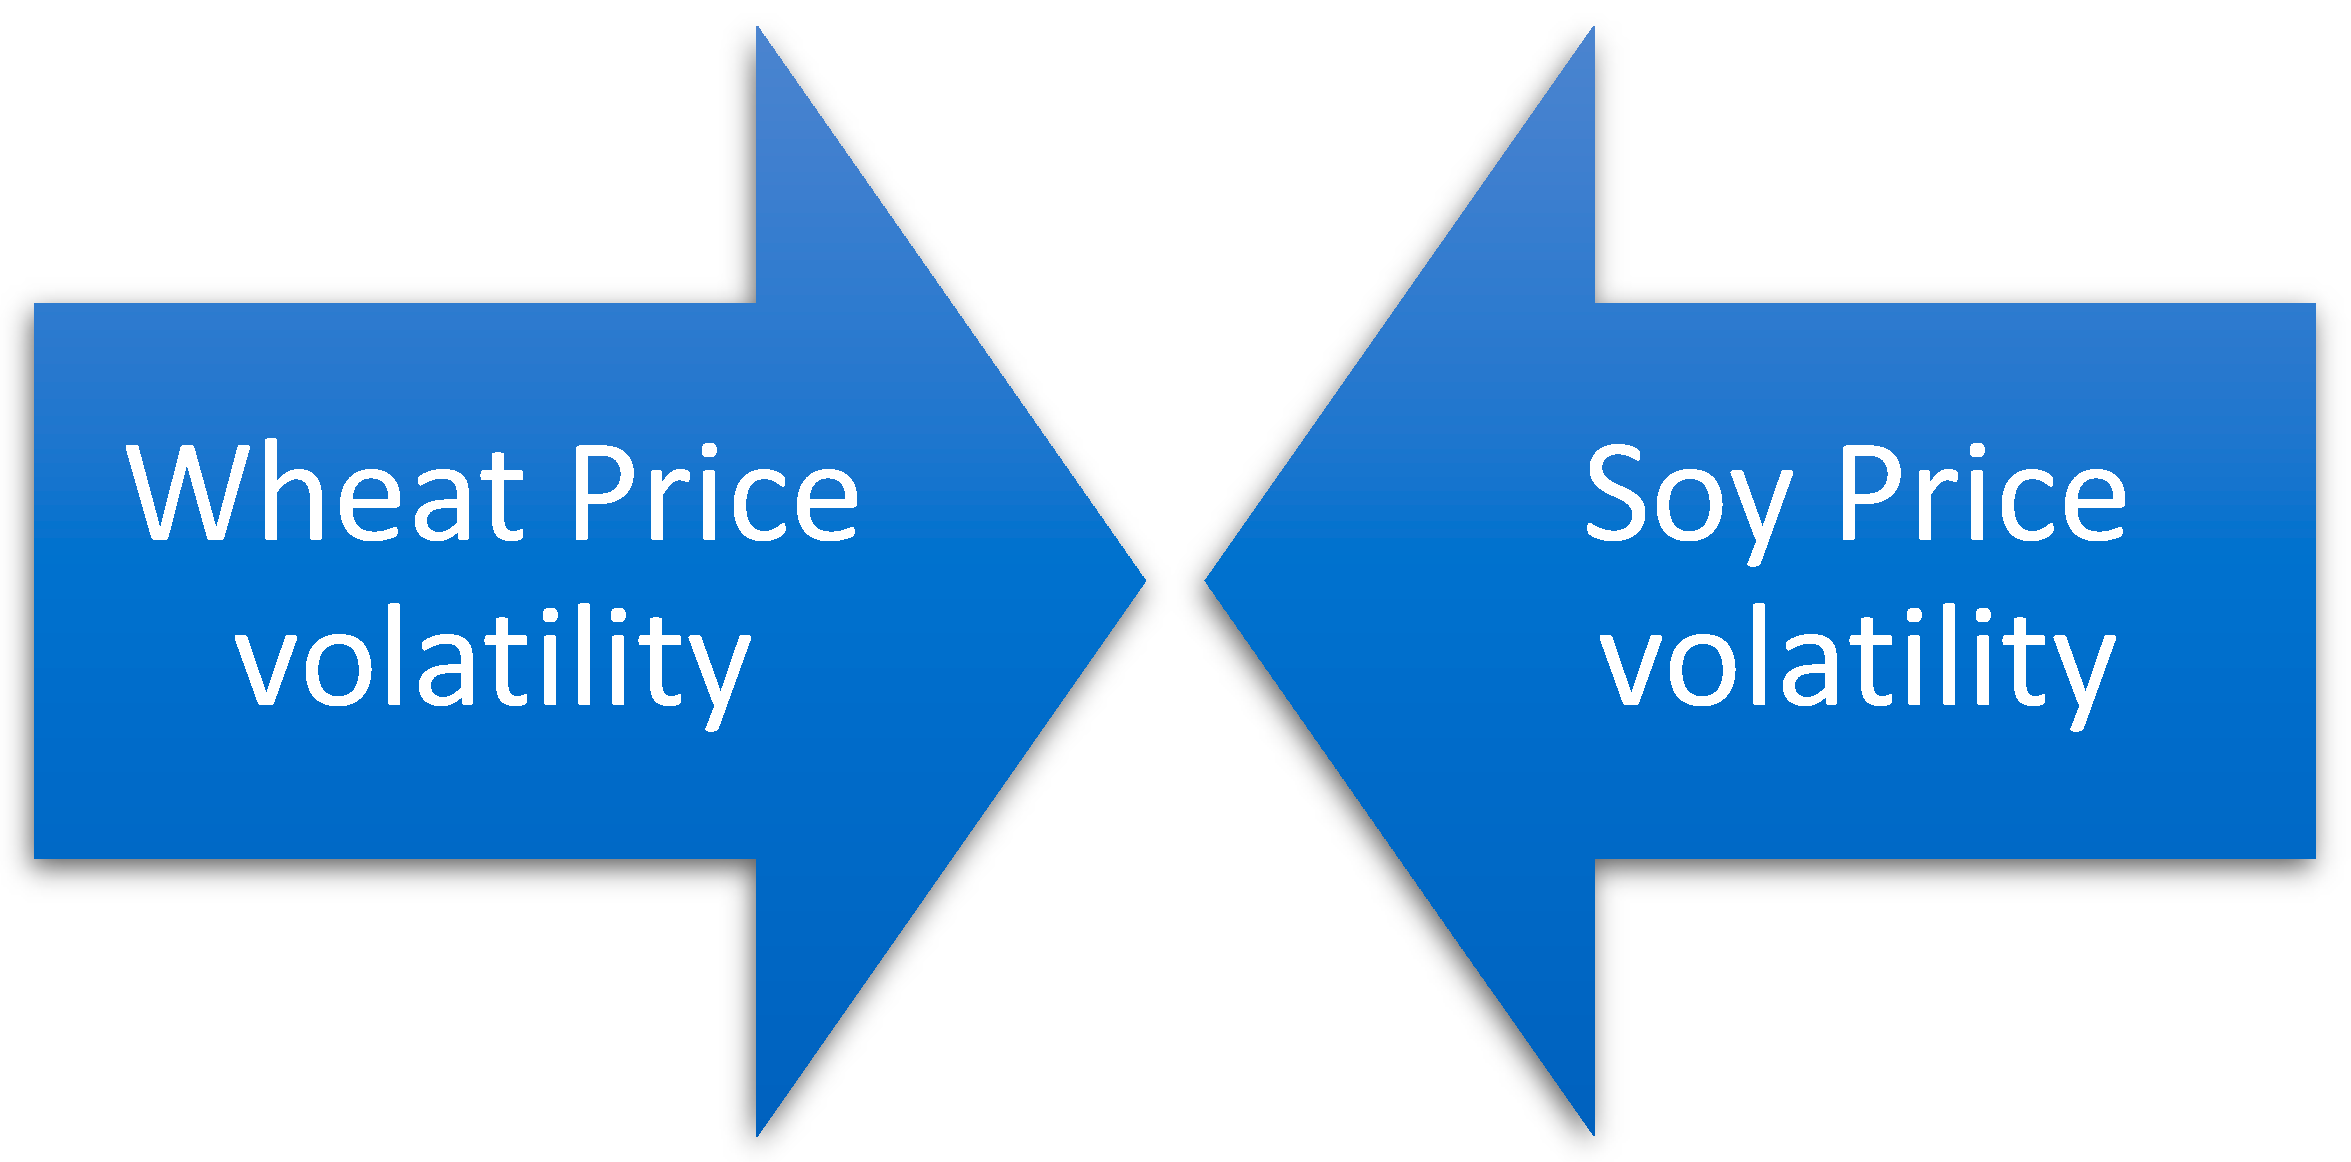
4. Conclusion
References
- Ågren, M. Does Oil Price Uncertainty Transmit to Stock Markets? Uppsala University, Department of Economics: Uppsala, 2006. [Google Scholar]
- Amara, N.; Landry, R. Counting citations in the field of business and management: Why use Google Scholar rather than the Web of Science. Scientometrics 2012, 93, 553–581. [Google Scholar] [CrossRef]
- An, H.; Qiu, F.; Zheng, Y. How do export controls affect price transmission and volatility spillovers in the Ukrainian wheat and flour markets? Food Policy 2016, 62, 142–150. [Google Scholar] [CrossRef]
- An, S.; Gao, X.; An, H.; An, F.; Sun, Q.; Liu, S. Windowed volatility spillover effects among crude oil prices. Energy 2020, 200, 1–15. [Google Scholar] [CrossRef]
- Antonakakis, N.; Kizys, R. Dynamic spillovers between commodity and currency markets. International Review of Financial Analysis 2015, 41, 303–319. [Google Scholar] [CrossRef]
- Arfaoui, N.; Yousaf, I.; Jareño, F. Return and volatility connectedness between gold and energy markets: Evidence from the pre-and post-COVID vaccination phases. Economic Analysis and Policy 2023, 77, 617–634. [Google Scholar] [CrossRef]
- Arouri, M.E.H.; Jouini, J.; Nguyen, D.K. On the impacts of oil price fluctuations on European equity markets: Volatility spillover and hedging effectiveness. Energy Economics 2012, 34, 611–617. [Google Scholar] [CrossRef]
- Ashfaq, S.; Tang, Y.; Maqbool, R. Volatility spillover impact of world oil prices on leading Asian energy exporting and importing economies’ stock returns. Energy 2019, 188. [Google Scholar] [CrossRef]
- Balcilar, M.; Ozdemir, Z.A.; Ozdemir, H. Dynamic return and volatility spillovers among S&P 500, crude oil, and gold. International Journal of Finance and Economics 2021, 26, 153–170. [Google Scholar]
- Basak, S.; Pavlova, A. A Model of Financialization of Commodities. Journal of Finance 2016, 71, 1511–1556. [Google Scholar] [CrossRef]
- Batten, J.A.; Ciner, C.; Lucey, B.M. The macroeconomic determinants of volatility in precious metals markets. Resources Policy 2010, 35, 65–71. [Google Scholar] [CrossRef]
- Batten, J.A.; Ciner, C.; Lucey, B.M. Which precious metals spill over on which, when, and why? Some evidence. Applied Economics Letters 2015, 22, 466–473. [Google Scholar] [CrossRef]
- Beckmann, J.; Czudaj, R. Volatility transmission in agricultural futures markets. Economic Modelling 2014, 36, 541–546. [Google Scholar] [CrossRef]
- Behmiri, N.B.; Manera, M. The role of outliers and oil price shocks on volatility of metal prices. Resources Policy 2015, 46, 139–150. [Google Scholar] [CrossRef]
- Bernhardt, M. 2017. Return and Volatility Spillover Effects in Agricultural Commodity Markets. Salzburg, No. 2017–03.
- Booth, G.G.; Brockman, P.; Tse, Y. The relationship between US and Canadian wheat futures. Applied Financial Economics 1998, 8, 73–80. [Google Scholar] [CrossRef]
- Bouri, E.; Jain, A.; Biswal, P.C.; Roubaud, D. Cointegration and nonlinear causality amongst gold, oil, and the Indian stock market: Evidence from implied volatility indices. Resources Policy 2017, 52, 201–206. [Google Scholar] [CrossRef]
- Broadstock, D.C.; Li, R.; Wang, L. Integration reforms in the European natural gas market: A rolling-window spillover analysis. Energy Economics 2020, 92. [Google Scholar] [CrossRef]
- Candila, V.; Farace, S. On the volatility spillover between agricultural commodities and Latin American stock markets. Risks 2018, 6. [Google Scholar] [CrossRef]
- Chang, C.L.; Mcaleer, M.; Wang, Y. Testing Co-Volatility spillovers for natural gas spot, futures, and ETF spot using dynamic conditional covariances. Energy 2018, 151, 984–997. [Google Scholar] [CrossRef]
- Charoenthammachoke, K.; Leelawat, N.; Tang, J.; Kodaka, A. Business continuity management: A preliminary systematic literature review based on ScienceDirect database. Journal of Disaster Research 2020. [Google Scholar] [CrossRef]
- Chen, Y.; Qu, F.; Li, W.; Chen, M. Volatility spillover and dynamic correlation between the carbon market and energy markets. Journal of Business Economics and Management 2019, 20, 979–999. [Google Scholar] [CrossRef]
- Chevallier, J.; Ielpo, F. Volatility spillovers in commodity markets. Applied Economics Letters 2013, 20, 1211–1227. [Google Scholar] [CrossRef]
- Dahl, R.E.; Oglend, A.; Yahya, M. Dynamics of volatility spillover in commodity markets: Linking crude oil to agriculture. Journal of Commodity Markets 2020, 20. [Google Scholar] [CrossRef]
- Dai, Z.; Zhu, H. Time-varying spillover effects and investment strategies between WTI crude oil, natural gas, and Chinese stock markets related to the Belt and Road initiative. Energy Economics 2022, 108. [Google Scholar] [CrossRef]
- Dhamija, A.K.; Yadav, S.S.; Jain, P. Volatility spillover of energy markets into EUA markets under EU ETS: a multi-phase study. Environmental Economics and Policy Studies 2018, 20, 561–591. [Google Scholar] [CrossRef]
- Du, X.; Yu, C.L.; Hayes, D.J. Speculation and volatility spillover in the crude oil and agricultural commodity markets: A Bayesian analysis. Energy Economics 2011, 33, 497–503. [Google Scholar] [CrossRef]
- Dutta, A. A note on the implied volatility spillovers between gold and silver markets. Resources Policy 2018, 55, 192–195. [Google Scholar] [CrossRef]
- Dutta, A. Impact of silver price uncertainty on solar energy firms. Journal of Cleaner Production 2019, 225, 1044–1051. [Google Scholar] [CrossRef]
- Etienne, X.L.; Trujillo-Barrera, A.; Hoffman, L.A. Volatility spillover and time-varying conditional correlation between DDGS, corn, and soybean meal markets. Agricultural and Resource Economics Review 2017, 46, 529–554. [Google Scholar] [CrossRef]
- Etienne, X.L.; Trujillo-Barrera, A.; Wiggins, S. Price and Volatility Transmissions between Natural Gas, Fertilizer, and Corn Markets. Agricultural Finance Review 2016, 76, 151–171. [Google Scholar] [CrossRef]
- Ewing, B.T.; Gormus, A.; Soytas, U. Risk Transmission from Oil and Natural Gas Futures to Emerging Market Mutual Funds. Emerging Markets Finance and Trade 2018, 54, 1828–1837. [Google Scholar] [CrossRef]
- Ewing, B.T.; Malik, F. Volatility transmission between gold and oil futures under structural breaks. International Review of Economics and Finance 2013, 25, 113–121. [Google Scholar] [CrossRef]
- Ewing, B.T.; Malik, F. Volatility spillovers between oil prices and the stock market under structural breaks. Global Finance Journal 2016, 29, 12–23. [Google Scholar] [CrossRef]
- Fung, H.G.; Leung, W.K.; Xu, X.E. Information Flows Between the U.S. and China Commodity Futures Trading. Review of Quantitative Finance and Accounting 2003. [Google Scholar] [CrossRef]
- Gao, R.; Zhao, Y.; Zhang, B. The spillover effects of economic policy uncertainty on the oil, gold, and stock markets: Evidence from China. International Journal of Finance and Economics 2021, 26, 2134–2141. [Google Scholar] [CrossRef]
- Geng, J.B.; Ji, Q.; Fan, Y. How regional natural gas markets have reacted to oil price shocks before and since the shale gas revolution: A multi-scale perspective. Journal of Natural Gas Science and Engineering 2016, 36, 734–746. [Google Scholar] [CrossRef]
- Geng, J.B.; Xu, X.Y.; Ji, Q. The time-frequency impacts of natural gas prices on US economic activity. Energy 2020, 205. [Google Scholar] [CrossRef]
- Gong, X.; Liu, Y.; Wang, X. Dynamic volatility spillovers across the oil and natural gas futures markets based on a time-varying spillover method. International Review of Financial Analysis 2021, 76. [Google Scholar] [CrossRef]
- Gong, X.; Xu, J.; Liu, T.; Zhou, Z. Dynamic volatility connectedness between industrial metal markets. North American Journal of Economics and Finance 2022, 63. [Google Scholar] [CrossRef]
- Guhathakurta, K.; Dash, S.R.; Maitra, D. Period-specific volatility spillover-based connectedness between oil and other commodity prices and their portfolio implications. Energy Economics 2020, 85. [Google Scholar] [CrossRef]
- Guo, J. Co-movement of international copper prices, China’s economic activity, and stock returns: Structural breaks and volatility dynamics. Global Finance Journal 2018, 36, 62–77. [Google Scholar] [CrossRef]
- Haixia, W.; Shiping, L. Volatility spillovers in China's crude oil, corn, and fuel ethanol markets. Energy Policy 2013, 62, 878–886. [Google Scholar] [CrossRef]
- Hamadi, H.; Bassil, C.; Nehme, T. News surprises and volatility spillover among agricultural commodities: The case of corn, wheat, soybean, and soybean oil. Research in International Business and Finance 2017, 41, 148–157. [Google Scholar] [CrossRef]
- Hammoudeh, S.M.; Yuan, Y.; Mcaleer, M.; Thompson, M.A. Precious metals-exchange rate volatility transmissions and hedging strategies. International Review of Economics and Finance 2010, 19, 633–647. [Google Scholar] [CrossRef]
- Hassouneh, I.; Serra, T.; Bojnec, Š.; Gil, J.M. Modeling price transmission and volatility spillover in the Slovenian wheat market. Applied Economics 2017, 49, 4116–4126. [Google Scholar] [CrossRef]
- He, X.; Takiguchi, T.; Nakajima, T.; Hamori, S. Spillover effects between energies, gold, and stock: the United States versus China. Energy and Environment 2020, 31, 1416–1447. [Google Scholar] [CrossRef]
- El Hedi Arouri, M.; Jouini, J.; Nguyen, D.K. Volatility spillovers between oil prices and stock sector return Implications for portfolio management. Journal of International Money and Finance 2011, 30, 1387–1405. [Google Scholar] [CrossRef]
- El Hedi Arouri, M.; Lahiani, A.; Nguyen, D.K. World gold prices and stock returns in China: Insights for hedging and diversification strategies. Economic Modelling 2015, 44, 273–282. [Google Scholar] [CrossRef]
- Hegerty, S.W. Commodity-price volatility and macroeconomic spillovers: Evidence from nine emerging markets. North American Journal of Economics and Finance 2016, 35, 23–37. [Google Scholar] [CrossRef]
- Hu, H.; Chen, D.; Sui, B.; Zhang, L.; Wang, Y. Price volatility spillovers between supply chain and innovation of financial pledges in China. Economic Modelling 2020, 89, 397–413. [Google Scholar] [CrossRef]
- Ji, Q.; Fan, Y. How does oil price volatility affect non-energy commodity markets? Applied Energy 2012, 89, 273–280. [Google Scholar] [CrossRef]
- Ji, Q.; Geng, J.B.; Tiwari, A.K. Information spillovers and connectedness networks in the oil and gas markets. Energy Economics 2018, 75, 71–84. [Google Scholar] [CrossRef]
- Jiang, J.; Marsh, T.L.; Tozer, P.R. Policy induced price volatility transmission: Linking the U.S. crude oil, corn, and plastics markets. Energy Economics 2015, 52, 217–227. [Google Scholar] [CrossRef]
- Jiang, S.; Li, Y.; Lu, Q.; Wang, S.; Wei, Y. Volatility communicator or receiver? Investigating volatility spillover mechanisms among Bitcoin and other financial markets. Research in International Business and Finance 2022, 59. [Google Scholar] [CrossRef]
- Kang, S.H.; Mciver, R.; Yoon, S.M. Dynamic spillover effects among crude oil, precious metal, and agricultural commodity futures markets. Energy Economics 2017, 62, 19–32. [Google Scholar] [CrossRef]
- Kang, S.H.; Yoon, S.M. Dynamic spillovers between Shanghai and London nonferrous metal futures markets. Finance Research Letters 2016, 19, 181–188. [Google Scholar] [CrossRef]
- Kang, S.H.; Yoon, S.M. Financial crises and dynamic spillovers among Chinese stock and commodity futures markets. Physica A: Statistical Mechanics and its Applications 2019, 531. [Google Scholar] [CrossRef]
- Karali, B.; Ramirez, O.A. Macro determinants of volatility and volatility spillover in energy markets. Energy Economics 2014, 46, 413–421. [Google Scholar] [CrossRef]
- Khalfaoui, R.; Sarwar, S.; Tiwari, A.K. Analyzing volatility spillover between the oil market and the stock market in oil-importing and oil-exporting countries: Implications on portfolio management. Resources Policy 2019, 62, 22–32. [Google Scholar] [CrossRef]
- Kumar, S.; Pradhan, A.K.; Tiwari, A.K.; Kang, S.H. Correlations and volatility spillovers between oil, natural gas, and stock prices in India. Resources Policy 2019, 62, 282–291. [Google Scholar] [CrossRef]
- Kumar, S.; Singh, G.; Kumar, A. Volatility spillover among prices of crude oil, natural gas, exchange rate, gold, and stock market: Fresh evidence from exponential generalized autoregressive conditional heteroscedastic model analysis. Journal of Public Affairs 2022, 22. [Google Scholar] [CrossRef]
- Lahiani, A.; Khuong Nguyen, D.; Vo, T. Understanding Return And Volatility Spillovers Among Major Agricultural Commodities. The Journal of Applied Business Research 2013, 29, 1781–1790. [Google Scholar] [CrossRef]
- Lee, H.B.; Park, C.H. Spillover effects in the global copper futures markets: asymmetric multivariate GARCH approaches. Applied Economics 2020, 52, 5909–5920. [Google Scholar] [CrossRef]
- Lin, B.; Li, J. The spillover effects across natural gas and oil markets: Based on the VEC-MGARCH framework. Applied Energy 2015, 155, 229–241. [Google Scholar] [CrossRef]
- Liu, X.; Cheng, S.; Wang, S.; Hong, Y.; Li, Y. An empirical study on information spillover effects between the Chinese copper futures market and spot market. Physica A: Statistical Mechanics and its Applications 2008, 387, 899–914. [Google Scholar] [CrossRef]
- Luo, J.; Ji, Q. High-frequency volatility connectedness between the US crude oil market and China’s agricultural commodity markets. Energy Economics 2018, 76, 424–438. [Google Scholar] [CrossRef]
- Ma, K.; Diao, G. Study on Spillover Effect between International Soybean Market and China’s Domestic Soybean Market. Ensayos Sobre Politica Economica 2017, 35, 260–266. [Google Scholar] [CrossRef]
- Maghyereh, A.I.; Awartani, B.; Tziogkidis, P. Volatility spillovers and cross-hedging between gold, oil, and equities: Evidence from the Gulf Cooperation Council countries. Energy Economics 2017, 68, 440–453. [Google Scholar] [CrossRef]
- Malik, F.; Hammoudeh, S. Shock and volatility transmission in the oil, US, and Gulf equity markets. International Review of Economics and Finance 2007, 16, 357–368. [Google Scholar] [CrossRef]
- Manisha, D. Study in Copper Price Linkage Between International and Indian Commodity Market. International Journal on Recent Trends in Business and Tourism 2017, 1, 49–53. [Google Scholar]
- Mensi, W.; Al-Yahyaee, K.H.; Hoon Kang, S. Time-varying volatility spillovers between stock and precious metal markets with portfolio implications. Resources Policy 2017, 53, 88–102. [Google Scholar] [CrossRef]
- Mensi, W.; Beljid, M.; Boubaker, A.; Managi, S. Correlations and volatility spillovers across commodity and stock markets: Linking energies, food, and gold. Economic Modelling 2013, 32, 15–22. [Google Scholar] [CrossRef]
- Mensi, W.; Hammoudeh, S.; Nguyen, D.K.; Yoon, S.M. Dynamic spillovers among major energy and cereal commodity prices. Energy Economics 2014, 43, 225–243. [Google Scholar] [CrossRef]
- Mensi, W.; Rehman, M.U.; Vo, X.V. Dynamic frequency relationships and volatility spillovers in natural gas, crude oil, gas oil, gasoline, and heating oil markets: Implications for portfolio management. Resources Policy 2021, 73. [Google Scholar] [CrossRef]
- Mensi, W.; Tiwari, A.; Bouri, E.; Roubaud, D.; Al-Yahyaee, K.H. The dependence structure across oil, wheat, and corn: A wavelet-based copula approach using implied volatility indexes. Energy Economics 2017, 66, 122–139. [Google Scholar] [CrossRef]
- Mensi, W.; Vo, X.V.; Kang, S.H. COVID-19 pandemic’s impact on intraday volatility spillover between oil, gold, and stock markets. Economic Analysis and Policy 2022, 74, 702–715. [Google Scholar] [CrossRef] [PubMed]
- Moher, D.; Liberati, A.; Tetzlaff, J.; Altman, D.G.; PRISMA Group. Preferred reporting items for systematic reviews and meta-analyses: the PRISMA statement. Annals of internal medicine 2009, 151, 264–269. [Google Scholar] [CrossRef] [PubMed]
- Nazlioglu, S.; Erdem, C.; Soytas, U. Volatility spillover between oil and agricultural commodity markets. Energy Economics 2013, 36, 658–665. [Google Scholar] [CrossRef]
- Nazlioglu, S.; Soytas, U.; Gupta, R. Oil prices and financial stress: A volatility spillover analysis. Energy Policy 2015, 82, 278–288. [Google Scholar] [CrossRef]
- Nekhili, R.; Mensi, W.; Vo, X.V. Multiscale spillovers and connectedness between gold, copper, oil, wheat, and currency markets. Resources Policy 2021, 74. [Google Scholar] [CrossRef]
- Oliyide, J.A.; Adekoya, O.B.; Khan, M.A. Economic policy uncertainty and the volatility connectedness between oil shocks and metal market: An extension. International Economics 2021, 167, 136–150. [Google Scholar] [CrossRef]
- Onour, I.A.; Sergi, B.S. Wheat and corn prices and energy markets: Spillover effects. International Journal of Business and Globalisation 2012, 9, 372–382. [Google Scholar] [CrossRef]
- Pandey, P. Price Discovery And Volatility Spillover In Spot And Futures: An Empirical Study Of Gold Market In India. Tactful Management Research Journal 2014, 2, 1–5. [Google Scholar]
- Pandey, V.; Vipul, V. Volatility spillover from crude oil and gold to BRICS equity markets. Journal of Economic Studies 2018, 45, 426–440. [Google Scholar] [CrossRef]
- Perifanis, T.; Dagoumas, A. Price and volatility spillovers between the US crude oil and natural gas wholesale markets. Energies 2018, 11. [Google Scholar] [CrossRef]
- Raza, N.; Jawad Hussain Shahzad, S.; Tiwari, A.K.; Shahbaz, M. Asymmetric impact of gold, oil prices, and their volatilities on stock prices of emerging markets. Resources Policy 2016, 49, 290–301. [Google Scholar] [CrossRef]
- Reboredo, J.C.; Ugolini, A. Downside/upside price spillovers between precious metals: A vine copula approach. North American Journal of Economics and Finance 2015, 34, 84–102. [Google Scholar] [CrossRef]
- Reboredo, J.C.; Ugolini, A. The impact of downward/upward oil price movements on metal prices. Resources Policy 2016, 49, 129–141. [Google Scholar] [CrossRef]
- Roy, R.P.; Sinha Roy, S. Financial contagion and volatility spillover: An exploration into Indian commodity derivative market. Economic Modelling 2017, 67, 368–380. [Google Scholar] [CrossRef]
- Saghaian, S.; Nemati, M.; Walters, C.; Chen, B. Asymmetric Price Volatility Transmission Between U.S. Biofuel, Corn, and Oil Markets. 2018.
- Sanjuán-López, A.I.; Dawson, P.J. Volatility Effects of Index Trading and Spillovers on US Agricultural Futures Markets: A Multivariate GARCH Approach. Journal of Agricultural Economics 2017, 68, 822–838. [Google Scholar] [CrossRef]
- Saunders, M.; Lewis, P.; And Thornhill, A. Research Methods for Business Students, 5th ed.; Pearson Education: London, 2009. [Google Scholar]
- Schindler, P. Business Research Methods, 14th ed.; McGraw-Hill Education: New York, 2021. [Google Scholar]
- Sehgal, S.; Rajput, N.; Deisting, F. Price Discovery and Volatility Spillover: Evidence from Indian Commodity Markets. The International Journal of Business and Finance Research 2013, 7, 57–75. [Google Scholar]
- Shen, J.; Huang, S. Copper cross-market volatility transition based on a coupled hidden Markov model and the complex network method. Resources Policy 2022, 75. [Google Scholar] [CrossRef]
- Siami - Namini, S.; Hudson, D. 2017. Volatility Spillover Between Oil Prices, US Dollar Exchange Rates, And International Agricultural Commodities Prices. Alabama, p. 1–50.
- Singh, A., Karali, B., and Ramirez, O., 2011. High Price Volatility and Spillover Effects in Energy Markets. Pittsburgh, p. 1–31.
- Soytas, U.; Oran, A. Volatility spillover from world oil spot markets to aggregate and electricity stock index returns in Turkey. Applied Energy 2011, 88, 354–360. [Google Scholar] [CrossRef]
- Sumner, S.; Johnson, R.; Soenen, L. Spillover effects among gold, stocks, and bonds. Journal of CENTRUM Cathedra: The Business and Economics Research Journal 2010, 3, 106–120. [Google Scholar] [CrossRef]
- Tiwari, A.K.; Mishra, B.R.; Solarin, S.A. Analyzing the spillovers between crude oil prices, stock prices, and metal prices: The importance of frequency domain in USA. Energy 2021, 220. [Google Scholar] [CrossRef]
- Tranfield, D.; Denyer, D.; Smart, P. Towards a Methodology for Developing Evidence-Informed Management Knowledge by Means of Systematic Review. British Journal of Management 2003. [Google Scholar] [CrossRef]
- Trujillo-Barrera, A.; Mallory, M.; Garcia, P. Western Agricultural Economics Association Volatility Spillovers in U.S. Crude Oil, Ethanol, and Corn Futures Markets Volatility Spillovers in U.S. Crude Oil, Ethanol, and Corn Futures Markets. Journal of Agricultural and Resource Economics, 2012. [Google Scholar]
- Uddin, G.S.; Shahzad, S.J.H.; Boako, G.; Hernandez, J.A.; Lucey, B.M. Heterogeneous interconnections between precious metals: Evidence from asymmetric and frequency-domain spillover analysis. Resources Policy 2019, 64. [Google Scholar] [CrossRef]
- Umar, Z.; Jareño, F.; Escribano, A. Oil price shocks and the return and volatility spillover between industrial and precious metals. Energy Economics 2021, 99. [Google Scholar] [CrossRef]
- United Nations Conference On Trade And Development, 2021. Commodities And Development Report 2021 : Escaping from the Commodity Dependence Trap through Technology and Innovation, UNITED NATIONS.
- Vardar, G.; Coşkun, Y.; Yelkenci, T. Shock transmission and volatility spillover in stock and commodity markets: evidence from advanced and emerging markets. Eurasian Economic Review 2018, 8, 231–288. [Google Scholar] [CrossRef]
- Wang, G.J.; Xie, C.; Jiang, Z.Q.; Stanley, H.E. Extreme risk spillover effects in world gold markets and the global financial crisis. International Review of Economics and Finance 2016, 46, 55–77. [Google Scholar] [CrossRef]
- Wang, Y.; Bouri, E.; Fareed, Z.; Dai, Y. Geopolitical risk and the systemic risk in the commodity markets under the war in Ukraine. Finance Research Letters 2022, 49. [Google Scholar] [CrossRef]
- Wu, F.; Guan, Z.; Myers, R.J. Volatility spillover effects and cross hedging in corn and crude oil futures. Journal of Futures Markets 2011, 31, 1052–1075. [Google Scholar] [CrossRef]
- Wu, Q.; Wang, M.; Tian, L. The market-linkage of the volatility spillover between traditional energy price and carbon price on the realization of carbon value of emission reduction behavior. Journal of Cleaner Production 2020, 245. [Google Scholar] [CrossRef]
- Xu, W.; Ma, F.; Chen, W.; Zhang, B. Asymmetric volatility spillovers between oil and stock markets: Evidence from China and the United States. Energy Economics 2019, 80, 310–320. [Google Scholar] [CrossRef]
- Xu, X.E.; Fung, H.G. Cross-market linkages between U.S. and Japanese precious metals futures trading. Journal of International Financial Markets, Institutions and Money 2005, 15, 107–124. [Google Scholar] [CrossRef]
- Yang, J.; Zhang, J.; Leatham, D.J. Price and Volatility Transmission in International Wheat Futures Markets . ANNALS OF ECONOMICS AND FINANCE 2003. [Google Scholar]
- Yang, Z.; Du, X.; Lu, L.; Tejeda, H. Price and Volatility Transmissions among Natural Gas, Fertilizer, and Corn Markets: A Revisit. Journal of Risk and Financial Management 2022, 15. [Google Scholar] [CrossRef]
- Yin, L.; Han, L. Exogenous Shocks and Information Transmission in Global Copper Futures Markets. Journal of Futures Markets 2013, 33, 724–751. [Google Scholar] [CrossRef]
- Yip, P.S.; Brooks, R.; Do, H.X.; Nguyen, D.K. Dynamic volatility spillover effects between oil and agricultural products. International Review of Financial Analysis 2020, 69. [Google Scholar] [CrossRef]
- Yosthongngam, S.; Tansuchat, R.; Yamaka, W. Volatility spillovers between ethanol and corn prices: A Bayesian analysis. Energy Reports 2022, 8, 1030–1037. [Google Scholar] [CrossRef]
- Zhang, B.; Wang, P. Return and volatility spillovers between China and world oil markets. Economic Modelling 2014, 42, 413–420. [Google Scholar] [CrossRef]
- Zhang, C.; Tu, X. The effect of global oil price shocks on China’s metal markets. Energy Policy 2016, 90, 131–139. [Google Scholar] [CrossRef]
- Zhang, W.; He, X.; Nakajima, T.; Hamori, S. How does the spillover among natural gas, crude oil, and electricity utility stocks change over time? Evidence from North America and Europe. Energies 2020, 13. [Google Scholar] [CrossRef]
- Zhang, Y.; Liu, L. The lead-lag relationships between spot and futures prices of natural gas. Physica A: Statistical Mechanics and its Applications 2018, 490, 203–211. [Google Scholar] [CrossRef]
- Zhang, Y.J.; Sun, Y.F. The dynamic volatility spillover between the European carbon trading market and the fossil energy market. Journal of Cleaner Production 2016, 112, 2654–2663. [Google Scholar] [CrossRef]
- Zhao, J.; Goodwin, B.K. 2011. Volatility Spillovers in Agricultural Commodity Markets: An Application Involving Implied Volatilities from Options Markets, Pennsylvania.
- Zhao, Y.; Yang, M.; Zhang, Y.; Qi, C. Impact on the Chinese soybean markets from international prices volatility: Empirical study based on VEC model. African Journal of Agricultural Research 2010, 5, 1943–1950. [Google Scholar]
- Zhong, J.; Wang, M.; M Drakeford, B.; Li, T. Spillover effects between oil and natural gas prices: Evidence from emerging and developed markets. Green Finance 2019, 1, 30–45. [Google Scholar] [CrossRef]
- Zhu, F.; Zhu, Y.; Jin, X.; Luo, X. Do spillover effects between crude oil and natural gas markets disappear? Evidence from options markets. Finance Research Letters 2018, 24, 25–33. [Google Scholar] [CrossRef]
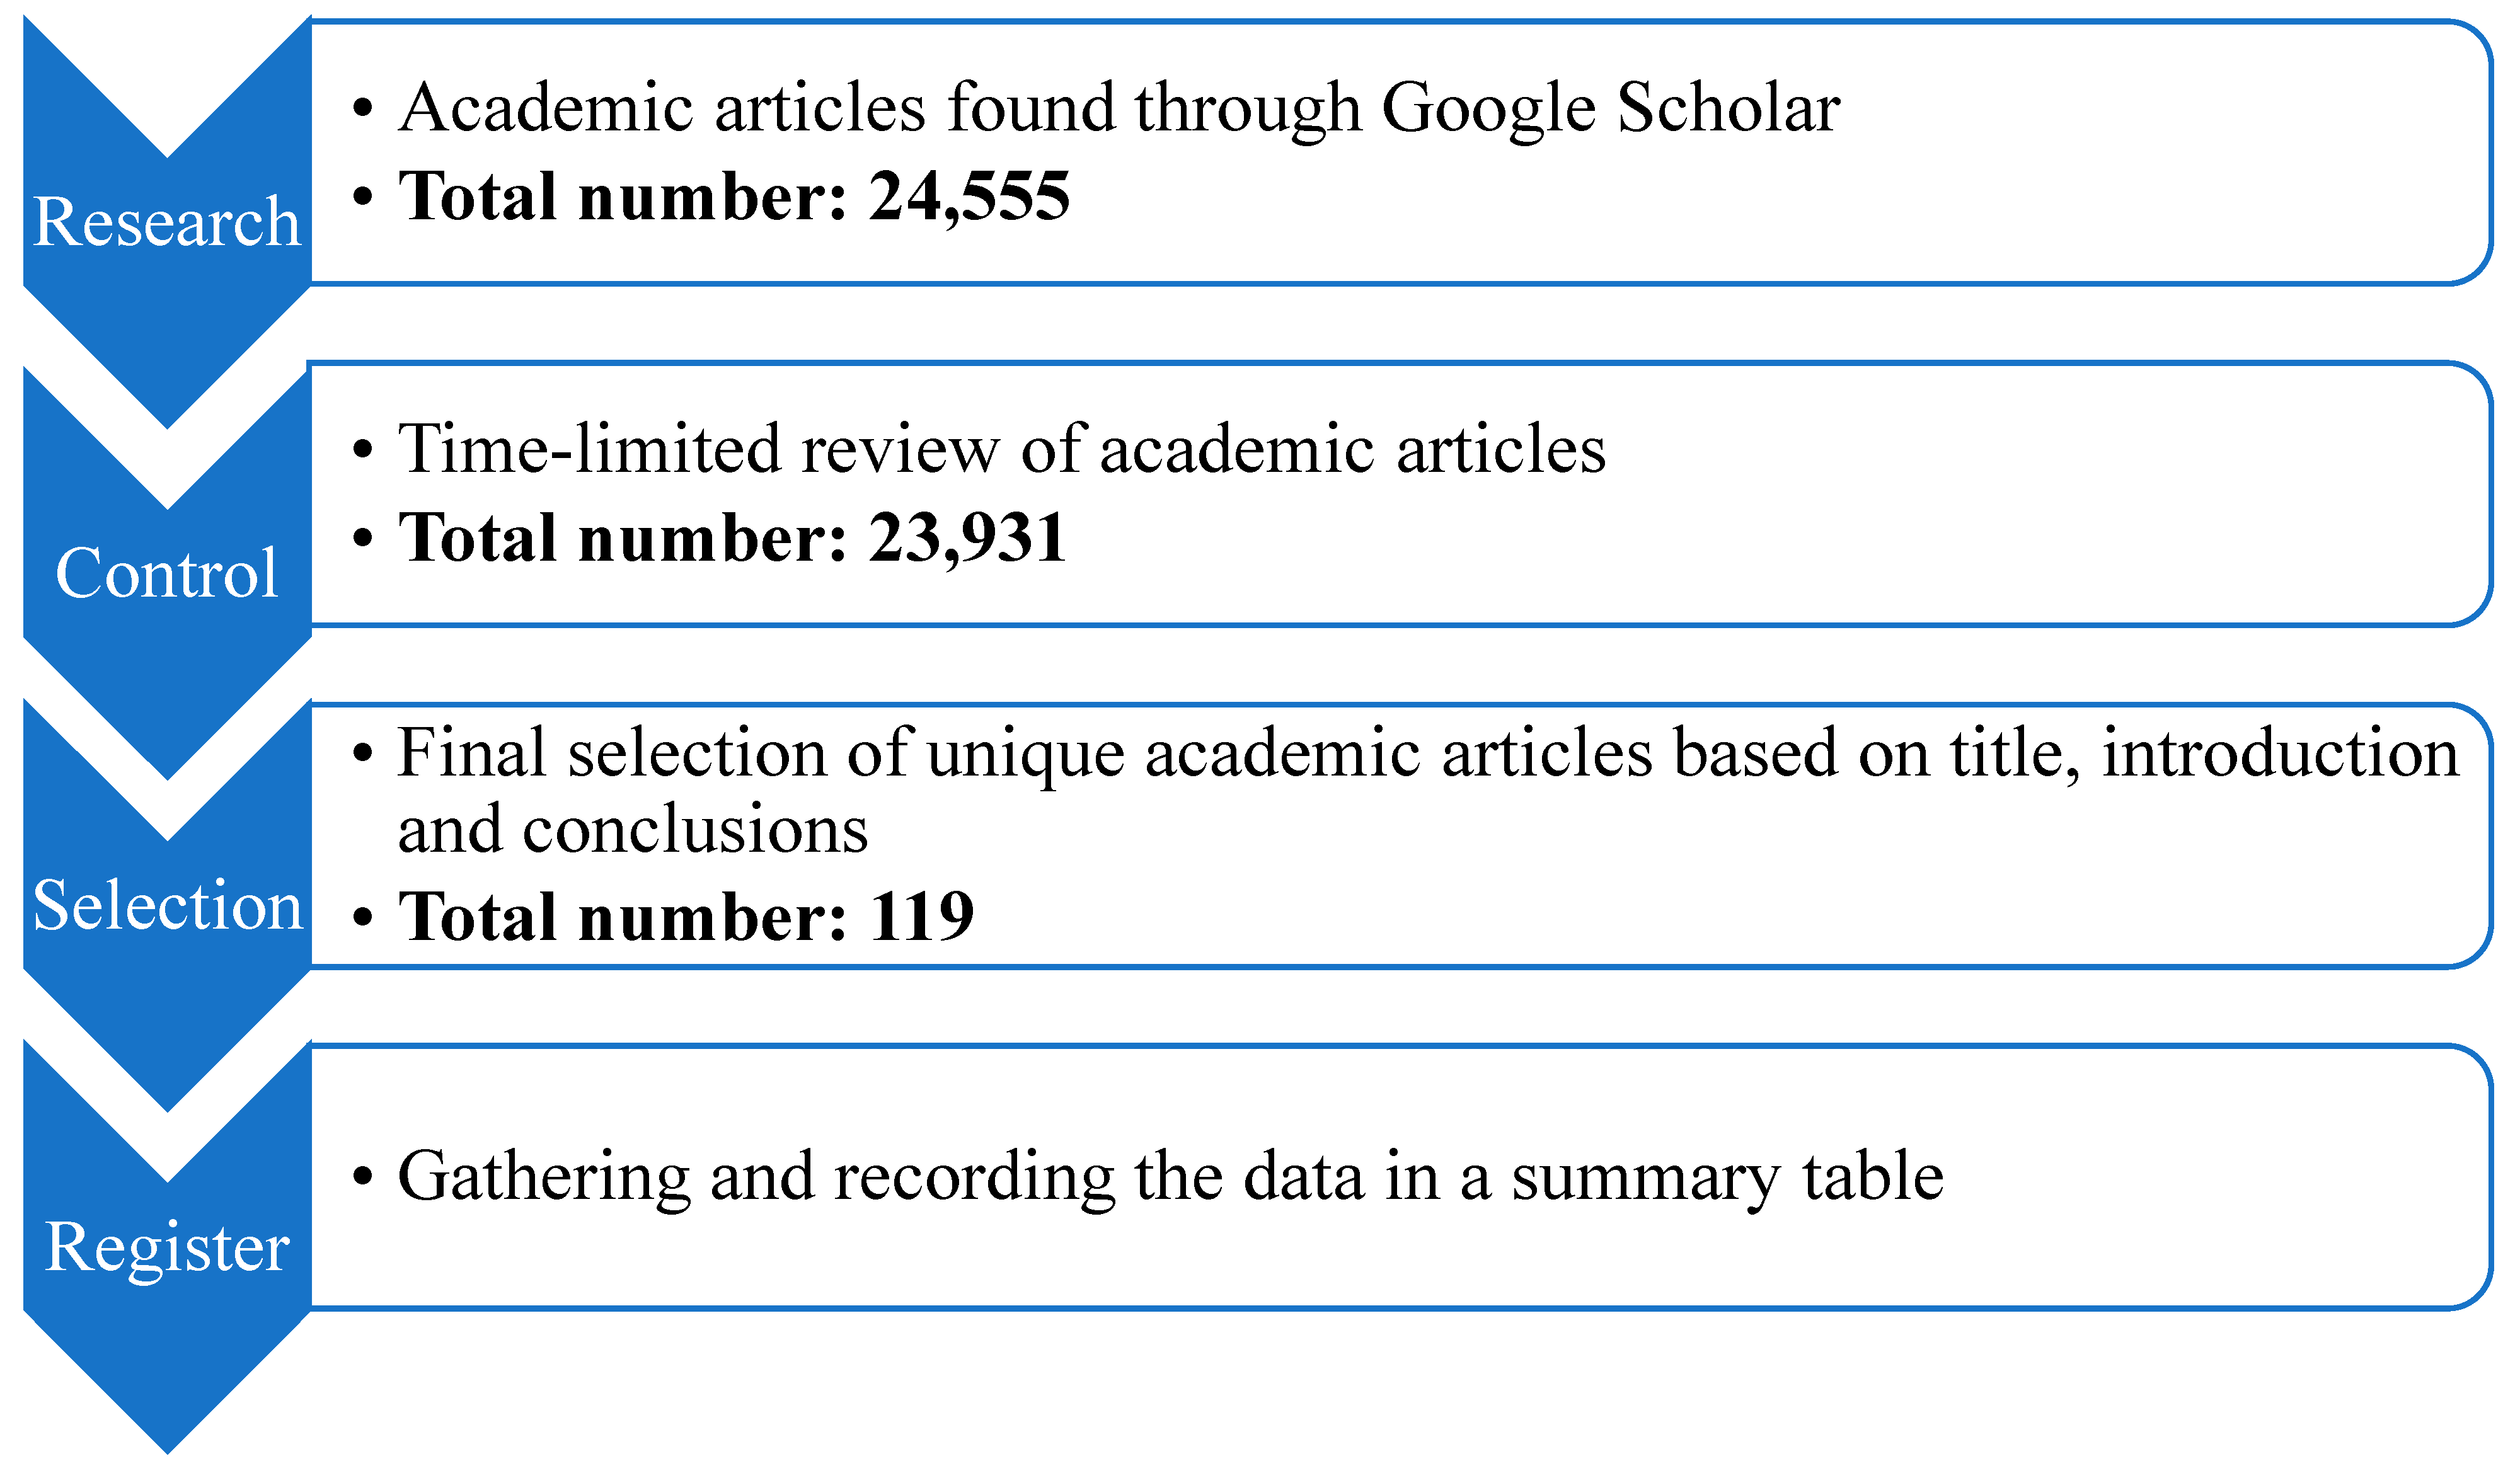
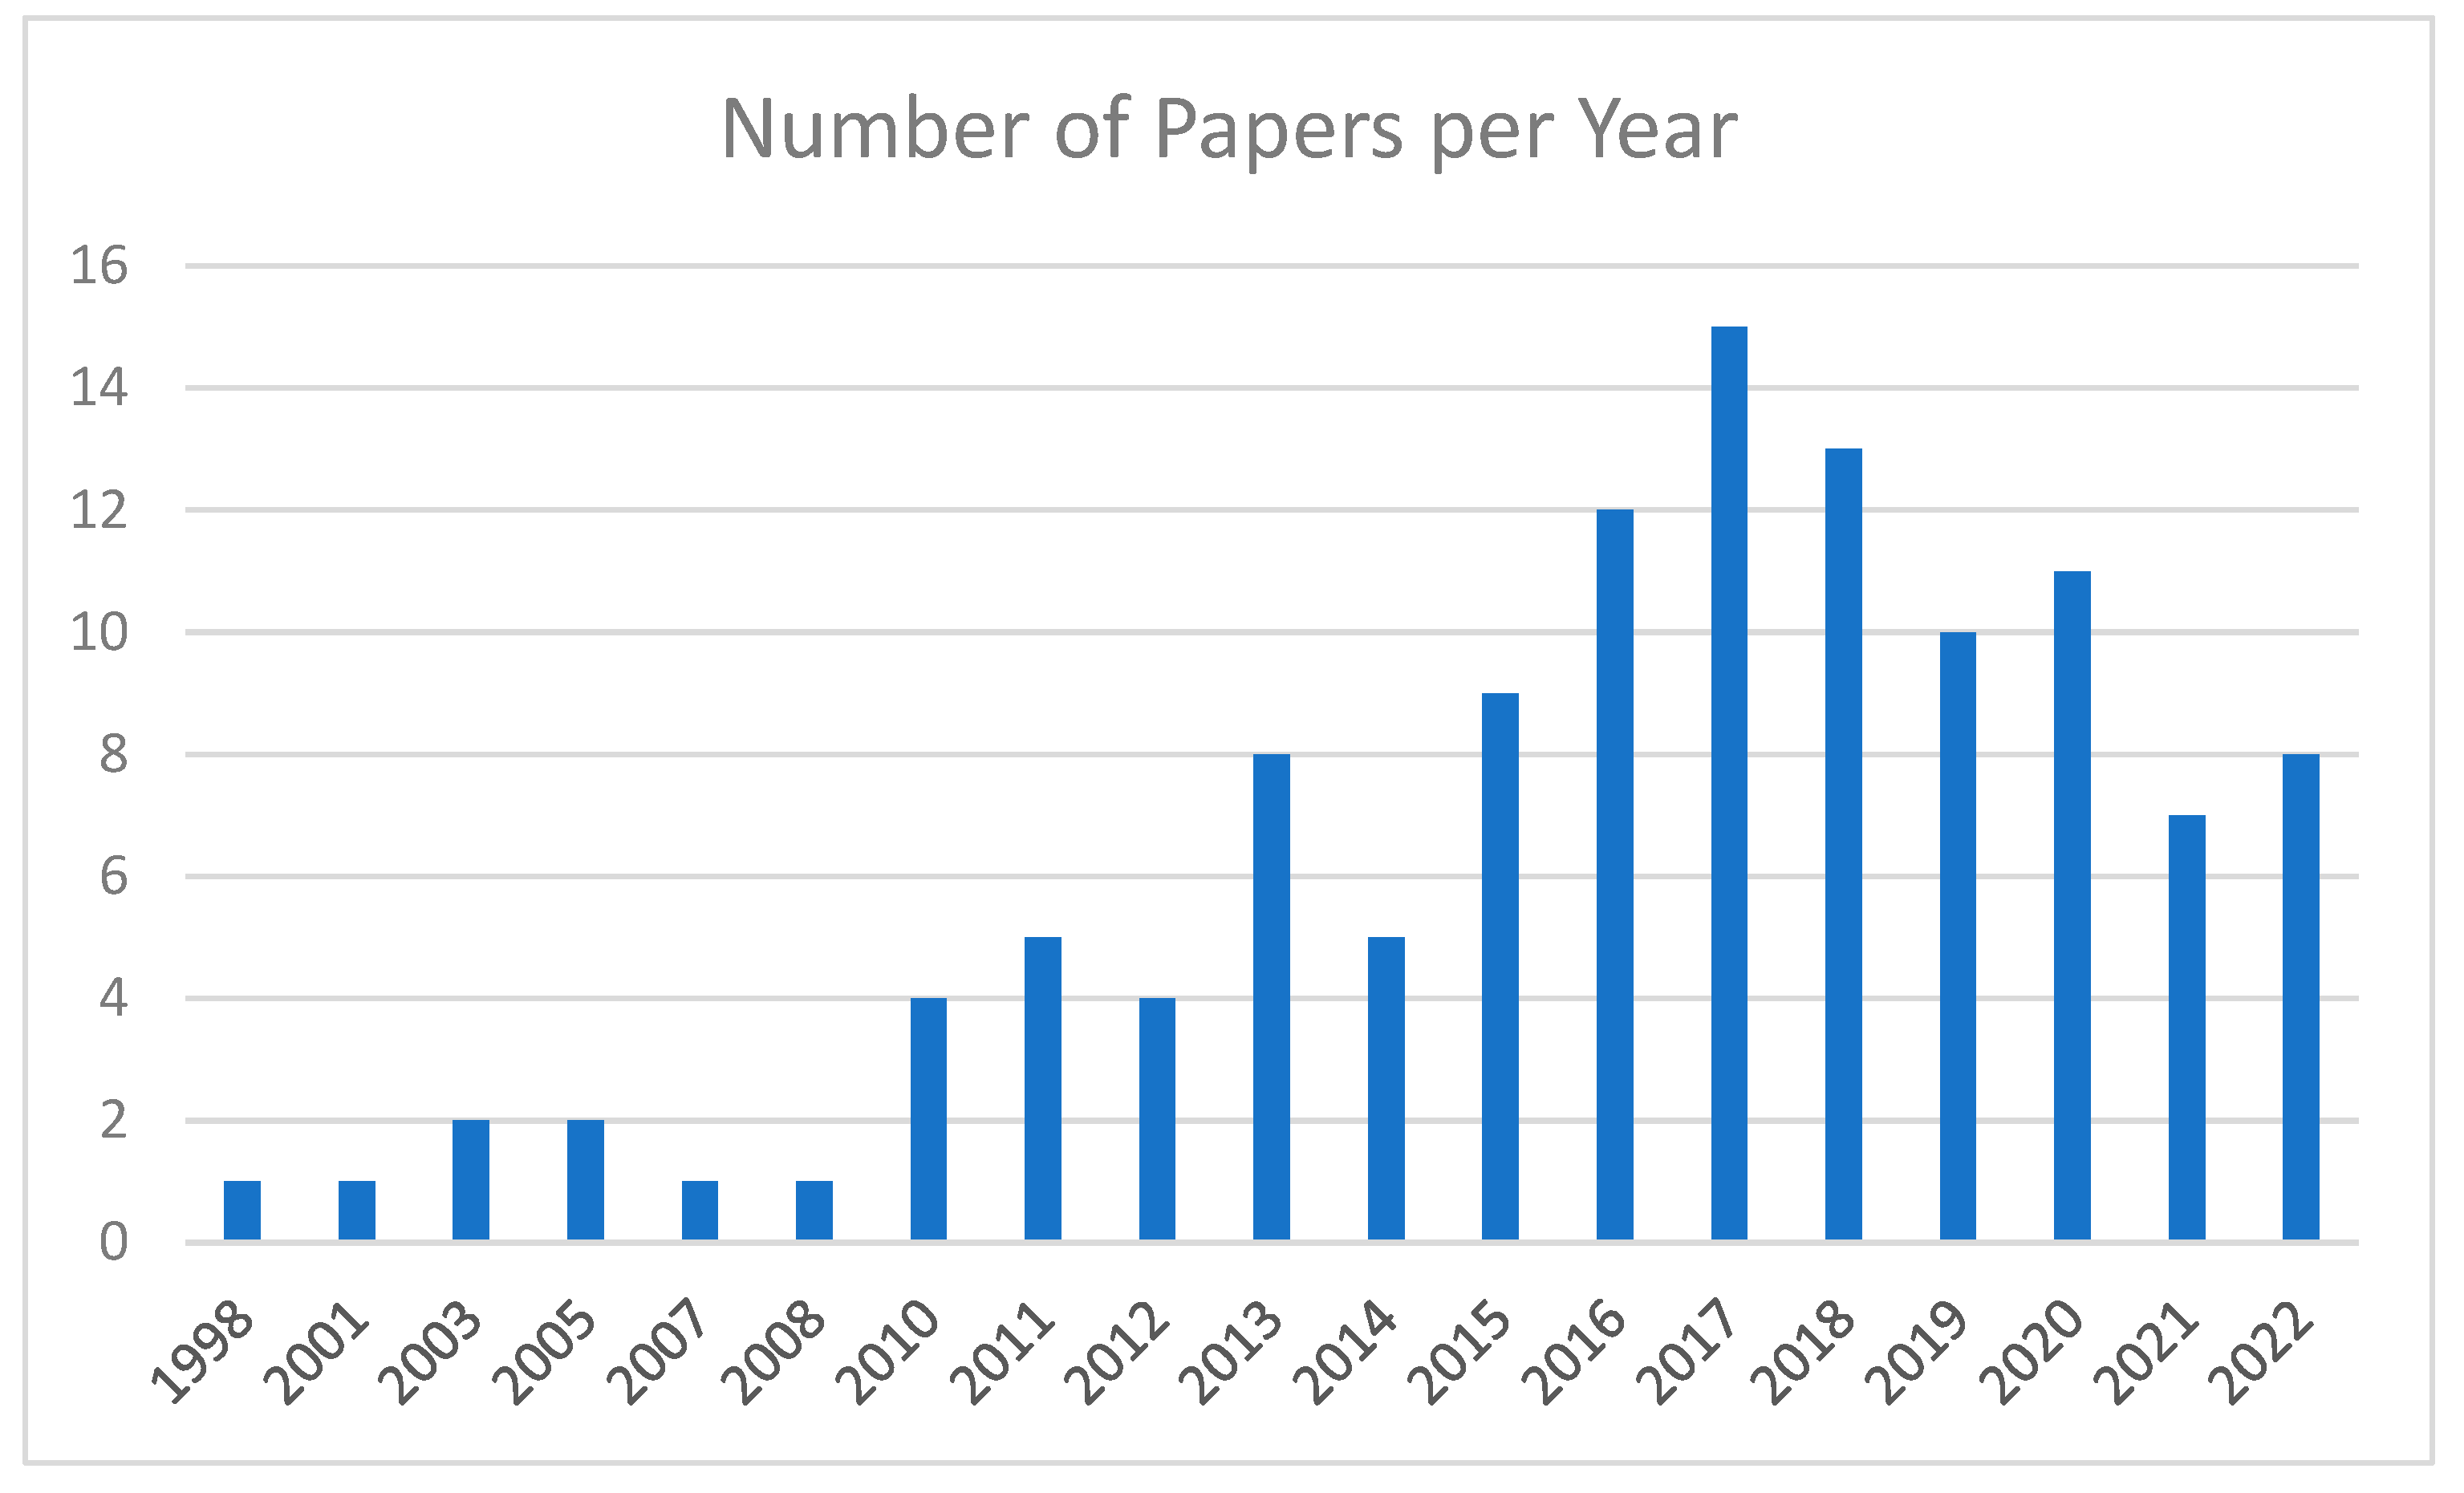
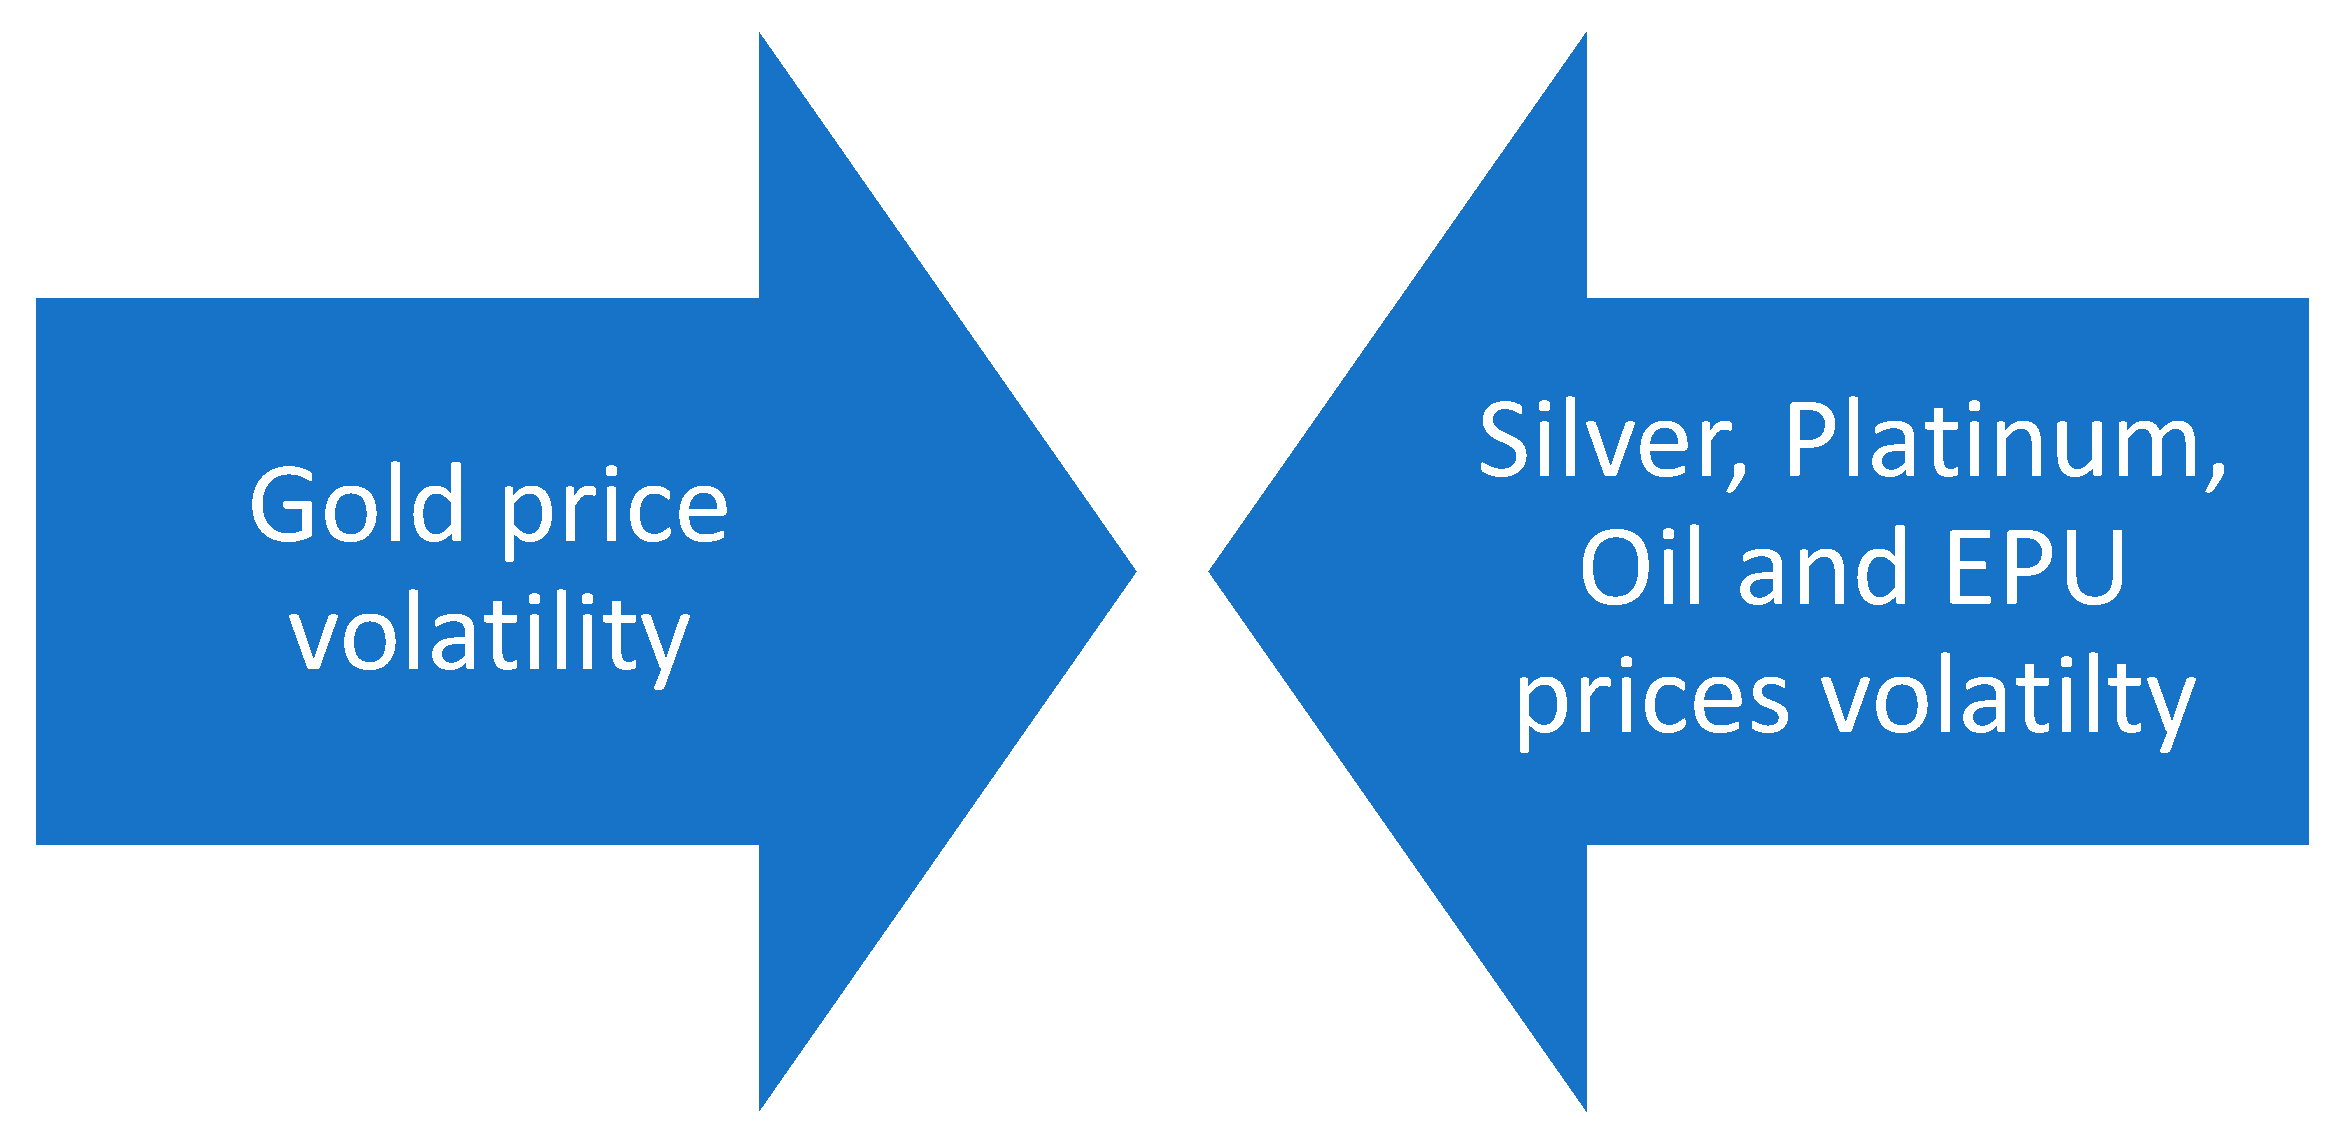
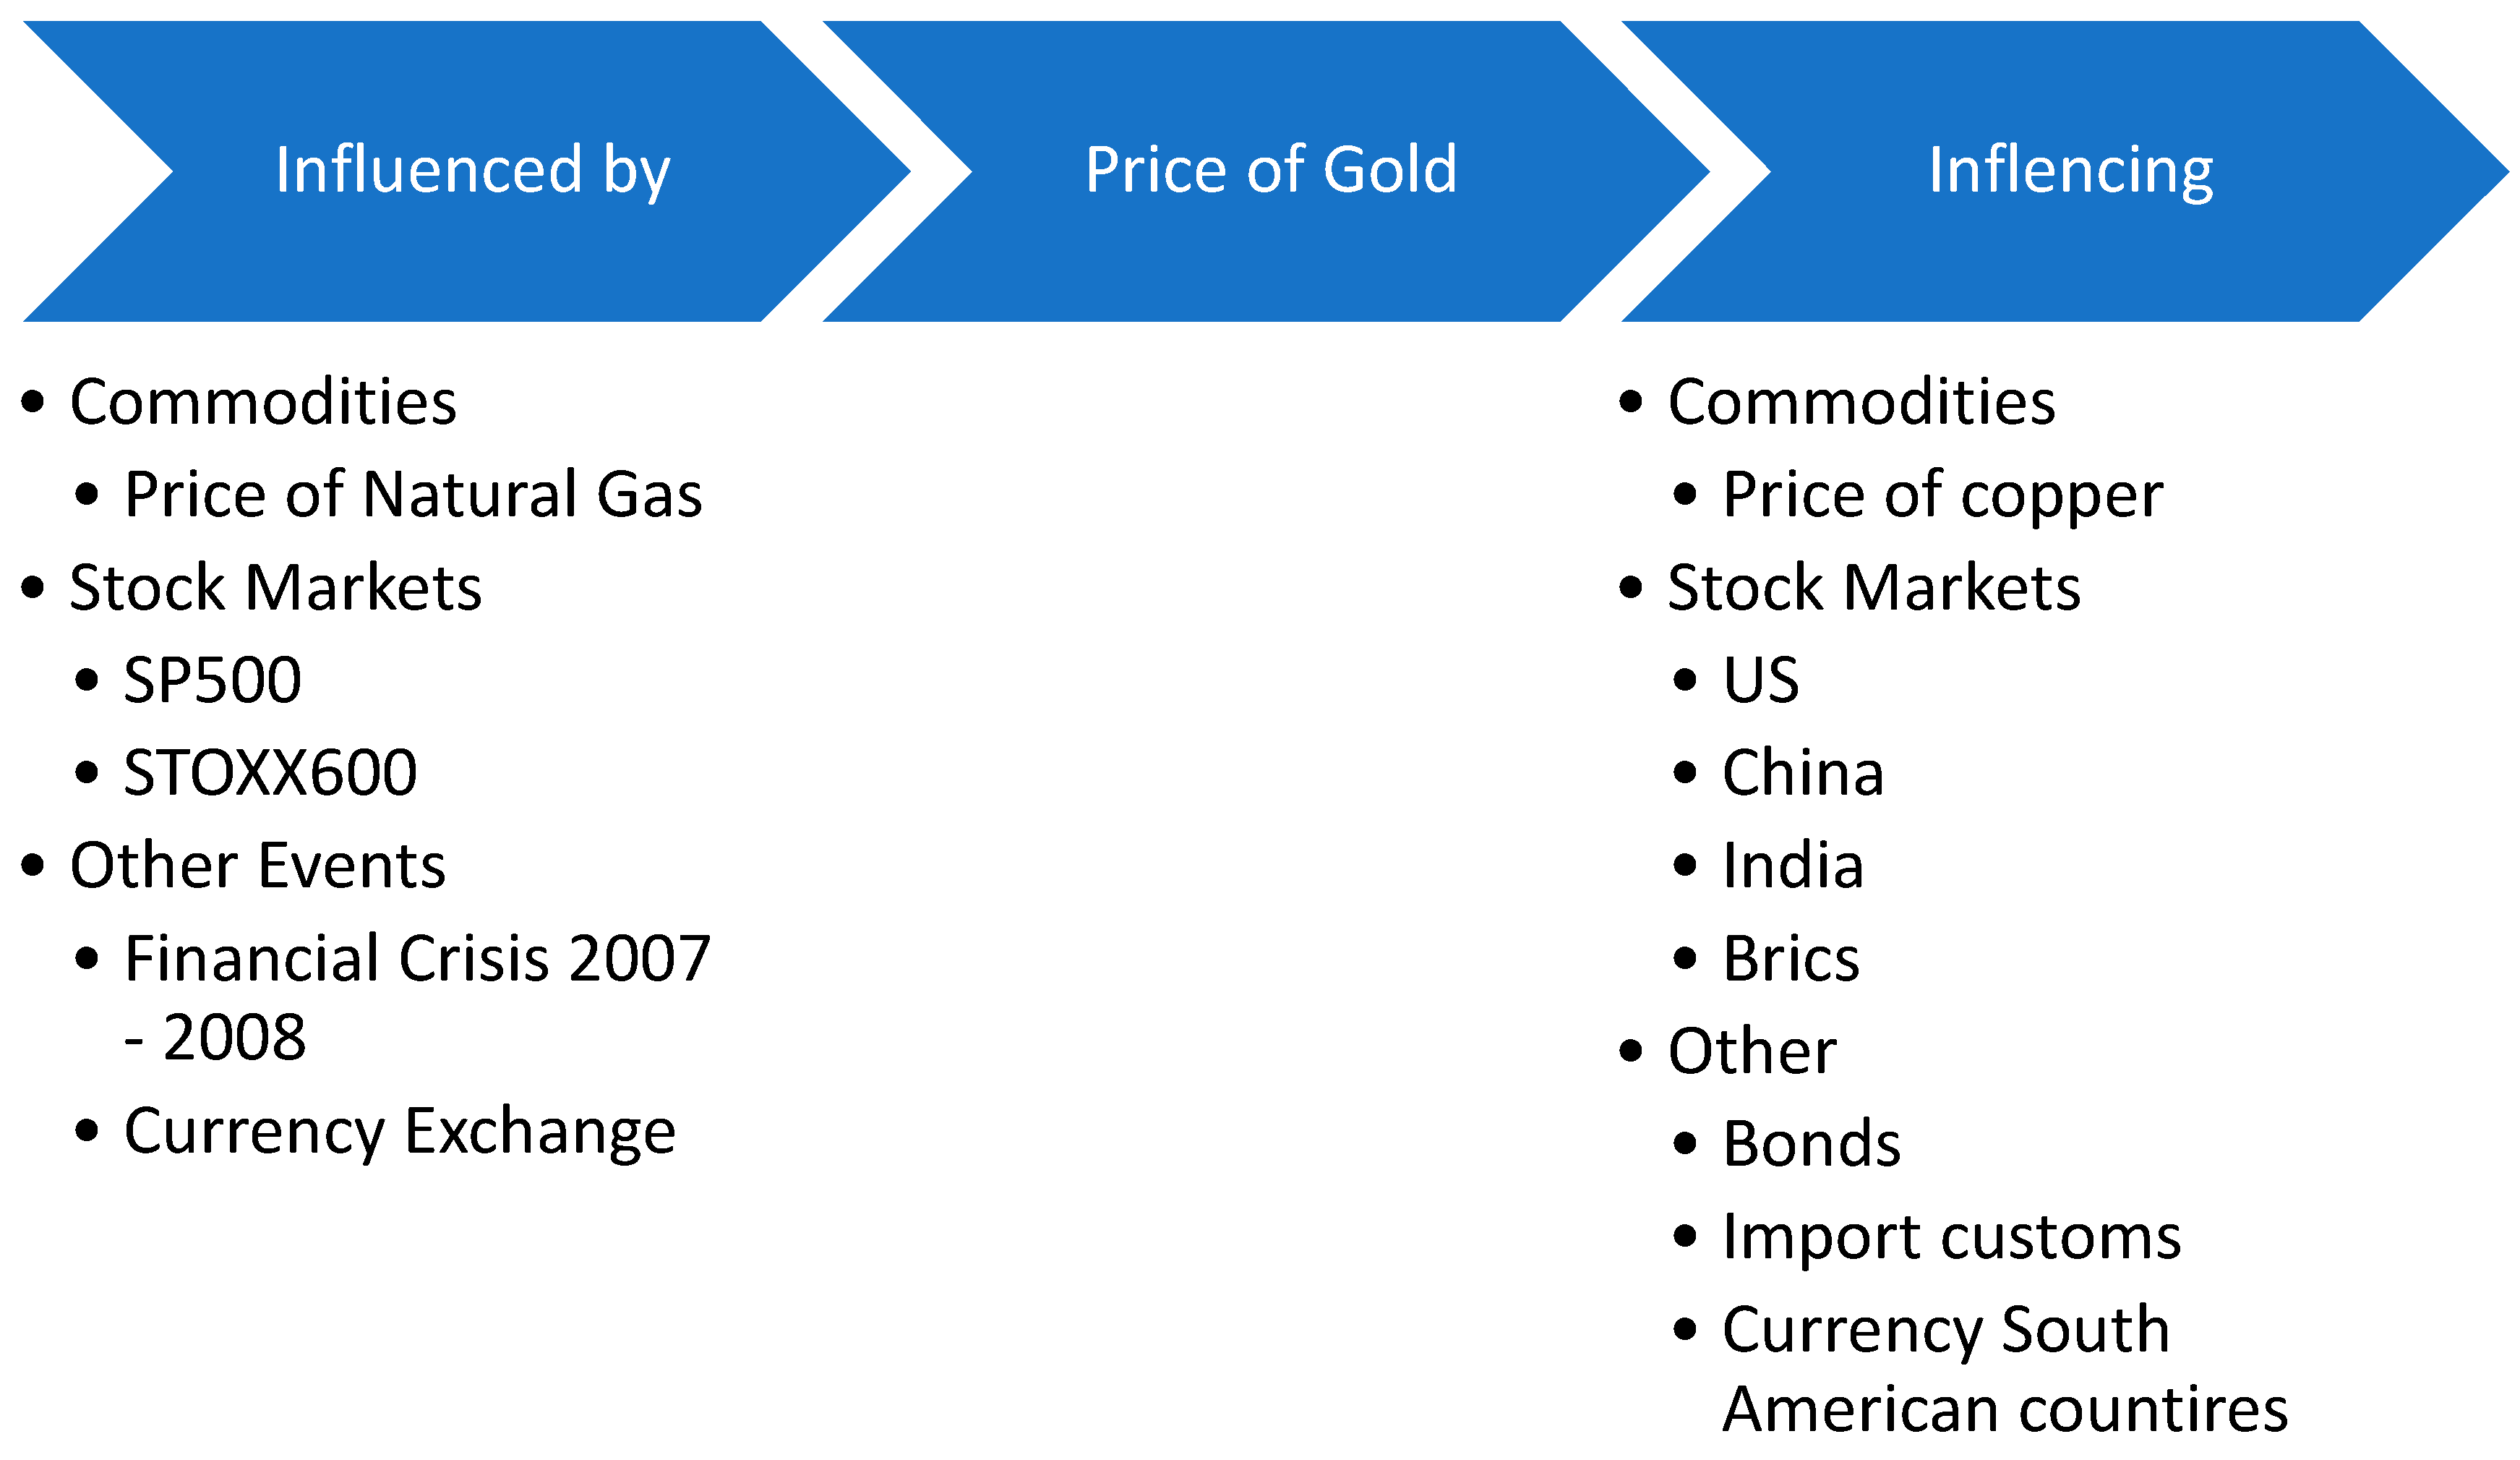
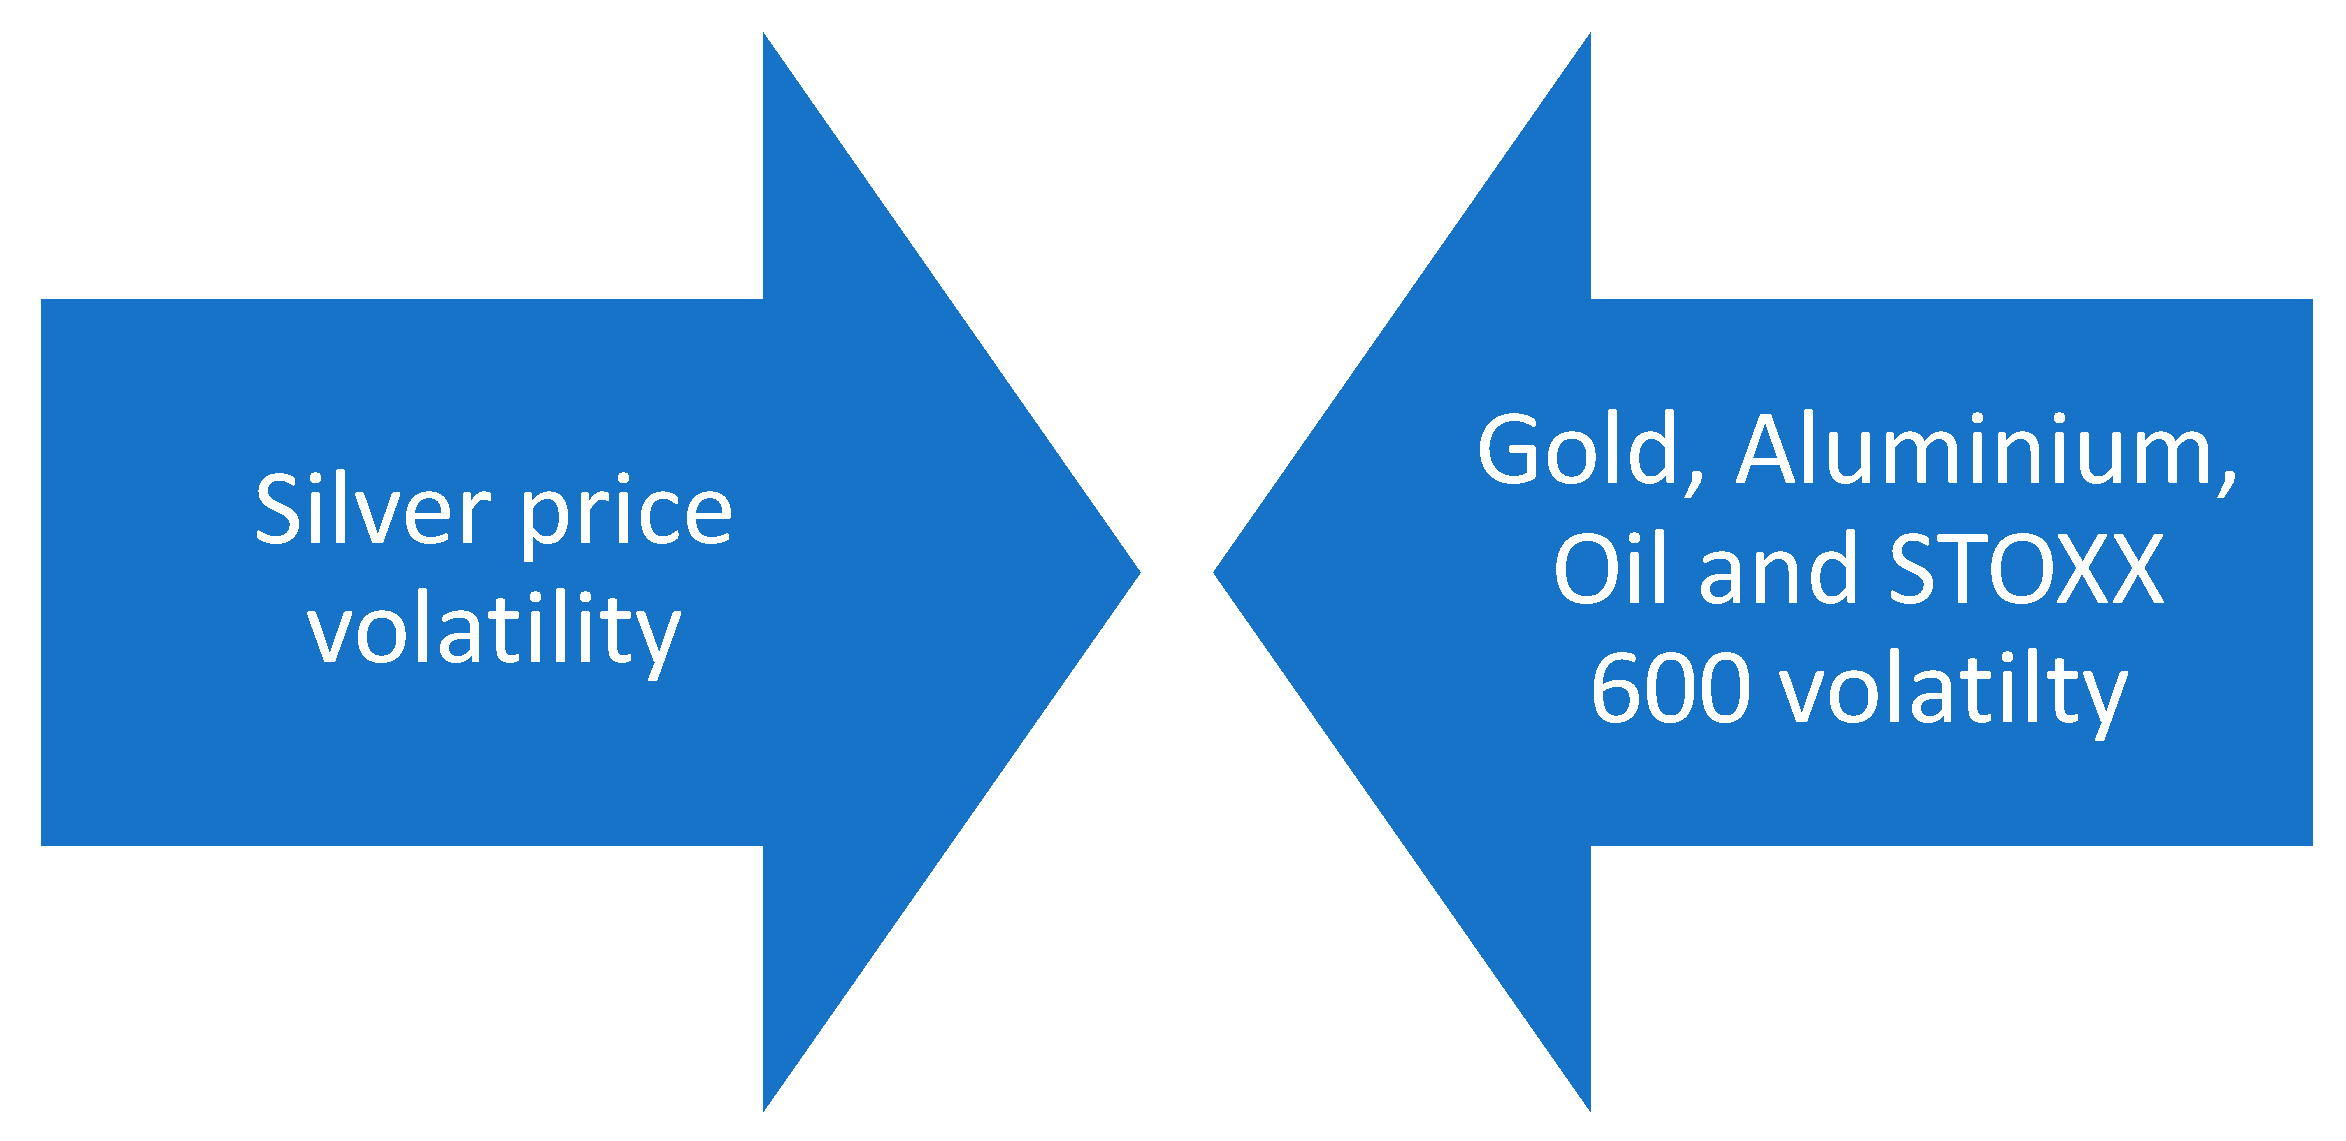
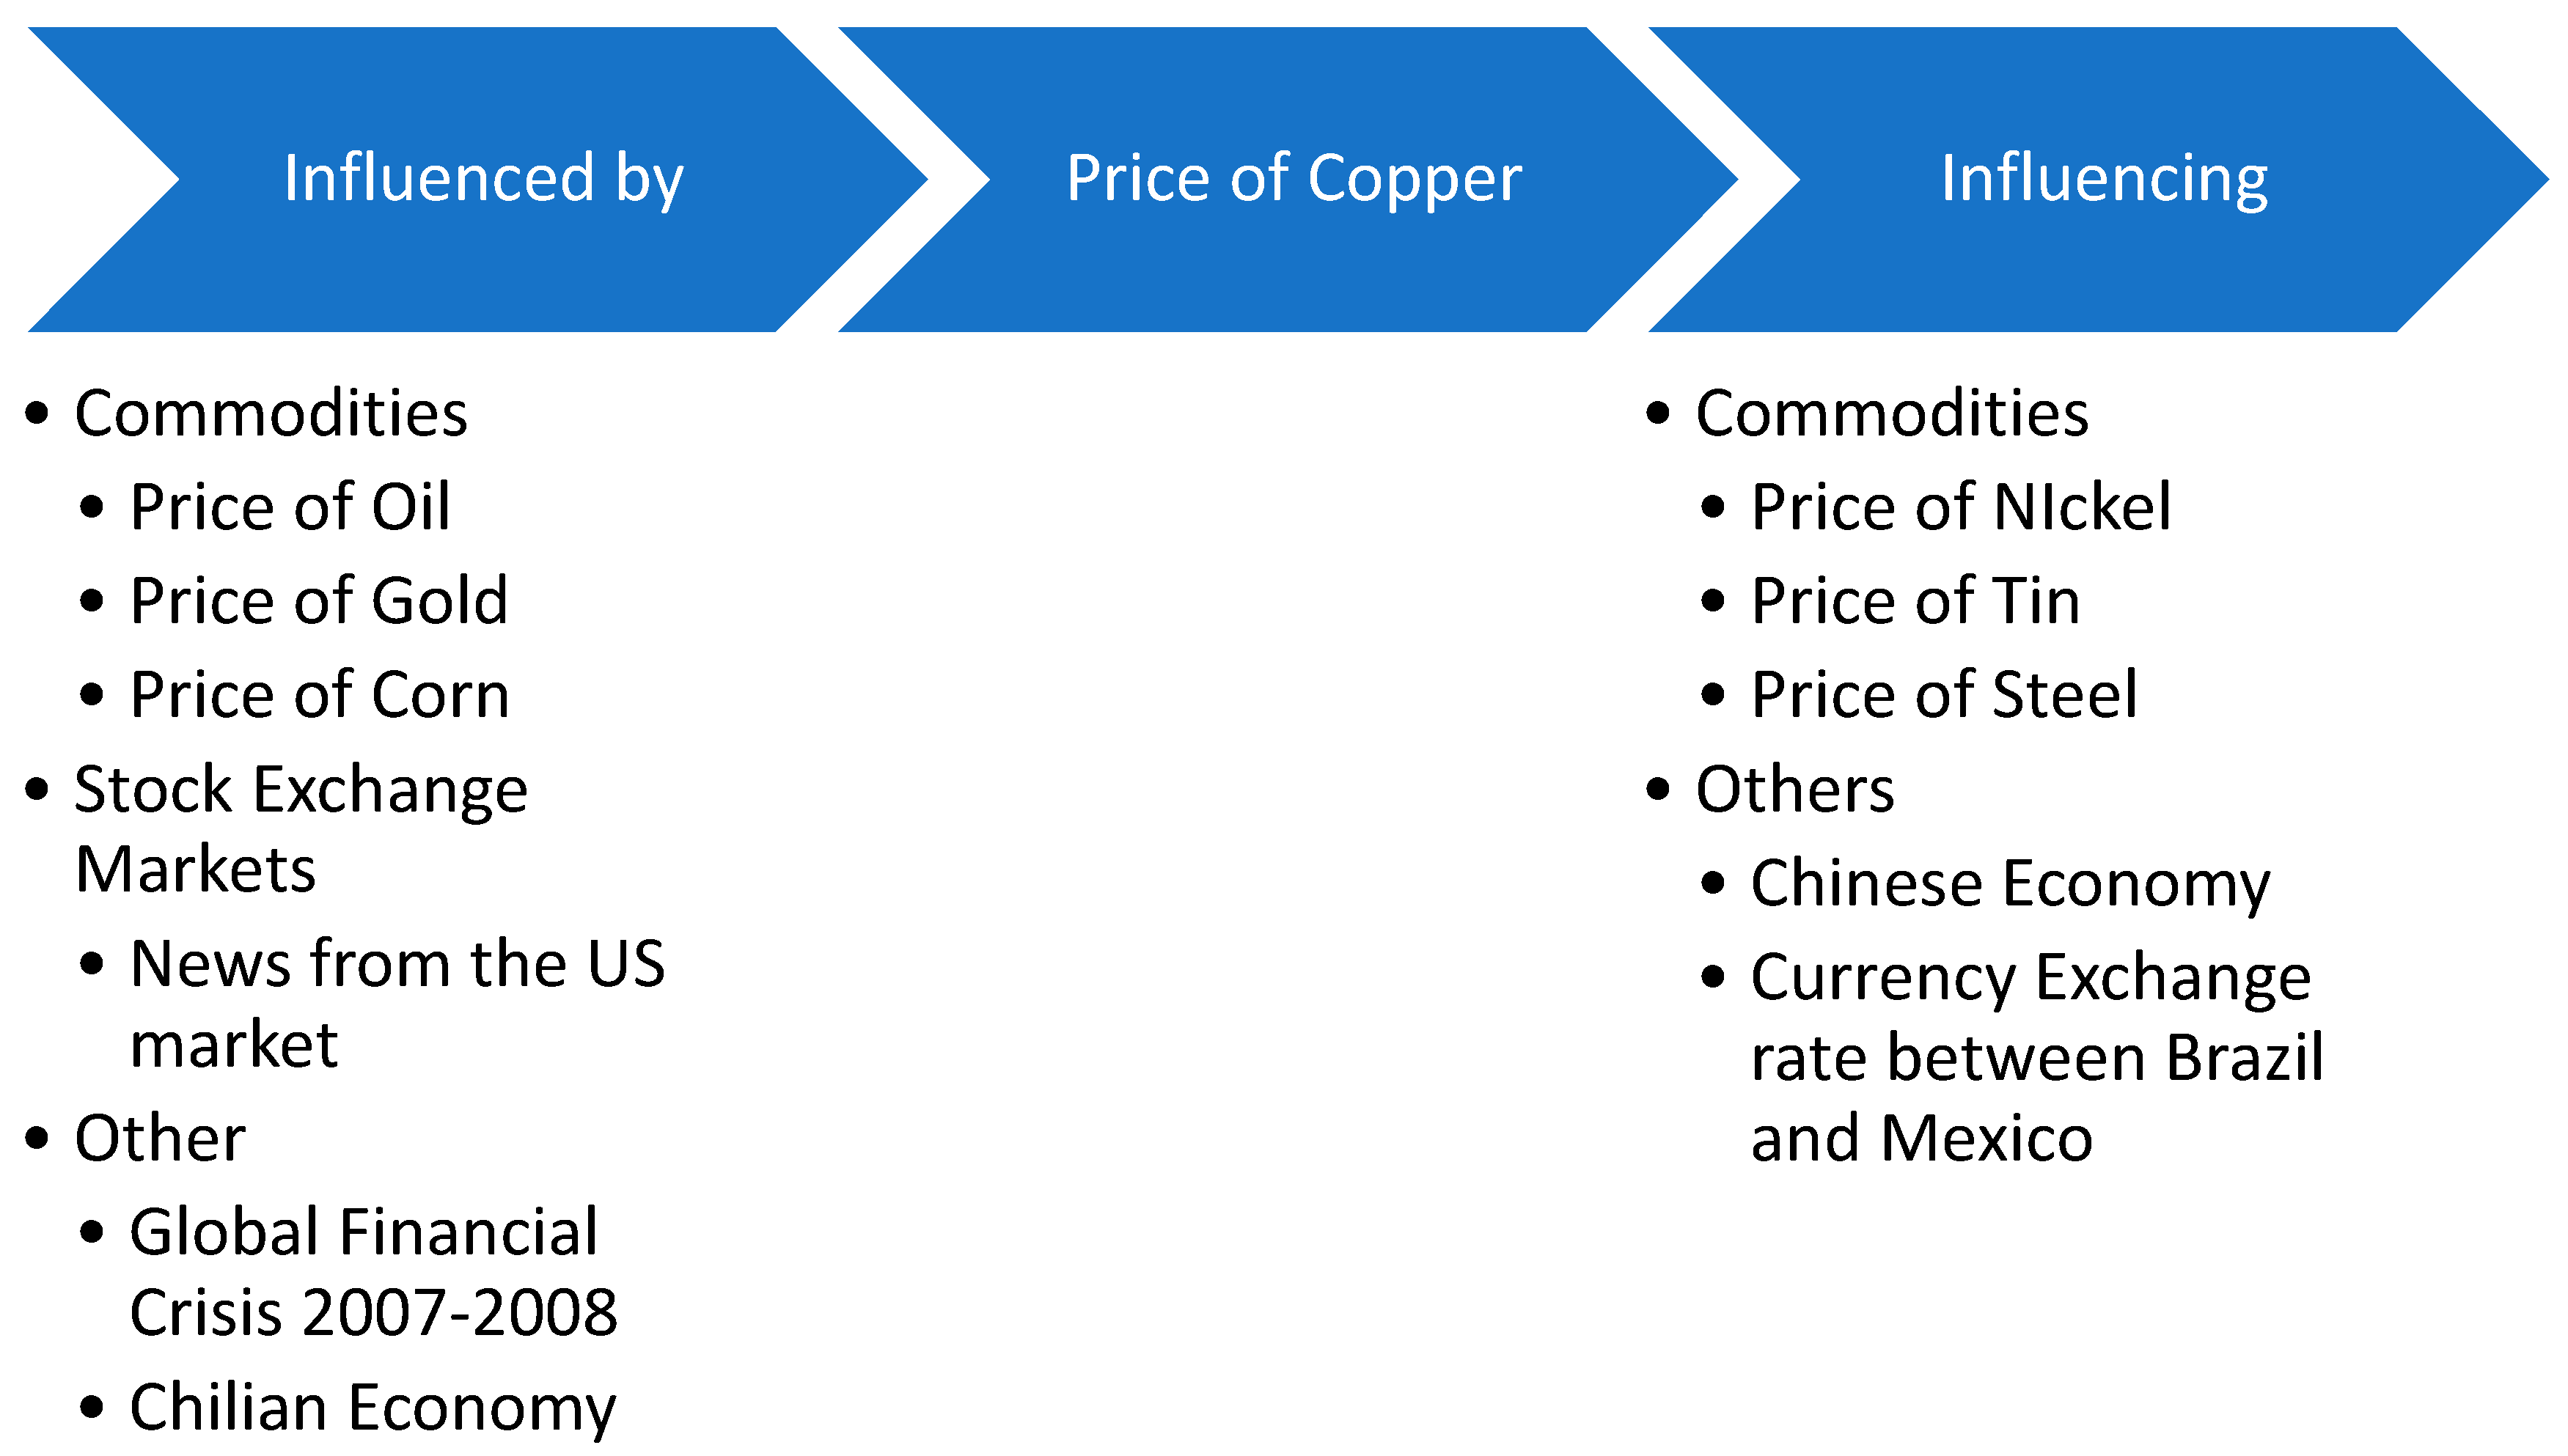
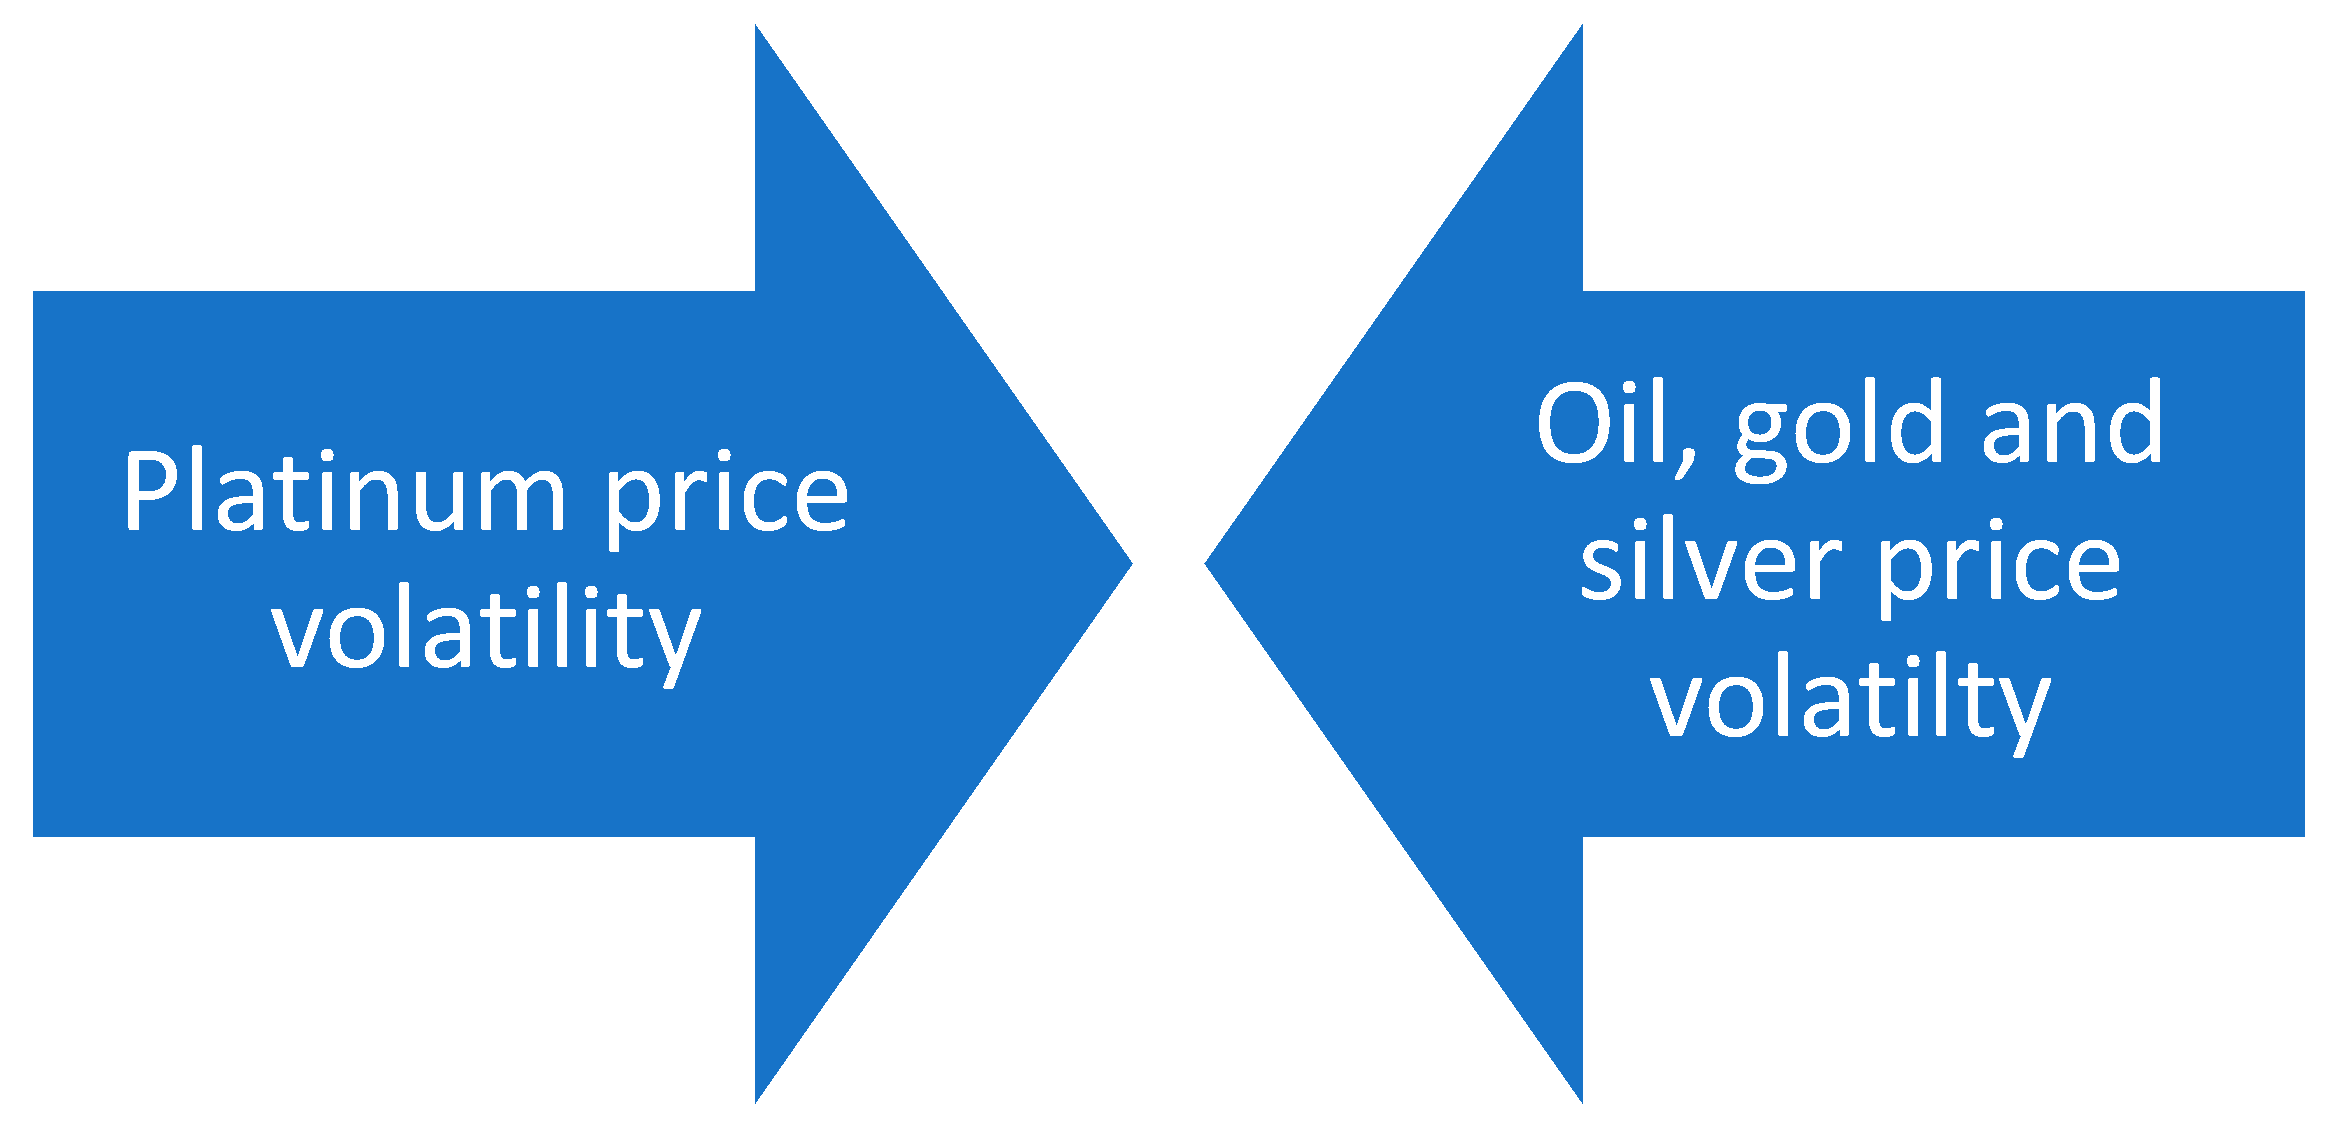
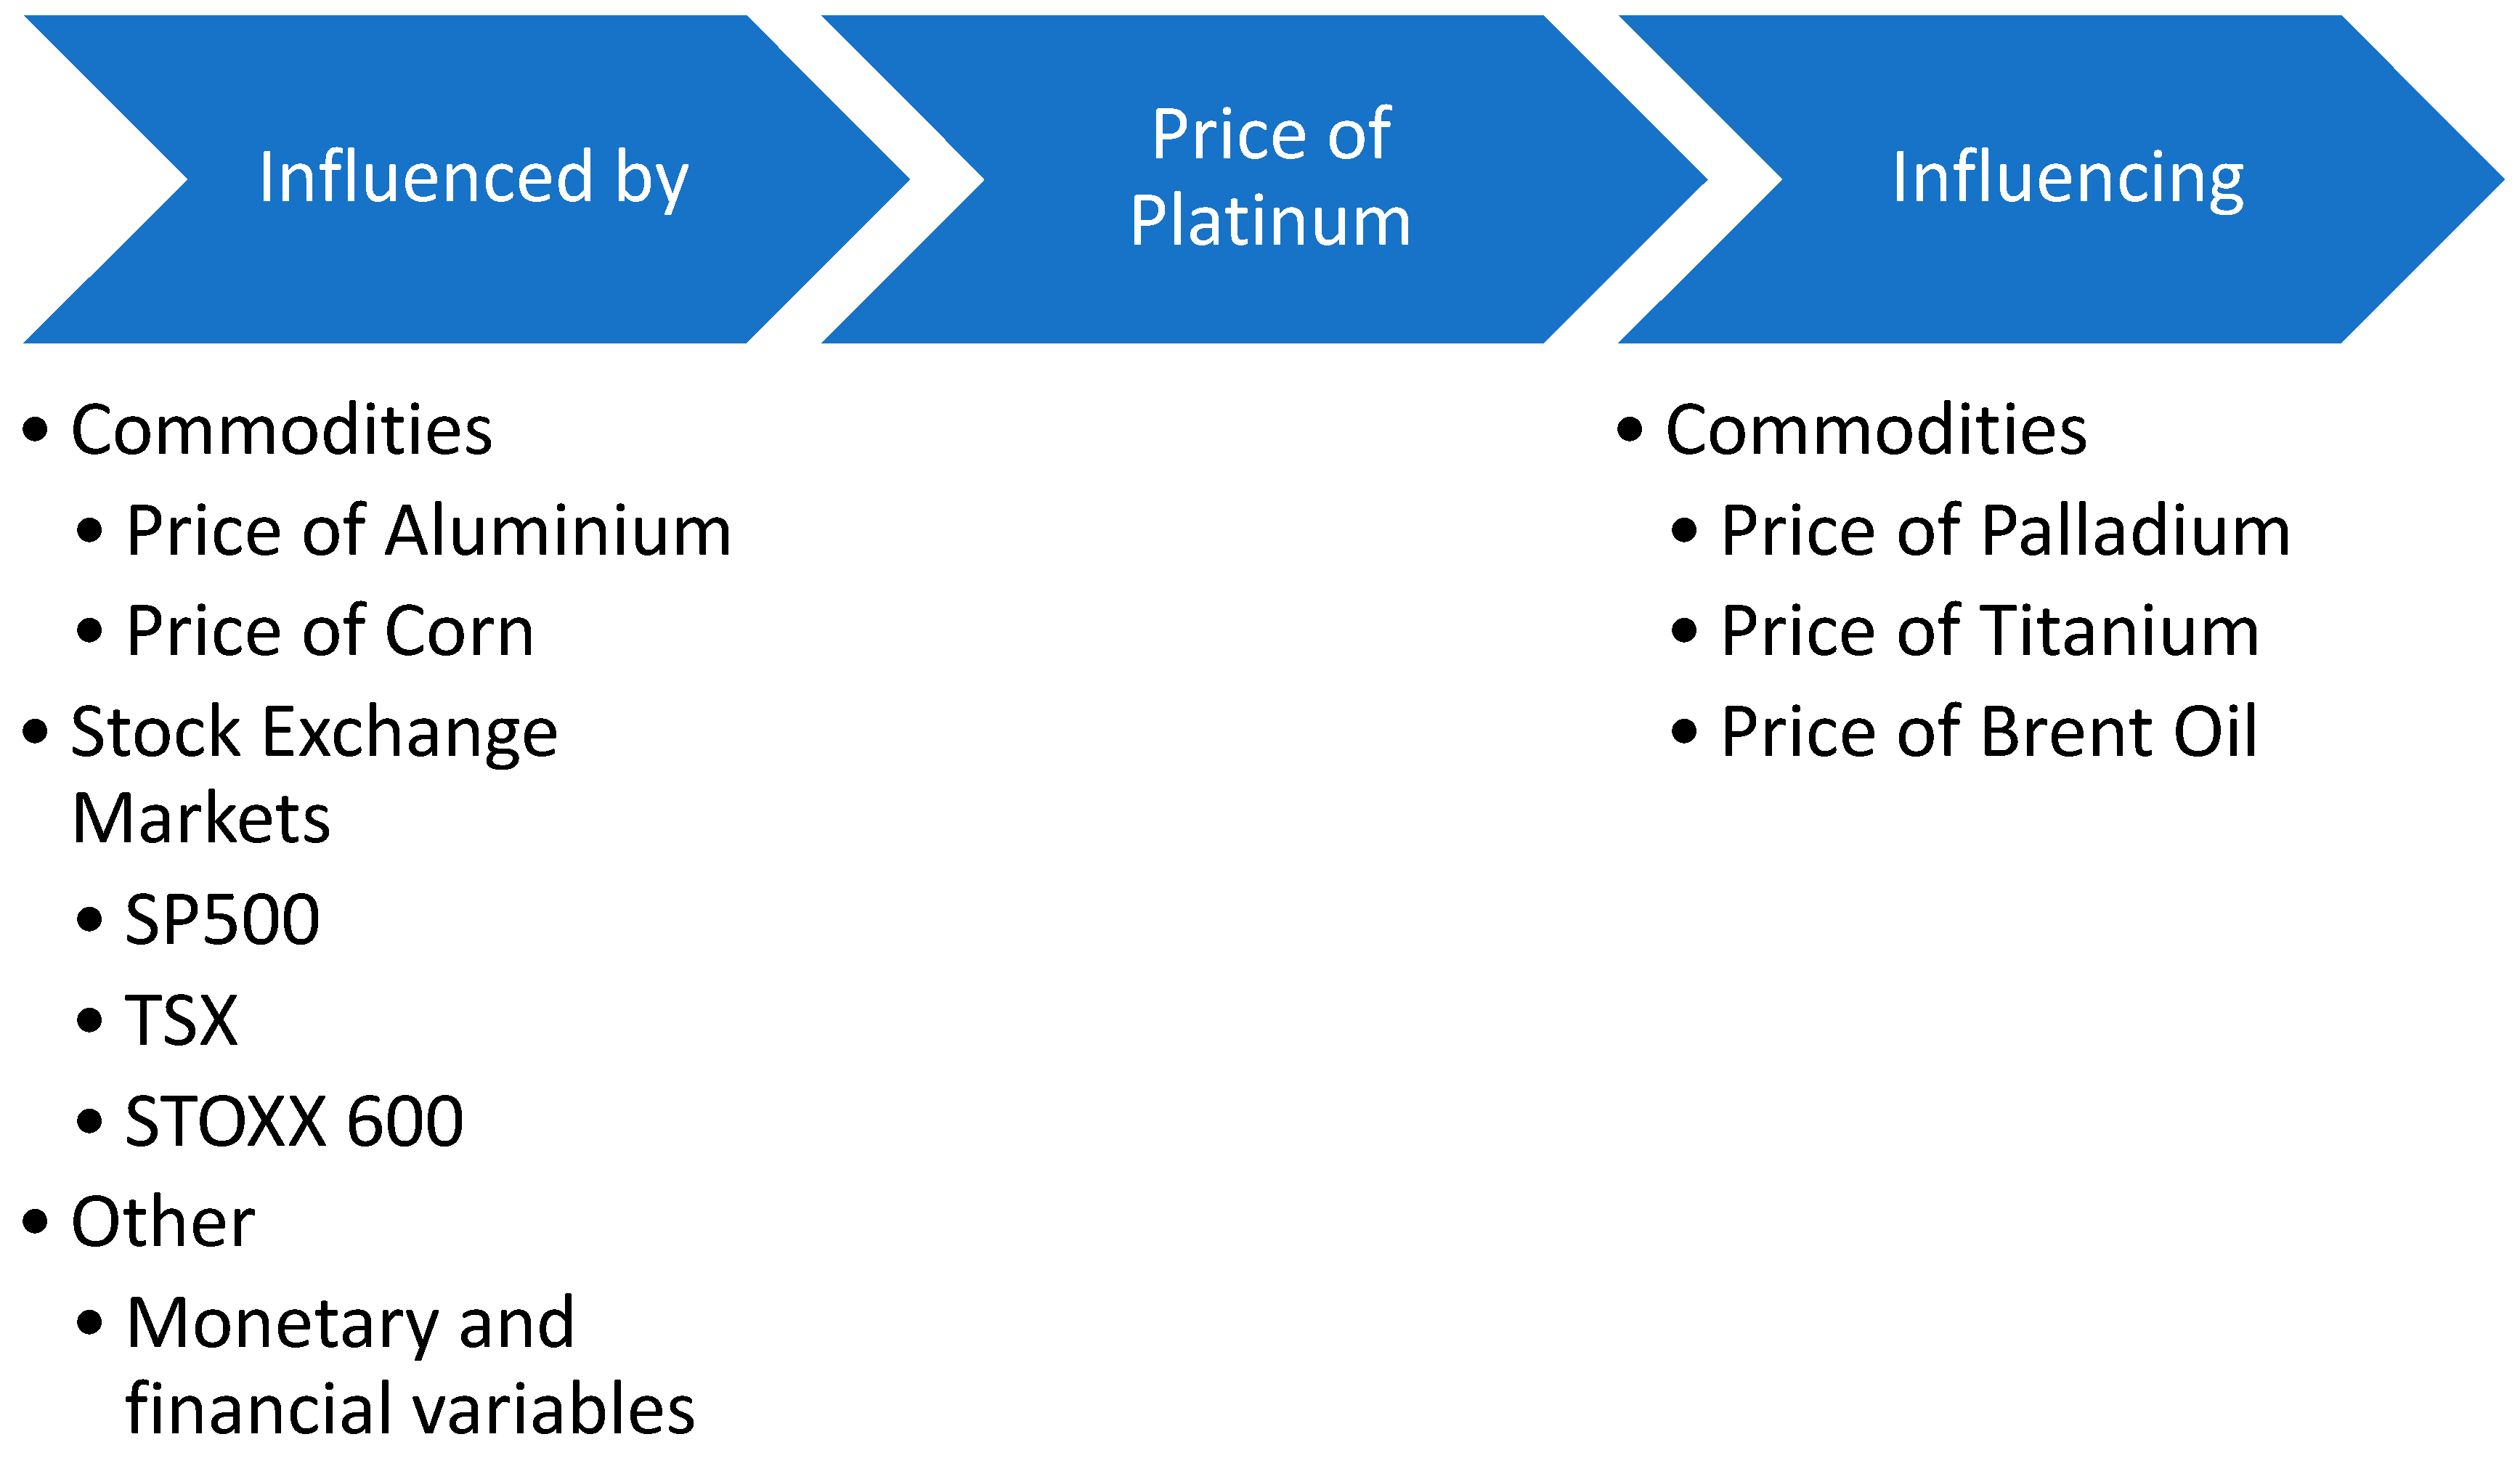
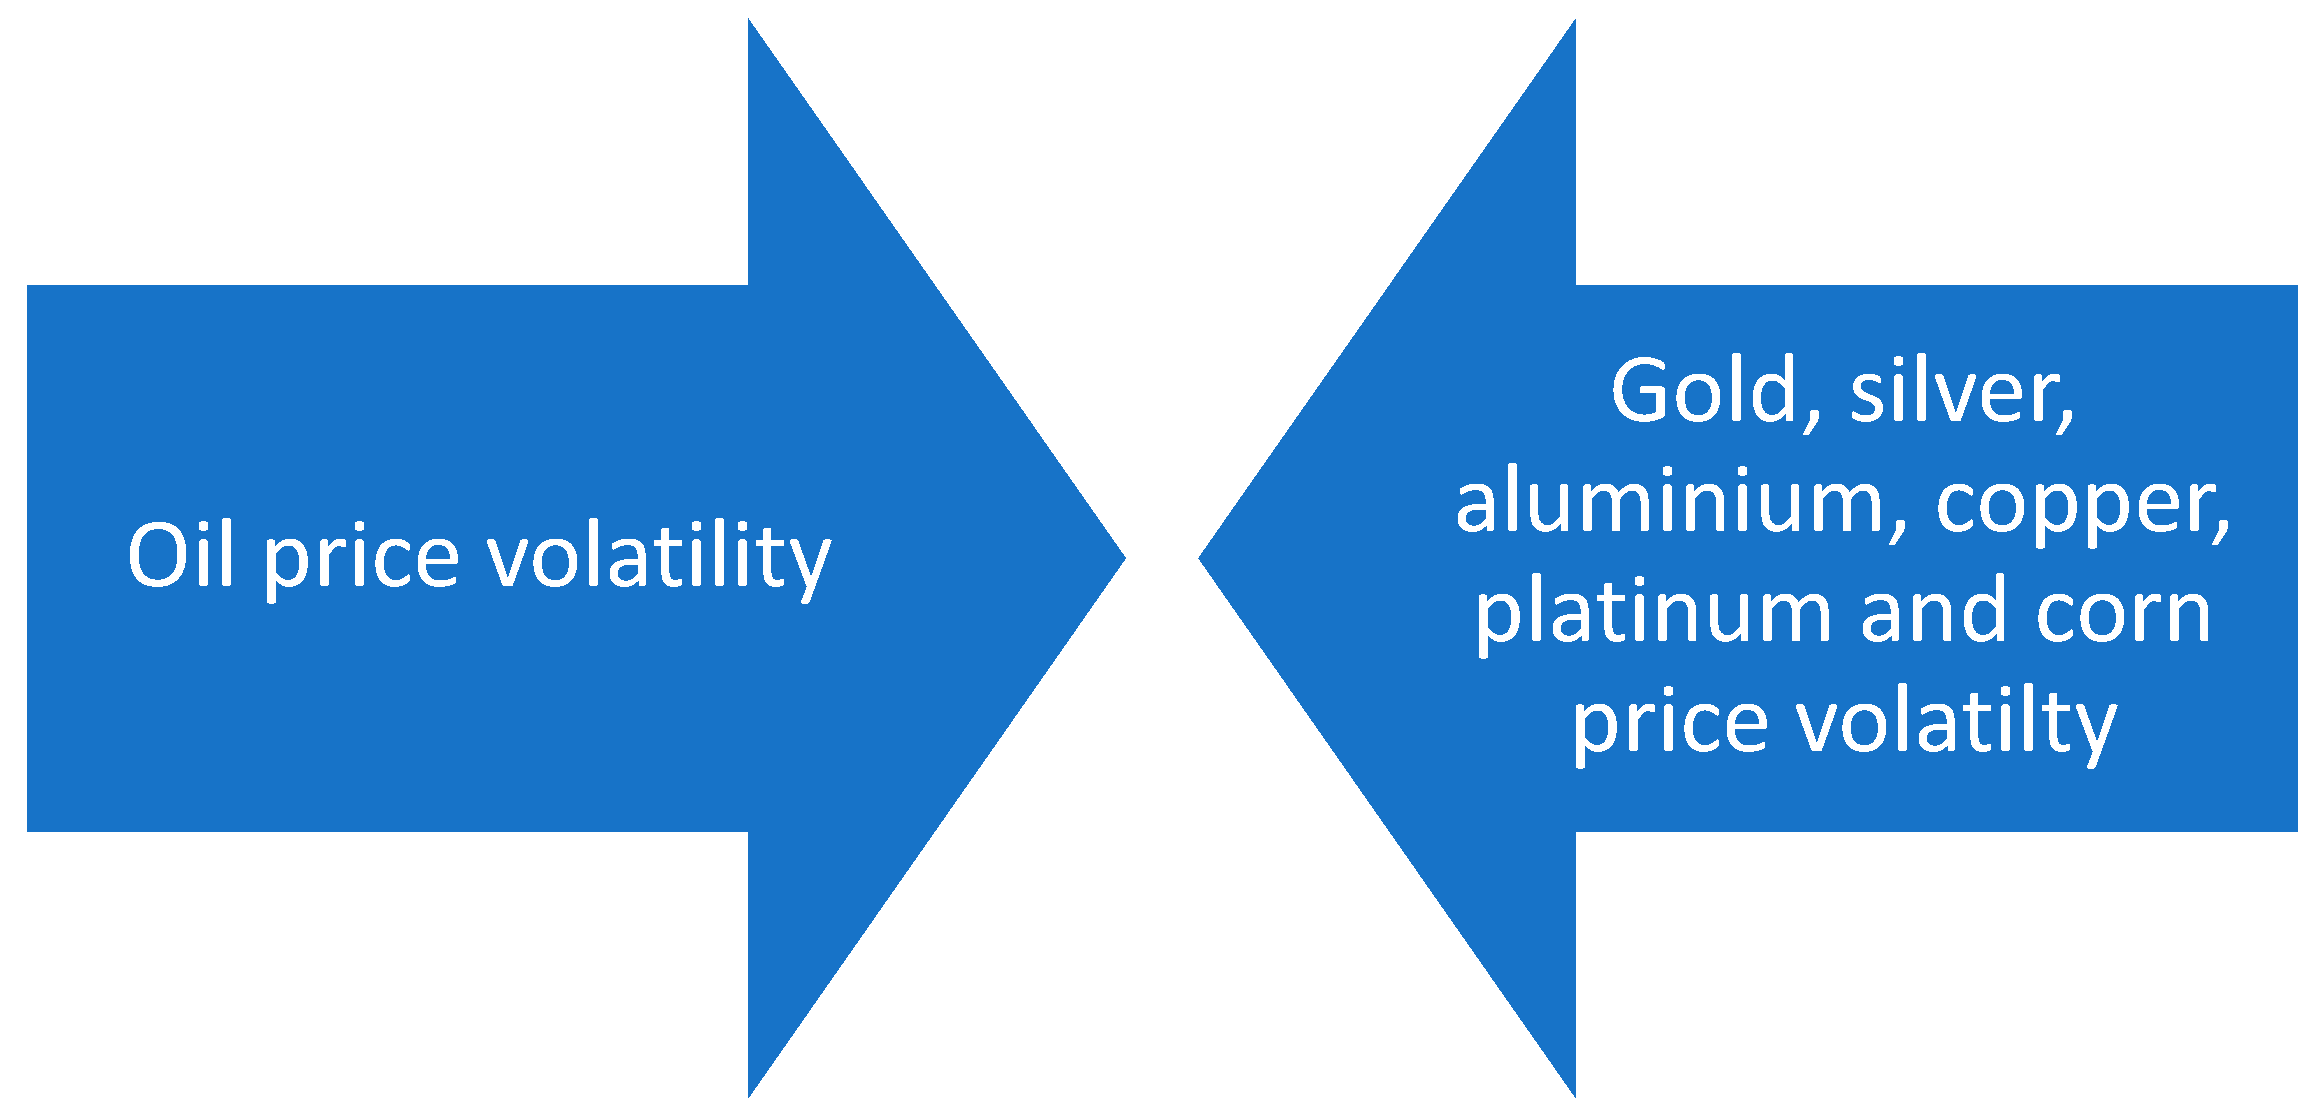
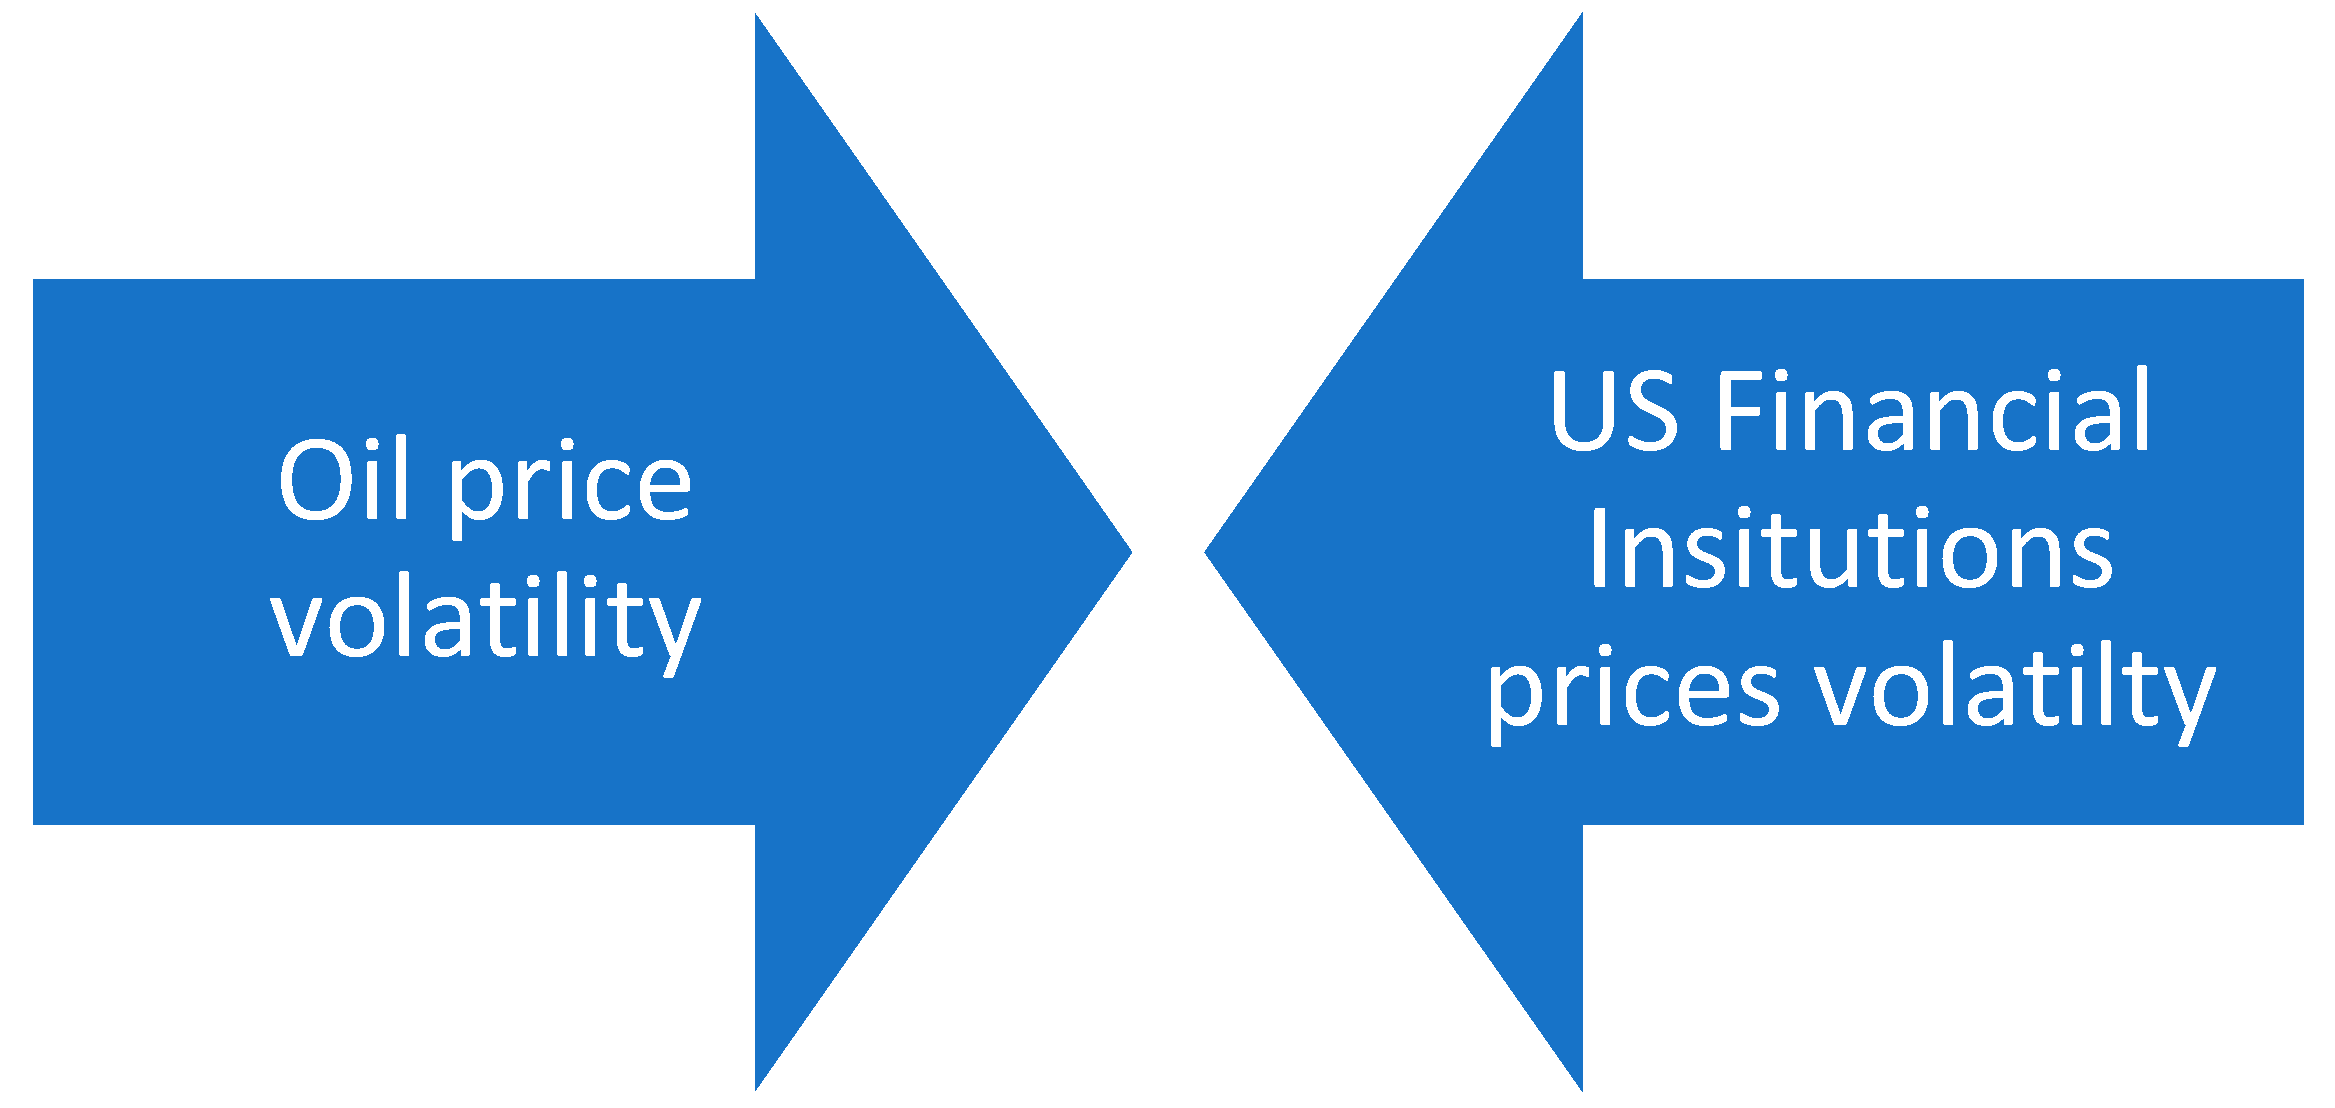
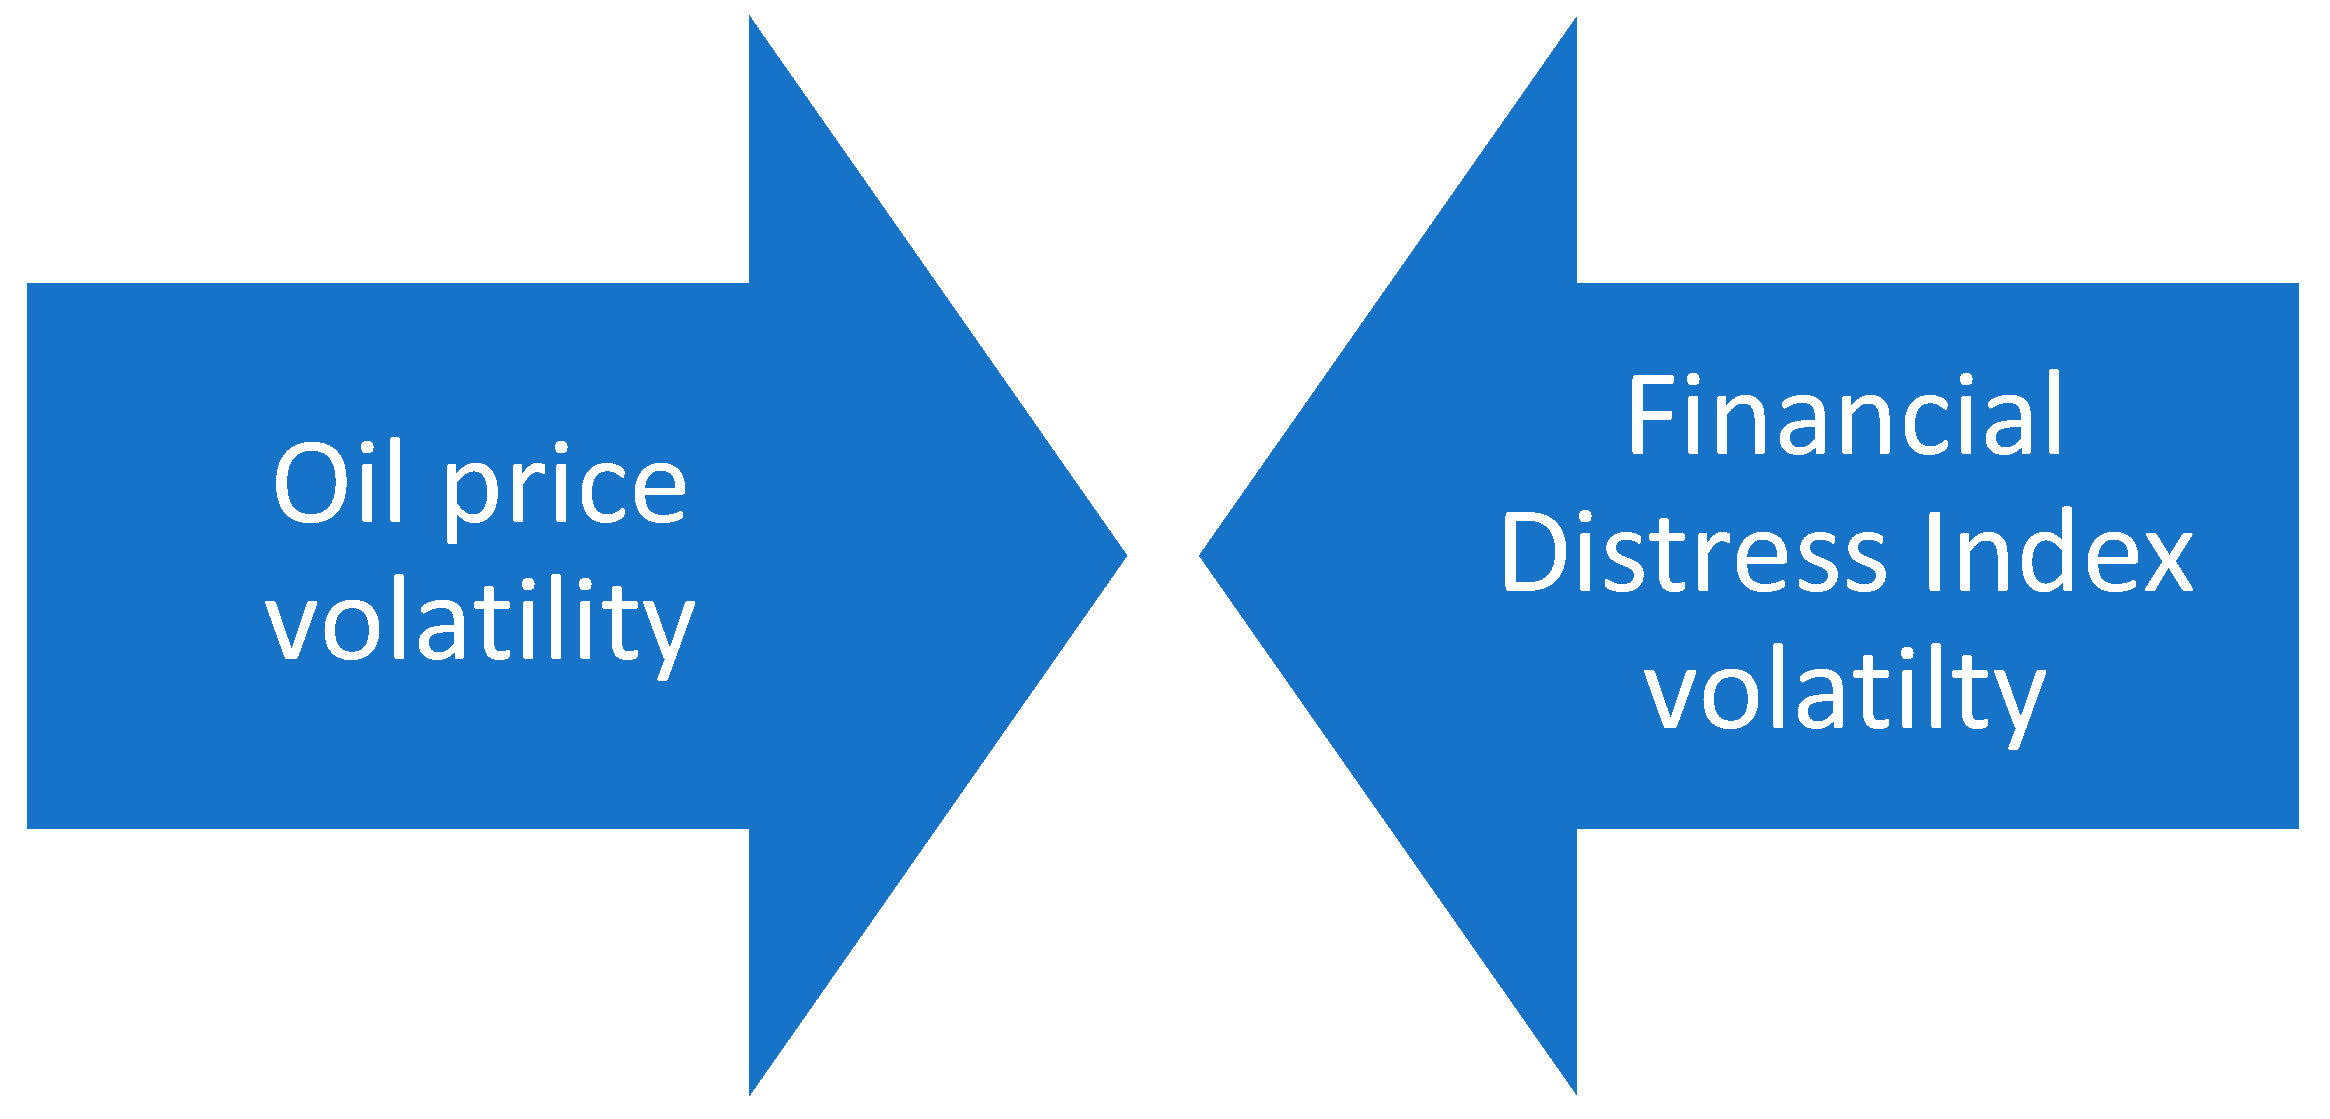
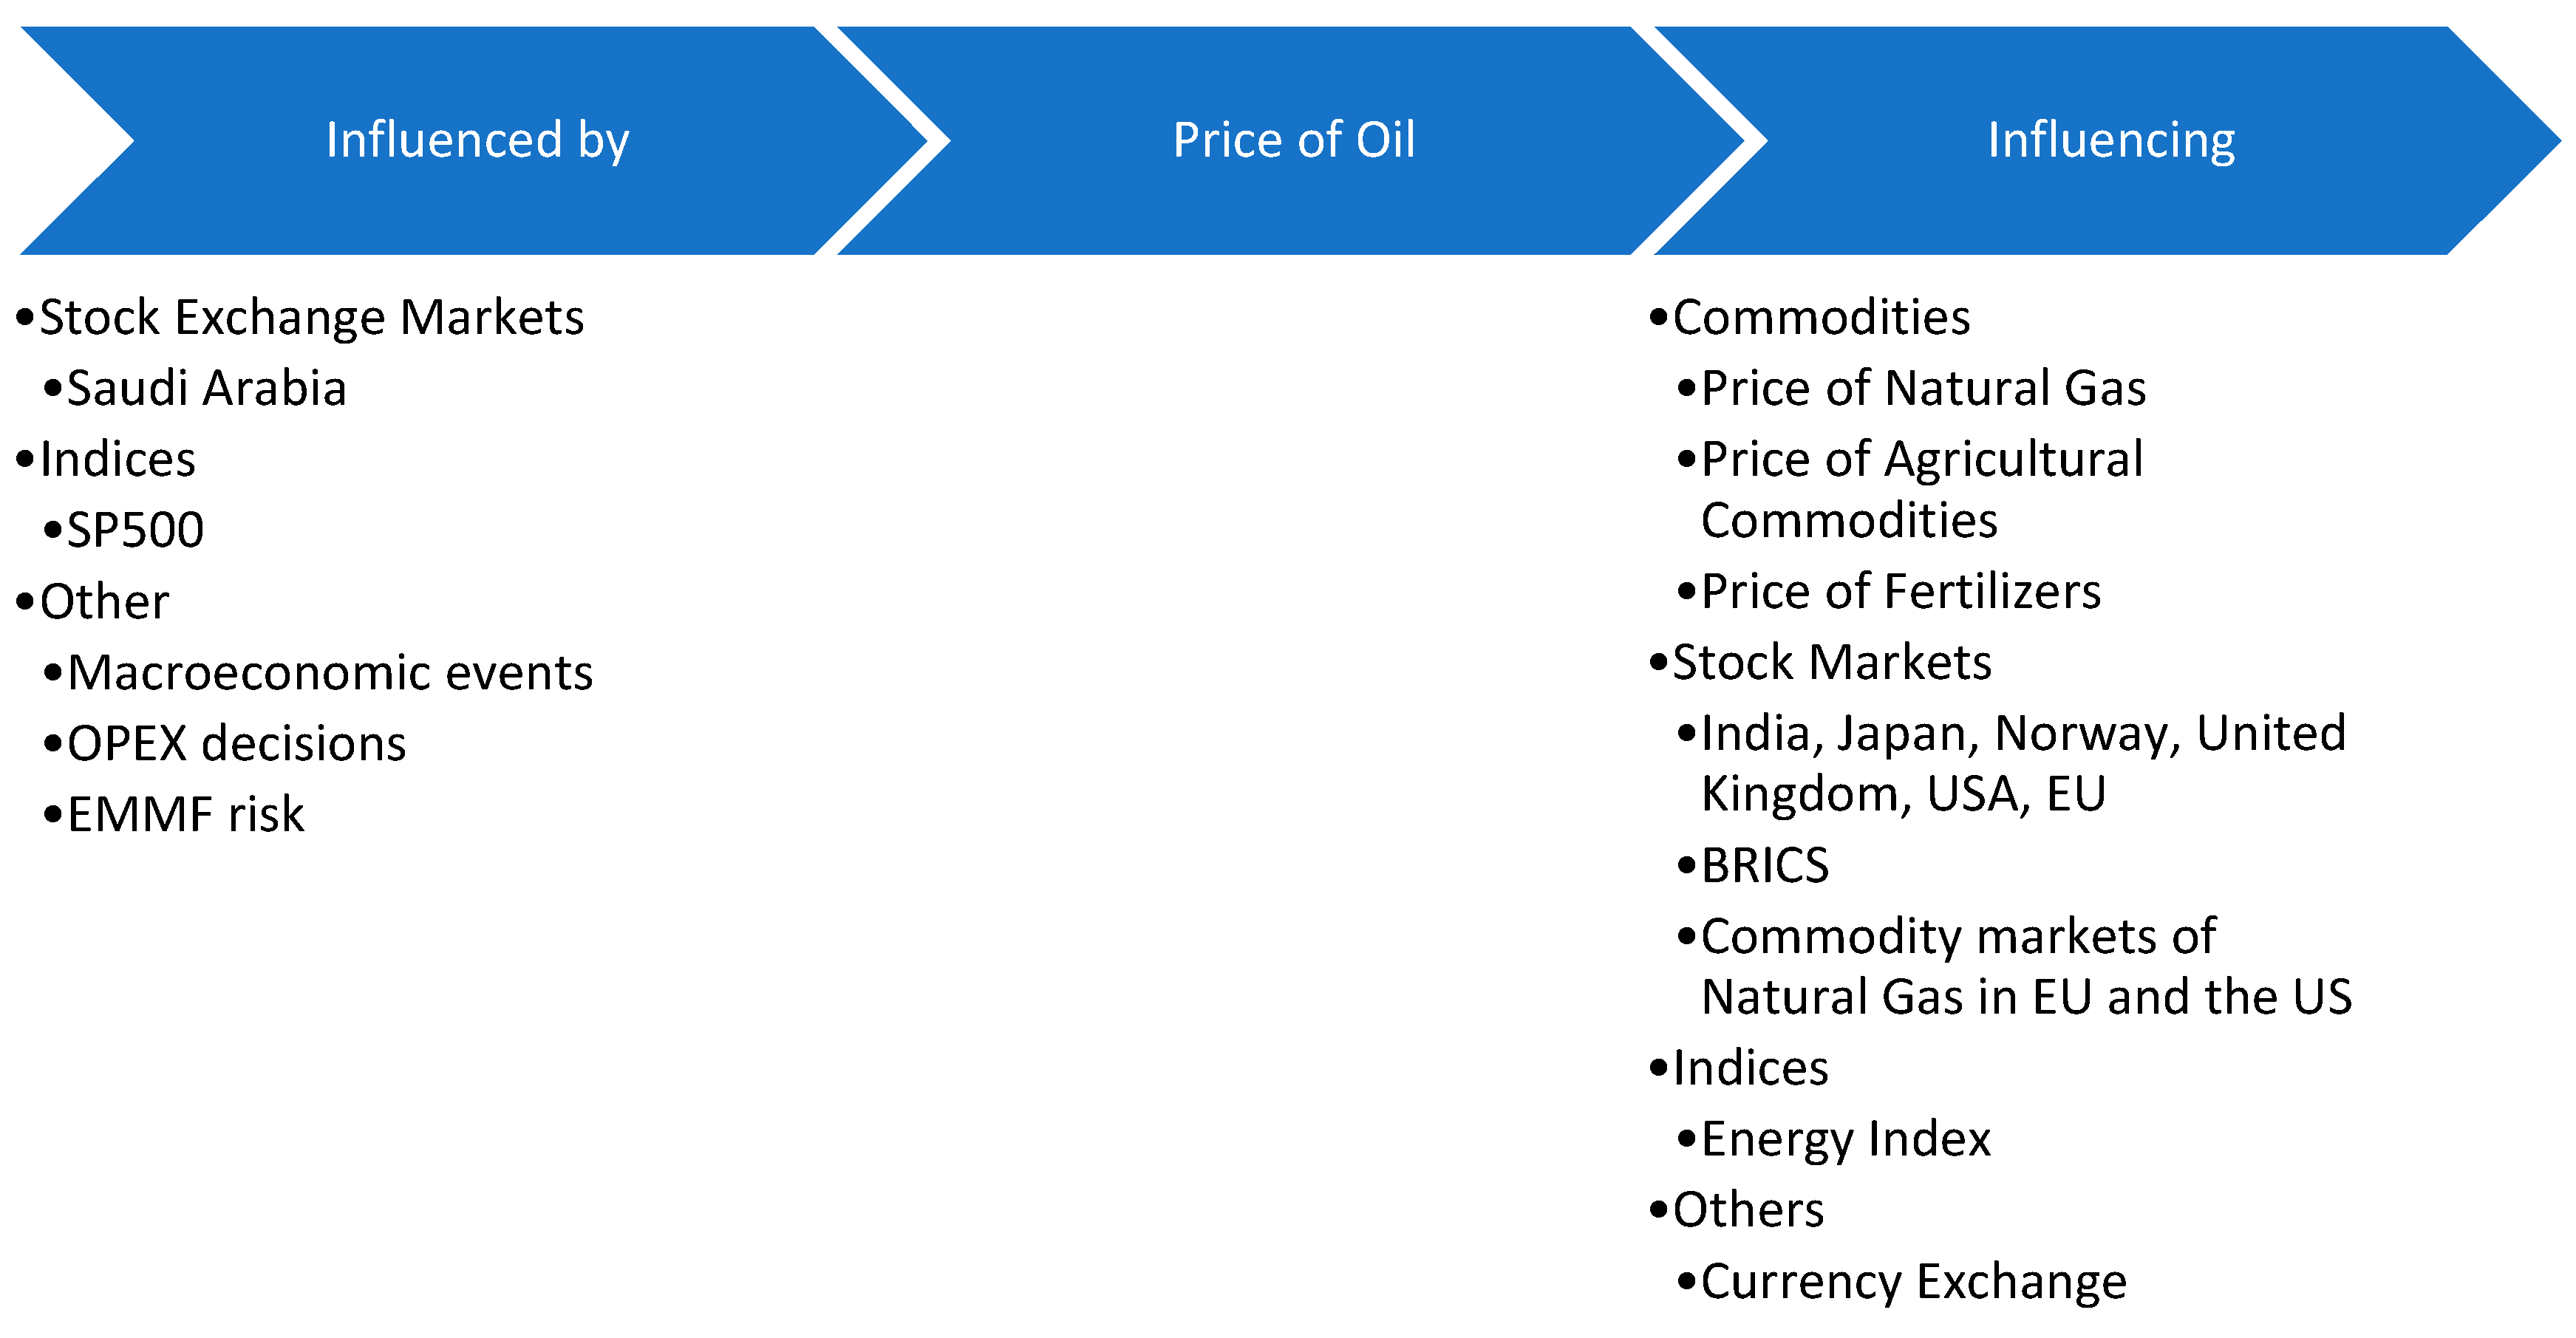
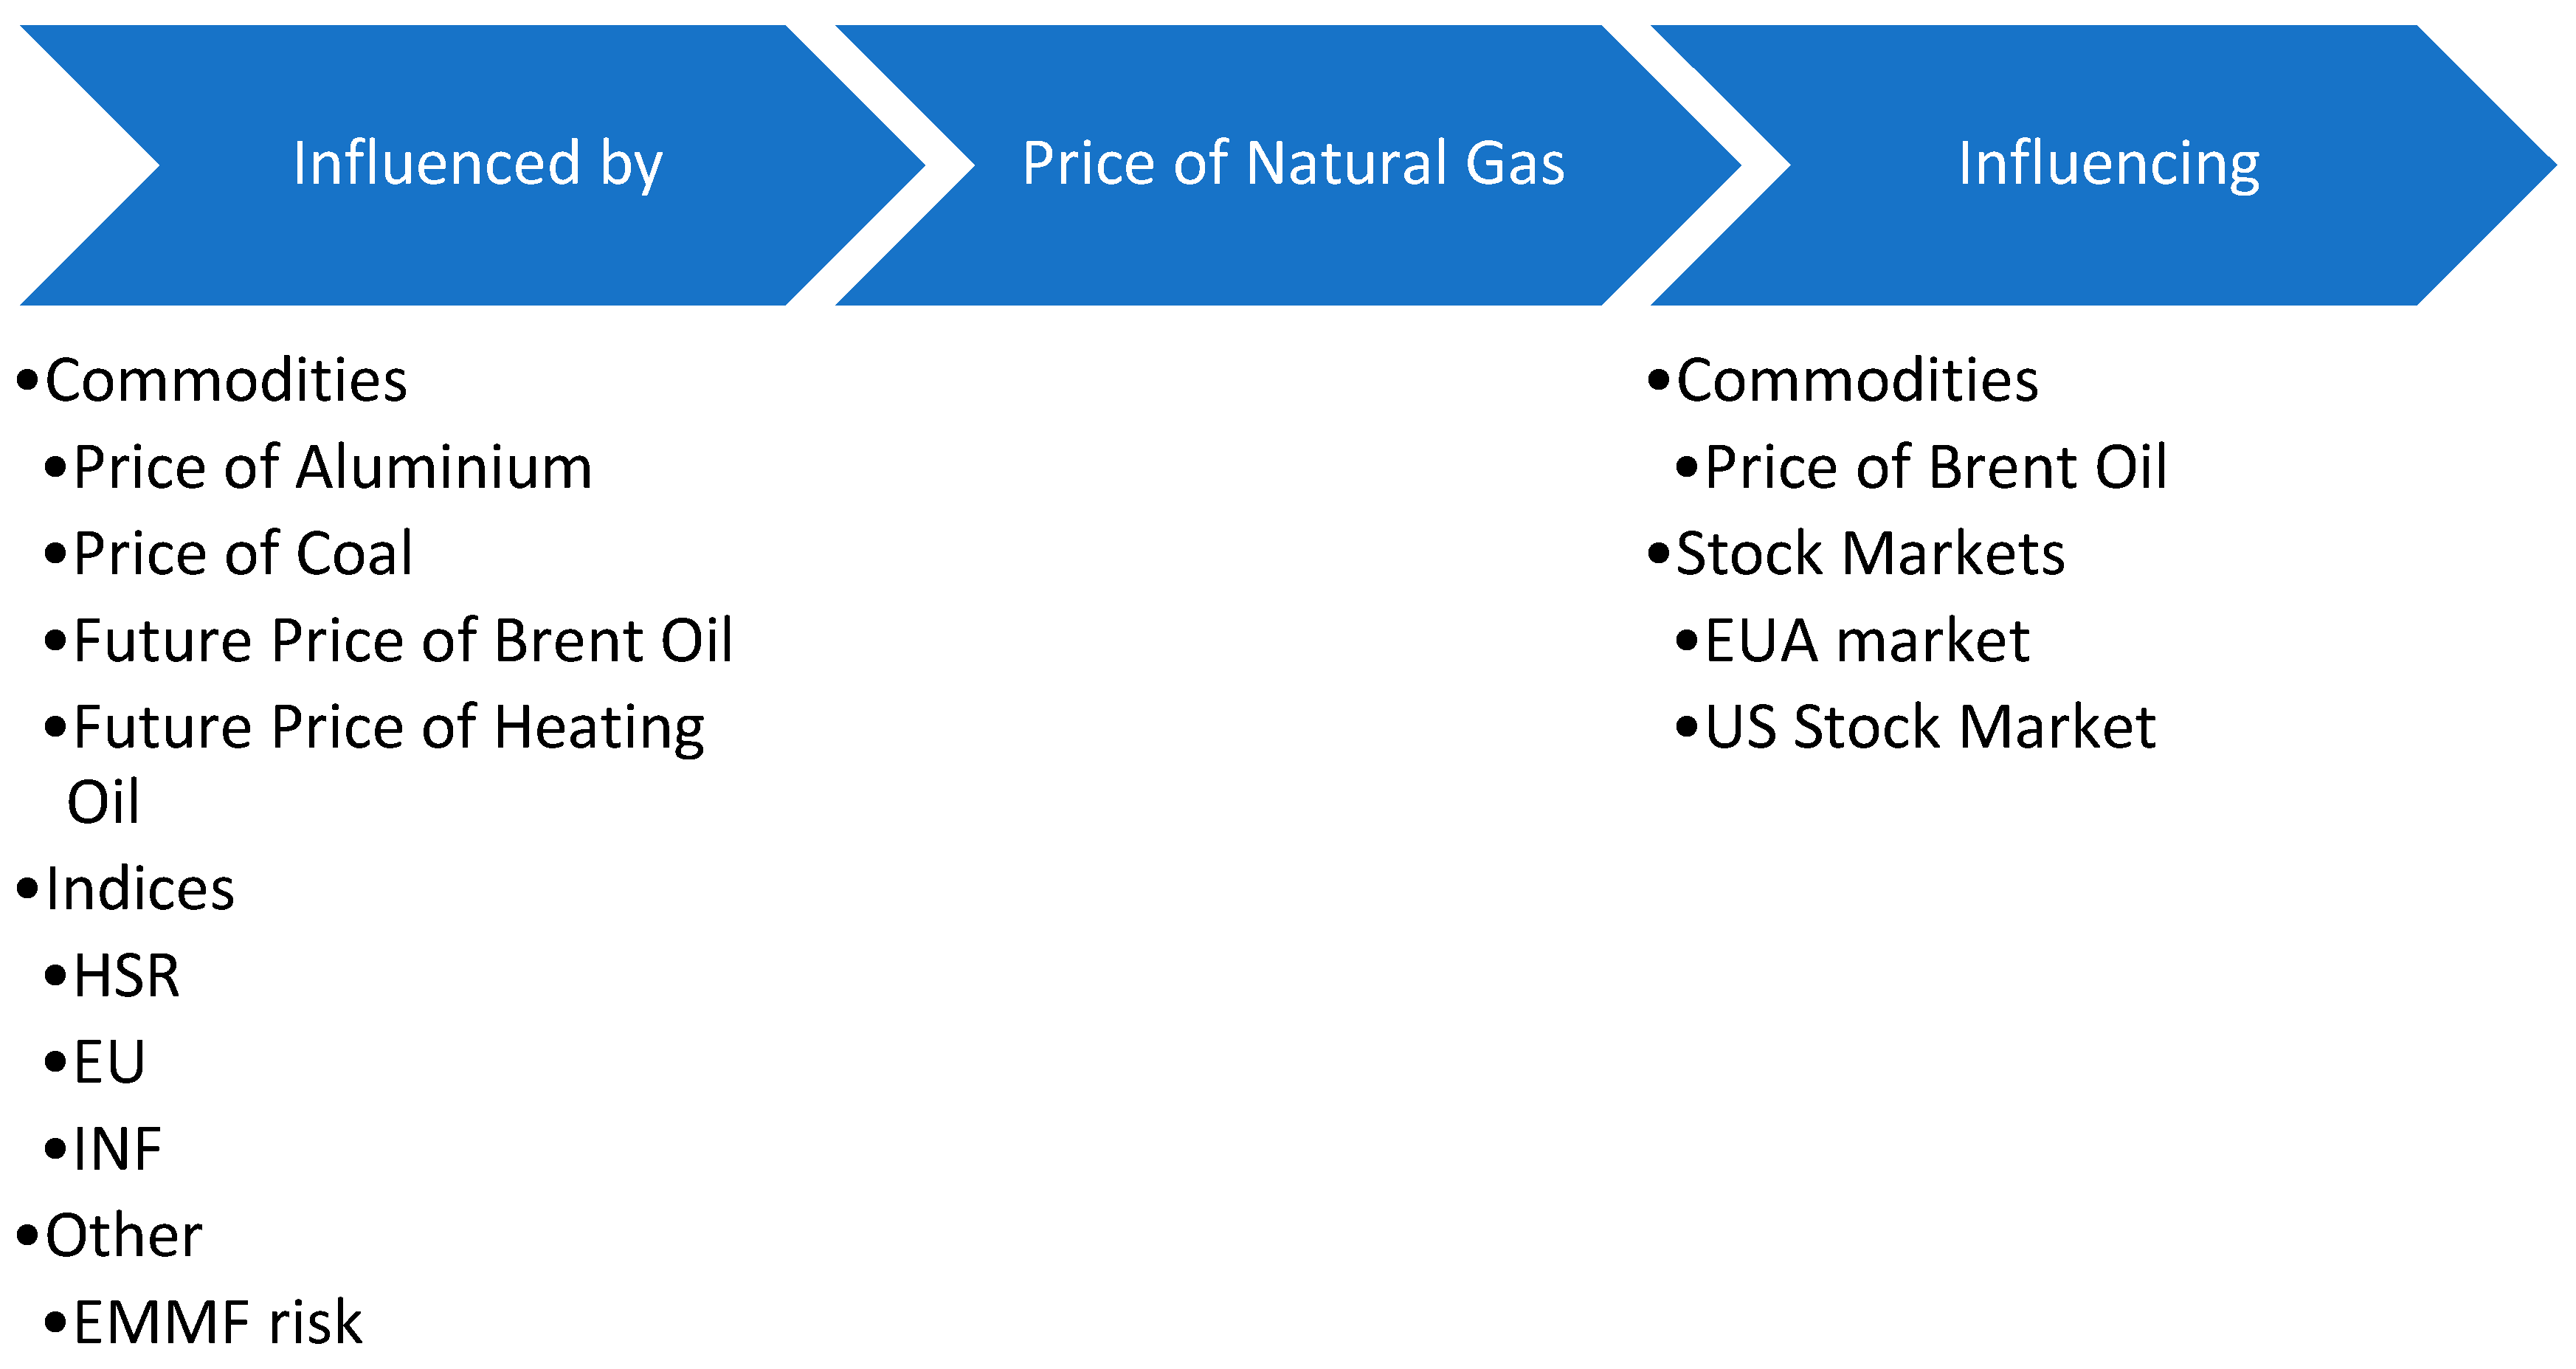
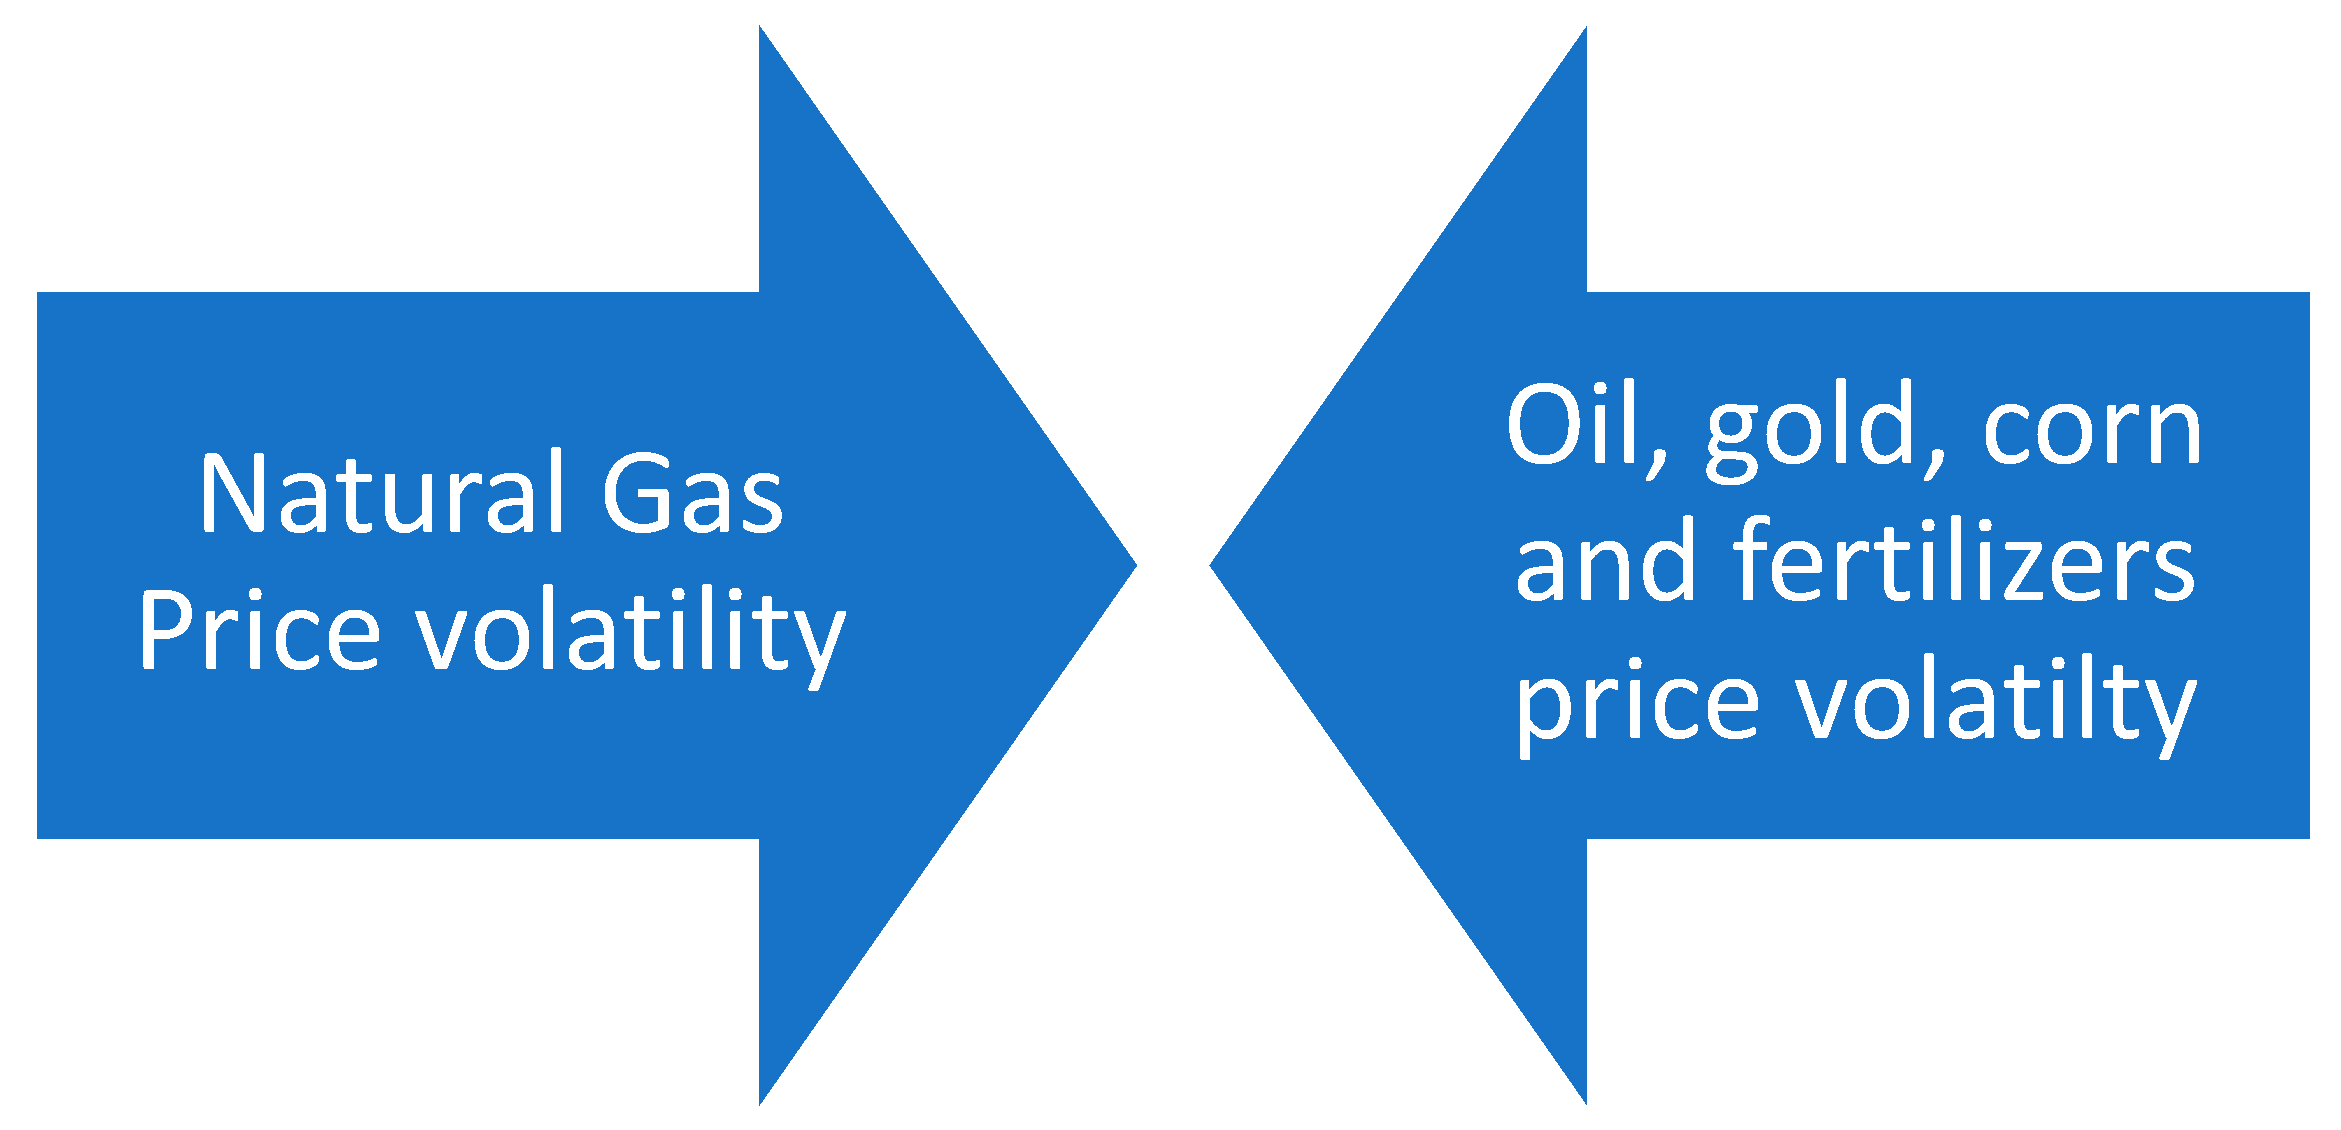
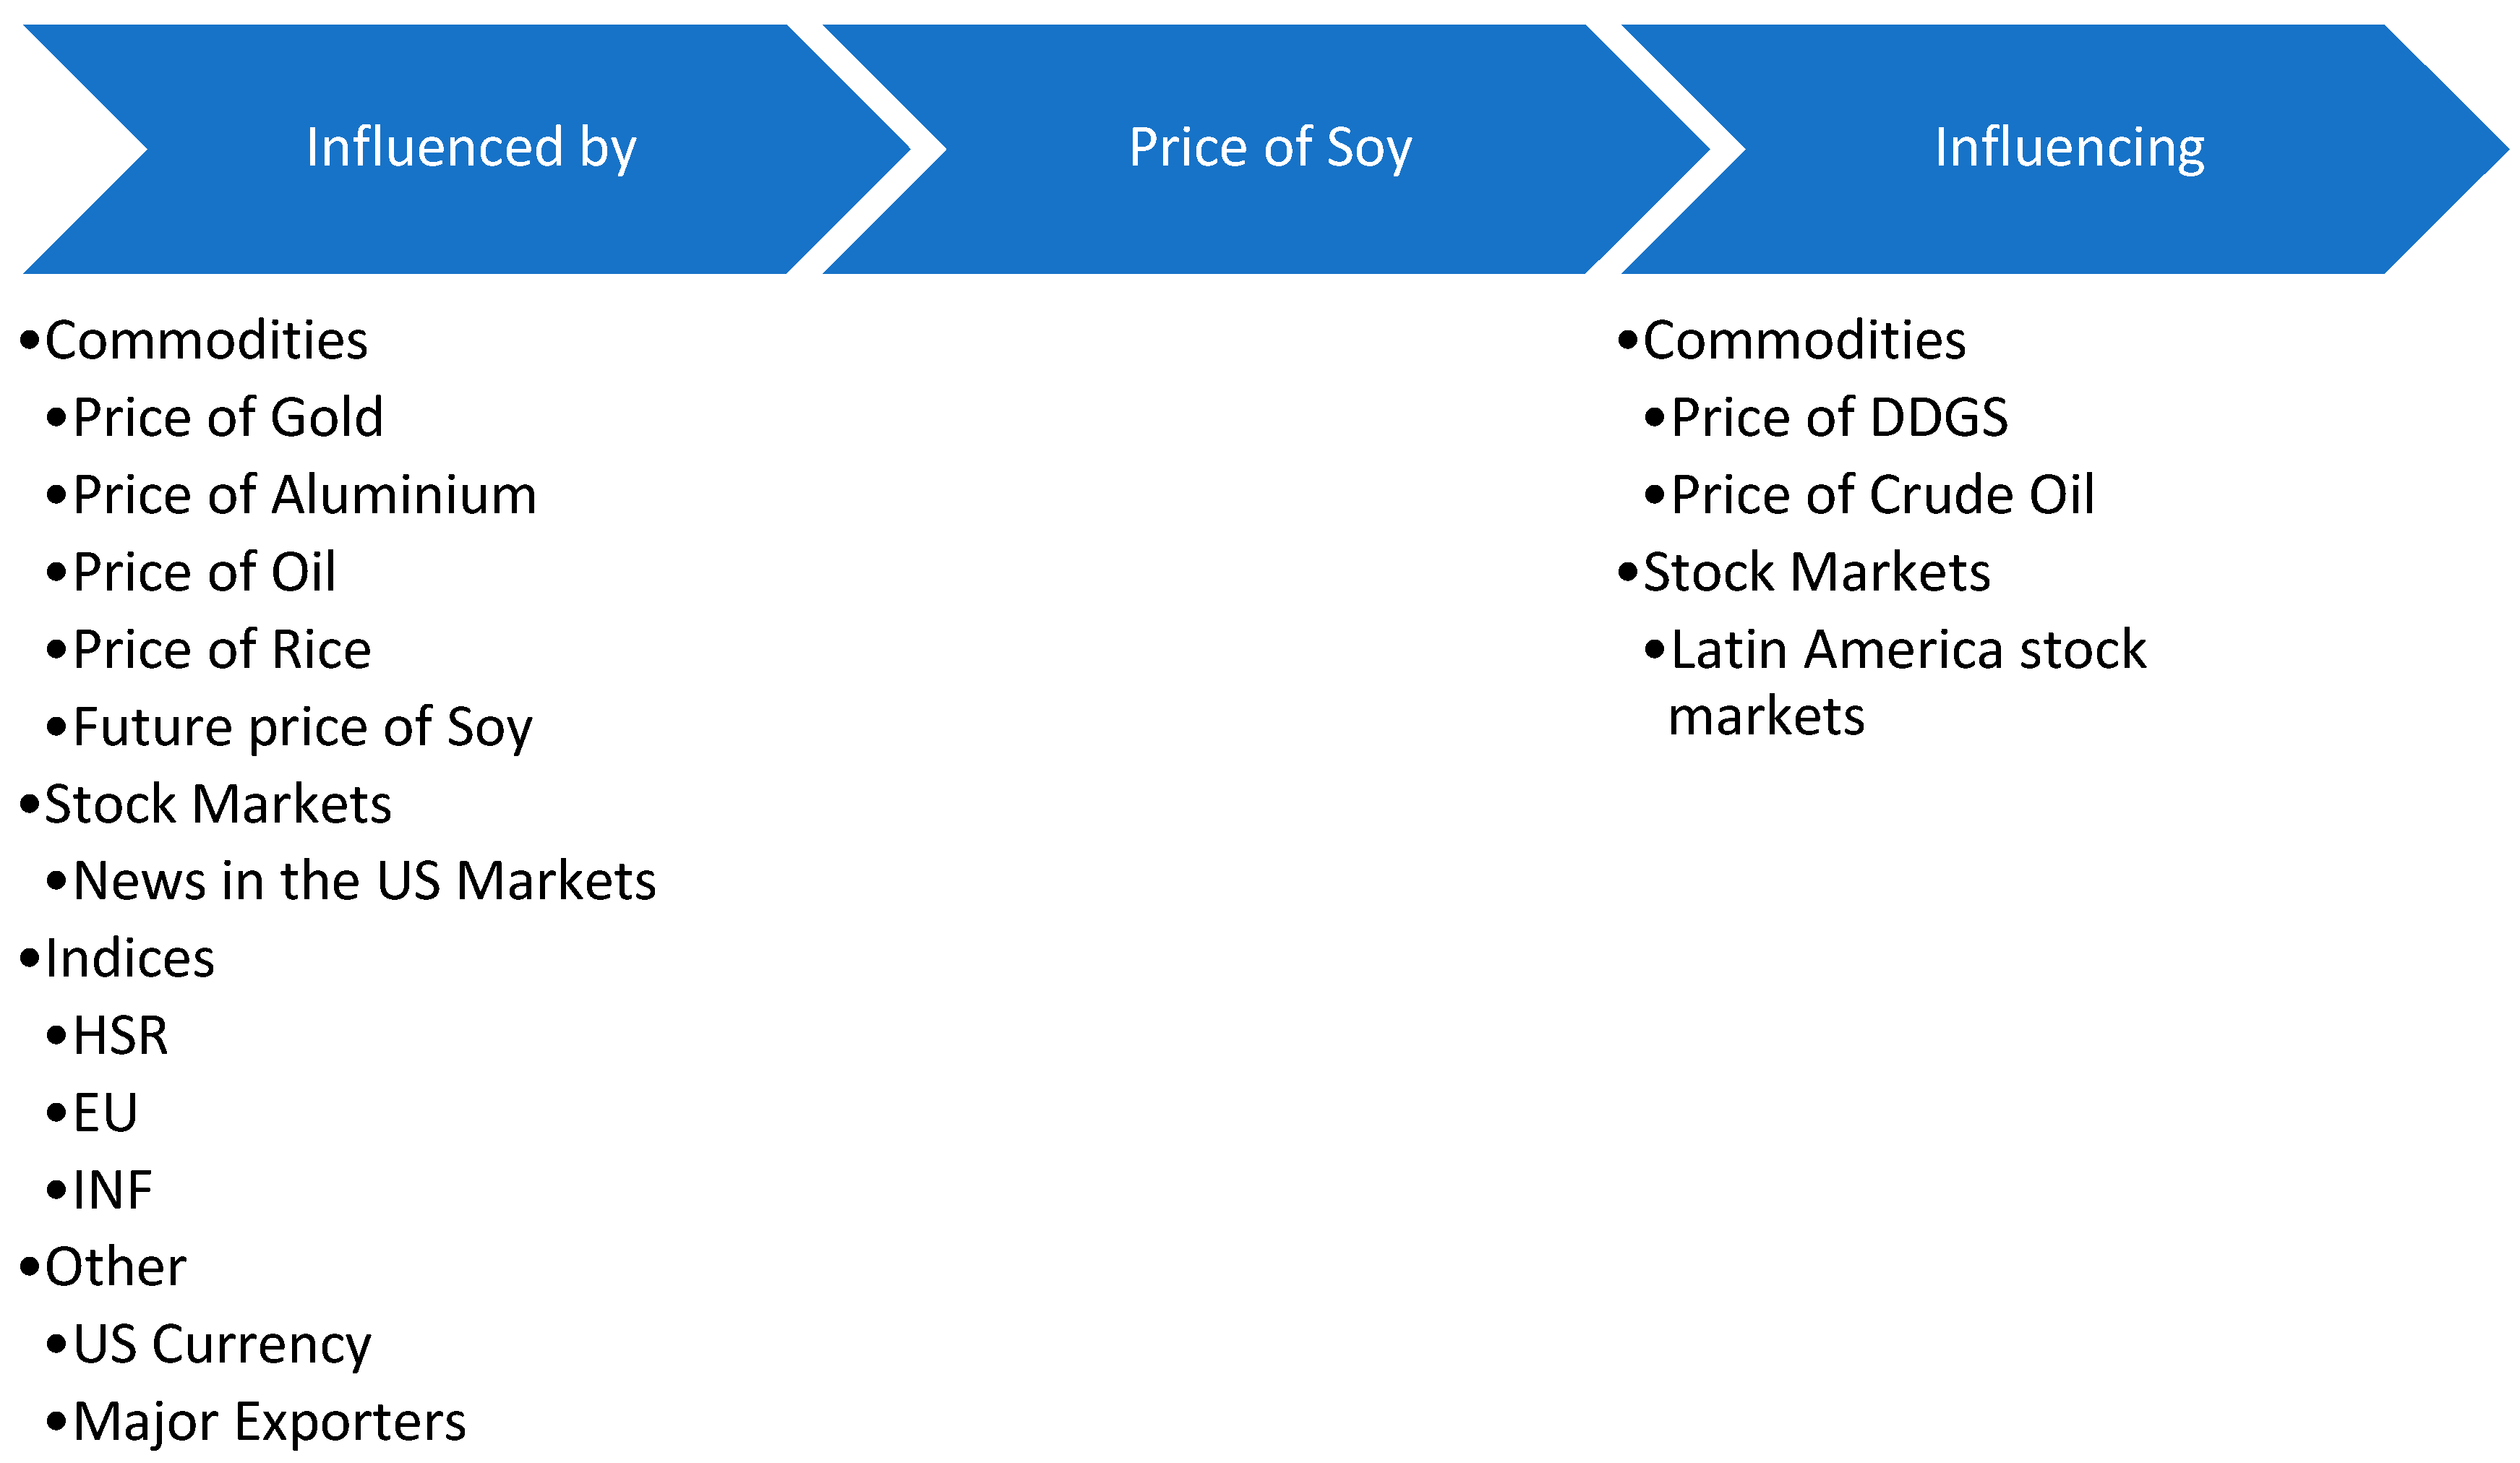
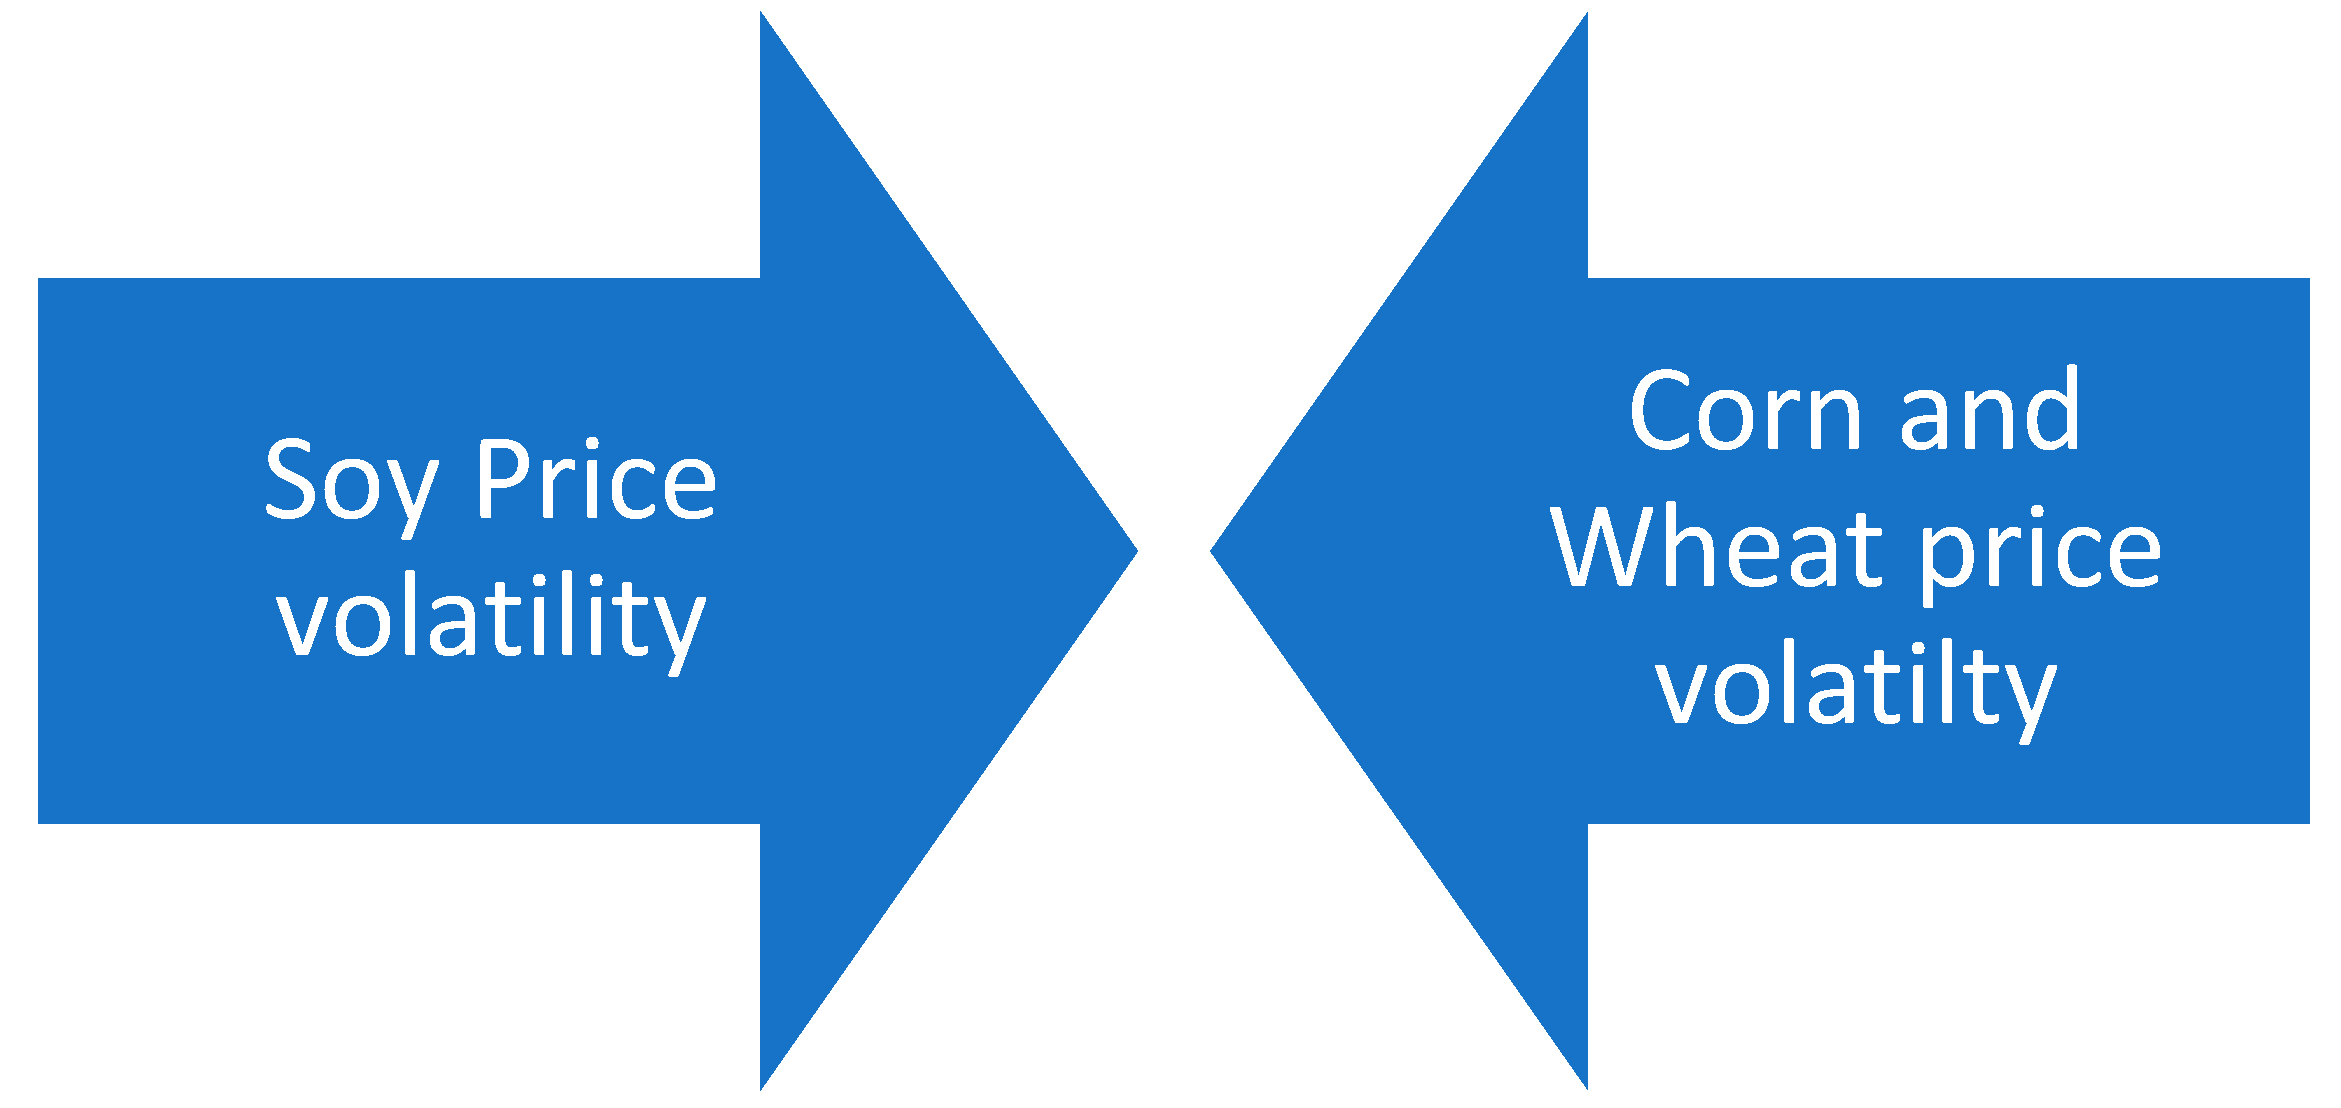
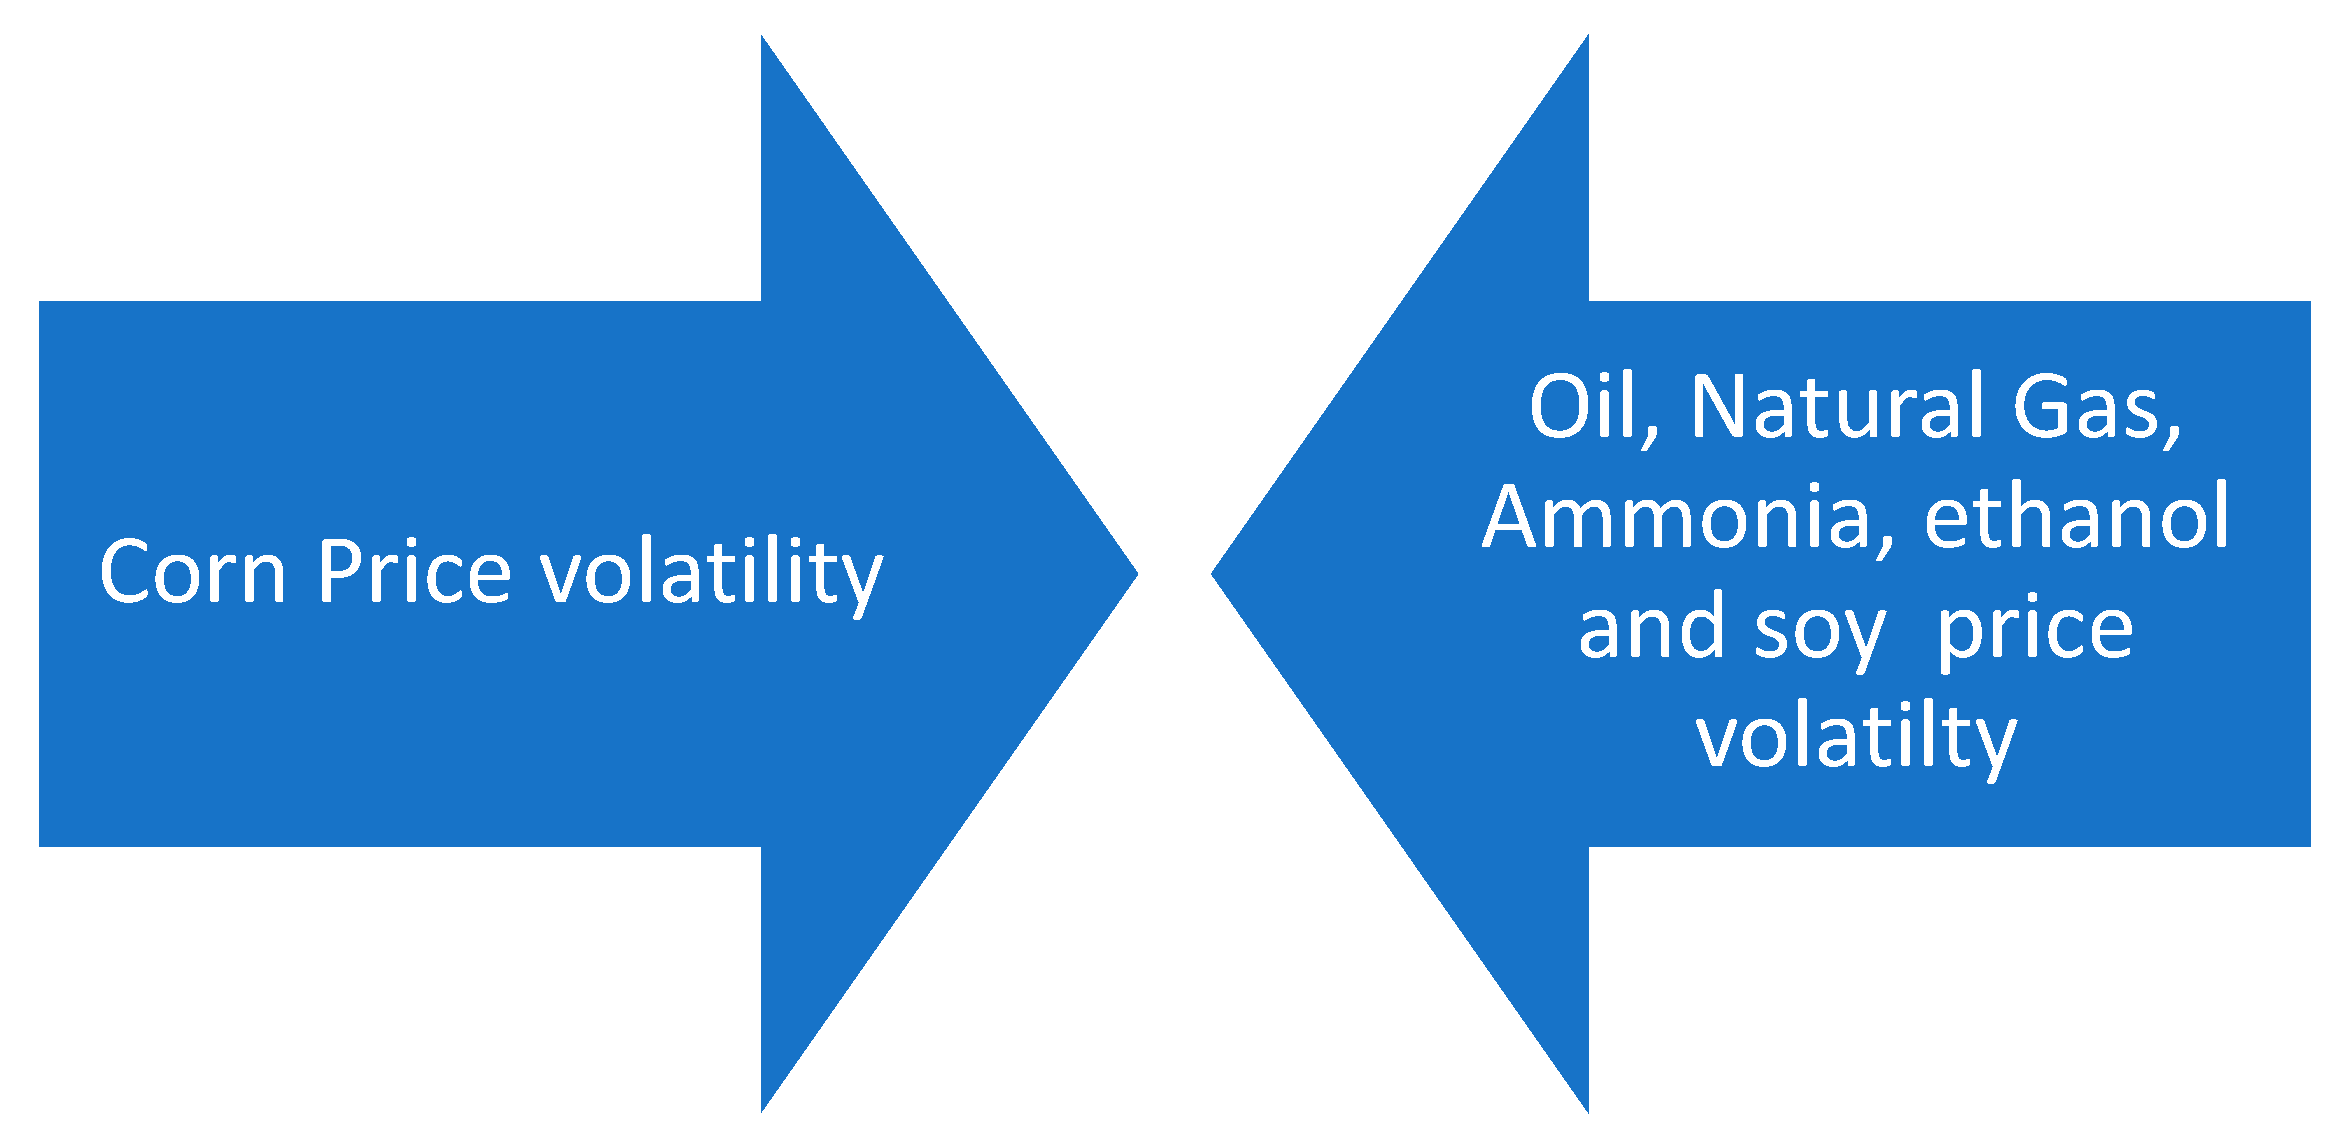
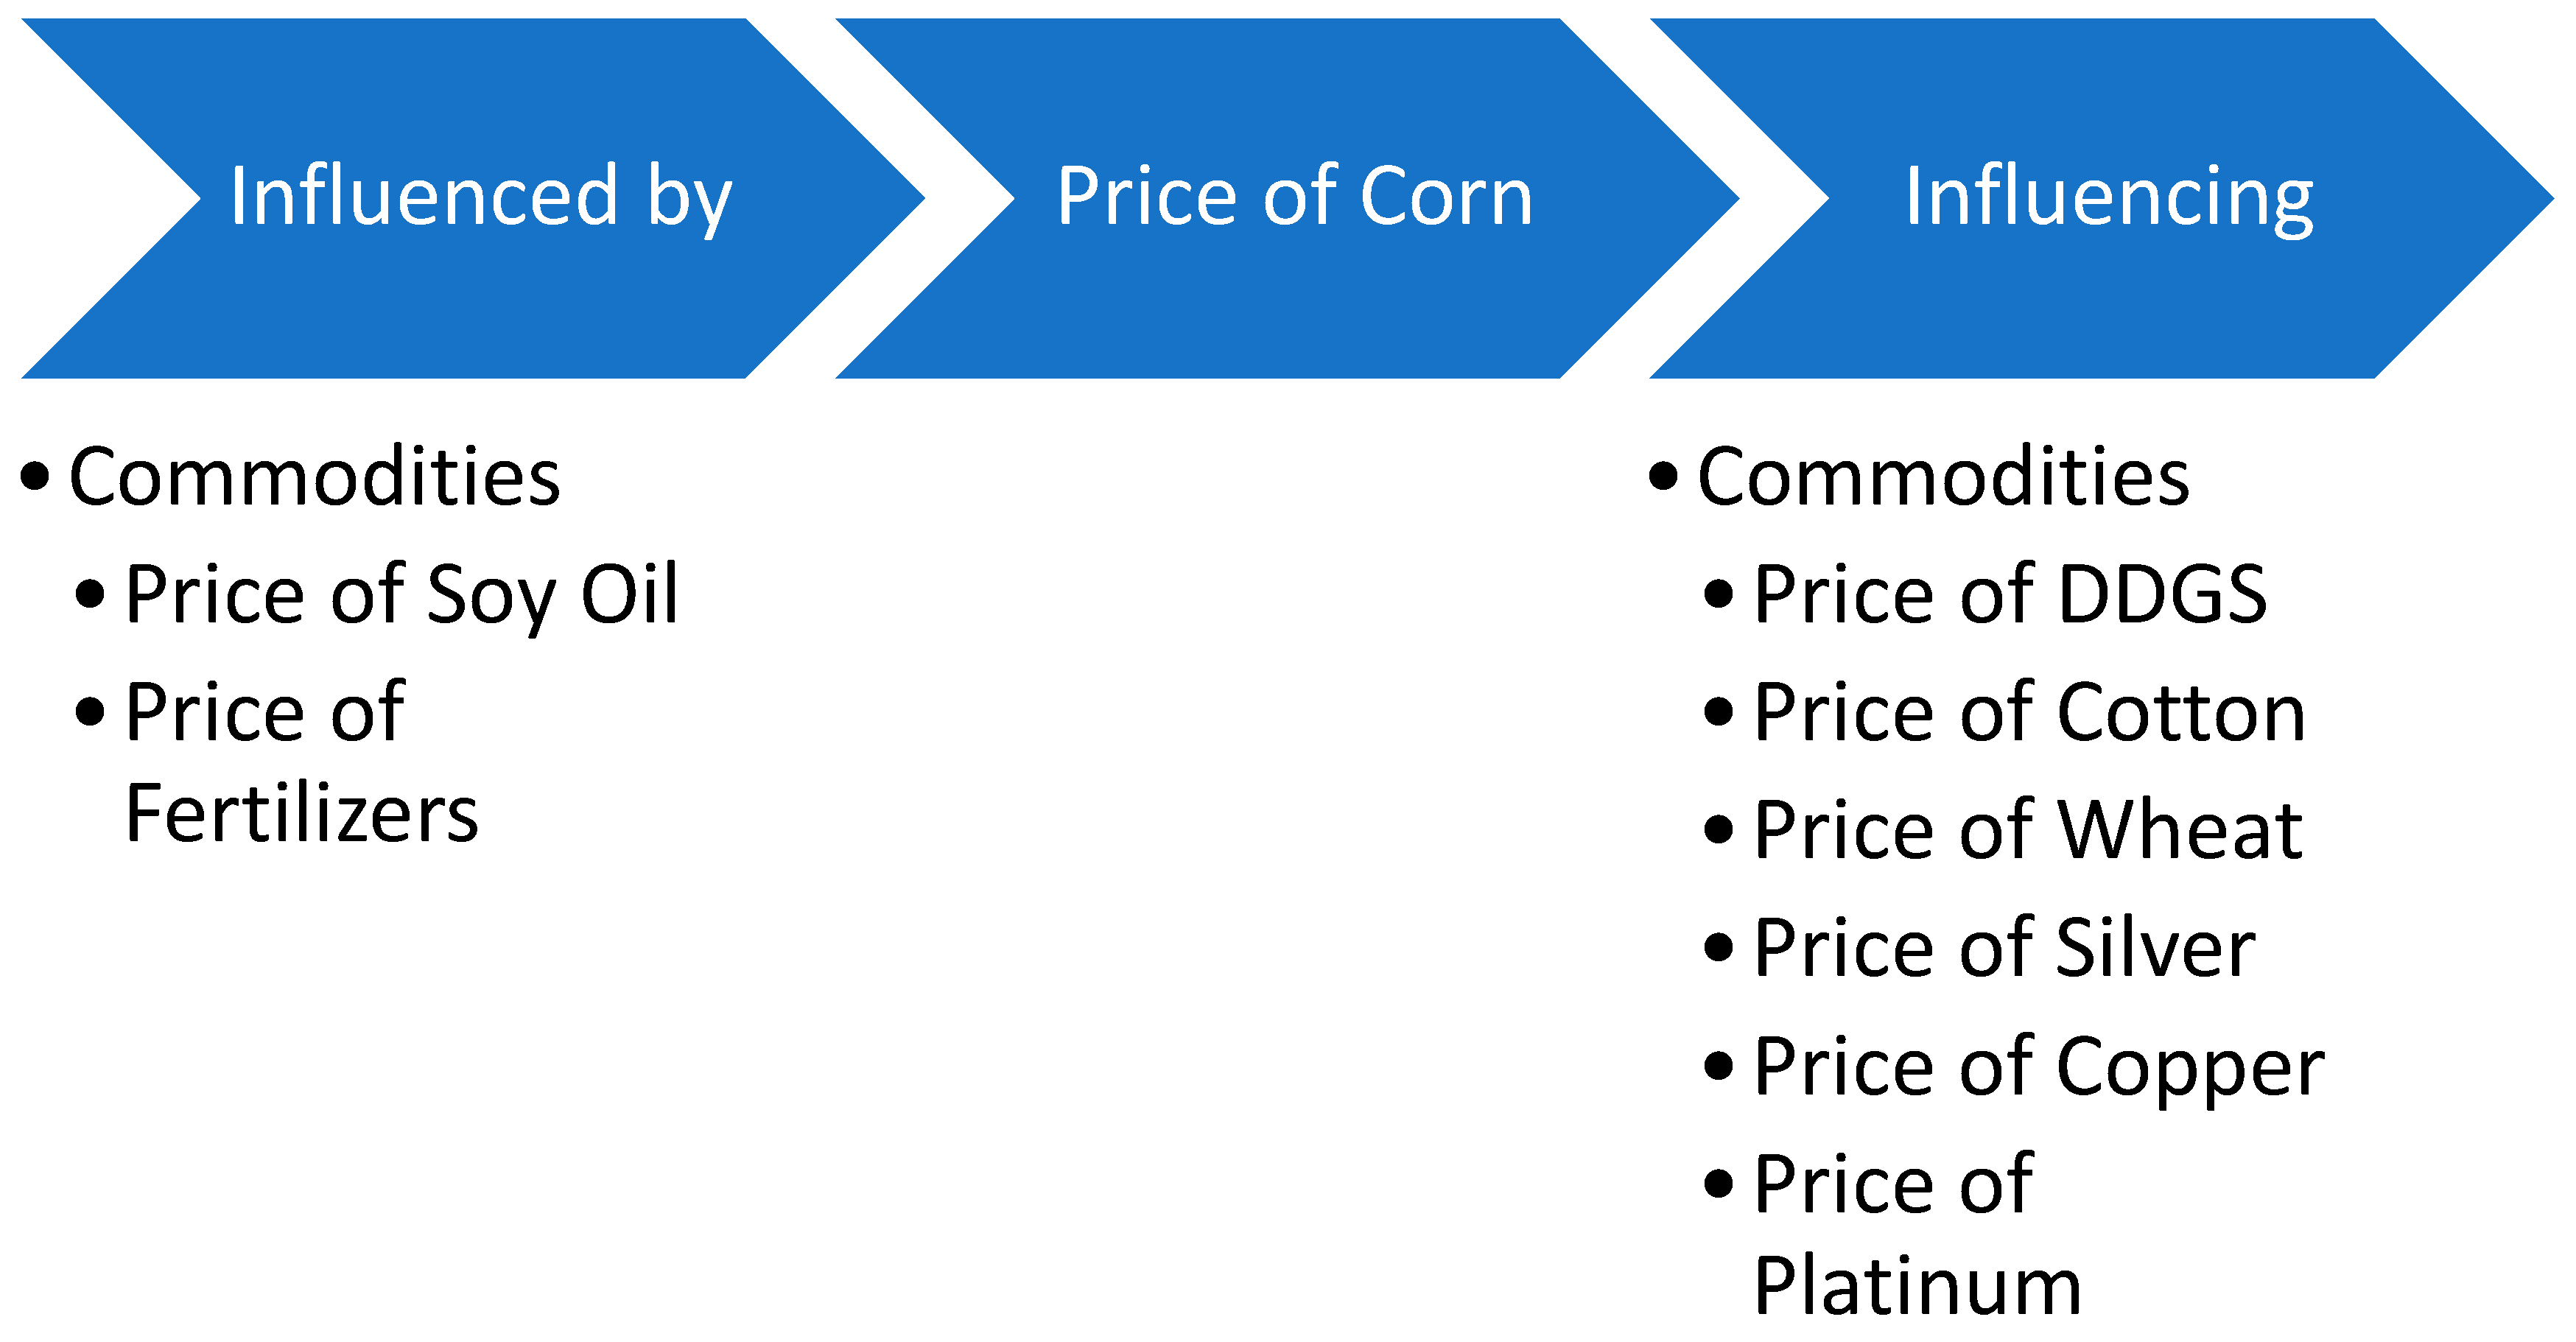
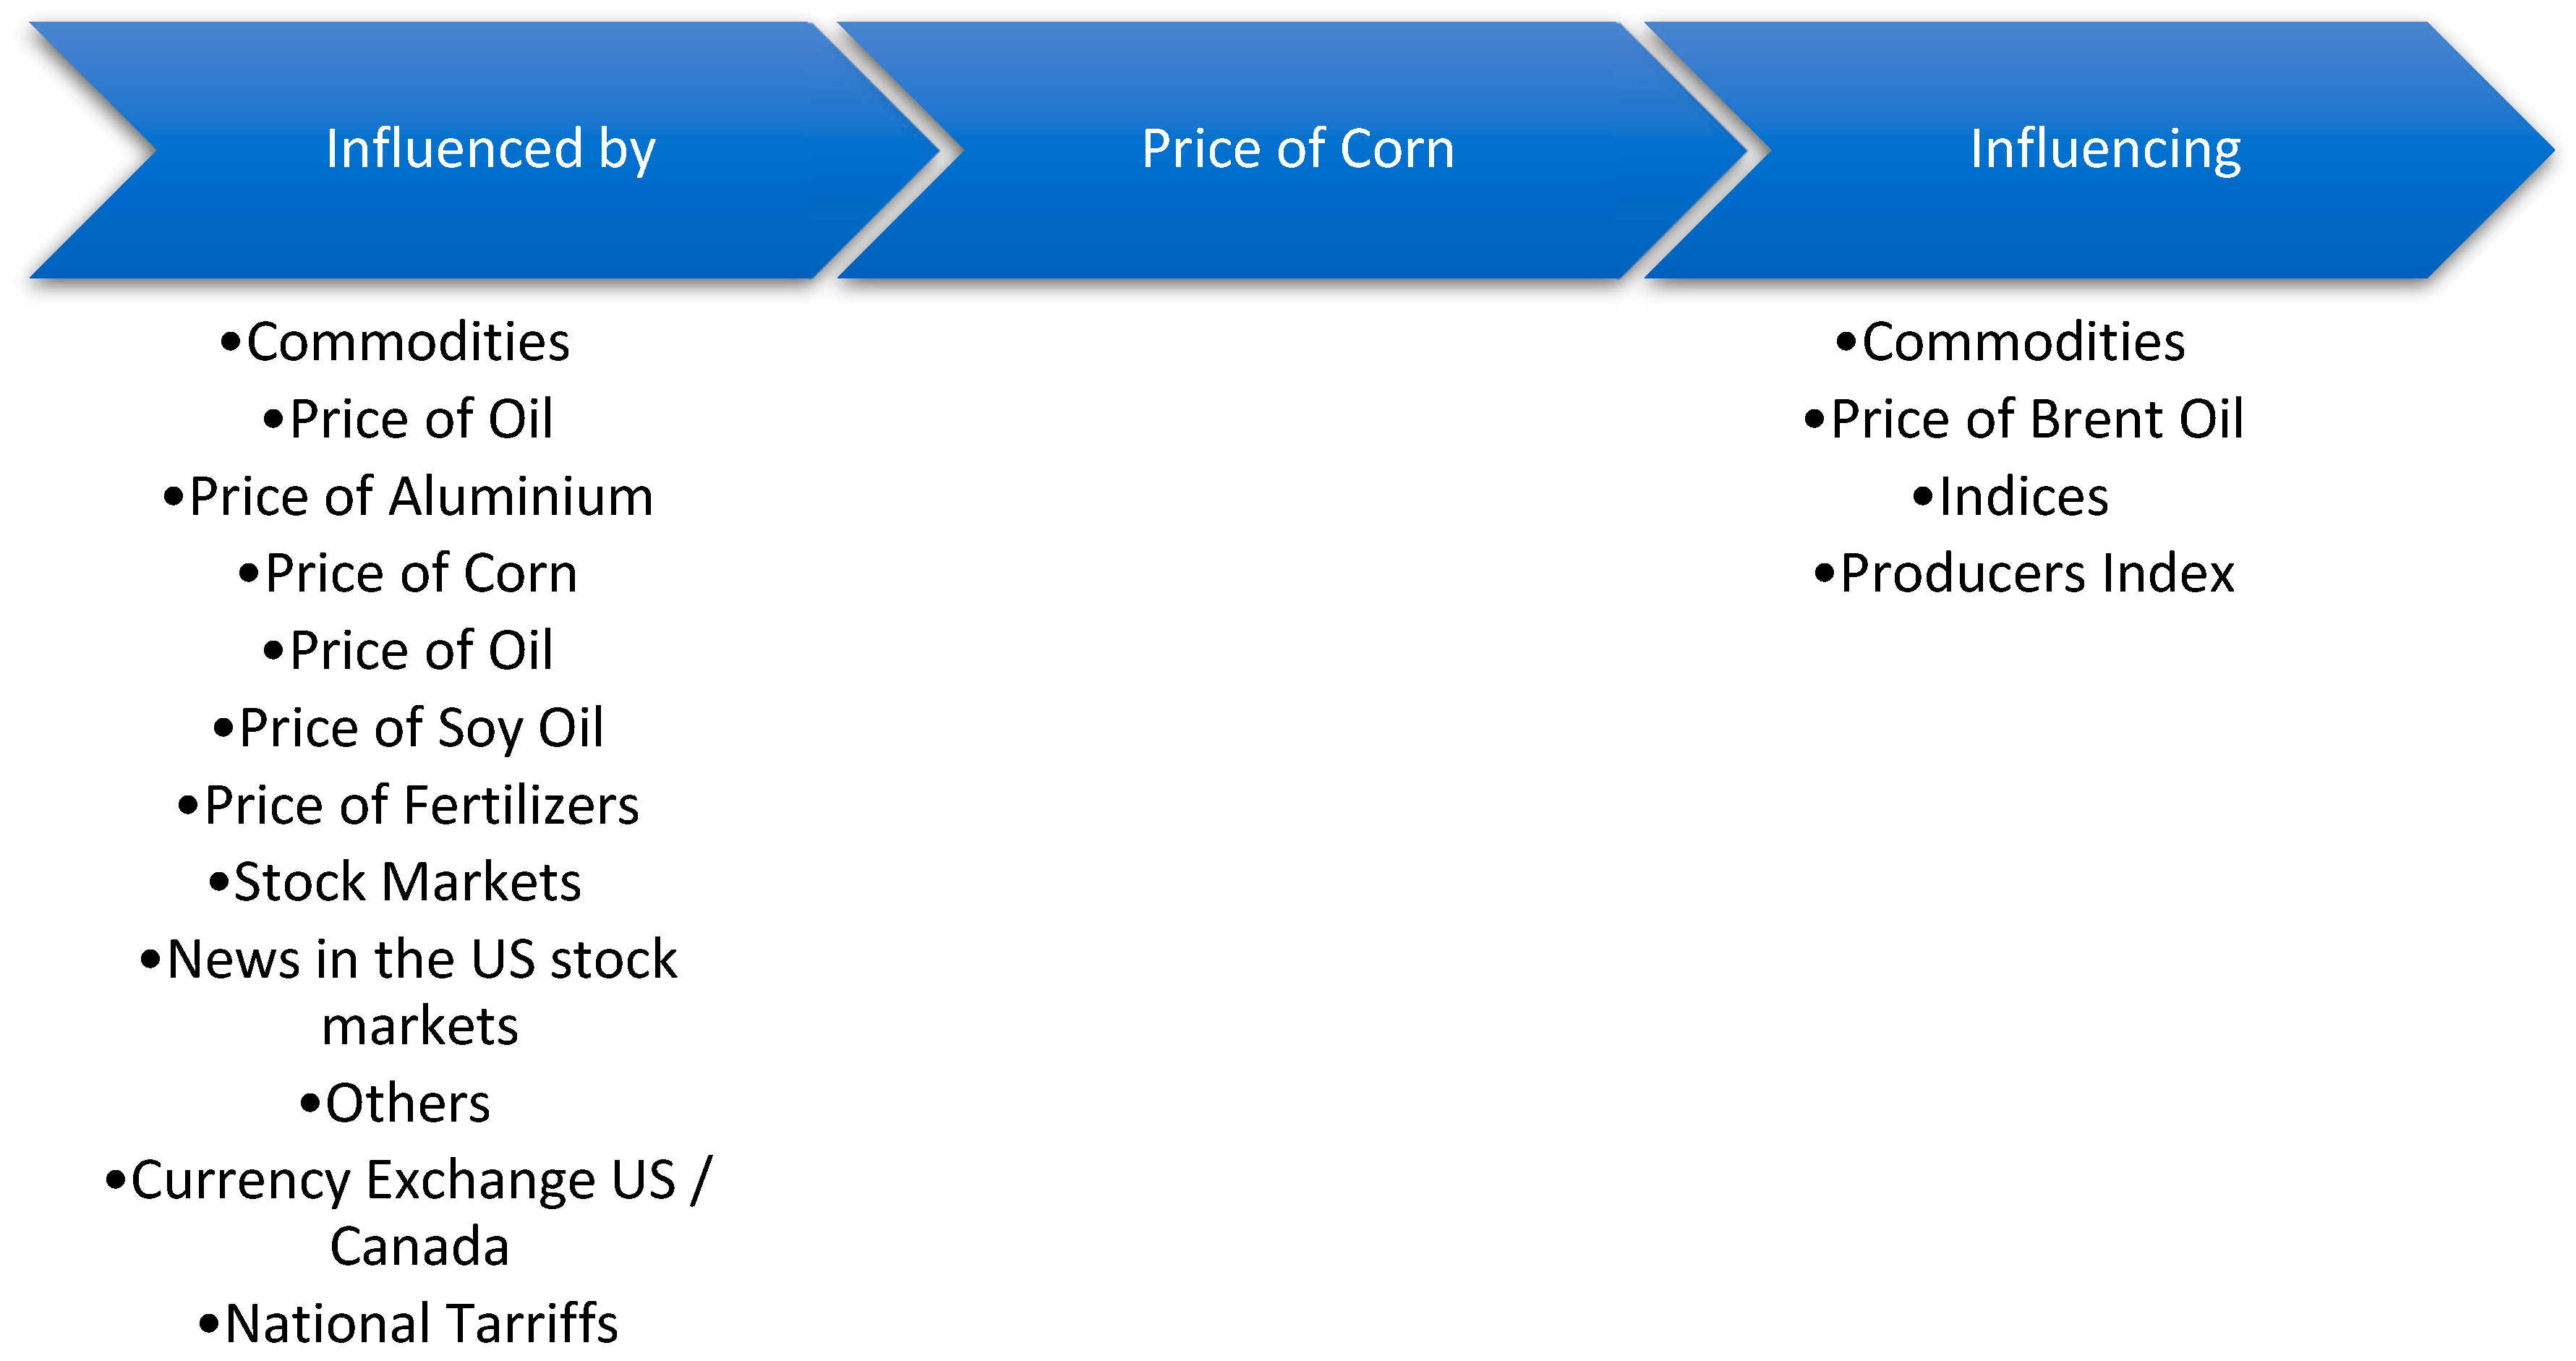
| Keywords | Google Scholar results |
|---|---|
| Volatility spillover, gold | 4.860 |
| Volatility spillover, silver | 1.440 |
| Volatility spillover, aluminum/aluminum | 731 |
| Volatility spillover, copper | 1.230 |
| Volatility spillover, platinum | 604 |
| Volatility spillover, oil | 9.230 |
| Volatility spillover, natural gas | 2.200 |
| Volatility spillover, soybeans | 900 |
| Volatility spillover, corn | 1.630 |
| Volatility spillover, wheat | 1.720 |
| Total | 24.555 |
| Keywords | Google Scholar results |
|---|---|
| Volatility spillover, gold | 4.770 |
| Volatility spillover, silver | 1.420 |
| Volatility spillover, aluminum/aluminum | 695 |
| Volatility spillover, copper | 1.210 |
| Volatility spillover, platinum | 579 |
| Volatility spillover, oil | 8.950 |
| Volatility spillover, natural gas | 2.170 |
| Volatility spillover, soybeans | 867 |
| Volatility spillover, corn | 1.600 |
| Volatility spillover, wheat | 1.690 |
| Total | 23.951 |
| Keywords | Google Scholar Results in Numbers |
|---|---|
| Volatility spillover, gold | 38 |
| Volatility spillover, silver | 20 |
| Volatility spillover, aluminium/aluminum | 12 |
| Volatility spillover, copper | 18 |
| Volatility spillover, platinum | 11 |
| Volatility spillover, oil | 50 |
| Volatility spillover, natural gas | 19 |
| Volatility spillover, soybeans | 15 |
| Volatility spillover, corn | 20 |
| Volatility spillover, wheat | 17 |
| Total | 220 |
| The total number of articles included are 119, nevertheless since some studies research more than one commodity, they appear as duplicates in the current table. | |
| Journals | Number of Publications per Journal |
|---|---|
| African Journal of Agricultural Research | 1 |
| Agricultural & Applied Economics Association | 3 |
| Agricultural and Resource Economics Review | 1 |
| Agricultural Finance Review | 1 |
| Annals of Economics and Finance | 1 |
| Applied Economics | 2 |
| Applied Economics Letters | 2 |
| Applied Energy | 3 |
| Applied Financial Economics | 1 |
| Economic Analysis and Policy | 2 |
| Economic Modelling | 6 |
| Energies | 2 |
| Energy | 5 |
| Energy & Environment | 1 |
| Energy Economics | 16 |
| Energy Finance | 1 |
| Energy Policy | 3 |
| Energy Reports | 1 |
| Ensayos sobre POLÍTICA ECONÓMICA | 1 |
| Environmental Economics and Policy Studies | 1 |
| Eurasian Economic Review | 1 |
| Finance Research Letters | 3 |
| Food Policy | 1 |
| Global Finance Journal | 2 |
| International Economics | 1 |
| International Journal Of Business and Finance Researc | 1 |
| International Journal of Business and Globalisation | 1 |
| International Journal of Finance and Economics | 2 |
| International Journal on Recent Trends in Business and Tourism | 1 |
| International Review of Economics and Finance | 4 |
| International Review of Financial Analysis | 3 |
| Journal of Agricultural and Resource Economics | 2 |
| Journal of Agricultural Economics | 1 |
| Journal of Business Economics and Management | 1 |
| Journal of CENTRUM Cathedra: The Business and Economics Research Journal | 1 |
| Journal of Cleaner Production | 3 |
| Journal of Commodity Markets | 1 |
| Journal of Economic Studies | 1 |
| Journal of Futures Markets | 1 |
| Journal of International Financial Markets, Institutions and Money | 2 |
| Journal of International Money and Finance | 1 |
| Journal of Natural Gas Science and Engineering | 1 |
| Journal of Public Affairs | 1 |
| North American Journal of Economics and Finance | 4 |
| Physica A: Statistical Mechanics and its Applications | 3 |
| Research in International Business and Finance | 2 |
| Resources Policy | 15 |
| Review of Quantitative Finance and Accounting | 1 |
| Risks | 1 |
| Tactful Management Research Journal | 1 |
| The Journal of Applied Business Research | 1 |
| The Journal of Future Markets | 1 |
| Sum | 119 |
Disclaimer/Publisher’s Note: The statements, opinions and data contained in all publications are solely those of the individual author(s) and contributor(s) and not of MDPI and/or the editor(s). MDPI and/or the editor(s) disclaim responsibility for any injury to people or property resulting from any ideas, methods, instructions or products referred to in the content. |
© 2024 by the authors. Licensee MDPI, Basel, Switzerland. This article is an open access article distributed under the terms and conditions of the Creative Commons Attribution (CC BY) license (http://creativecommons.org/licenses/by/4.0/).


