1. Introduction
With the intention of effectively performing analysis on the impact of Distributed Energy Resources (DERs) in the Medium Voltage (MV) and Low Voltage (LV) networks, utilities must first have in place the data necessary to build detailed models of the Distribution Network (DN) components [
1], as well as advanced simulation tools that allow for comprehensive analysis to evaluate system performance and identify potential issues [
2].
The fact that DERs are geographically dispersed, and that their engineering treatment, i.e., energy planning, stationary or dynamic grid analysis and protection, mainly depend on some geographical qualities, makes Geographic Information System (GIS) environments ideal for their study [
3]. Furthermore, GIS have become an important tool for utilities and city planners and has been embedded in their internal processes from asset and operations management to planning, design, and engineering. Various works on the scientific literature has focused on the integration of GIS environments for adding value to decision processes regarding the topology of electrical power systems and DERs potential assessment [
4,
5,
6,
7].
To make the simulation of DER´s behavior more accessible and flexible, the use of open-source software tools such as OpenDSS® (Open Distribution System Simulator) and open-source GIS software (QGIS) has been recently explored and used by utilities and research laboratories across the world [
8,
9,
10,
11,
12].
However, simulation result with these tools highly depend on the quality and availability of network data (location and capacity of distribution transformers, capacitors and DERs, as well as type, material, size, and length of conductors, etc.) [
13], and the necessary work to translate (
clean, fix, aggregate or remove incorrect, corrupted, incorrectly formatted, duplicated, or incomplete) data within the GIS network to the respective power flow simulation tools is not only arduous, but often requires third party commercial software packages [
14] that needs licensing, and that do not allow access to the source code to change or add any functionalities and new algorithms from users.
Several works in scientific literature present various approaches for the manipulation of the GIS database to automatically generate network models. The authors in [
15,
16,
17] report on the construction of network models using MATLAB® for the extraction, processing, or network modeling. However, a common feature and liability of these studies is the fact that recurring modifications in the GIS databases require new interactions of file exchanges between software packages, a repetitive and time-consuming task. It is also often the case that studies of photovoltaic (PV) penetration are carried out using synthetic data of the DERs characteristics [
18,
19,
20,
21,
22] with simplified or generic networks, this reduces the accuracy on capturing specific regional or site-specific factors and limit the validation opportunities for the models and the correct representation of the real distribution circuit behavior [
23].
This paper reports on the implementation and modification of a software plugin called QGIS2OpenDSS, developed by researchers at the Electric Power & Energy Research Laboratory (EPERLab) of the University of Costa Rica (UCR) [
24]. This tool creates the OpenDSS network model directly from an open-source geographic information system (QGIS) using PyQGIS, QGIS library for executing Python code [
25]. Although limited by its Graphical User Interface (GUI), OpenDSS has been used in several studies, harnessing the functionality of plugins that are capable of automatically scripting the required connection matrices [
26]. Nevertheless, exploring the use of the QGIS2OpenDSS plugin in a real circuit with real data on DER penetration has not been widely investigated. For this reason, the main contribution of this paper is to adapt and use real PV penetration information from a GIS database of a distribution network circuit, using the QGIS2OpenDSS plugin to build the DN model, and then conduct analysis using the constructed simulations in OpenDSS. A distribution feeder with more than 60% penetration of renewable energy has been chosen and the required modification for the selected plugin has been conducted.
The integration of this tool in the software stack of the DNOs in the Dominican Republic is an important contribution. Recent studies on the issues regarding the development of DERs in the island have identified that the lack of access and capacity on specialized electrical system analysis software for DER interconnection procedures create unnecessary delays on the approval of projects and the further development of the market due to the current established policies [
27].
This paper is organized as follows:
Section 2 includes a summary of QGIS2OpenDSS and the software stack behind it, as well as the required list of attributes for each DN element to build its model in OpenDSS, and the modifications made to the plugin for the case study. In addition,
Section 3 explains the Distribution Network Data Extraction Process from a real DN feeder (VOLG101) with high renewable penetration (>60% PV) in Santiago de los Caballeros, Dominican Republic, with 7,428 customers, while a demonstration of the plugin capabilities is shown in
Section 4. Finally,
Section 5 illustrates the type of analysis that can be carried out to study the impact of PV generation, and future work and conclusions are drawn in
Section 6.
2. Materials and Methods
To effectively perform an analysis on the impact of Distributed Energy Resources (DERs) in the Medium Voltage (MV) and Low Voltage (LV) networks, utilities must first have in place the data necessary to build detailed models of the Distribution Network (DN) components, as well as advanced simulation tools that allow for comprehensive analysis to evaluate system performance and identify potential issues. This section presents a description of the open-source GIS software package in which the plugin was built (QGIS), and the power engineering software for which the models are created (OpenDSS), as well as a summary of the most important aspects of QGIS2OpenDSS plugin architecture and functionalities.
2.1. QGIS
Geographical Information Systems (GIS) are a powerful tool which can be defined as an integrated set of data, hardware, software, and processes designed as a computer system for gathering, managing, mapping, and analyzing spatial data [
28]. GIS are now being widely used by distribution energy utilities to manage and store information about the characteristics of their assets, which in turn allows power engineers to use this data (overhead lines distance, conductor type, transformer data, customer location and consumption, etc.) to create detailed network models.
QGIS is an Open-Source Geographic Information System (GIS) licensed under the GNU General Public License, and part of the Open-Source Geospatial Foundation (OSGeo), which allows developers to create plugins to add additional features that are not part of the original software stack [
29].
2.2. OpenDSS
OpenDSS is a comprehensive electrical power system simulation tool primarily for electric utility power distribution systems. It is an open-source software package that supports nearly all frequency domain (RMS sinusoidal steady-state) analyses commonly performed on electric utility power distribution systems by the DNO [
30].
A key aspect of this script-driven simulation tool is that it works with numerous solution modes including the standard single Snapshot mode, Daily mode, Duty Cycle Mode, Monte Carlo mode, and several modes where the load varies as a function of time, which is critical to quantifying the impacts of variable sources and loads [
31]. OpenDSS differs from the traditional radial circuit solvers because it solves networked (meshed) distribution systems as easily as radial systems.
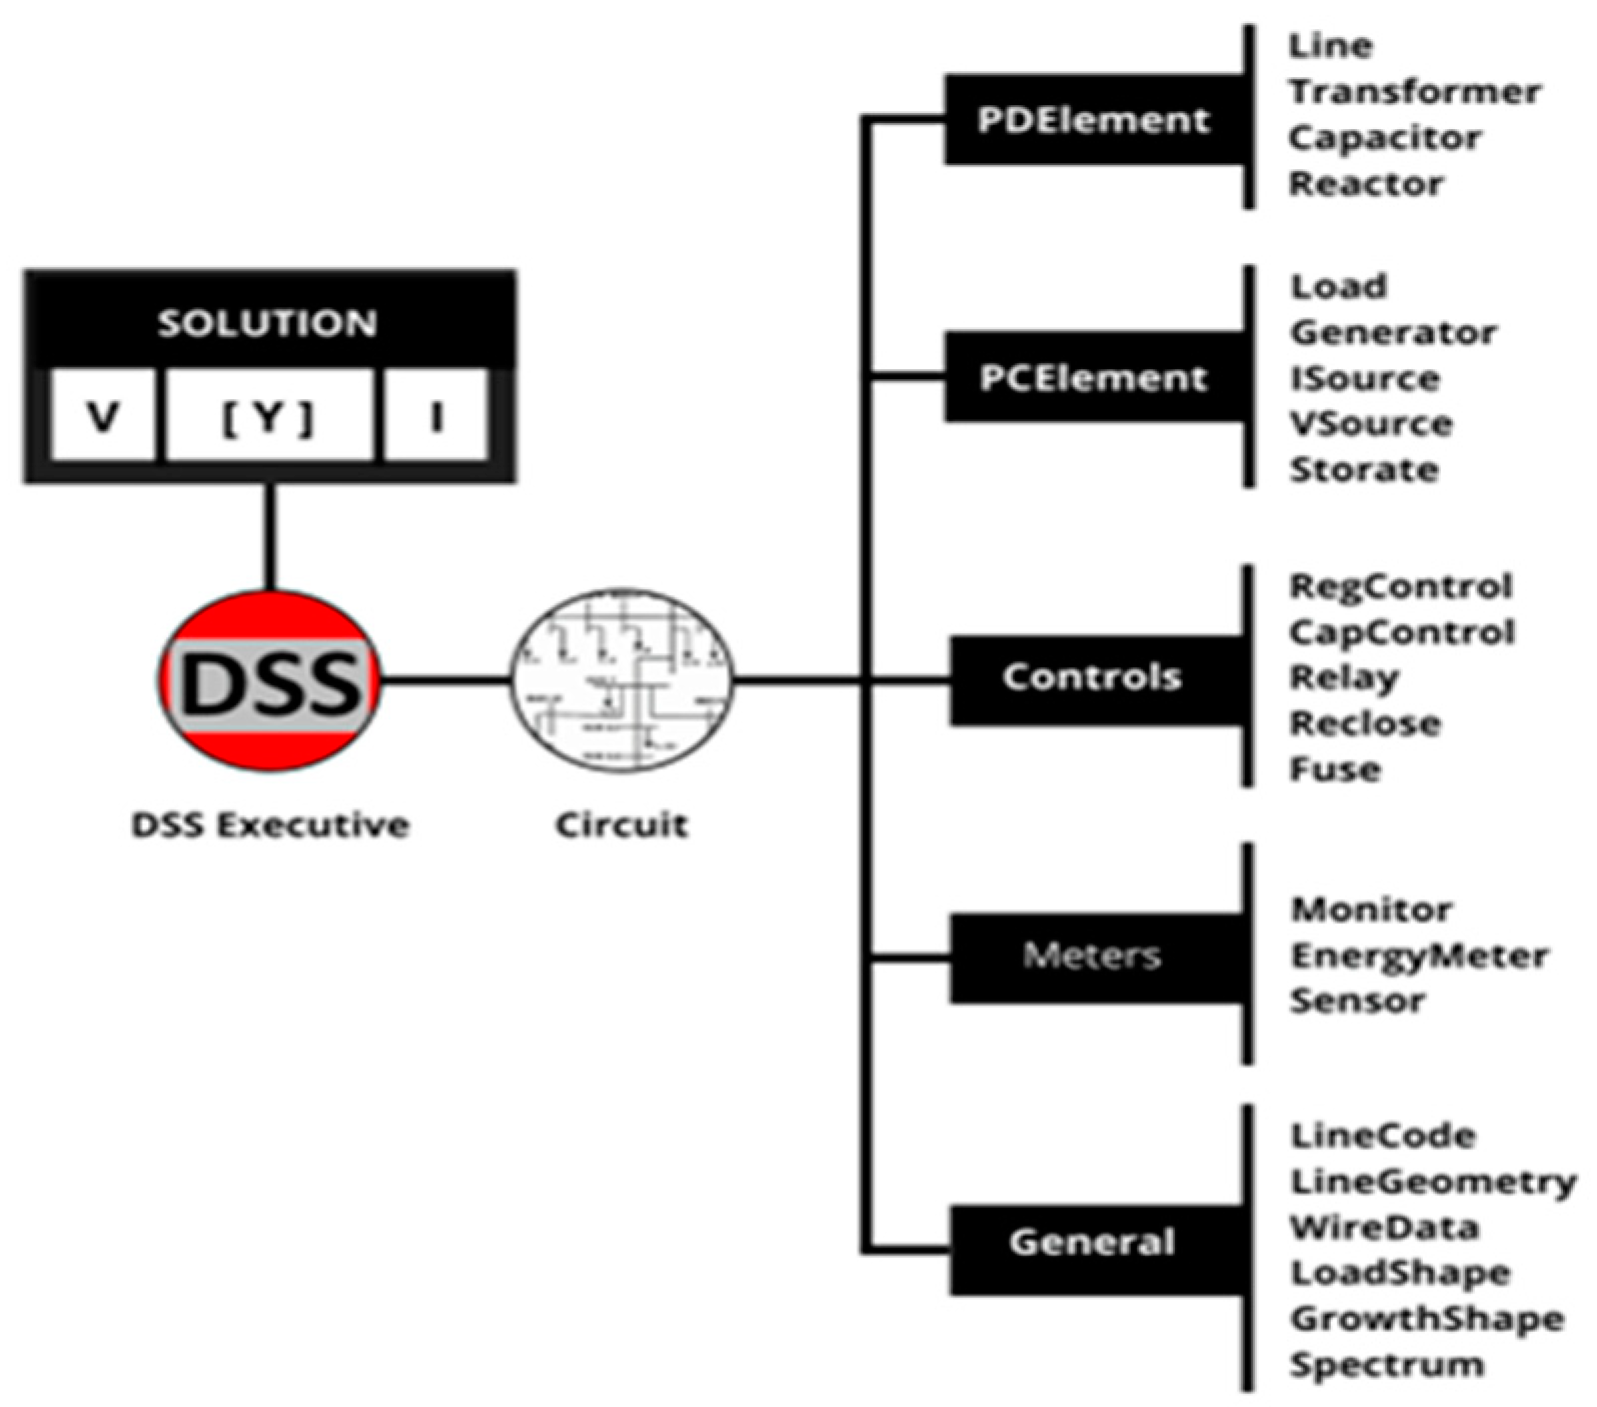
Figure 1 shows the internal architecture of the software and the sequence of definitions, i.e., power delivery, conversion, and control elements that contain the characteristics and configuration.
2.3. QGIS2OPENDSS Plugin
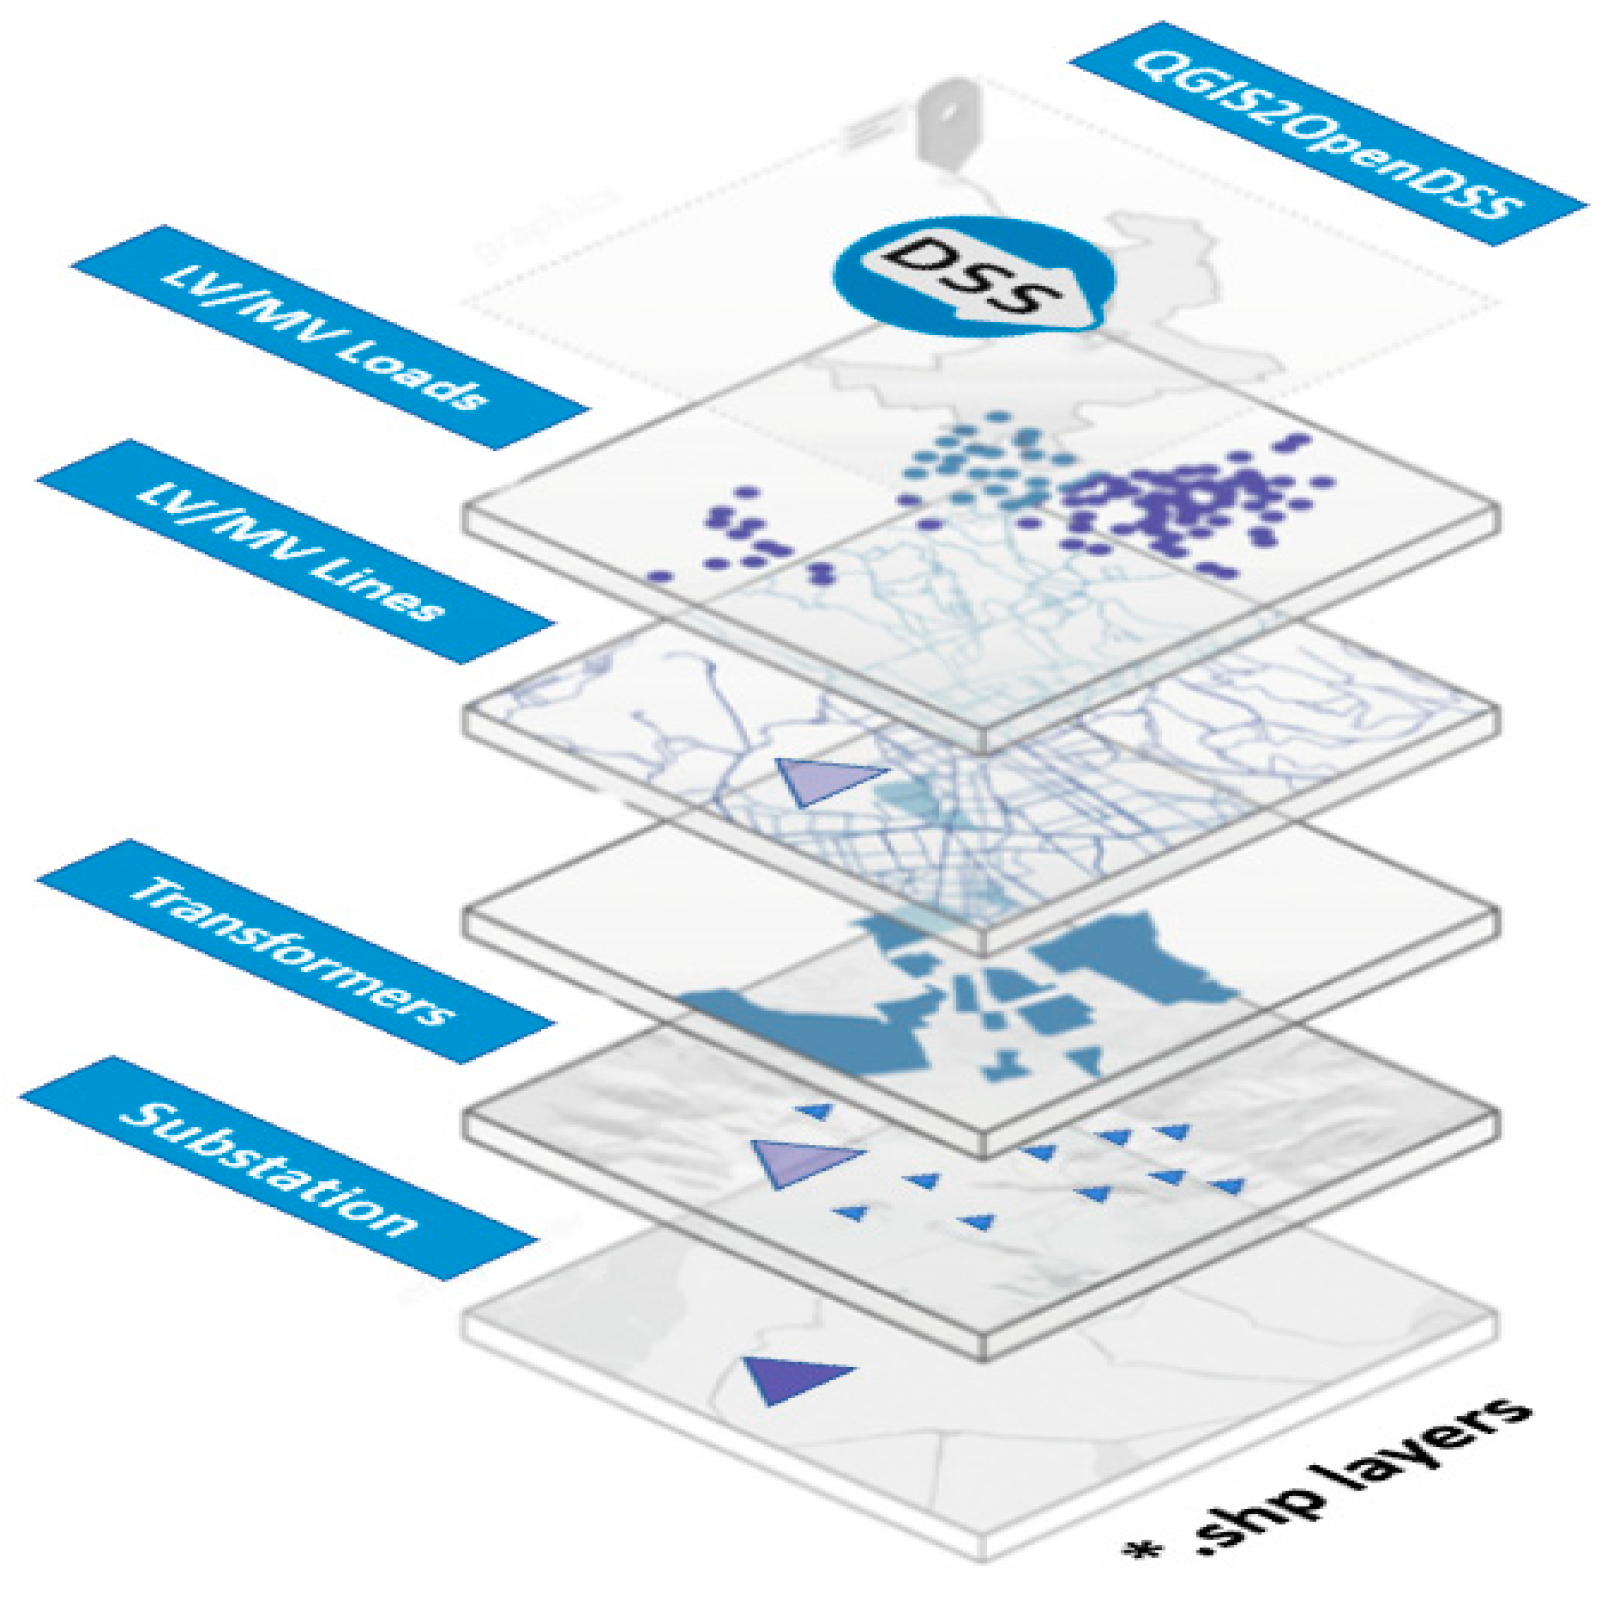
QGIS2OpenDSS extracts and processes GIS data to generate the OpenDSS files (*.dss) required to run the simulator. The plugin contains a Graphical User Interface (GUI) that facilitates the translation of data, that comes in the form of
*.shp files, which contain the information, characteristics, and attributes of object classes (LV/MV lines, Loads, Transformers, etc.) (See
Figure 2).
In the GUI, the user would select the layer of DN elements to be modeled in OpenDSS, each layer has attributes that are classified as mandatory (essential) and optional (these attributes can be extracted indirectly from the files generated by the GIS departments of the electricity distribution companies).
Relevant aspects of the plugin´s inner workings such as the connectivity of elements (done using Python Library Kd-trees [
32]) and the load profile allocation algorithm (where a typical demand profile is assigned to each load) are out of the scope of this paper, an interested reader can refer to references [
33].
2.3.1. Data Requirements in QGIS2OpenDSS
The plugin was originally designed to work with the CRTM05-WGS84 (Costa Rica) projection, but users can modify this if the projection coordinates are given in meters. This is important because the object location is a common attribute among all DN elements. For our case study UTM Zone 31-WGS84 was selected. Here is the list of the required DN elements to build a DN model, and an example of how the naming convention for the attributes works on the plugin for the overhead MV/LV Lines and for PV DERs.
Table 1 presents the list of attributes in the shape files of overhead Medium Voltage (MV), Low Voltage (LV) lines. A description of each parameter is presented below.
NEUTMAT: Neutral conductor material (CU, AAC, AAAC, ACSR).
NEUTZIZ: Neutral conductor gauge - Can be specified in AWG, mm2, MCM.
PHASEMAT: Phase conductor material (CU, AAC, AAAC, ACSR).
PHASESIZ: Phase conductor gauge - Can be specified in AWG, mm2, MCM.
LINEGEO: Geometry of the line - This data characterizes the geometry used in the conductors. Only one letter is used to indicate the type (H – Horizontal, B- Biphasic, V-Vertical, T-Triangular).
PHASEDESIG: Designation of the phases. The user can use letters or numbers as encoding.
NOMVOLT: Coding for nominal voltage. The user must select one of the predefined codes for the voltage selection.
Table 2 shows the list of mandatory and optional attributes in the shapefiles of the distributed generators. These generators take the number of phases and connections of the loads where they are installed. A description of each parameter is presented below.
TECH: Distributed generator type (PV, Hydro, Wind).
KVA: Generator installed power in kVA.
CURVE1: Irradiance curve file name for photovoltaic systems, must include the extension.
Curve2: File name of the temperature curve for photovoltaic systems.
The user will need to verify and translate the existing utility network data to match the naming convention and requirement of the plugin for the rest of DN elements:
2.3.2. Erroneous Data
One of the key features of the plugin is that if any of the attributes listed are missing, the user will be alerted with an error message. It's possible that the attribute name in the plugin may not match the name in the table, leading to non-recognition. The plugin is also capable of:
Detecting disconnected elements due to small coordinate displacements.
Wrong phase designation: The plugin verifies that the elements being connected have the correct phase designation.
Unknown transformer model capacity or nominal voltage: The plugin uses a look up table of typical series impedances based on the nominal voltage and capacity of transformers. If the value is not found in the table, it will trigger an error.
These errors must be fixed in the GIS database to successfully run the plugin.
2.3.3. Adaptations and Updates to the Plugin for the Dominican Republic Case Study
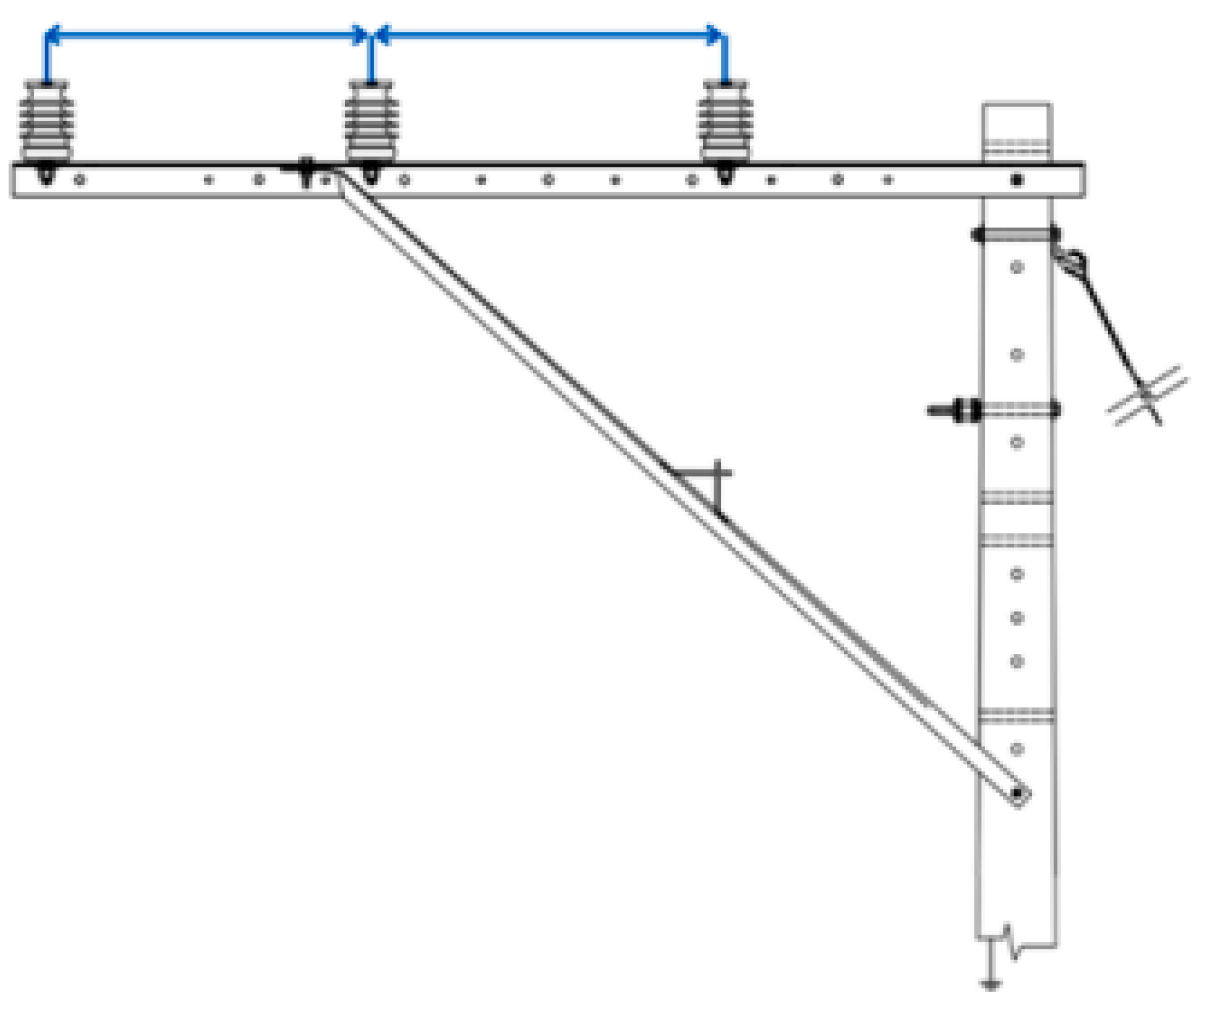
Several new Line Geometries were added to the Line Configuration Library. As expected, the distribution network code and regulation from the Dominican Republic differ from Costa Rica, so configurations such as depicted in
Figure 3 were added, as well as new line geometries for underground cables. Procedures similar to those show in [
34] were follow.
In the Dominican Republic, 12.47 kV feeders represent almost 90% of all MV feeders. Series impedances for the transformers at this nominal voltage level were added to the plugin.
A function that determines which line the load is connected to, to find out if the wire code accepts the indicated SERVICE type was modified to accept cable type=="DPX” in the main script qgis2opendss.py.
3. Case Study: Distribution Network Data Extraction Process
With the goal of implementing the OpenDSS-Based Distribution Network Builder in a real case study, a blueprint of the processes to obtain, clean and transform the existing GIS Data of a regional distribution energy company in the Dominican Republic (EDENORTE) was created (see
Figure 4). Several data dictionaries, models, and workflows were created in QGIS to standardize and summarize the process.
The test feeder (VOLG 101) characteristics are shown in
Table 3, which can be seen in the GIS model in Figure 6.
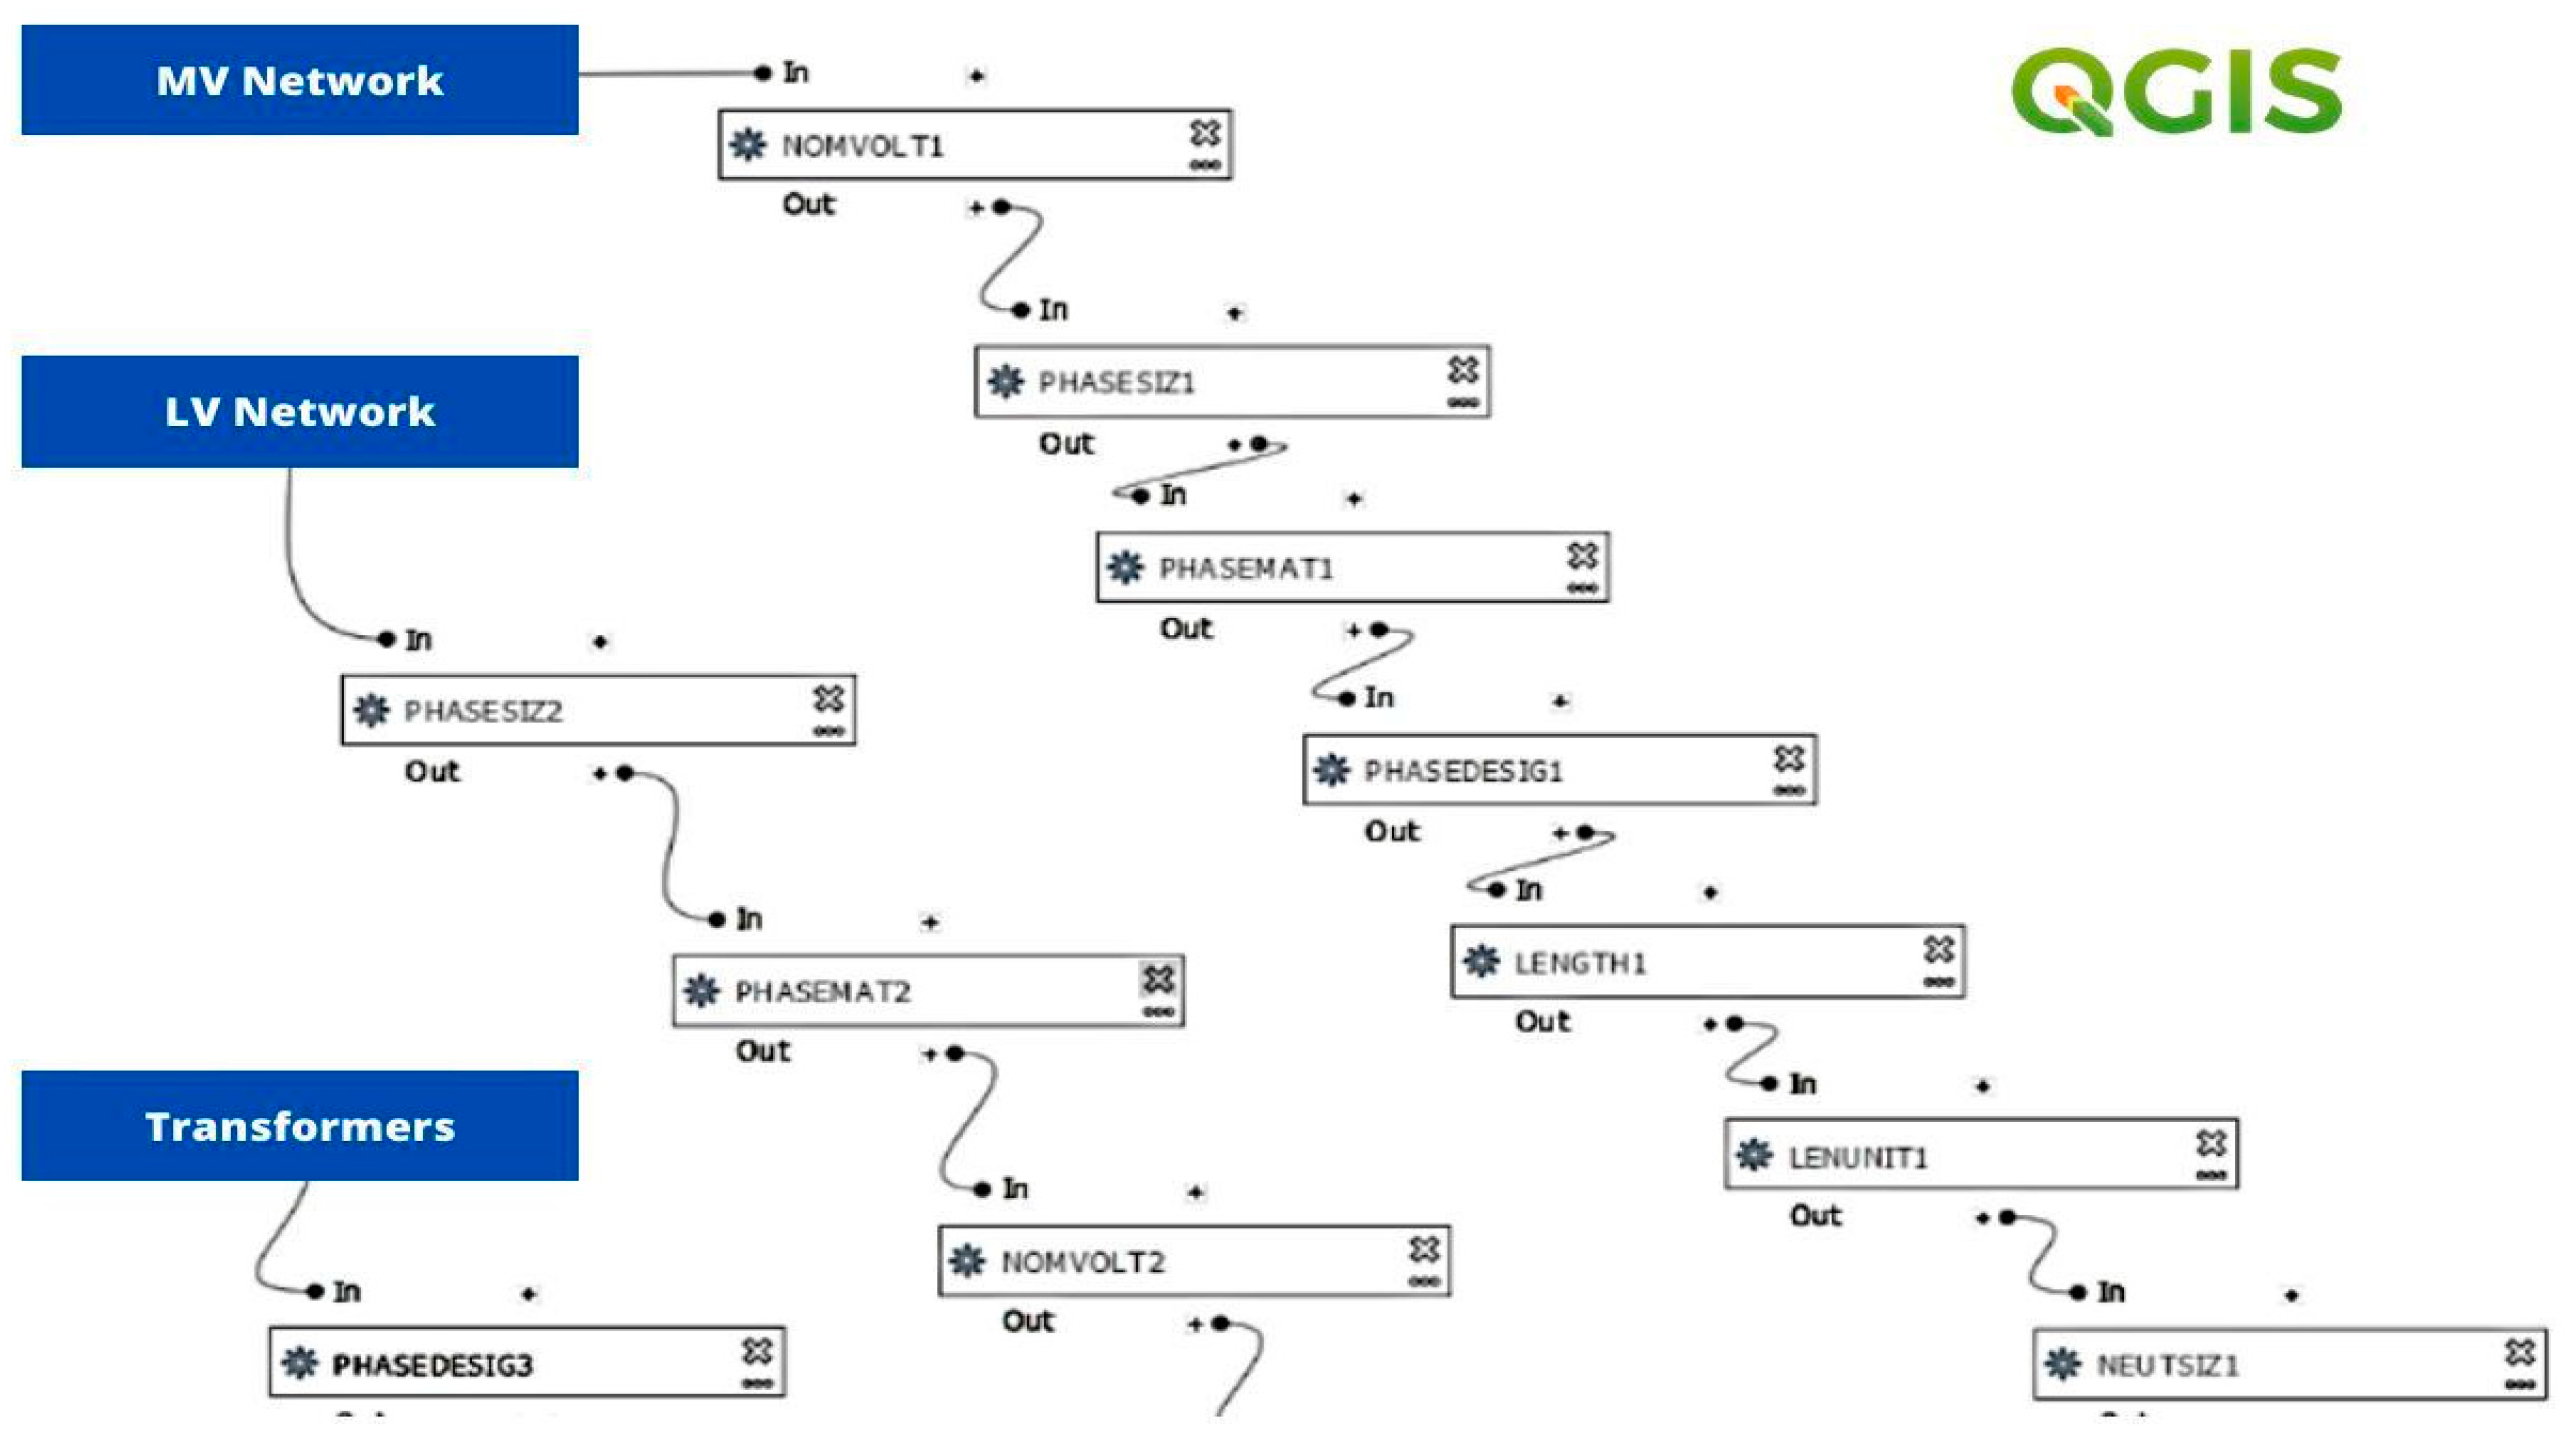
QGIS Model Designer was used to create a model for data extraction and translation with a simple and easy-to-use graphical interface. This was a key development because, while working on the GIS datasets, most of the analysis operations that were executed were not isolated but were part of a set of operations. Using a model, that chain of processes could be executed in a single process or algorithm, saving time and effort, which is proportional to the volume of the model. Another model was used to extract MV/LV Loads from the registered consumption in kilowatt-hours by clients (monthly energy consumption), which is the equivalent of the KWHMONTH attribute for the plugin.
Figure 5 shows a snapshot of the data translation model built in QGIS to translate MV/LV networks and transformer data for the plugin.
EPERLab researchers also developed another QGIS plugin called DNCorrector, which can read the coordinates of DN elements contained in the layers, detecting errors directly related to the connection between elements, and capable of automatically correcting some of the errors detected. DNCorrector was used to clear out the final connectivity errors.
4. Demonstration
4.1. QGIS2OpenDSS File Creator
Once all issues regarding connectivity and naming conventions are cleared, the plugin takes the attributes of the GIS layers to generate the OpenDSS files. The plugin execution time averages 3 minutes approximately, on a PC INTEL
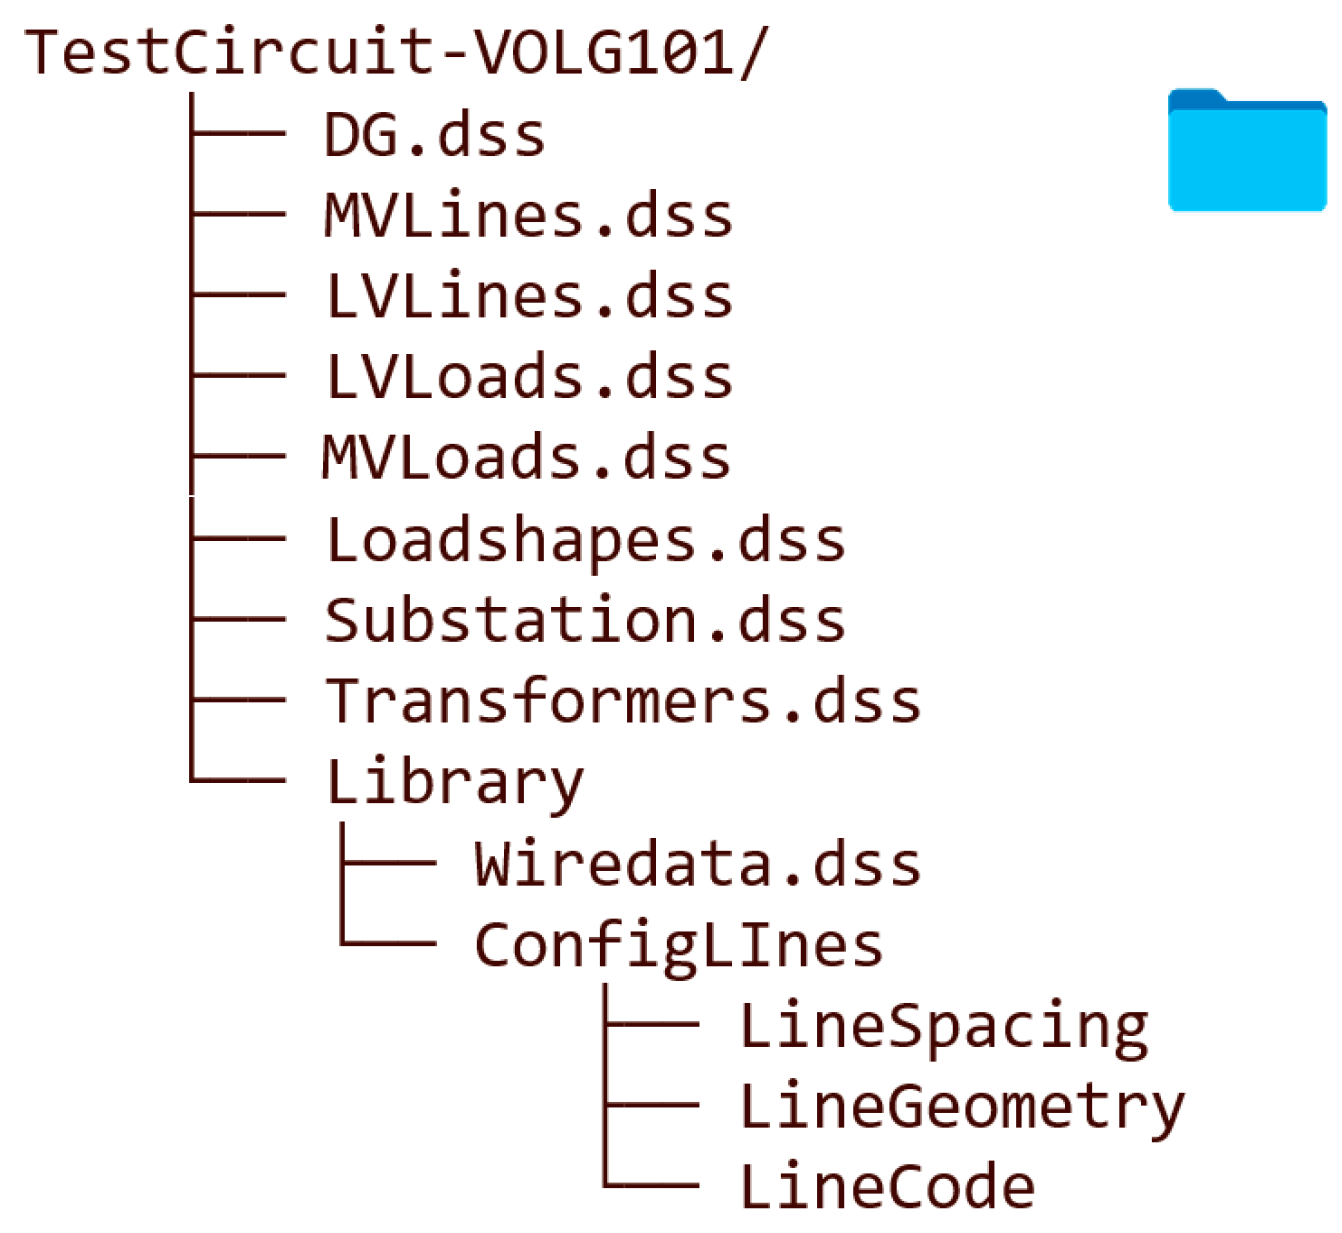
® Core I7, 8GB RAM, 64bits. In this case study, the files generated on the directory by the plugin are shown in
Figure 6.
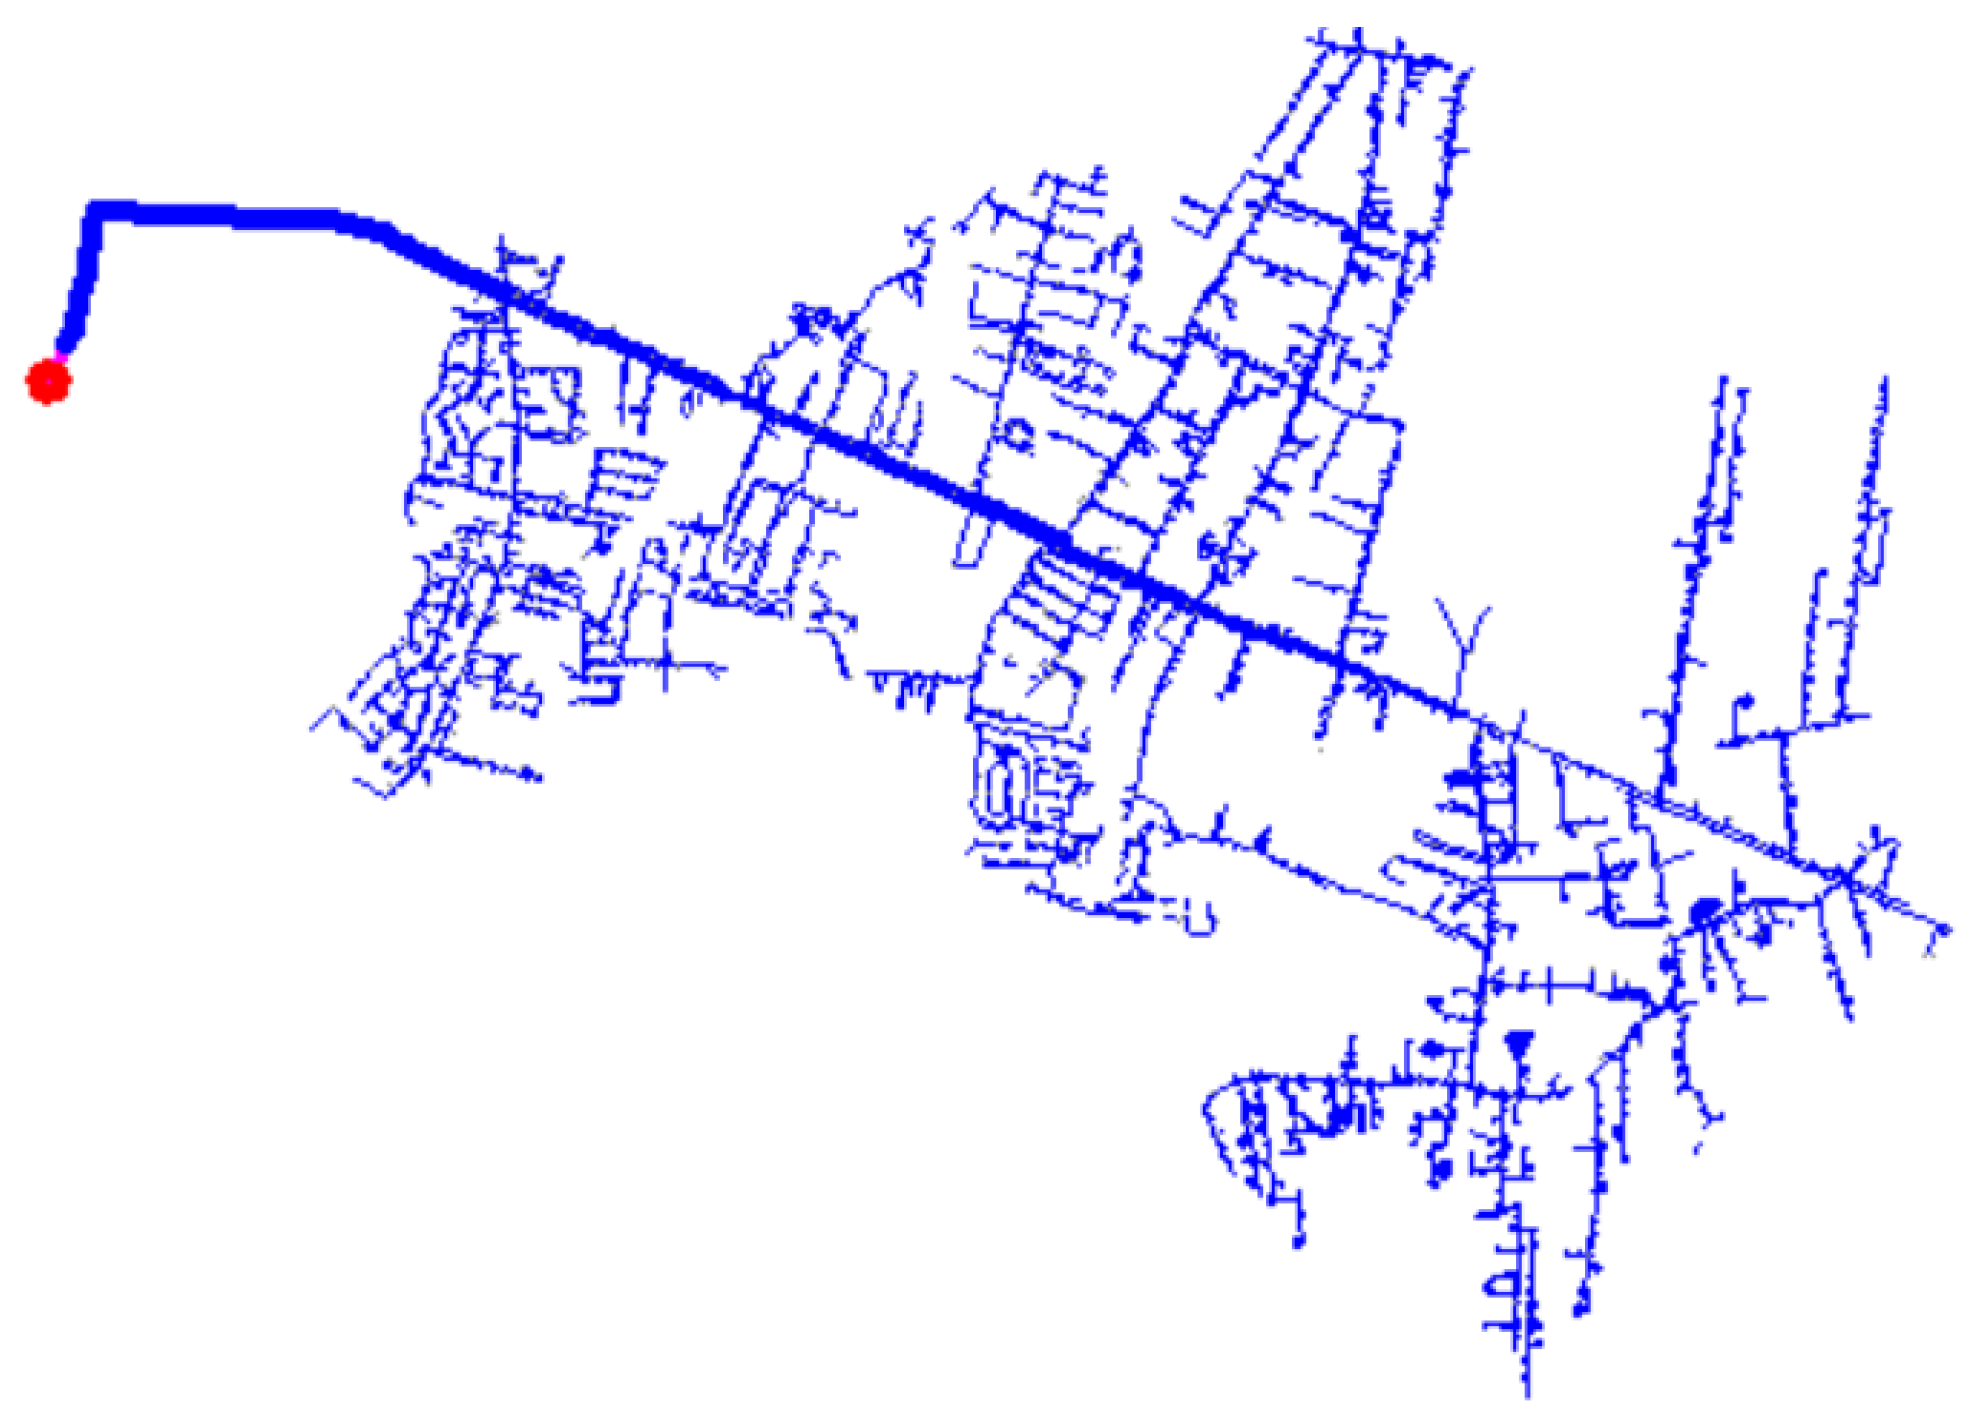
The plugin also creates a list of buses for all the LV and MV elements in a *csv file, which can be used to plot the circuit and see power flow simulations in OpenDSS, which can be seen in
Figure 7.
Each individual file created on the project directory is crucial for the execution of the power flow simulation on OpenDSS. The description of the function of these files is explained bellow:
DG.dss: Includes the busname, phases, nominal voltage, connection type, power rating, irradiance, and temperature.
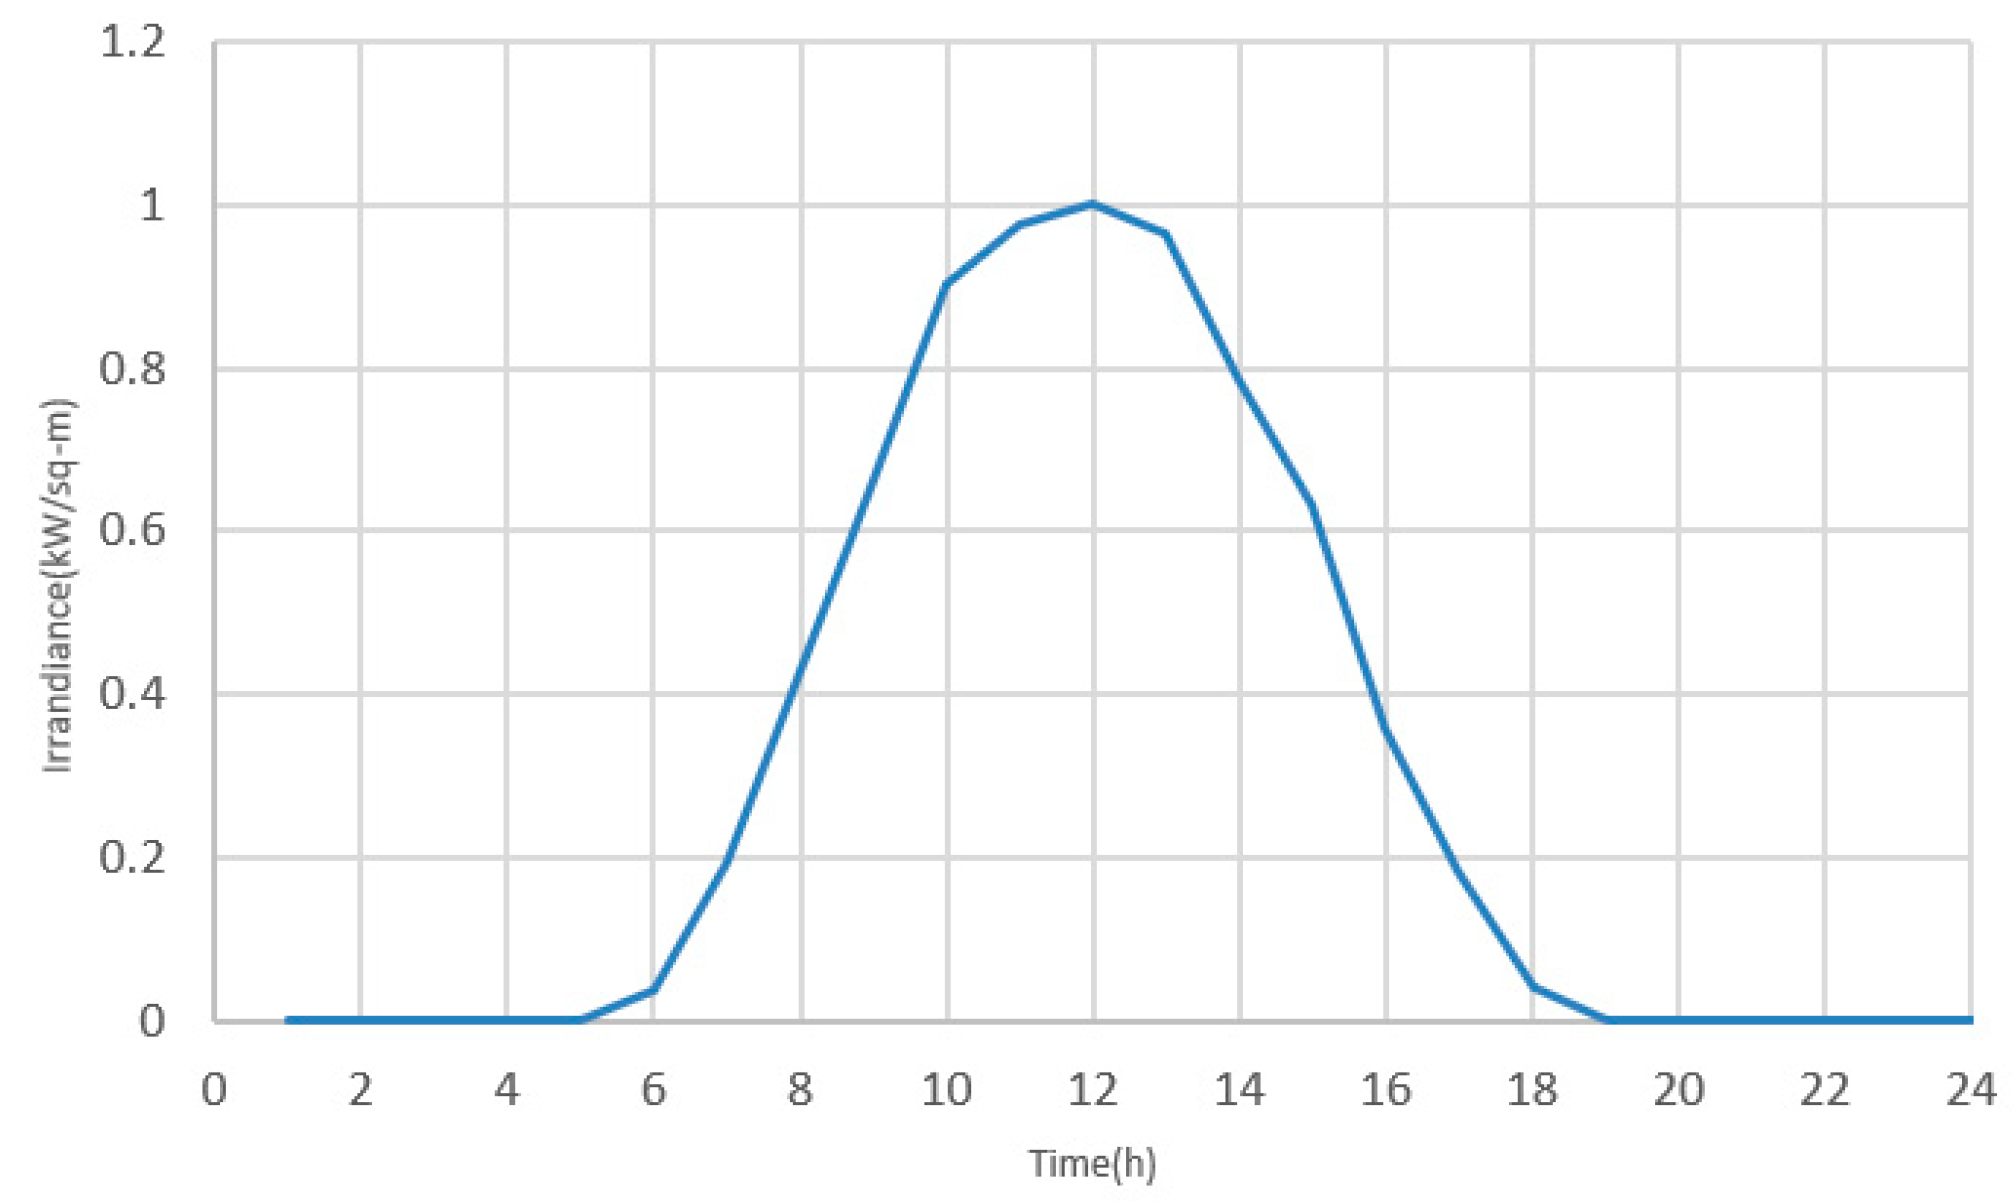
Figure 8 shows the typical irradiance curve in Santiago used to model the PV generation.
MVLines.dss: Details the connectivity of each MVline/cable segment, geometry of line/cable and its length.
LVLines.dss: Details the connectivity of each LV line/cable segment, geometry of line/cable and its length.
MV/LVLoads.dss: Indicates load location, type, nominal voltage, and power factor and the associated loadshape.
Substation.dss: Provides information on the source bus, phases, connection, windings, power rating.
Transformers.dss: Provides information on all transformers (e.g., losses, impedance, voltages, etc.).
Furthermore, a set of supplementary libraries with information regarding load profiles, wire information and the geometry configuration for the distribution network must be available. This is also produced by the plugin and organized in the following manner:
Wiredata: Database that contains the characteristics (name, resistance, diameter and GMR, etc) of each wire.
ConfigLines: Database that contains the geometry (spacing, number of conductors, phases) of each line.
Loadshapes: Provides the electrical behavior of a load along a given period.
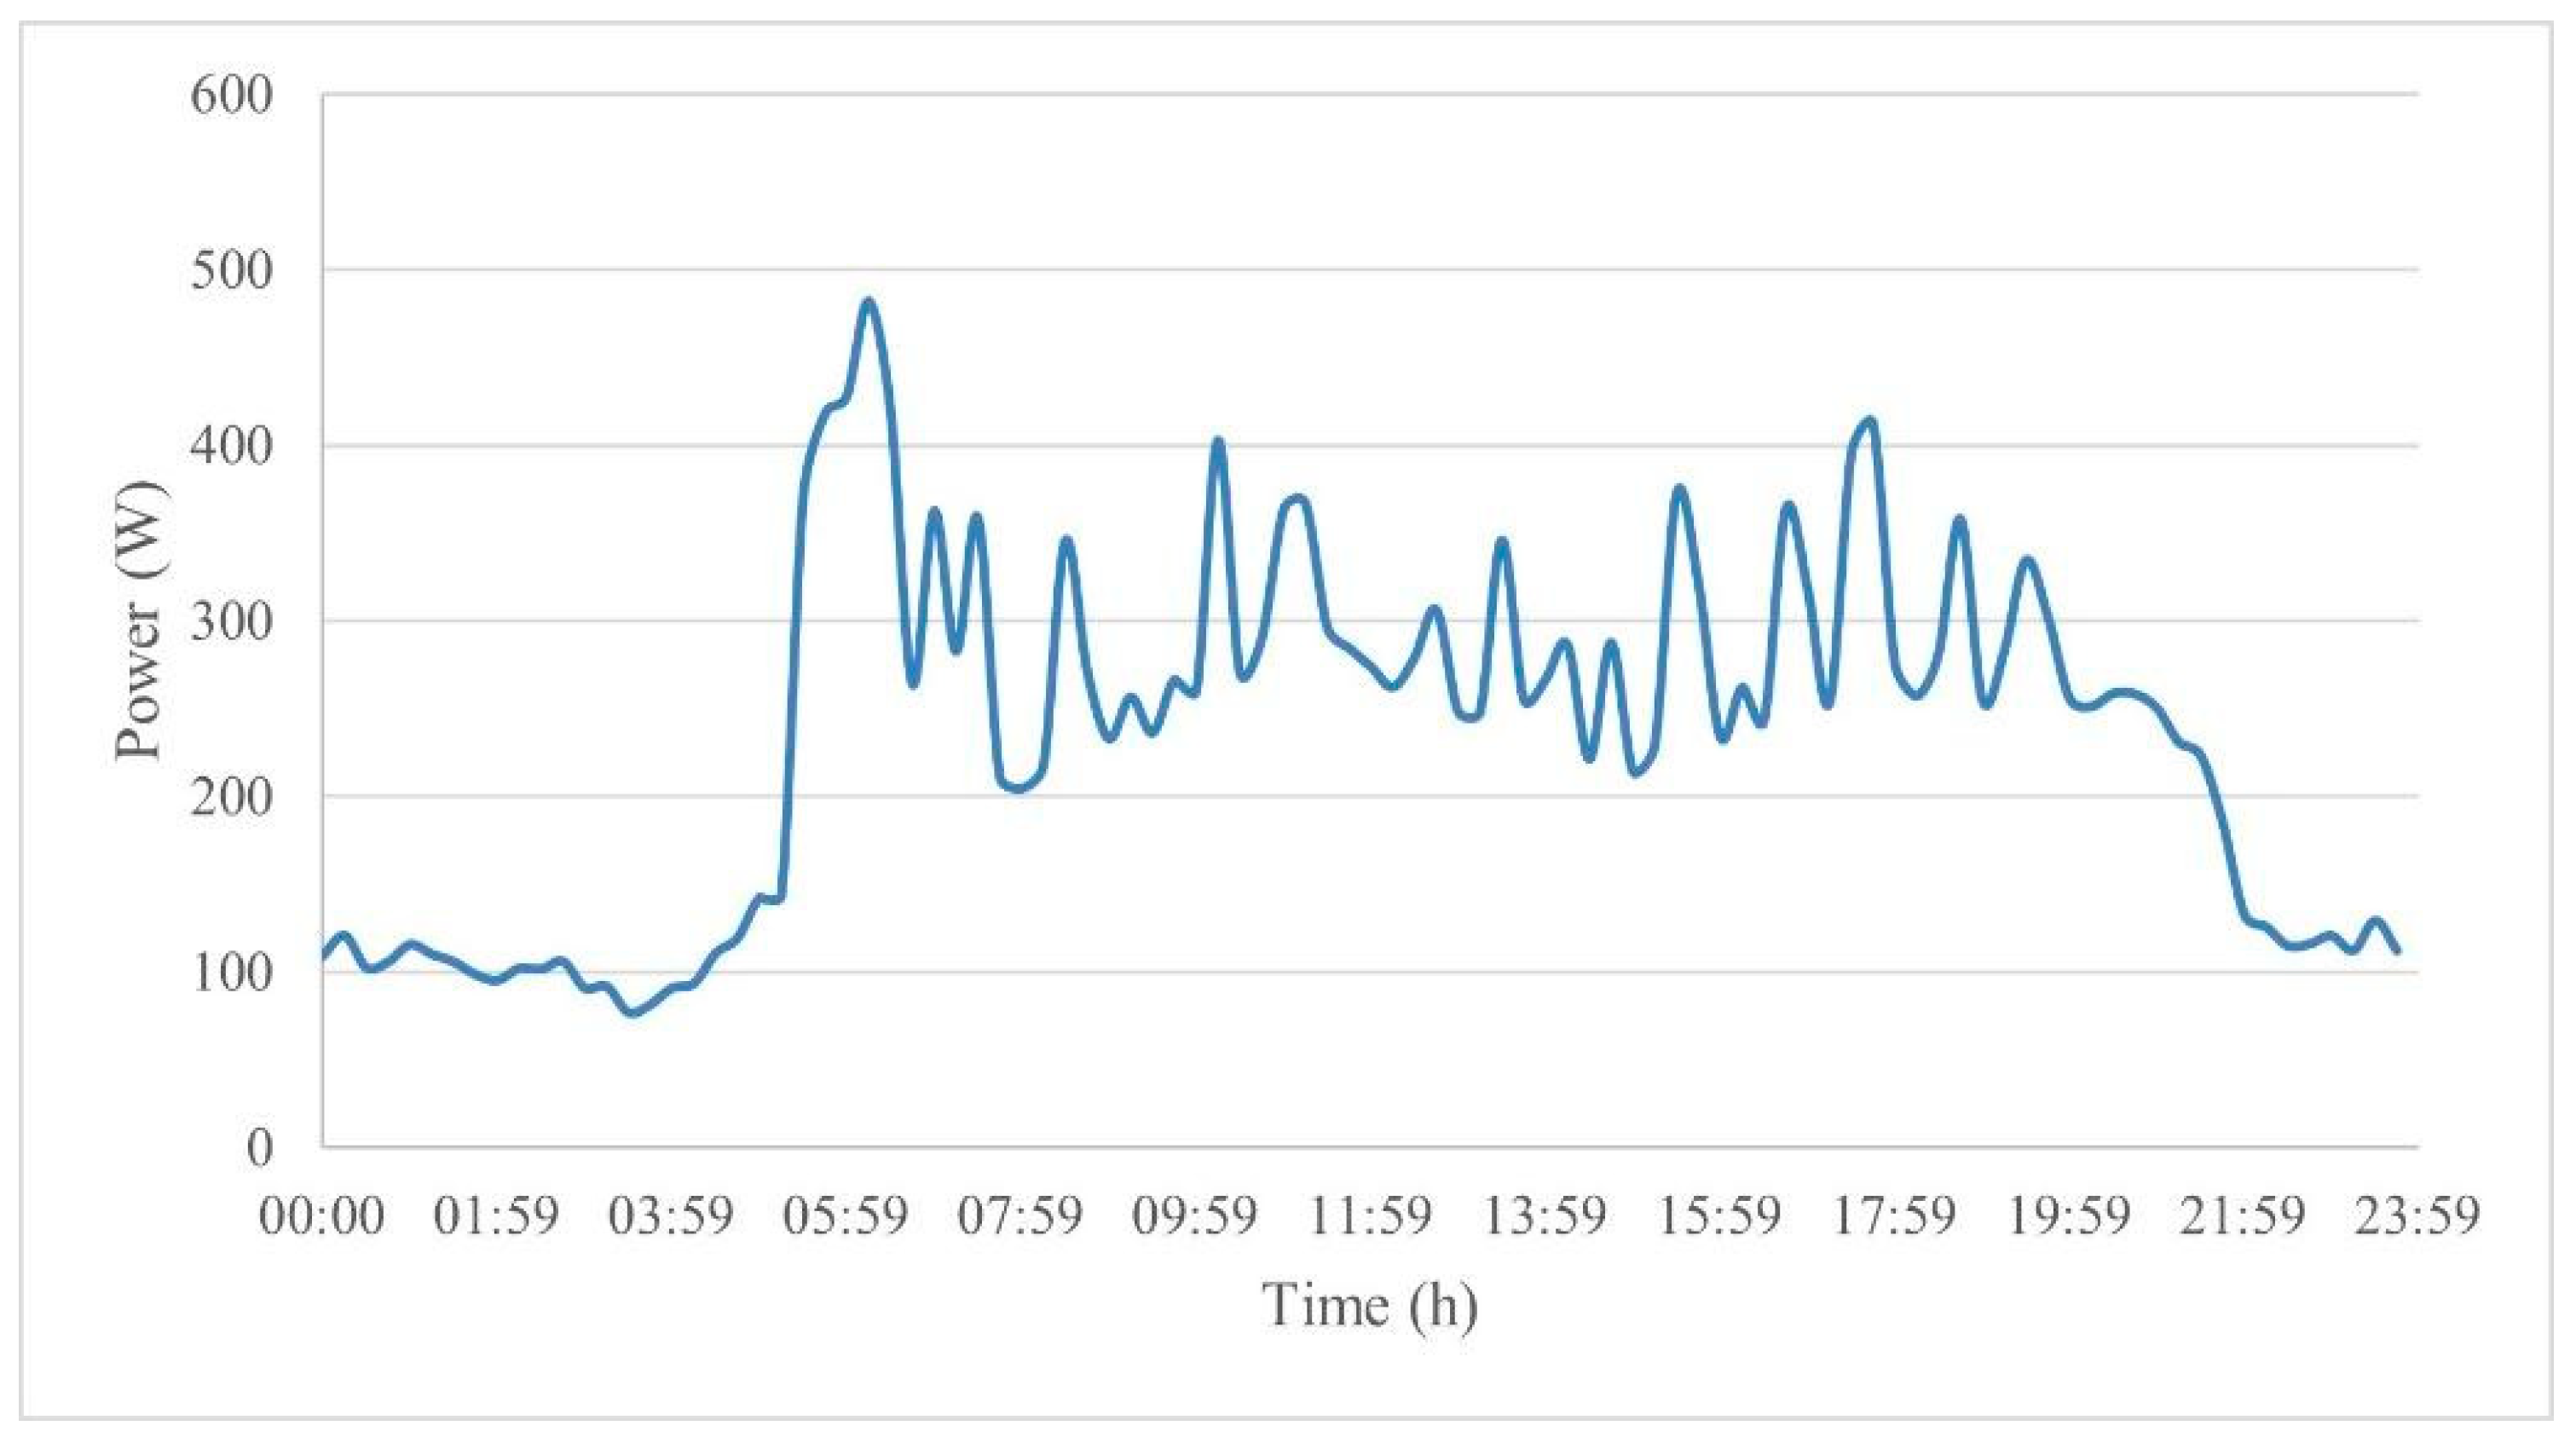
In total the plugin allocated 451 load profiles among 7,528 customers. The circuit is mostly residential, with only 10% of the customers being commercial. This is relevant when looking at the average load shape in
Figure 9. Additionally, this form of residential load shape is consistent with profiles of residential circuits reported in the scientific literature, as shown in [
35].
5. Results and Discussion
5.1. Simulation in OpenDSS
This section illustrates various studies that have been carried out to study the impact of photovoltaic (PV) generation in our case study, showcasing the integration of OpenDSS and QGIS.
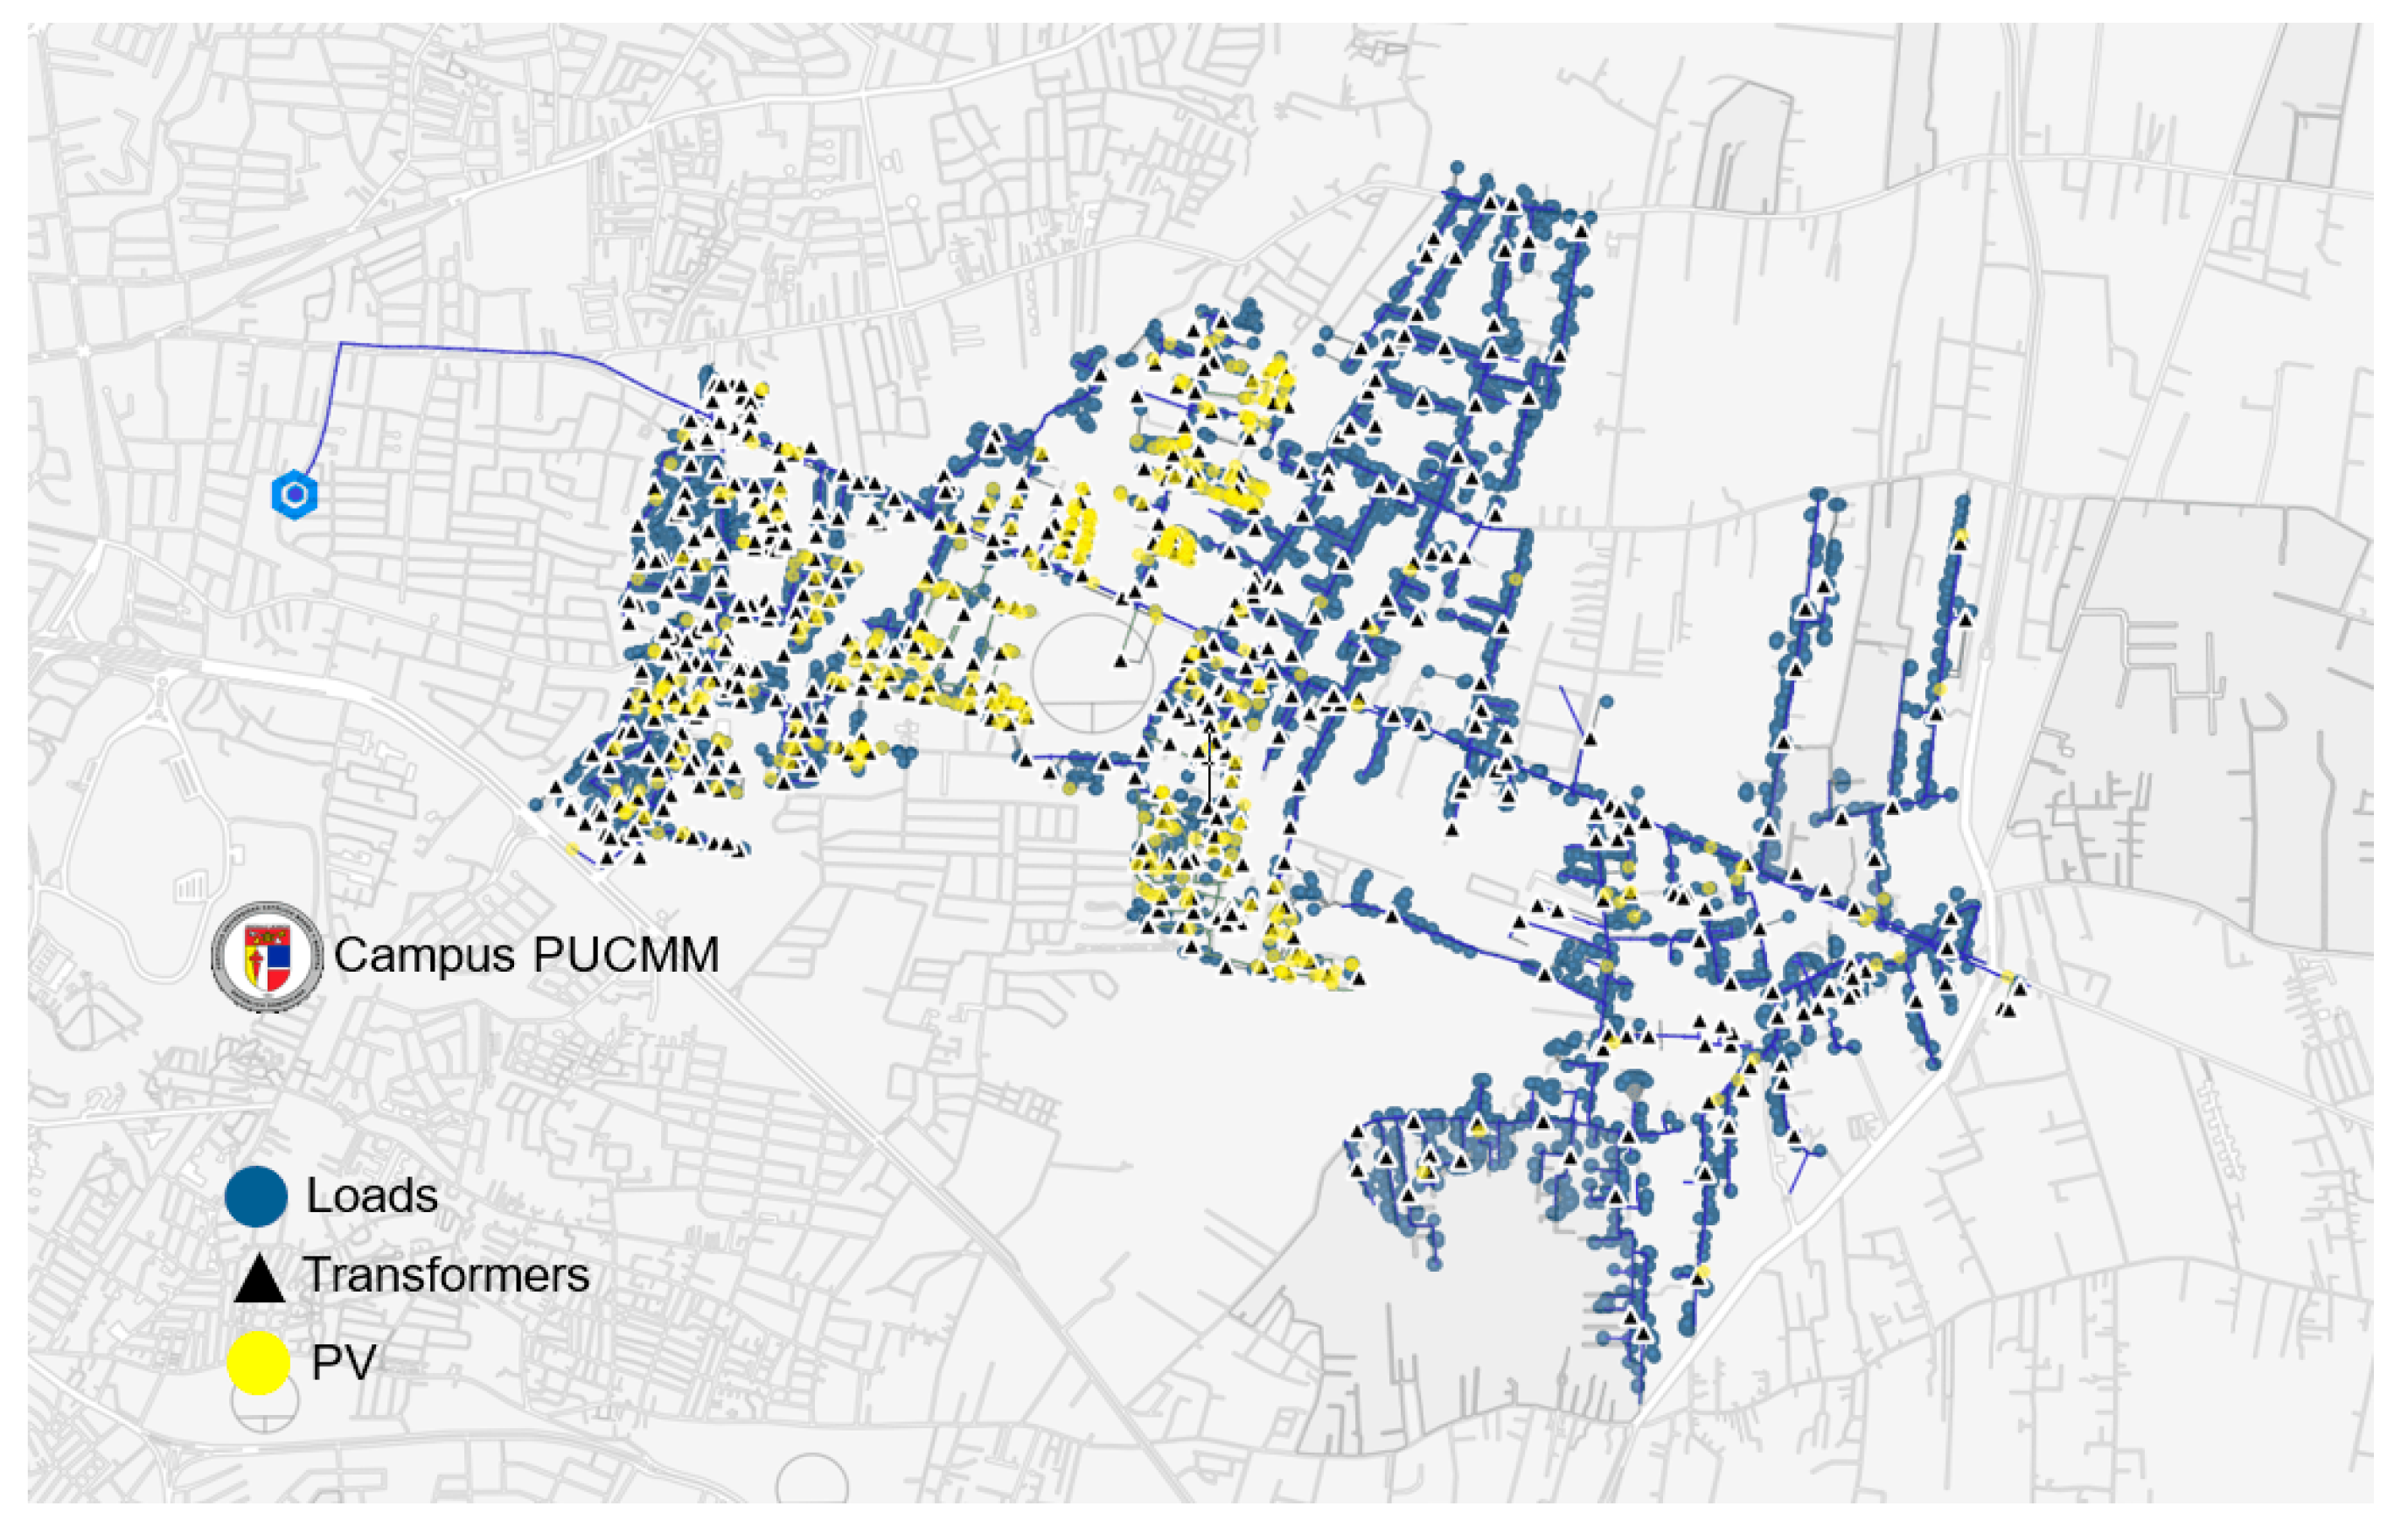
Figure 10 presents the GIS model of the circuit provided by EDENORTE. The blue circles represent Loads, black triangles MV transformers, while yellow circles are the PV Generators. This model is made of 10,206 LV and 2,470 MV buses, 9,990 LV line sections and wire services, 873 (3φ) MV, 4 (2φ) MV, and 1,621 (1φ) line sections and 579 MV transformers.
Once all OpenDSS files
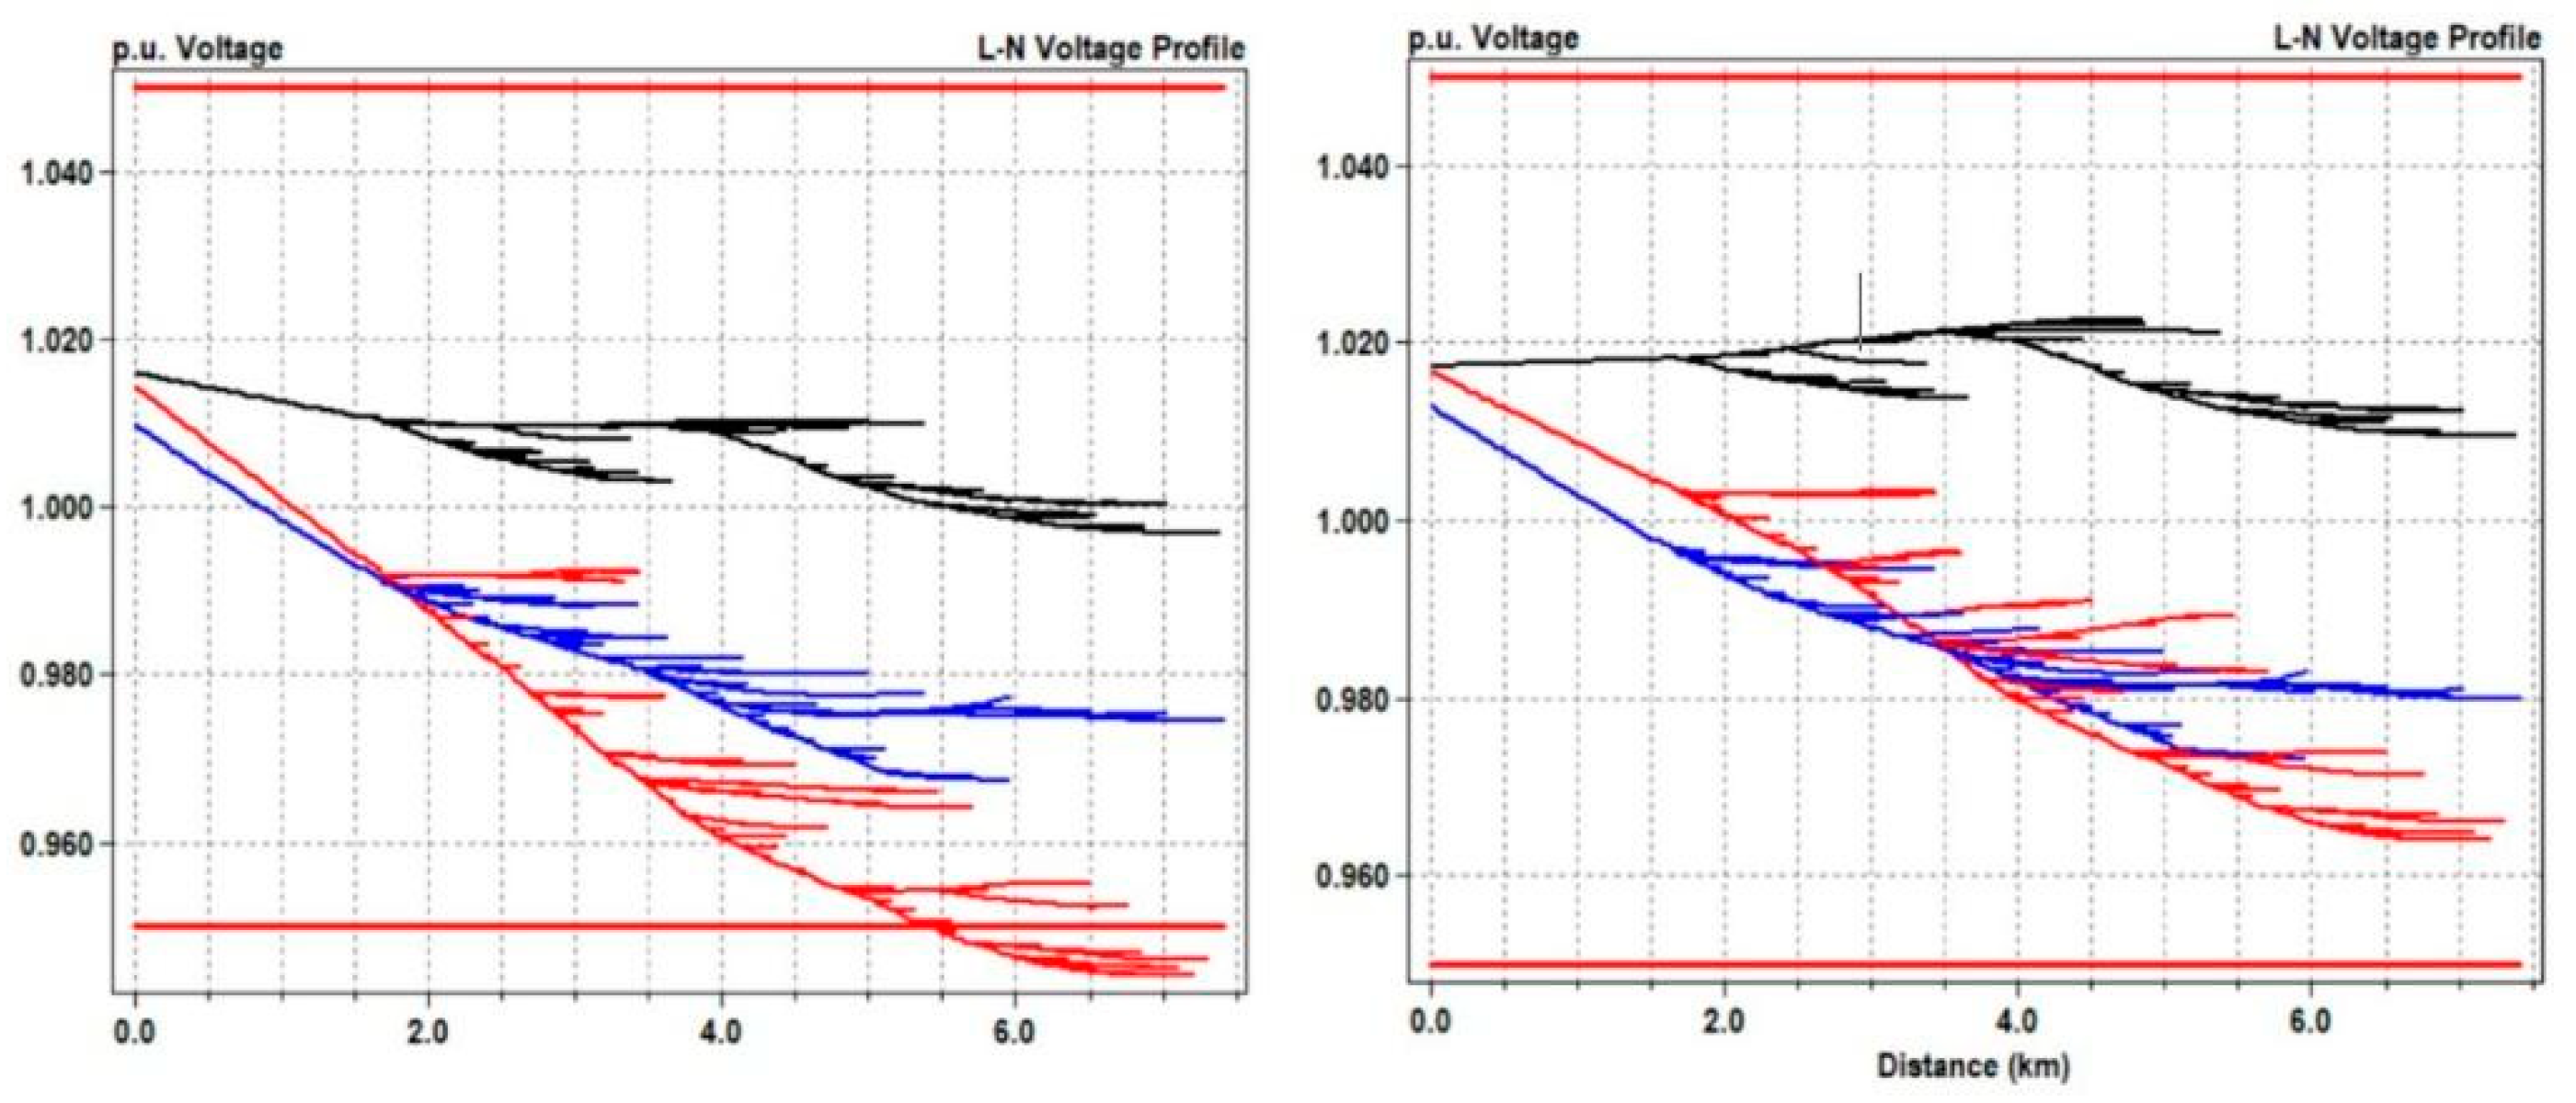
*.dss were generated as shown in section 4, a snapshot power flow simulation was carried out to quantify the impacts of variable sources and loads in the voltage profiles of the feeder.
Figure 11 (a) shows the L-N Voltage profile (pu) without PV generation, while (b) with PV. As expected, distributed solar can lead to voltage rise in the DN.
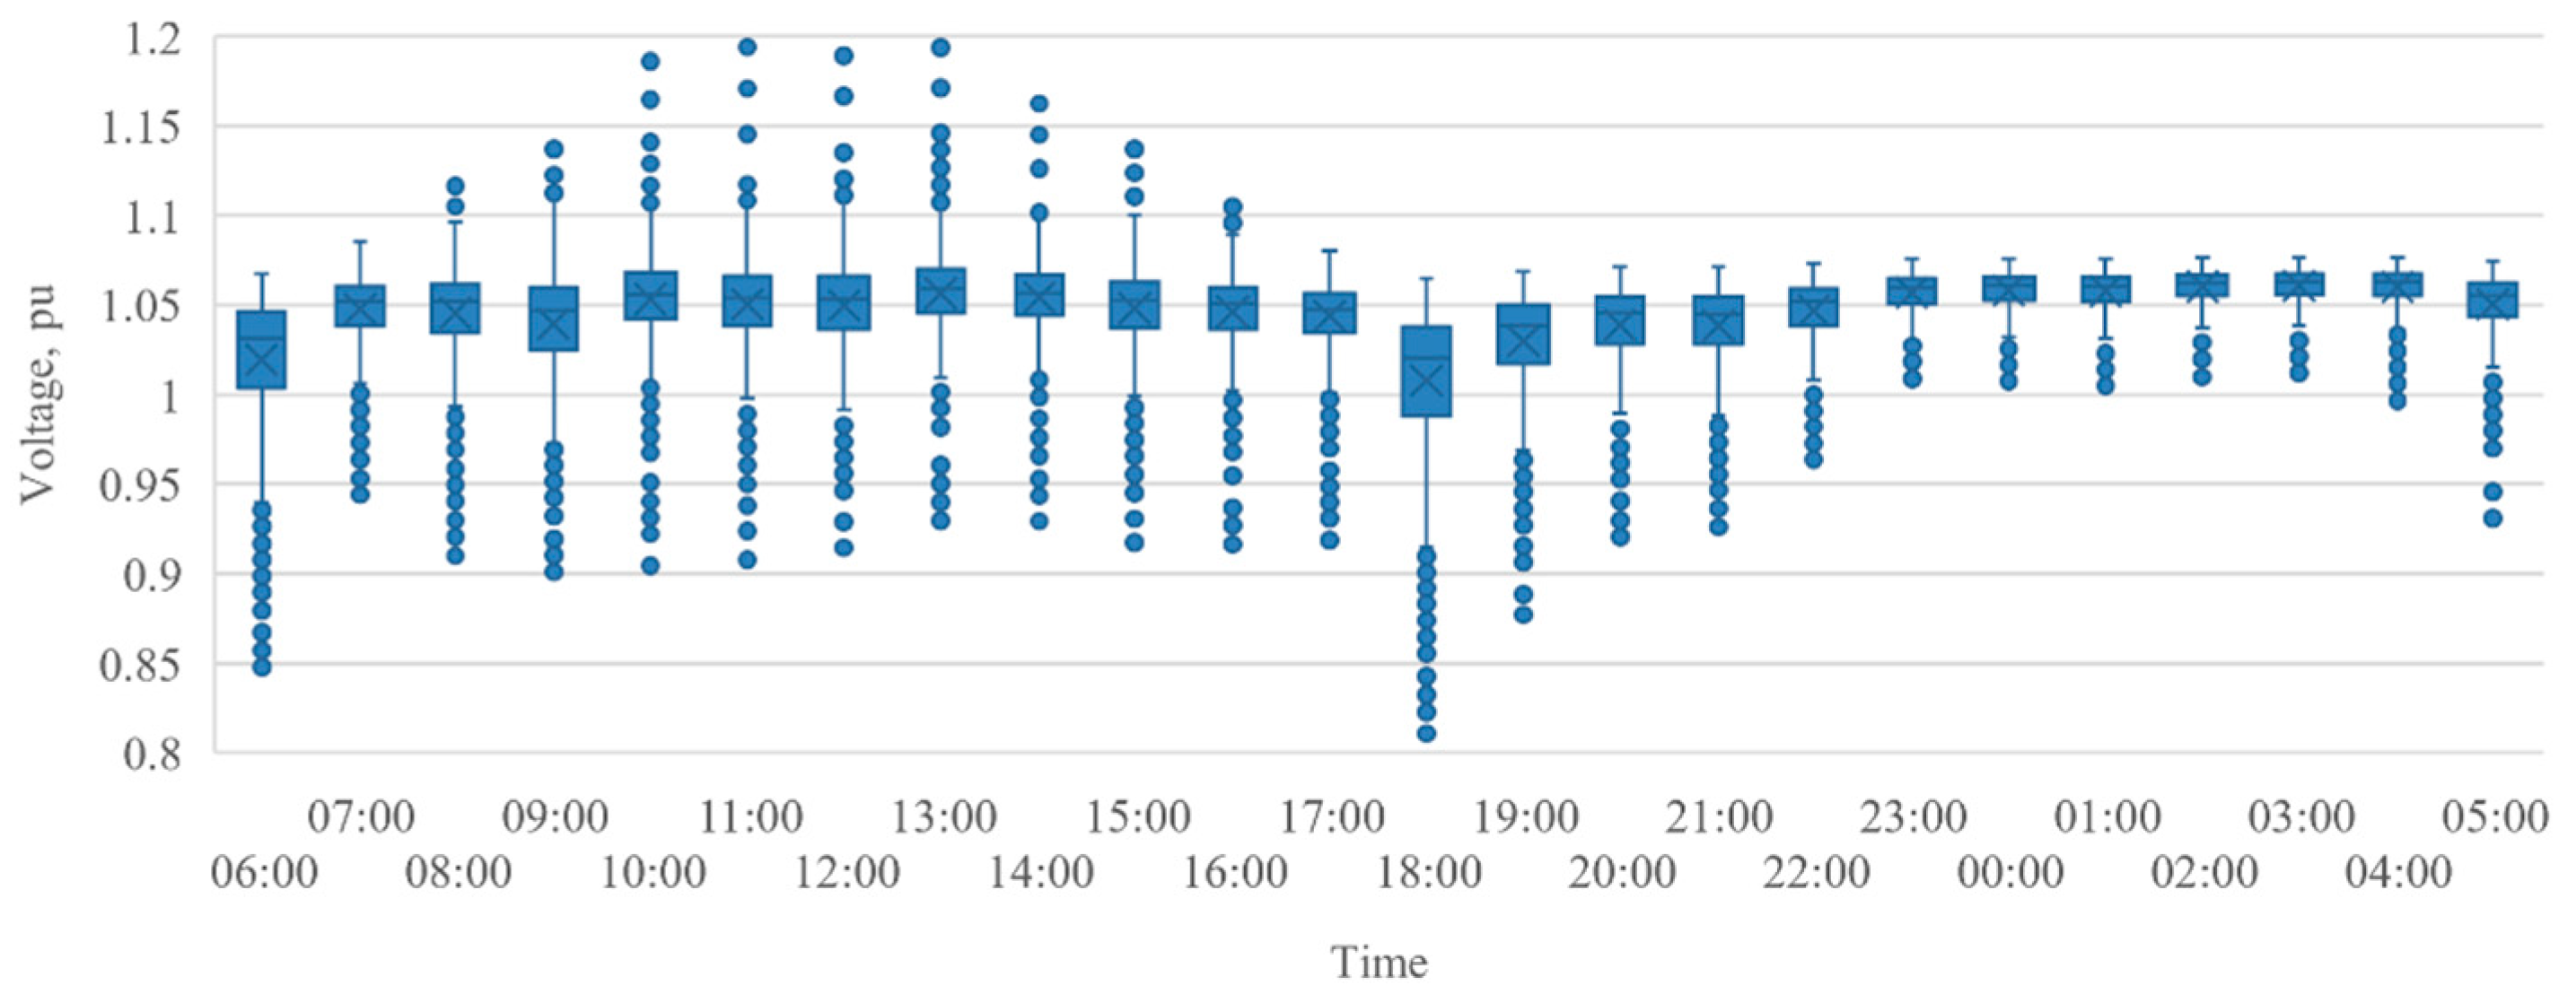
Figure 12 presents the variation of all LV buses throughout the day.
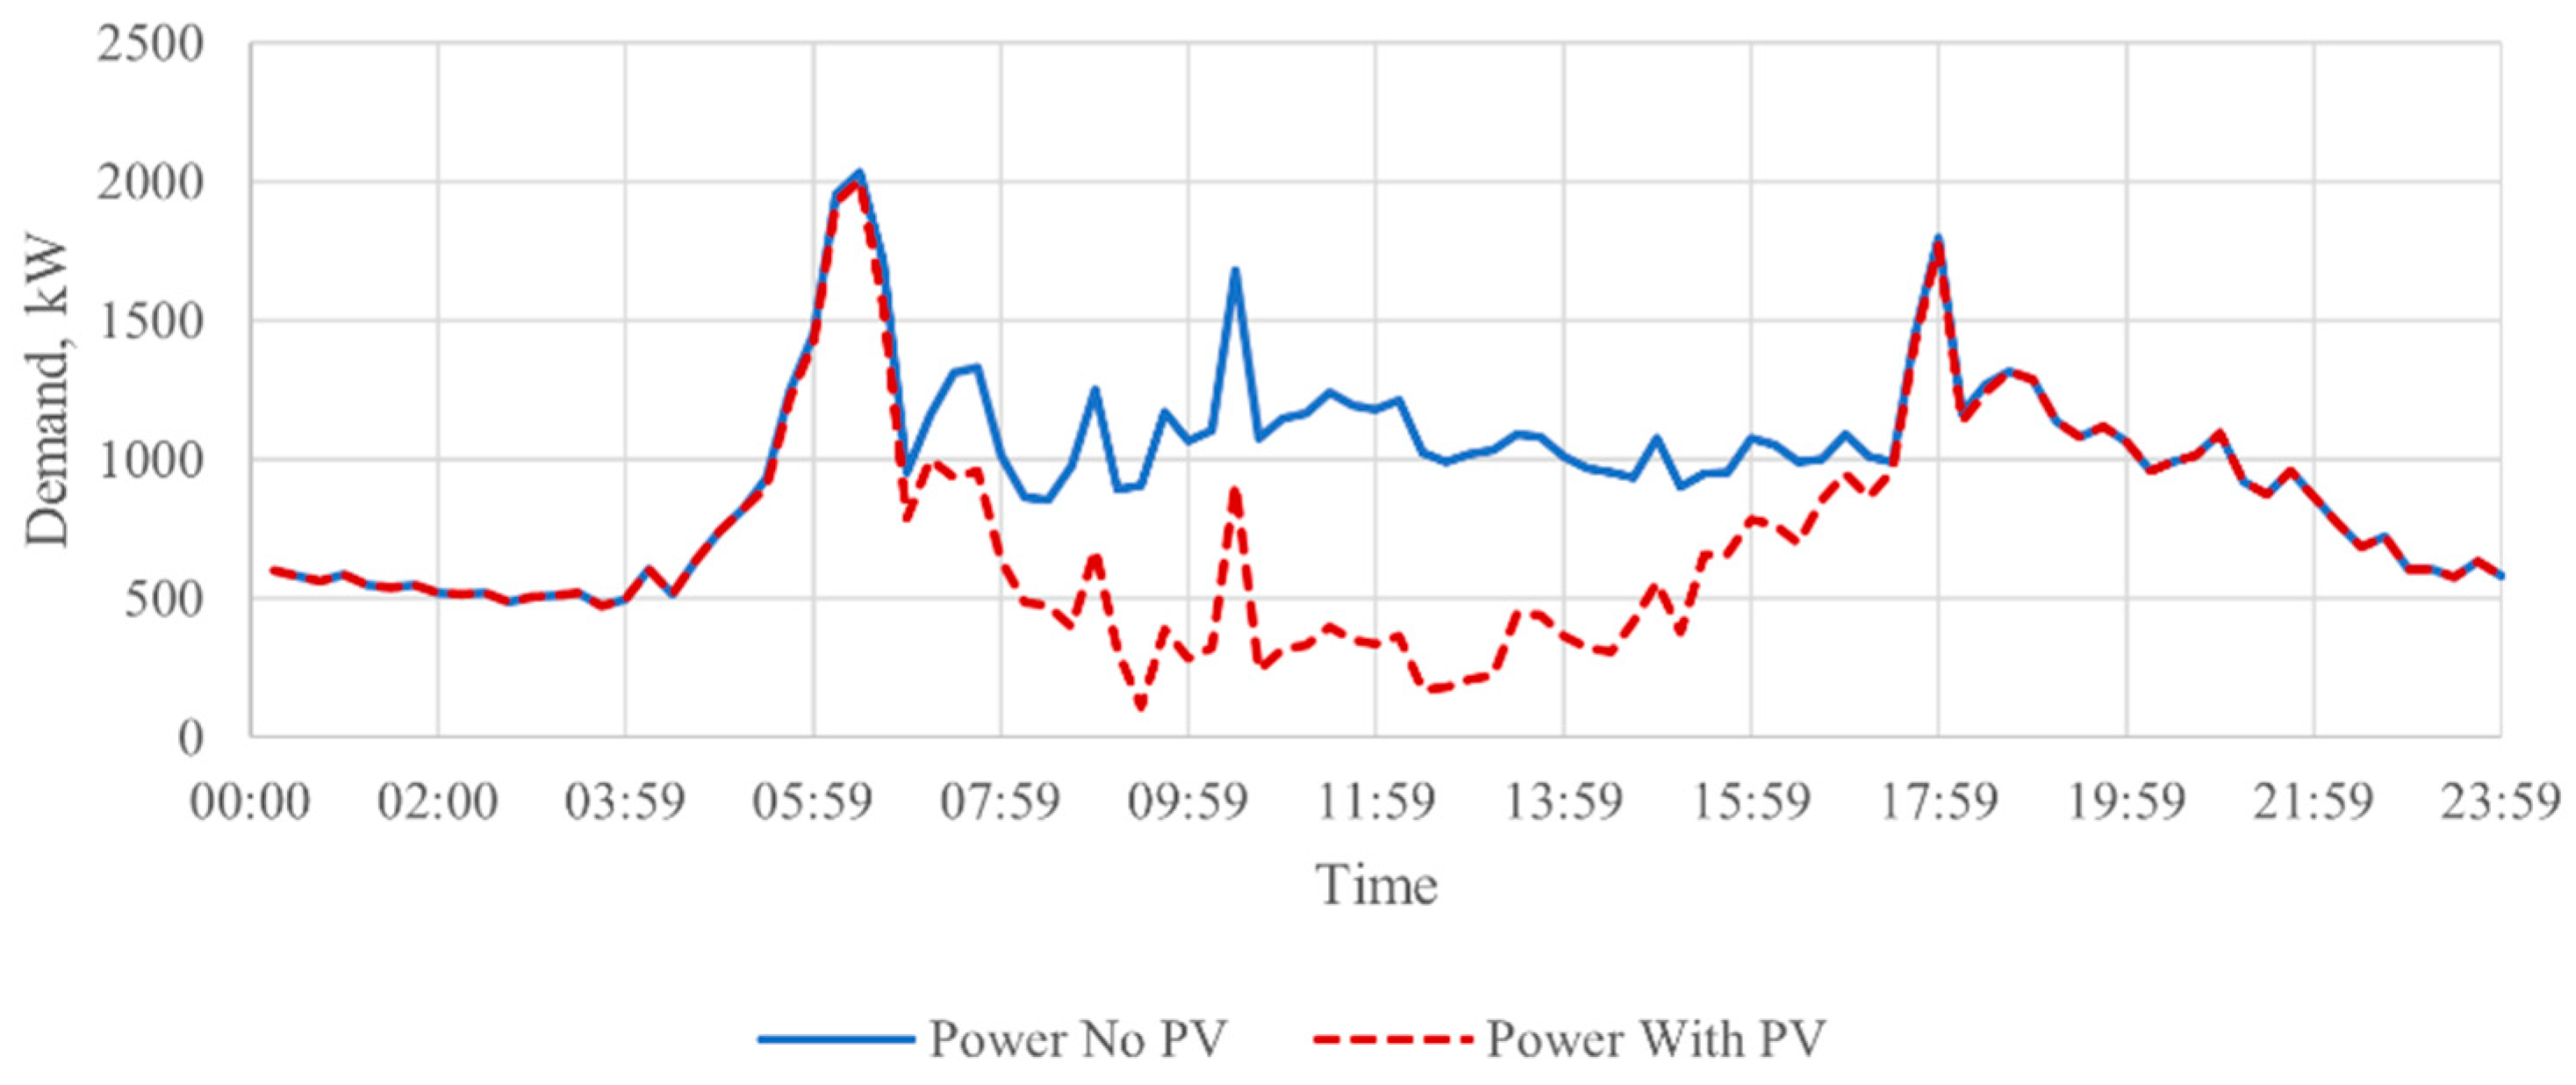
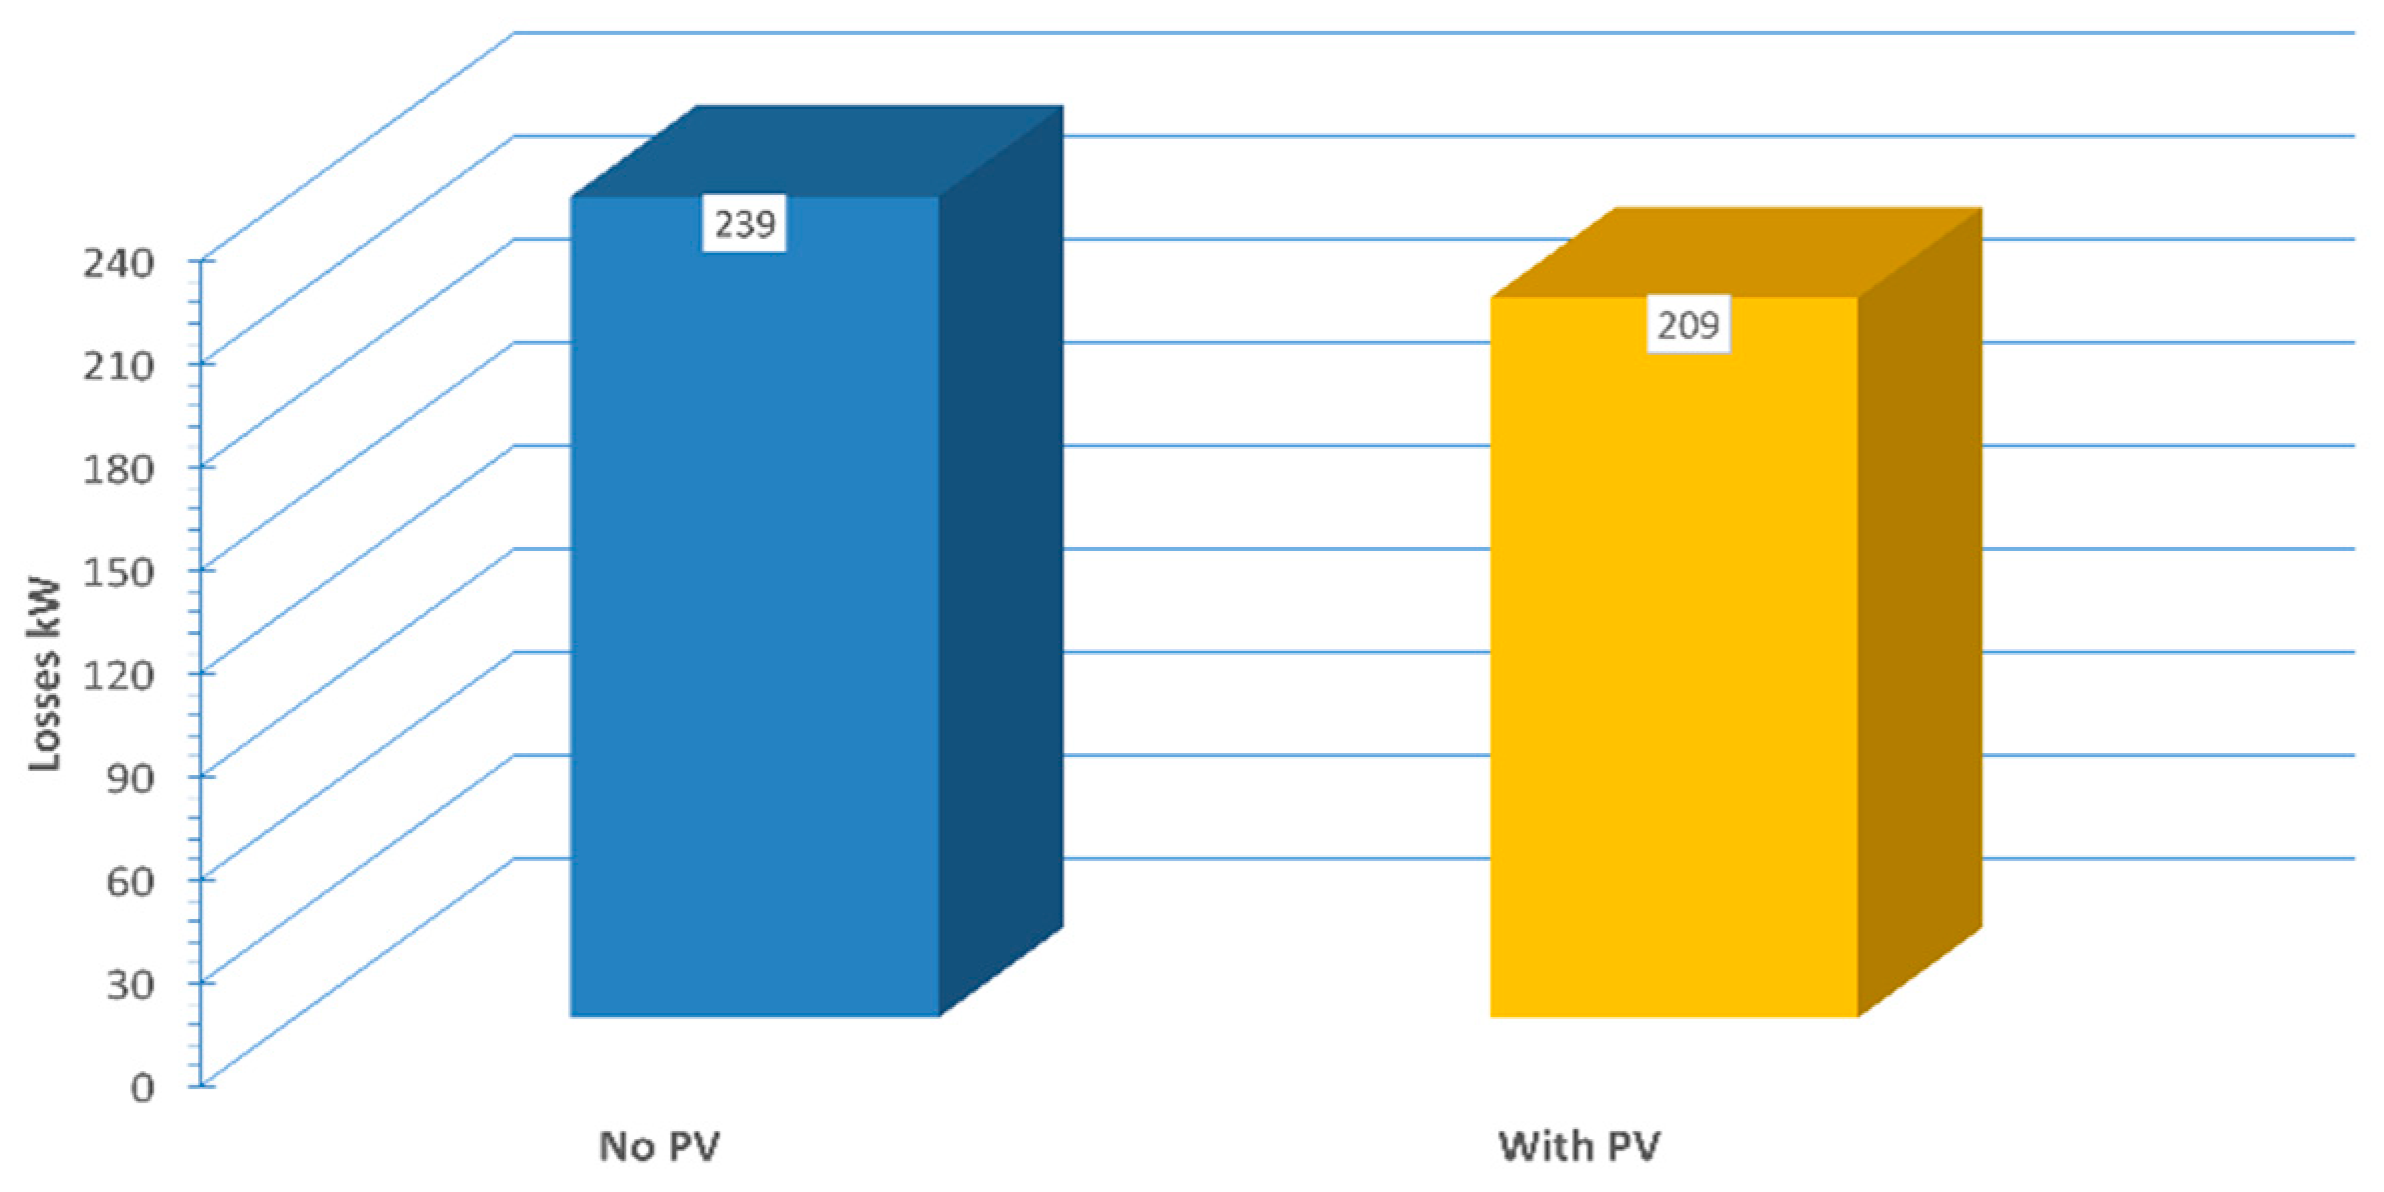
The effect of PV integration on the technical losses in the DN was also evaluated. For this purpose, a daily time series simulation was carried out under two conditions: no PV systems and the inclusion of the PV systems that were present in the DNO’s GIS database.
Figure 13 shows the results of the feeder load profile, which is consistent with the residential nature of the circuit, as can be seen in
Figure 10.
This time series simulation allows us to identify the critical hours on which to explore the effects of PV system penetration on technical losses. As can be seen, around 12:00 PM is the moment on the day on which the effect of the PV penetration causes important changes in the behavior of the main electrical feeder of the circuit under study. As stated in
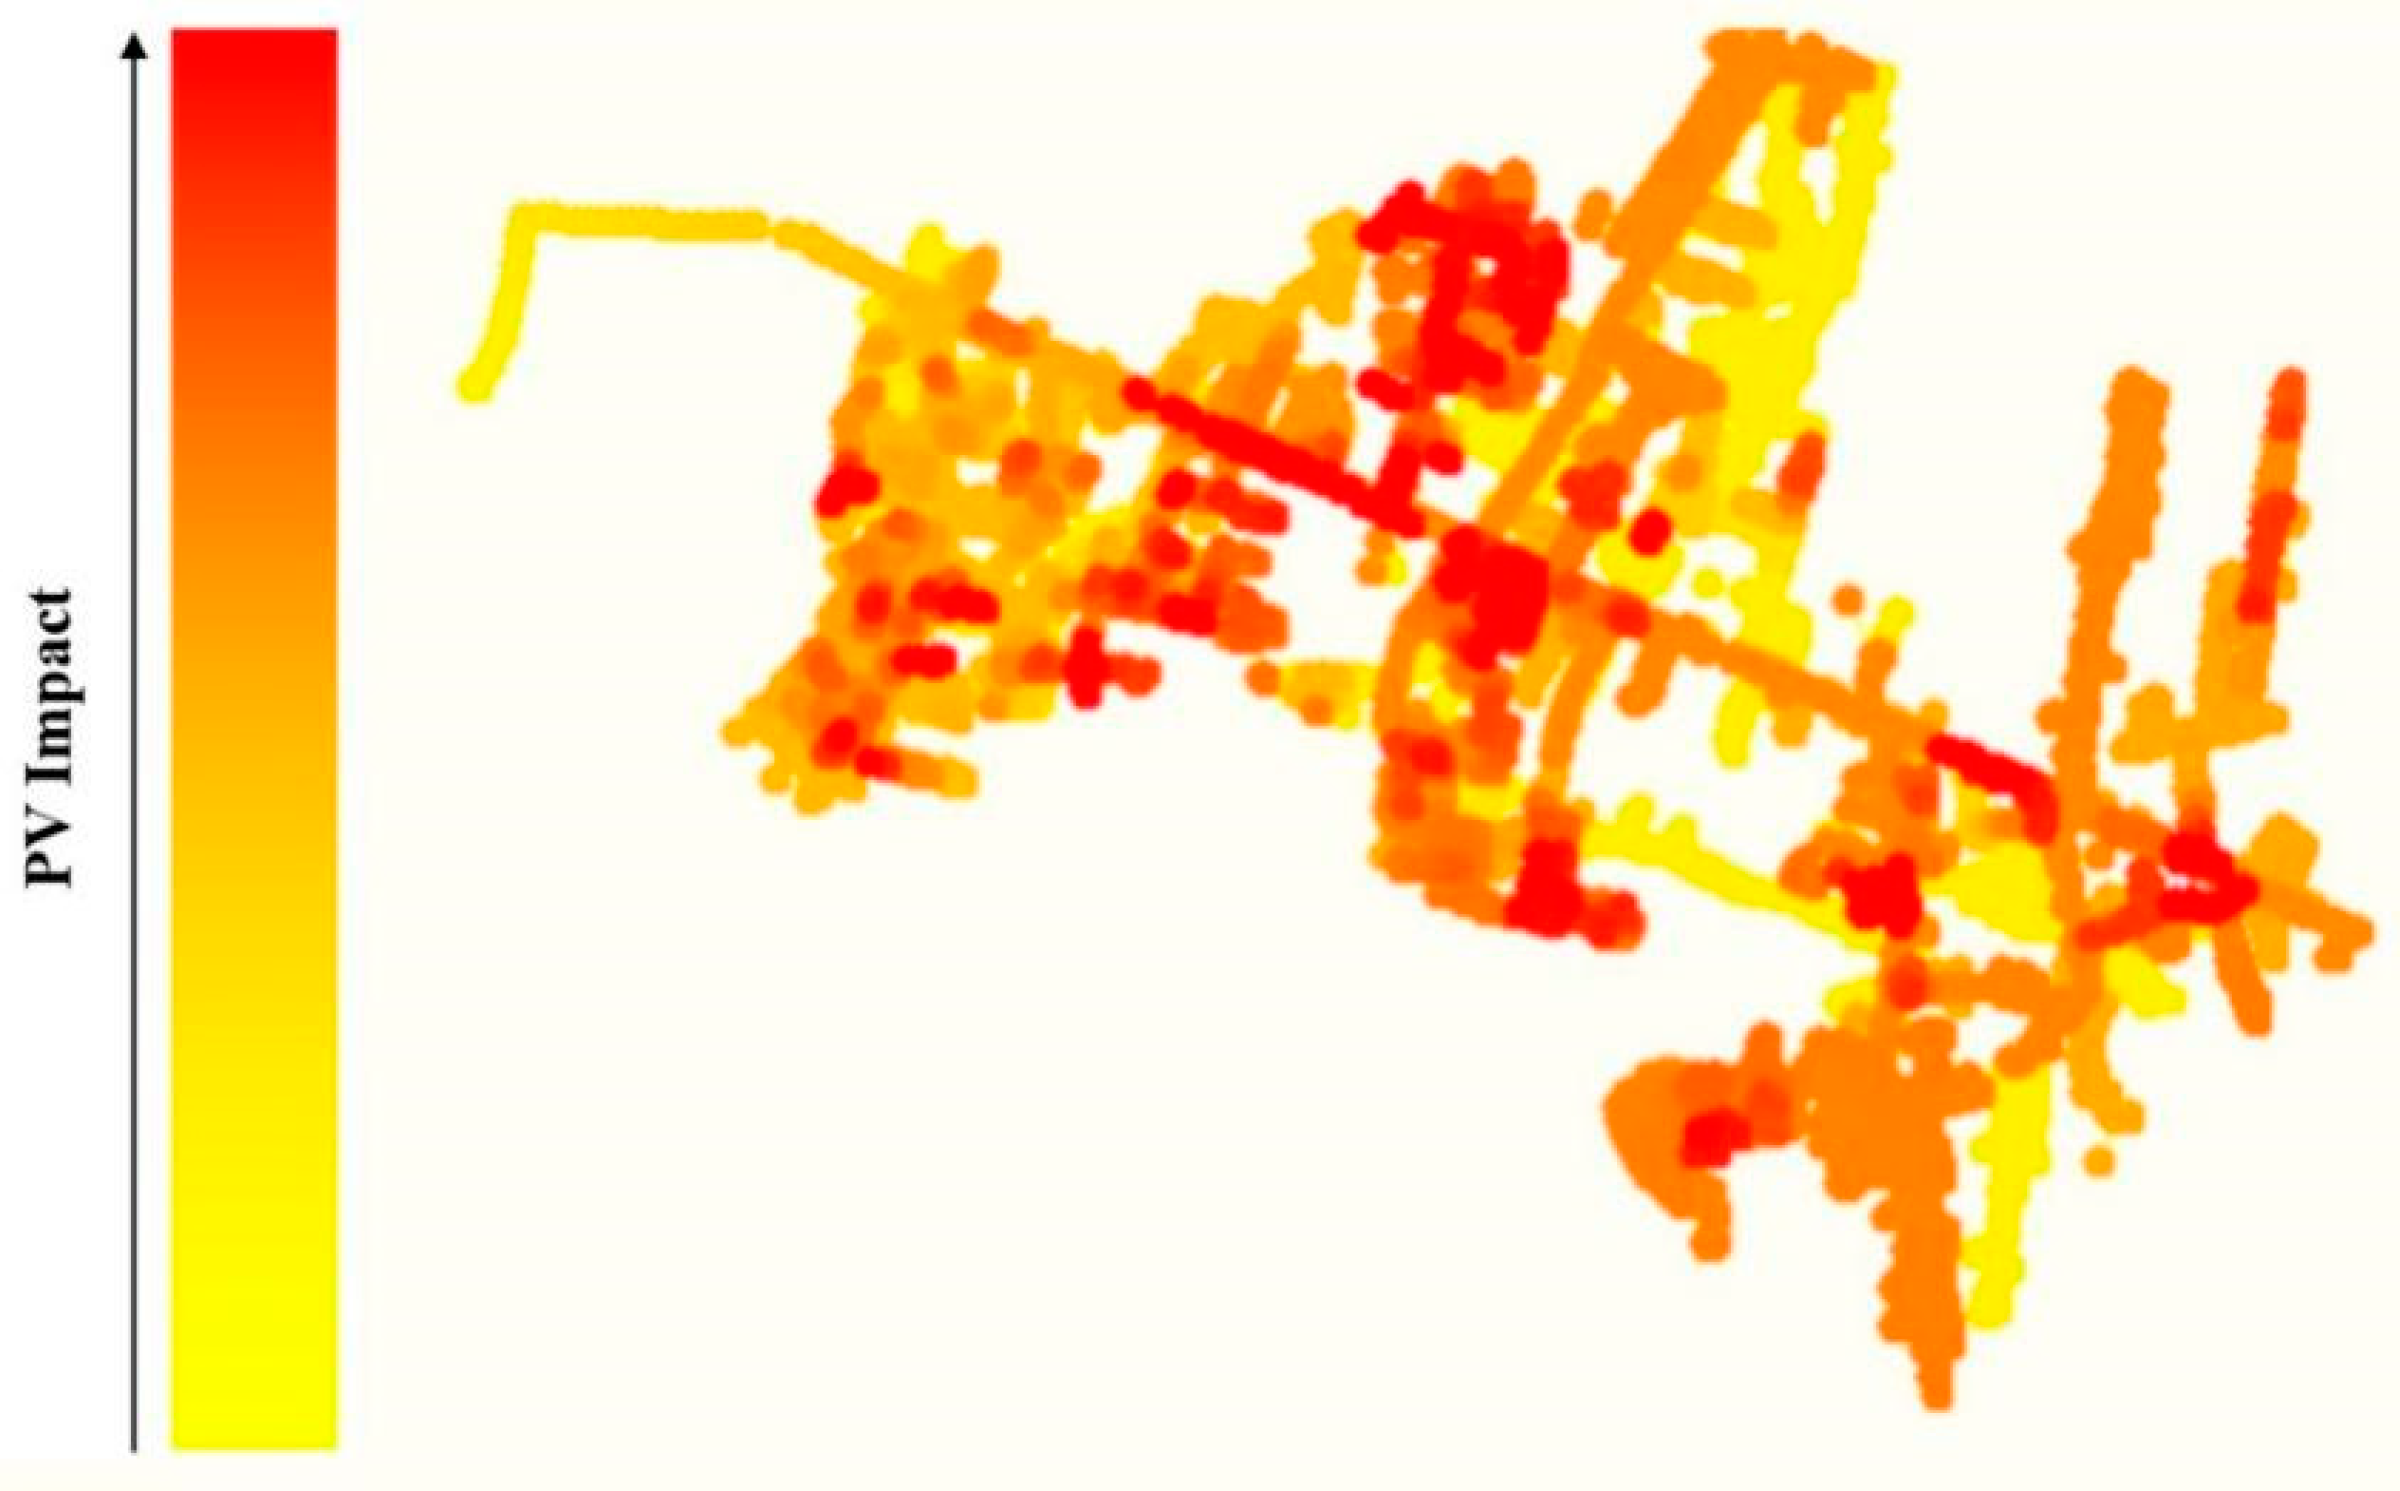
Section 4 of this paper, actual irradiance information was captured for the construction of this simulation results. From this information, and using the power flow results, it is possible to construct a heat map for the zones on which the PV penetration impact is greater in terms of percentage voltage rise as shown in
Figure 14. On average, the buses with the highest percentage of voltage rise (16%) are those close to the highest concentration of PV while the lower voltage rise is found at the tails of the secondary circuits and where the PV concentration is the lowest.
Finally, to measure the effect of these changes on the behavior of the circuit, it is important to determine if there is a global reduction or increase in technical losses. As shown in
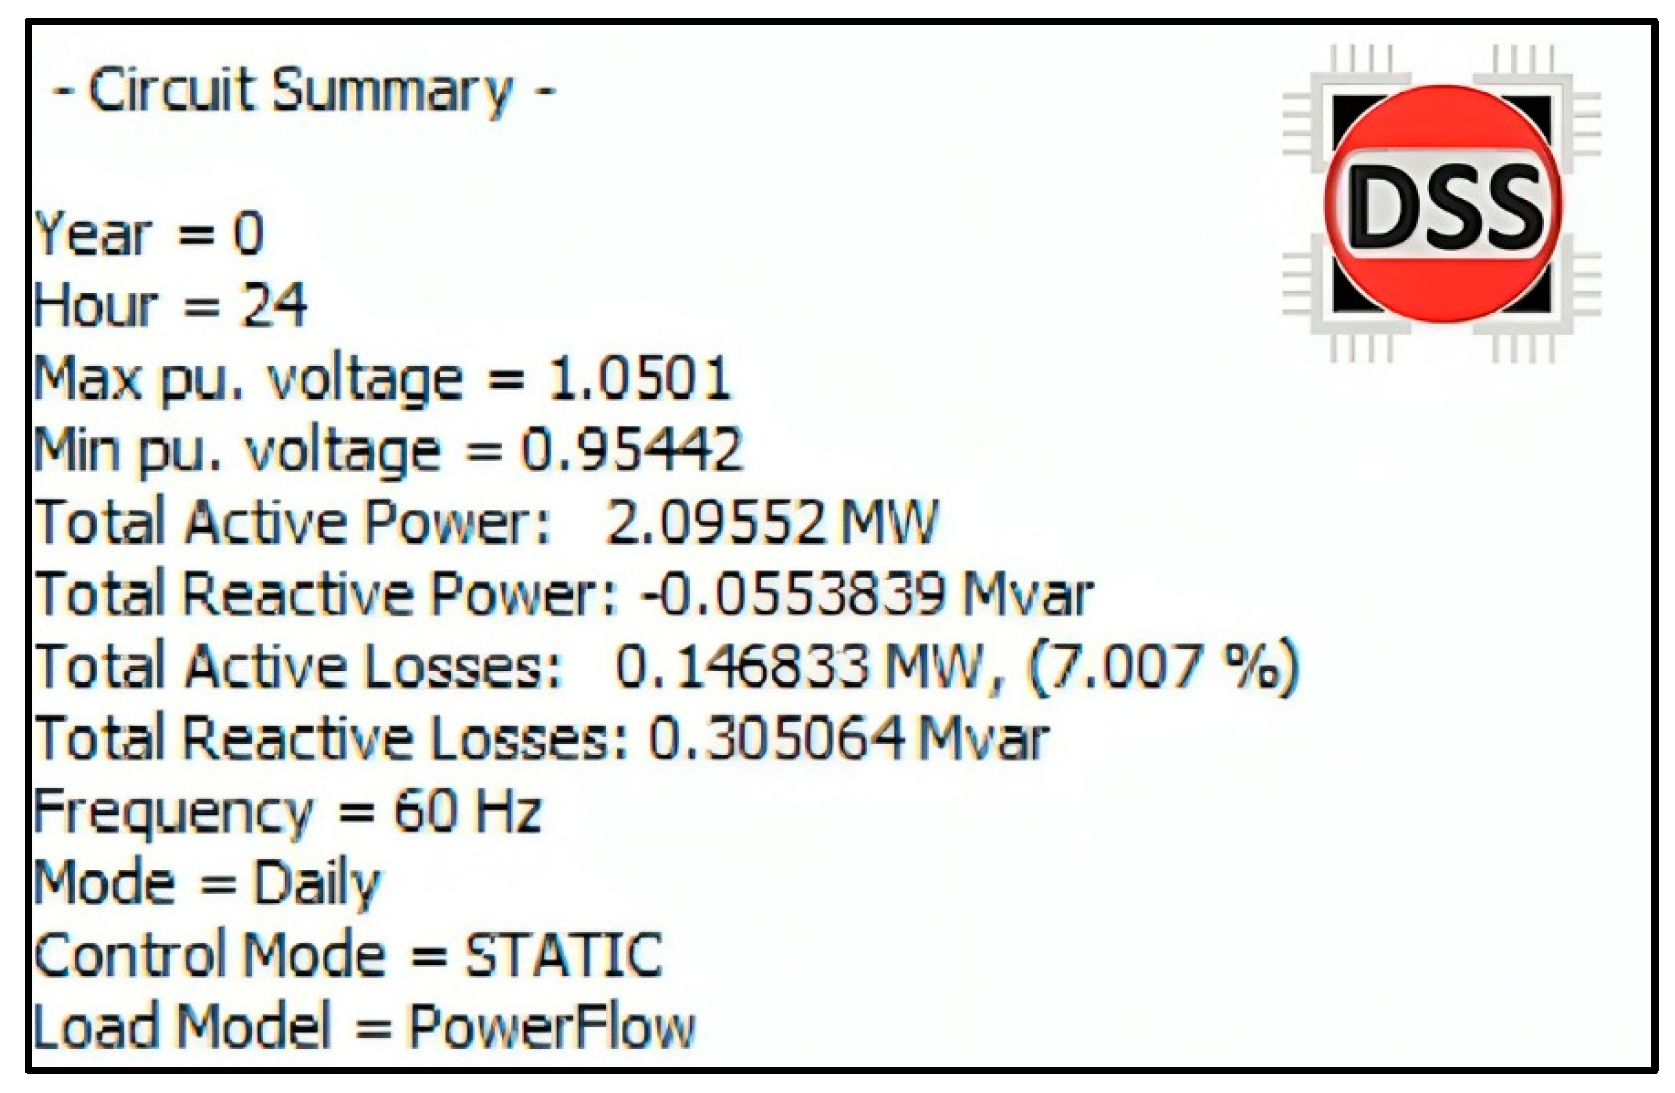
Figure 15, the total circuit losses are reduced from 238.83 kW to 209.35 kW for an improvement of 12.34%. The summary of the power flow simulation is shown in
Figure 16.
5.2. Discussion
As demonstrated, detailed studies on real geographically dispersed DERs can be easily carried out with the integration of GIS and advanced simulation tools such as OpenDSS. These tools facilitate the assessment, accurate representation and analysis of complex distribution networks facing increasing integration of renewable energy sources, allowing for the evaluation of various technical aspects such as voltage regulation, power quality, and system stability. Creating the possibility of conducting studies of the Dominican Republics’ electrical grid with similar focus as the ones shown in [
36,
37,
38].
For validation purposes, the obtained results were compared with real data provided by the DNO regarding the reported average technical losses for the year 2021 (as shown in Table 5). As can be seen in
Figure 16, the absolute error between this value and the one reported by the DNO is approximately 9.5%. This implies that the topological arrangement and considerations that were taken in our modelling process are in line with the real behavior of the circuit. The differences between the reported technical losses value and the simulation results can be explained by the previous exposed modelling challenges regarding the DNO dataset. Thus, the methodology presented by this work could be implemented for the simulation of the actual DNO distribution circuit topology.
This subject holds utmost significance, particularly in countries like Dominican Republic, where present regulations require a supplementary study for new photovoltaic systems if the actual installed capacity in that circuits exceeds 15% of the circuit´s annual peak load [
39]. The additional cost of such a study constitutes an obstacle to the installation of new photovoltaic systems, for small-scale photovoltaic systems where the cost is disproportionately high. In addition, it creates a backlog in the studies on the DNO side since it needs to process many studies through applications above the 15% limit.
Recent studies have demonstrated that the technical limit is often much higher than the proposed limit of 15% by the regulations in the Dominican Republic. Even extreme feeders with PV distribution at the end show at least 25% accommodation capacity with mitigation measures such as voltage setpoint optimization or reactive power control, and even 50% in urban feeders [
40]. As the country seeks to increase its renewable energy generation, understanding the maximum penetration level of PV installations is crucial for ensuring the stability and reliability of the distribution grid, as well as helps in planning and implementing sustainable energy strategies, fostering the growth of renewable energy, and reducing dependence on fossil fuels.
However, from the author’s experience, the DNOs in the Dominican Republic lack access to tools to conduct these detailed studies, therefore an open-source repository with the processes and models to clean, fix, aggregate or remove incorrect, corrupted, incorrectly formatted, duplicated, or incomplete data within the GIS network dataset was created to enable the data to be processed by the QGIS2OPENDSS plugin in QGIS, which is the key to carry out these studies.
Through the validation process some errors were found in the network element database, requiring additional network analysis for correction. Namely, there are discrepancies in the association of loads to transformers, as well as energy consumption data in the DNOs database. This database must undergo a thorough cleansing process to remove any erroneous information that may lead to the creation of impractical engineering network models. Correcting these errors is a complex task that demands an understanding of the construction of GIS network models and their appropriate adaptation for power engineering purposes.
Finally, to fully harness the capabilities of GIS software, forthcoming efforts will concentrate on the development of hosting capacity maps and investigations pertaining to the penetration of electric vehicles (EVs). Additionally, GIS-based tools will be devised to facilitate the mapping and identification of infrastructure weakness, such as trees located near overhead medium voltage (MV) lines, among other location-based hazards. For example, preliminary analysis conducted on the DN data reveals that the occurrence of tree limbs falling into overhead distribution lines constitutes a contributing factor to nearly 10% of power outages within certain distribution feeders.
6. Conclusions
Overall, this paper contributes to the growing body of research on modeling and simulation of distribution networks with high renewable penetration. The proposed framework utilizing QGIS and OpenDSS provides a valuable tool for network planning, analysis, and optimization in the context of increasing renewable energy integration. It offers a cost-effective and flexible solution, empowering stakeholders to make informed decisions and pave the way towards a sustainable and resilient energy future.
The power of the tool has been demonstrated on a real circuit in Dominican Republic with high renewable penetration and with more than 7,000 customers. The illustrative network studies highlight the convenience of the tool to effectively perform analysis on the impact of Distributed Energy Resources (DERs) in the Medium Voltage (MV) and Low Voltage (LV) networks.
Furthermore, the possibility of using this tool for the creation of co-simulation scenarios will be explored in future projects. With the aim of creating toolboxes for the development of digital twin technologies focused on the operation of distribution network and fault detection processes.
The implementation of the tool using real data is expected to bring new opportunities for capacity building within the DNO, as well as future collaborations from the remaining DNOs and other research groups within the DR.
Funding
This work is financially supported in part by the United States Agency for International Development (USAID) and National Academy of Science under parent award number AID-OAA-A-11-00012. The authors thank EDENORTE´s Distribution, Planning and Network Study Department for providing the GIS database and technical support for the analyzed circuit, and EPERLab researchers for making this tool open source.
Data Availability Statement
Conflicts of Interest
The authors declare no conflicts of interest.
References
- Shirek, G.; Lassiter, B.; Carr, W.; Kersting, W.H. Modeling Secondary Services in Engineering and Mapping. In Proceedings of the 2010 IEEE Rural Electric Power Conference (REPC); IEEE, May 2010; pp. A2-A2-10–10. [Google Scholar]
- Adesina, L.M.; Abdulkareem, A.; Katende, J.; Fakolujo, O. Newton-Raphson Algorithm as a Power Utility Tool for Network Stability. Adv. Sci. Technol. Eng. Syst. J. 2020, 5, 444–451. [Google Scholar] [CrossRef]
- Lazarou, S.; Vita, V.; Karampelas, P.; Ekonomou, L. A Power System Simulation Platform for Planning and Evaluating Distributed Generation Systems Based on GIS. Energy Syst. 2013, 4, 379–391. [Google Scholar] [CrossRef]
- Alhamwi, A.; Medjroubi, W.; Vogt, T.; Agert, C. Development of a GIS-Based Platform for the Allocation and Optimisation of Distributed Storage in Urban Energy Systems. Appl. Energy 2019, 251, 113360. [Google Scholar] [CrossRef]
- Bottaccioli, L.; Patti, E.; Macii, E.; Acquaviva, A. GIS-Based Software Infrastructure to Model PV Generation in Fine-Grained Spatio-Temporal Domain. IEEE Syst. J. 2018, 12, 2832–2841. [Google Scholar] [CrossRef]
- Parajeles, M.J.; Quirós-Tortós, J.; Valverde, G. Assessing the Performance of Smart Inverters in Large-Scale Distribution Networks with PV Systems. 2017 IEEE PES Innov. Smart Grid Technol. Conf. - Lat. Am. ISGT Lat. Am. 2017 2017, 2017, 1–6. [Google Scholar] [CrossRef]
- Massano, M.; Macii, E.; Lanzini, A.; Patti, E.; Bottaccioli, L. A GIS Open-Data Co-Simulation Platform for Photovoltaic Integration in Residential Urban Areas. Engineering 2022. [Google Scholar] [CrossRef]
- González, R.; Arguello, A.; Valverde, G.; Quirós-Tortós, J. OpenDSS-Based Distribution Network Analyzer in Open Source GIS Environment. 2016 IEEE PES Transm. Distrib. Conf. Expo. Am. PES T D-LA 2016, 2017. [Google Scholar] [CrossRef]
- Jain, A.K.; Horowitz, K.; Ding, F.; Sedzro, K.S.; Palmintier, B.; Mather, B.; Jain, H. Dynamic Hosting Capacity Analysis for Distributed Photovoltaic Resources—Framework and Case Study. Appl. Energy 2020, 280, 115633. [Google Scholar] [CrossRef]
- Hariri, A.; Newaz, A.; Faruque, M.O. Open-source Python-OpenDSS Interface for Hybrid Simulation of PV Impact Studies. IET Gener. Transm. Distrib. 2017, 11, 3125–3133. [Google Scholar] [CrossRef]
- Rathbun, M.; Xu, Y.; Nejad, R.R.; Qu, Z.; Sun, W. Impact Studies and Cooperative Voltage Control for High PV Penetration. IFAC-PapersOnLine 2018, 51, 684–689. [Google Scholar] [CrossRef]
- García-Muñoz, F.; Jiménez-Martínez, M.; Eichman, J.; Corchero, C.; Benveniste, G. Exploring the Viability of Local Electricity Markets for Managing Congestion in Spanish Distribution Networks. Energies 2024, 17, 1–18. [Google Scholar] [CrossRef]
- Vega-Fuentes, E.; Yang, J.; Lou, C. Power Flow Visualization in DER-Rich Low Voltage Networks. IEEE PES Innov. Smart Grid Technol. Conf. Eur. 2020, 2020, 735–738. [Google Scholar] [CrossRef]
- Sigurdsson, G.Á.; Abdel-Fattah, M.F. Smart Grids Simulation Tools: Overview and Recommendations. 2021 IEEE 62nd Int. Sci. Conf. Power Electr. Eng. Riga Tech. Univ. RTUCON 2021 - Proc. 2021. [Google Scholar] [CrossRef]
- Antoncic, M.; Mikec, M.; Blazic, B. Development of Distribution Network Model in OpenDSS Using Matlab and GIS Data. 7th Int. Youth Conf. Energy, IYCE 2019, 2019; 1–6. [Google Scholar] [CrossRef]
- Abdulrahman, I.; Radman, G. Power System Spatial Analysis and Visualization Using Geographic Information System (GIS). Spat. Inf. Res. 2020, 28, 101–112. [Google Scholar] [CrossRef]
- Olauson, J.; Marin, M.; Soder, L. Creating Power System Network Layouts: A Fast Parallel Algorithm. IEEE Syst. J. 2020, 14, 3687–3694. [Google Scholar] [CrossRef]
- Quiros-Tortos, J.; Valverde, G.; Arguello, A.; Ochoa, L.N. Geo-Information Is Power: Using Geographical Information Systems to Assess Rooftop Photovoltaics in Costa Rica. IEEE Power Energy Mag. 2017, 15, 48–56. [Google Scholar] [CrossRef]
- Martinez-Velasco, J.; Guerra, G. Reliability Analysis of Distribution Systems with Photovoltaic Generation Using a Power Flow Simulator and a Parallel Monte Carlo Approach. Energies 2016, 9, 537. [Google Scholar] [CrossRef]
- de Negreiros, G.F.; Lobo, F.X.; Torres, I.C.; Tiba, C. Impact on Voltage Regulation in Medium Voltage Distribution Networks Due to the Insertion of Photovoltaic Generators. Energies 2023, 16. [Google Scholar] [CrossRef]
- Ebad, M.; Grady, W.M. An Approach for Assessing High-Penetration PV Impact on Distribution Feeders. Electr. Power Syst. Res. 2016, 133, 347–354. [Google Scholar] [CrossRef]
- Radatz, P.; Kagan, N.; Rocha, C.; Smith, J.; Dugan, R.C. Assessing Maximum DG Penetration Levels in a Real Distribution Feeder by Using OpenDSS. Proc. Int. Conf. Harmon. Qual. Power, ICHQP 2016, 2016, 71–76. [Google Scholar] [CrossRef]
- Weber, M.; Cakmak, H.K.; Kuhnapfel, U.; Hagenmeyer, V. A Novel Method for Topology Preserving Static Network Reduction. 2023 IEEE 11th Int. Conf. Smart Energy Grid Eng. SEGE 2023 2023, 58–63. [Google Scholar] [CrossRef]
- Pereira, O.; Quiros-Tortos, J.; Valverde, G. Phase Rebalancing of Distribution Circuits Dominated by Single-Phase Loads. IEEE Trans. Power Syst. 2021, 36, 5333–5344. [Google Scholar] [CrossRef]
- Jovanović, D. From Qgis To Python: Comparison of Free and Open Tools for Statistical Analysis of Cultural Heritage and Data Representation. Int. Arch. Photogramm. Remote Sens. Spat. Inf. Sci. - ISPRS Arch. 2022, 48, 229–236. [Google Scholar] [CrossRef]
- McGarry, C.; Anderson, A.; Elders, I.; Galloway, S. A Scalable Geospatial Data-Driven Localization Approach for Modeling of Low Voltage Distribution Networks and Low Carbon Technology Impact Assessment. IEEE Access 2023, 11, 64567–64585. [Google Scholar] [CrossRef]
- Donastorg, A.; Renukappa, S.; Suresh, S. Evaluating Critical Success Factors for Implementing Renewable Energy Strategies in the Dominican Republic. Renew. Energy 2020, 149, 329–335. [Google Scholar] [CrossRef]
- Wang, S.; Liu, S.; Huang, C.; Tang, J.; Pang, Y. Integration Implementation and Application of Power Grid GIS Platform and Production Management System Based on ESB. Proc. - 2022 Int. Semin. Comput. Sci. Eng. Technol. SCSET 2022, 2022; 287–290. [Google Scholar] [CrossRef]
- Domoto, E.; Okuhara, K.; Rene, A.O.N. Development of QGIS Plugin for Seamless Integration of Ideation Support and Geoprocessing. Proc. - 2021 10th Int. Congr. Adv. Appl. Informatics, IIAI-AAI 2021, 2021; 569–574. [Google Scholar] [CrossRef]
- Assis, F.A.; Coelho, F.C.R.; Castro, J.F.C.; Donadon, A.R.; Roncolatto, R.A.; Rosas, P.A.C.; Andrade, V.E.M.S.; Bento, R.G.; Silva, L.C.P.; Cypriano, J.G.I.; et al. Assessment of Regulatory and Market Challenges in the Economic Feasibility of a Nanogrid: A Brazilian Case. Energies 2024, 17, 1–18. [Google Scholar] [CrossRef]
- Dugan, R.C.; McDermott, T.E. An Open Source Platform for Collaborating on Smart Grid Research. 2011 IEEE Power Energy Soc. Gen. Meet. 2011, 1–7. [Google Scholar] [CrossRef]
- Ram, P.; Sinha, K. Revisiting Kd-Tree for Nearest Neighbor Search. In Proceedings of the Proceedings of the 25th ACM SIGKDD International Conference on Knowledge Discovery & Data Mining; ACM: New York, NY, USA, July 25, 2019; pp. 1378–1388. [Google Scholar]
- Leiva, D.; Araya, C.; Valverde, G.; Quiros-Tortos, J. Statistical Representation of Demand for GIS-Based Load Profile Allocation in Distribution Networks. 2017 IEEE Manchester PowerTech 2017, 1–6. [Google Scholar] [CrossRef]
- Brusilowicz, B.; Herlender, J. Transmission Line Modelling and Simulating for Transient Analysis. Proc. - Int. Conf. Mod. Electr. Power Syst. MEPS 2019, 2019. [Google Scholar] [CrossRef]
- Zanocco, C.; Sun, T.; Stelmach, G.; Flora, J.; Rajagopal, R.; Boudet, H. Assessing Californians’ Awareness of Their Daily Electricity Use Patterns. Nat. Energy 2022, 7, 1191–1199. [Google Scholar] [CrossRef]
- Azzopardi, B.; Gabdullin, Y. Assessing Combined High Photovoltaic and Electric Vehicle Charging Penetration in Low-Voltage Distribution Networks: A Case Study in Malta. Energies 2024, 17. [Google Scholar] [CrossRef]
- Haces-Fernandez, F. Risk Assessment Framework for Electric Vehicle Charging Station Development in the United States as an Ancillary Service. Energies 2023, 16. [Google Scholar] [CrossRef]
- Ni, Q.; Jiang, H. Topology Identification of Low-Voltage Distribution Network Based on Deep Convolutional Time-Series Clustering. Energies 2023, 16. [Google Scholar] [CrossRef]
- Garabitos Lara, E.; Vallejo Díaz, A.; Ocaña Guevara, V.S.; Santos García, F. Tecno-Economic Evaluation of Residential PV Systems under a Tiered Rate and Net Metering Program in the Dominican Republic. Energy Sustain. Dev. 2023, 72, 42–57. [Google Scholar] [CrossRef]
- Li, S.; Lian, J.; Conejo, A.J.; Zhang, W. Transactive Energy Systems: The Market-Based Coordination of Distributed Energy Resources. IEEE Control Syst. 2020, 40, 26–52. [Google Scholar] [CrossRef]
|
Disclaimer/Publisher’s Note: The statements, opinions and data contained in all publications are solely those of the individual author(s) and contributor(s) and not of MDPI and/or the editor(s). MDPI and/or the editor(s) disclaim responsibility for any injury to people or property resulting from any ideas, methods, instructions or products referred to in the content. |
© 2024 by the authors. Licensee MDPI, Basel, Switzerland. This article is an open access article distributed under the terms and conditions of the Creative Commons Attribution (CC BY) license (http://creativecommons.org/licenses/by/4.0/).
