Preprint
Article

Photo-Physical Investigations of Ionic Liquid (IL) Based ZnO Dye Sensitized Solar Cells

Altmetrics

Downloads

112

Views

40

Comments

0

This version is not peer-reviewed

Submitted:

06 May 2024

Posted:

07 May 2024

You are already at the latest version

Alerts
Abstract
In this research work, we describe the preparation process, characterization, and photo-physical studies of an ionic liquid (IL) based semiconductor Zinc Oxide (ZnO) nanoparticles synthesized by an economical wet chemical precipitation method. For the first time, an IL was synthesized with the help of a chemical reaction between triethylamine (TEA) and bromoacetic acid (BAA). A polyamide dye was prepared by a reaction between two monomers, ethylenediamine (EDA) and trimesoylchloride (TMC), under room temperature conditions. The polyamide dye was capped on ZnO nanoparticles, and the final product was divided into three different samples, A, B, and C, according to level of concentrations of IL and Polyamide dye. These samples were characterized with X-Ray Diffraction (XRD), Field Emission Scanning Electron Microscopy (FESEM), Dynamic Light Scattering (DLS) spectra, Ultraviolet-Visible (UV-Vis), and Fluorescence spectroscopies. The formation of polyamide linkages in the ionic liquid has been confirmed by a spectroscopic method using Fourier Transform Infrared (FTIR) spectroscopy. The capping of polyamide dye molecules on the surface of ZnO nanoparticles revealed two things: (i) improved UV absorption spectra and (ii) enhanced luminescence in the photoluminescence spectra. Hence, during investigations, broad absorption bands were observed at peaks 263 nm, 278 nm, and 276 nm respectively for samples A, B, and C. Further, IL was used as an electrolyte or redox mediator and polyamide as a dye material in the fabrication of ZnO Dye-Sensitized Solar Cells (DSSCs). The samples A, B, and C were used in the fabrication of photo-anode assemblies for ZnO DSSCs. The ZnO DSSCs were tested under strong simulated light at Air Mass (AM) 1.5 solar irradiations. The observed photovoltaic results shown that solar cell SCB generated a maximum power conversion efficiency (η) of 5.65%, higher than the power conversion efficiencies of solar cells SCA (3.99%) and SCC (4.46%) respectively. The Incident Photon to Current Conversion Efficiency (IPCE) spectra values of ZnO DSSCs shown a significant improvement in the incident photon to current conversion efficiency of solar cell SCB (IPCE=61%) as compared to SCC (enhanced by 6%) and SCA (enhanced by 4%). Such solar cell assemblies can be suitable for green and clean energy applications.
Keywords: 
Subject: Engineering  -   Electrical and Electronic Engineering

1. Introduction

The Dye-Sensitized Solar Cells (DSSCs) have been known as the third generation solar cells. The third generation (3G) of photovoltaic technology, which combines the low cost, flexibility of polymer thin films with the stability of organic and inorganic nanoparticles, was introduced with the aim of improving the optoelectronic properties of the low-cost thin film dye sensitized solar cells. The idea of dye sensitized solar cells was first suggested by Professor Grátzel in 1991 [1]. The DSSC has low fabrication cost, low maintenance, low material cost, low weight, and reasonably high-power conversion efficiency. In a DSSC, the photovoltaic converter directly converts the solar radiation energy into electricity. The DSSC configuration does not require very sophisticated fabrication requirements as in case of silicon solar cells [2,3,4]. The modern DSSCs can be made very transparent, flexible, and colorful for applications. Dyes play a very important role in the DSSC as a direct light absorber of sun or simulated light conditions. High absorption spectrum of a dye produces a high stream of photocurrent in the assembly of the DSSC [5]. The overall power conversion efficiency of DSSC depends upon the injection of electrons from the valence band to the conduction band for smooth surface scattering of ZnO nanoparticles. In this research work, we have experimentally investigated the synthesis, characterization and optoelectronic properties of ionic liquids based semiconductor ZnO nanocomposite [6]. The photo-anode section of a dye sensitized solar cell absorbs dye molecules and performs the conduction of photoelectrons. ZnO is a wide energy bandgap (3.37 eV) and large excitation binding energy (60 meV) n-type semiconductor material used as a photo-anode material in optoelectronic devices [7].
An ionic liquid (IL) is used as a non-volatile solvent for electrolytes in ZnO DSSCs. The IL electrolytes can be diluted with different solvents of organic and inorganic materials. The formation of an ionic liquid is just like the formation of salt. A salt is a complex composite that comprises a positively charged cation and negatively charged anion. These positive and negative charge particles balance out, making the overall compound nonaligned in charge [8,9,10]. An ionic liquid is a balanced and unbalanced compound used as an electrolyte and redox mediator in DSSC. Basically, the three types of electrolytes used for DSSCs are liquid, solid and quasi solid electrolytes [11]. Ionic liquids based on acetonitrile (ACN) have been widely used as solvents for DSSCs. The basic process of working of ZnO DSSC is shown in Figure 1. However, the relatively highest cell efficiency and a solvent with low viscosity improves the diffusion coefficient of the redox couple, allowing high ionic conductivity [12].
ILs possess an inclusive collection of properties that can be adjusted to suit different applications ranging from biological, electrochemical, catalytic research, to dye sensitized solar cells [13]. Ionic liquids have low melting temperature and can dissolved in both organic and inorganic compounds.
Unfortunately, the low hole-conductivity, and poor semiconductor electrolyte interface dealings so far have limited use of IL [15]. The mixtures of anions with cation, along with the range of sometimes spelled pendants or functional groups, allow the synthesis of the preferred ionic liquids with particular properties [16]. For example, the use of bromoacetic acid results in ionic liquids with higher stability. At present, the cyclical based ionic liquids, principally bromoacetic acid based ionic liquid, have developed into the fundamental choice in studies regarding ionic liquid-based electrolyte for the past years. Amongst the participants of the heterocyclic family, triethylamine and bromoacetic acid have been used as the cation for ionic liquids due to several properties, such as lower viscosity, higher diffusivity, higher density and higher stability [17]. Also, the electrochemical properties of the ionic liquids can be applied for various electrochemical devices such as dye sensitized solar cells [18].

2. Experimental Procedure

In the following segment, we have discussed the materials and instruments used for the synthesis procedure and investigated the structural characteristics of ionic liquid and polyamide capped ZnO nanoparticles.

2.1. Materials Methodology

All the chemicals used in this research work were purchased from commercial suppliers and were used without further purification. For the study of ionic liquid and polyamide dye capped ZnO nanoparticles, the UV-Vis absorption spectra were recorded on a Shimadzu UV-2400 spectrophotometer and a PerkinElmer LS55 fluorescence spectrophotometer was utilized to study the photo-physical properties of the composites. FE-SEM images of ionic liquid and polyamide dye capped ZnO nanoparticles were recorded on a JEOL Model-JSM-7610F plus, operating at 10 kV voltage which was used to analyze the morphology of final nanocomposites. The current density and photo-voltage (J-V curves) of ionic liquid and polyamide based ZnO DSSCs were evaluated at 100mW/cm2 under AM 1.5 solar irradiations. The significant values of photo-voltage and current density were recorded using an ultra-fine digital multimeter. The IPCE (incident photon to current conversion efficiency) spectra values were evaluated by varying excitation wavelengths at 300 nm for ZnO DSSC.

2.2. Synthesis of Ionic Liquid (IL) Electrolyte

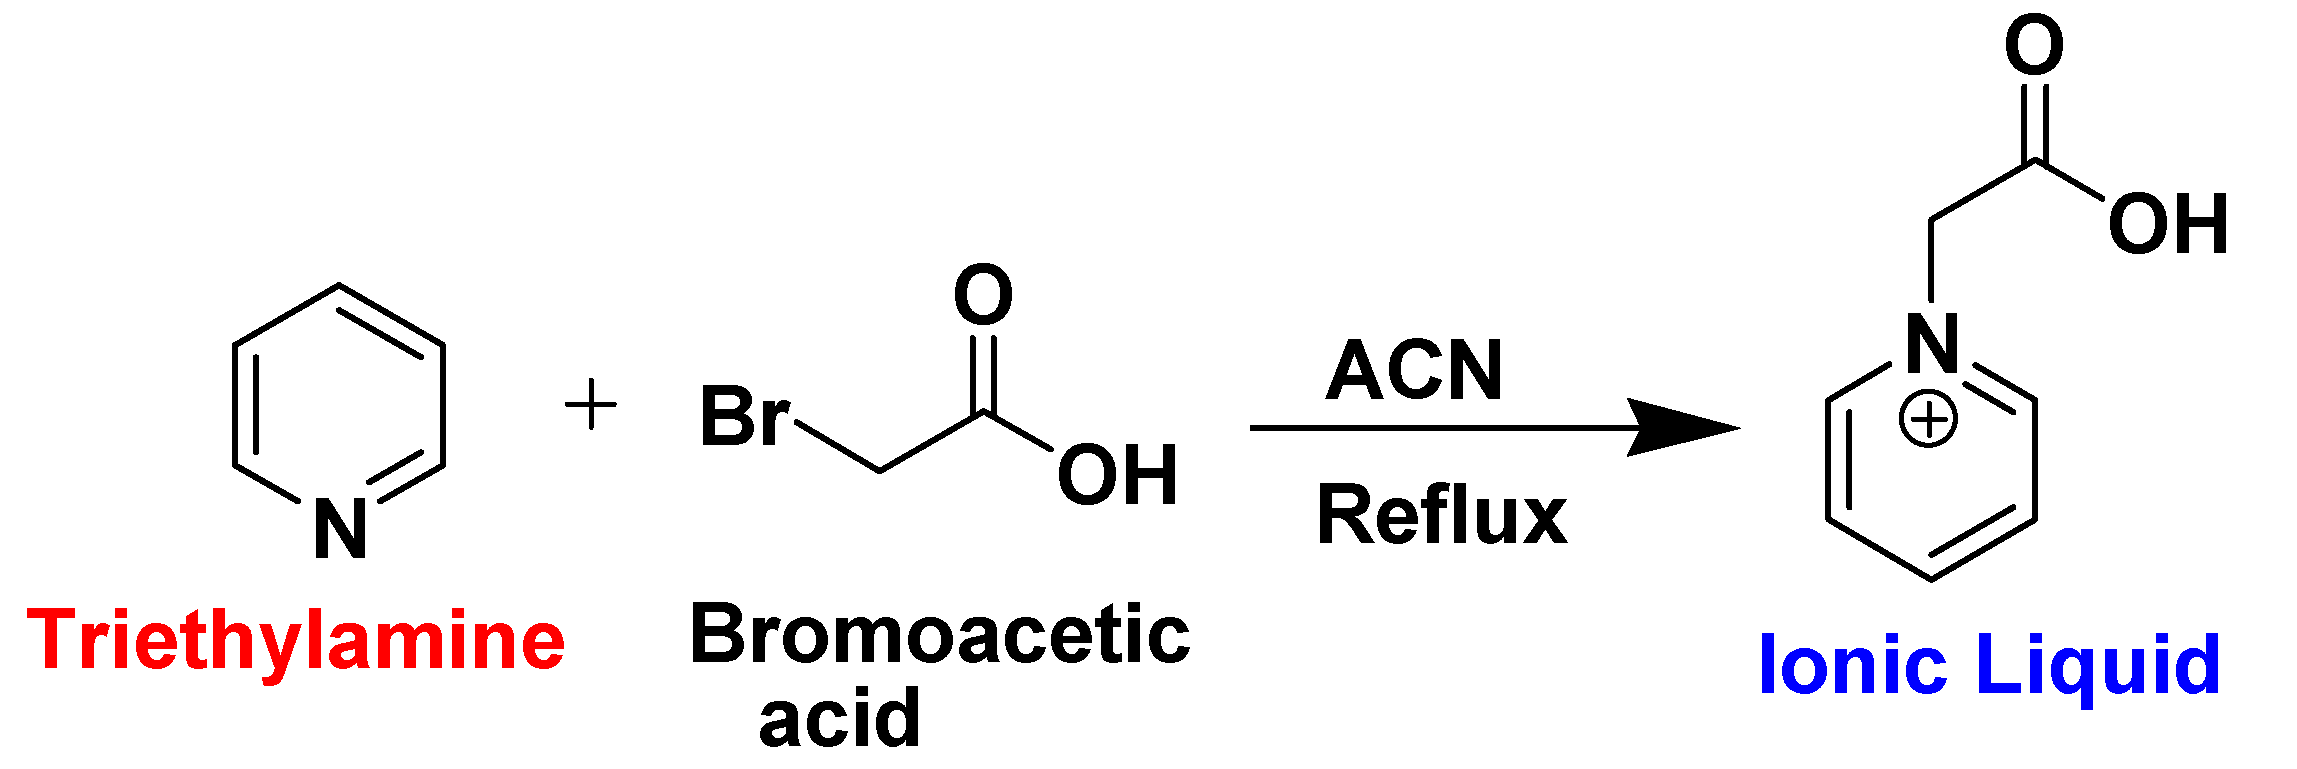
The desired ionic liquid was synthesized by the wet chemical precipitation method by reacting bromoacetic acid (BAC) and triethylamine (TEA). Ionic liquid was synthesized by a reaction between 4 g of bromoacetic acid which was dissolved in 30 ml of acetonitrile and 2 g of pyridine (added to this solution) shown in Scheme 1. The reaction mixture was stirred at room temperature (25C) for one hour. The formation of white precipitates indicates the formation of a product. The solution was filtered through Whatman filter paper and the precipitates obtained were washed with acetonitrile two to three times. The product obtained was in pure form.

2.3. Synthesis of Dye

A polyamide dye was prepared by interfacial polymerization between two monomers ethylene diamine and trimesoyl chloride (TMC). A 20 mL portion of 2 wt % aqueous ethylene diamine solution was prepared and a 10 mL portion of 0.1 wt/vol% TMC in n-hexane was immediately poured into the beaker containing ethylene diamine solution after which interfacial polymerization was conducted at room temperature for 1 min shown in Scheme 2. After the reaction, the excess TMC solution was rinsed with n-hexane. The prepared polyamide material was washed several times with DI (Deionized) water.

2.4. Preparation of ZnO Nanoparticles

The quantum-sized ZnO nanoparticles were synthesized by taking Zn (ClO4)2·6H2O (1g) in distilled water (25 mL). The solution was maintained at constant stirring with a solution temperature of 25C. The NaOH solution was slowly added to the Zn2+ solution dropwise. The stirring of solution continued for 2 hrs, and a dispersion of ZnO particles gradually formed in the solution. The as-prepared dispersion was centrifugally filtered and washed with deionized distilled water five times.

2.5. Capping of Dye on ZnO Nanoparticles (Formation of Samples A, B, and C)

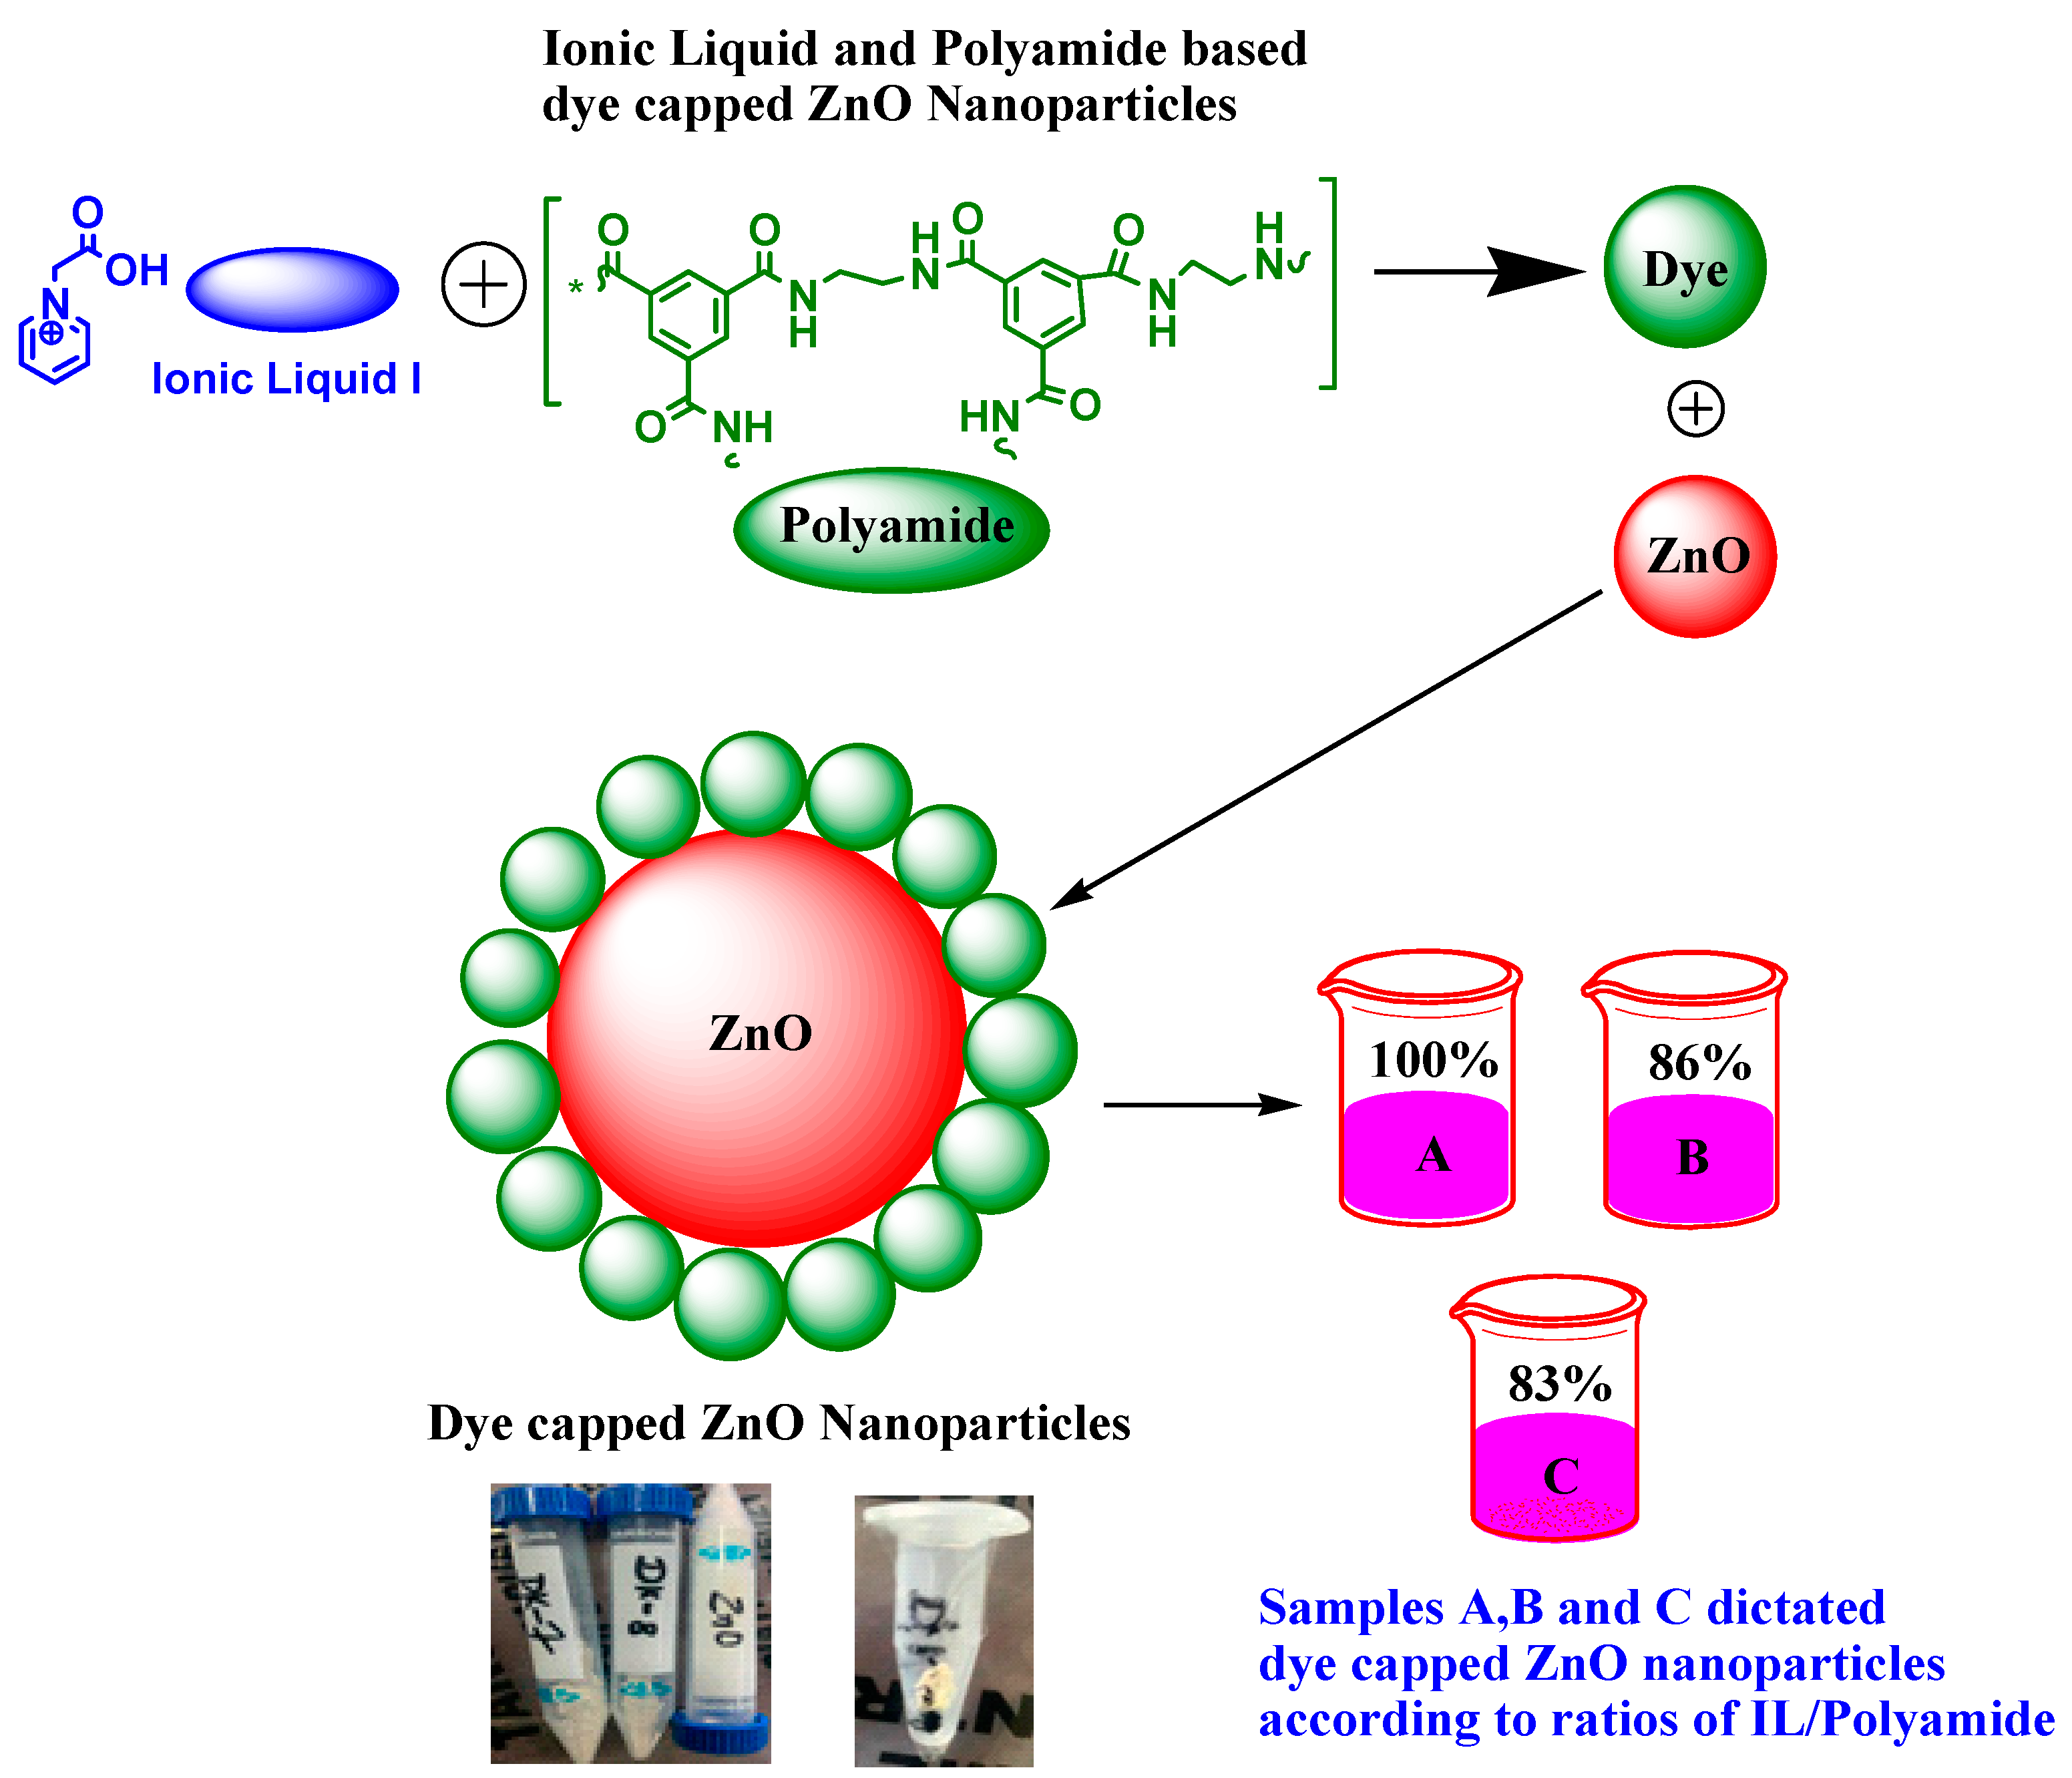
The ZnO nanoparticles were synthesized by taking Zn (ClO4)2·6H2O (2.0 mmol) along with ionic liquid (3.0 mmol) and polyamide (5 wt %) in distilled water (25 mL). The solution was maintained at constant stirring with a solution temperature of 25C. The NaOH solution was slowly added to the Zn2+ solution dropwise. The stirring of the solution continued for 2 hours, and a dispersion of ZnO nanoparticles gradually formed in the solution. The as-prepared dispersion was centrifugally filtered and washed with ethanol and deionized distilled water five times. Thus, the Ionic liquid and polyamide dye capped ZnO nanoparticles (samples A, B, and C, shown in Figure 2) were obtained respectively. The samples A, B and C were prepared according to the level of quantity (in mg) for ionic liquid, and polyamide material. These three samples actually show the ratios of ionic liquid to polyamide dye materials capped on ZnO nanoparticles.
Table 1. Level of concentrations (in mg) and ratio of ionic liquid (IL) and polyamide dye.
Name of Sample Ionic Liquid
(in mg)
Polyamide
(in mg)
Ratio: IL/Polyamide
(in %)
Sample A 500 mg 500 mg 100
Sample B 600 mg 700 mg 86
Sample C 500 mg 600 mg 83

2.6. Fabrication of Dye Capped ZnO DSSCs

For the fabrication of ionic liquid and polyamide dye capped ZnO DSSC, we have prepared three different samples: (sample A, sample B, and sample C) respectively. The three samples of dye (different proportions) were separately pasted on three cleaned and dried ITO conductive glass sheets, which acted as photo-anodes of the cells. The samples A, B and C were prepared into a liquid form and further processed for the fabrication of ZnO DSSCs. The ITO conductive glass sheets pasted by samples A, B, and C (ionic liquid and polyamide capped ZnO nanoparticles) were air dried at room temperature (25 °C). The surface area of the thin ITO glass sheet was selected as 1 cm × 1 cm (collective surface area = 1cm2). The fabrication process of ZnO DSSC was same as already reported in our previously published research papers [26,34,36]. When polyamide dye capped ZnO nanoparticles layer was pasted on the conductive surface of ITO glass, a counter electrode in the form of carbon dust was flamed with a candle on another conductive surface of ITO glass. The conductive side of the carbon dust capped counter electrode was placed on top of the anode sheet of the cell. A liquid electrolyte (ionic liquid) based solution was placed from one of the top conductive sides of ITO glass. This liquid electrolyte was put into the space between the two conductive electrodes with the help of capillary action. Therefore, two sturdy black binder clips were used to hold the electrodes together in the form of DSSC. The fabrication of ionic liquids and polyamide capped ZnO photo-anode is shown in Figure 3.
The overall power conversion efficiency of the ZnO DSSC was calculated by significant electrical parameters such as short circuit current density (Jsc), open circuit voltage (Voc), incident light intensity (Pin), and fill factor (FF). The incident photon to current conversion efficiency (IPCE) of ionic liquid based ZnO DSSC mainly depends upon these four parameters by the following equation [19,20,21]. For measuring photovoltaic parameters i.e., current and voltage curves, a digital multi-meter (Ultra fine multi-meter Omega DMM 101) was connected to the DSSC electrodes with a variable resistance in the presence of light irradiations. The illumination sources selected were Xenon light source and high intensity torch light source. The intensity of the light source was 100 mW/cm2. This is equivalent to one sun or AM (air mass) 1.5 of photon power that is delivered to the surface area of a dye sensitized solar cell. The ZnO DSSC’s photon to current conversion efficiency or power conversion efficiency ( η ) depends upon the four main parameters as described in the following equation.
( η ) D S S C = J s c × V o c × F F P i n
Here, the fill factor (FF) is the ratio of maximum power to the measured short circuit current density (Jsc) and open circuit voltage (Voc) values. So, the fill factor (FF) is given by.
F F = M a x i m u m   P o w e r   ( P m a x ) V o c × J s c
For measuring maximum power (Pmax), first open circuit voltage is measured when the current value in the dye sensitized solar cell is almost zero. Similarly, short circuit current density is measured after inserting variable resistance R in shunt with the dye sensitized solar cell circuit. Hence the maximum power (Pmax) delivered with dye sensitized solar cells is given as.
Pmax = Vmax × Jmax
The incident photon to current conversion efficiency (IPCE) is the very important factor of the DSSC, which measures the total percentage of the absorbed light or photon getting converted into electrical current. IPCE may be defined as:
I P C E = 1240 [ J s c m A c m 2 ] λ ( n m ) × P i n ( m W c m 2 )
The overall performance of dye sensitized solar cells is basically dependent on the characteristics of the factors expressed above. For obtaining better results from dye sensitized solar cells, a lot of research work were carried throughout the world to examine the various cell components/materials preparation methods, the effect of processing factor on these materials, stability of ionic liquid and polyamide dye, performance of ionic liquid electrolyte, and conditions of conductive electrodes.

3. Results and Discussions

In this section, we have discussed the structural/morphological and optoelectronic properties of ionic liquid and polyamide dye based ZnO samples A, B and C respectively using XRD, FESEM, DLS, UV-Visible, and fluorescence spectroscopy techniques.

3.1. Materials Development

The crystal structure of the ionic liquid and polyamide dye capped ZnO nanoparticles was analyzed by XRD using Rigaku Mini flex III diffractometer operated at 30 kV and 10 mA using CuKα X- ray radiations with a scan speed of 10/min for 2θ in a range of 10 to 75. The average crystallite size was estimated with the Debye- Scherrer’s equation using XRD analysis data. A Fourier transformation infrared (FTIR) spectrum was recorded on a PerkinElmer spectrophotometer (Model-Veriton S8620G) in the range 400–4000 cm–1. The nanoparticle size of ionic liquid and polyamide dye capped ZnO nanoparticles was analyzed with Dynamic Light Scattering (DLS) using a Metrohm Microtrac Ultra Nanotrac particle size analyser instrument. For analyzing 10μM concentration of solution was used and the presented results are the average of 20 scans 240 pixels were recorded with a Camtasia recorder at 12 frames/s.

3.2. Characterizations of Samples A, B and C (DLS, XRD and FTIR)

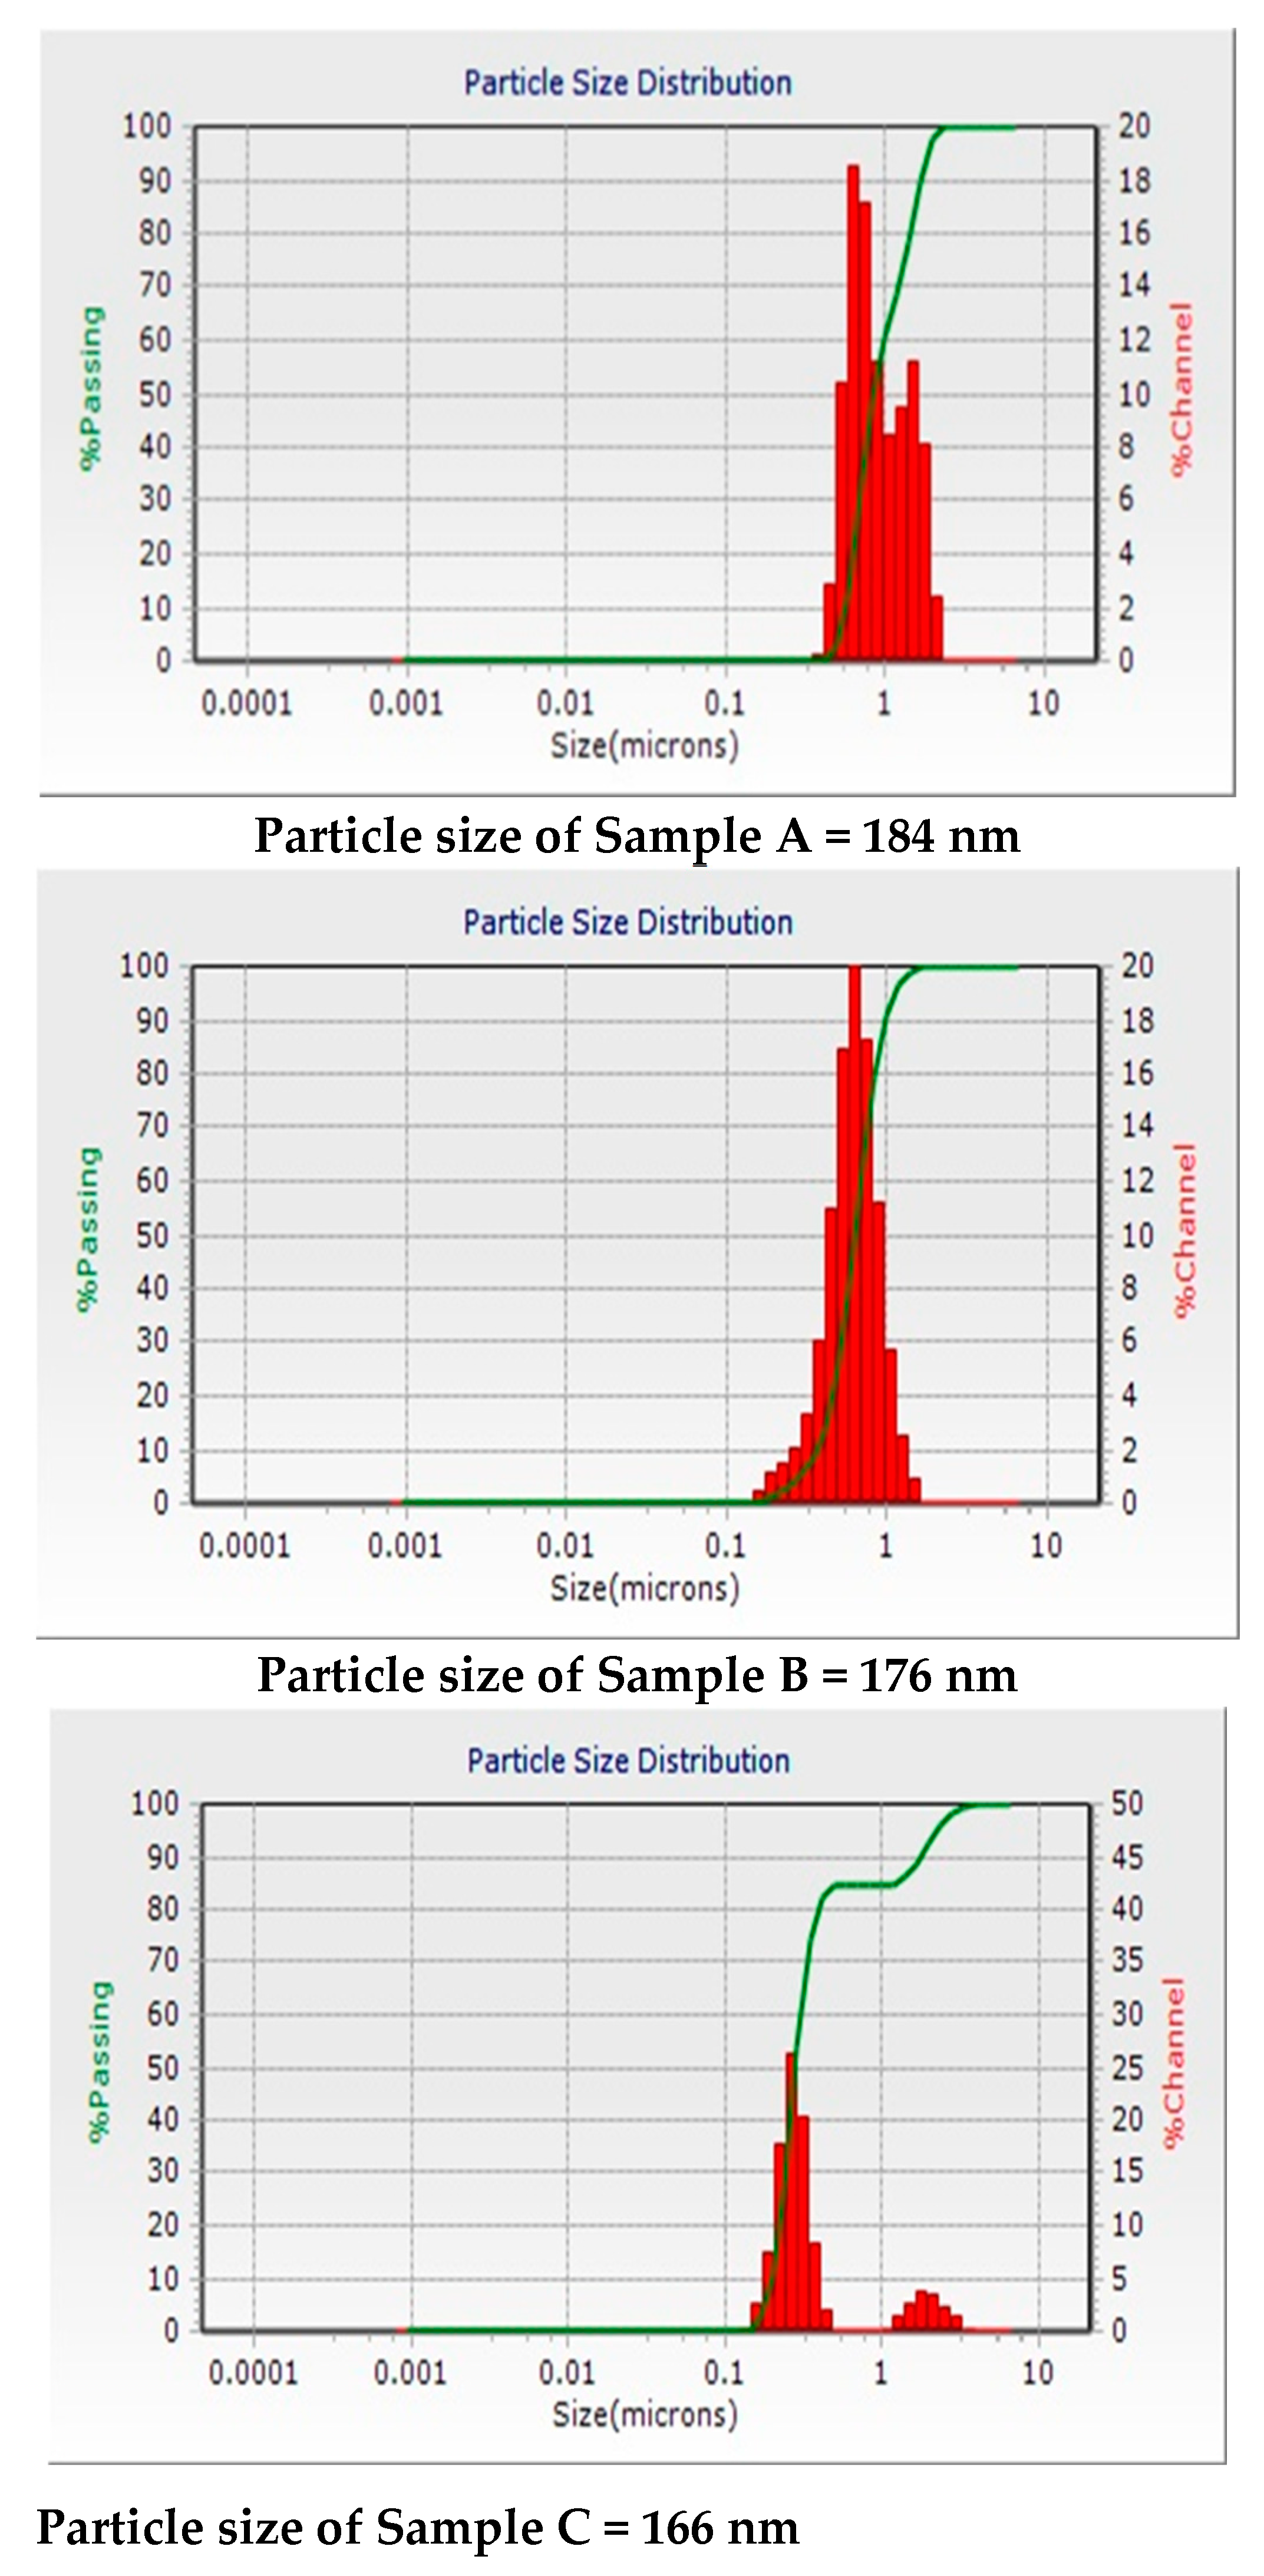
The distribution of particle size of ionic liquid based sample A showed an average particle size in the range of 184 nm, as measured with DLS based particle size analyzer (Figure 4a) by dissolving the compound in DMSO: H2O (70:30; v/v). The particle size of sample B was also measured using a DLS, particle size analyzer, which showed size 176 nm (Figure 4b). The particle size of sample C capped ZnO nanoparticles was also measured using a DLS, particle size analysis which showed size 166 nm (Figure 4c). DLS spectra have shown somewhat larger particle size as compared to FESEM analysis due to the hydro-dynamic radius of nanoaggregates during DLS analysis.
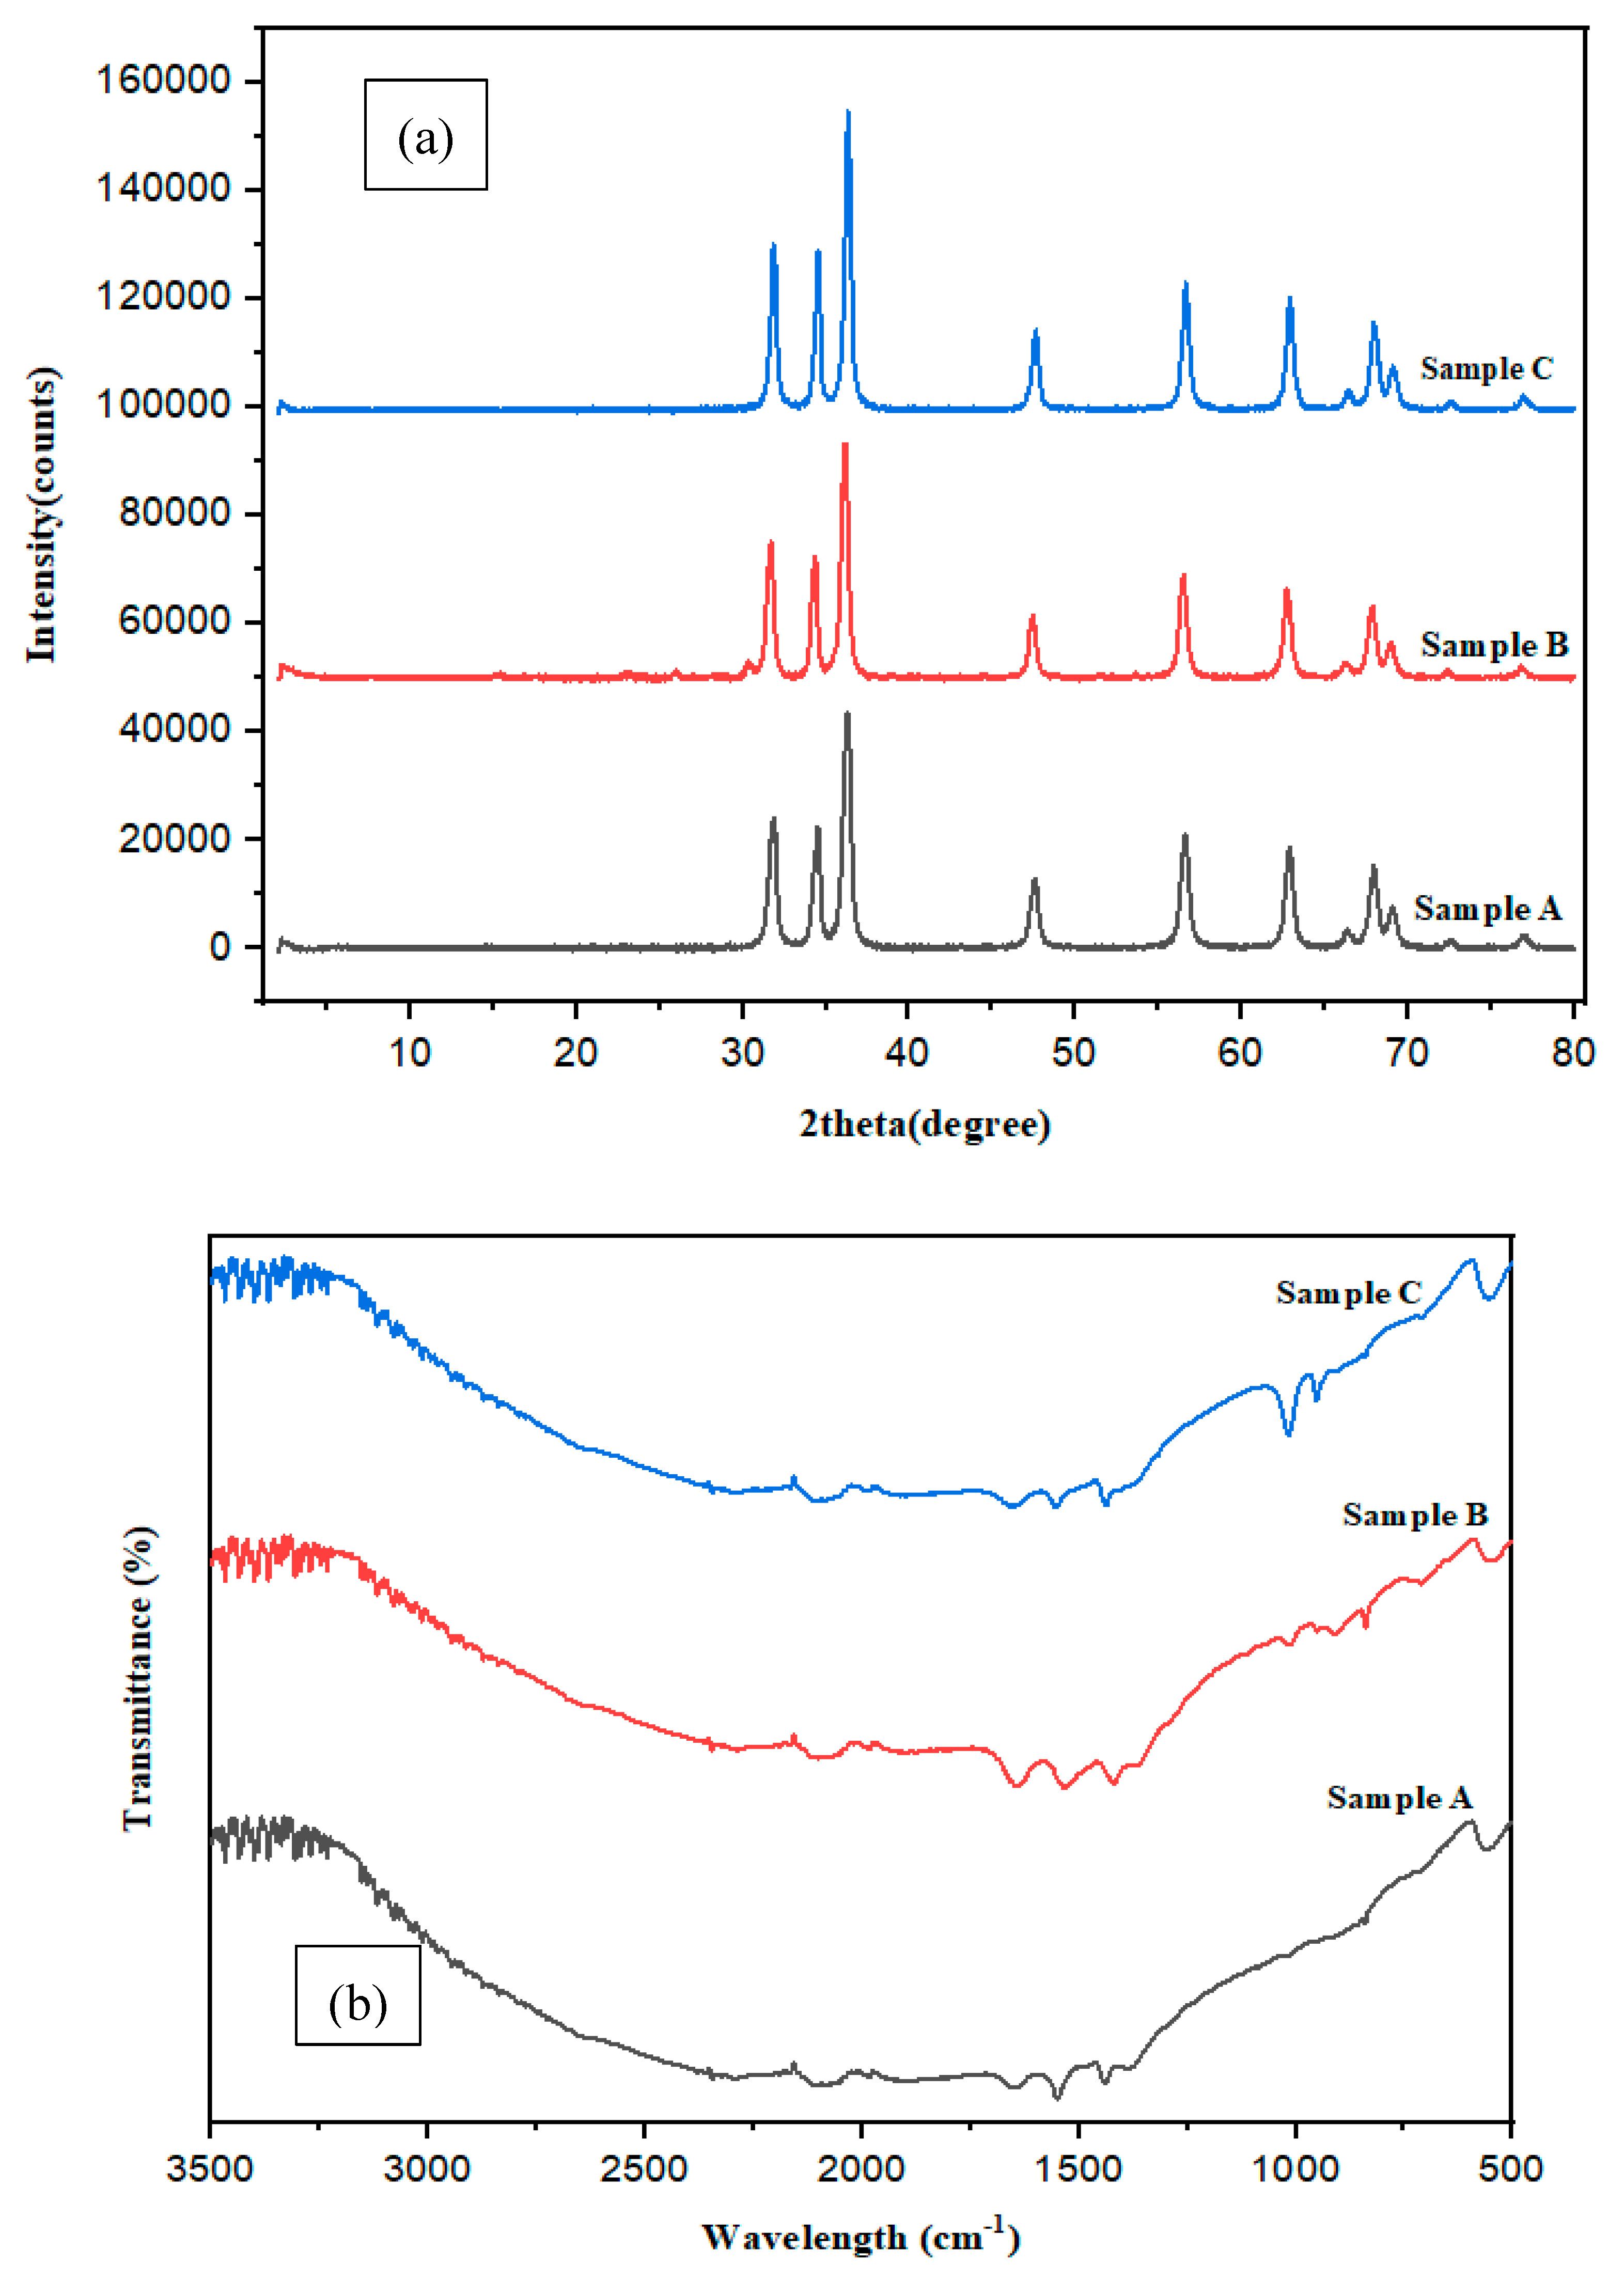
The crystalline size of the synthesized ionic liquid and polyamide dye capped ZnO nanoparticles was characterized by using XRD techniques. XRD analysis of the prepared samples A, B, and C was done by a Rigaku Mini flex III diffractometer operated at 30 kV and 10 mA using CuKα X- ray radiations with a scan speed of 10/min for 2θ in a range of 10 to 75. The indexing process of the powder diffraction pattern of ZnO was done by Miller Indices (h k l) and each peak was assigned in the first step. The X-ray diffractogram of the entire data has been shown in Figure 5a. The average particle size of the ionic liquid and polyamide dye capped ZnO has been evaluated by using the Debye-Scherrer formula D = 0.9λ/βcosθ, where ‘λ’ is the wavelength of X-ray (0.1541 nm), ‘β’ is the FWHM (full width half maximum), ‘θ’ is the diffraction angle, and ‘D’ is the particle diameter size [22,23,24]. For samples A, B and C, the XRD spectrum (Figure 5a) shows the presence of broad peaks of sample A at 2θ = 31.786, 34.447, 36.262, 47.533, 56.593, 62.866, 67.954 degrees, sample B at 2θ = 31.638, 34.297, 36.124, 47.416, 56.478, 62.752, 67.848, 76.844 degrees and sample C at 2θ = 32.589, 23.817, 37.983, 60.806, 72.092 degrees respectively. While comparing to the JCPDS card (36-1451) [19,20,21], the average size of dye capped ZnO nanoparticles (sample A) was found to be in the range of 184.2 nm (Figure 5a) showing that with surface capping, the XRD pattern peak of polyamide dye capped ZnO nanoparticles appeared to be widened. The average size of sample B was found to be in the range of 176.3 nm and for the sample C, its range was 160.5 nm.
It was confirmed from the graph that the main peaks were in agreement with the wurtzite structure of ZnO, which indicated that the surface capping of ZnO nanoparticles (i.e., ionic liquid electrolyte and polyamide dye capped ZnO nanoparticles (sample A, B, and C)) has no effect on the crystalline nature of ZnO nanoparticles. The surface variation removes the combined surfactants present on the ZnO. Hence, we used ionic liquid (IL) and polyamide as an effective functional group for surface capping of ZnO nanoparticles.
Table 2. XRD calculations for dye capped ZnO nanoparticles.
Polyamide dye capped ZnO Samples Peak position (in degrees) Reflection
(h k l)
d-spacing
(in nm)
Size of particle D
(in nm)
Sample A 36.26° 101 2.47 184.2
Sample B 36.12° 101 2.48 176.3
Sample C 24.60° 002 3.61 160.5
FTIR spectroscopy is an analytical technique used to identify the nature of materials such as organic, polymeric, and in some cases, inorganic materials. The FTIR spectroscopy method uses infrared light to scan test samples and detect their chemical properties. The FTIR absorption spectrum was recorded around 1000-4000 cm-1 suggesting the incoming and outgoing impurities. To be more particular, a large absorption band around 2500 cm-1 corresponds to the COOH stretching approach of the carboxyl group. The presence of the absorption peaks around 3000 and 3500 cm-1 is due to the COOH stretching vibration mode of the different alkyl groups. The presence of the peaks between 1800 and 1400 cm-1 is due to the balanced and unbalanced stretching mode of the zinc carboxylate group, respectively. It is obvious that as the size of the ZnO nanoparticles starts to increase, the quantity of the impurities, such as carboxyl group in the samples, will also decrease correspondingly. The FTIR is used to convey the information about the presence of incoming and outgoing impurities that may exist near to the surface of ionic liquid and polyamide dye capped ZnO nanoparticles.
Figure 5b clearly shows the FTIR spectra of ionic liquid and polyamide dye capped ZnO nanoparticles at different samples, such as samples A, B, C respectively. Annealing of the ionic liquid capped ZnO nanoparticle samples radically decreases in all samples of ZnO nanoparticles. At longer annealing time, the spectral signatures of carboxyl group essentially start to disappear, signifying the probable dissociation of zinc and its resulting in the formation of ZnO nanoparticles.

3.3. Morphological Studies (FE-SEM)

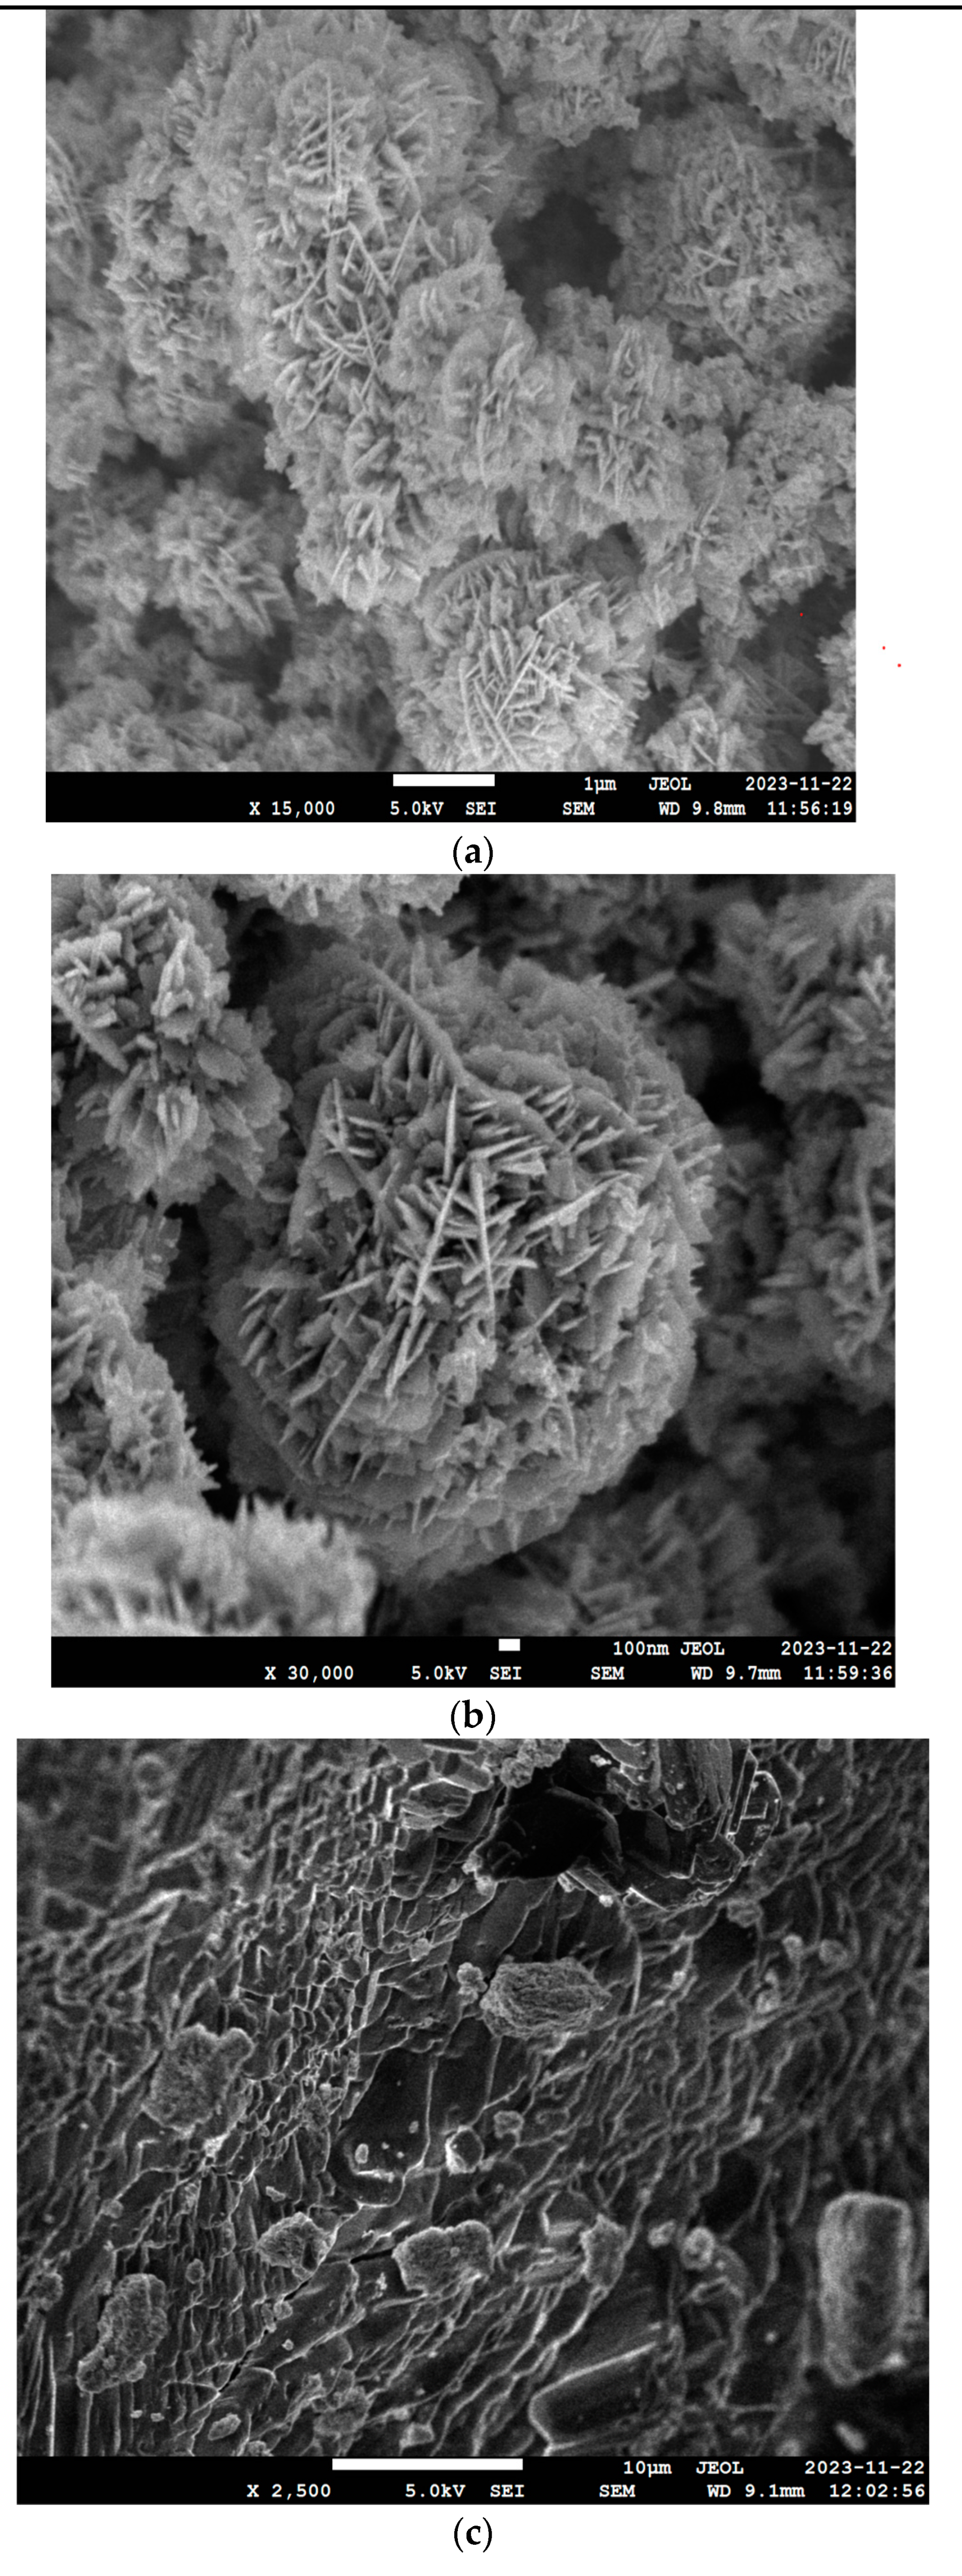
The morphology and size divisions of ionic liquid and polyamide dye capped ZnO nanoparticles (samples A, B, and C) were investigated by scanning electron microscopy technique with the SEM model JEOL Model-JSM-7610F plus at 10 kV. The SEM images of samples A, B, and C seem to be standardized as shows in Figure 6a–c. The SEM micrograph shown that the dye capped ZnO nanoparticles i.e. sample A, B, and C are in the nano region (nano flowers like structures).
The observed length of the dye capped ZnO nanoparticles (sample A) was in the range of 187nm approximately. The width of the modified ZnO nanoparticle is 9.8 nm as appears in the high magnification FESEM image shown in Figure 6a. The Figure 6 (b) and (c) show the FESEM results of the dye capped ZnO nanoparticles (sample B and C). The size and morphology of ZnO nanoparticles were observed at different resolutions. The FESEM image shows the modified ZnO nanoparticles from supramolecular self-assembled structures due to the structure directed nature of the compound. The material shows almost no particle group and very standardized particle size distribution in the nanoparticle of sample B with a range of about 180 nm and width is 9.7 nm. The size and morphology of ionic liquid based sample C ranges around 170 nm and the width is approximately 9.1 nm.
Table 3. Summary of FESEM calculations for dye capped ZnO nanoparticles (sample A, B, and C).
Name of ZnO Sample Width of ZnO Nanoparticle
Sample A 9.8 nm
Sample B 9.7 nm
Sample C 9.1 nm
Table 4 shown the comparison of the size of dye capped ZnO nanoparticles examined under different techniques: XRD, FE-SEM, and DLS for samples A, B and C. The table readings shown the similarities among the
Table 4. Summary of XRD, FE-SEM, DLS calculations for polyamide dye capped ZnO nanoparticles (samples A, B, and C).
Sample Name XRD
(size of ZnO nanoparticles)
FE-SEM
(size of ZnO nanoparticles)
DLS
(size of ZnO nanoparticles)
Sample A 184.2 nm 187 nm 184 nm
Sample B 176.3 nm 180 nm 176 nm
Sample C 160.5 nm 170 nm 166 nm
Table 5. Summary of UV-Visible spectra calculations for dyes capped ZnO nanoparticles. (for samples A, B, and C).
Name of Sample ZnO(in mg) Ionic Liquid(in mg) Polyamide(in mg) UV-Visible spectraPeak 1 & Peak 2
Sample A 500 mg 700 mg 500 mg 263 nm, 295 nm
Sample B 500 mg 600 mg 700 mg 278 nm, 344 nm
Sample C 500 mg 500 mg 600 mg 276 nm, 305 nm
Table 6. Summary of energy band gap (Eg) values of dye capped ZnO nanoparticles. (for samples A, B and C based ZnO nanoparticles).
Ionic liquid based ZnO samples Wavelength(λ)( in nm) Absorbance(α) (αhν)2 Energy band gap(Eg)(in eV)
Sample A 263.8 0.746 3.50 4.70
Sample B 278.8 3.185 14.16 4.44
Sample C 276.6 0.136 0.61 4.48

3.4. Optoelectronic Properties of Samples A, B and C Based ZnO Nanoparticles

This section described the optoelectronic properties of synthesized ionic liquid and polyamide dye capped ZnO nanoparticles (Samples A, B, and C) using UV-Visible and Fluorescence spectroscopies.

UV-Visible Spectra Studies

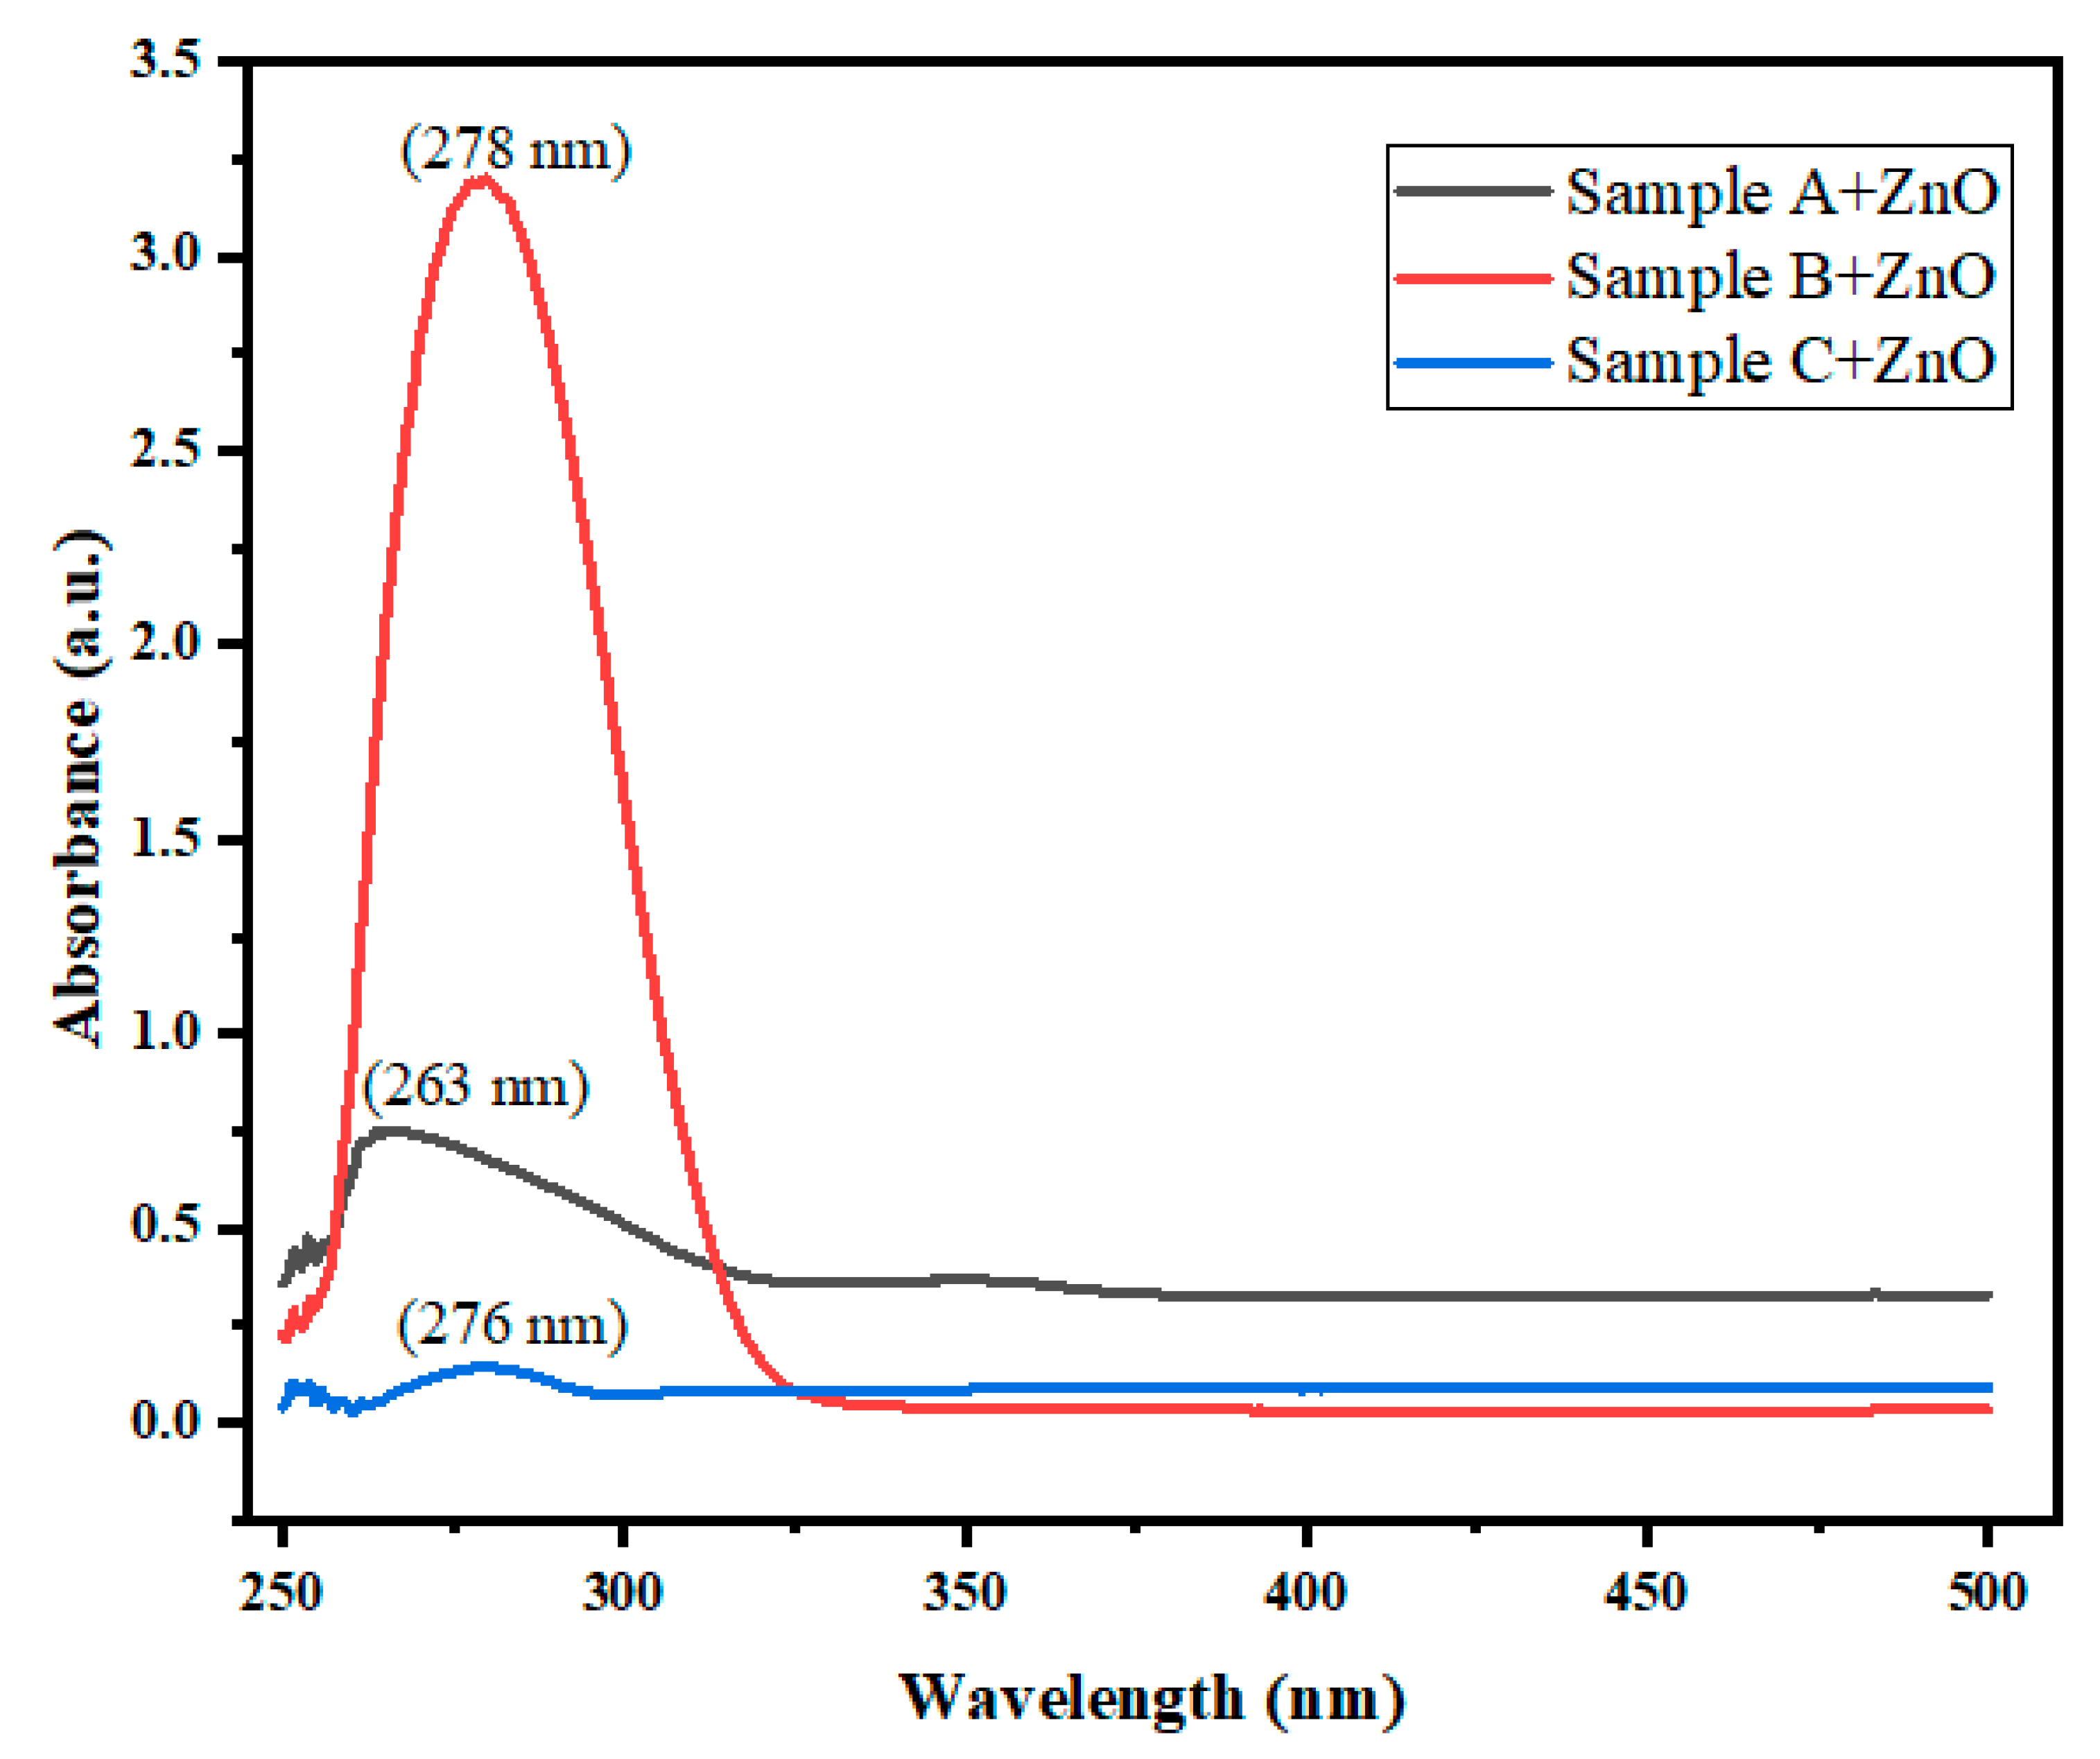
The optoelectronic properties of polyamide dye capped ZnO nanoparticles become more and more imperative at the nanoscale level. Figure 7 shown the essential comparison of dye capped ZnO nanoparticles (samples A, B and C) for UV-Visible absorption spectra study. The absorption spectra of dye capped ZnO nanoparticles were observed (samples A, B and C) at different absorption peaks at 263 nm, 278 nm and 276 nm. The sample A + ZnO at the range 263 nm can be attributed to the presence of dye capping agent triethylamine (TEA) with bromoacetic acid (BAA) (Ionic liquid) and trimesoyl chloride (TMC) with ethylenediamine (ETD) (polyamide). Similarly, the absorption spectra of the sample B + ZnO was observed with different absorption peak at 278 nm and for the sample C + ZnO the absorption peak was observed around 276 nm. This corresponds to a charge transfer between dye molecules from donor to acceptor section and ZnO nanoparticles. The UV-Vis absorption bands were observed at peaks 263 nm, 278 nm, and 276 nm with their corresponding energy band gaps for sample A, B and C based ZnO nanoparticles. We calculated the energy band gap (Eg) of the dye capped ZnO nanoparticles, using Tauc plot equation is given by:
αhν = A(hν –Eg)1/2
Where α is the absorbance, h is the Planck’s constant, ν is the frequency and Eg is the energy band gap. The energy band gap observed in the current situation of surface modified ZnO nanoparticles was 4.70 eV for sample A + ZnO nanoparticle, 4.44 eV for sample B + ZnO nanoparticle and 4.48 eV for sample C + ZnO nanoparticle.

Fluorescence Spectra Studies

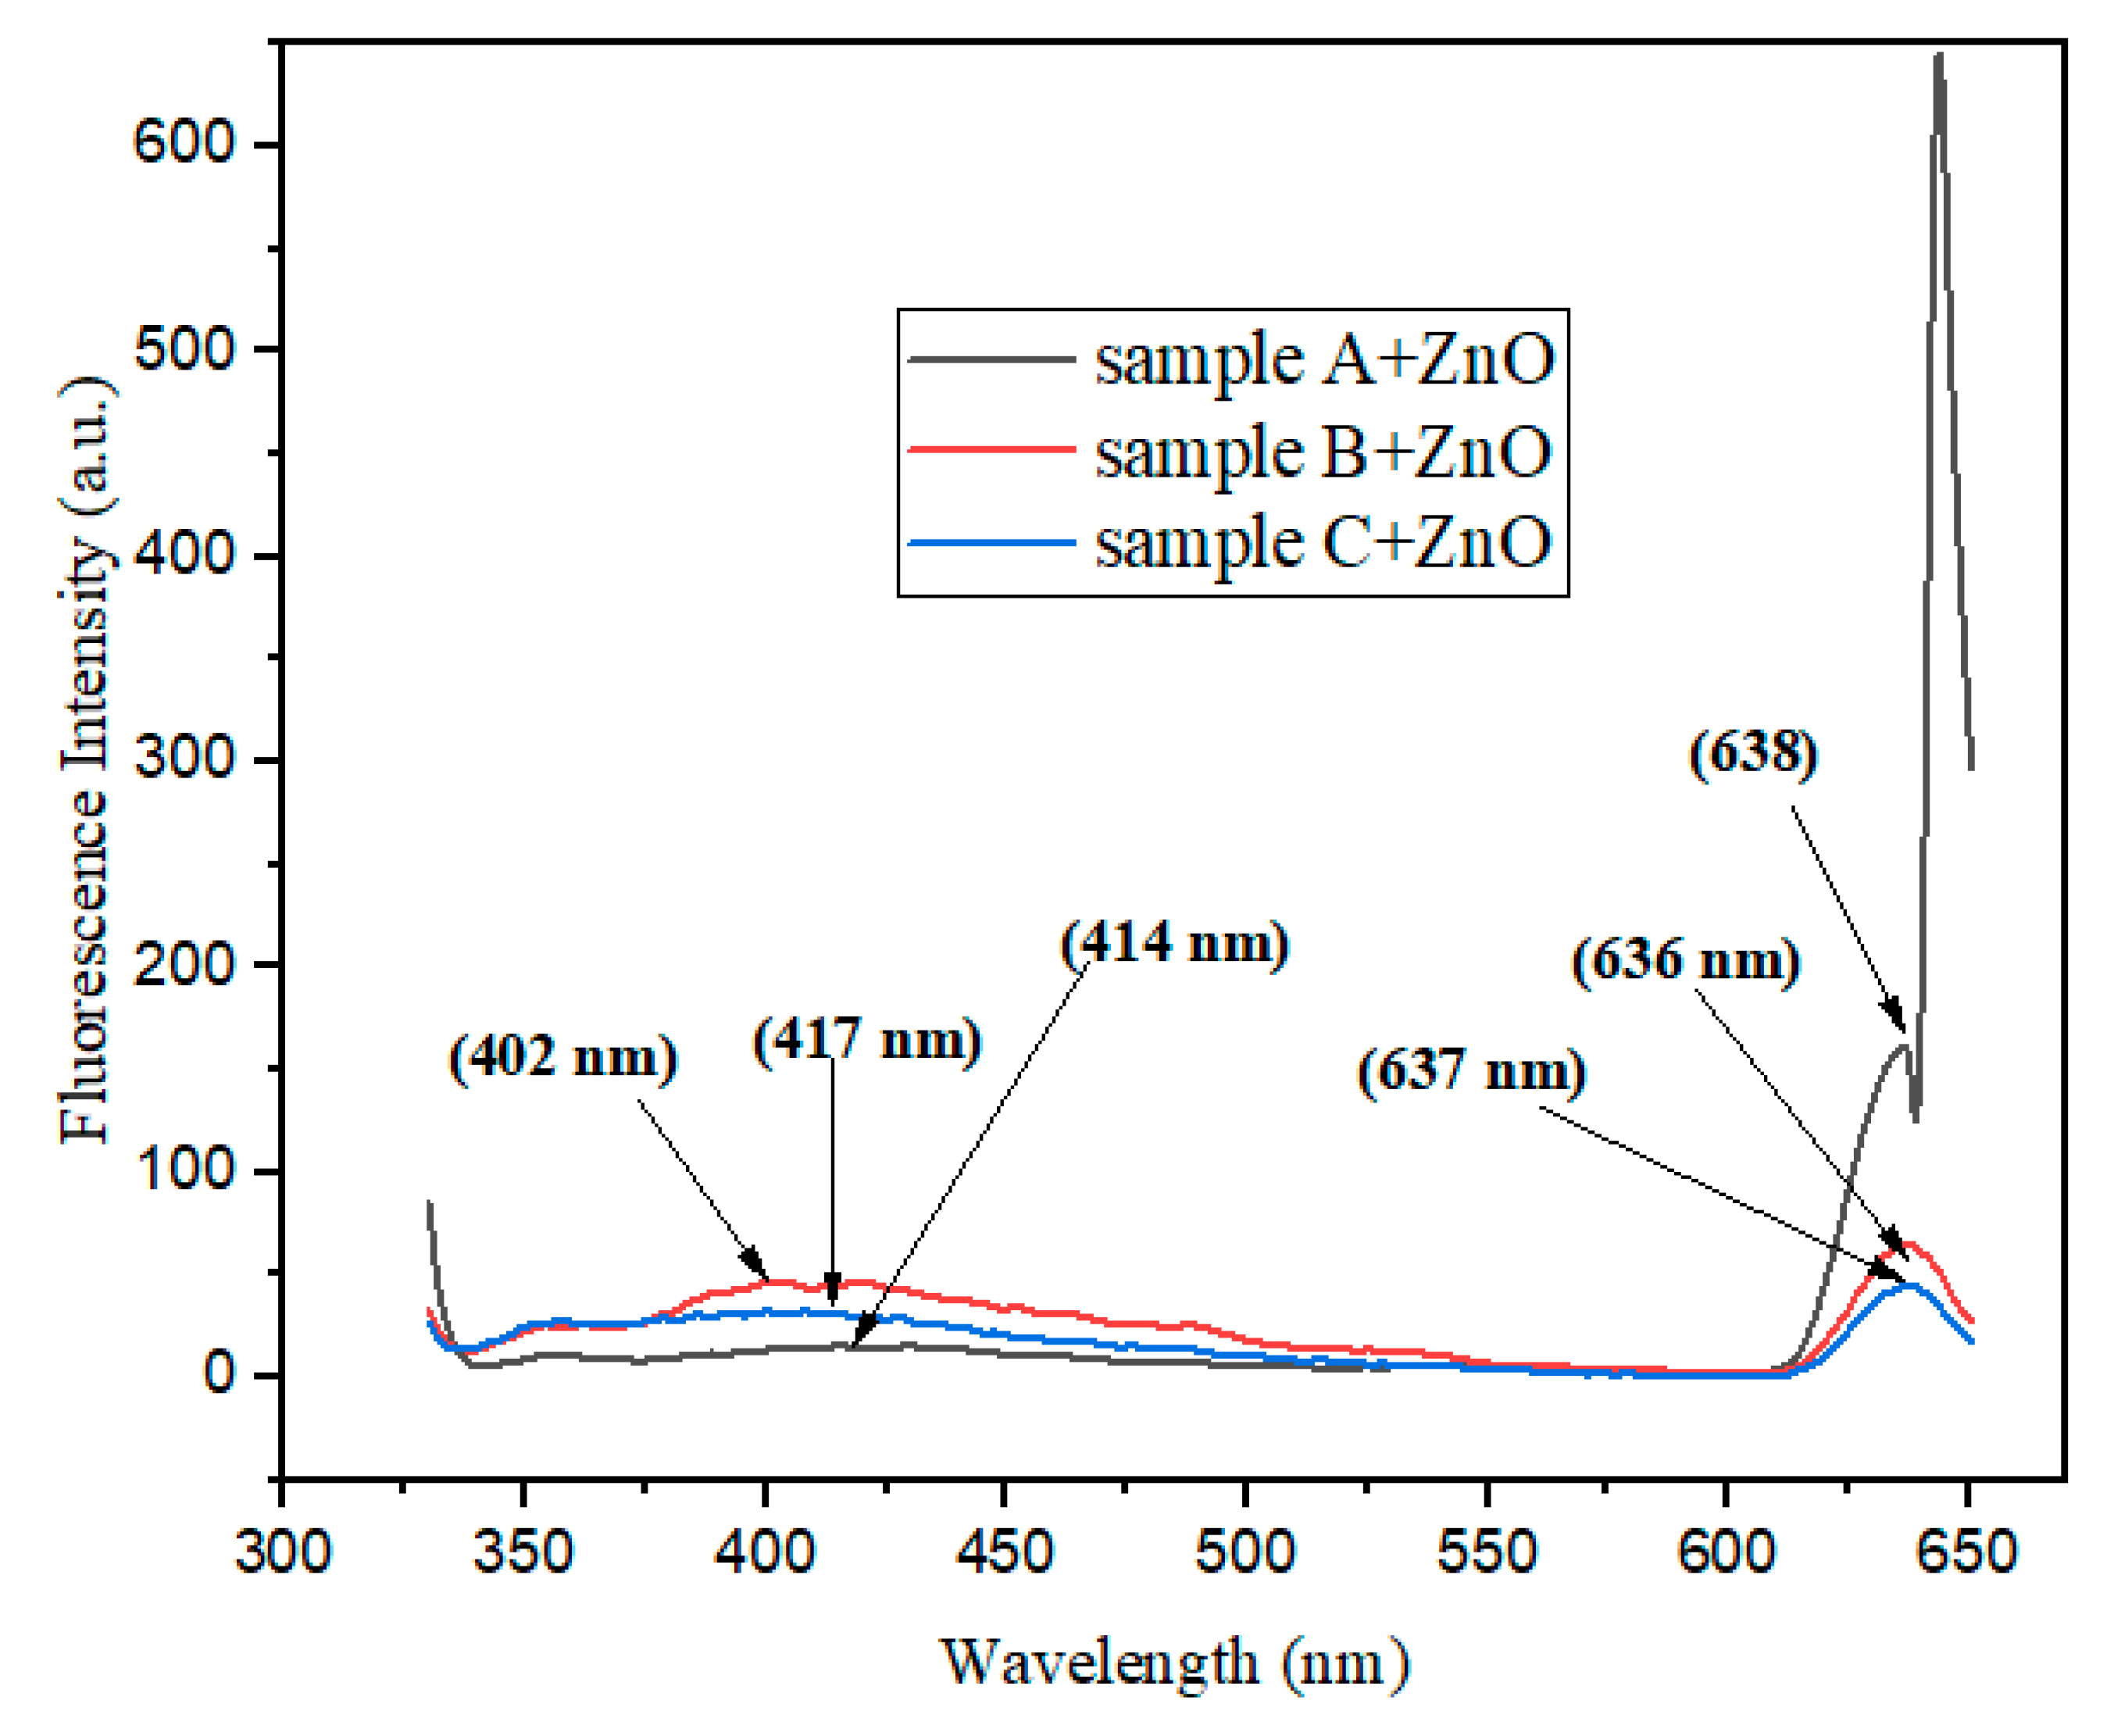
The fluorescence spectra have been obtained by exciting the samples A, B and C at 325 nm. The fluorescence spectra of three different samples A, B, and C, shows the near to strong ultraviolet region (narrow high peaks) accompanied by the medium and small broadened peaks at visible region. Figure 8 shows a maximum excitation peak at 330 nm for ionic liquid and polyamide dye capped ZnO nanoparticle. Similarly, the visible region of the photoluminescence spectra shows different peaks at 419 nm, 417 nm, 418 nm for samples A, B, and C respectively. An interesting observation in the fluorescence spectra was recorded in the IR emission region at 638 nm, 636 nm and 637 nm for samples A, B, and C. The blue, red and black emission for broadened spectra formed from some surface defects present in the ZnO nanocomposites as shown in Figure 8.

3.5. Photovoltaic Performances of ZnO DSSCs

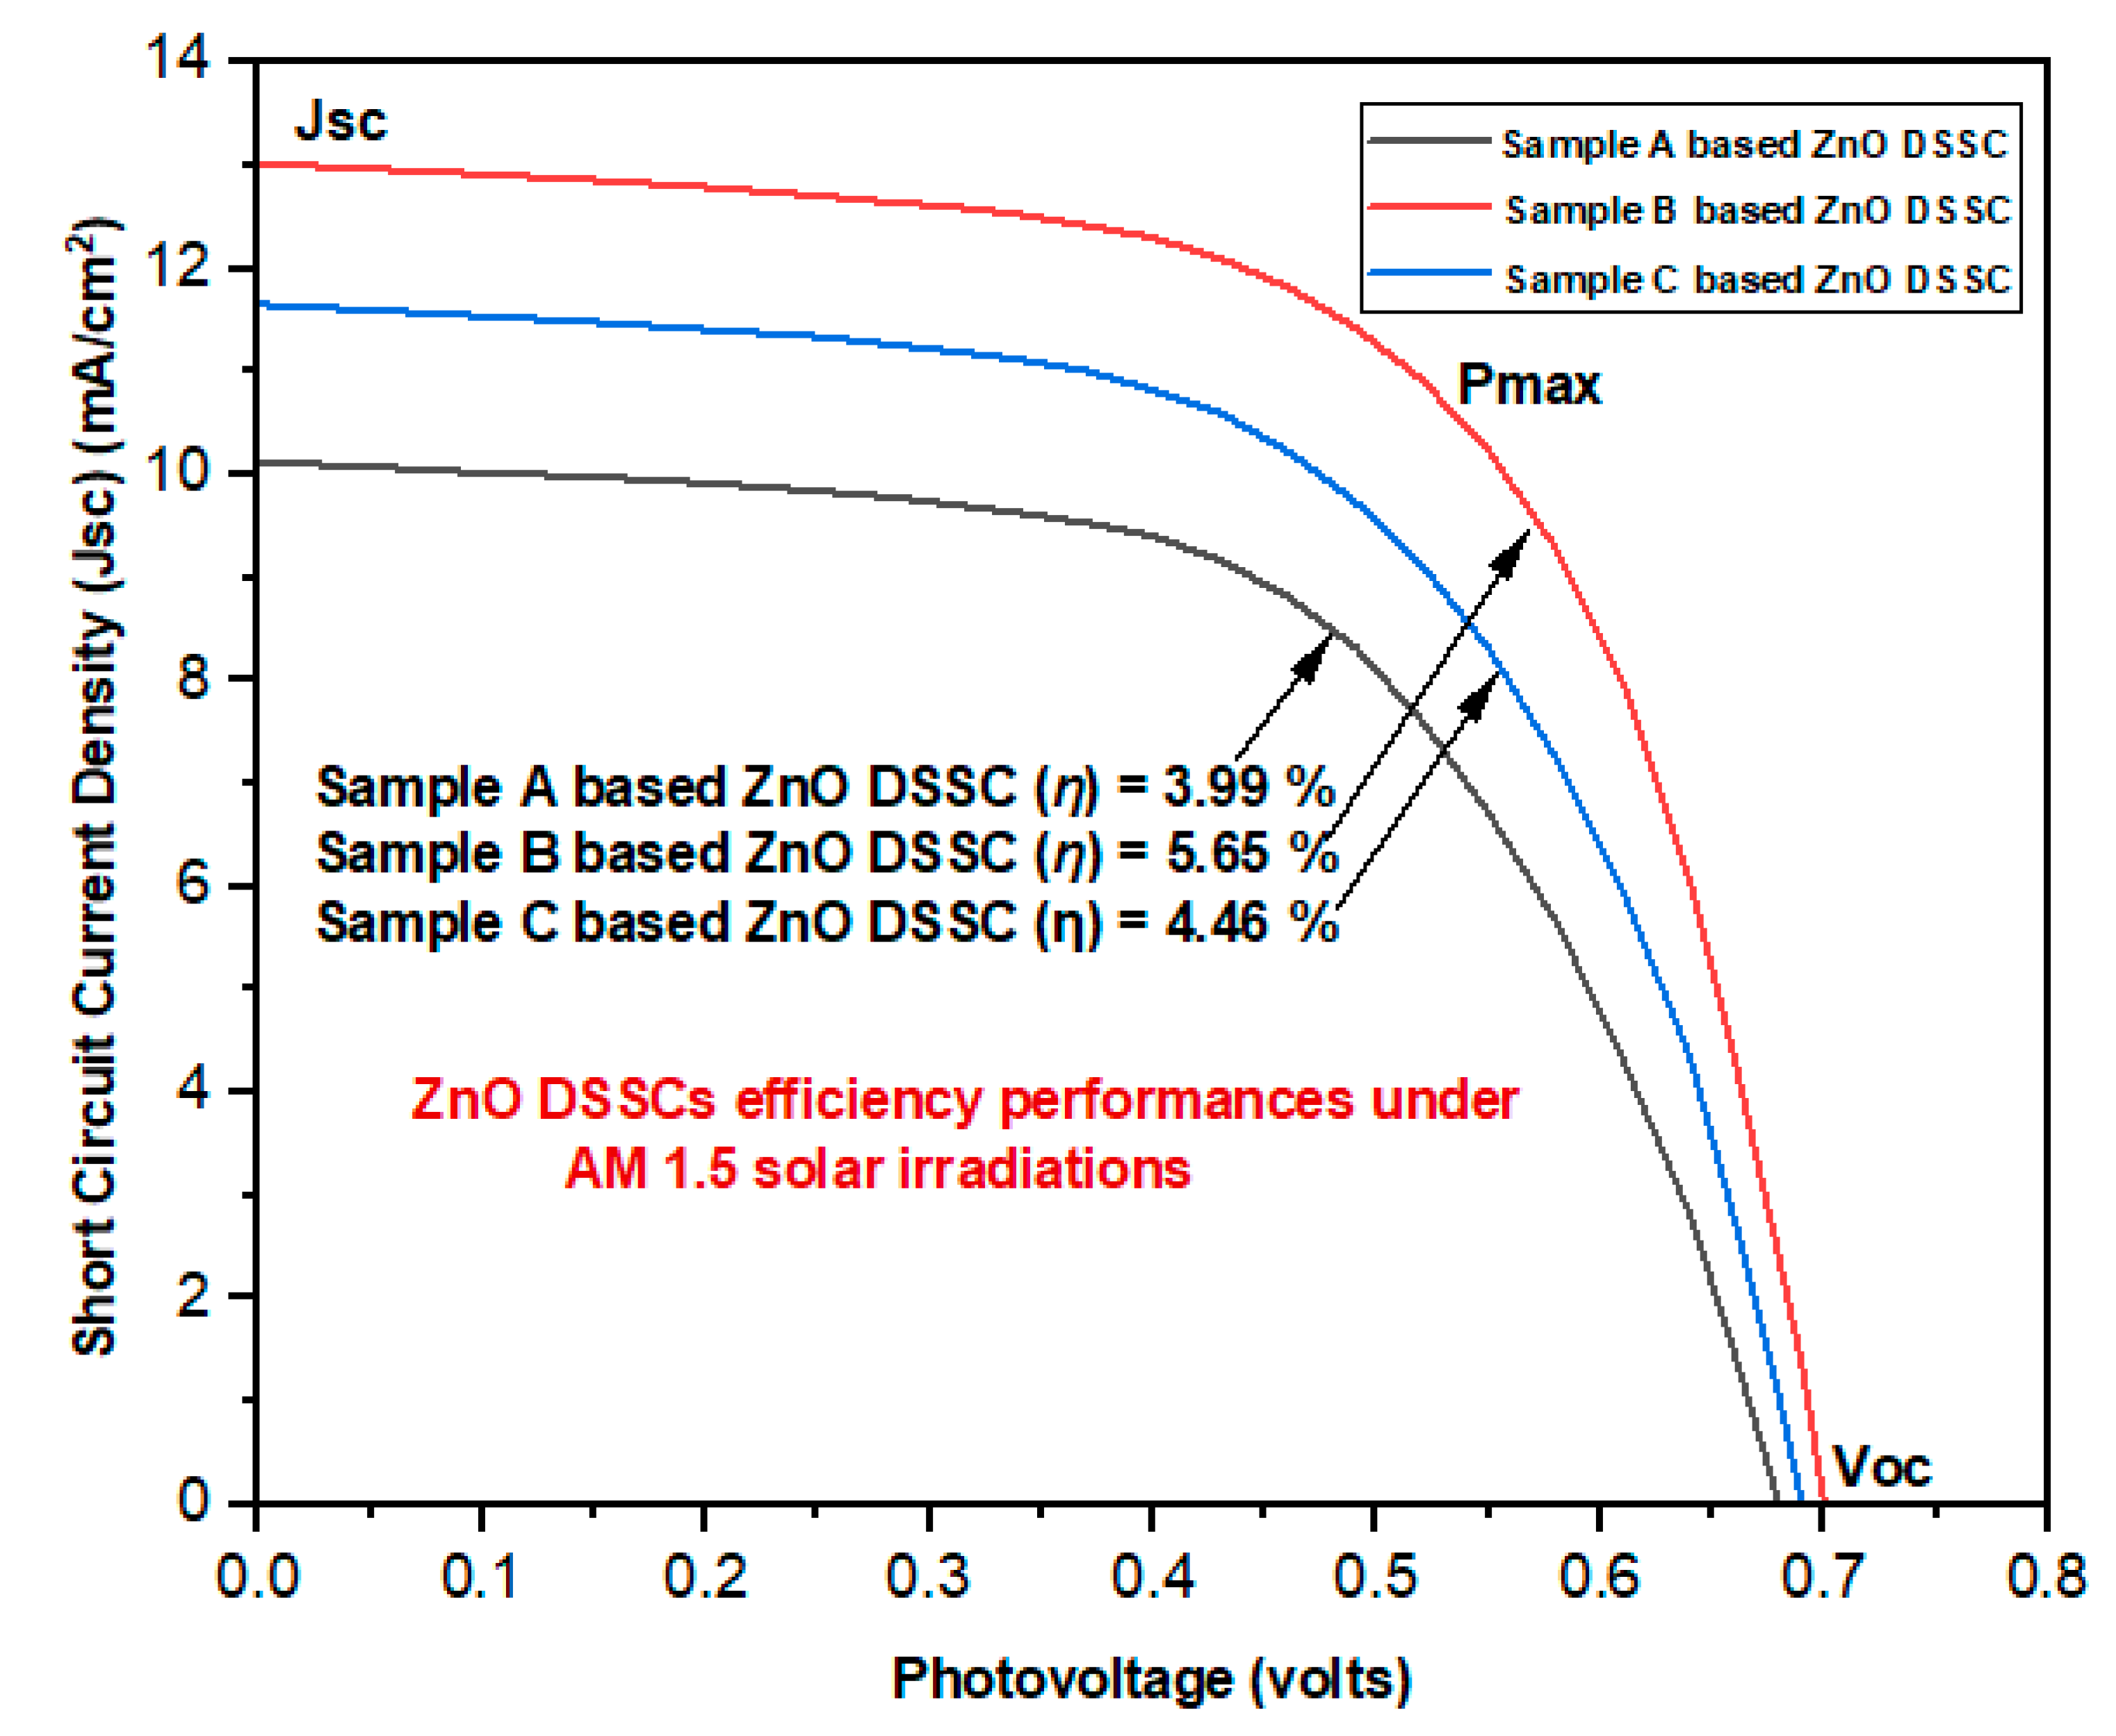
The current and voltage characteristics have been recorded for three different samples A, B, and C based ZnO DSSCs at an effective surface area of 1cm2 under simulated solar irradiations of 100 mW/cm2 as shown in Figure 9. The different electrical parameters for ZnO DSSC i.e., short circuit current density (Jsc), open circuit voltage (Voc), fill factor (FF), and incident photon to current conversion efficiency (η%) have been calculated and presented in Table 7.
Figure 9 shows that the current density and photo-voltage curves of the ZnO DSSCs under the influence of samples A, B, and C. The sample A based ZnO DSSC (SCA) shows the lowest values of short circuit current density (Jsc = 10.12 mA/cm2), open circuit voltage (Voc = 0.68 V), maximum value of current density (Jmax = 8.82 mA/cm2) and voltage (Vmax = 0.46 V).
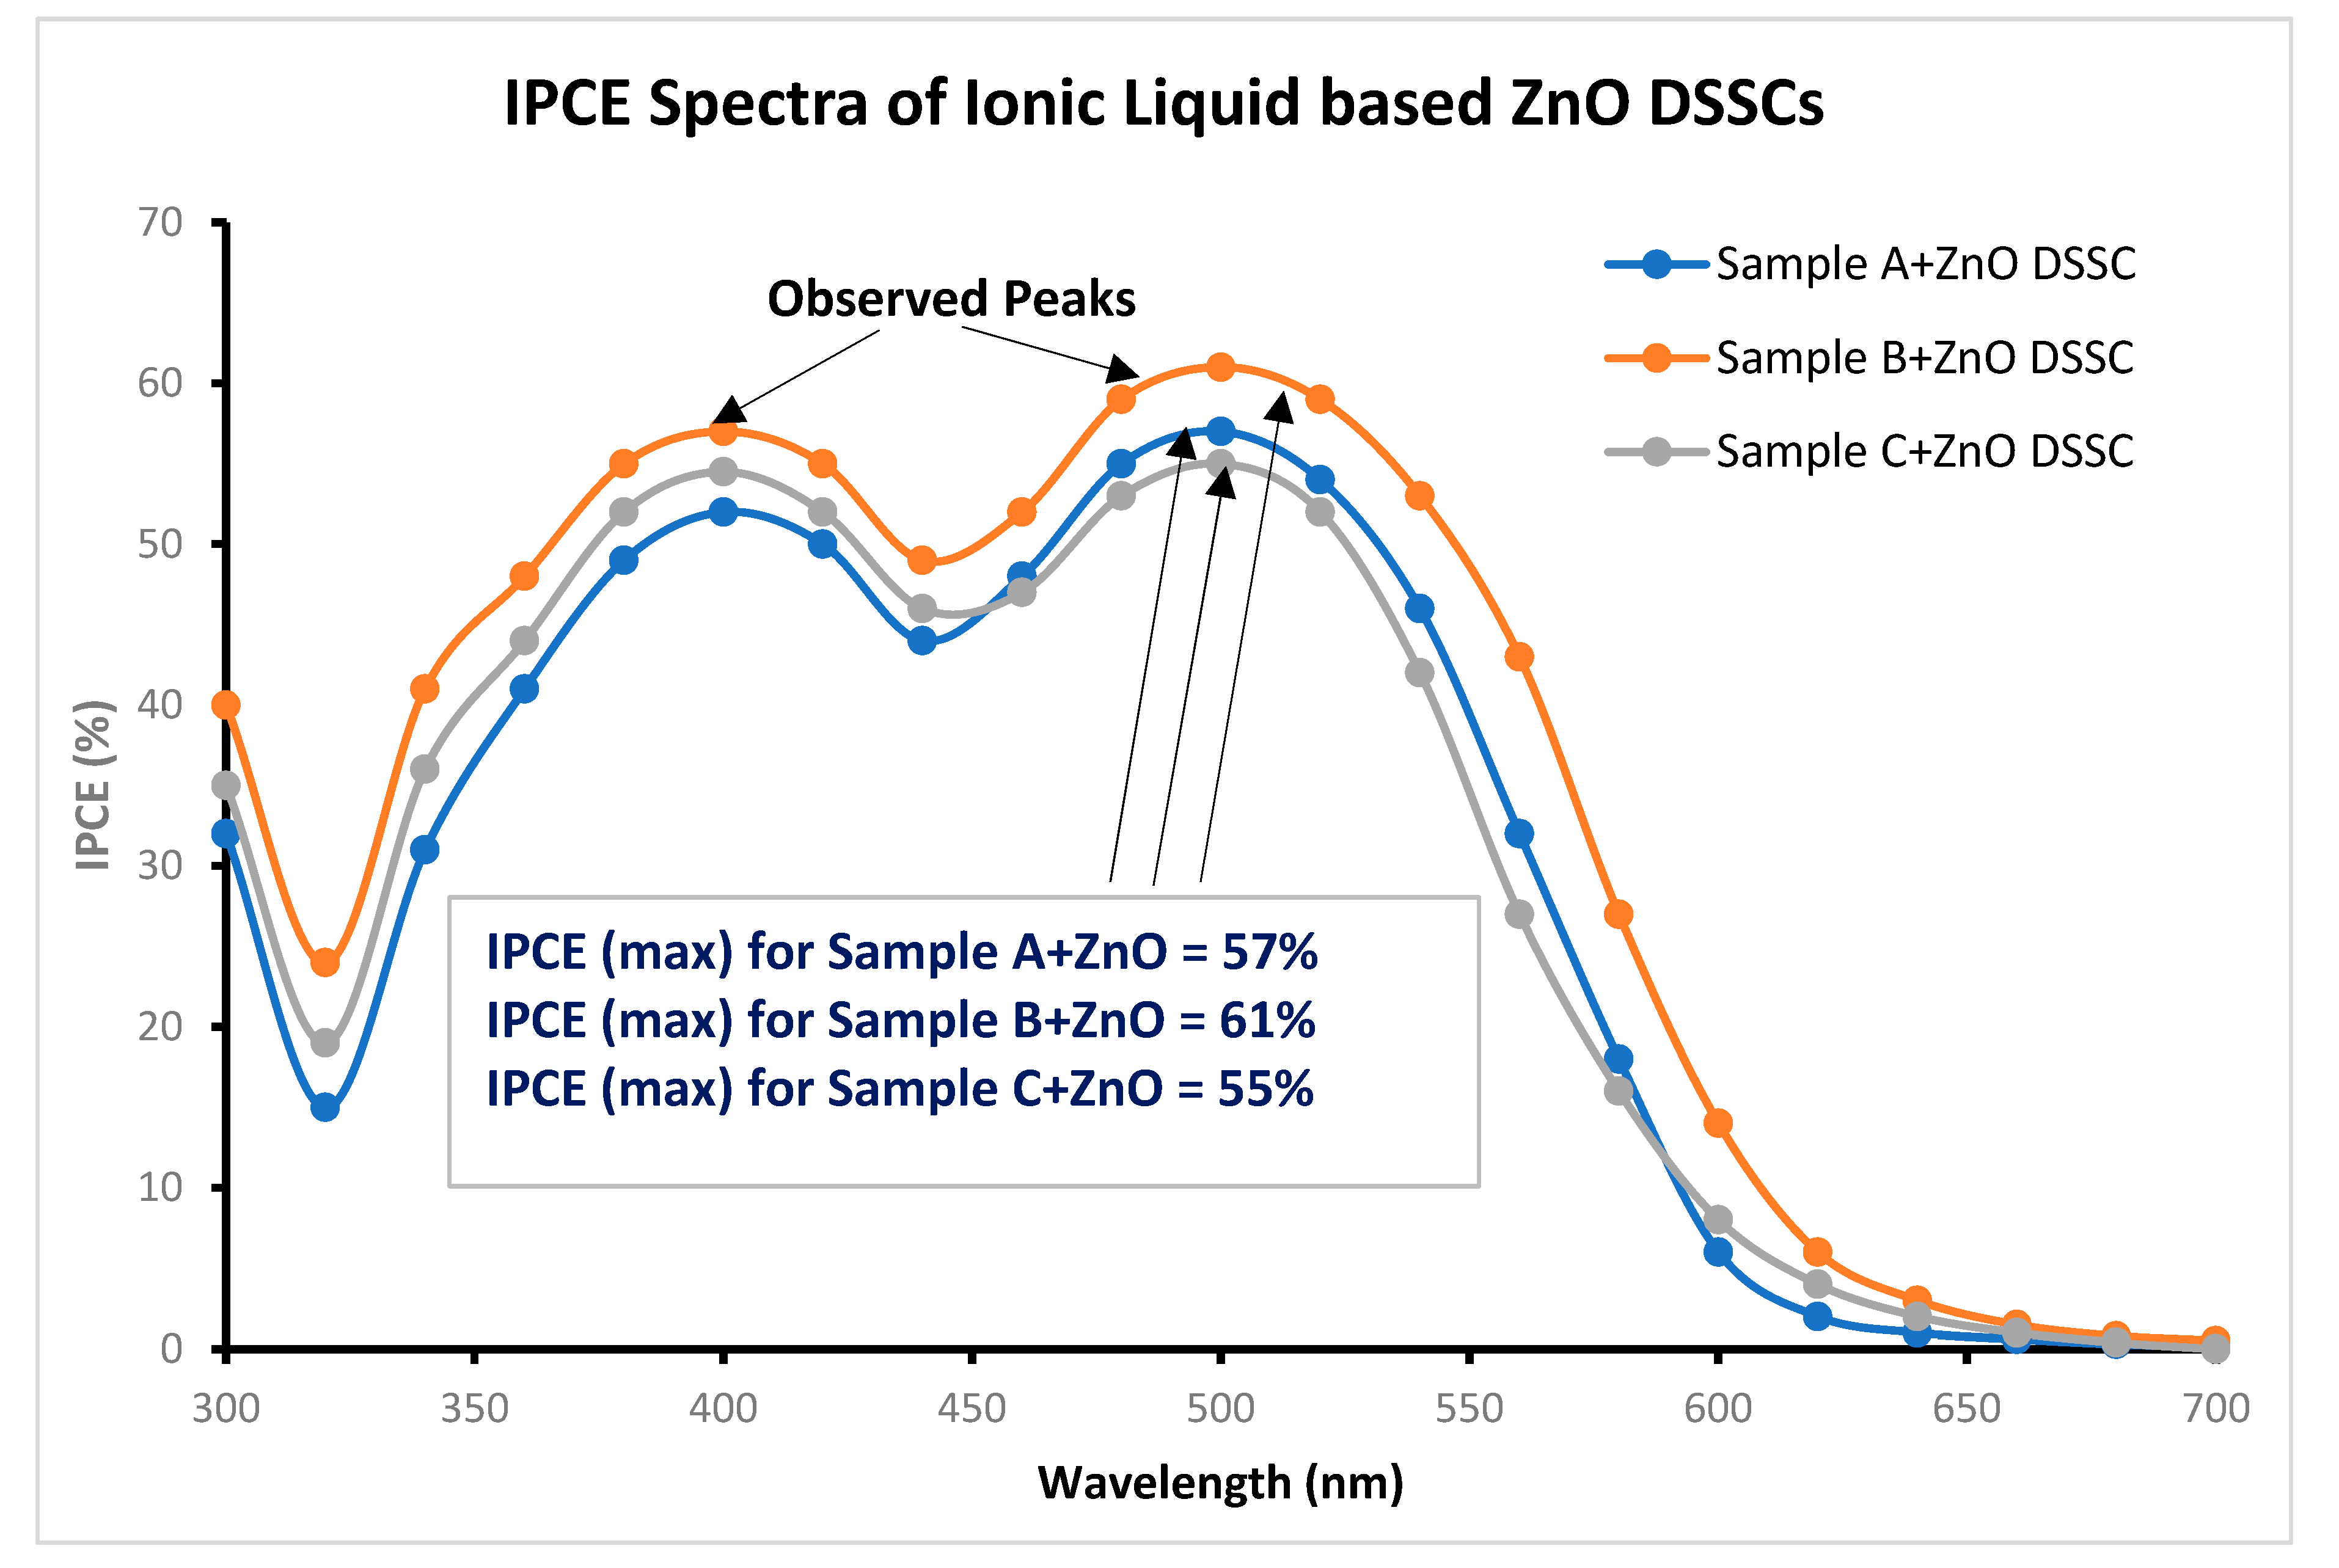
The calculated value of fill factor (FF) for sample A based ZnO DSSC is 0.58. We obtained the lowest value of incident photon to current conversion efficiency (η = 3.99%) for sample A based ZnO DSSC. When the dye molecules are capped on ZnO nanoparticles, the form combination among the nanoparticles absorbed the radiations in the whole of the visible region and near infrared region of the solar spectrum. In order to compare this photovoltaic performance with other ZnO DSSCs, the sample B based ZnO DSSC (SCB) shows the highest values of short circuit current density (Jsc = 13.02 mA/cm2) and open circuit voltage (Voc = 0.7 V). The corresponding values of its maximum current density (Jmax = 10.92 mA/cm2) and maximum voltage (Vmax = 0.52) were recorded. The calculated value of fill factor (FF) for sample B based ZnO DSSC is 0.62. For the sample B based ZnO DSSC, we obtained a significant enhanced value of incident photon to current conversion efficiency (η = 5.65 %). Similarly the sample C based ZnO DSSC (SCC) shows the lowest values of short circuit current density (Jsc = 11.65 mA/cm2) and open circuit voltage (Voc = 0.69 V). The maximum value of current density (Jmax = 9.74 mA/cm2) and voltage (Vmax = 0.49 V). For the sample C + ZnO DSSC, we obtained the values of incident photon to current conversion efficiency (η = 4.46 %). An important photo parameter of quantum efficiency or spectral response i.e., the incident to photon current conversion efficiency (IPCE) for samples A, B, and C based ZnO DSSCs had been recorded as shown in Figure 10. The incident photon to current conversion efficiency (IPCE) was recorded using the following equation (6).
I P C E ( % ) = 1240 ( J s c λ × P i n )
Where λ is the wavelength, Jsc is the short circuit current density (mA/cm2), and Pin is the input power (mW/cm2) [36]. The IPCE spectra for the samples A, B, and C based ZnO DSSCs had shown the broader peak bands between 300 nm to 700 nm. The values of IPCE spectra obtained for sample A, B and C based ZnO DSSCs at 500 nm were 57%, 61 % and 55% respectively. The comparison of IPCE spectra of samples A, B and C based ZnO DSSCs are presented in Table 8.
From the Table 8, it has been observed that the IPCE spectra of capped ZnO DSSCs (sample C) has lower efficiency as compared to ZnO DSSCs (sample A (57%) and sample B (61%)).
Table 9 shown that the comparison of the power conversion efficiencies between ZnO DSSCs (present results) and other DSSCs SC1, SC2, SC3 and SC4 (references [37,38,39,40]). This comparison is based on the quantity of ionic liquid electrolytes and dye used in the DSSCs. The comparison results revealed that the achieved efficiencies of ionic liquid and polyamide dye capped ZnO DSSCs were 3.99%, 5.65%, and 4.46% (for samples A, B and C based ZnO DSSCs) better than the efficiencies of ionic liquids and N-3/Z-907 dyes based other consulted DSSCs (4.4%, 3.1%, 5.3%, 5.4% and 5.17%) obtained from the above mentioned references respectively. It has been concluded that the sample B based ZnO DSSC (SCB) shown better power conversion efficiency and IPCE spectral value than other ZnO DSSCs (SCA and SCC).

3.6. Conclusions

For the present research work, we have synthesized three samples (A, B, and C) of ionic liquid and polyamide dye capped ZnO nanoparticles with the wet chemical precipitation method by a reaction between trimethylamine with bromoacetic acid (for ionic liquid as an electrolyte)) and trimesoylchloride with ethylenediamine ( for Polyamide dye). The synthesized samples A, B, and C were characterized by various methods like XRD, UV-Vis, FESEM, FTIR, DLS and Fluorescence spectra. The observation for FESEM clarified a well-defined nano-flowers like structures of dye capped ZnO nanoparticles. DLS results agreed well with the FESEM results in term of the distribution of particle size for samples A, B, and C capped ZnO nanoparticles respectively. XRD pattern also specified that the polyamide dye capped ZnO nanoparticles were single crystalline structures. The optoelectronic studies of samples A, B, and C based ZnO nanoparticles indicated good light absorption in the UV-Vis band with visible discharge emission. Further these samples (dyes capped ZnO nanoparticles) were processed as photo-anode sheets to design the dye sensitized solar cells (DSSCs). The photovoltaic studies under AM (air mass) 1.5 solar irradiations showed that the overall achieved incident photon to current conversion efficiency of sample B capped ZnO DSSC was higher by 1.66 % and 1.19% than sample A and C based ZnO DSSCs. A significant improvement of 6% in the IPCE spectra for sample B based ZnO DSSC was observed when compared to IPCE spectra of sample C based ZnO DSSC. Hence such solar cell assemblies can be implemented for low cost photovoltaic applications for clean and green energies.

Funding

No funding was received for the completion of this research work.

Acknowledgements

We are grateful to Guru Nanak Dev University, Amritsar and Indian Institute of Technology, Ropar for supporting lab facilities for the completion of this Ph.D research work.

Conflict of Interest

The authors declare no conflict of Interest.

Notes

The authors declare no competing financial interest.

References

  1. Cornelia Sima, Constantin Grigoriu, Stefan Antohe, Comparison of the dye-sensitized solar cells performances based on transparent conductive ITO and FTO, Thin Solid Films, 519 (2010), p. 595-597.
  2. Zhicai He, Chengmei Zhong, Xun Huang, Wai-Yeung Wong, Hongbin Wu., Liwei Chen, Shijian Su, Yong Cao, Simultaneous Enhancement of open circuit voltage, short-circuit current density, and Fill Factor in Polymer Solar Cells, Advanced Materials, 23 (2011), p. 4636-4643.
  3. Xuanhua Li, Wallace C. H. Choy, Lijun Huo, Fengxian Xie, Wei E. I. Sha, Baofu Ding, Xia Guo, Yongfang Li, Jianhui Hou, Jingbi You, Yang Yang, Dual Plasmonic Nanostructures for High Performances Invested Organic Solar Cells, Advanced Materials, 24 (2012), p. 3046-3052.
  4. Zhicai He, Changmei Zhong, Shijian Su, Miao Xu, Hongbin Wu and Yong Cao, Enhanced power conversion efficiency in polymer solar cells using an inverted device structure, Nature Photonics, 6 (2012), p. 591-595.
  5. Jingbi You, Letian Dou, Ken Yoshimura, Takehito Kato, Kenichiro Ohya, Jing Gao, Gang Li, Yang Yang, A polymer tandem solar cell with 10.6% power conversion efficiency, Nature Communications, 4:1446 (2013), p. 1-10.
  6. H. Park, Y. Park, W. Kim, W. Choi, Surface modification of TiO2 photocatalyst for environment applications, Journal of Photochemistry and Photobiology C: Photochemistry Reviews, 15 (2013), p. 1-20.
  7. J. Fan, Y. Hao, A. Cabot, E. M. J. Johansson, G. Boschloo, A. Hagfeldt, Cobalt(II/III) redox electrolyte in ZnO nanowire-based dye sensitized solar cells, ACS Applied Materials & Interfaces, 5 (6) (2013), p. 1902-1906.
  8. Guillaume Bousrez, Olivier Renier, Brando Adranno, Volodymyr Smetana, and Anja-Verena Mudring, Ionic Liquid-Based Dye-Sensitized Solar Cells-Insights into Electrolyte and Redox Mediator Design, ACS Sustainable Chemistry Engineering, 9 (2021), p. 8107-8114.
  9. Denizalti, Serpil; Ali, Abdulrahman Khalaf; Ela, Cagatay; Ekmekci, Mesut; Erten-Ela, Sule, Dye-Sensitized Solar Cells Using Ionic Liquids as Redox Mediator, Chemical Physics Letters, 691 (2018), p. 373-378.
  10. Annkatrin Lennert, Michelle Sternberg, Karsten Meyer, Ruben D. Costa, Dirk M. Guldi, Iodine-Pseudohalogen Ionic Liquid-Based Electrolytes for Quasi-Solid State Dye-Sensitized Solar Cells, ACS Applied Material Interfaces, 9 (39) (2017), p. 33437-33445.
  11. Kitty Y. Chen, Phil A. Schauer, Brian O. Patrick and Curtis P. Berlinguette, Correlating cobalt redox couple to photovoltage in the dye-sensitized solar cell, Dalton Transactions, 47 (2018), p. 11942-11952.
  12. Dianlu Jiang, Narek Darabedian, Sevak Ghazarian, Yuanqiang Hao, Maxim Zhgamadze, Natalie Majaryan, Rujuan Shen, and Feimeng Zhou, Dyes and Redox Couples with Matched Energy Levels: Elimination of the Dye-Regeneration Energy Loss in Dye-Sensitized Solar Cells, ChemPhysChem, 16 (2015), p. 3385-3388.
  13. Jun-Ho Yum, Etienne Baranoff, Florian Kesslar, Thomas Moehl, Shahzada Ahmad, Takeru Bessho, Arianna Marchioro, Elham Ghadiri, Jacques-E. Moser, Chenyi Yi, Md. K. Nazeeruddin, and Michael Grätzel, A cobalt complex redox shuttle for dye-sensitized solar cells with high open circuit potentials, Nature Communication, 3 (631) (2012), p. 1-8.
  14. Rodrigo García-Rodríguez, Roger Jiang, Esdras J. Canto-Aguilar, Gerko Oskam, and Gerrit Boschloo, Improving the mass transport of copper-complex redox mediators in dye-sensitized solar cells by reducing the inter-electrode distance, Physical Chemistry Chemical Physics, 19 (2017), p. 32132-32142.
  15. Marina Freitag, Fabrizio Giordano, Wenxing Yang, Meysam Pazoki, Burkhard Ziete, Michael Grӓtzel, Anders Hagfeldt, and Gerrit Boschloo, Copper Phenanthroline as a Fast and High-Performance Redox Mediator for Dye-Sensitized Solar Cells, Journal of Physical Chemistry C, 18 (120) (2016), p. 9595-9603.
  16. Tomohiro Higashino, Hitomi Liyama, Shimpei Nimura, Yuma Kurumisawa, and Hiroshi Imahori, Effect of Ligand Structures of Copper Redox Shuttles on Photovoltaic Performance of Dye-Sensitized Solar Cells, Inorganic Chemistry, 59 (1) (2020), p.452-459.
  17. Tae-Yeon Cho, Soon-Gil Yoon, S.S. Sekhon, and Chi-Hwan Han, Effect of Ionic Liquid with Different Cations in I-/I3- Redox Electrolyte on the Performance of Dye-Sensitized Solar Cells, Bulletin of the Korean Chemical Society, 32 (6) (2011), p. 2058-2062.
  18. Genevieve P.S. Lau, Jean-David Décoppet, Thomas Moehl, Shaik M. Zakeeruddin, Michael Grätzel, and Paul J. Dyson, Robust High-Performance Dye-Sensitized Solar Cells Based on Ionic Liquid-Sulfolane Composite Electrolytes, Scientific Reports, 5 (18156) (2016), p. 1-8.
  19. Mini Thomas and Sheeja Rajiv, Dye-Sensitized Solar Cells Based on an Electrospun Polymer Nanocomposite Membrane as Electrolyte, New Journal of Chemistry, 43 (2019), p. 4444-4454.
  20. Ruwaida Asyikin Abu Talip, Wan Zaireen Nisa Yahya, and Mohamad Azmi Bustam, Ionic Liquids Roles and Perspectives in Electrolyte for Dye-Sensitized Solar Cells, Sustainability, 20 (18) (2020), p. 1-23.
  21. Mikhail Gorlov and Lars Kloo, Ionic Liquid electrolytes for dye-sensitized solar cells, Dalton Transactions, 20 (2008), p. 2655-2666.
  22. Zhigang Lei, Biaohua Chen, Yoon-Mo Koo, Douglas R. MacFarlane, Introduction: Ionic Liquids, Chemical Reviews, 117 (2017), p. 6633-6635.
  23. Amal-Al-Kalout, Thermal treatment optimization of ZnO nanoparticles-photoelectrodes for high photovoltaic performance of dye-sensitized solar cells, Journal of the Association of Arab Universities for Basic and Applied Sciences, 17 (2014), p. 66-72.
  24. A.K. Chandiran, M. Abdi-Jalebi, M. K. Nazeeruddin, M. Grätzel, Analysis of electron transfer properties of ZnO and TiO2 photoanodes for dye sensitized solar cells, ACS Nano 8 (3) (2014), p. 2261-2268.
  25. Sarita Bose, Virendra Soni and K.R. Genwa, Recent Advances and Future Prospects for Dye Sensitized Solar Cells: Review, 5 (2015), p. 1-9.
  26. Satbir Singh, Tilak Raj, Amarpal Singh, Navneet Kaur, Optoelectronic and Photovoltaic Performance of Pyridine Based Monomer and Polymer capped ZnO Dye-Sensitized Solar Cells, 16(6) (2016), p. 5975-5983.
  27. R. Vittal, Kuo-chuan Ho, Zinc Oxide based dye-sensitized solar cells: Review, Renewable and Sustainable Energy Reviews, 70 (2016), p. 920-935.
  28. Ardiansyah Taufik, Alfred Albert, Roseri Saleh, Sol-gel synthesis of ternary CuO/TiO2/ZnO nanocomposites for enhanced photocatalytic performance under UV and visible light irradiation, Journal of Photochemistry and Photobiology A: Chemistry, 344 (2017), p. 149-162.
  29. Khushboo Sharma, Vinay Sharma and S.S Sharma, Dye-Sensitized Solar Cells: Fundamental and Current Status, Nanoscale Research Letters, 13 (2018), p. 1-46.
  30. Seong II Cho, Hye Kyeong Sung, Sang-Ju Lee, Wook Hyun Kim, Dae-Hwan Kim and Yoon Soo Han, Photovoltaic Performance of Dye-Sensitized Solar Cells Containing ZnO Microrods, Nanomaterials, 9 (2019), p. 1-12.
  31. Sabastine C. Ezike, Clement N. Hyelnasinyi, Mufutau A. Salawu, John F. Wansah, Amarachukwu N. Ossai, Nnabuike N. Agu, Synergistic effect of chlorophyll and anthocyanin co-sensitizers in TiO2-based dye-sensitized solar cells, Surfaces and Interfaces, 22 (2020), p. 1-39.
  32. Amarachukwu N. Ossai, Sabastine C. Ezike, Pascal Timtere, Abubakar D. Ahmed, Enhanced photovoltaic performance of dye-sensitized solar cells-based carica papaya leaf and black cherry fruit co-sensitizers, Chemical Physics Impact, 2 (2021), p. 1-8.
  33. Mikko Kokkonen, Parisa Talebi, Jin Zhou, Somayyeh Asgari, Sohail Ahmed Soomro, Farid Elsehrawy, Janne Halme, Shahzada Ahmad, Anders Hagfeldt and Syed Ghufran Hashmi, Advanced research trends in dye-sensitized solar cells, Journal of Material Chemistry A, 9 (2021), p. 10527-10545.
  34. Dr. Satbir Singh, Dr. Tilak Raj, Indra Bahadur, Dr. Harpreet Singh, Prof. Rajender S. Varma, Improved Power Conversion Efficiencies of Dye-Capped and Sensitized ZnO Solar Cells, ChemistrySelect, 7 (2022), p.1-11.
  35. Salisu. I. Kunya, Yunusa Abdu, Mohd Kamarulzaki Mustafa, and Mohd Khairul Ahmad, Survey of the Achievement of a ZnO Dye-Synthesized Solar Cell, Journal of Chemistry Studies, 2 (1) (2023), p. 1-12.
  36. Satbir Singh, Talik Raj, Indra Bahadur, Harpreet Singh, and Rajender S. Varma, Improved Power Conversion Efficiencies of Dye-Capped and Sensitized Solar Cells, Chemistry Select, 7 (38) (2022), p. 1-11.
  37. T. Kato, A. Okazaki, S. Hayase, Latent gel electrolyte precursors for quasi-solid dye sensitized solar cells: The comparison of nano-particle cross-linkers with polymers cross-linkers, Journal of Photochemistry and Photobiology A: Chemistry, 179 (1-2) (2006), p. 42-48.
  38. M. Wang, X. Xiao, X. Zhou, X. Li and Y. Lin, The Effect of Ionic Liquid to Dye-Sensitized Solar Cell with Fluorinated Oligomer Electrolyte, Solar Energy Material, 91 (2007), p. 785.
  39. Peng Wang, Shaik M. Zakeeruddin, Ivan Exnar and Michael Grätzel, High efficiency dye-sensitized nanocrystalline solar cells based on ionic liquid polymer gel electrolyte, Chemical Communications, 22 (2002), p. 2972-2973.
  40. E. Stathatos, P. Lianos, S. M. Zakeeruddin, P. Liska, and M. Grätzel, A Quasi-Solid-State Dye-Sensitized Solar Cell Based on a Sol-Gel Nanocomposite Electrolyte Containing Ionic Liquid, Chemistry of Materials, 15 (9) (2003), p. 1825-1829.
  41. Serpil Denizalti, Abdurrahman K. Ali, Ҫağatay Ela, Mesut Ekmekei, Sule Erten Ela, Dye-Sensitized Solar Cells using Ionic Liquids as Redox Mediator, Chemical Physics Letters, 691 (2018), p. 373-378.
Figure 1. Basic components and working of a ZnO DSSC.
Preprints 105712 g001
Scheme 1. Synthesis of ionic liquid (IL).
Preprints 105712 sch001
Scheme 2. Synthesis of polyamide dye.
Preprints 105712 sch002
Figure 2. Preparation procedure for dye capped ZnO nanoparticles (samples A, B, and C).
Preprints 105712 g002
Figure 3. Preparation of ionic liquid based ZnO photo-anode.
Preprints 105712 g003
Figure 4. DLS based particle size analyzer showing (a) particle size of dye capped ZnO nanoparticles (sample A) (b) particle size of dye capped ZnO nanoparticles (sample B) and (c) particle size of dye capped ZnO nanoparticles (sample C).
Preprints 105712 g004
Figure 5. (a) XRD patterns for dye capped ZnO nanoparticles, (b) FTIR spectra of dye capped ZnO nanoparticles.
Preprints 105712 g005
Figure 6. FESEM images of dye capped ZnO nanoparticles: (a) Sample A (b) Sample B and (c) Sample C.
Preprints 105712 g006
Figure 7. UV-Visible spectra of ionic liquid and polyamide dye capped ZnO nanoparticles (a) Sample A+ ZnO (b) Sample B+ ZnO and (c) Sample C+ ZnO.
Preprints 105712 g007
Figure 8. Fluorescence spectra of samples A, B and C based ZnO nanoparticles.
Preprints 105712 g008
Figure 9. Photovoltaic performances (J/V curves) of samples A, B and C based ZnO DSSCs.
Preprints 105712 g009
Figure 10. Comparison IPCE spectra (%) for samples A, B and C based ZnO DSSCs.
Preprints 105712 g010
Table 7. Comparison of current-voltage characteristics of ZnO DSSCs under simulated solar irradiations (AM 1.5).
Name of ZnO DSSC Open Circuit voltage Voc (volts) Short Circuit Current Density (Jsc) (mA/cm2) Maximum short circuit current density (Jmax)
(mA/cm2)
Maximum open circuit voltage (Vmax)
(volts)
Fill Factor (FF) Efficiency
(η %)
SCA 0.68 10.12 8.82 0.46 0.58 3.99
SCB 0.70 13.02 10.92 0.52 0.62 5.65
SCC 0.69 11.65 9.74 0.49 0.59 4.46
Table 8. Comparison of IPCE spectra (%) of samples A, B and C based ZnO DSSCs.
ZnO DSSC Description Electrolyte/Dye/Sensitizer Value of IPCE (%)
SCA Ionic liquid/polyamide 57%
SCB Ionic liquid/polyamide 61%
SCC Ionic liquid/polyamide 55%
Table 9. Comparison ionic liquids based ZnO DSSCs with other ionic liquid based DSSCs.
ZnO DSSC Electrolytes Mixture (IL) used Dye
used
Voc
(volts)
Jsc (mA/cm2) FF η%
SCA Triethylamine (1g)+Bromoacetic acid (1g) Trimesoyl chloride (10 ml) +Ethylenediamine
(5 ml)
0.68 10.12 0.58 3.99
(present result)
SCB Triethylamine (0.5g)+Bromoacetic acid (0.5g) Trimesoyl chloride (10 ml) + Ethylenediamine
(5 ml)
0.7 13.02 0.62 5.65
(present result)
SCC Triethylamine (1g)+Bromoacetic acid (0.5g) Trimesoyl chloride
(5 ml) + Ethylenediamine
(5 ml)
0.69 11.65 0.59 4.46
(present result)
Other DSSCs Electrolyte Mixture (IL) Used dyes η% Ref.
SC1 0.3 M I2, PVP (2 wt%), HOOC(CH2)16COOH(4 wt%), H2O (5 wt%) in PMImI N-3 4.4 [37]
SC2 1 M Lil, 0.5 M I2 in PEO(750)MimCl N-3 3.1 [38]
SC3 PVDF-HFP (10 wt%), I2 in PMImI Z-907 5.3 [39]
SC4 CH3CO2H, TMOS, 0.5 M PMImI, 0.04 Mm NMBI, 20 MMI2 in PC/Triton X-100 (molar ratio 4:1) N-3 5.4 [40]
SC5 0.6 M ionic liquid + 0.1 M LiI + 0.05 M I2 in MPN ----- 5.17 [41]
Disclaimer/Publisher’s Note: The statements, opinions and data contained in all publications are solely those of the individual author(s) and contributor(s) and not of MDPI and/or the editor(s). MDPI and/or the editor(s) disclaim responsibility for any injury to people or property resulting from any ideas, methods, instructions or products referred to in the content.
Copyright: This open access article is published under a Creative Commons CC BY 4.0 license, which permit the free download, distribution, and reuse, provided that the author and preprint are cited in any reuse.
Prerpints.org logo

Preprints.org is a free preprint server supported by MDPI in Basel, Switzerland.

Subscribe

© 2024 MDPI (Basel, Switzerland) unless otherwise stated