Preprint
Article

The Investigation of the Synthesis, Characterization, Molecular Docking, and Pharmacokinetic Properties of New Thiocarbohydrazones Based on Schiff Bases

Altmetrics

Downloads

141

Views

93

Comments

0

This version is not peer-reviewed

Submitted:

07 May 2024

Posted:

08 May 2024

You are already at the latest version

Alerts
Abstract
Ten new Schiff bases, including thiocarbohydrazone derivatives (1–10), were synthesized using an efficient, uncomplicated, and environmentally friendly approach using the reaction of alkyl-substituted aldehydes. The thiocarbohydrazones that were obtained were derived from o-phthalaldehyde. The chemical structures of the compounds were identified by the utilization of UV-Vis spectroscopy, Fourier transform infrared (FT-IR), 1H nuclear magnetic resonance (1H NMR), 13C nuclear magnetic resonance (13C NMR), and elemental analysis methods. The thermal stability of thiocarbohydrazones was examined using thermogravimetric analysis (TGA-DSC). Investigations were conducted on urease inhibition tests, pharmacokinetic property research, and molecular docking. The collection of samples with the urease enzyme revealed significant molecular docking findings, with MolDock scores ranging from -153 to -189. The compounds have the potential to be effective drug candidates for treating certain diseases, as indicated by the consistent results of molecular docking, urease inhibition tests, and pharmacokinetic characteristics investigations.
Keywords: 
Subject: Medicine and Pharmacology  -   Pharmacy

1. Introduction

Schiff bases are chemical compounds characterized by the presence of the imine (>C=N-) functional group. Hugo Schiff first identified these chemicals through the interaction between primary amines and aldehydes, or ketones [1]. Schiff bases are important due to their wide range of applications in biological systems [2], chemical catalysis [3], medicine and pharmacy [4], as well as chemical analysis, and emerging technologies. Schiff bases exhibit many advantageous biological activities and therapeutic effects. The properties of this substance include antibacterial [5], antimicrobial [6], anti-inflammatory [7], antiviral [8], antioxidant [9], anti-HIV [10], cytotoxic [11], antifungal [12], antituberculosis [13], anticancer [14], anthelmintic [15], antiglycation [16], antidepressant [17], and corrosion inhibition [18]. Phthalaldehyde (OPA) has many uses in the field of Schiff base production and investigation [19]. Thiocarbohydrazones are a distinct group of compounds represented by the structural formula =N–NH–C(=S) NH–N= [20]. Thiocarbohydrazones are intriguing ligand systems because of their numerous possible donor sites. Typically, they function as neutral or negatively charged ligands and form a bond with the metal via a sulfur atom and one imine nitrogen atom. This phenomenon arises from the tautomeric equilibrium between the thioketo and thioenol forms. Various variables influence this equilibrium, including the characteristics of the metal ion and its counterion, the circumstances of the reaction, the properties of the solvent, and the pH level of the medium. Extra coordination sites on the lateral substituents may change both the amount of reactants and how well they bind to different metal ions. These traits could be useful in a number of biological contexts, and being able to fine-tune the chelate's stability and properties by changing the coordinating residues of the substituents could have big effects[21,22]. They have diverse applications in the fields of biochemistry [23], pharmaceuticals [24], and industry [25,26]. These compounds exhibit a range of beneficial effects, including their ability to prevent cancer [27,28], DNA repair [28], fight against microbes [29], kill bacteria [24], combat fungal infections [29], act as antioxidants [30], destroy cells [31], inhibit viruses [32], suppress tumor growth [13], and protect against corrosion [33]. Both isatin-based thiocarbohydrazone and Schiff bases possess pharmacological and biological characteristics [34]. Antioxidants have been discovered to confer health advantages by mitigating many types of harm, such as cellular senescence, mutagenic modifications, and the formation of malignant neoplastic tissue. This is accomplished by their capacity to interact with oxygen and nitrogen species, effectively nullifying their radical impacts and therefore mitigating oxidative stress conditions [35]. Antioxidants are molecular substances that disrupt oxidation by limiting the production of free radicals or by controlling the oxidation of biodiesel via the removal of existing radicals [36].These antioxidants have phenolic functional groups in their chemical composition. The antioxidant (AH) acts by impeding the progression of the peroxide radical (ROO.) by preventing the production of radicals in the autoxidation pathway [37]. Multiple studies have indicated that Schiff bases exhibit advantageous antioxidant characteristics as a result of the inclusion of a nitrogen atom in the azomethine group, which is located in the sp2 hybrid orbit. Furthermore, Schiff bases have unshared electron pairs, making them very efficient chelating agents and prone to different reactions [25]. Assessing antioxidant activities is a way to determine the reactivity of Schiff base compounds, which have the capability to create coordination complexes with metal ions. The antioxidative activity of phenolic Schiff bases (SB-OH) is intimately linked to their ability to release hydrogen atoms. There are several ways to scavenge free radicals, which results in the creation of the corresponding phenoxy radical [38,39].

2. Materials and Methods

2.1. Materials

The chemicals and solvents used in this study were procured from reputable suppliers, namely Merck & Co., Inc., located in Kenilworth, NJ, USA, and Sigma-Aldrich Chemical Company, based in St. Louis, MO, USA.
The samples were utilized without undergoing further purification. Thin layer chromatography (TLC) using Kieselgel-60 GF254 (Merck) monitored the progress of the reaction. UV-Vis spectra and absorption data were obtained with a Shimadzu (Shimadzu Corporation, Kyoto, Japan). A Perkin Elmer Spectrum-Two FT-IR spectrometer, manufactured in the USA, was utilized for Fourier transform infrared analysis at ambient temperature. 1H NMR and 13C NMR spectra (in DMSO-d6) were taken at 25 °C using an Agilent Premium Compact spectrometer operating at 14.1 Tesla and 600 MHz. A Eurovector EA3000 (Eurovector S.r.l., Pavia, Italy) elemental analyzer was used for elemental analysis.
The TGA-DSC analysis was performed using an SDT Q-600 instrument manufactured by TA Instrument-Waters in the USA. The powder samples were subjected to heating at a rate of 10 °C/min in an alumina pan with a nitrogen gas flow rate of 50 mL/min until reaching a temperature of 1100 °C.
A molecular docking study was carried out via the Molegro Virtual Docker 6.0.1. software. Compounds were sketched through Chem-Draw Ultra 18.0, and then Chem3D 18.0 was used to improve energy minimization. The crystal structure of Jack bean urease (4GY7) was obtained from the PDB bank [40]. The binding energy for each molecule with the most suitable binding pose was transferred to the Discovery Studio imaging software to obtain the two-dimensional and three-dimensional shapes [41].
The possible effect of urease inhibition on samples and thiourea at different dosages was evaluated using the spectrophotometric technique. The inhibitory concentration (IC50: µg/mL) was displayed in Table 11. The breakdown of urea produces hypochlorite of ammonia, which nitroprusside interacts with to produce urease inhibitory activity, which was detected at 630 nm [42].
For pharmacokinetic properties, we may more effectively produce highly efficient medical structures and enhance their chemistry and biological uses by assessing their ADME and drug-likeness properties and estimating their biological activity scores. Every molecule was examined for its MW, TPSA, n-ON acceptor, and n-OHNH donor compliance. Its skin accessibility (Log Kp), blood-brain barrier permeability, soluble rate, and capacity for being taken by human gastrointestinal tissues. SwissADME (http://www.swissadme.ch/index.php) and Molsoft (https://molsoft.com) websites were used in the analyses [43].

2.2. Methods

2.2.1. Synthesis of Schiff Base-Based New Thiocarbohydrazones (1-10)

(MA = 134.13 g/mol) o-Phthalaldehyde (1,2-benzenedicarbaldehyde) (5.0 mmol) reacts with thiocarbohydrazide (5.0 mmol) (MA: 106.15 g/mol). Hydrochloric acid, acting as a catalyst, modifies the mixture and dissolves it in 100% ethyl alcohol (20 mL). It is then heated under reflux and agitated. Thin layer chromatography (TLC) is employed to track the progress of the reaction using an executive phase consisting of a mixture of n-hexane and ethyl acetate at a ratio of 4:1. The resulting product is subjected to filtration prior to cooling, followed by numerous washes with cold absolute ethyl alcohol. Subsequently, it is subjected to vacuum drying, and its structure is elucidated. The o-phthalaldehyde-derived thiocarbohydrazone (2.0 mmol) reacts with aldehyde derivatives containing different R groups (2.0 mmol). Each combination is individually modified with HCl (catalyst) and dissolved in 100% ethyl alcohol (25 mL). Next, we heat each combination separately under reflux before mixing them. Thin layer chromatography (TLC) is employed to observe the progression of the processes using an executive phase consisting of a mixture of n-hexane and ethyl acetate at a ratio of 4:1. Once the temperature has decreased in the surrounding environment, the resulting substances from the reaction are separated by filtration. They are then subjected to numerous washes using ethyl alcohol that is 100% pure. After that, the substances are dried under vacuum conditions, and their structure is determined [44,45]. The products exhibited significant yields ranging from 55% to 87% (Figure 1).

3. Results and Discussion

3.1. Physical Properties

Here are the results for the physical properties, yields, melting points, colors, and elemental analyses (Table 1 and Table 2).

3.2. Vibration Frequency Ranges

The vibrations of the substances as measured by FT-IR (Table 3). Presenting the spectral areas associated with certain chemical vibrations generated by the samples. The stretching vibration of the aldehyde group (–CHO) in the first component did not exhibit two bands at 2830–2680 cm-1. The symmetric and asymmetric stretching vibrations of the amino group (–NH2) were not detected in the spectral range of 3400–3150 cm-1. Instead, we detected new stretching vibrations of the imine group around 1570–1481 cm–1. The presence of these peaks serves as an initial indication of the effective synthesis of the materials. The stretching vibrations of ν(O–H) were recorded at a range of 3685–3678 cm−1 for all compounds (1–10). The stretching vibrations of ν(–C–O) originating from the methoxy and hydroxy groups were observed in the range of 1077–1065 cm−1. The vibrations of the ν(–NH) group in the thiocarbohydrazone area were detected within the range of 3272–3201 cm−1. The ν(-C=S) signals of the thiocarbohydrazone region were seen at 1512–1405 cm–1. The absorptions of the ν(–C–N) group were observed at 1199–1100 cm−1.
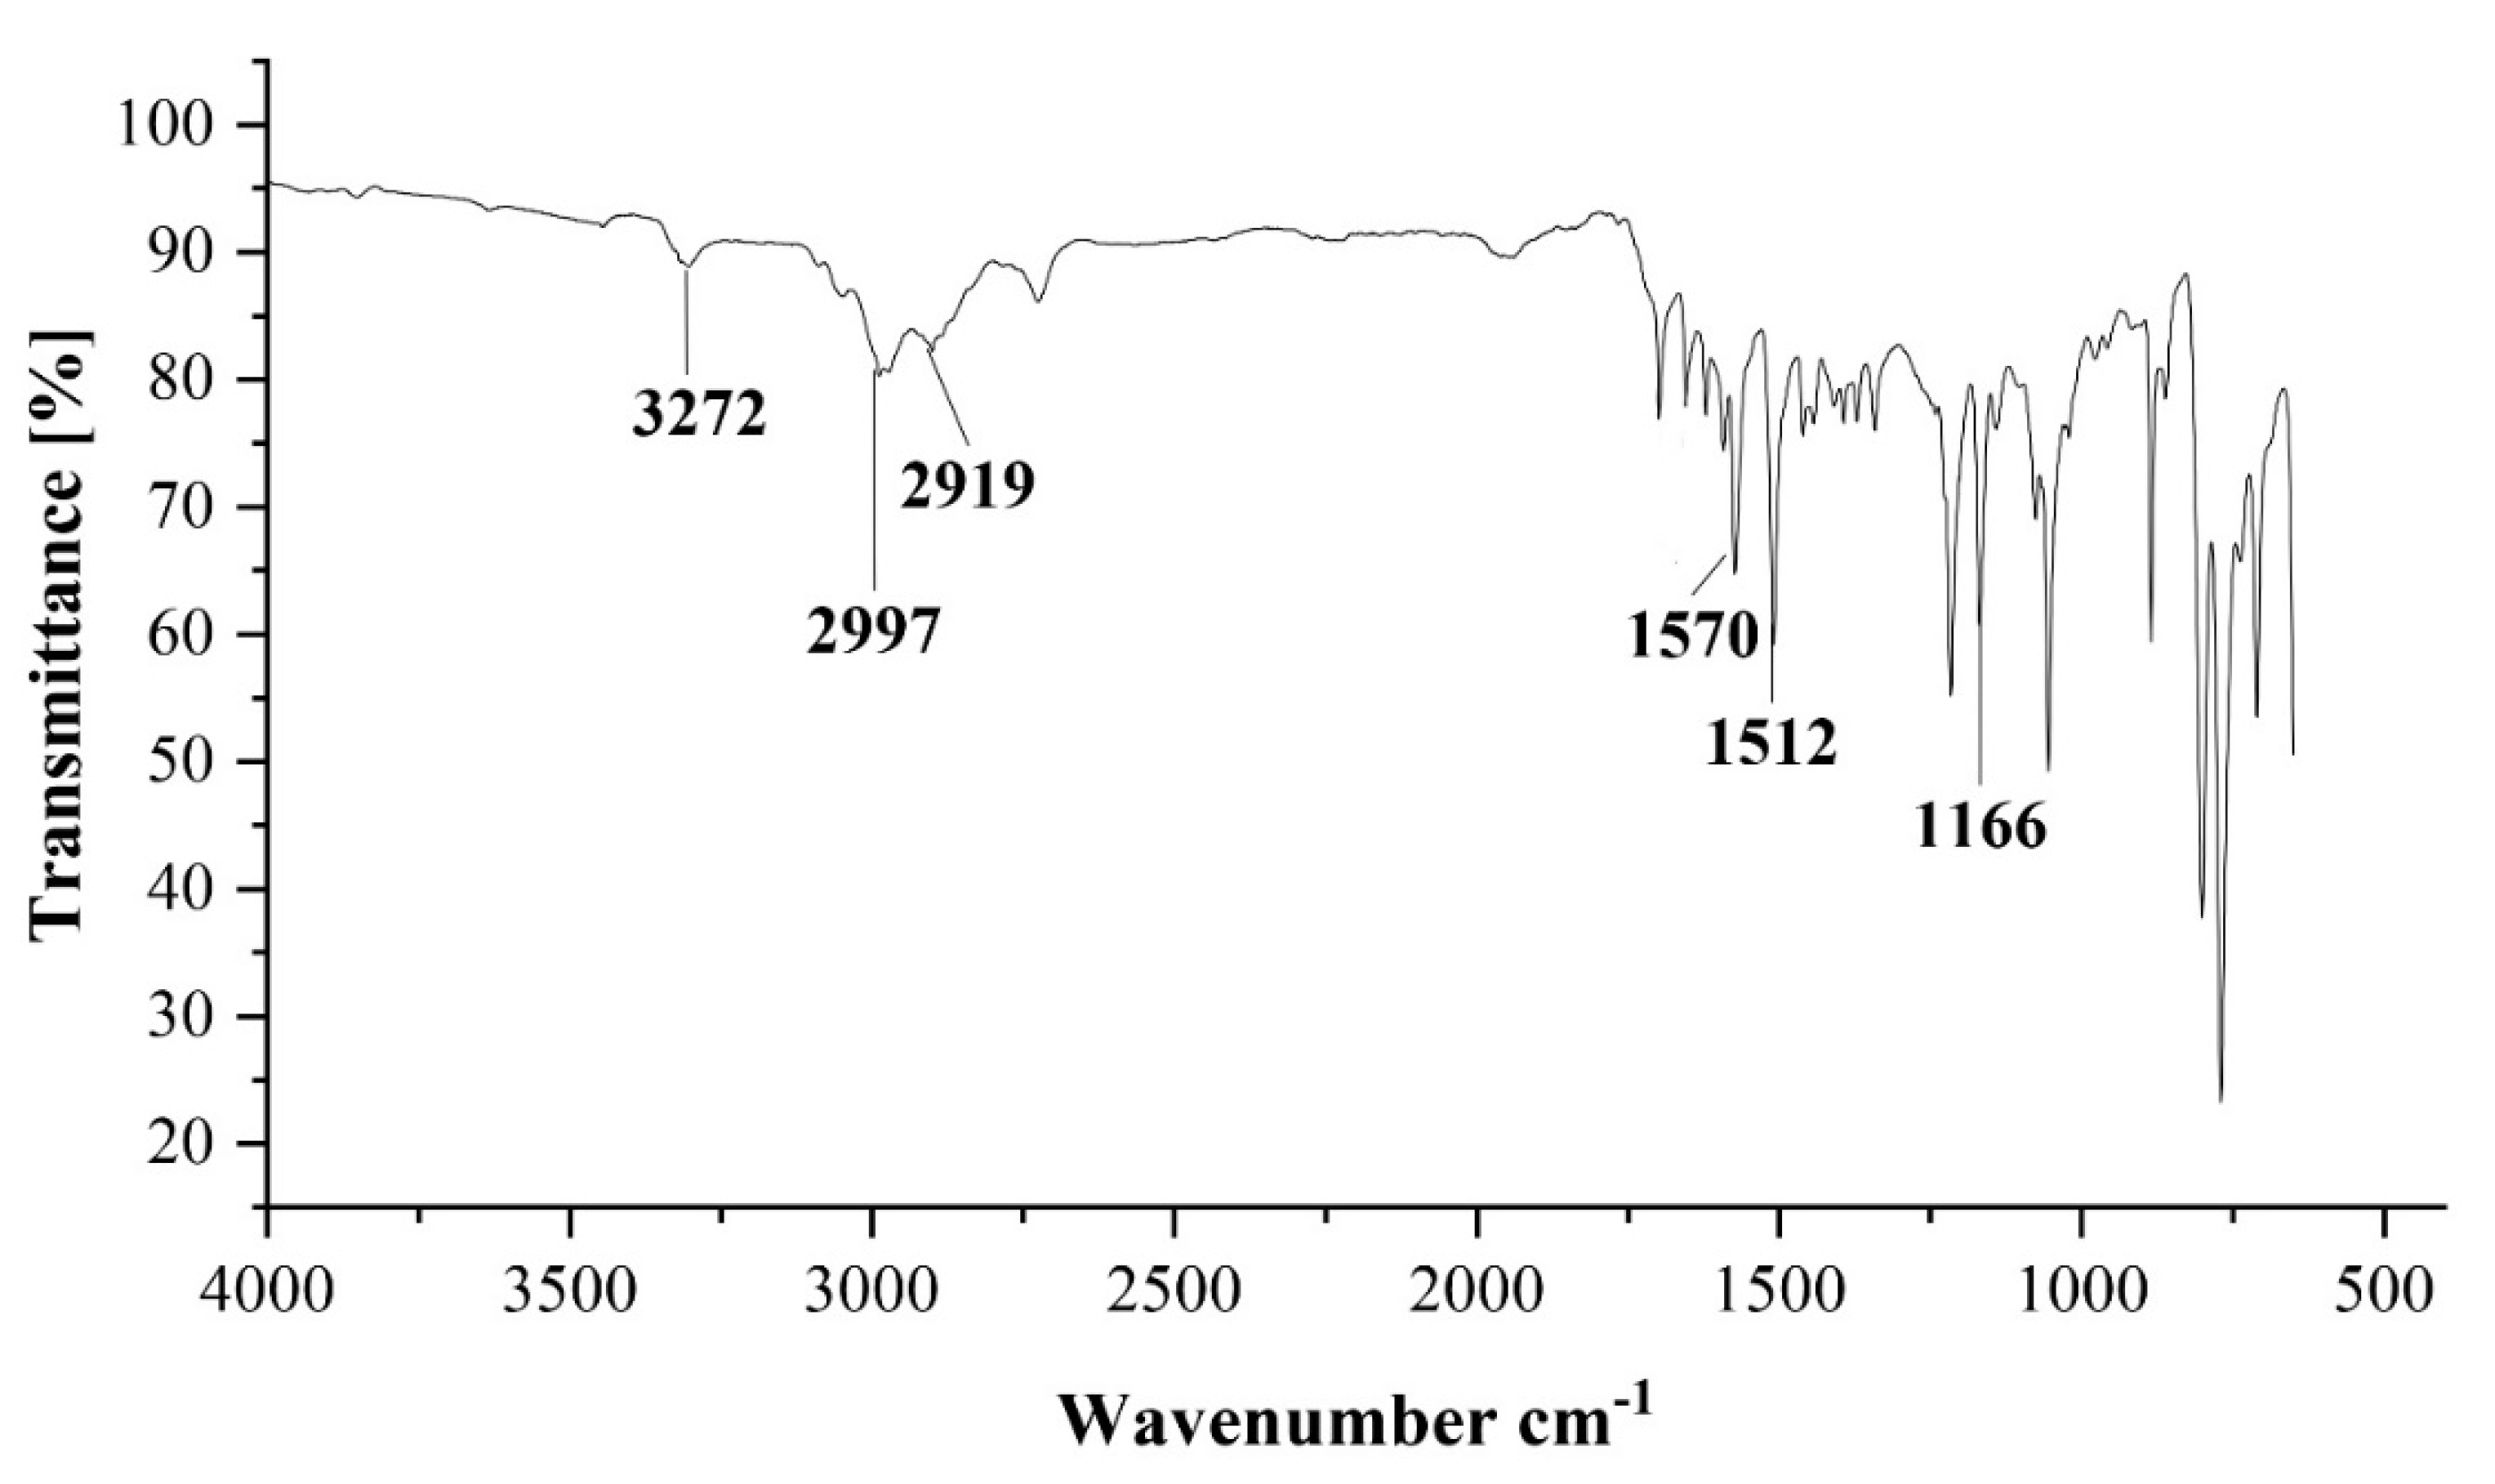
Compound 4 displayed FT-IR emissions that corresponded to distinct functional groupings. The –NH stretching vibration was detected at 3272 cm-1. The existence of this functional group is indicated by the appearance of the –C=N stretching vibration at 1570 cm−1. Furthermore, the presence of the C=S signal in the thiocarbohydrazone area was detected at a frequency of 1512 cm−1. The existence of the C–N bond was shown by the detection of the stretching vibration at 1166 cm-1 (Figure 2). The frequency statistics for all molecules were in accordance with the published values for similar compounds [4,47,48,49].

3.3. The Interpretation of the 1H Nuclear Magnetic Resonance Spectrum

The NMR spectra of all compounds using deuterated dimethyl sulfoxide (DMSO-d6) as the solvent. They found that DMSO-d6 and water exist in DMSO (HOD, H2O) at chemical shifts of about 2.00, 2.55 (quintet), and 3.40 ppm (variable, depending on the solvent and its concentration).
Shows the chemical shifts for all compounds, excluding compound 4 (Table 4). The proton signals attributed to the imine (-CH=N) groups in compounds 1–10 were seen as singular peaks within the chemical shift ranges of 8.58–8.52 ppm. The singlet signals of the amino groups (-N2H and -N1H) inside the thiocarbohydrazone moiety were seen at chemical shift ranges of 11.62–10.63 and 10.66–9.74 ppm, respectively. The proton signals for the hydroxyl groups (-OH) in compounds 1–10 were seen as singlets, with chemical shifts ranging from 13.46 to 8.75 ppm. For compounds 6, 7, 8, and 10, the proton signals of the methoxy group (-OCH3) showed a singlet at 3.79, 3.80, 3.80, and 3.83 ppm, respectively.
The H1, H3, and H4 protons showed doublet peaks at 8.01–7.88 ppm, 7.66–7.64 ppm, and 8.35–8.33 ppm, respectively. The H2 proton is coupled to the H1 and H3 protons, and the observed doublet of doublets peakes at 7.55–7.54 (J = 7.5, 1.8 Hz) ppm. The H5 proton was coupled to the H4 and H6 protons and showed triplet peaks at 7.54–7.53 (J = 8.0 Hz) ppm. The H6 proton was coupled to the H5 and H7 protons and showed a doublet of doublet peaks at 7.54–7.53 (J = 8.0, 3.0 Hz) ppm. The H7 proton was detected as a doublet peak at 7.75–7.73 ppm. The H8 proton was detected as a doublet peak at 7.60–7.57 ppm. The H9 proton was coupled to the H8 and H9 protons and showed doublet of doublets peaks at 7.44–7.42 (J = 8.1, 3.0 Hz) ppm. For compound 9, the proton signal of the methylene group (-CH2) was observed as a doublet of doublets peaking at 4.07–4.03 (2H, dd, J = 6.2 Hz) ppm; the methyl group (-CH3) was detected as a triplet at 1.33–1.31 (1H, t, J = 6.2 Hz) ppm.
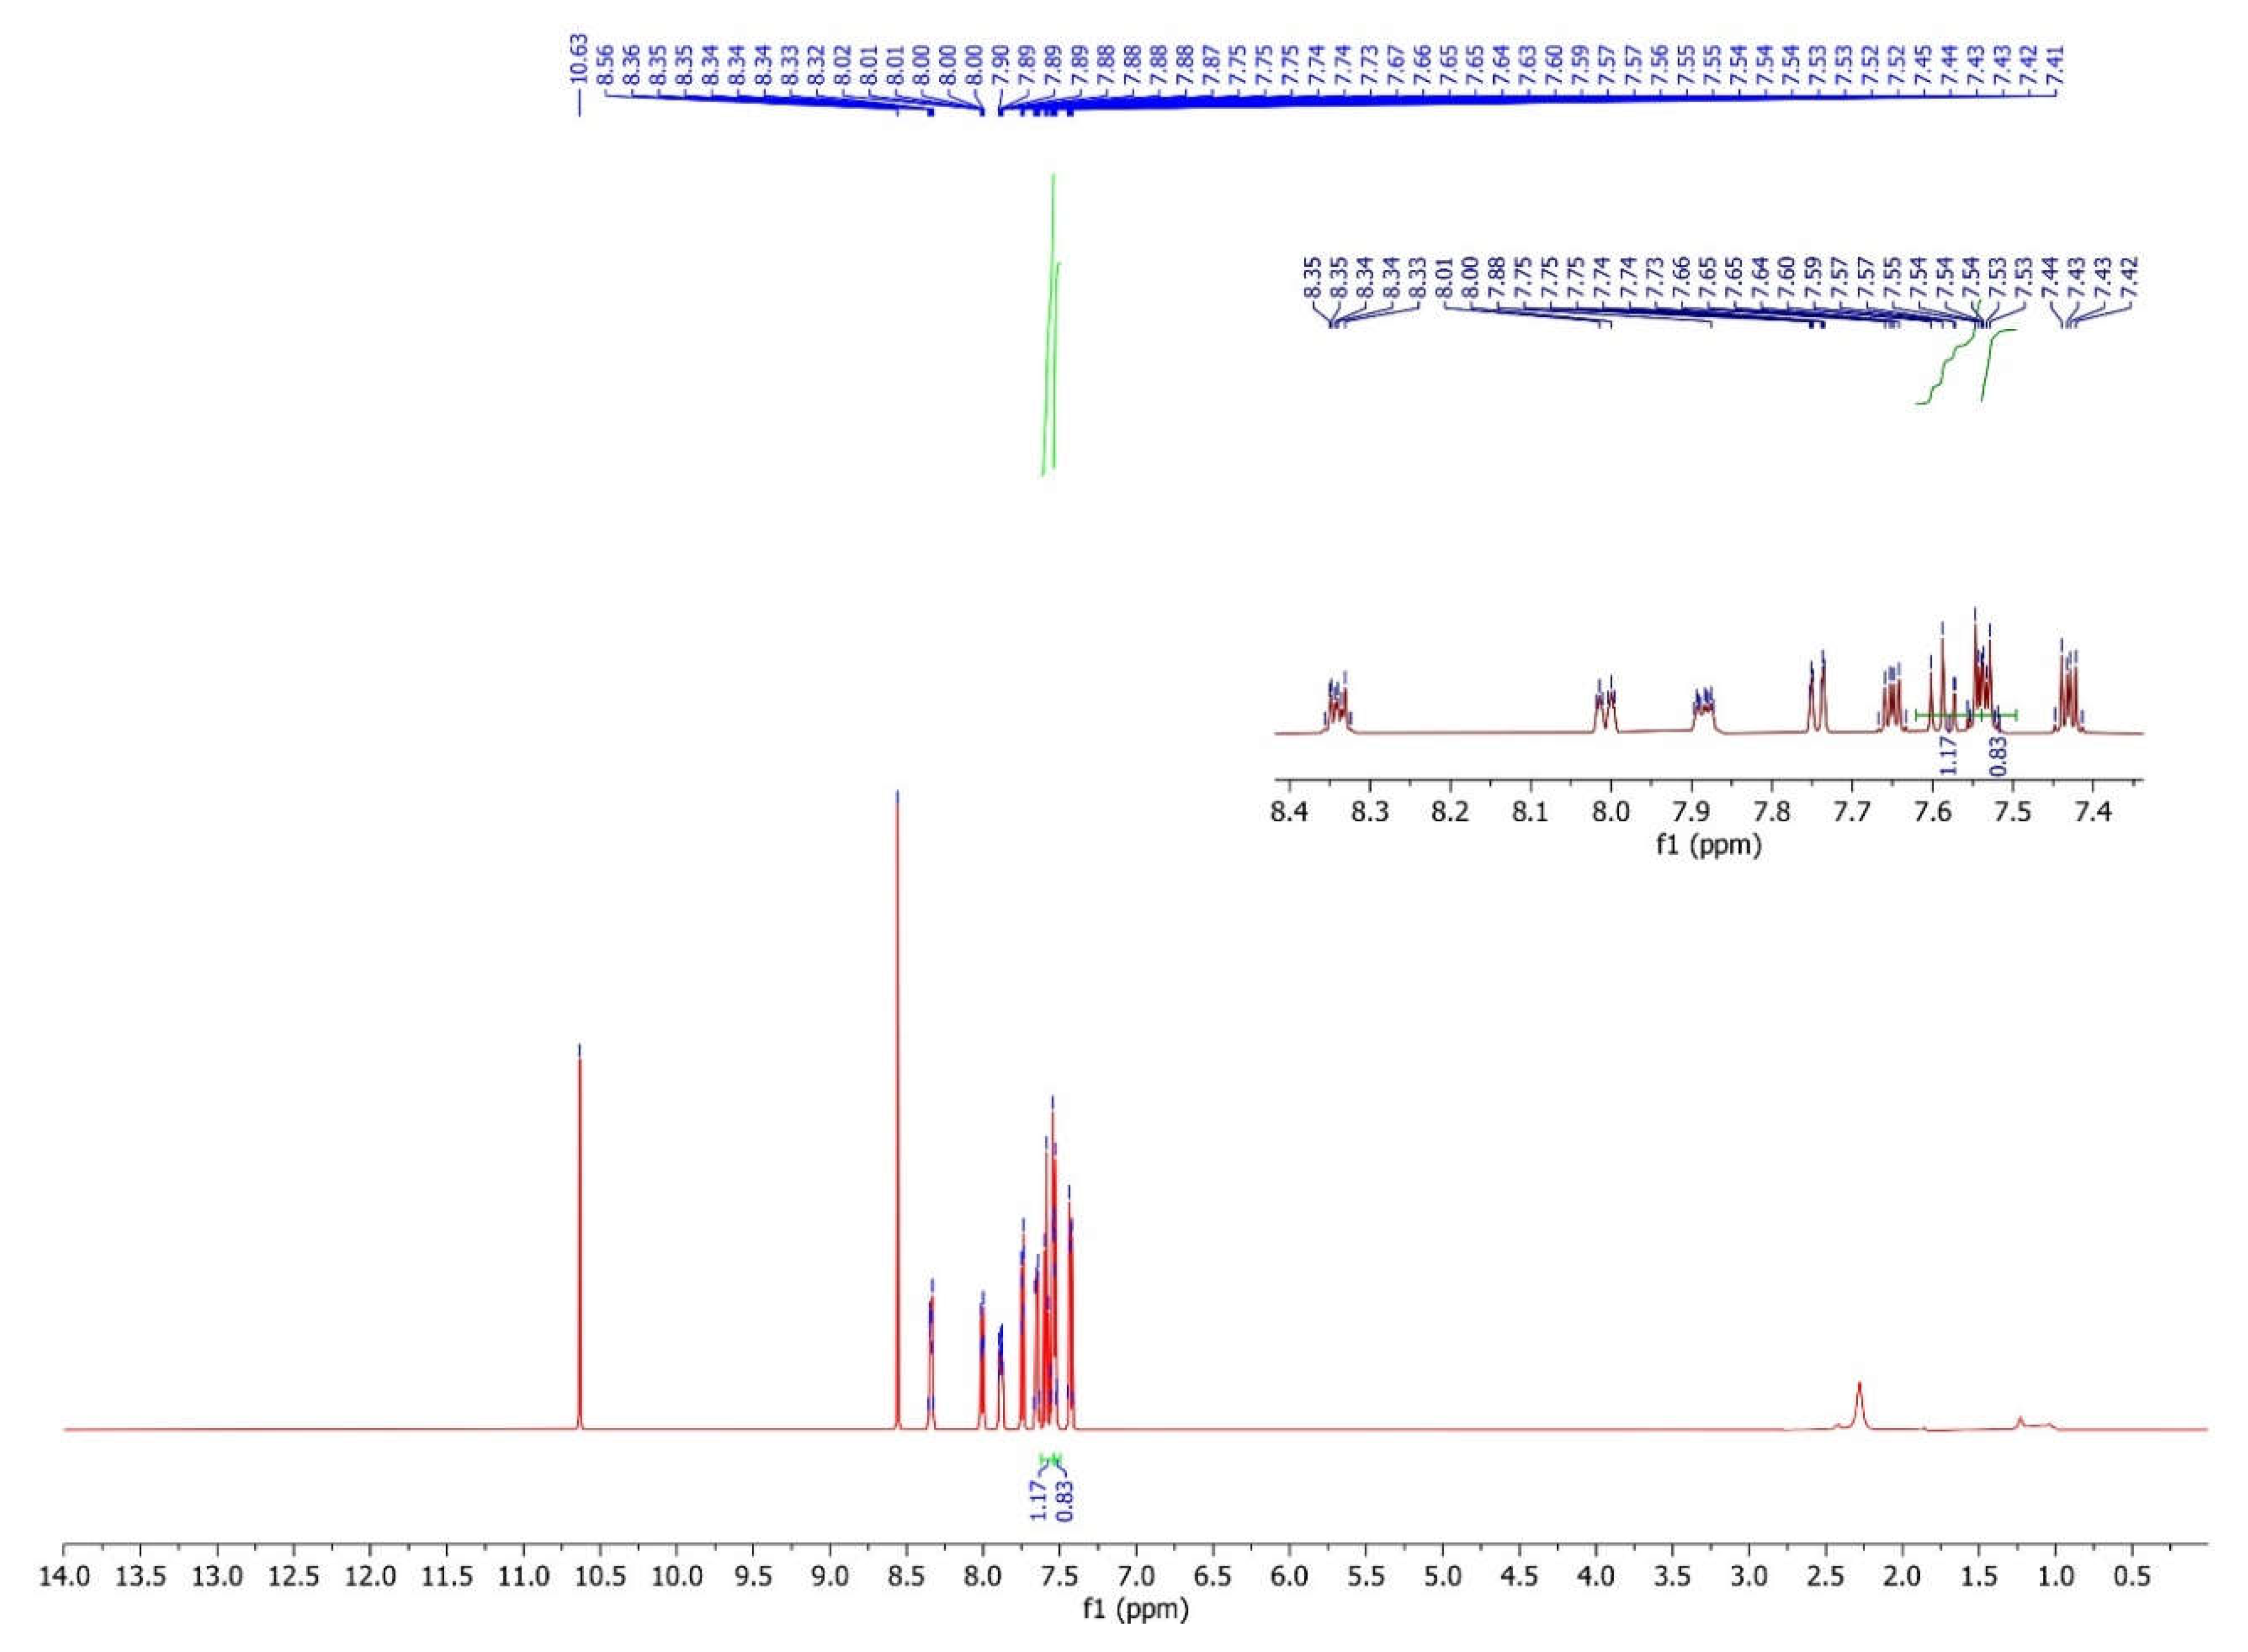
In compound 4, the signal of imine (-CH=N) was observed as a singlet at 8.55 ppm. The -N1H and -N2H proton signals of the thiosemicarbazone region were observed as a singlet at 10.63 ppm. Table 5 displays the chemical shifts of compound 4. Figure 3 displays the aromatic proton signals of the thiosemicarbazone ring (H1–H7), which were identified within the range of 8.35 to 7.53 ppm (please see supplementary information). These results are highly consistent with values for similar compounds [50,51,52,53,54].

3.4. The interpretation of the 13C Nuclear Magnetic Resonance Spectrum

The 13C NMR spectra of the compounds were taken in DMSO-d6; the chemical shifts are summarized in Table 6 and Table 7, respectively. In the compounds (1–9), the aromatic C signals of the aryl ring (C1–C6) were observed between 163.4 and 111.4 ppm, and those from the terephthalaldehyde ring (C9–C10) were observed between 141.1 and 128.2 ppm.
The imine compounds 1-3 and 5-10 exhibited distinctive peaks at 150.50 and 142.08 ppm, respectively, corresponding to the –C=N (C7 and C9) functional groups. Compounds 1-3 and 5-10, respectively, exhibited notable –C=S (C8) peaks at 187.64 and 184.19 ppm in the thiosemicarbazone area. The methoxy carbon atoms (–OCH3) in compounds 6, 7, 8, and 10 exhibited resonance between 57.64 and 56.21 ppm. Compound 9 showed a methylene carbon signal at 65.75 ppm. Please refer to the supplementary material for further details.
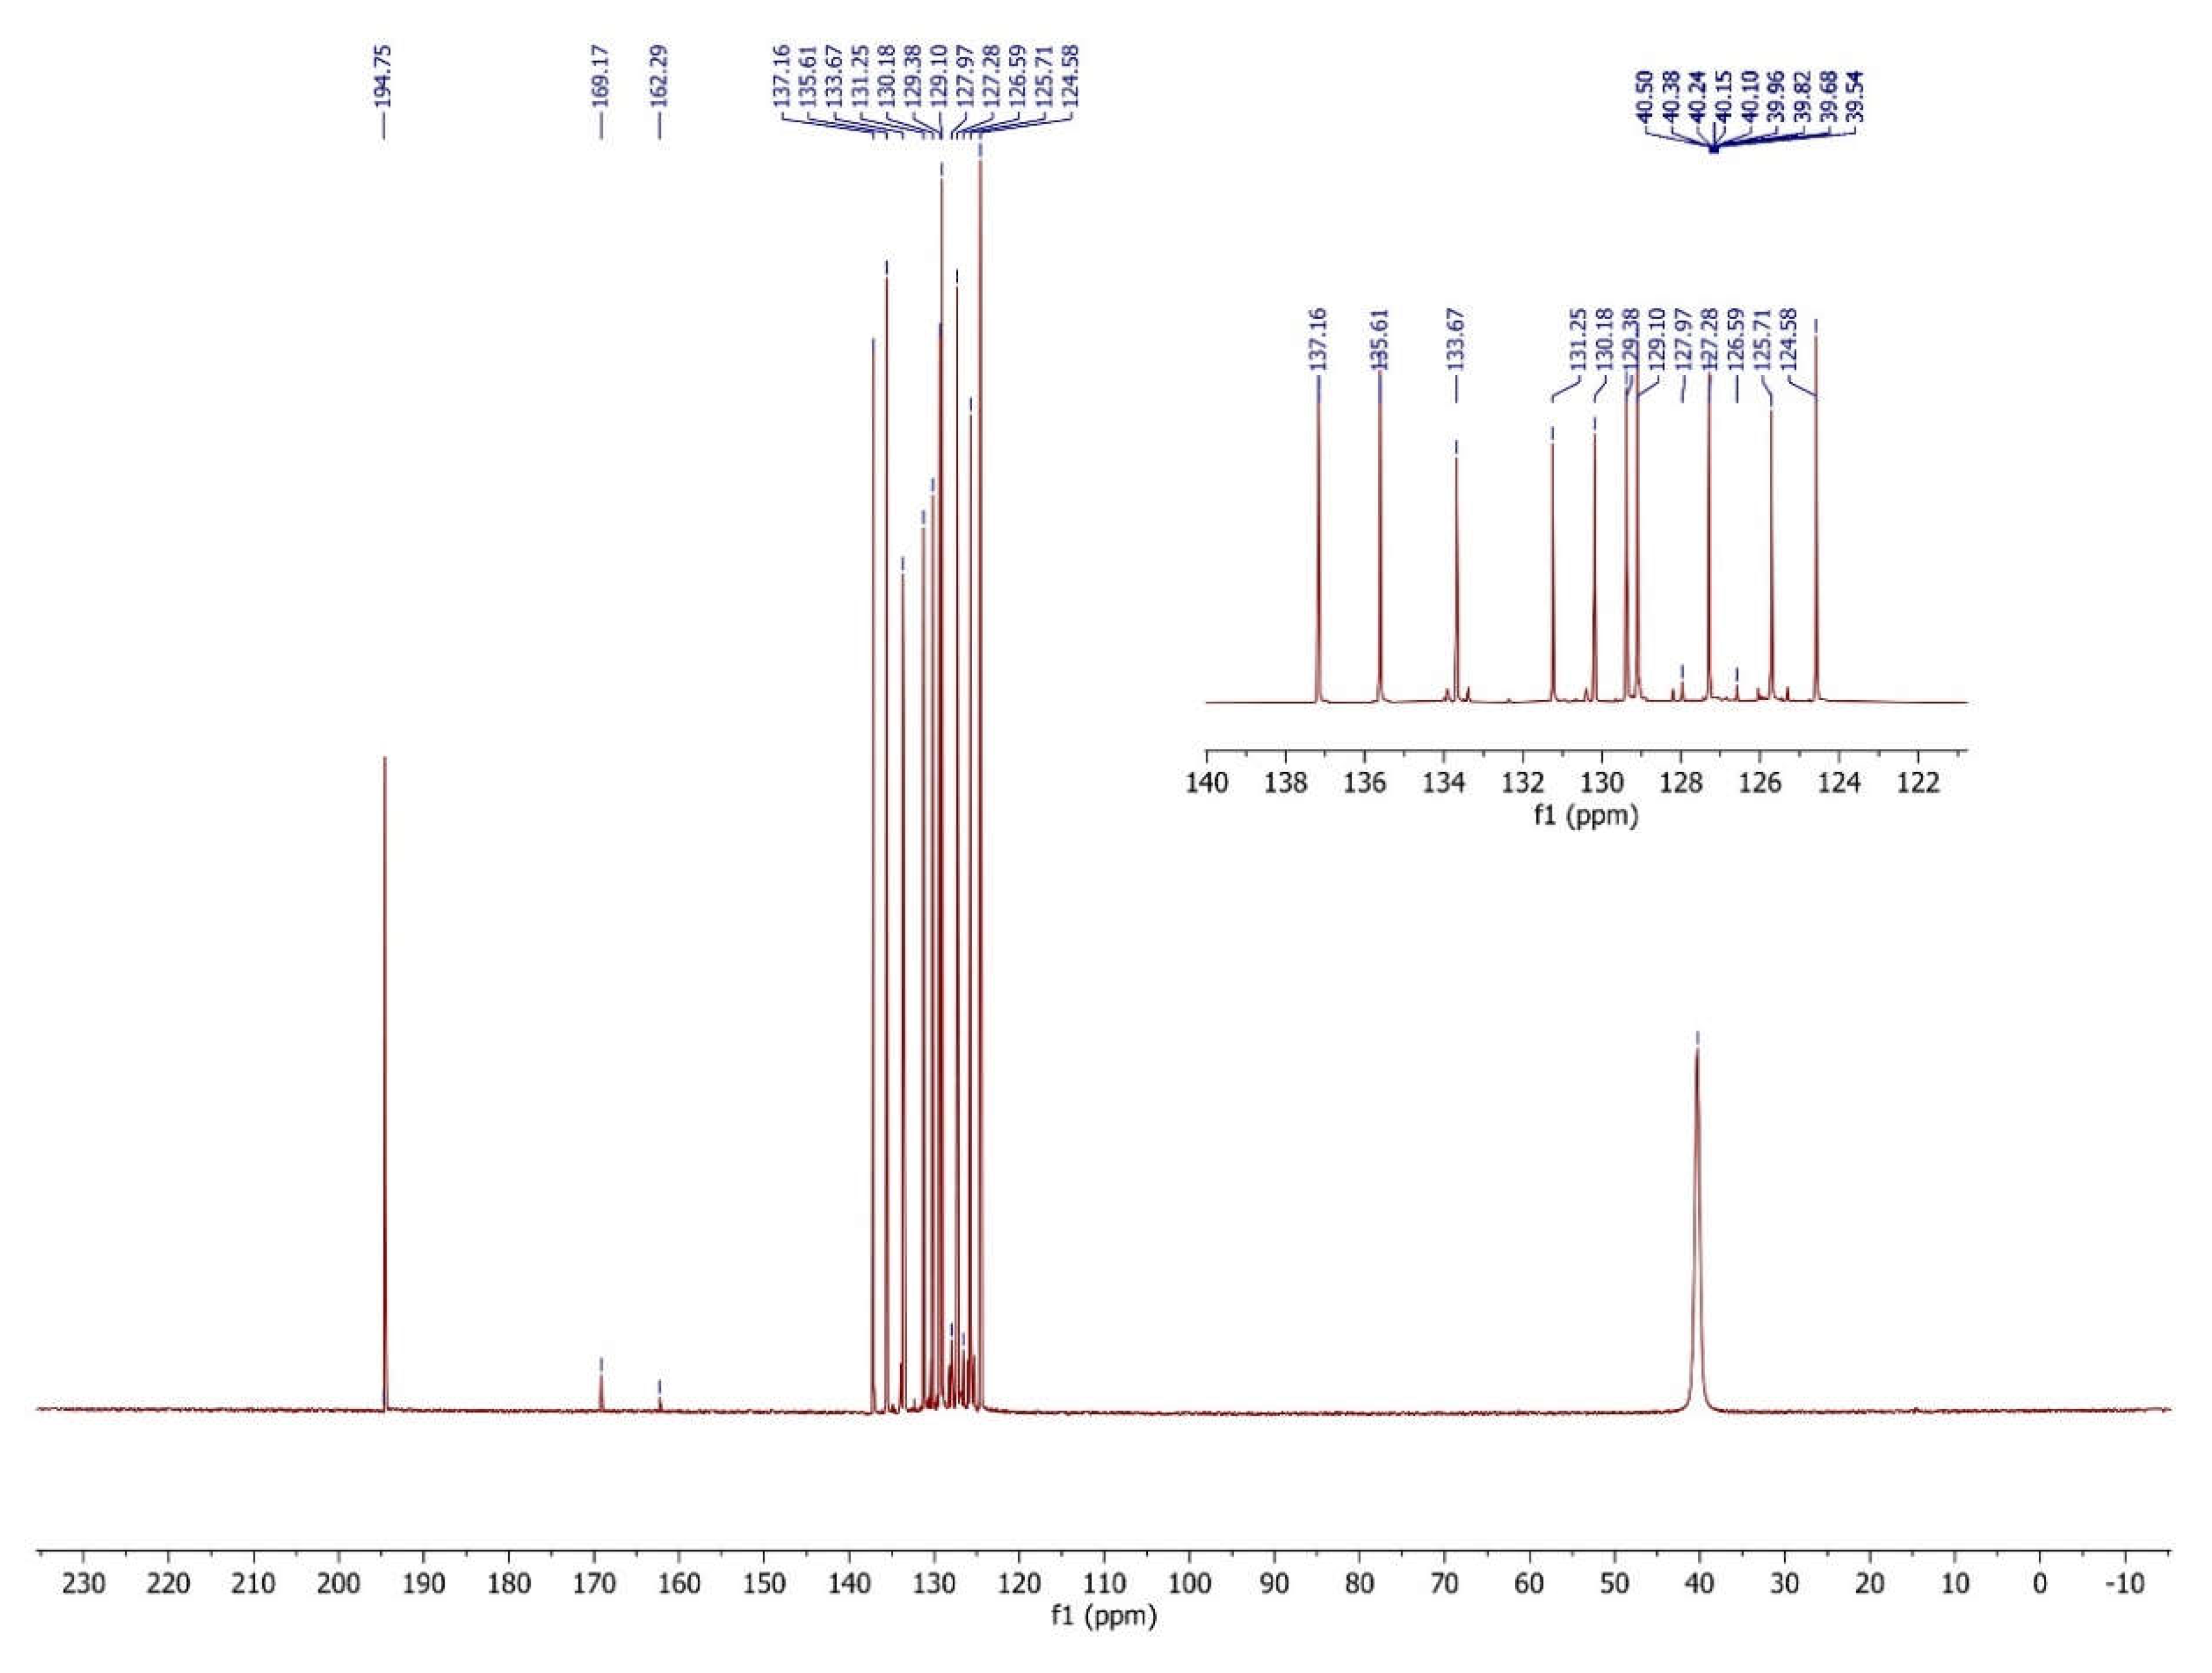
Compound 4 exhibited a 13C NMR spectrum with 10 distinct resonances, which aligns with the structure depicted in Figure 4. The thiosemicarbazone part of compound 4 showed a -C=S (C12) signal with a 194.75 ppm chemical shift. The imine compound exhibited a distinctive -C=N (C11 and C13) peak, which was detected at chemical shifts of 162.29 and 169.17 ppm, respectively. The carbon atoms (C1–C10) of the ring containing two aryl groups were identified with chemical shifts of 135.61, 137.16, 131.25, 126.59, 124.58, 133.67, 125.71, 120.10, 127.28, and 130.18 ppm, respectively. The chemical shifts of the aromatic carbon signals in the terephthalaldehyde region (C14–C16) were detected at 135.61, 127.97, and 129.38 ppm, respectively. These results are consistent with the data published for analogous substances [51,55,56,57].

3.5. Analysis of the UV–Vis Spectra

The electronic absorption spectra of the newly synthesized thiocarbohydrazones, which are derived from Schiff base derivatives (1–10), indicate that absorption bands within the wavelength range of 240–350 nm were seen in all the products produced, namely in dimethylsulfoxide. The compounds exhibit notable absorption bands in their electronic spectra, namely in the aromatic ring (C=C) and thiocarbohydrazone (C=S)–imine (CH=N) area. These bands can be attributed to transitions of a π → π * and an n → π *. All compounds exhibit π → π * type transitions of C=C on the aromatic ring within the wavelength range of 240–260 nm. The n → π * transitions of the imine C=N double bond were seen at a wavelength of 280 nm, with the exception of compound 4 which exhibited a transition at 260 nm. The spectral bands seen within the range of 310–350 nm can be attributed to the electronic transition n → π * of the thiocarbohydrazone moiety possessing the C=S group.
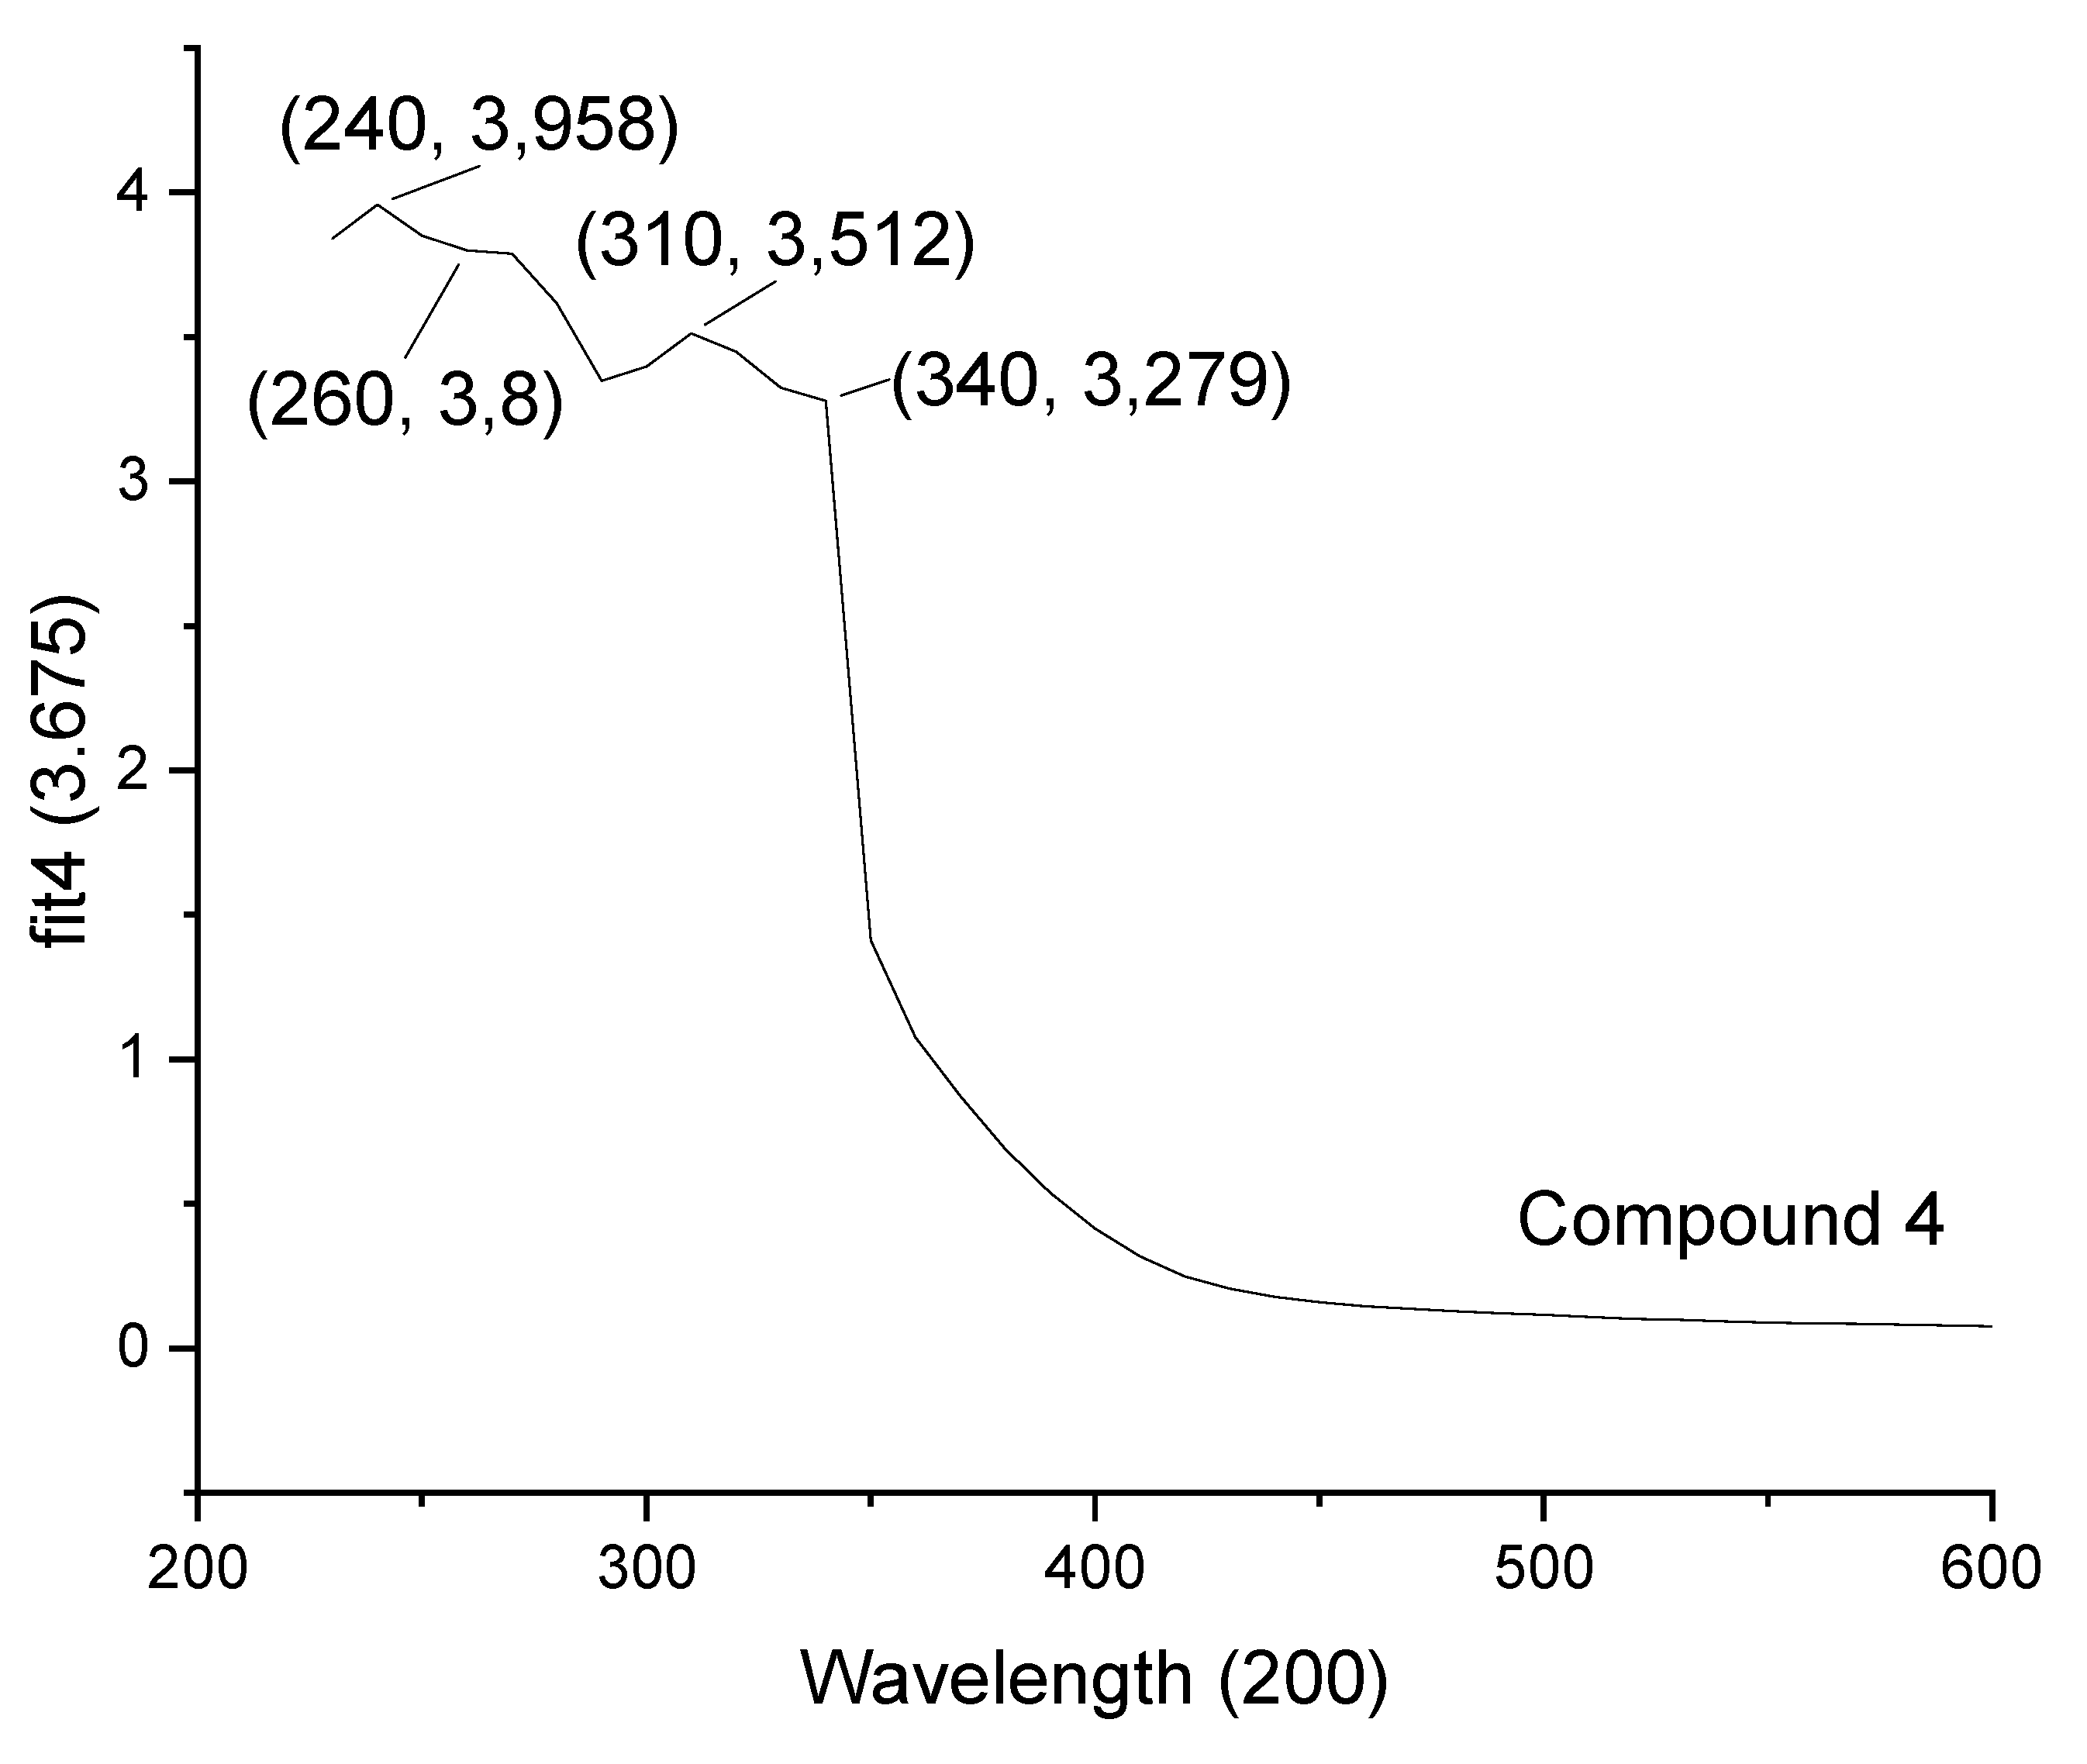
The thiocarbohydrazone moiety (C=S) in compound 4 exhibits 2 n → π * transitions at 310 (shoulder) and 340 nm, as seen in Figure 5. The bands observed at 260 nm (shoulder) correspond to the azomethine C=N double bond and the n → π * transitions. On the other hand, the π → π * transitions of C=C on the aromatic structure are observed at 240 nm, as depicted in Figure 5. Table 8 provides a summary of the electronic spectrum data for all the substances. The observed values align with the findings published for analogous substances [2,57,58]. Please refer to the supplementary material for further details.

3.6. Thermal Properties

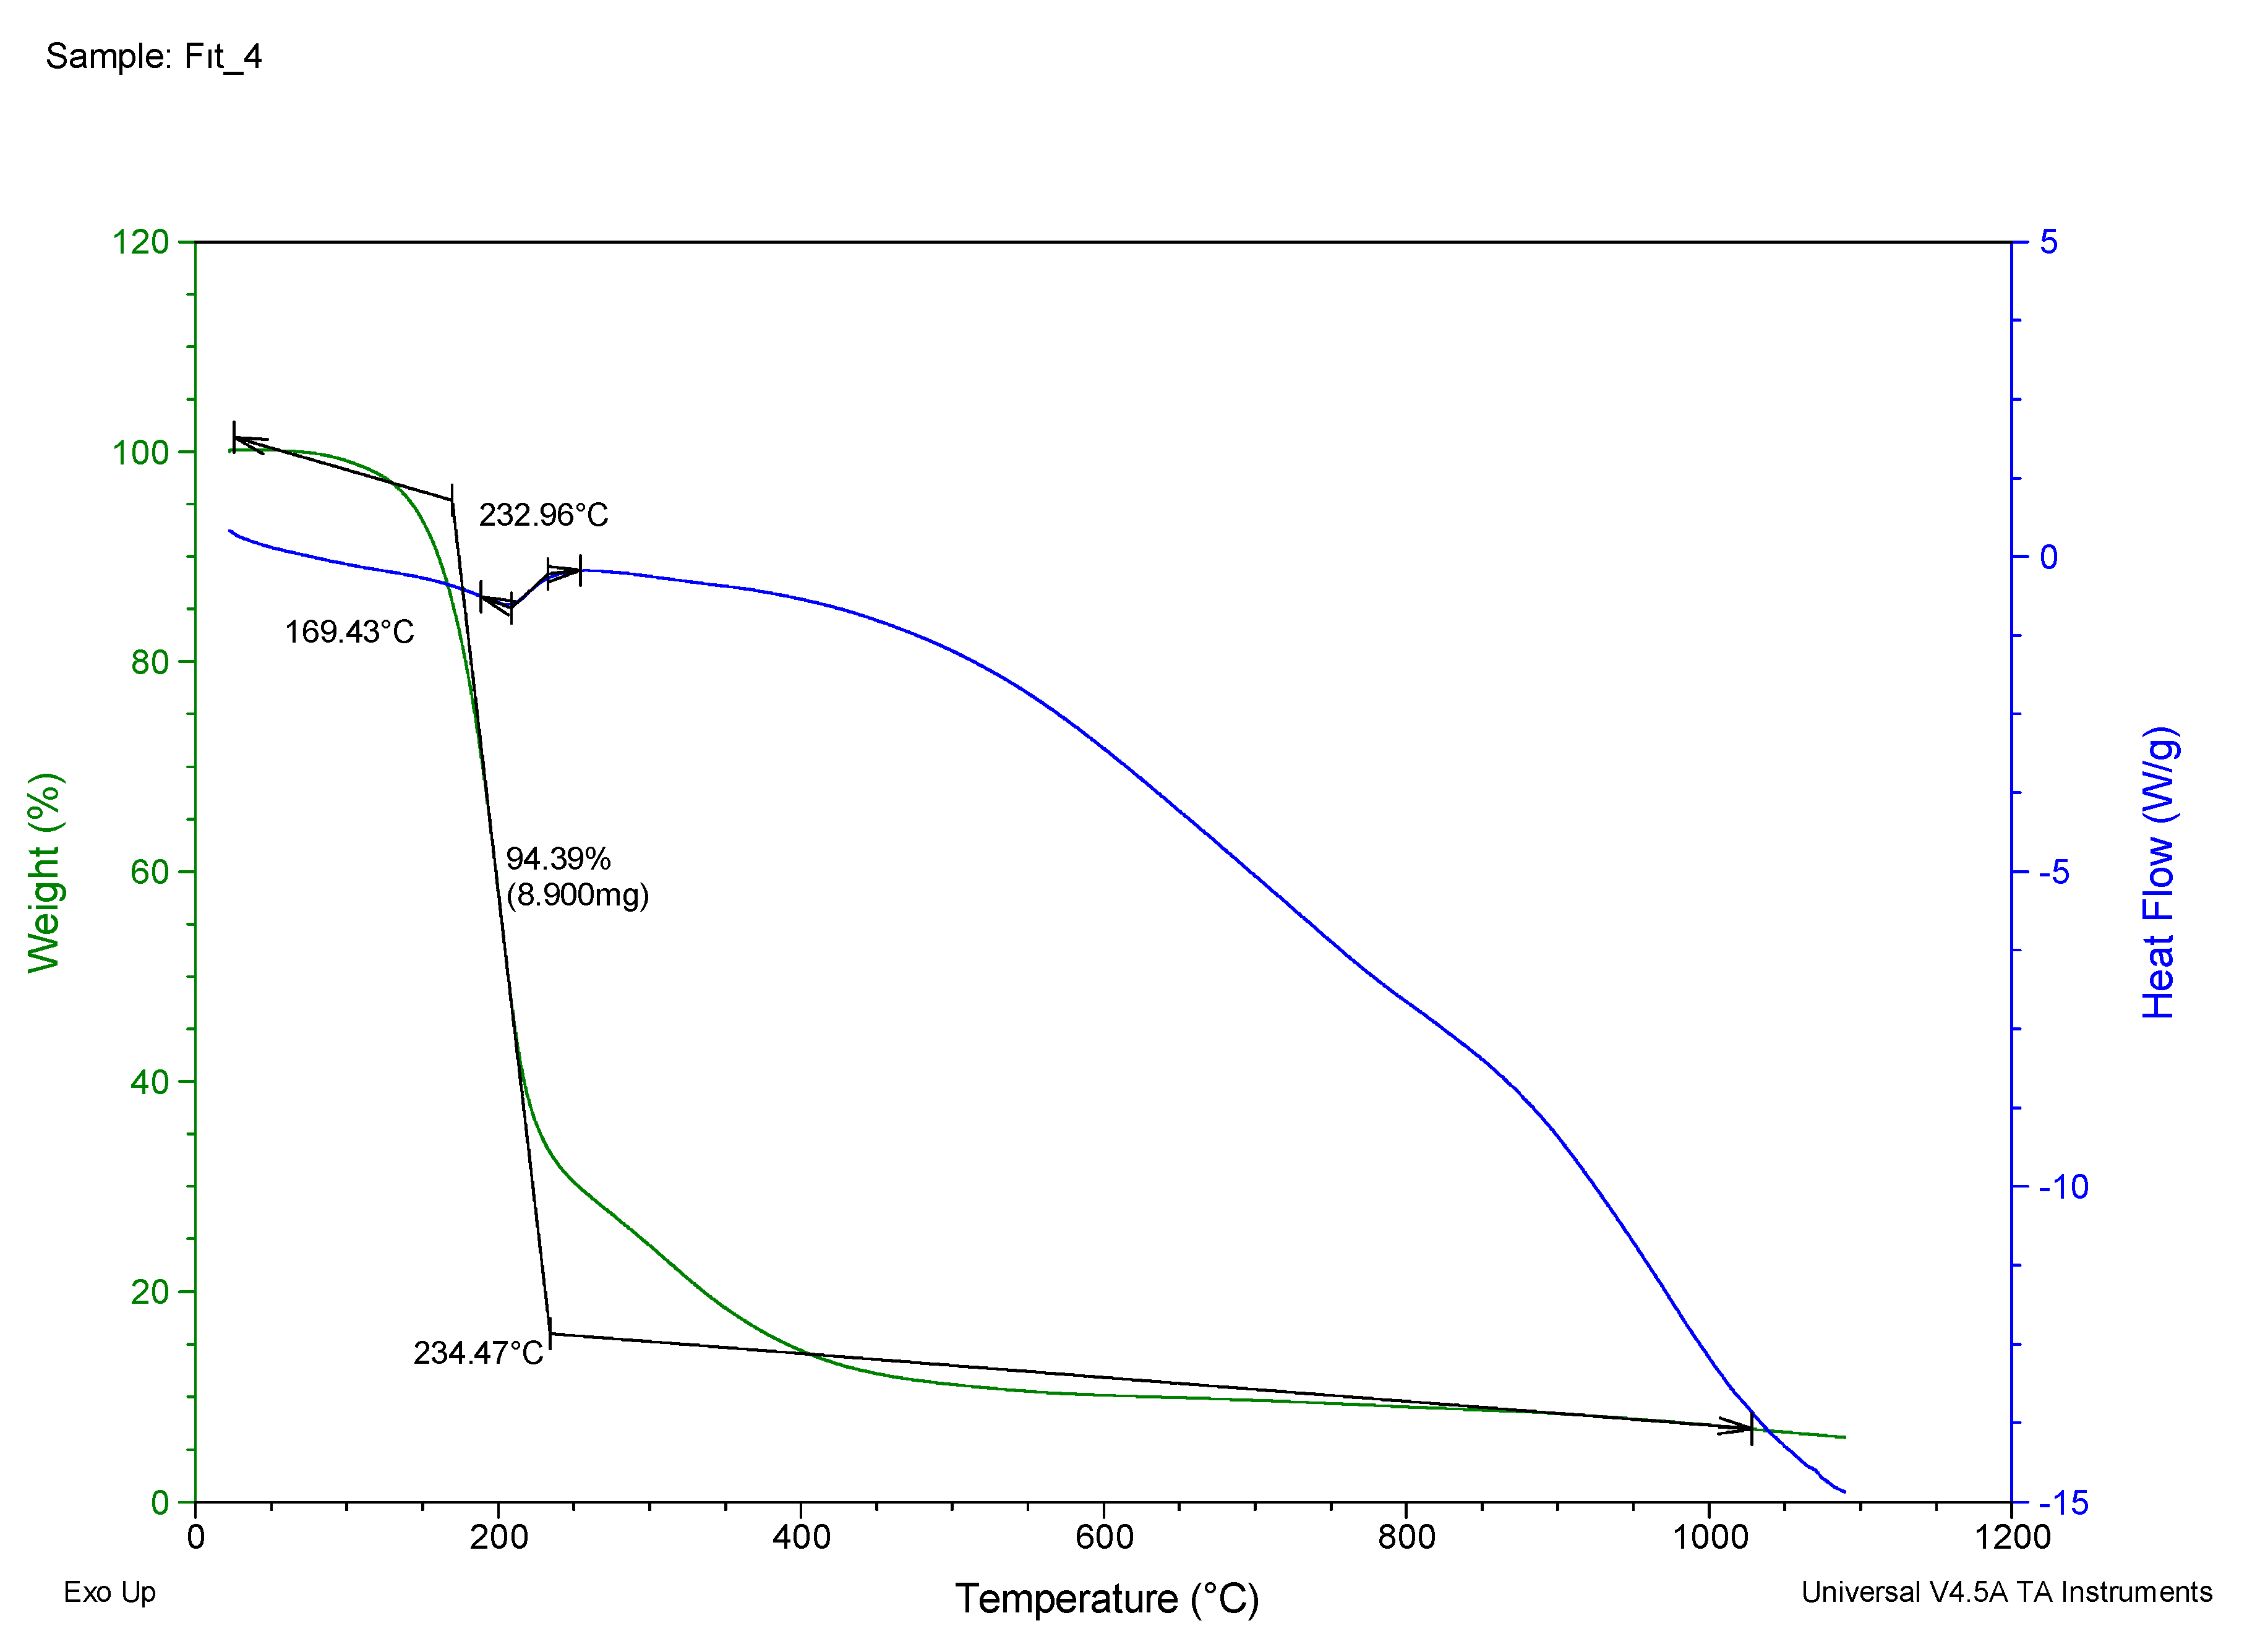
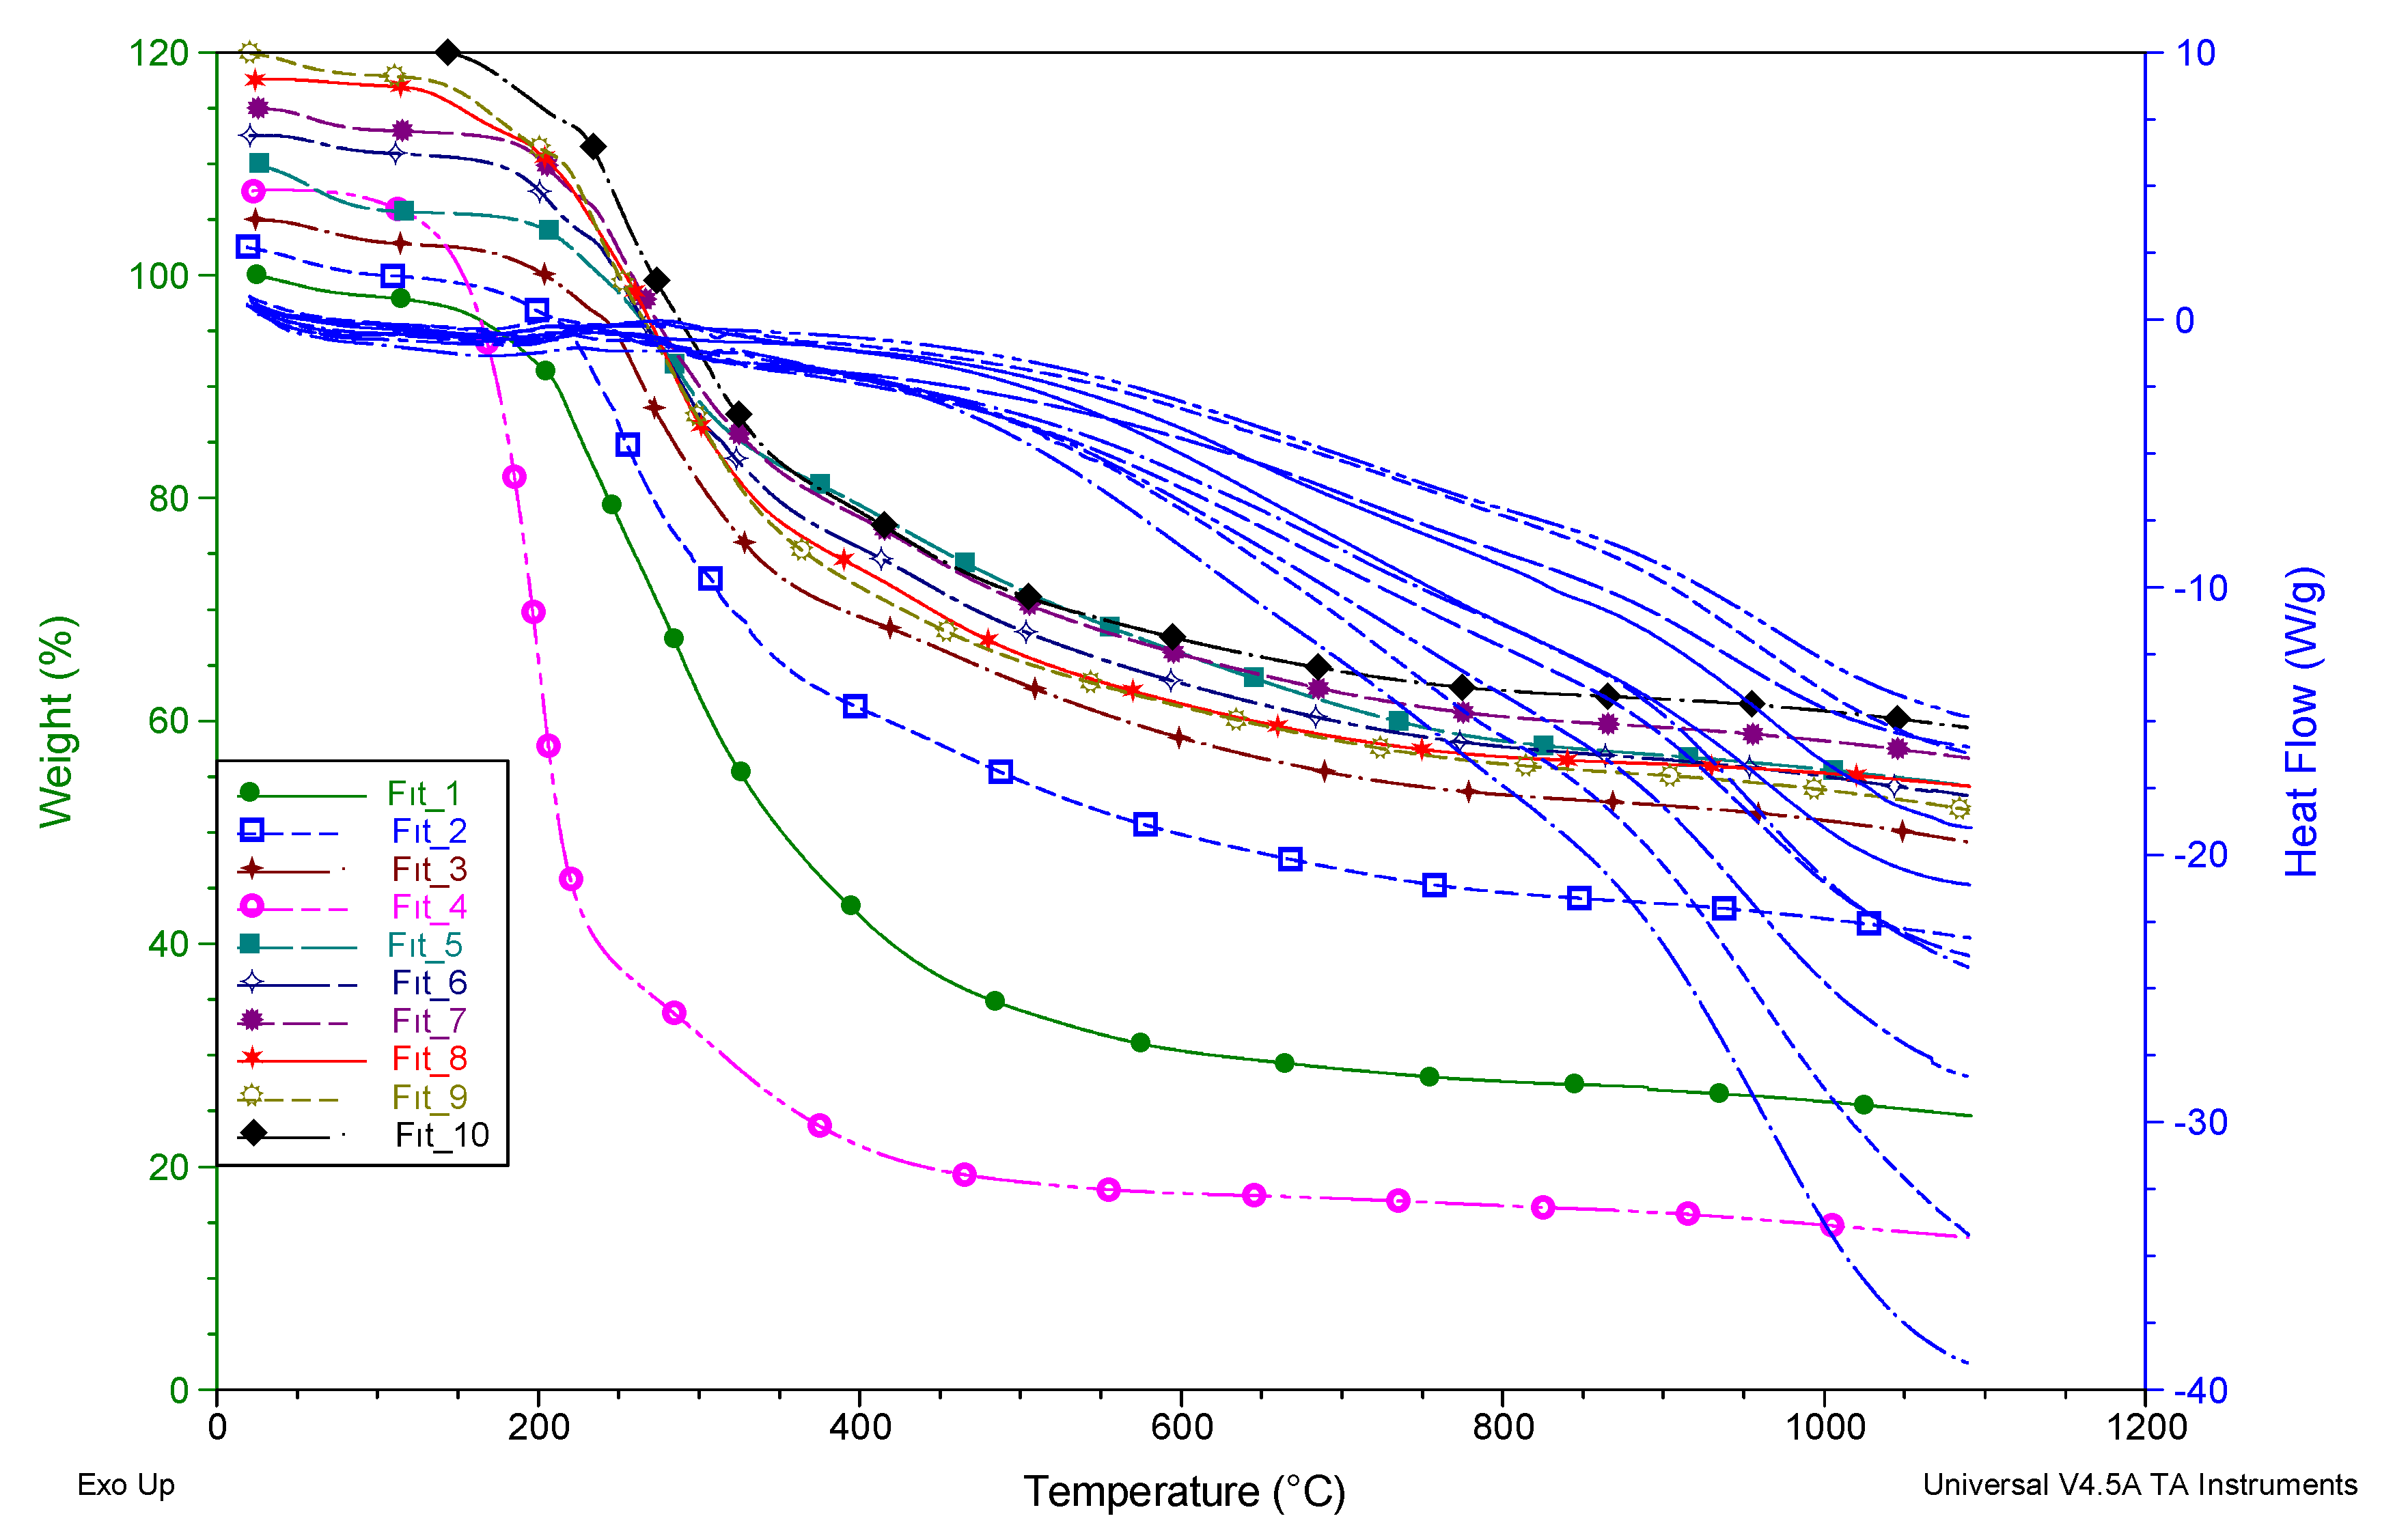
Thermal properties such as onset temperature (Ton), weight loss% values, and melting point temperature (Tm) values were obtained from TGA-DSC analysis, and these values were calculated from thermal curves. The thermal analysis curve of compound 4 and the calculation results for all of them are shown in Figure 6 and Table 9, respectively. The TGA curve of compound 4 showed a single decomposition step. The step was at a temperature range of 169.43–234.47 °C, and it suited the loss of the thiocarbohydrazone group (94.39%, 8.9 mg). The Tm values of thiocarbohydrazones (1-10) were calculated as 205.26, 214.01, 241.44, 232.96, 261.42, 239.74, 231.96, 298.97, 212.59, and 295.93 C, respectively. Ton values of thiocarbohydrazones (1-10) were calculated as 195.69, 200.98, 228.08, 169.43, 236.94, 211.38, 217.53, 207.42, 200.22, and 211.37 °C, respectively. It is seen from the TGA curves in Figure 7 that all of the thiocarbohydrazones have a degradation step (between 25 and 1100 °C). The weight loss% values of Schiff bases were found to be 74.20, 58.42, 54.63, 94.39, 54.93, 58.83, 58.02, 63.82, 65.13, and 61.56%, respectively. The TGA results were evaluated according to the literature [59,60,61]. Please refer to the supplementary material for further details.

3.7. Molecular Docking and Urease Inhibition

Urease is a crucial enzyme in the metabolic system that is related to the hydrolysis of urea. It is critical to discover compounds that can control this enzyme's activity. In general, the series of samples gave high molecular docking results with the urease enzyme between -153 to -189 MolDock scores. This indicates that the interaction between these compounds and the protein proceeds smoothly. However, the highest value was recorded by compound 4 with a MolDock score of -189.
Table 10. Moldock scores and inhibition activity values (IC50: µg/mL) for the samples with the urease.
Comp. 1 2 3 4 5 6 7 8 9 10 thiourea
MolDock Score -160 -171 -175 -189 -161 -177 -170 -153 -175 -186 -
IC50 (µg/mL) 88.11±1.95 39.00±1.17 39.86±1.04 20.79±0.68 39.89±0.40 31.28±0.00 45.78±0.40 84.97±1.07 38.01±0.37 27.11±0.00 37.13±1.38
As for the nature of the interactions, they were as follows: the interaction of the first compound 1 with urease was produced through nine bonds as: two conventional H-bonds with GLY641 and GLU642 residues, C-H bonds with THR715, two pi-donor H-bonds with VAL640 and SER645 residues, four pi-alkyl hydrophobic interactions with ARG639, VAL640, LYS716 and MET746 residues Figure 8.
The interaction between compound 2 and urease was produced through nineteen bonds as follow; seven conventional H-bonds with VAL640, GLU642, SER421, SER421, GLY638, PRO717 and ASP730 residues, two C-H bonds with SER634 and SER421 residues, a pi-cation electrostatic interaction with LYS716, pi-anion electrostatic interaction with GLU418 residue, two pi-sulfur interactions with CYS412 and PHE838 residues, pi-pi T-shaped hydrophobic interaction with PHE838 residue, four pi-alkyl hydrophobic interactions with LEU415, VAL640, LYS716 and MET746 residues Figure 9.
The interaction between compound 3 and urease formed via eleven interactions as follow; conventional H-bond with ASP730 residue, two C-H bonds with MET637 and SER421 residues, pi-anion electrostatic interaction with GLU642 residue, two pi-sulfur interactions with MET588 and PHE838 residues, amide-pi stacked hydrophobic interaction with MET637:C, O; GLY638: N residues, four pi-alkyl hydrophobic interactions with ARG639, ARG639, LYS716 and MET746 residues Figure 10.
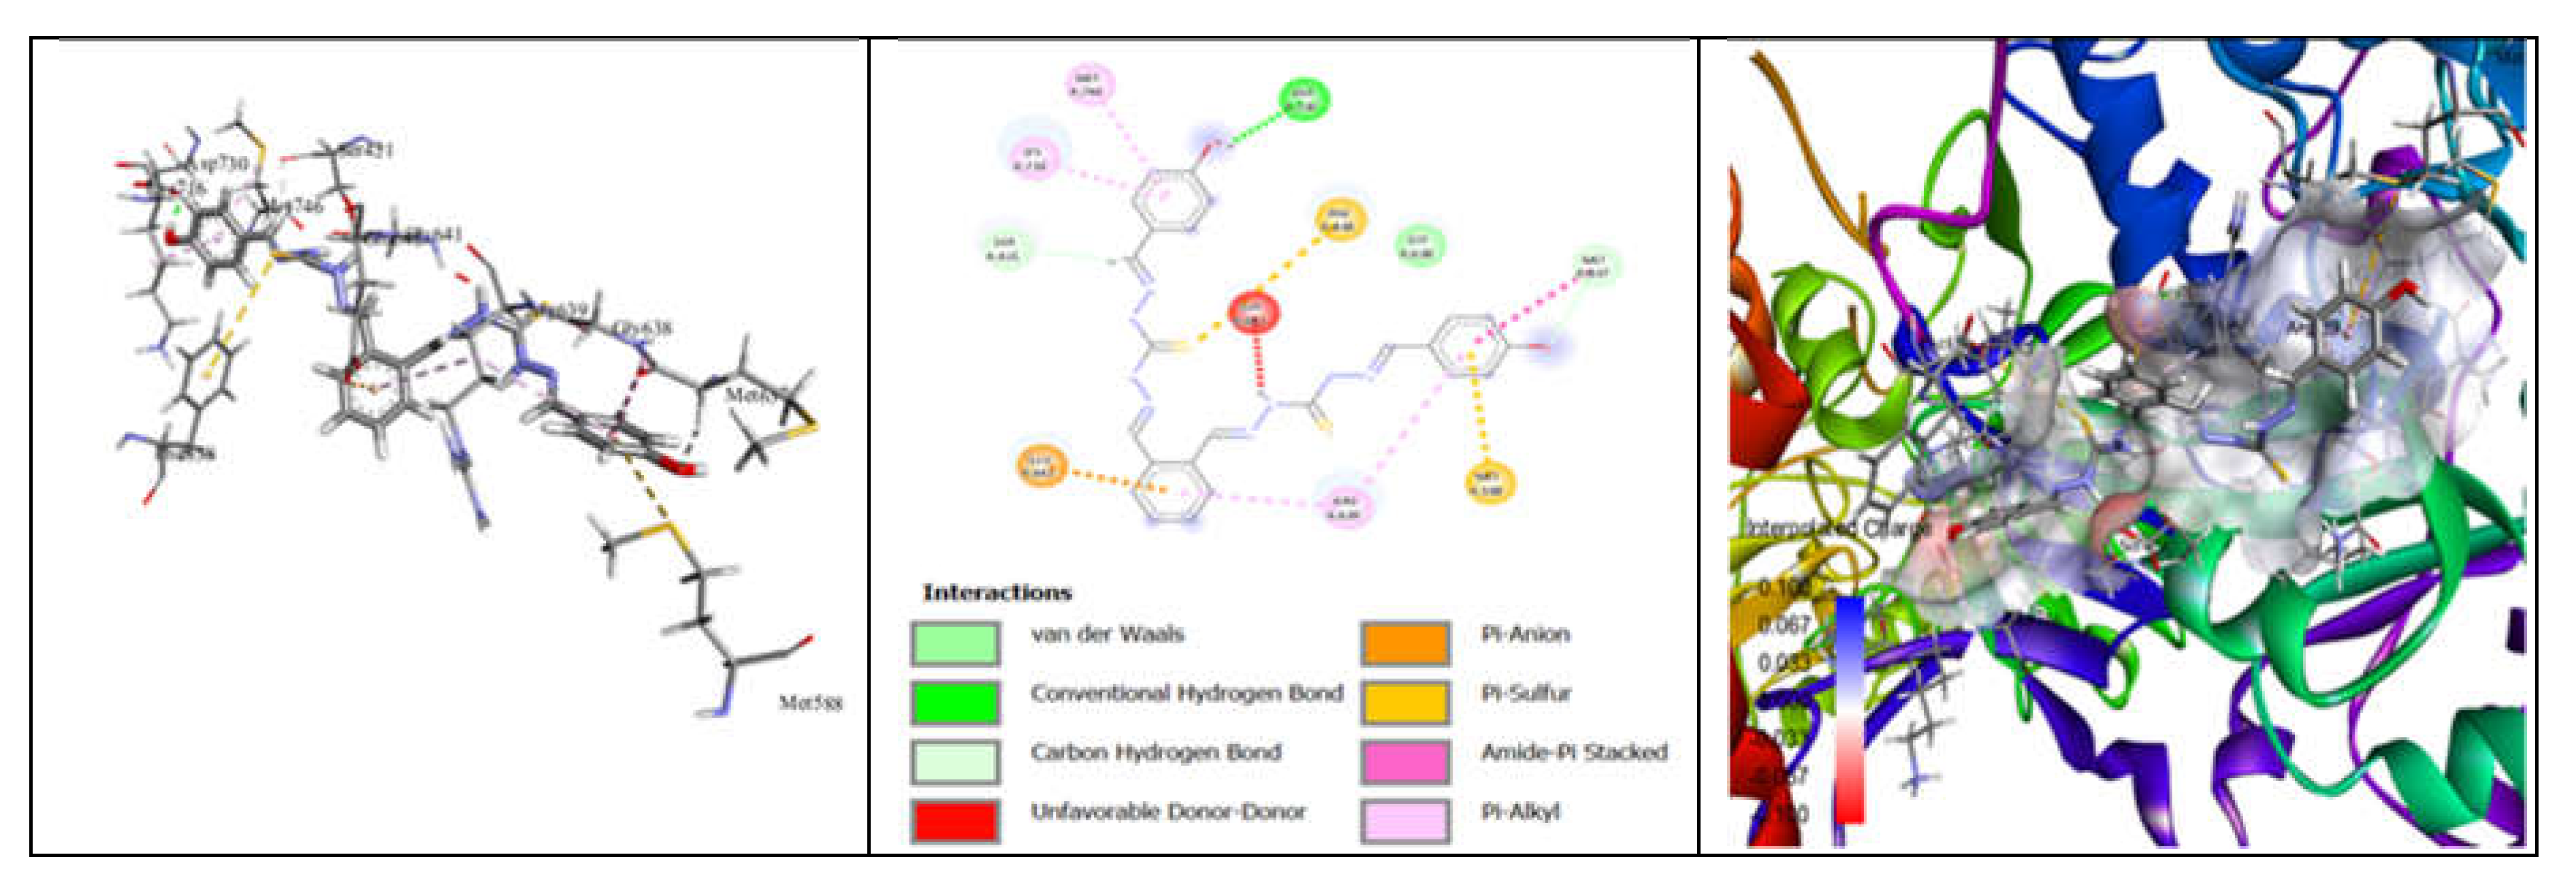
Compound 4 has interacted with urease within sixteen bonds as follows; four conventional H-bonds with GLY641, GLU418, SER421, and SER421 residues, C-H bond with GLY641 residue, pi-cation electrostatic interaction with GLY641 residue, two pi-anion electrostatic interactions with ASP730 and ASP730 residues, two pi-sulfur interactions with CYS412 residue, pi-pi stacked hydrophobic interaction with PHE712 residue, five pi-alkyl hydrophobic interactions with LEU415, VAL640, LYS716 and LEU415 residues Figure 11.
The interaction between compound 5 and urease via thirteen bonds as follows; four conventional H-bonds with MET746, SER421, SER421 and THR715 residues, two C-H bonds with MET746 and GLY641 residues, two pi-cation electrostatic interactions with LYS716 and ARG747 residues, pi-anion electrostatic interaction with ASP730 residue, pi-sigma interaction with LYS716 residue, three pi-alkyl hydrophobic interactions with MET746, LYS745 and ARG747 residues Figure 12.
The interaction between compound 6 and urease via thirteen bonds as follows; two conventional H-bonds with SER421 and GLU418 residues, five C-H bonds with THR715, VAL744, GLY714, GLY641 and THR715 residues, pi-cation electrostatic interaction with LYS716 residue, two pi-anion electrostatic interactions with GLU418 and ASP730 residues, pi-sigma hydrophobic interaction with LYS716 residue, pi-lone pair interaction GLY641 residue, alkyl hydrophobic interaction with ILE644 residue Figure 13.
Compound 7 has interacted with urease within fourteen bonds as follows; attractive charge (salt bridge) electrostatic interaction with GLU418 residue, attractive charge electrostatic interaction with GLU642 residue, two conventional H-bonds with GLU642 residue, two C-H bonds with GLY642 and ASP730 residues, pi-anion electrostatic interaction with PHE840 residue, pi-donor H-bond with GLY641 residue, two alkyl interactions with LYS716 and LEU839 residues, four pi-alkyl hydrophobic interactions with ARG639, VAL640, LYS716 and MET746 residues Figure 14.
The interaction between compound 8 and urease was created through twelve interactions as follows; four conventional H-bonds with MET746, SER421, THR715, and GLU418 residues, C-H bond with GLU642 residue, pi-cation electrostatic interaction with LYS716 residue, pi-anion electrostatic interaction with GLU418 residue, pi-donor H-bond with MET746 residue, pi-sigma hydrophobic interaction with LYS746 residue, pi-pi T-shaped interaction with PHE838 residue, two pi-alkyl hydrophobic interaction with PHE838 residue Figure 15.
The interaction between compound 9 and urease was generated through eleven interactions as follows; three conventional H-bonds with GLU418, GLU418, and PRO717 residues, pi-pi T-shaped hydrophobic interaction with TRP728 residue, three alkyl hydrophobic interactions with LYS716, MET746 and PRO748 residues, four pi-alkyl hydrophobic interactions with TRP728, LYS716, PRO717 and MET746 residues Figure 16.
The interaction between compound 10 and urease was created via seventeen interactions as follows; three conventional H-bonds with SER645, ARG835, and GLY641 residues, six C-H bonds with SER834, GLY641, SER834, PHE840, PRO717 and ASP730 residues, pi-anion electrostatic interaction with PHE840 residue, pi-pi stacked electrostatic interaction with PHE838 residue, two alkyl hydrophobic interactions with LYS716 and MET746 residues, four pi-alkyl hydrophobic interactions with PHE838, ARG835, LYS716 and MET746 residues Figure 17.

3.8. Pharmacokinetic Properties

Since the enzyme urease occupies a location in the human digestive system, it is natural for us to test whether our compounds have the ability to reach the digestive system and how the substances will behave within the system. Compounds were examined for adherence to MW, TPSA, n-ON receptor, and n-OHNH donors. Furthermore, the permeability level (Log Kp) in both the epidermis layer and the blood-brain barrier, as well as the solubility and absorption capacity in human gastrointestinal cells, have been evaluated for each of them (Table 11). However, our results show that the properties of all compounds were investigated in terms of MW, TPSA, H-bonds acceptors, and donors’ conformance. In addition, blood-brain barrier permeability, solubility, and the ability to be absorbed by human intestinal cells. In general, our results provide information about the synthesized molecules' absorption, distribution, metabolism and excretion. The majority of the compounds with acquired ADME parameters were found to be within acceptable boundaries and did not vary from Lipinski's rules.
Table 11. Basic physicochemical properties and computational descriptors of the screened compounds.
Comp. Physicochemical Properties Pharmacokinetic Properties Drug-likeness Lipophilicity Solubility
M.wt TPSA HBA HBD GI absorption Log Kp BBB Druglike score MolLogP MolLogS (mg/L)
1 486.62 146.1 4 4 Low -6.04 2.05 -1.27 6.55 0.17
2 518.61 202.2 6 6 Low -6.74 1.50 -1.05 6.94 0.31
3 518.61 202.2 6 6 Low -6.74 1.17 -0.74 5.42 1.41
4 568.73 161.74 4 4 Low -4.87 1.03 -0.98 9.26 0.05
5 550.61 242.66 8 8 Low -7.44 1.08 -0.64 5.91 0.74
6 587.67 220.66 8 6 Low -7.15 1.00 -0.77 6.40 0.79
7 587.67 220.66 8 6 Low -7.15 1.00 -0.75 7.10 0.69
8 587.67 220.66 8 6 Low -7.15 1.00 -0.71 6.59 0.66
9 606.72 220.66 8 6 Low -6.8 0.93 -0.40 7.59 0.72
10 638.72 239.12 10 6 Low -7.55 0.87 -0.61 4.62 28.80
Rule ≤500 <140 <10 <5 - -(3-5) 0-6 - <5 -

4. Conclusions

The paper presents the preparation of novel thiosemicarbazones, including Schiff bases, with satisfactory yields ranging from 55% to 87%. The products underwent various characterization methods including UV–Vis, FT-IR, 1H NMR, 13C NMR, elemental analyses, and TGA-DSC analyses. The results of our inhibition study aligned perfectly with the findings from the molecular docking analysis of these compounds against the urease enzyme. Compound 4 exhibited the strongest inhibition activity against the enzyme, while compounds 6 and 10 also demonstrated significant inhibition. Furthermore, the results for compounds 2, 3, 5, and 9 exhibited a remarkable similarity. This similarity was also observed when comparing the results of the molecular docking for these compounds. Based on the molecular docking results, it can be inferred that these compounds have the ability to hinder the effectiveness of urease by interacting with the enzyme. In addition, when compared to thiourea, which is considered the reference inhibitor for this enzyme, compounds 4, 6, and 10 showed higher results. On the other hand, compounds 2, 3, 5, and 9 exhibited nearly identical inhibition values to the inhibitor. Pharmacokinetic properties of compound 1 and compound 4 fall within the acceptable range according to major rules. Additionally, compound 10 exhibits the highest solubility among all tested compounds and falls within the acceptable lipophilicity range. Molecules shattered many of the established boundaries. Nevertheless, some of the findings from the ADMET investigation suggest that substances that show promise in inhibiting the tested enzyme in laboratory tests could be explored as potential drugs for treating various conditions caused by excessive urease activity.

Supplementary Materials

The following supporting information can be downloaded at the website of this paper posted on Preprints.org. Figure S1: IR spectrum of compound 1. Figure S2: IR spectrum of compound 2. Figure S3: IR spectrum of compound 3. Figure S4: IR spectrum of compound 5. Figure S5: IR spectrum of compound 6. Figure S6: IR spectrum of compound 7. Figure S7: IR spectrum of compound 8. Figure S8: IR spectrum of compound 9. Figure S9: IR spectrum of compound 10. Figure S10: 1H NMR spectrum of compound 1. Figure S11: 1H NMR spectrum of compound 2. Figure S12: 1H NMR spectrum of compound 3. Figure S13: 1H NMR spectrum of compound 5. Figure S14: 1H NMR spectrum of compound 6. Figure S15: 1H NMR spectrum of compound 7. Figure S16: 1H NMR spectrum of compound 8. Figure S17: 1H NMR spectrum of compound 9. Figure S18: 1H NMR spectrum of compound 10. Figure S19: 13C NMR spectrum of compound 1. Figure S20: 13C NMR spectrum of compound 2. Figure S2: 13C NMR spectrum of compound 3. Figure S22: 13C NMR spectrum of compound 5. Figure S23: 13C NMR spectrum of compound 6. Figure S24: 13C NMR spectrum of compound 7. Figure S25: 13C NMR spectrum of compound 8. Figure S26: 13C NMR spectrum of compound 9. Figure S27: 13C NMR spectrum of compound 10. Figure S28: UV-Vis spectrum of compound 1 in DMSO. Figure S29: UV-Vis spectrum of compound 2 in DMSO. Figure S30: UV-Vis spectrum of compound 3 in DMSO. Figure S31: UV-Vis spectrum of compound 5 in DMSO. Figure S32: UV-Vis spectrum of compound 6 in DMSO. Figure S33: UV-Vis spectrum of compound 7 in DMSO. Figure S34: UV-Vis spectrum of compound 8 in DMSO. Figure S35: UV-Vis spectrum of compound 9 in DMSO. Figure S36: UV-Vis spectrum of compound 10 in DMSO. Figure S37: TGA and DSC curves for synthesized compound 1. Figure S38: TGA and DSC curves for synthesized compound 2. Figure S39: TGA and DSC curves for synthesized compound 3. Figure S40: TGA and DSC curves for synthesized compound 5. Figure S41: TGA and DSC curves for synthesized compound 6. Figure S42: TGA and DSC curves for synthesized compound 7. Figure S43: TGA and DSC curves for synthesized compound 8. Figure S44: TGA and DSC curves for synthesized compound 9. Figure S45: TGA and DSC curves for synthesized compound 10.

Funding

This research received no external funding.

Institutional Review Board Statement

Not applicable.

Informed Consent Statement

Not applicable.

Data Availability Statement

Data are contained within the article.

Conflicts of Interest

The author declares no conflict of interest.

References

  1. Da Silva, C.M.; Da Silva, D.L.; Modolo, L. V.; Alves, R.B.; De Resende, M.A.; Martins, C.V.B.; De Fátima, Â. Schiff Bases: A Short Review of Their Antimicrobial Activities. Journal of Advanced Research 2011, 2, 1–8. [Google Scholar] [CrossRef]
  2. Abou-Melha, K.S.; Faruk, H. Bimetallic Complexes of Schiff Base Bis-[4-Hydroxycuomarin-3-Yl]- 1N,5N-Thiocarbohydrazone as a Potentially Dibasic Pentadentate Ligand. Synthesis, Spectral, and Antimicrobial Properties. Journal of the Iranian Chemical Society 2008, 5, 122–134. [Google Scholar] [CrossRef]
  3. Ahamad, I.; Prasad, R.; Quraishi, M.A. Experimental and Quantum Chemical Characterization of the Adsorption of Some Schiff Base Compounds of Phthaloyl Thiocarbohydrazide on the Mild Steel in Acid Solutions. Materials Chemistry and Physics 2010, 124, 1155–1165. [Google Scholar] [CrossRef]
  4. Aly, A.A.; Abdallah, E.M.; Ahmed, S.A.; Awad, M.K.; Rabee, M.M.; Mostafa, S.M.; Bräse, S. Metal Complexes of New Thiocarbohydrazones of Cu(I), Co(II), and Ni(II); Identification by NMR, IR, Mass, UV Spectra, and DFT Calculations. Journal of Sulfur Chemistry 2023, 44, 282–303. [Google Scholar] [CrossRef]
  5. EL-Mahdy, K.M.; El-Kazak, A.M.; Abdel-Megid, M.; Seada, M.; Farouk, O. Synthesis, Characterization and Antimicrobial Activities of Some New Heterocyclic Schiff Bases Derived from Thiocarbohydrazide. Acta Chimica Slovenica 2016, 63, 18–25. [Google Scholar] [CrossRef]
  6. Gupta, A.K.; Prachand, S. Thiol Derivatives and Antifungal Activity. International Journal of Pharmacy & Life Sciences 2012, 3, 1848–1857. [Google Scholar]
  7. Hameed, A.; al-Rashida, M.; Uroos, M.; Abid Ali, S.; Khan, K.M. Schiff Bases in Medicinal Chemistry: A Patent Review (2010-2015). Expert Opinion on Therapeutic Patents 2017, 27, 63–79. [Google Scholar] [CrossRef] [PubMed]
  8. Kajal, A.; Bala, S.; Kamboj, S.; Sharma, N.; Saini, V. Schiff Bases: A Versatile Pharmacophore. Journal of Catalysts 2013, 2013, 1–14. [Google Scholar] [CrossRef]
  9. Kalem, E.; Ağar, E. Schiff Bazlarinin Biyolojik Aktivitesi Biological Activity of Schiff Bases Öz : Abstract : 2021, 8, 57–76.
  10. Khan, S.A.; Kumar, P.; Joshi, R.; Iqbal, P.F.; Saleem, K. Synthesis and in Vitro Antibacterial Activity of New Steroidal Thiosemicarbazone Derivatives. European Journal of Medicinal Chemistry 2008, 43, 2029–2034. [Google Scholar] [CrossRef]
  11. Manjunatha, M.; Naik, V.H.; Kulkarni, A.D. Activities , and Spectroscopic Studies of Co ( II ), Ni ( II ), and Cu ( II ) Complexes of Biologically Potential Coumarin Schiff Bases. 2011, 64, 4264–4275.
  12. Rana, K.; Pandurangan, A.; Singh, N.; Tiwari, A.K. A Systemic Review of Schiff Bases as an Analgesic, Anti-Inflammatory. Academic Sciences 2012, 4, 5–11. [Google Scholar]
  13. Sathisha, M.P.; Revankar, V.K.; Pai, K.S.R. Synthesis, Structure, Electrochemistry, and Spectral Characterization of Bis-Isatin Thiocarbohydrazone Metal Complexes and Their Antitumor Activity against Ehrlich Ascites Carcinoma in Swiss Albino Mice. Metal-Based Drugs 2008, 2008. [Google Scholar] [CrossRef] [PubMed]
  14. Tribak, Z.; Chda, A.; Skalli, M.K.; Haoudi, A.; Rodi, Y.K.; Senhaji, O.; Essassi, E.M.; Cheikh, R. Ben; EL Abida, K. Theoretical Approach Using DFT and Muscle Relaxant Effects of 5-Chloroisatin Derivatives. International Journal of Chemistry and Technology 2018, 2, 105–115. [Google Scholar] [CrossRef]
  15. Tuli, H.S.; Rani, A.; Kumar, M.; Khare, R. Schiff Bases as an Antimicrobial Agent: A Review Anti-Neoplastic Effects of Garcinol View Project Schiff Bases as an Antimicrobial Agent: A Review. Journal of Biological and Chemical Sciences 2015, 2, 62–91. [Google Scholar]
  16. Utreja, D.; Vibha, B.S.P.; Singh, S.; Kaur, M. Schiff Bases and Their Metal Complexes as Anti-Cancer Agents: A Review. Current Bioactive Compounds 2015, 11, 215–230. [Google Scholar] [CrossRef]
  17. Mathew, B.; Suresh, J.; Anbazhagan, S. Synthesis, in Silico Preclinical Evaluation, Antidepressant Potential of 5-Substituted Phenyl-3-(Thiophen-2-Yl)-4,5-Dihydro-1h-Pyrazole-1-Carboxamides. Biomedicine and Aging Pathology 2014, 4, 327–333. [Google Scholar] [CrossRef]
  18. Çavuş, M.S.; Yakan, H.; Özorak, C.; Muğlu, H.; Bakır, T.K. New N,N’-Bis(Thioamido)Thiocarbohydrazones and Carbohydrazones: Synthesis, Structure Characterization, Antioxidant Activity, Corrosion Inhibitors and DFT Studies. Research on Chemical Intermediates 2022, 48, 1593–1613. [Google Scholar] [CrossRef]
  19. Shen, X.; Zhang, Z.; Cheng, C.; Liu, C.; Ma, N.; Sun, D.; Li, D.; Wang, C. Bone Regeneration and Antibacterial Properties of Calcium-Phosphorus Coatings Induced by Gentamicin-Loaded Polydopamine on Magnesium Alloys. Biomedical Technology 2024, 5, 87–101. [Google Scholar] [CrossRef]
  20. Abu-Hussen, A.A.A.; Emara, A.A.A. Metal Complexes of Some Thiocarbohydrazone Ligands: Synthesis and Structure. Journal of Coordination Chemistry 2004, 57, 973–987. [Google Scholar] [CrossRef]
  21. Blumenkopf, T.A.; Harrington, J.A.; Koble, C.S.; Bankston, D.D.; Morrison, R.W.; Bigham, E.C.; Styles, V.L.; Spector, T. 2-Acetylpyridine Thiocarbonohydrazones. Potent Inactivators of Herpes Simplex Virus Ribonucleotide Reductase. Journal of Medicinal Chemistry 1992, 35, 2306–2314. [Google Scholar] [CrossRef]
  22. Bonaccorso, C.; Marzo, T.; La Mendola, D. Biological Applications of Thiocarbohydrazones and Their Metal Complexes: A Perspective Review. Pharmaceuticals 2020, 13. [Google Scholar] [CrossRef]
  23. Mosa, A.I.; Emara, A.A.A.; Yousef, J.M.; Saddiq, A.A. Novel Transition Metal Complexes of 4-Hydroxy-Coumarin-3- Thiocarbohydrazone: Pharmacodynamic of Co(III) on Rats and Antimicrobial Activity. Spectrochimica Acta - Part A: Molecular and Biomolecular Spectroscopy 2011, 81, 35–43. [Google Scholar] [CrossRef] [PubMed]
  24. Ebrahim Tehrani, K.H.M.; Kobarfard, F.; Azerang, P.; Mehravar, M.; Soleimani, Z.; Ghavami, G.; Sardari, S. Synthesis and Antimycobacterial Activity of Symmetric Thiocarbohydrazone Derivatives against Mycobacterium Bovis BCG. Iranian Journal of Pharmaceutical Research 2013, 12, 331–346. [Google Scholar]
  25. Jarrahpour, A.; Sheikh, J.; Mounsi, I. El; Juneja, H.; Hadda, T. Ben Computational Evaluation and Experimental in Vitro Antibacterial, Antifungal and Antiviral Activity of Bis-Schiff Bases of Isatin and Its Derivatives. Medicinal Chemistry Research 2013, 22, 1203–1211. [Google Scholar] [CrossRef]
  26. Papadakis, M.; Barrozo, A.; Delmotte, L.; Straistari, T.; Shova, S.; Réglier, M.; Krewald, V.; Bertaina, S.; Hardré, R.; Orio, M. How Metal Nuclearity Impacts Electrocatalytic H2 Production in Thiocarbohydrazone-Based Complexes. Inorganics 2023, 11, 1–19. [Google Scholar] [CrossRef]
  27. Cvijetić, I.N.; Herlah, B.; Marinković, A.; Perdih, A.; Bjelogrlić, S.K. Phenotypic Discovery of Thiocarbohydrazone with Anticancer Properties and Catalytic Inhibition of Human DNA Topoisomerase IIα. Pharmaceuticals 2023, 16, 341. [Google Scholar] [CrossRef] [PubMed]
  28. Ibrahim, A.A.; Kareem, M.M.; Al-Noor, T.H.; Al-Muhimeed, T.; Alobaid, A.A.; Albukhaty, S.; Sulaiman, G.M.; Jabir, M.; Taqi, Z.J.; Sahib, U.I. Pt(Ii)-Thiocarbohydrazone Complex as Cytotoxic Agent and Apoptosis Inducer in Caov-3 and Ht-29 Cells through the P53 and Caspase-8 Pathways. Pharmaceuticals 2021, 14. [Google Scholar] [CrossRef] [PubMed]
  29. Shebl, M.; Khalil, S.M.E.; Al-Gohani, F.S. Preparation, Spectral Characterization and Antimicrobial Activity of Binary and Ternary Fe(III), Co(II), Ni(II), Cu(II), Zn(II), Ce(III) and UO 2(VI) Complexes of a Thiocarbohydrazone Ligand. Journal of Molecular Structure 2010, 980, 78–87. [Google Scholar] [CrossRef]
  30. Cândido-Bacani, P. de M.; Reis, M.B. dos; Serpeloni, J.M.; Calvo, T.R.; Vilegas, W.; Varanda, E.A.; Cólus, I.M. de S. Mutagenicity and Genotoxicity of Isatin in Mammalian Cells in Vivo. Mutation Research - Genetic Toxicology and Environmental Mutagenesis 2011, 719, 47–51. [Google Scholar] [CrossRef]
  31. Bonaccorso, C.; Grasso, G.; Musso, N.; Barresi, V.; Condorelli, D.F.; La Mendola, D.; Rizzarelli, E. Water Soluble Glucose Derivative of Thiocarbohydrazone Acts as Ionophore with Cytotoxic Effects on Tumor Cells. Journal of Inorganic Biochemistry 2018, 182, 92–102. [Google Scholar] [CrossRef]
  32. Gabr, M.T.; El-Gohary, N.S.; El-Bendary, E.R.; El-Kerdawy, M.M.; Ni, N. Isatin-β-Thiocarbohydrazones: Microwave-Assisted Synthesis, Antitumor Activity and Structure-Activity Relationship. European Journal of Medicinal Chemistry 2017, 128, 36–44. [Google Scholar] [CrossRef]
  33. Mousavi, S.N.; Bahrami, A.; Sadri, M.; Alipour, A. Optimization of an Ecofriendly Coating Containing Chitosan and Gelatin as Corrosion Inhibitor of Carbon Steel Grade E by Response Surface Method. Journal of Particle Science & Technology 2019, 5, 23–31. [Google Scholar] [CrossRef]
  34. Yakan, H.; Koçyiğit, Ü.M.; Muğlu, H.; Ergul, M.; Erkan, S.; Güzel, E.; Taslimi, P.; Gülçin, İ. Potential Thiosemicarbazone-Based Enzyme Inhibitors: Assessment of Antiproliferative Activity, Metabolic Enzyme Inhibition Properties, and Molecular Docking Calculations. Journal of Biochemical and Molecular Toxicology 2022, 36. [Google Scholar] [CrossRef] [PubMed]
  35. Aruoma, O.I.; Kaur, H.; Halliwell, B. Oxygen Free Radicals and Human Diseases. Journal of the Royal Society of Health 1991, 111, 172–177. [Google Scholar] [CrossRef] [PubMed]
  36. Mohammed, Z.H.; Ibraheem, R.M. Anti-Oxidant Activity of Methanol Extracts of Arum Maculatum L. and Physalis Peruviana L. Plants. Ibn Al-Haitham J. for Pure & Appl. Sci. 2015, 28, 1–7. [Google Scholar]
  37. Knothe, G. Some Aspects of Biodiesel Oxidative Stability ☆. 2007, 88, 669–677. [CrossRef]
  38. Di Meo, F.; Lemaur, V.; Cornil, J.; Lazzaroni, R.; Duroux, J.L.; Olivier, Y.; Trouillas, P. Free Radical Scavenging by Natural Polyphenols: Atom versus Electron Transfer. Journal of Physical Chemistry A 2013, 117, 2082–2092. [Google Scholar] [CrossRef] [PubMed]
  39. Marković, Z.; Đorović, J.; Petrović, Z.D.; Petrović, V.P.; Simijonović, D. Investigation of the Antioxidant and Radical Scavenging Activities of Some Phenolic Schiff Bases with Different Free Radicals. Journal of Molecular Modeling 2015, 21. [Google Scholar] [CrossRef] [PubMed]
  40. Saur, I.M.L.; Panstruga, R.; Schulze-Lefert, P. NOD-like Receptor-Mediated Plant Immunity: From Structure to Cell Death. Nature Reviews Immunology 2021, 21, 305–318. [Google Scholar] [CrossRef] [PubMed]
  41. BIOVIA, D.S. No Title 2017, 779.
  42. Zhang, L.; Mulrooney, S.B.; Leung, A.F.K.; Zeng, Y.; Ko, B.B.C.; Hausinger, R.P.; Sun, H. Inhibition of Urease by Bismuth(III): Implications for the Mechanism of Action of Bismuth Drugs. BioMetals 2006, 19, 503–511. [Google Scholar] [CrossRef] [PubMed]
  43. Yenigun, S.; Ipek, Y.; Marah, S.; Demirtas, I.; Ozen, T. DNA Protection, Molecular Docking, Antioxidant, Antibacterial, Enzyme Inhibition, and Enzyme Kinetic Studies for Parietin, Isolated from Xanthoria Parietina (L.) Th. Fr. Journal of Biomolecular Structure and Dynamics 2024, 42, 848–862. [Google Scholar] [CrossRef]
  44. Muğlu, H.; Yakan, H.; Misbah, A.G.A.; Çavuş, M.S.; Bakır, T.K. Synthesis, Structure Characterization and Quantum Chemical Study on Relationship between Structure and Antioxidant Properties of Novel Schiff Bases Bearing (Thio)/Carbohydrazones. Research on Chemical Intermediates 2021, 47, 4985–5005. [Google Scholar] [CrossRef]
  45. Yakan, H. Preparation, Structure Elucidation, and Antioxidant Activity of New Bis(Thiosemicarbazone) Derivatives. Turkish Journal of Chemistry 2020, 44, 1085–1099. [Google Scholar] [CrossRef] [PubMed]
  46. Harald Küppers DuMonts Farben-Atlas. Über 5500 Farbnuancen Mit Kennzeichnung Und Mischanleitung; DuMont Reiseverlag, Ed.; Ostfildern, 1978; ISBN 9783770110582.
  47. Arjunan, V.; Mohan, S.; Subramanian, S.; Thimme Gowda, B. Synthesis, Fourier Transform Infrared and Raman Spectra, Assignments and Analysis of N-(Phenyl)- and N-(Chloro Substituted Phenyl)-2,2-Dichloroacetamides. Spectrochimica Acta - Part A: Molecular and Biomolecular Spectroscopy 2004, 60, 1141–1159. [Google Scholar] [CrossRef] [PubMed]
  48. Berthomieu, C.; Hienerwadel, R. Fourier Transform Infrared (FTIR) Spectroscopy. Photosynthesis Research 2009, 101, 157–170. [Google Scholar] [CrossRef] [PubMed]
  49. Choudhary, N.; Bee, S.; Gupta, A.; Tandon, P. Comparative Vibrational Spectroscopic Studies, HOMO-LUMO and NBO Analysis of N-(Phenyl)-2,2-Dichloroacetamide, N-(2-Chloro Phenyl)-2,2-Dichloroacetamide and N-(4-Chloro Phenyl)-2,2-Dichloroacetamide Based on Density Functional Theory. Computational and Theoretical Chemistry 2013, 1016, 8–21. [Google Scholar] [CrossRef]
  50. Fábián, B.; Kudar, V.; Csámpai, A.; Nagy, T.Z.; Sohár, P. Synthesis, IR-, NMR-, DFT and X-Ray Study of Ferrocenyl Heterocycles from Thiosemicarbazones. Part 21: Study on Ferrocenes. Journal of Organometallic Chemistry 2007, 692, 5621–5632. [Google Scholar] [CrossRef]
  51. Lobana, T.S.; Sharma, R.; Bawa, G.; Khanna, S. Bonding and Structure Trends of Thiosemicarbazone Derivatives of Metals-An Overview. Coordination Chemistry Reviews 2009, 253, 977–1055. [Google Scholar] [CrossRef]
  52. Nuwan De Silva, N.W.S.V.; Albu, T. V. A Theoretical Investigation on the Isomerism and the NMR Properties of Thiosemicarbazones. Central European Journal of Chemistry 2007, 5, 396–419. [Google Scholar] [CrossRef]
  53. Srinivasan, B.R.; Raghavaiah, P.; Nadkarni, V.S. Reinvestigation of Growth of Urea Thiosemicarbazone Monohydrate Crystal. Spectrochimica Acta - Part A: Molecular and Biomolecular Spectroscopy 2013, 112, 84–89. [Google Scholar] [CrossRef] [PubMed]
  54. Wolinski, K.; Hinton, J.F.; Pulay, P. Efficient Implementation of the Gauge-Independent Atomic Orbital Method for NMR Chemical Shift Calculations. Journal of the American Chemical Society 1990, 112, 8251–8260. [Google Scholar] [CrossRef]
  55. Barreto Bastos, A.M.; De Carvalho Alcântara, A.F.; Beraldo, H. Structural Analyses of 4-Benzoylpyridine Thiosemicarbazone Using NMR Techniques and Theoretical Calculations. Tetrahedron 2005, 61, 7045–7053. [Google Scholar] [CrossRef]
  56. Ebrahimi, H.P.; Hadi, J.S.; Alsalim, T.A.; Ghali, T.S.; Bolandnazar, Z. A Novel Series of Thiosemicarbazone Drugs: From Synthesis to Structure. Spectrochimica Acta - Part A: Molecular and Biomolecular Spectroscopy 2015, 137, 1067–1077. [Google Scholar] [CrossRef] [PubMed]
  57. Venkatachalam, T.K.; Pierens, G.K.; Reutens, D.C. Synthesis, NMR Structural Characterization and Molecular Modeling of Substituted Thiosemicarbazones and Semicarbazones Using DFT Calculations to Prove the Syn/Anti Isomer Formation. Magnetic Resonance in Chemistry 2014, 52, 98–105. [Google Scholar] [CrossRef] [PubMed]
  58. Chee, D.N.A.; Affan, M.A.; Ahmad, F.B.; Asaruddin, M.R.; Sam, N.; Salam, M.A.; Ismail, A.; Tan, S.H. Synthesis, Characterization, and Antibacterial Activity of Organotin(IV) Complexes with 2-Hydroxyacetophenone Thiocarbohydrazone. Journal of Coordination Chemistry 2011, 64, 4191–4200. [Google Scholar] [CrossRef]
  59. Kaya, Y.; Erçağ, A.; Kaya, S.; Katin, K.P.; Atilla, D. New Mixed-Ligand Iron(III) Complexes Containing Thiocarbohydrazones: Preparation, Characterization, and Chemical Reactivity Analysis through Theoretical Calculations. Applied Organometallic Chemistry 2022, 36, 1–12. [Google Scholar] [CrossRef]
  60. Li, M.; Xu, J.; Li, R.; Wang, D.; Li, T.; Yuan, M.; Wang, J. Simple Preparation of Aminothiourea-Modified Chitosan as Corrosion Inhibitor and Heavy Metal Ion Adsorbent. Journal of Colloid and Interface Science 2014, 417, 131–136. [Google Scholar] [CrossRef]
  61. Siddiqi, K.S.; Khan, S.; Nami, S.A.A.; El-ajaily, M.M. Polynuclear Transition Metal Complexes with Thiocarbohydrazide and Dithiocarbamates. Spectrochimica Acta - Part A: Molecular and Biomolecular Spectroscopy 2007, 67, 995–1002. [Google Scholar] [CrossRef]
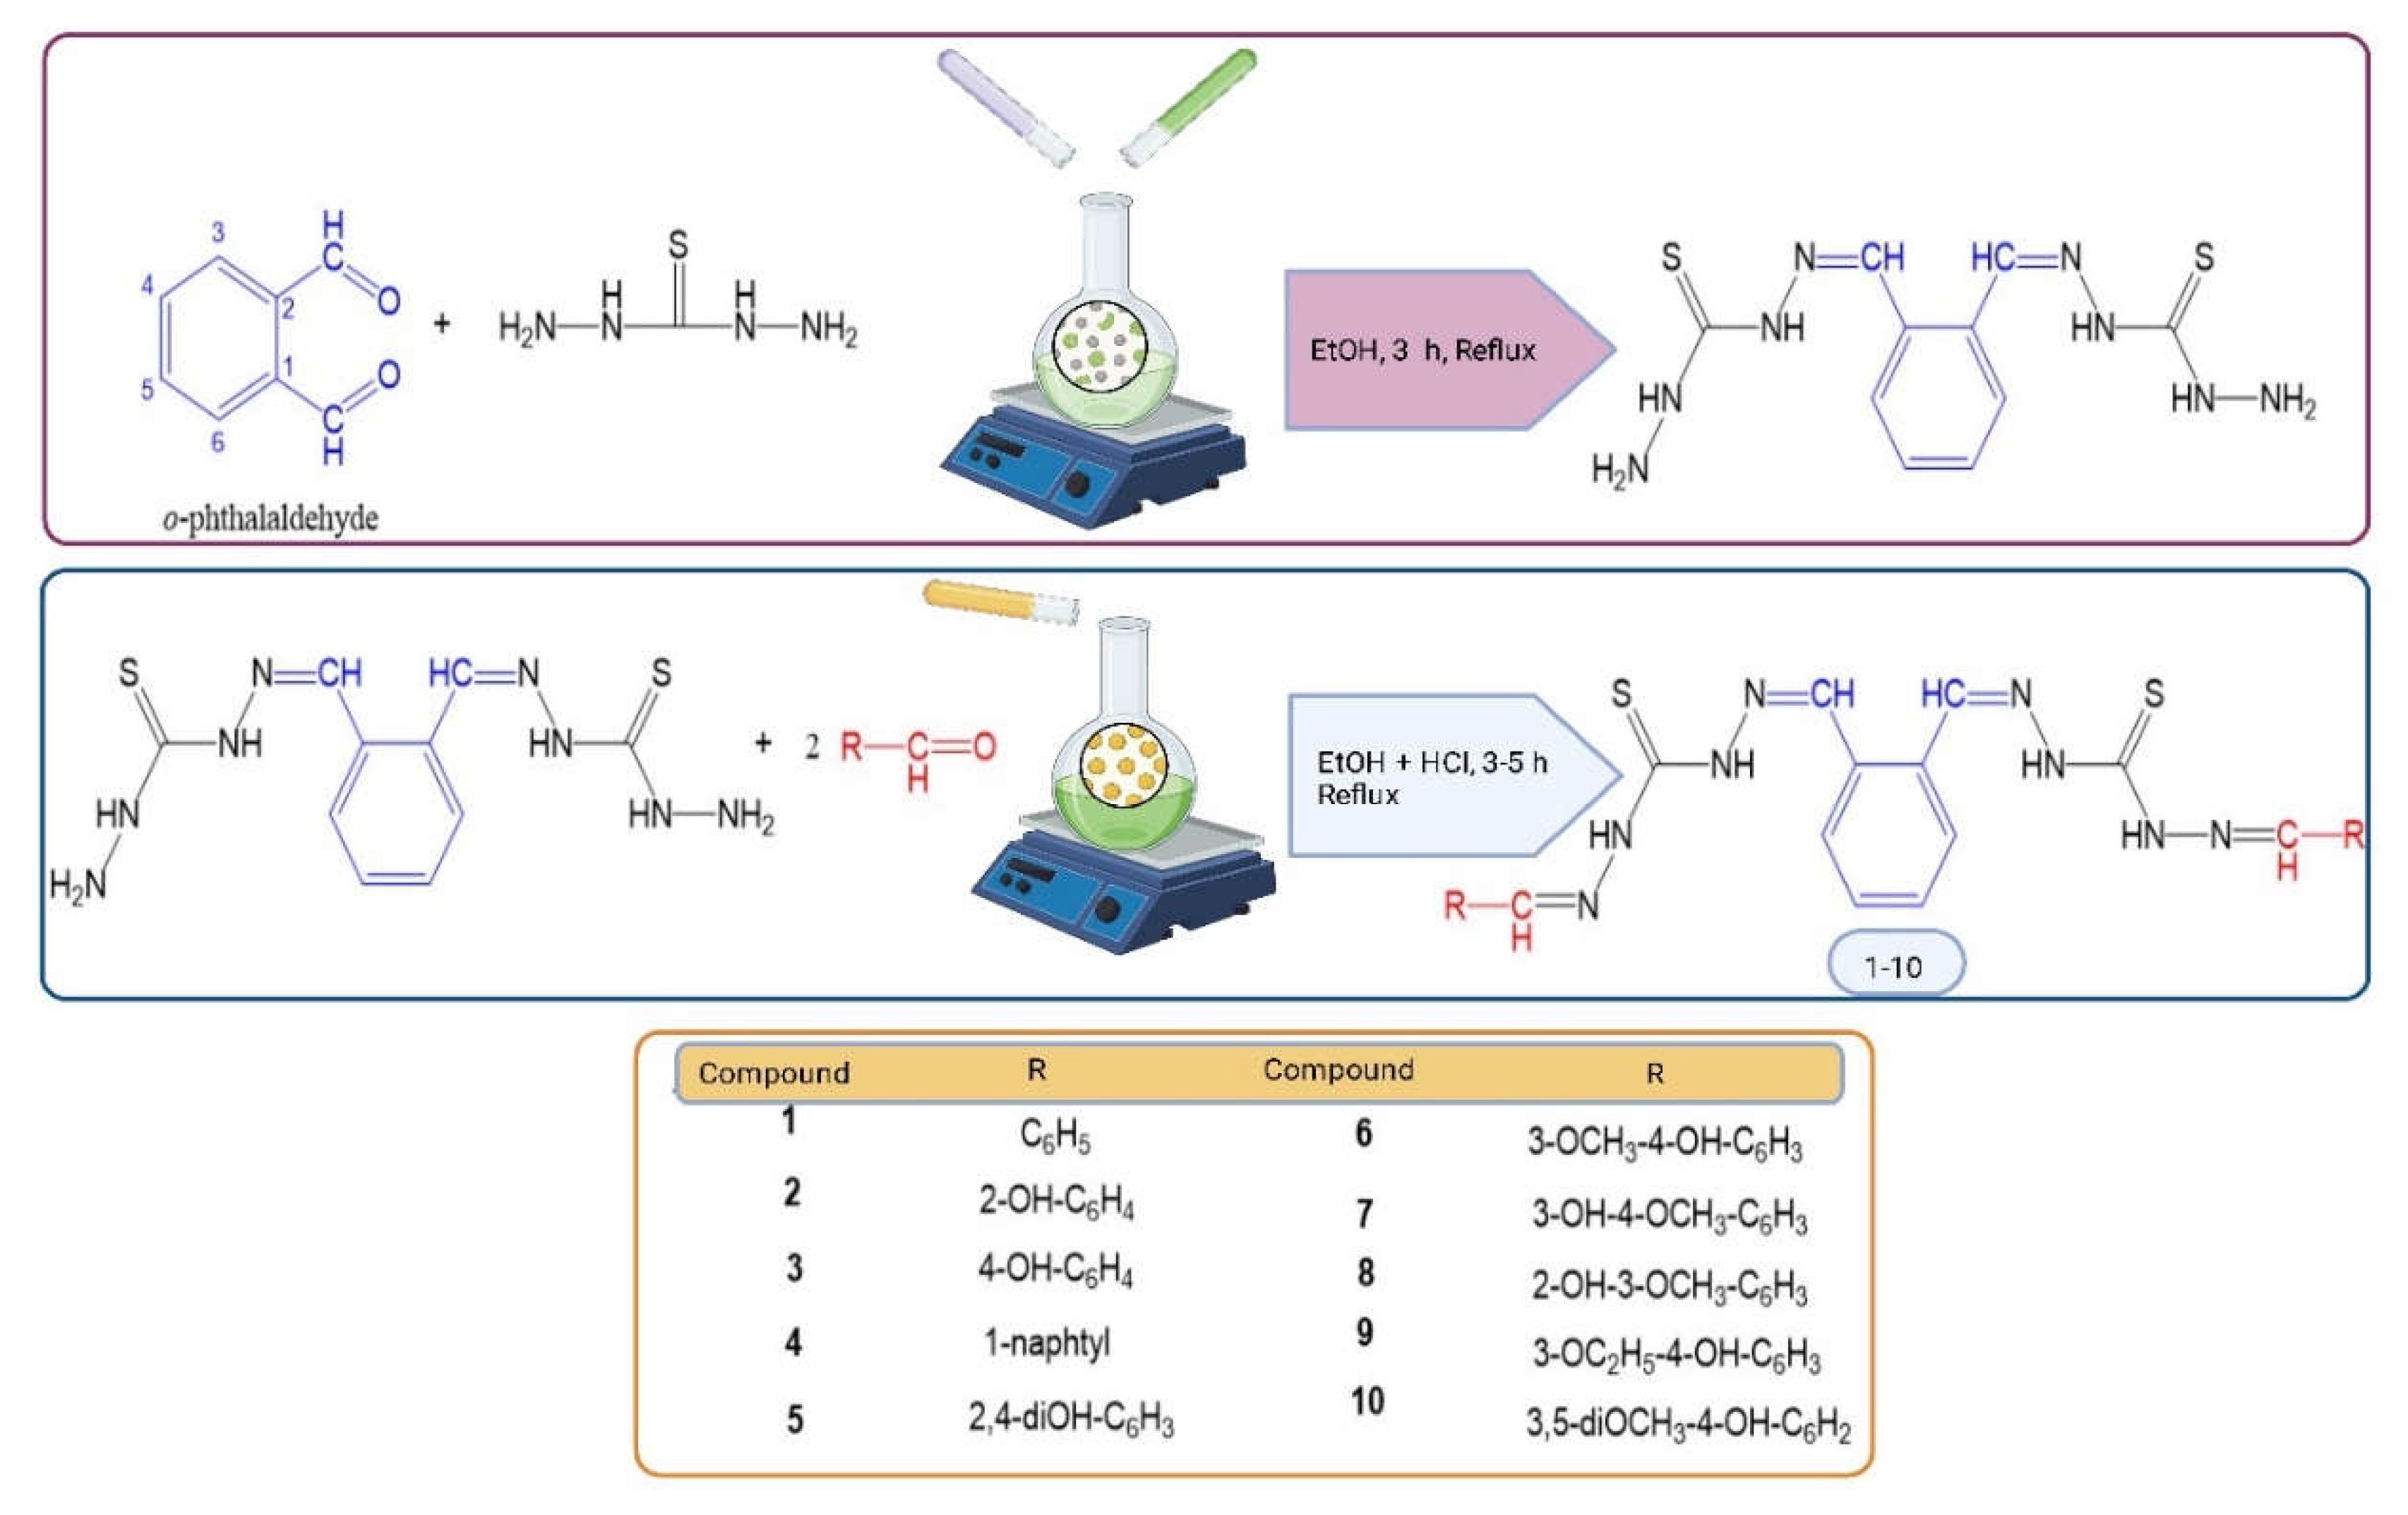
Figure 1. The structures and synthesis route for the synthesized new thiocarbohydrazones (1-10).
Preprints 105807 g001
Figure 2. FT-IR spectrum of synthesized compound 4.
Preprints 105807 g002
Figure 3. 1H NMR (δ, ppm, in DMSO-d6) spectrum of synthesized compound 4.
Preprints 105807 g003
Figure 4. 13C NMR (δ, ppm, in DMSO- d6) spectrum of synthesized compound 4.
Preprints 105807 g004
Figure 5. UV–Vis spectrum of compound 4 in DMSO-d6.
Preprints 105807 g005
Figure 6. TGA and DSC curves for synthesized compound 4.
Preprints 105807 g006
Figure 7. Thermogravimetric analyses (TGA-DSC) of the synthesized compounds.
Preprints 105807 g007
Figure 8. Molecular docking scheme for the compound 1-urease complex.
Preprints 105807 g008
Figure 9. Molecular docking scheme for the compound 2-urease complex.
Preprints 105807 g009
Figure 10. Molecular docking scheme for the compound 3-urease complex.
Preprints 105807 g010
Figure 11. Molecular docking scheme for the compound 4-urease complex.
Preprints 105807 g011
Figure 12. Molecular docking scheme for the compound 5-urease complex.
Preprints 105807 g012
Figure 13. Molecular docking scheme for the compound 6-urease complex.
Preprints 105807 g013
Figure 14. Molecular docking scheme for the compound 7-urease complex.
Preprints 105807 g014
Figure 15. Molecular docking scheme for the compound 8-urease complex.
Preprints 105807 g015
Figure 16. Molecular docking scheme for the compound 9-urease complex.
Preprints 105807 g016
Figure 17. Molecular docking scheme for the compound 10-urease complex.
Preprints 105807 g017
Table 1. Physical properties, yields, melting points, and colors all of the synthesized compounds.
Comp. Compound Name -R Yield % Melting Point (C) Color Color Code [46]
1 N',N'''-(1,2-phenylenebis(methaneylylidene))bis(N'-benzylidenemethanebis(thiohydrazide)) C6H5 80 205.26 Brown S70O26G02
2 N',N'''-(1,2-phenylenebis(methaneylylidene))bis(N'-(2-hydroxybenzylidene)methanebis(thiohydrazide)) 2-OH-C6H4 84 214.01 Dark Brown S80O07G15
3 N',N'''-(1,2-phenylenebis(methaneylylidene))bis(N'-(4-ydroxybenzylidene)methanebis(thiohydrazide)) 4-OH-C6H4 55 241.44 Black S99O11G33
4 N',N'''-(1,2-phenylenebis(methaneylylidene))bis(N'-(naphthalen-1-ylmethylene)methanebis(thiohydrazide)) C11H10 61 232.96 Dark Black S99O00G02
5 N',N'''-(1,2-phenylenebis(methaneylylidene))bis(N'-(2,4-dihydroxybenzylidene)methanebis(thiohydrazide)) 2,4-diOH-C6H3 77 261.42 Brown S90O60G11
6 N',N'''-(1,2-phenylenebis(methaneylylidene))bis(N'-(4-hydroxy-3-methoxybenzylidene)methanebis(thiohydrazide)) 3-OCH3-4-OH-C6H3 81 239.74 Brown S90O02G50
7 N',N'''-(1,2-phenylenebis(methaneylylidene))bis(N'-(3-hydroxy-4-methoxybenzylidene)methanebis(thiohydrazide)) 3-OH-4OCH3-C6H3 73 231.96 Brown S90O11G20
8 N',N'''-(1,2-phenylenebis(methaneylylidene))bis(N'-(2-hydroxy-3-methoxybenzylidene)methanebis(thiohydrazide)) 2-OH-3OCH3-C6H3 87 298.97 Light Brown S70O26G33
9 N',N'''-(1,2-phenylenebis(methaneylylidene))bis(N'-(3-ethoxy-4-hydroxybenzylidene)methanebis(thiohydrazide)) 3-OC2H5-4-OH-C6H3 78 212.59 Brown S80O33G33
10 N',N'''-(1,2-phenylenebis(methaneylylidene))bis(N'-(4-hydroxy-3,5-dimethoxybenzylidene)methanebis(thiohydrazide)) 3,5-diOCH3-4-OH-C6H2 62 295.93 Pale Black S90O07G41
Table 2. Elemental analysis results in all of the synthesized compounds.
Comp. Molecular mass (g/mol) Molecular formula Calculated Experimental
(C)% (H)% (N)% (S)% (O)% (C)% (H)% (N)% (S)% (O)%
1 486.62 C24H22N8S2 59.24 4.56 23.03 13.18 - 59.30 4.52 23.06 13.12 -
2 518.61 C24H22N8O2S2 55.58 4.28 21.61 12.36 6.17 55.57 4.29 21.63 12.37 6.14
3 518.61 C24H22N8O2S2 55.58 4.28 21.61 12.36 6.17 55.60 4.28 21.58 12.37 6.17
4 586.74 C32H26N8S2 65.51 4.47 19.10 10.93 - 65.53 4.45 19.11 10.91 -
5 550.61 C24H22N8O4S2 52.35 4.03 20.35 11.65 11.62 52.33 4.04 20.37 11.64 11.62
6 578.67 C26H26N8O4S2 53.97 4.53 19.36 11.08 11.06 53.97 4.54 19.35 11.08 11.06
7 578.67 C26H26N8O4S2 53.97 4.53 19.36 11.08 11.06 53.96 4.53 19.34 11.09 11.08
8 578.67 C26H26N8O4S2 53.97 4.53 19.36 11.08 11.06 53.97 4.54 19.33 11.09 11.07
9 606.72 C28H30N8O4S2 55.43 4.98 18.47 10.57 10.55 55.40 4.99 18.50 10.56 10.55
10 638.72 C28H30N8O6S2 52.65 4.73 17.54 10.04 15.03 52.65 4.72 17.57 10.05 15.01
Table 3. Experimental FT-IR values for all of the synthesized compounds (cm−1).
Comp. ν(OH) ν(NH) Ar. CH Aliph. CH ν(C=N) ν(NH-C=S) ν(C-N) Spec. vib.
1 - 3216 3080 2991 1492 1451 1120 -
2 3679 3201 2991 2929 1491 1464 1191 C-O:1069
3 3680 3207 2990 2921 1514 1456 1166 C-O:1068
4 - 3272 2997 2919 1570 1512 1166 -
5 3685 3254 2990 2911 1509 1411 1100 -
6 3679 3221 2984 2904 1513 1461 1190 C-O:1065
7 3679 3219 2990 2905 1512 1409 1195 C-O:1068
8 3679 3232 2984 2911 1481 1405 1185 C-O:1076
9 3678 3218 2990 2905 1512 1444 1195 C-O:1068
10 3679 3234 2990 2904 1512 1465 1199 C-O:1077
Table 4. 1H NMR (δ, ppm, in DMSO- d6) values of synthesized compounds except 4.
Preprints 105807 i001
Comp. H1 H2 H3 H4 H5 H6 H7 N1H-N N2H-N CH=N O-H Spec. peaks
1 7.74-7.73 d 7.50-7.48 dd 7.45-7.43 dd 7.48-7.46 dd 7.73–7.72 d 7.66-7.64 d 7.43–7.42 dd 9.83 s
11.62 s
8.58 s
-
-
2 - 6.95-6.93
d
7.31-7.28
dd
6.93-6.91
dd
7.52-7.50
d
7.66-7.64
d
7.44-7.42
dd
10.64 s 10.64 s
8.56 s
11.04 s
-
3 7.53-7.52
d
6.89-6.88
dd
- 6.87-6.87
dd
7.54-7.54
d
7.66-7.63
d
7.45-7.41
dd
9.83 s 11.50 s
8.56 s
9.69 s
-
5 - 6.56-6.55
s
- 6.55-6.53
d
7.49-7.48
d
7.67-7.63
d
7.45-7.41
dd
10.63 s 10.63 s
8.56 s
11.69 s
10.11 s
-
6 7.25-7.24 s - - 6.89-6.87
d
7.27-7.25
d
7.67-7.63
d
7.45-7.41
dd
9.83 s 11.62 s
8.56 s
9.50 s
-OCH3:
3.79, s
7 7.28 s - - 7.05-7.03
d
7.40-7.38
7.20-7.17
m
7.66-7.64
d
7.44-7.42
dd
9.86 s 11.62 s
8.54 s
9.24 s
-OCH3:
3.80, s
8 - - 6.99-6.97
d
6.96-6.94
dd
7.16-7.14
dd
7.67-7.63
d
7.45-7.41
dd
10.66 s 10.66 s
8.54 s
13.46 s
-OCH3:
3.80, s
9 7.25-7.24
s
- - 6.88-6.86
d
7.27-7.25
d
7.67-7.63
d
7.45-7.41
dd
9.74 s 10.98 s
8.53 s
9.62s -CH2:
4.07-4.03 dd
-CH3:
1.33-1.31t
10 7.00-6.99
s
- - - 7.00-6.99
s
7.67-7.63 7.45-7.41 9.95 s 11.50 s 8.52 s 8.75 s -OCH3:
3.83
s
s singlet, d doublet, dd doublet of doublet, dt doublet of triplet, t triplet, td triplet of doublet, m multiplied.
Table 5. 1H NMR (δ, ppm, in DMSO-d6) values of the synthesized compound 4.
Preprints 105807 i002
Comp. H1 H2 H3 H4 H5 H6 H7 N1H-N N2H-N CH=N O-H Spec. peaks
4 8.01-7.88
d
7.55-7.54
dd
7.66-7.64
d
8.35-8.33
d
7.54-7.53 dd 7.75-7.73
d
10.63
s
10.63 s
8.55 s
-
H8
7.60-7.57 d
H9
7.44-7.42
dd
Table 6. 13C NMR (δ, ppm, in DMSO-d6) values of synthesized compounds except 4.
Preprints 105807 i003
Comp. C1 C2 C3 C4 C5 C6 C7 C8 C9 C10 C11 C12 R
1 129.02 128.62 132.01 128.62 129.02 133.51 147.53 184.25 145.64 134.30 129.02 132.01 -
2 158.88 117.99 132.80 121.06 127.84 118.78 147.14 185.75 142.96 136.19 129.02 130.51 -
3 132.43 116.0 160.77 116.0 132.43 125.95 148.32 184.96 142.08 134.69 129.02 133.90
5 163.12 103.82 162.62 110.03 133.67 111.76 146.24 185.11 144.54 134.14 129.25 131.46 -
6 114.44 149.66 151.55 117.91 122.64 131.93 146.75 185.67 144.30 134.69 129.73 132.49 -OCH3: 57.64
7 125.08 153.60 155.03 120.35 127.33 131.46 150.50 184.19 145.34 136.11 129.49 131.46 -OCH3: 56.21
8 155.81 151.39 115.94 118.38 126.26 120.67 148.48 187.64 145.49 137.84 130.75 133.43 -OCH3: 56.31
9 113.26 148.48 153.60 116.41 123.55 130.99 146.27 186.14 143.30 135.64 129.49 132.96 O-CH2: 65.75CH2-CH3: 15.15
10 107.35 149.90 140.84 149.90 107.35 128.23 146.98 185.90 143.87 135.87 129.25 131.46 -OCH3: 56.61
Table 7. 13C NMR (δ, ppm, in DMSO-d6) values of the synthesized compound 4.
Preprints 105807 i004
Comp. C1 C2 C3 C4 C5 C6 C7 C8 C9 C10 C11 C12 C13 C14 C15 C16
4 135.61 137.16 131.25 126.59 124.58 133.67 125.71 120.10 127.28 130.18 162.29 194.75 169.17 135.61 127.97 129.38
Table 8. Electronic spectral data (nm) of all the synthesized compounds (1–10) in DMSO-d6.
Compound π → π*, B band n → π*, C=N n → π*, C=S
1 240 280 330
2 240 280 340
3 240 280 330
4 240 260 310, 340
5 250 280 350
6 260 280 340
7 240 280 340
8 260 280 330
9 250 280 340
10 240 280 320
Table 9. Results obtained from the TGA-DSC analyses.
Compounds TGA TGA DSC
aTon bWeight loss % at 1100 °C cTm (°C)
1 195.69 74.20 205.26
2 200.98 58.42 214.01
3 228.08 54.63 241.44
4 169.43 94.39 232.96
5 236.94 54.93 261.42
6 211.38 58.83 239.74
7 217.53 58.02 231.96
8 207.42 63.82 298.97
9 200.22 65.13 212.59
10 211.37 61.56 295.93
a: The onset temperature. b: Weight loss %. c: Melting point temperature.
Disclaimer/Publisher’s Note: The statements, opinions and data contained in all publications are solely those of the individual author(s) and contributor(s) and not of MDPI and/or the editor(s). MDPI and/or the editor(s) disclaim responsibility for any injury to people or property resulting from any ideas, methods, instructions or products referred to in the content.
Copyright: This open access article is published under a Creative Commons CC BY 4.0 license, which permit the free download, distribution, and reuse, provided that the author and preprint are cited in any reuse.
Prerpints.org logo

Preprints.org is a free preprint server supported by MDPI in Basel, Switzerland.

Subscribe

© 2024 MDPI (Basel, Switzerland) unless otherwise stated