1. Introduction
In order to acquire the material property by scratch test, different experimental processes and analytical methods have been implemented. Kamplade and Biermann [
1] utilized scratch tests analyzing the grain performance while grinding thermoplastics. Corundum grains were used in two different scratch test set-ups for fundamental analysis of the material removal process. The scratching process was evaluated by the relative material removal volumes of the scratch grooves. In addition to that, the forces occurring during the process and the required specific scratch energy were analyzed. Scratch tests using Rockwell-C diamond cone indenter are reported by Varga et. al. [
2] where test load was induced with slip-stick mechanism. Line scars were produced on the specimen after scratching. Scratch topographies and average profiles for increasing scratch load were studied and its cross-section was analyzed. Moreover, study on numerical simulations of the scratch process are also reported using smooth particle hydrodynamics [
3].
Through a thorough examination of the failure processes acting at both the macroscopic and microscopic length scales, the fracture toughness was determined using scratch tests. Energy required to create a unit fracture surface was computed by Akono and Ulm [
4] using energetic contour-independent J-integral. Energy release rate was linked to stress intensity factors in mode I and II via the Griffith-Irwin equation [
5]. J-integral formulations are reported for micro-scratch test. Finite element meshing was performed on crack tip. Using fracture criterion, forces and the tool geometry were linked to the plane strain fracture toughness [
6]. Cross-sectional investigations were done and analyzed. Moreover, it is reported [
7] that the elastic modulus and hardness of silicon carbide particle reinforced aluminum matrix composites, SiCp/Al, were determined through the indentation test by loading onto Al matrix and SiC particles, respectively. Two fundamental parameters, the elastic modulus (E) and the hardness (H), can be found by interpreting the
P-h behavior. Results show that due to the interaction effects of the three phases during the deformation process, when the indenter was on a single phase, the influence of the other phases cannot be neglected and are reflected in the P-h curves. In addition, scratch force, friction coefficient and material removal behaviour were investigated by traditional scratch test and ultrasonic vibration assisted machining (UVAM) tests. In traditional scratch test using single scratch approach, investigations on material removal behavior at the microscale is reported. Referring to the material removal behavior, another report [] states that macroscale grinding process is the compilation of microscopic effects of individual abrasive grains and interactions of neighboring grains were not included. In addition, use of unconventional UVAM technique is basically for difficult-to-process materials. UVAM was a combination of precision or ultra-precision machining with micro-scale (1–15 µm) and high frequency (16–40 kHz) tool or workpiece vibration in one or two directions. In this paper, authors bring test dimension upward to meso-scale of 1mm and lower frequency at 10Hz.
Moreover, mechanism for material removal and crack propagation in glass-ceramic has been studied by scratch test [
8]. Increase in the scratch depth leads to the formation of cracks. Material peeling is observed which is due to the crack propagation. Also, material peeling is shown to be obvious in brittle mode whereas plastic ridges are dominant in the ductile mode. Scratch test on glass-ceramics, also show that crack propagation increases linearly with the material removal volume. Wakeel and Hubler [
9] introduced heterogeneity into the micro-scratch test fracture. Same formula is utilized in our derivation. In this, the region ahead of the crack tip where material failure occurs is used to determine the energy release rate accounting for heterogeneity of the region. Akono and Ulm [
10] established the fracture scaling relations for scratch tests of axisymmetric shape of a scratch indenter in which equivalent force is composed of scratch force and indentation force. In our analysis, the factor for conical indenter is equal to one. Kamplade and Biermann [
11] examined the material removal of unreinforced, thermoplastic polymers by scratch tests to analyse the grain engagement. In this, helical scratch groove was produced using single grain. Also, indentation force and specific scratch energy were measured at specific wheel speed.
Material qualities of aluminum alloy have a significant impact on their structural behaviour. Along the line to determine the Young’s modulus of aluminum, several aspects considered are ultimate stress, Young's modulus and ultimate strain of normal and high strength aluminum alloys at elevated temperatures [
12].
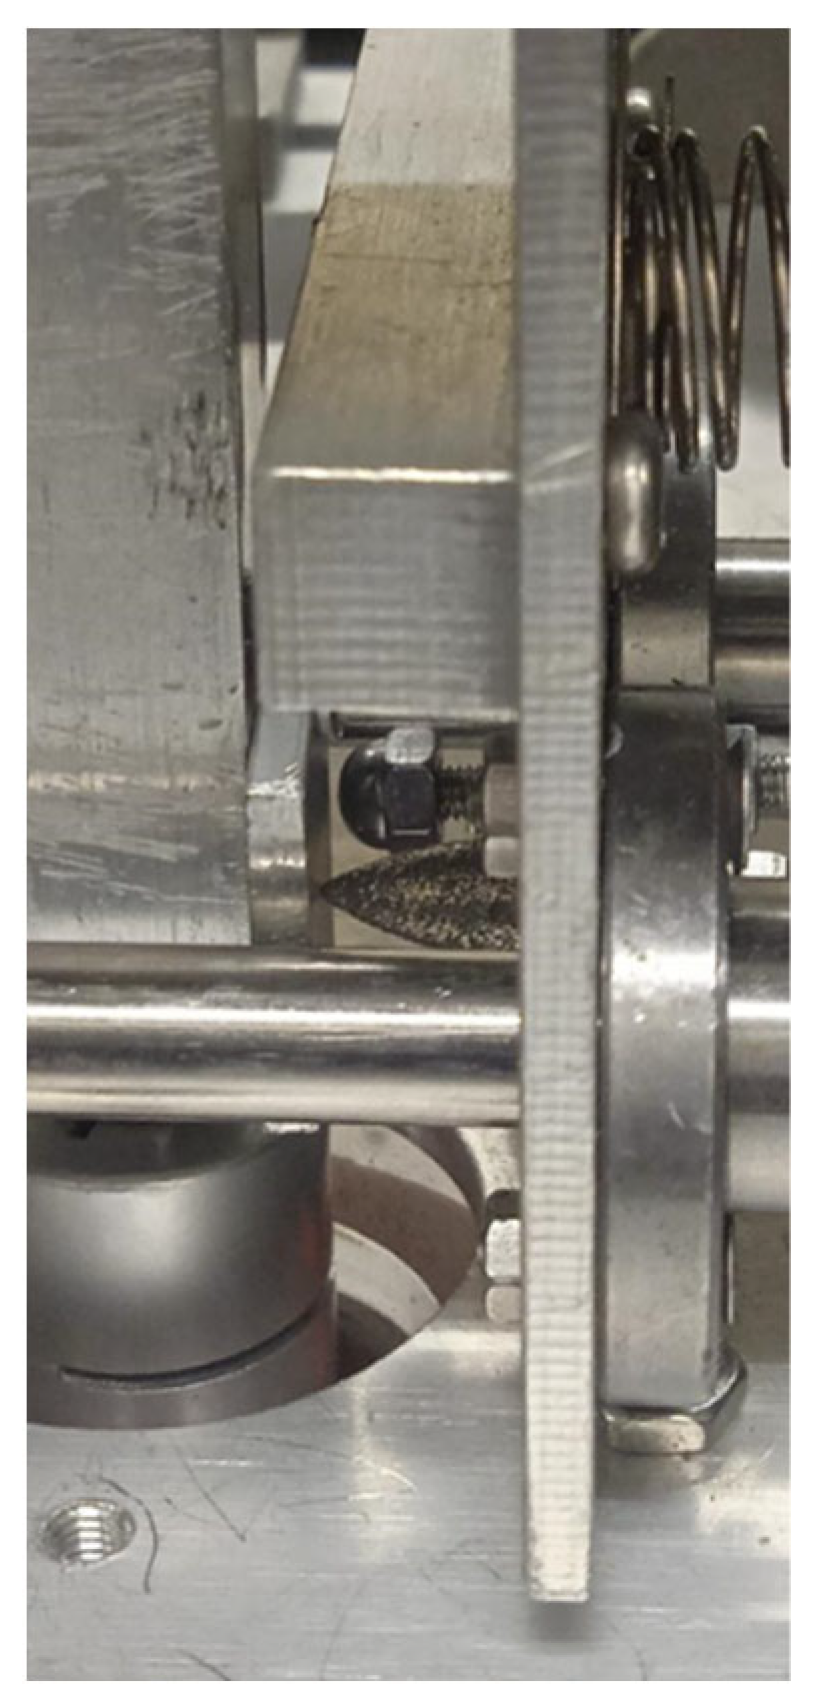
In traditional scratch test, static load is applied to obtain the fracture surface where the test is one time in a direction and is not repeatable. It might be unstable indenter movement along the path, depending on material-indenter interaction. In our case, cyclic vibration load is used instead generating repeatable load-path loop. As a result, stable linearized fracture surface is created. This generates refined sub-layer scratching within test material facilitating in-depth property analysis. Moreover, in the computation of scratch damping ratio, load profile at scratch path, vibrational speed, normal and shear stresses at indenter tip are utilized. Besides, indenter is changeable from round head shaped for slight scratching to pin head shaped in significant scratching.
2. Design and Working Principle of Scratching Damper
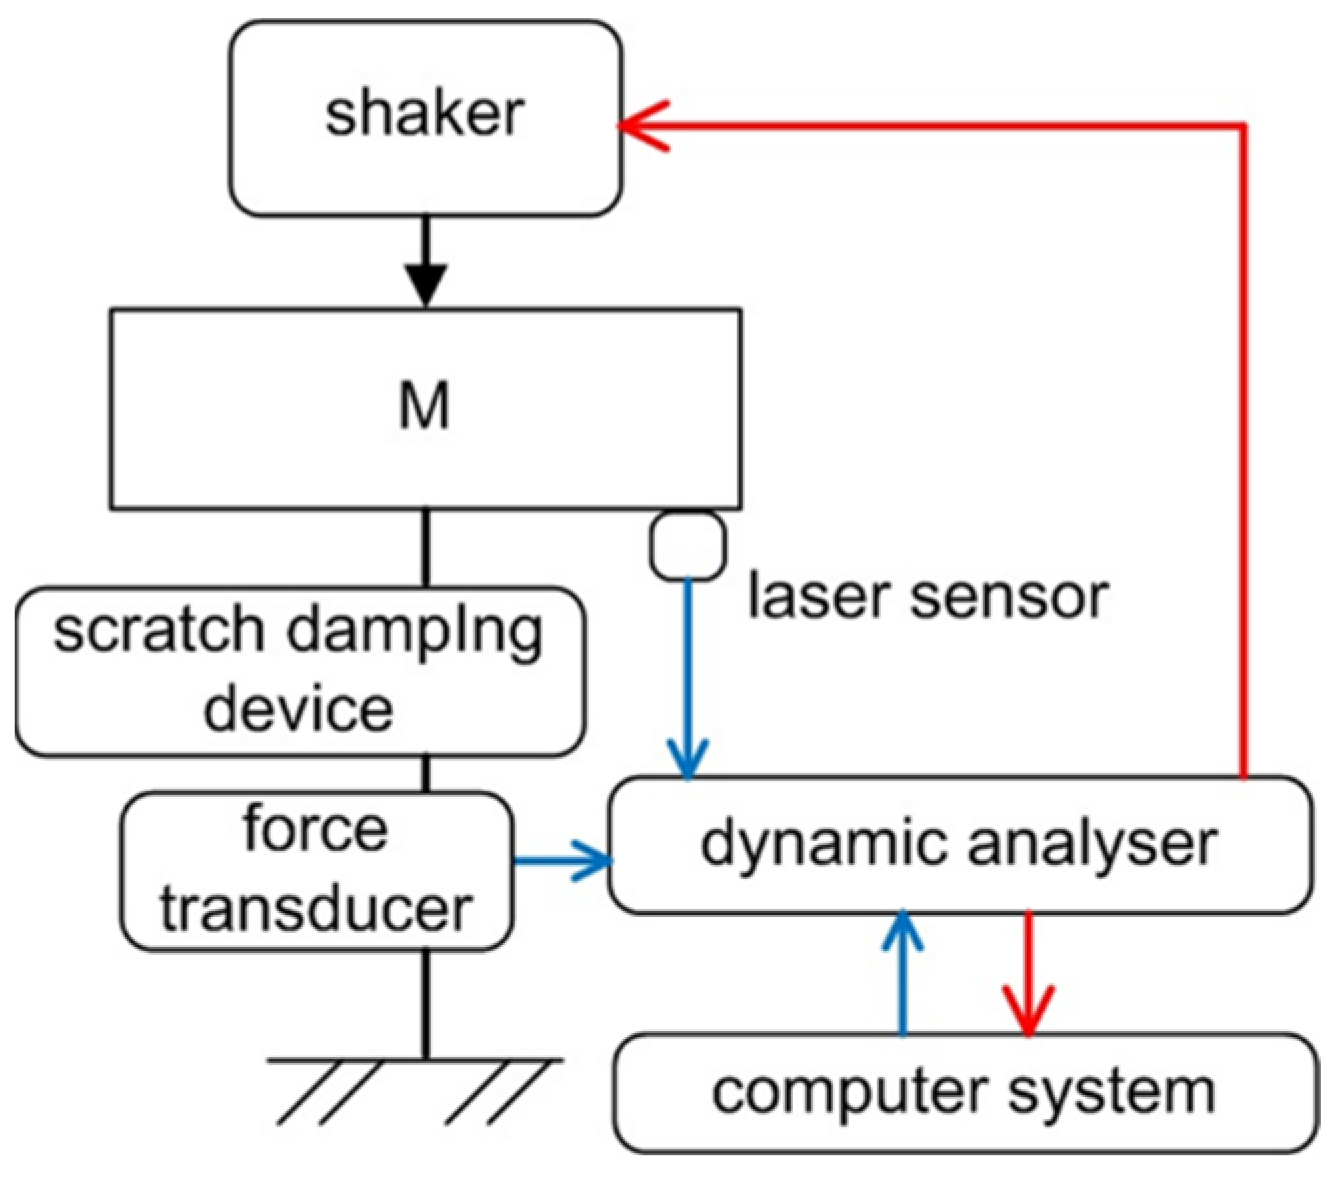
An innovative damper is built to conduct divisional scratching test through scratch damping where the required load can be obtained by moving circular scale divisions. Test-rig schematic of the scratching damper is illustrated in
Figure 1.
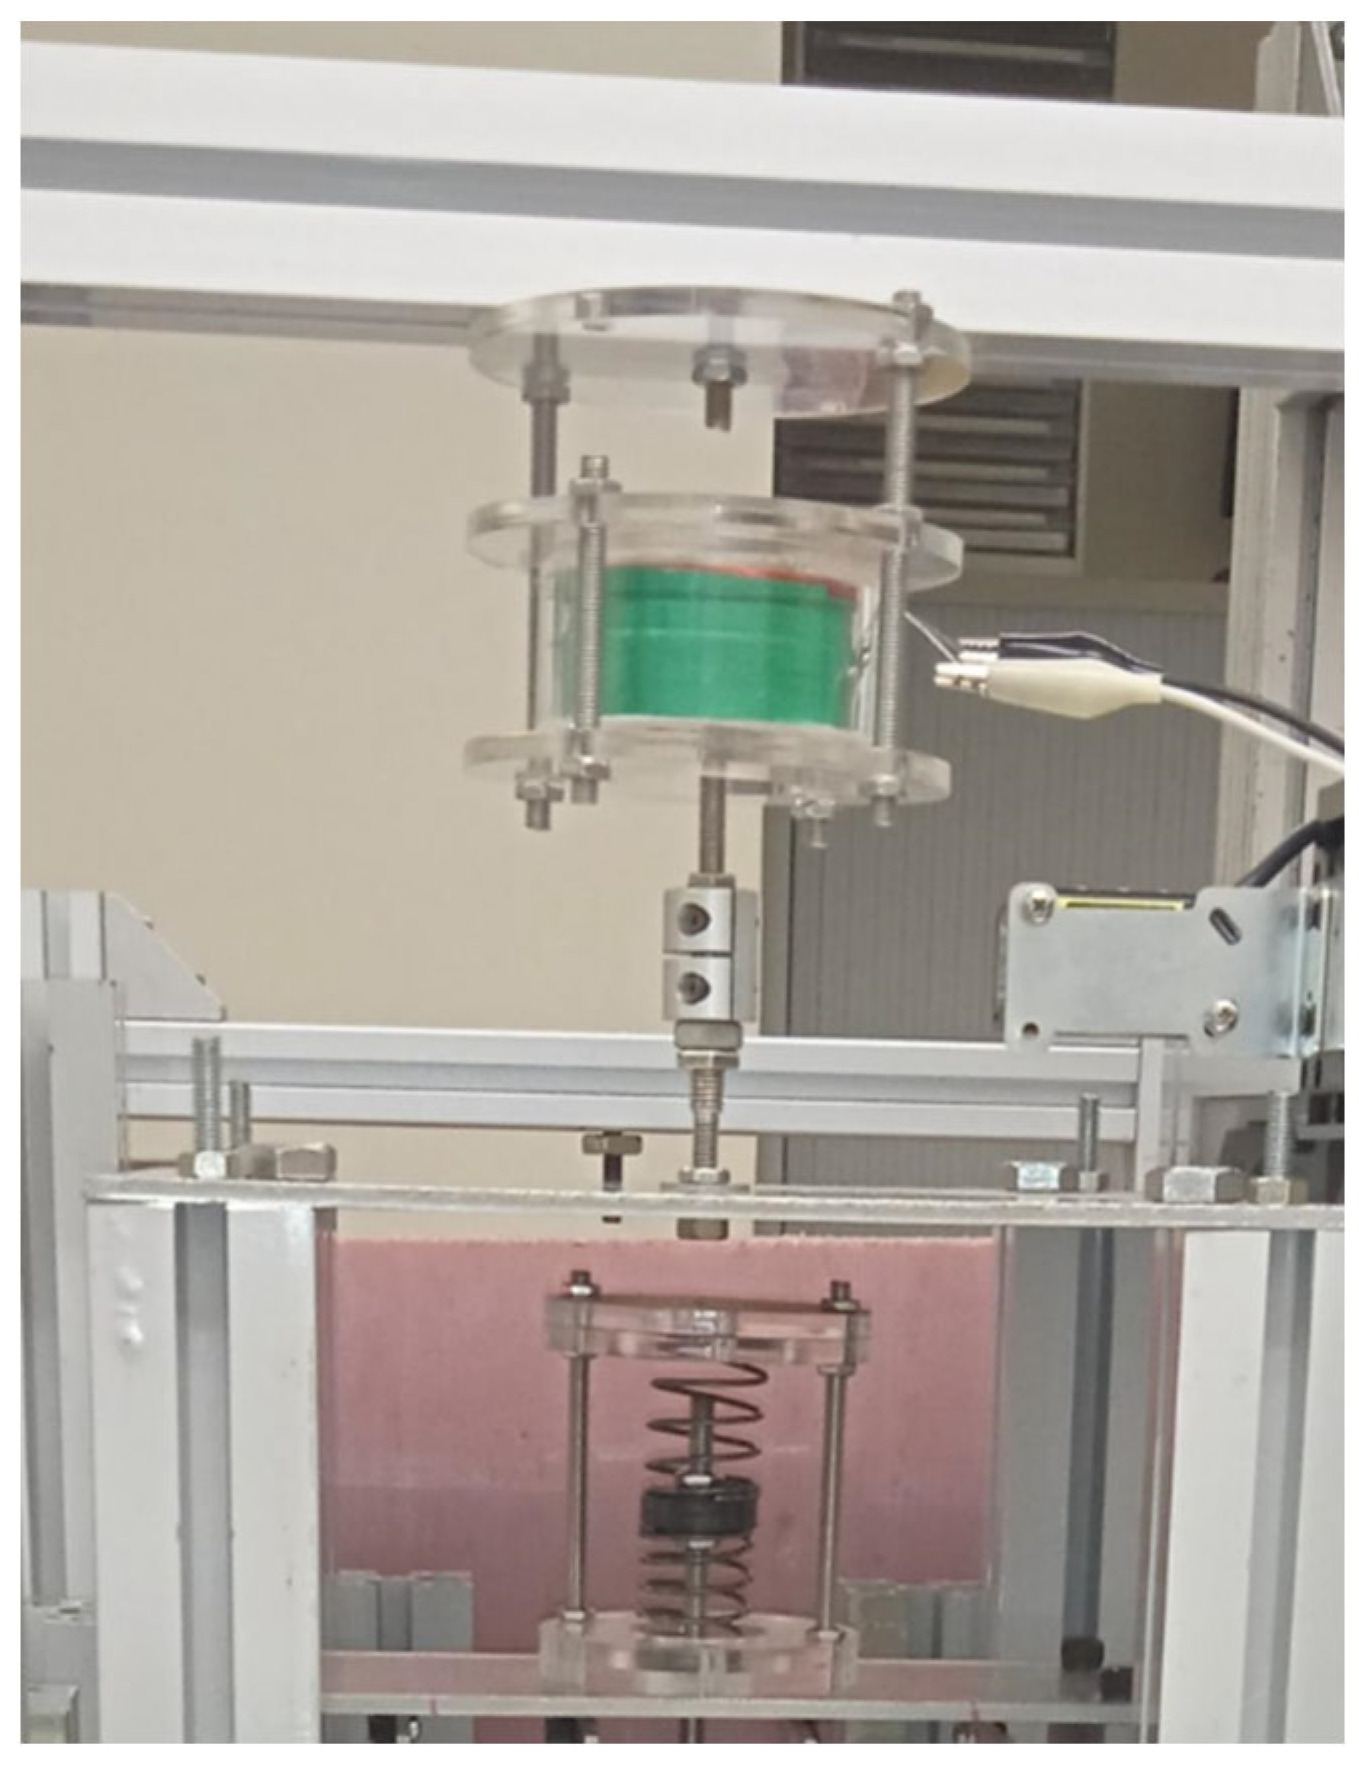
Non-contact electromagnetic exciter is mounted on top of the mounting frame that provides the excitation force without introducing any additional stiffness to the dynamic system as shown in
Figure 2. The exciter coil is fixed on the mounting frame while the permanent magnets of the exciter are fixed on the damper system which can be regarded as part of the system mass. Mass, stiffness and natural frequency of damper system are 6.87 Kg, 20.961 N/mm and 9Hz respectively.
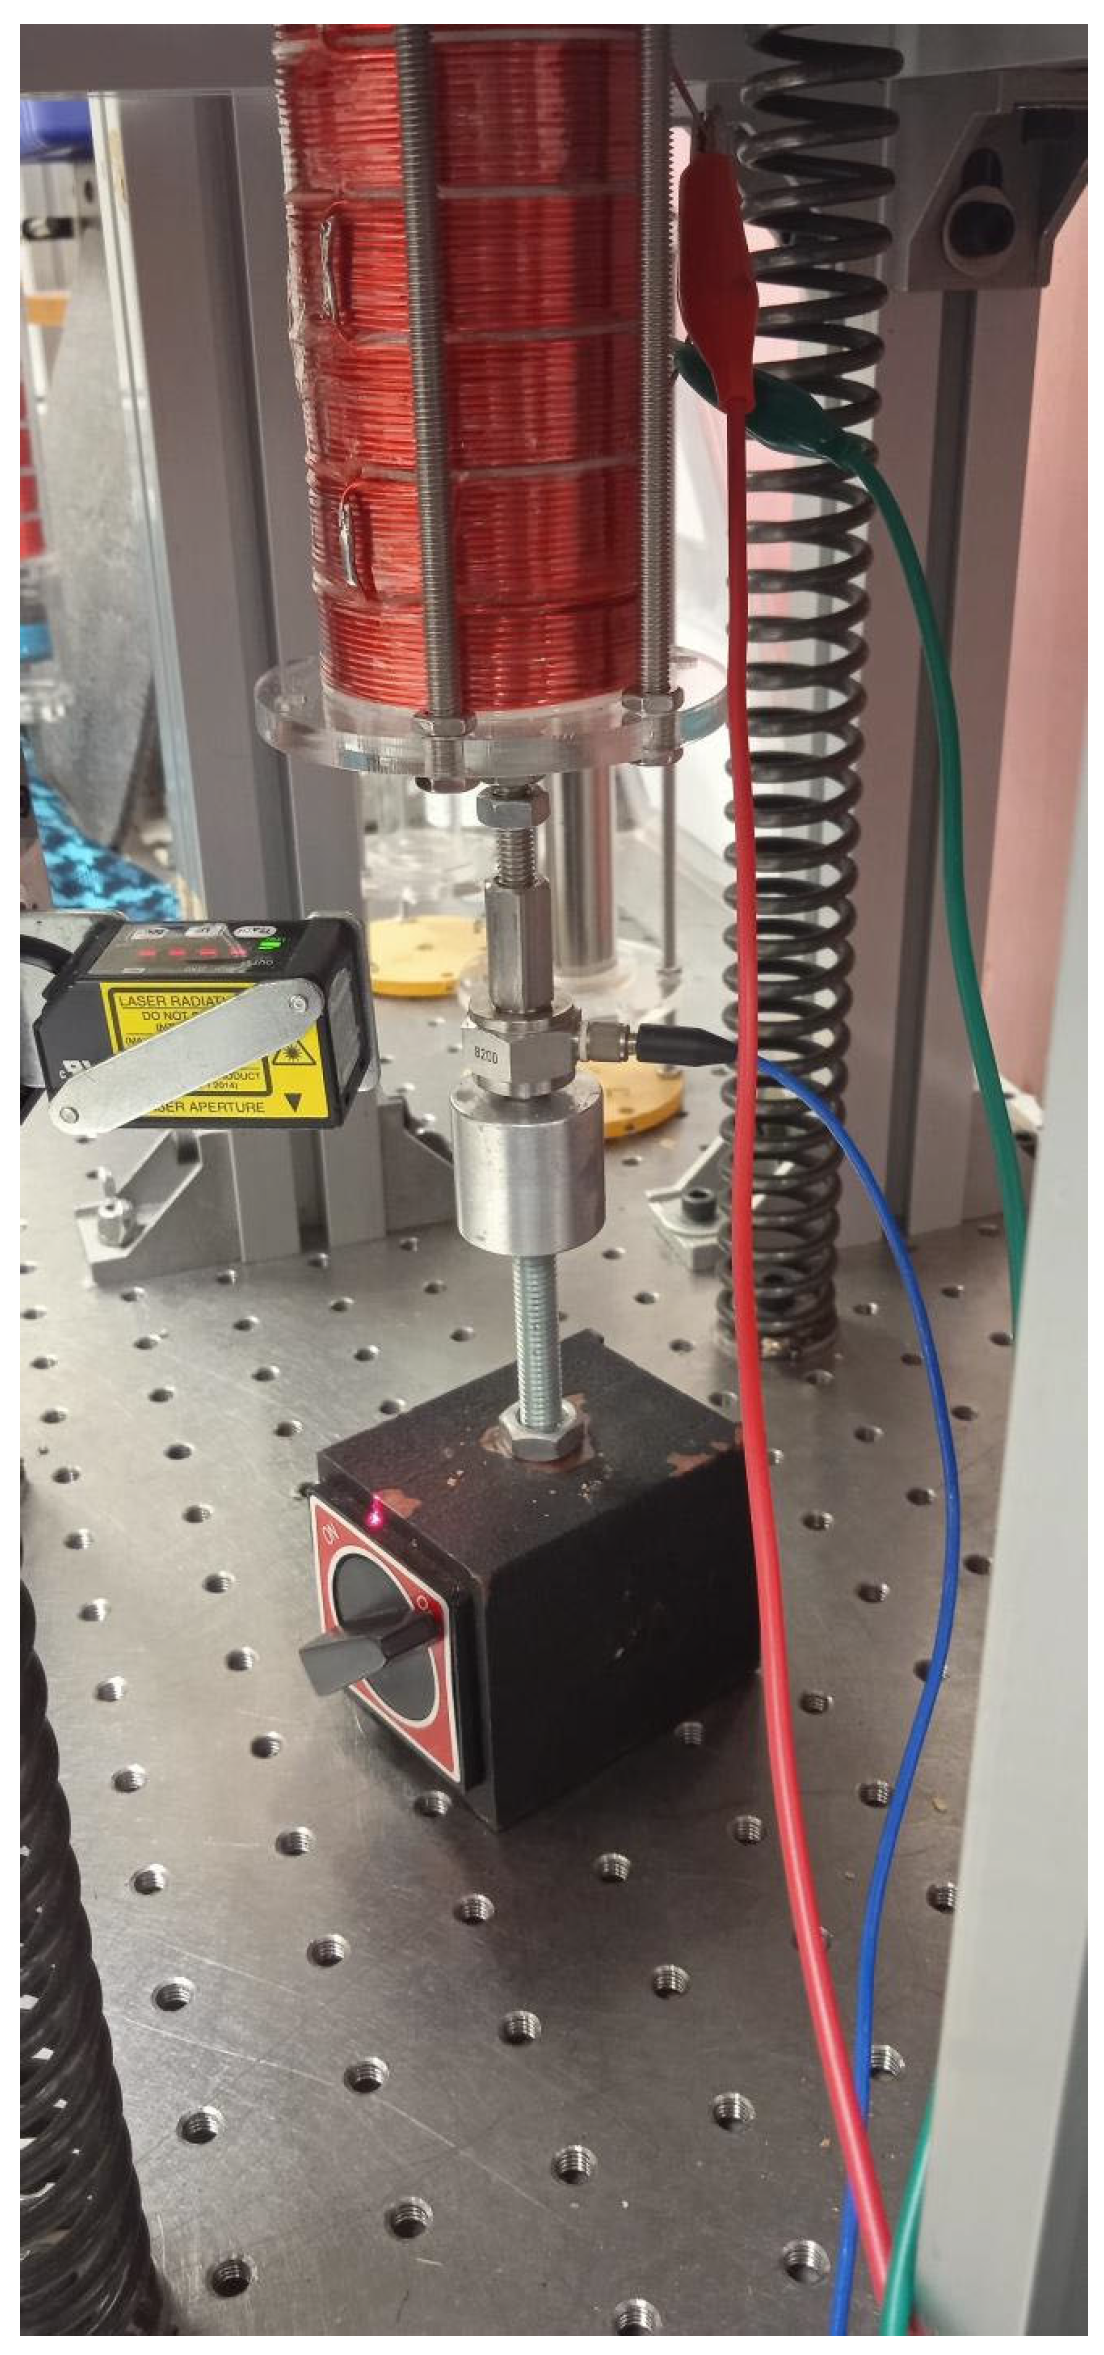
The linear guide is composed of 4 rotation bearings on each side face, and the smooth glassy surface for bearing motion allows reducing the parasitic damping of the damper system. To measure the damper force, force sensor is fastened on the damper rob which is grounded to steel table (
Figure 3).
Laser sensor is used to measure the absolute displacement of system mass. A nylon tube, with a pre-compressed spring inside, is fixed on the tuning mechanism of scratching device to provide rough linear guide for the mass vibration. The data acquisition and signal generation are conducted with the B&K PULSE 7767 system (
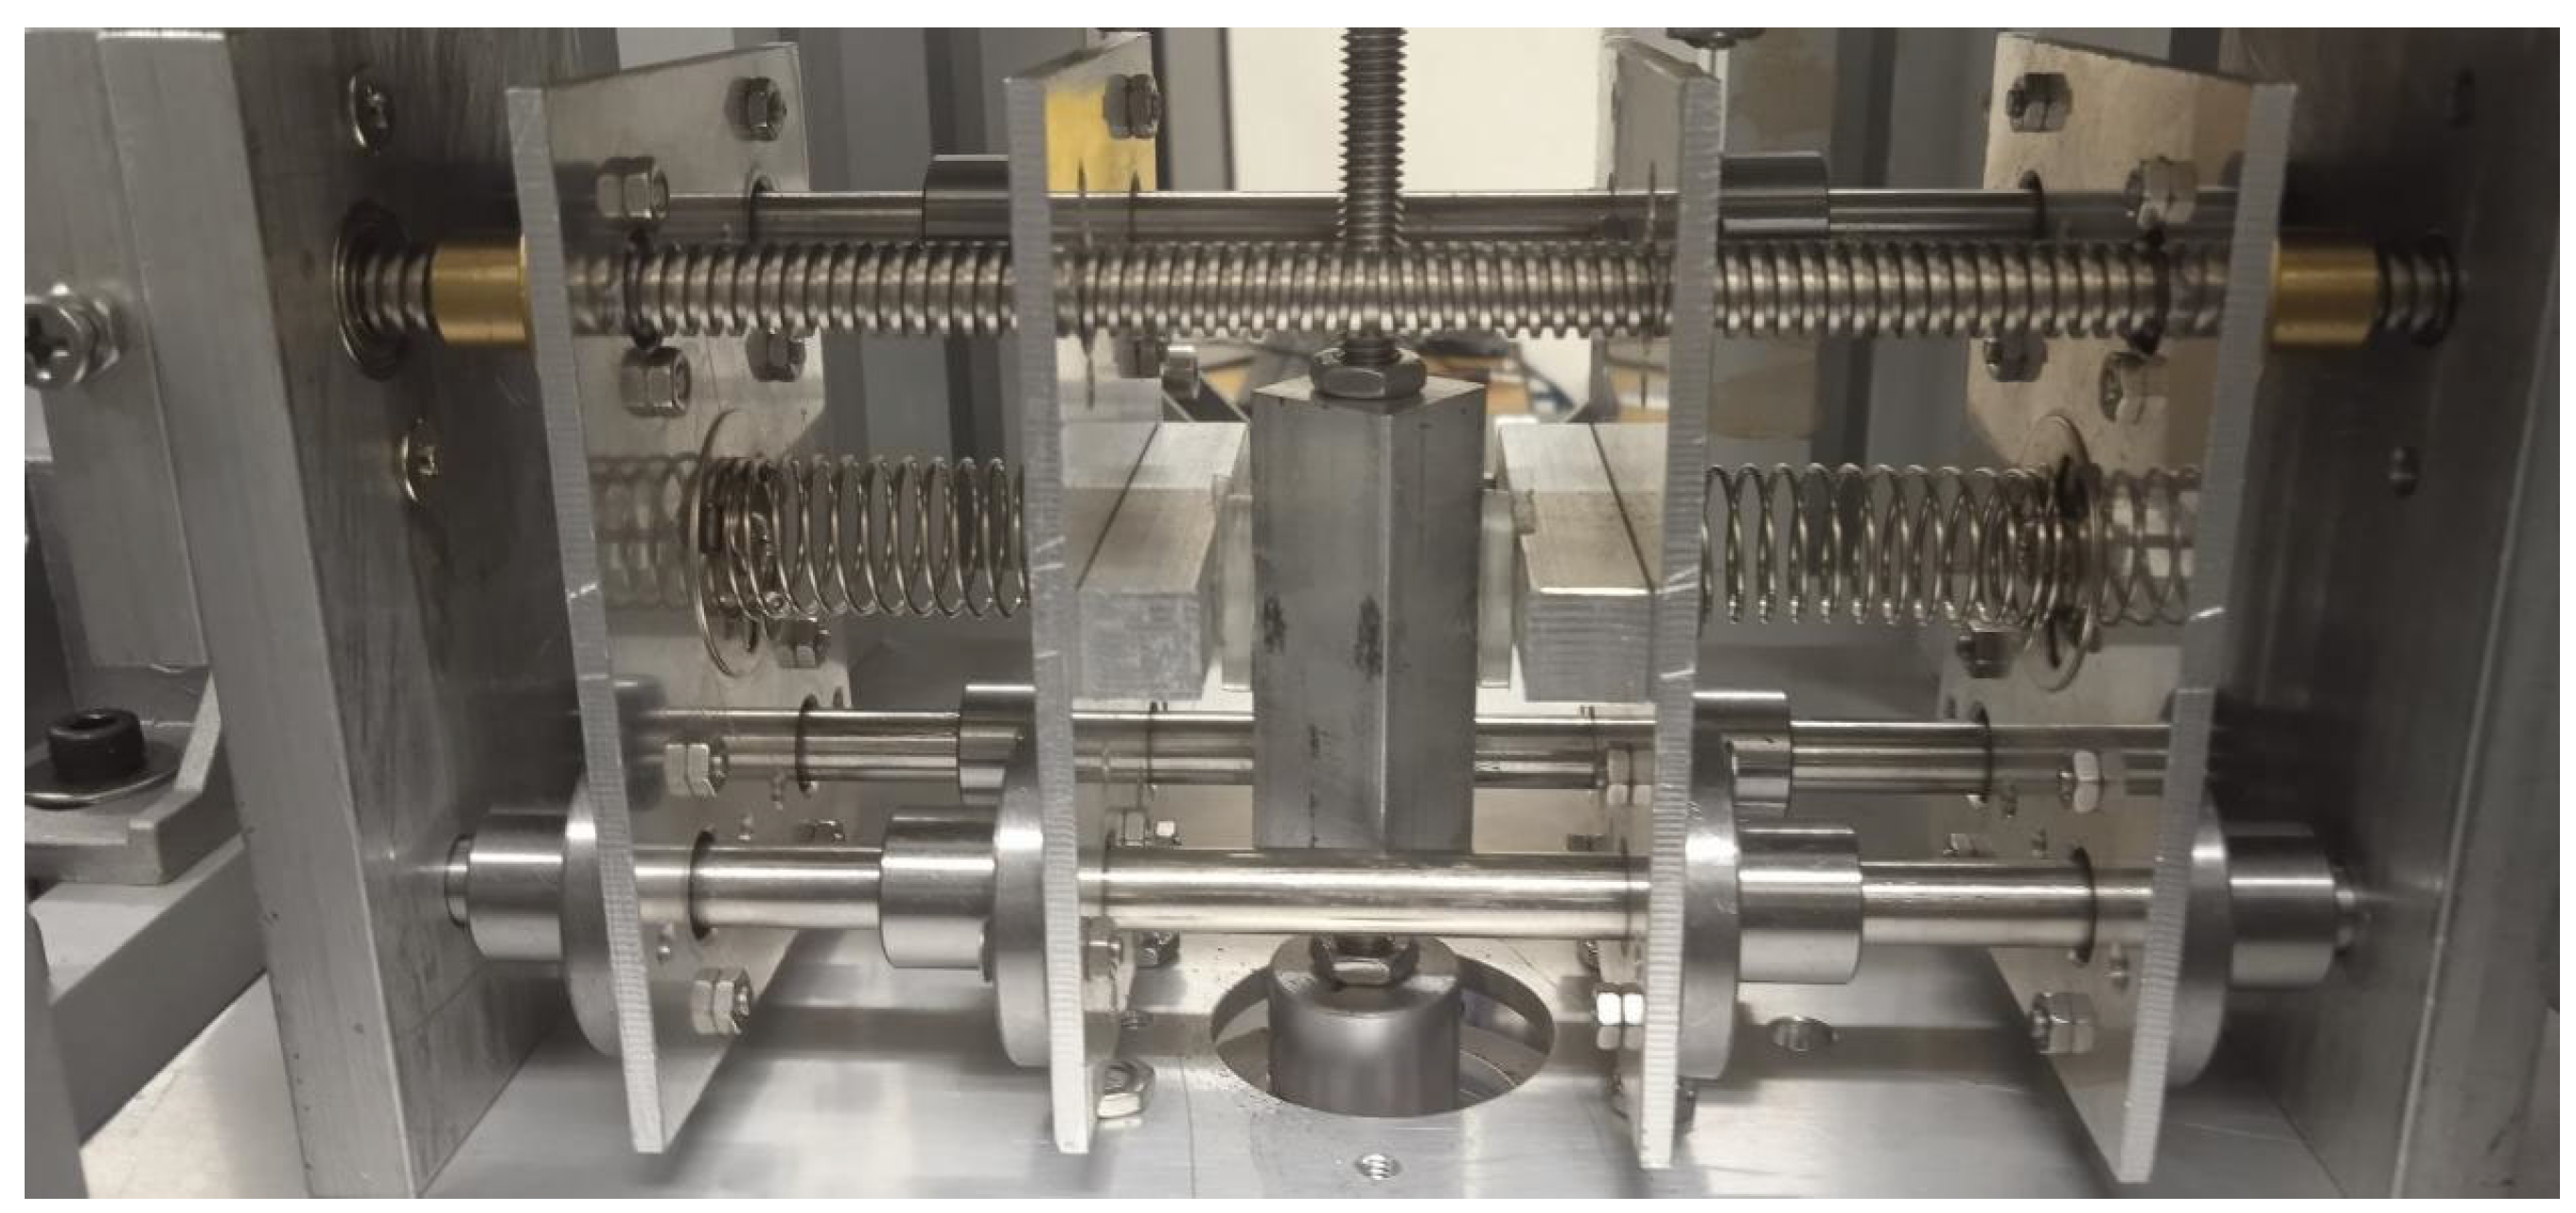
Figure 1). The driving signal to the exciter is amplified by the B&K 2712 power amplifier before sending to the non-contact exciter. The device is installed in the middle part of the system (
Figure 4).
Under the principle of scratch energy conservation, divisional scratching energy is computed by the energy equation within the same interval test
where is j divisional total energy of scratching motion at ith interval, is j divisional energy of damping motion, is j divisional scratching energy, is j divisional scratching energy factor, is j divisional material removal volume.
Applying the energetic contour-independent
J-integral [
4], the scratch energy release rate, which being the energy required to create a unit scratching surface, is
where
is free energy density with
,
being Poisson's ratio,
is displacement gradient,
is surface traction. For tangential track generating from the scratch head, Airy stress function is established as
Its symmetric stress tensors are computed by
Displacement gradient at the scratch head-material interface is determined by the potential function
which satisfying
,
. Afterwards, displacement gradient is calculated by
Substituting this to Eq.(2), one can obtain
On the other hand, the tangential force is given by
Assume that stress field over the scratch head being constant, its linear stress average is related to quadratic stress average on the projected contact area as the integral in Eq. (9) is
As
, the equivalent force can be simplified to
. Hence we have the scratch energy release rate created as
where
E is Young's modulus,
p and
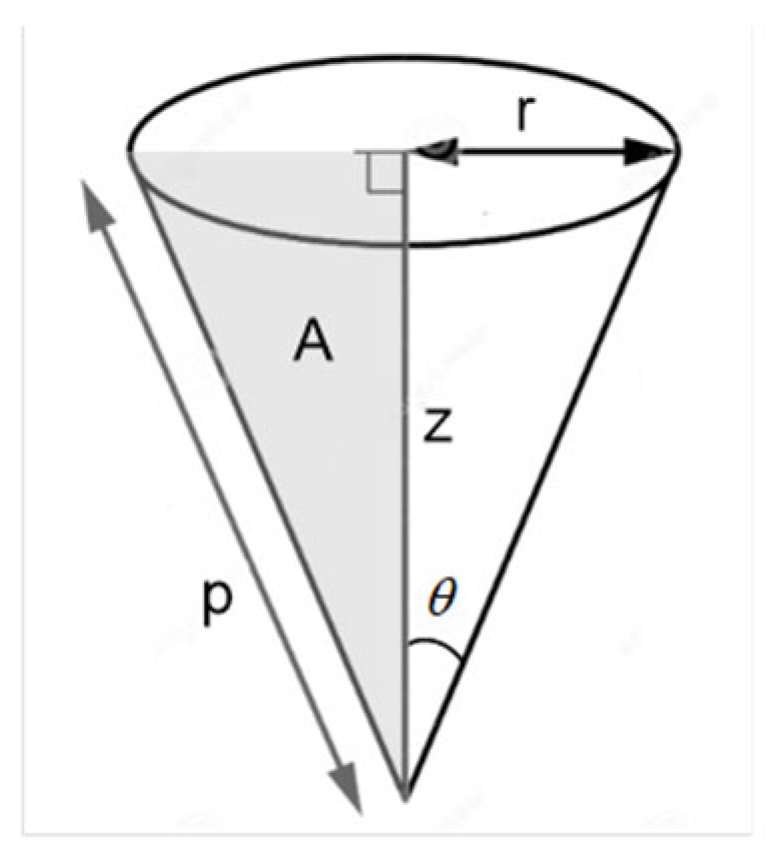
A are scratch head perimeter and projected contact area respectively. In general, the right -angled scratch head shape function defined by
Figure 5 can be generated by
in which
r is radius of head,
z is height,
is conical angle. Firstly,
p projected onto scratch direction is
Secondly, scratch surface projected in the scratch direction becomes
where
. Therefore
A can be computed using cylindrical co-ordinate as
3. Results and Discussions
3.1. Young’s Modulus of Extruded Aluminum Flat Bar
Upon scratch test of an extruded aluminum flat bar sample as shown in
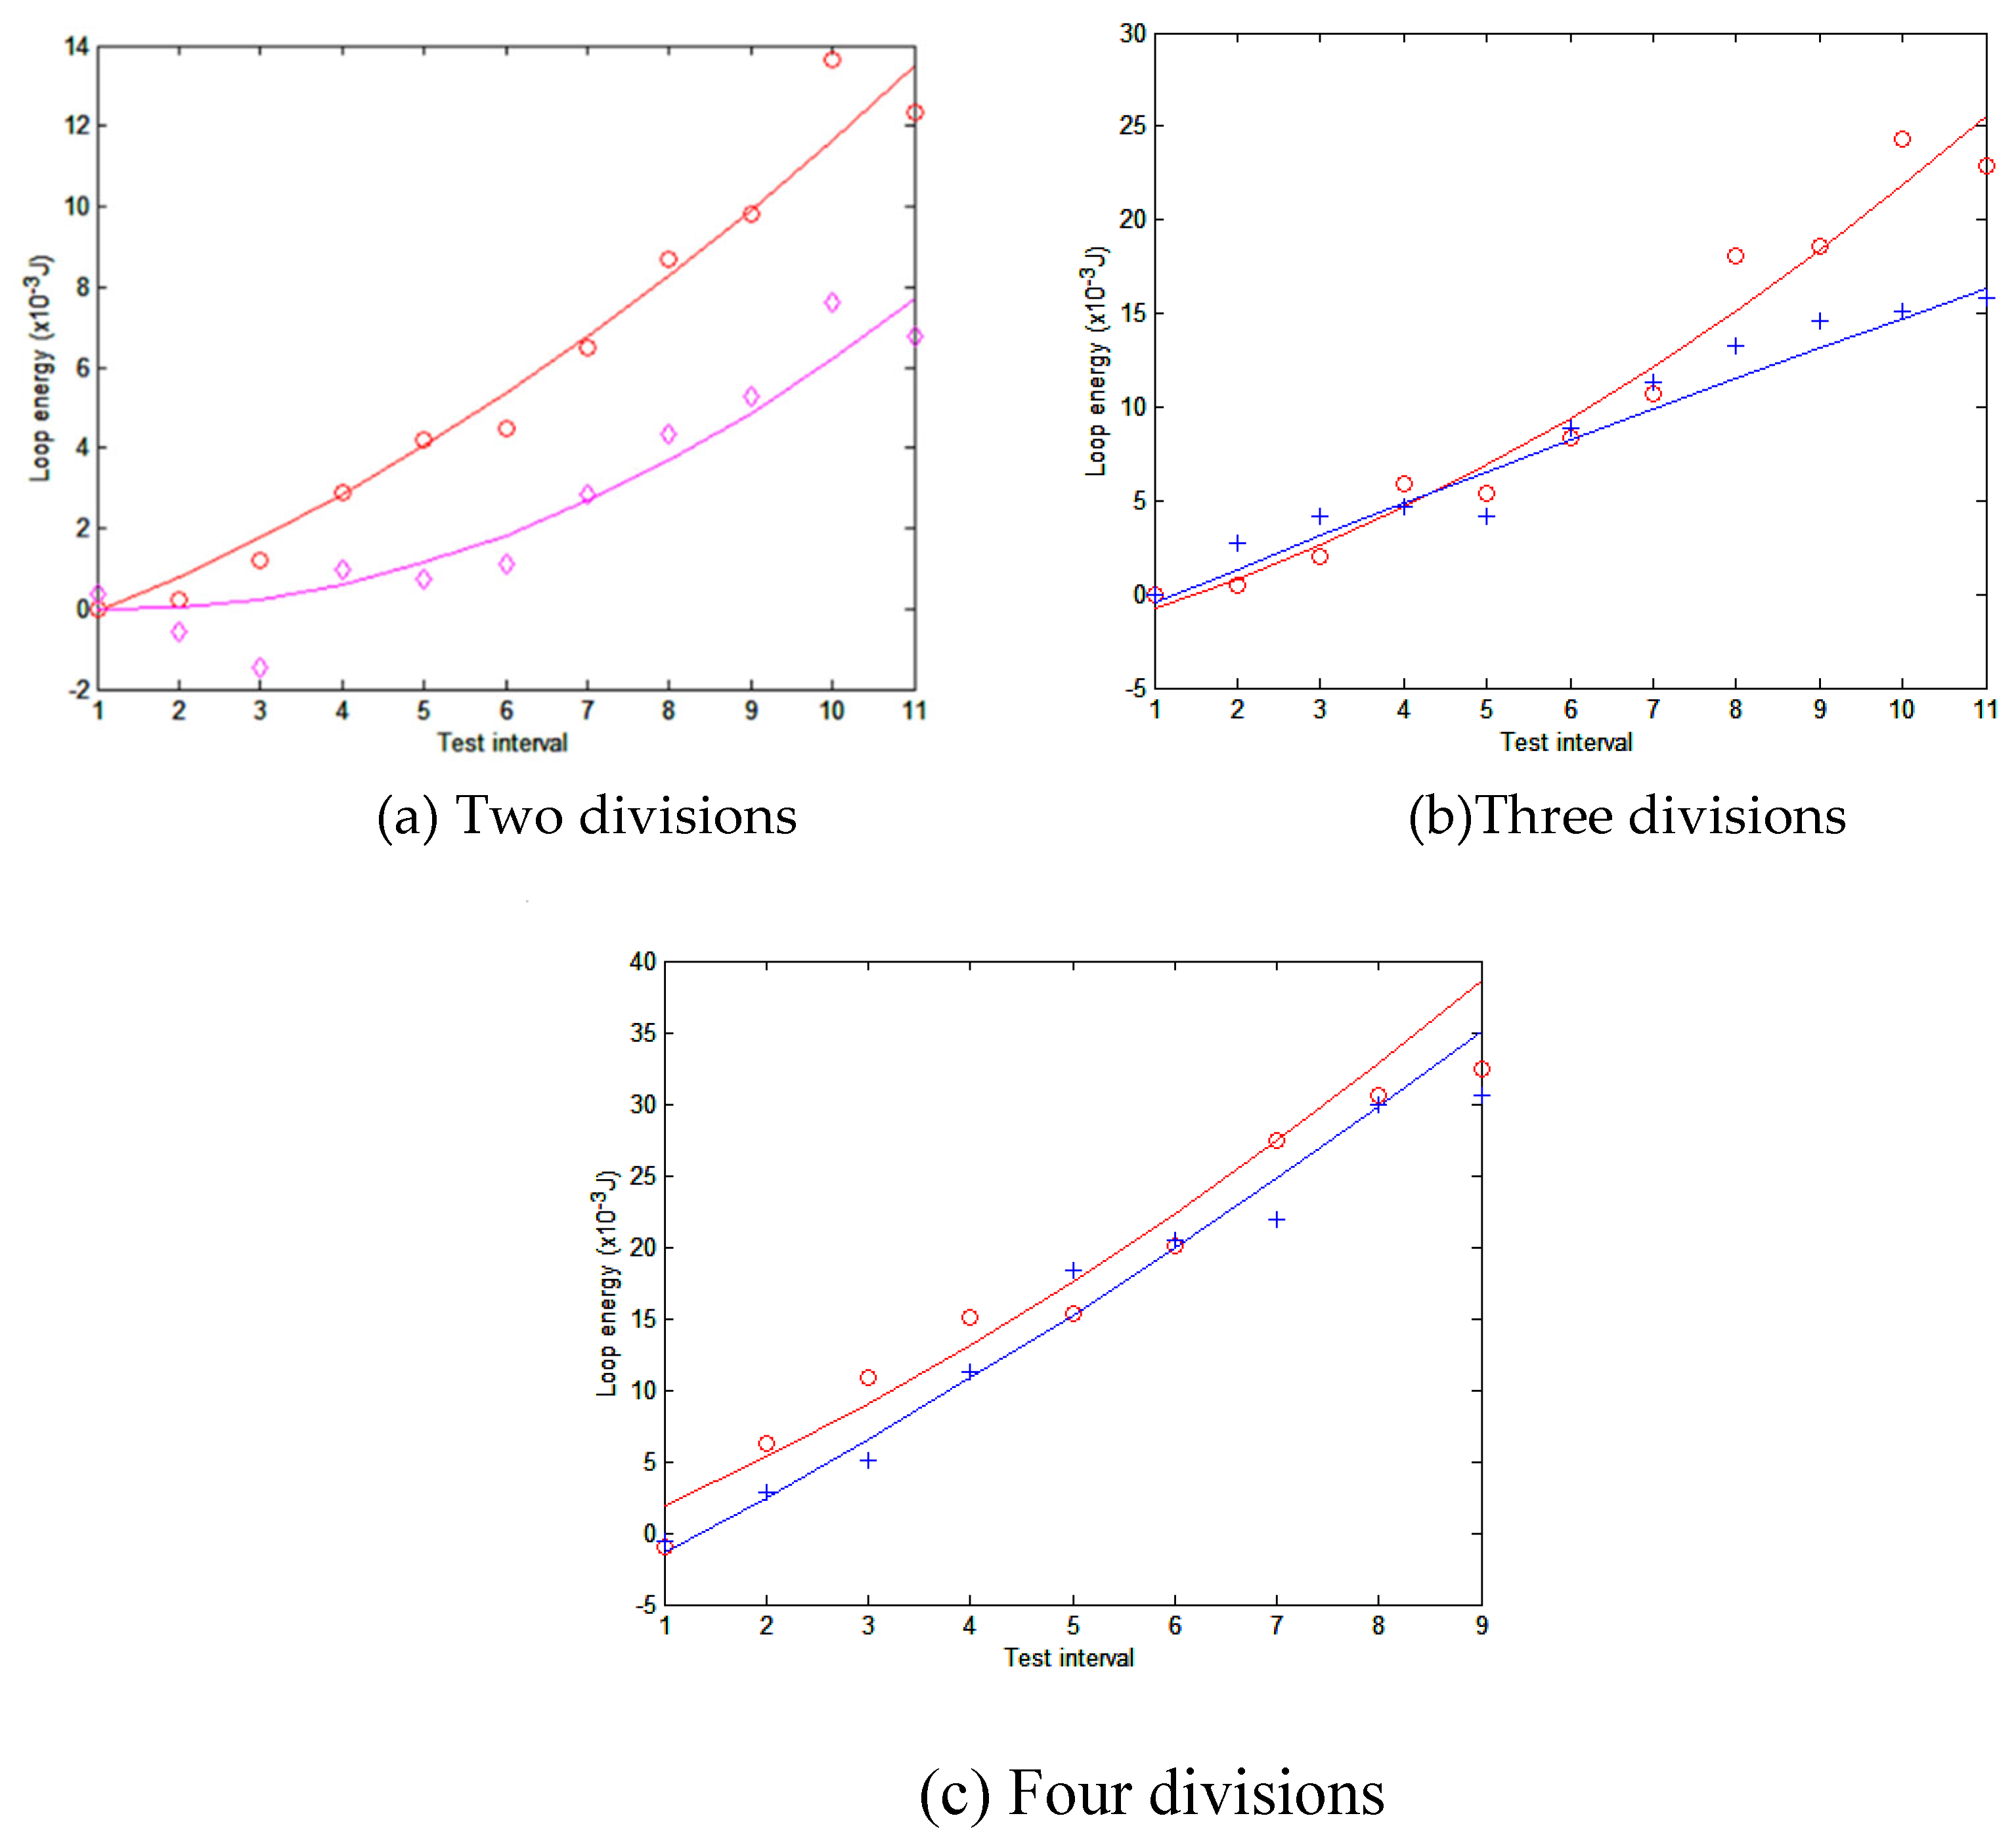
Figure 6 of size 15(L)x10(W)x4(T) in mm using scratching damper, the following sample tests in two to four divisions of the compression of spring pressure are conducted to investigate its material properties (such as Young’s modulus, hardness) in
Figure 7.
These load curves indicate that loop energy increases linearly with the interval load [
5,
6,
7,
8]. Some of the results are complied with Akono and Ulm [
7,
8,
9,
10] that scratching energy release rate increases with test load in quadratic curve. From
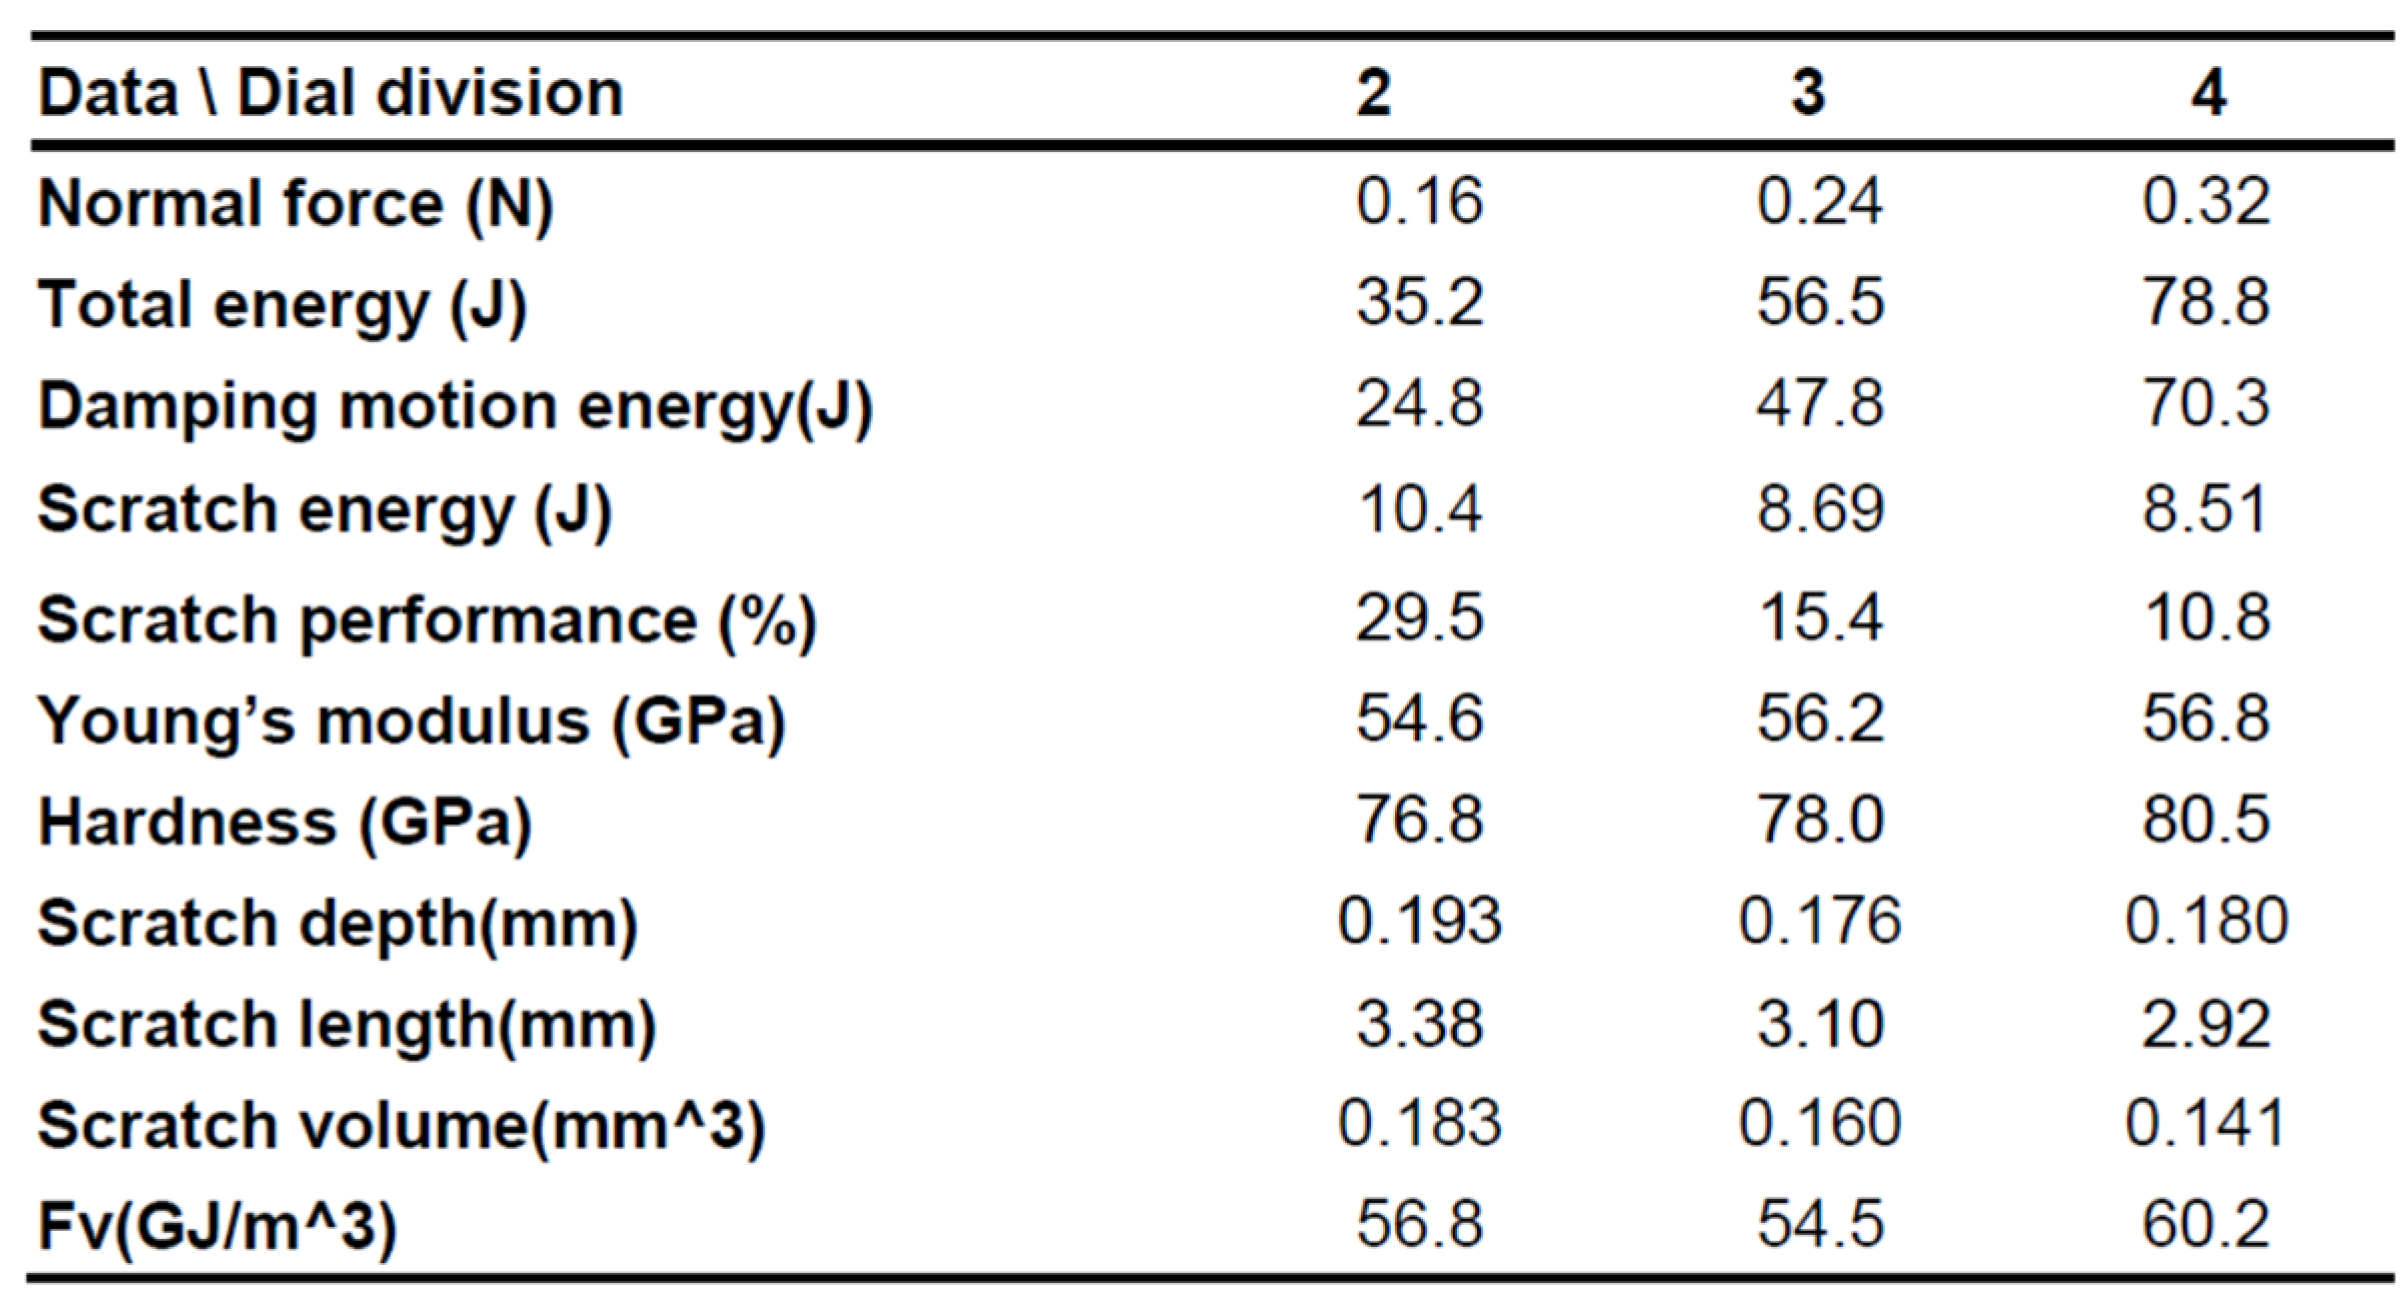
Table 1, one observes that normal force increases linearly with two to four dial divisions. However, the profile of loop damping energy per interval remains relatively constant.
Table 1.
Extruded aluminum material property comparison from scratching test.
Table 1.
Extruded aluminum material property comparison from scratching test.
The summation of loop energy per interval with pin conical rod is divisionals’ total energy expressed as
where
is single loop energy with pin rod,
i is number of test interval,
j is dial division of the test,
=9 Hz is fixed-sine test frequency,
= 48s is the test period. It is interesting to observe that shape of loop is highly repeatable within the same test period with nearly 500 cycles. Meanwhile, the summation of loop damping energy per interval with round rod is expressed as
where
is single loop energy with round rod. By Eq.(1), scratching energy per interval with
j divisions is
Divisional scratching energy release rate is
Meanwhile by Eq. (12), divisional Young’s modulus stands as
with notations in
j divisions. Results from two to four divisions are input to
Table 1. In general, their values decrease slightly with scratch performances and they tend to underestimate the actual
E. High performance indicates that scratching process follows scratch energy release rate. Two divisions is the best at 29.5%. Thus, by two divisional test, its
ith interval
is generated. From its
Nth data, ultimate Young’s modulus is obtained as
.
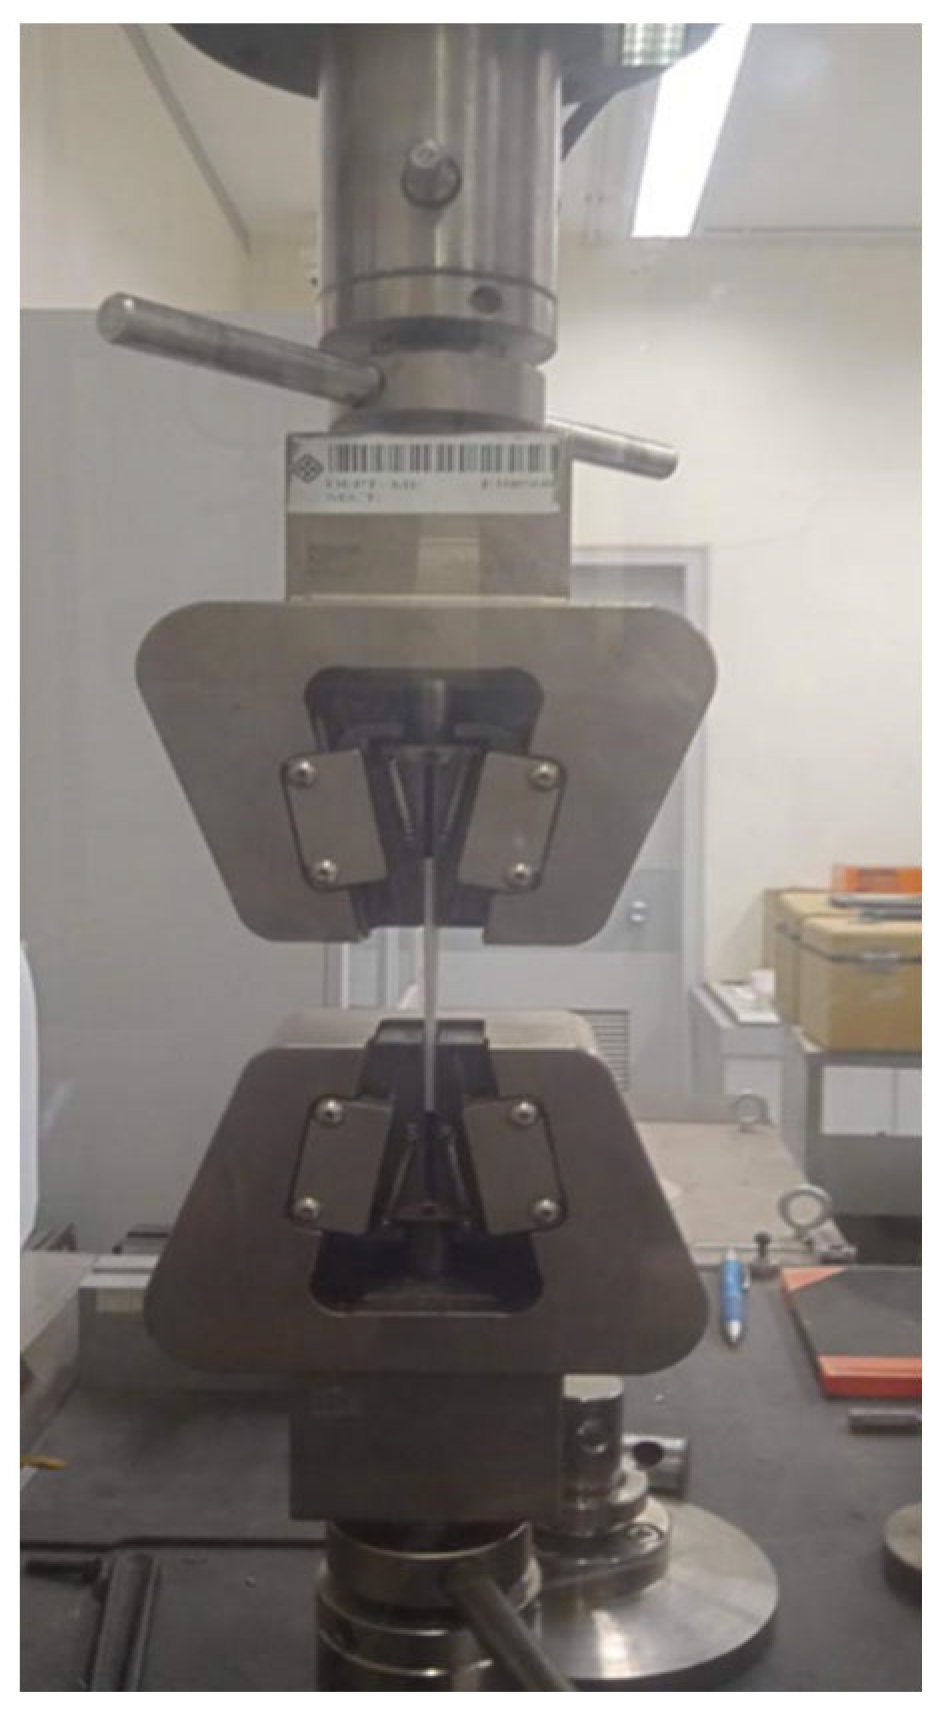
Tensile test is utilized to validate the Young’s modulus of extruded aluminum. Sample of nominal size in mm 57.4(L)x19.1(W)x2.76(T) is prepared conforming to the ASTM E 21 standards. Tensile testing machine is set to pull the sample as shown in
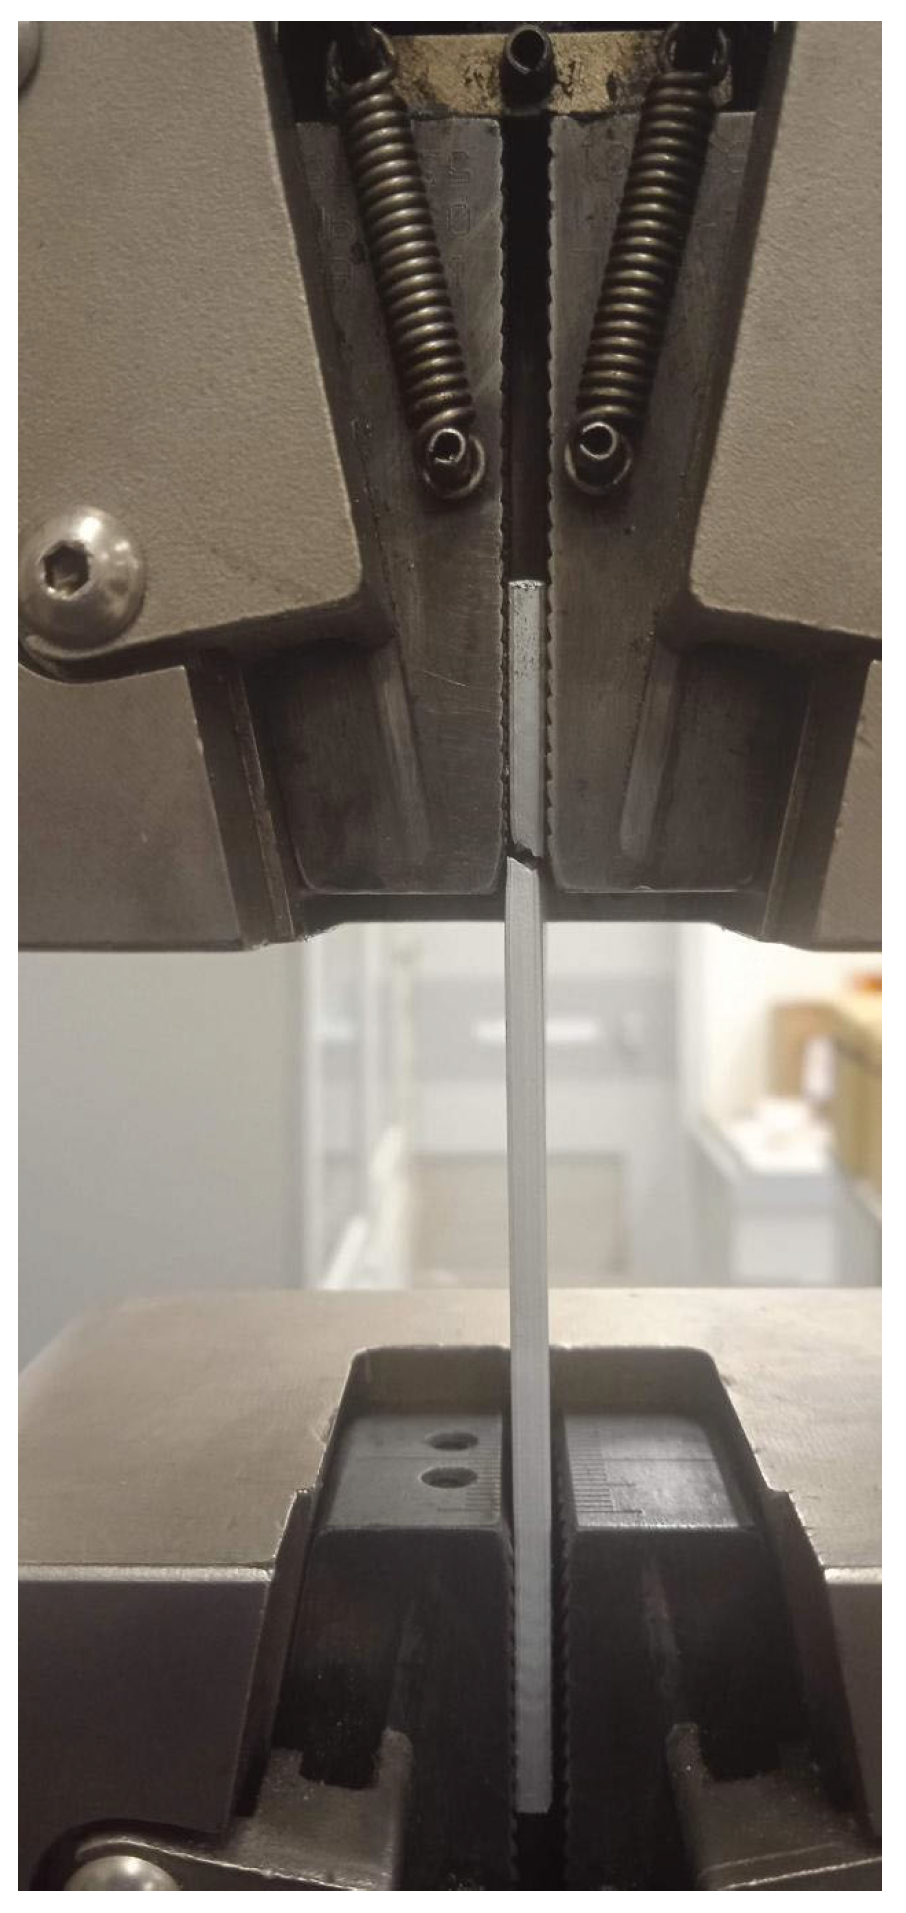
Figure 8 until its fracture is exhibited (
Figure 9). Stress and strain are calculated during the test by recording the applied tensile load and extension.
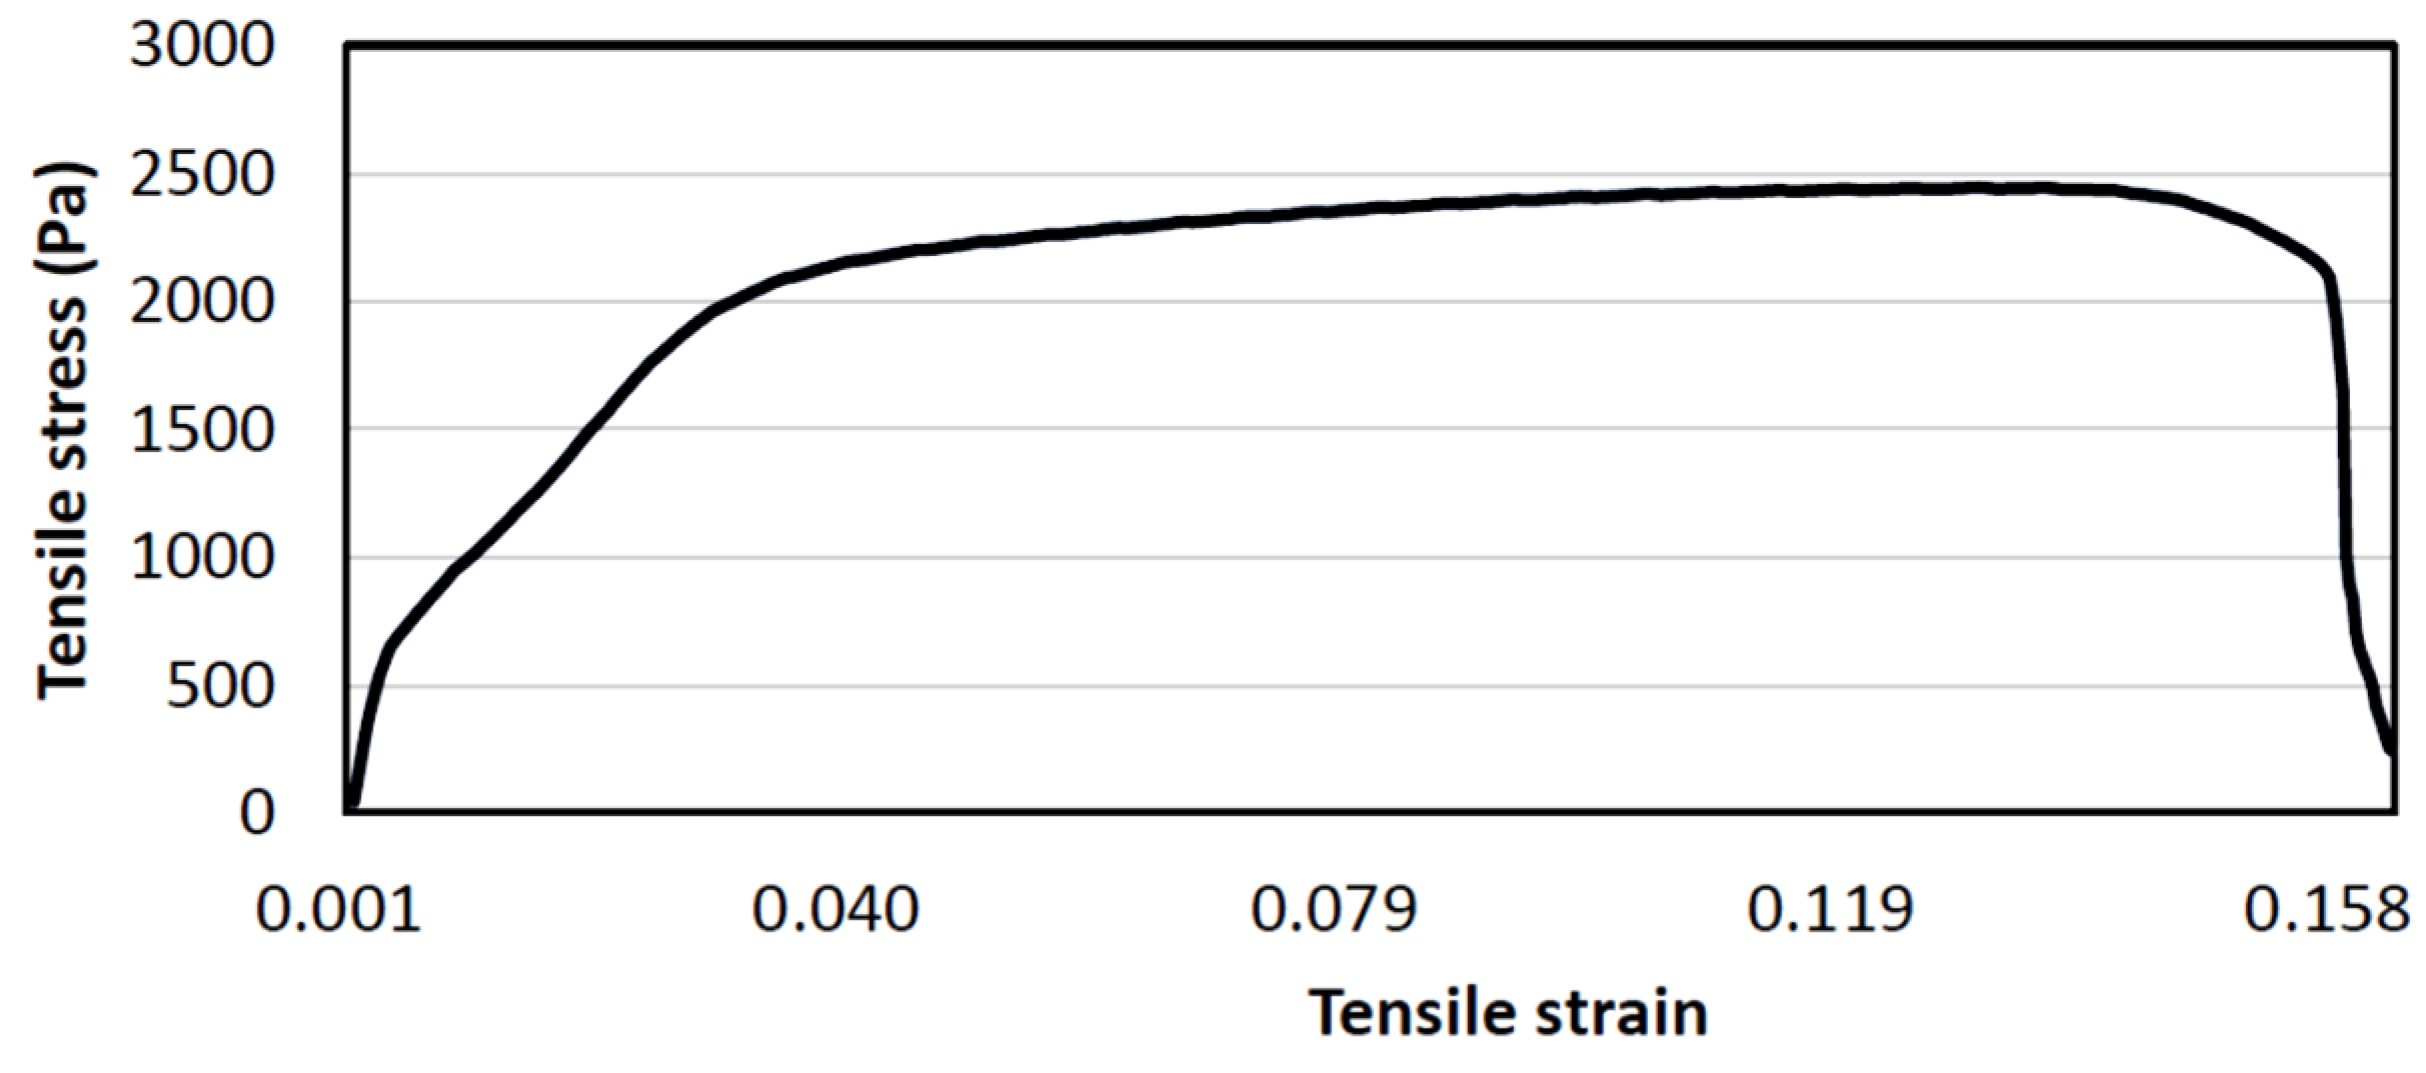
Stress-strain curve is generated by the machine as shown in
Figure 10.
According to the analysis of Su and Young [
9,
10,
11,
12], Young’s modulus of extruded aluminum varies linearly in initial stage of this curve. In the linear elastic region, the material behaves elastically, and the value of the Young’s modulus remains relatively constant. It is important to note that that as the material gets closer to its yield point, the point at which plastic deformation starts, this linear connection could not hold true at greater stress levels. Young's modulus will go down as the substance experiences plastic deformation. By examining the change in stress and strain values at distinct positions within the linear section, insights into the material’s behaviour can be sought and Young’s modulus based on the ratio of the changes in stress and strain can be calculated. In our case, change in stress and strain at separate positions 1 and 2 of linear section are computed. Slope of the curve is used to calculate the Young’s modulus of this sample as
The generated value is
which is +4.55% larger than
. Positive deviation arises at the elastic region estimation by tensile test. Thus, it tends to overestimate
at plastic region. For extruded aluminum, it’s normalised dependence of Young’s modulus ratio
on the apparent density
for flat bar sample [
11,
12,
13,
14] is
where w = 0.974 is fitting constant, u is fitting exponent. Using digital weight test, experimental is found to be 0.91. Substituting and into this equation, u is determined to be 1.479. Now substituting the scratch into Eq. (23), scratch is computed as 0.844 which being -7.2% deviation from experimental value.
3.2. Hardness Estimation and Brinell Test
Hardness of extruded aluminum is computed as follows. Divisional contact stiffness is given as
where
is the scratch head correction factor. From this equation, hardness is computed. Its four divisions
P-h curve is best fitted with results of Zheng et al. [
7]. Thus, it is used for analysis of divisional hardness. Meanwhile, divisional hardness is computed as
Using load data from two to four divisions, their hardness are generated in
Table 1. They increase with the divisional number. Using four divisional test, ultimate hardness is calculated using its
Nth data as
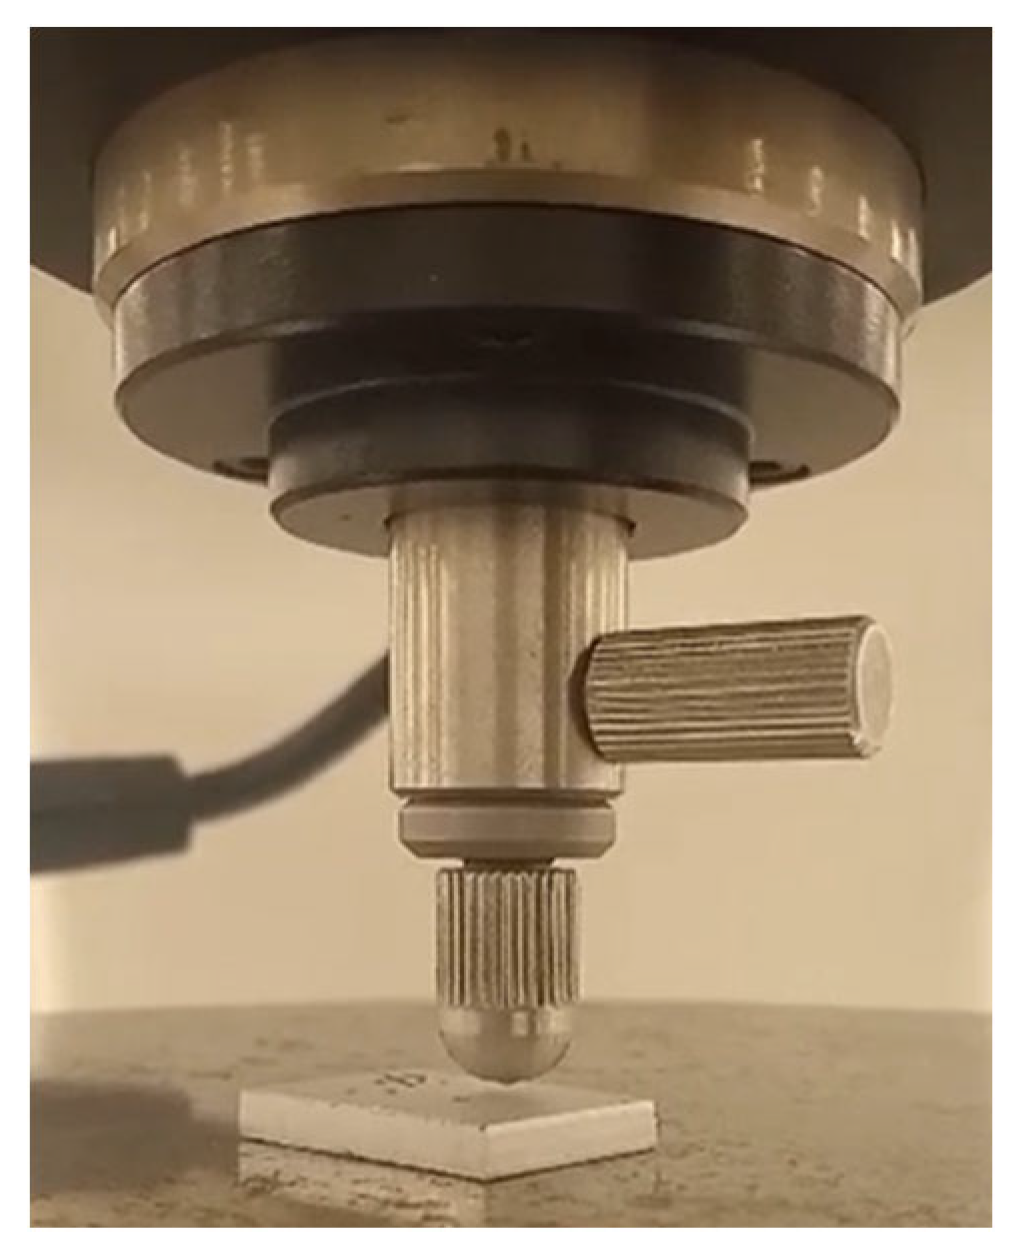
For existing standard tests, hardness can be measured through hardness tester and tensile test. Considering the Brinell hardness tester in
Figure 11 illustrating principle of the Brinell indenting process, an indenting load of 100
Kgf is exerted on the surface of the extruded aluminum sample plate through hardened steel ball of 1/16 inch diameter. After applying the load, a holding time of 15 s was used to ensure that the plastic flow of the testing material has ceased. It can avoid indenter from springback action and prevents from obtaining inaccurate diameter of the indented impression. The Brinell hardness number is related to the average flow stress of the material in the volume subjected to plastic deformation. Also, the required specifications on sample thickness were followed. The thickness of the specimen was at least ten times the depth of the indentation to avoid any breakage of the sample under high force. It also prevents samples from bending leading to accuracy of the test.
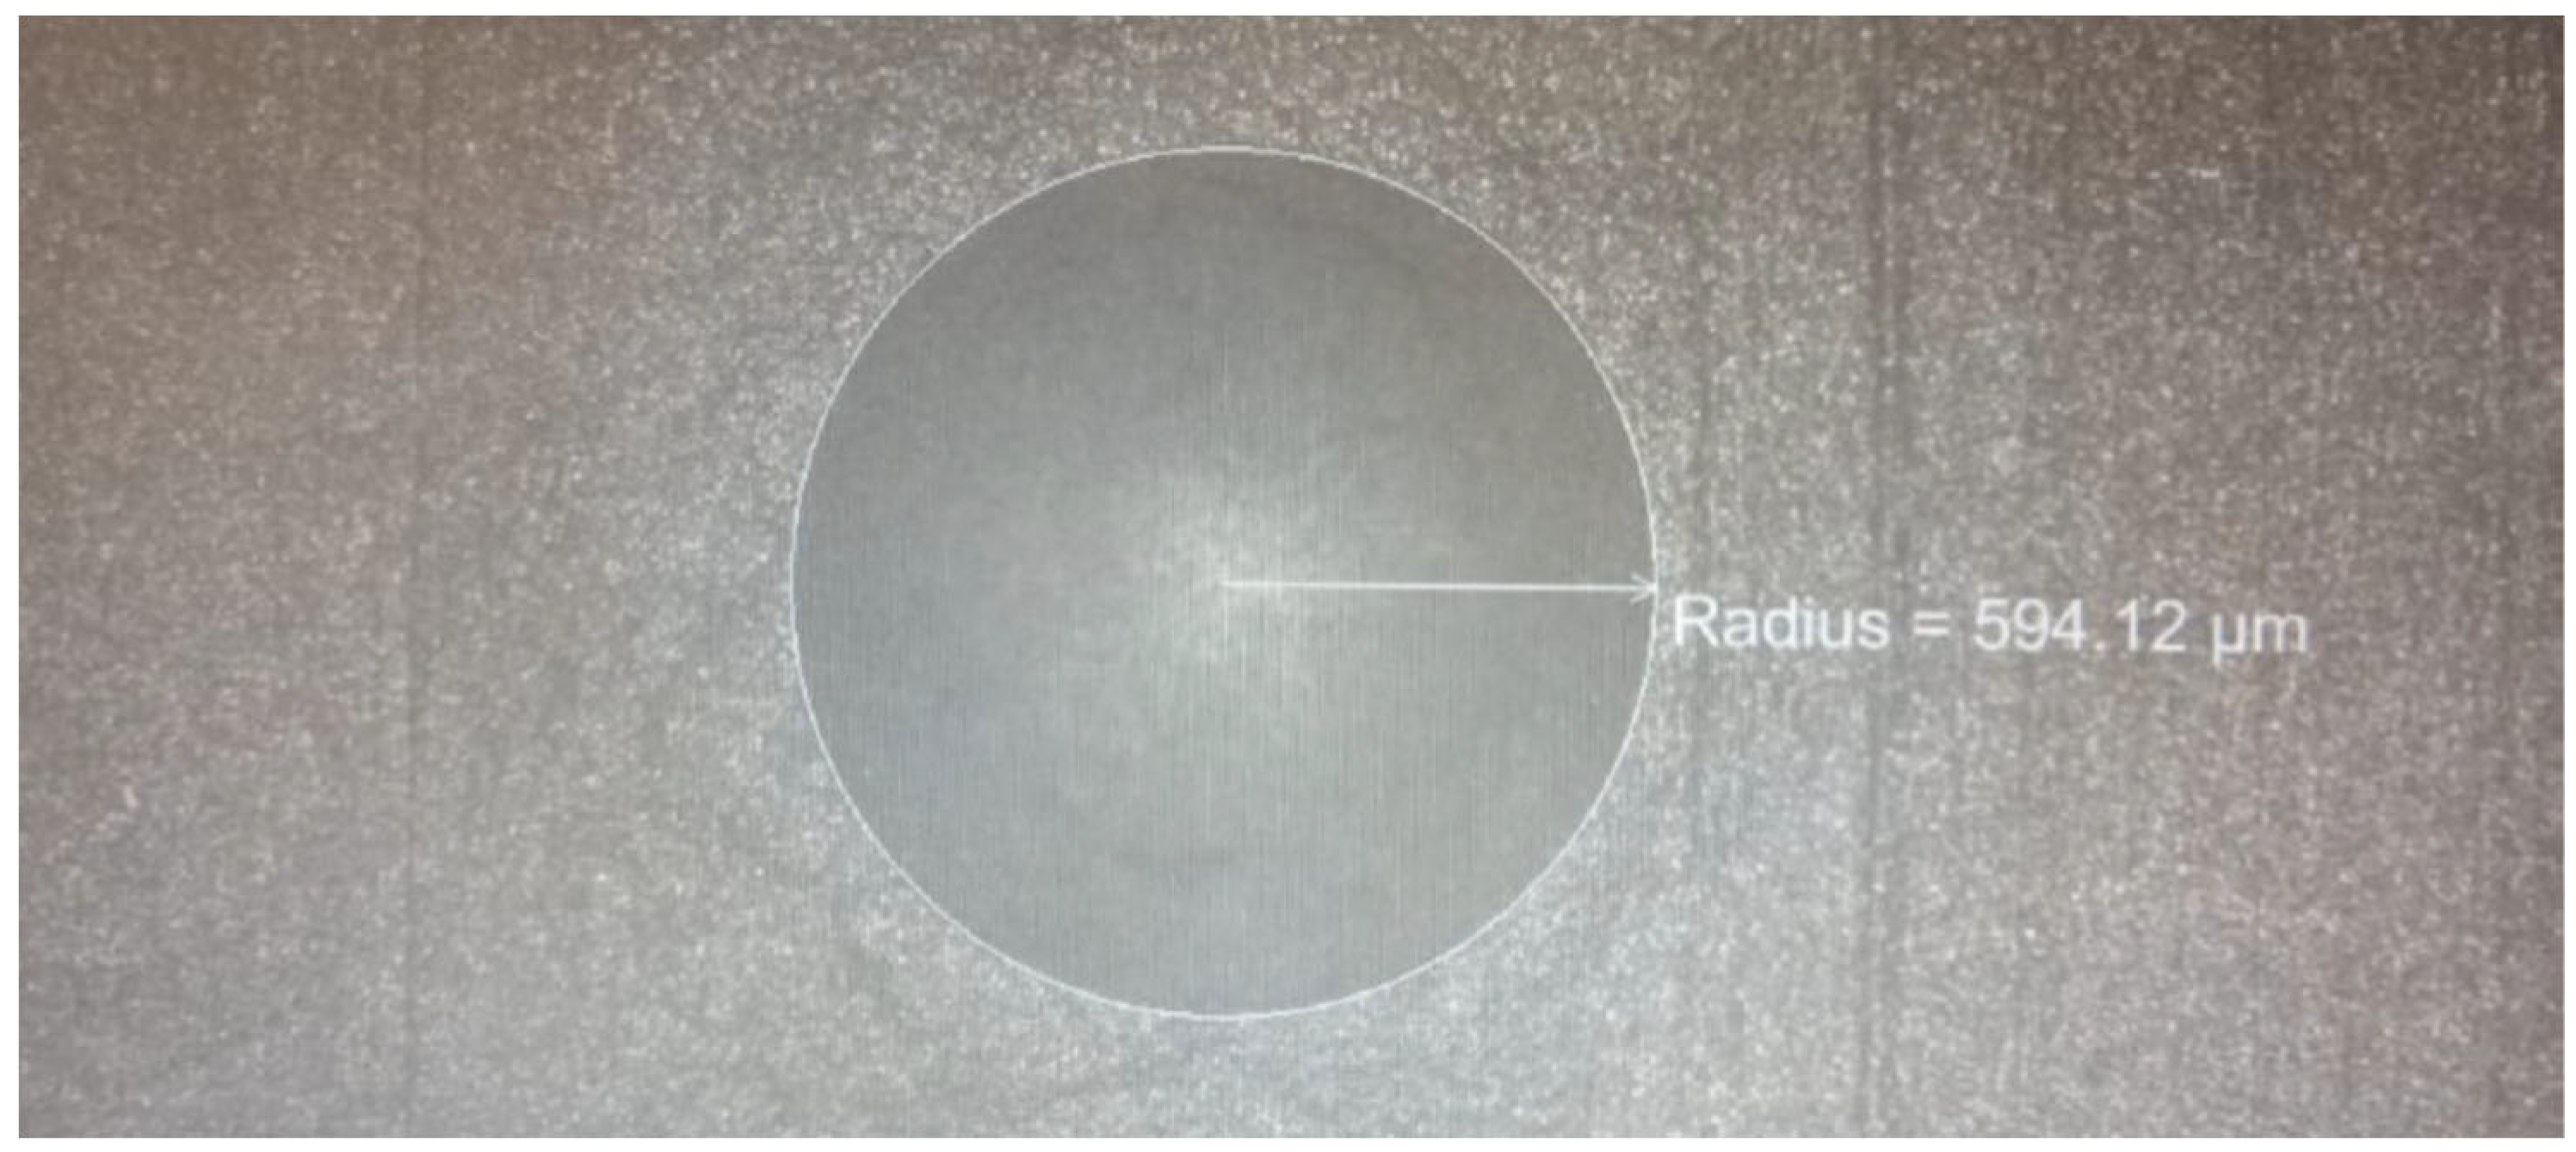
Multiple tests were carried out using same size samples. Brinell hardness number was used to compare the actual hardness. The microscopic image of an indentation on an aluminum sample in the specific experiment is shown in
Figure 12. Diameter of resulting permanent impression on the sample measured is
. Ultimately, Brinell hardness number [
12,
13,
14,
15] is computed as
where is the load on the indenting tool, is the diameter of steel ball, is measured diameter at the rim of indentation. As compared with , percentage difference is -6.89%. Negative deviation arises at estimation of higher peak load by the damper near the plastic region. Thus, it tends to overestimate at elastic region. Material with lower modulus of elasticity will have a lower BHN. The modulus of elasticity of a material is the cause for the BHN of that material. The materials’ modulus of elasticity here indicates how resistant it is to elastic deformation when stress is applied to it. The modulus of elasticity has affected the hardness of the material. Note that BHN has the dimension of stress but is usually quoted by mass per unit area.
Additionally, using the stress-strain curve of tensile test at 0.2% plastic deformation, the offset yield strength is taken as 72.1GPa. By the interpolated data curve, this corresponds to tensile test hardness of 77.7GPa. Comparing with the , it is only -3.15% deviated. Hence scratch hardness computed by Eq.(25) is fully validated.
3.3. Dimension Inspection and Performance Evaluation
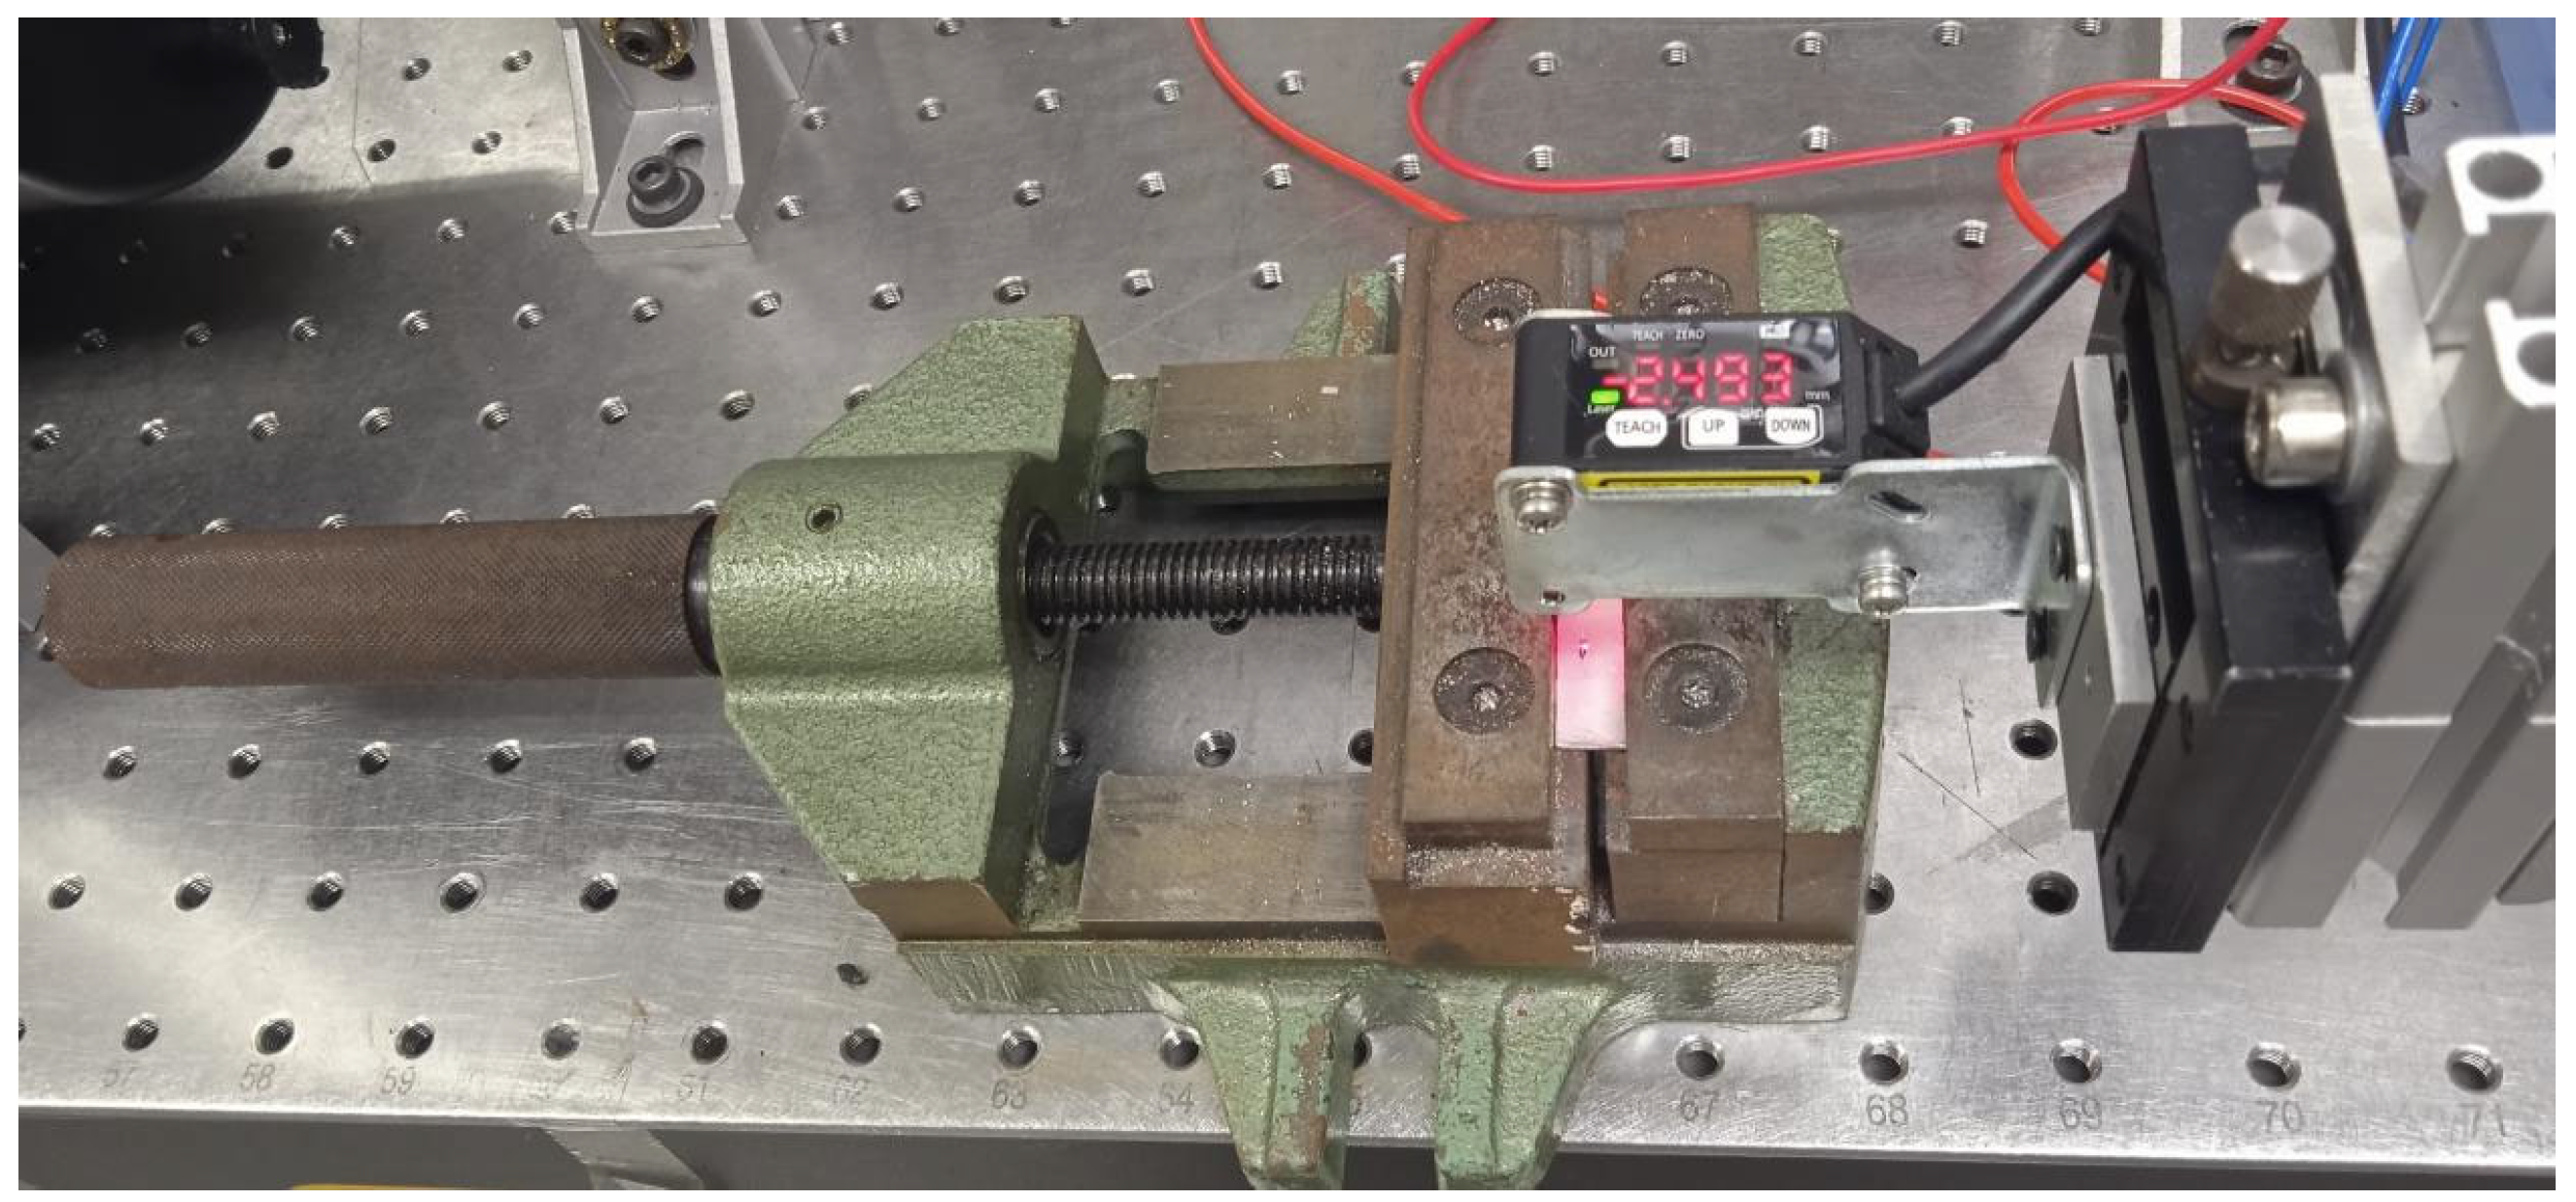
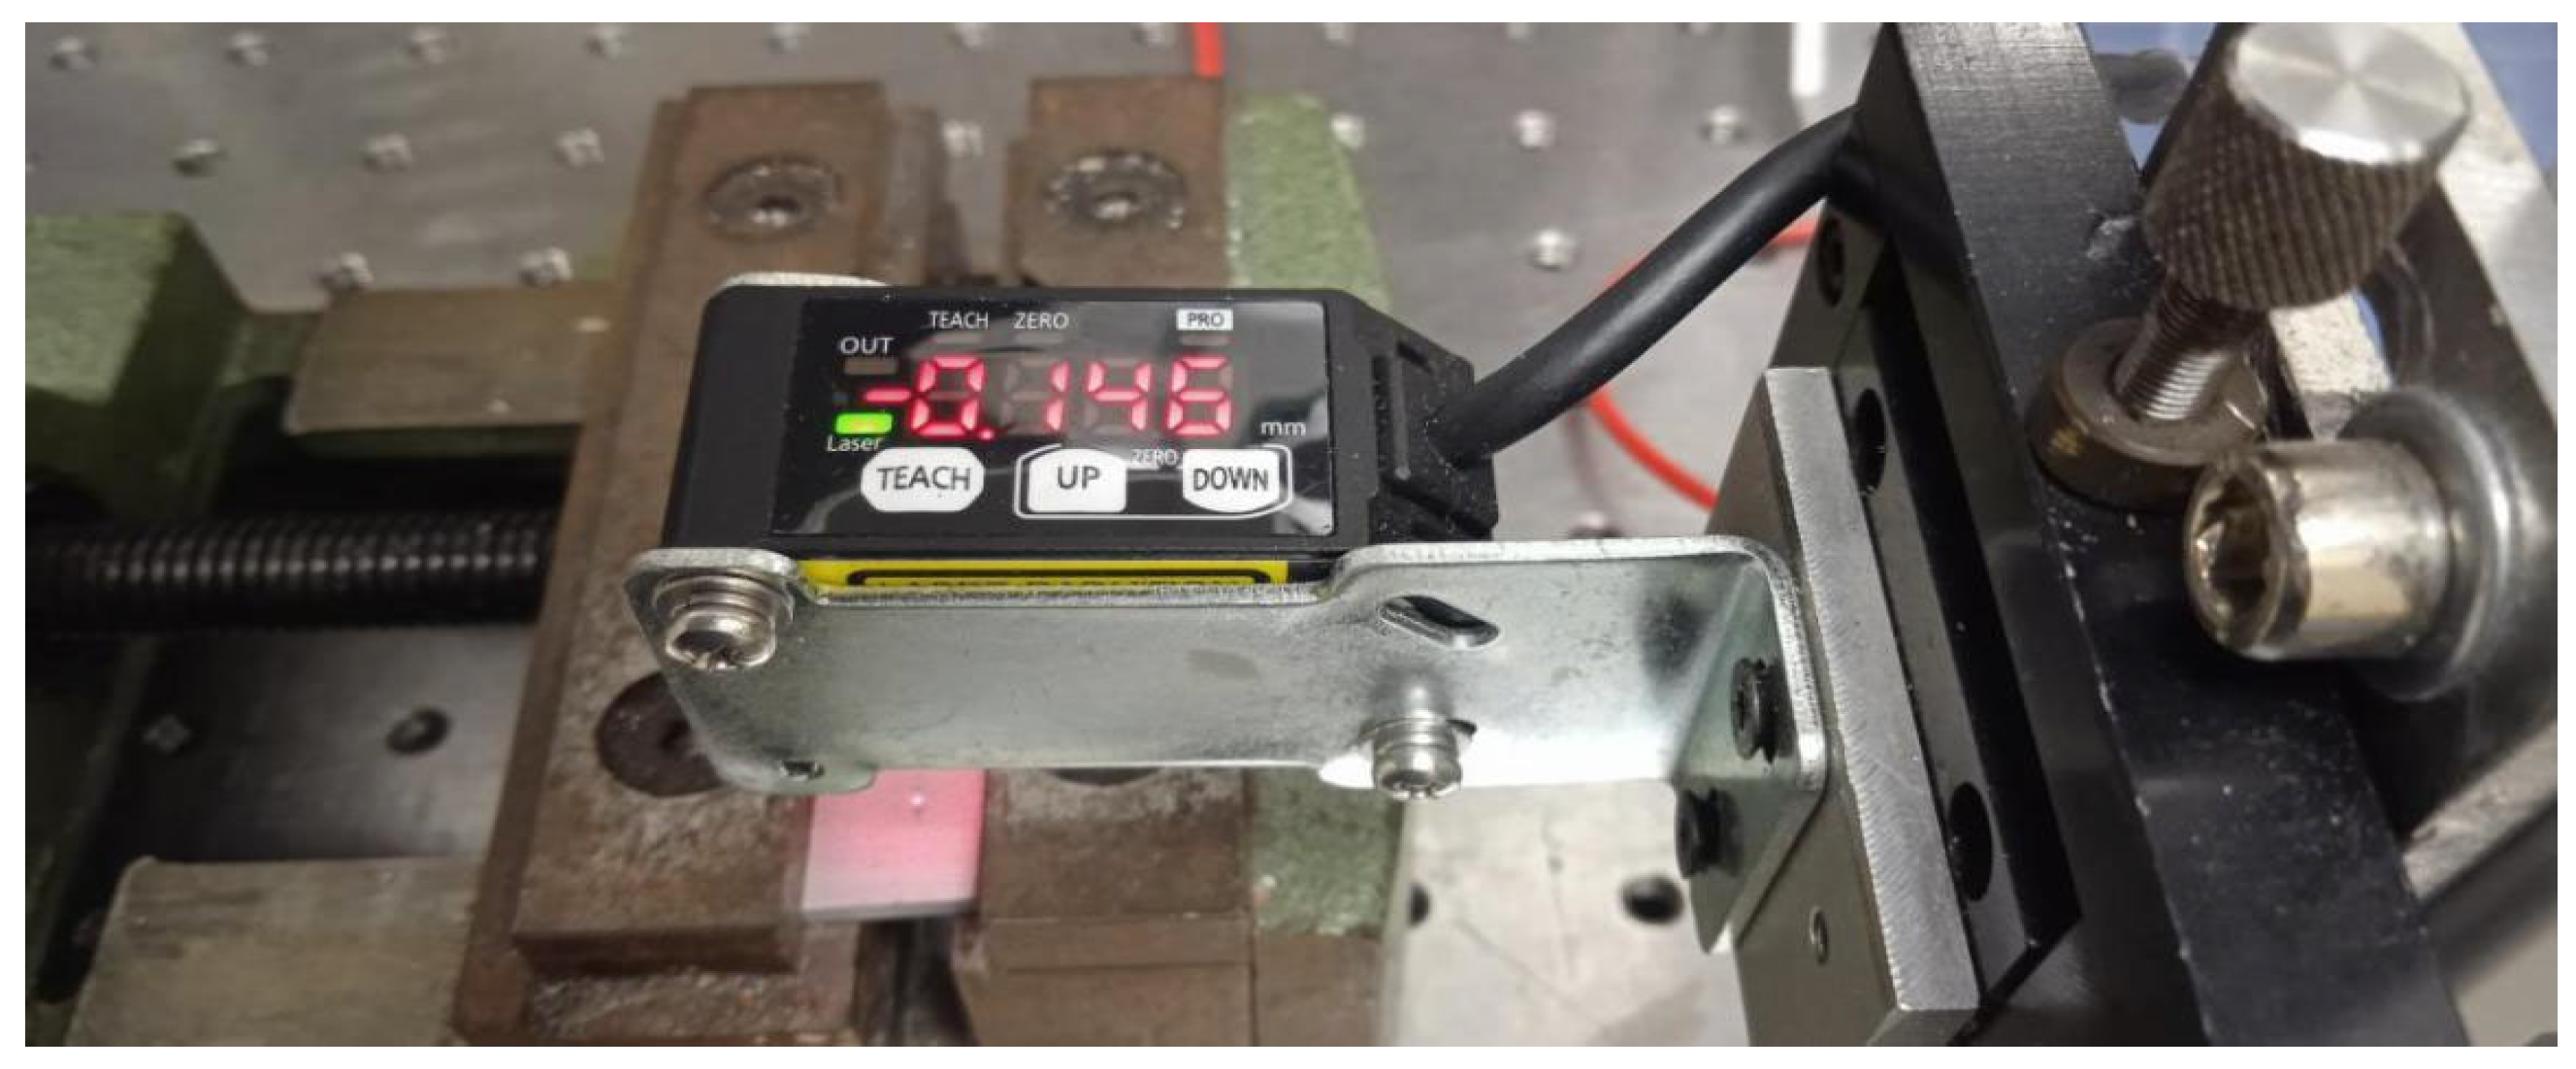
In order to check the physical depth of the scratching track, laser sensor (
Figure 13) is used to measure the depth of each track on the divisional samples (
Figure 14).
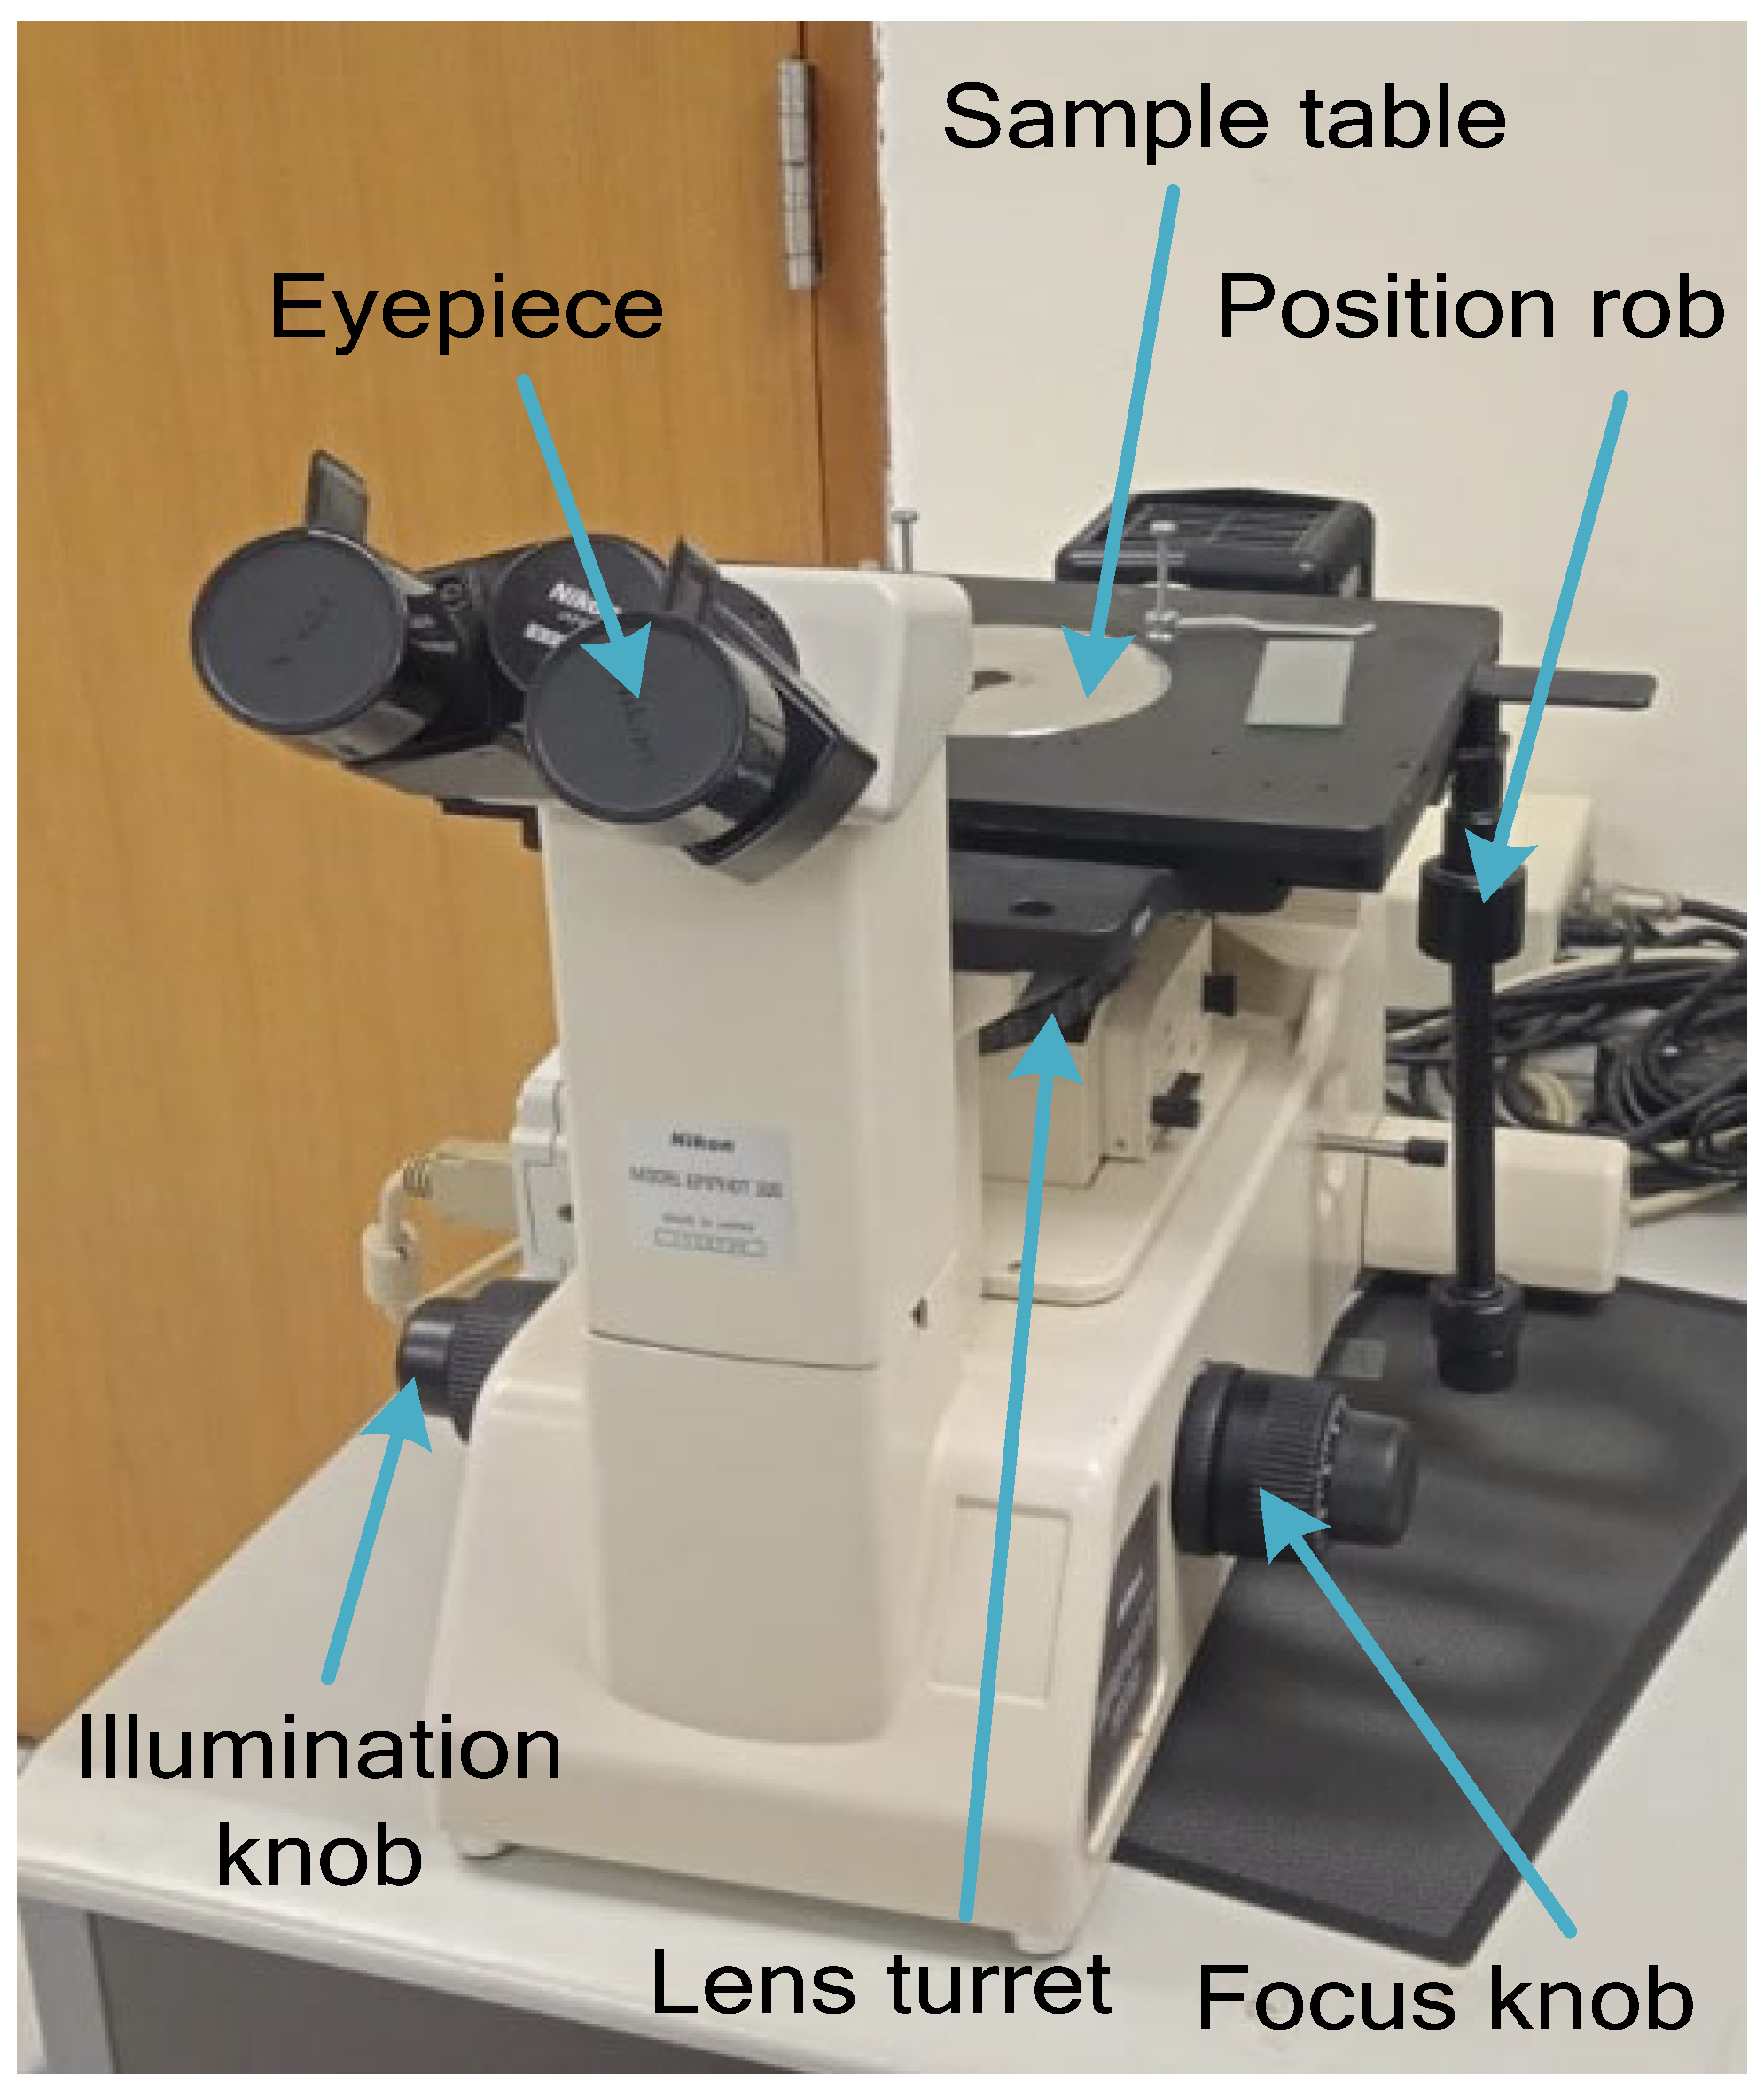
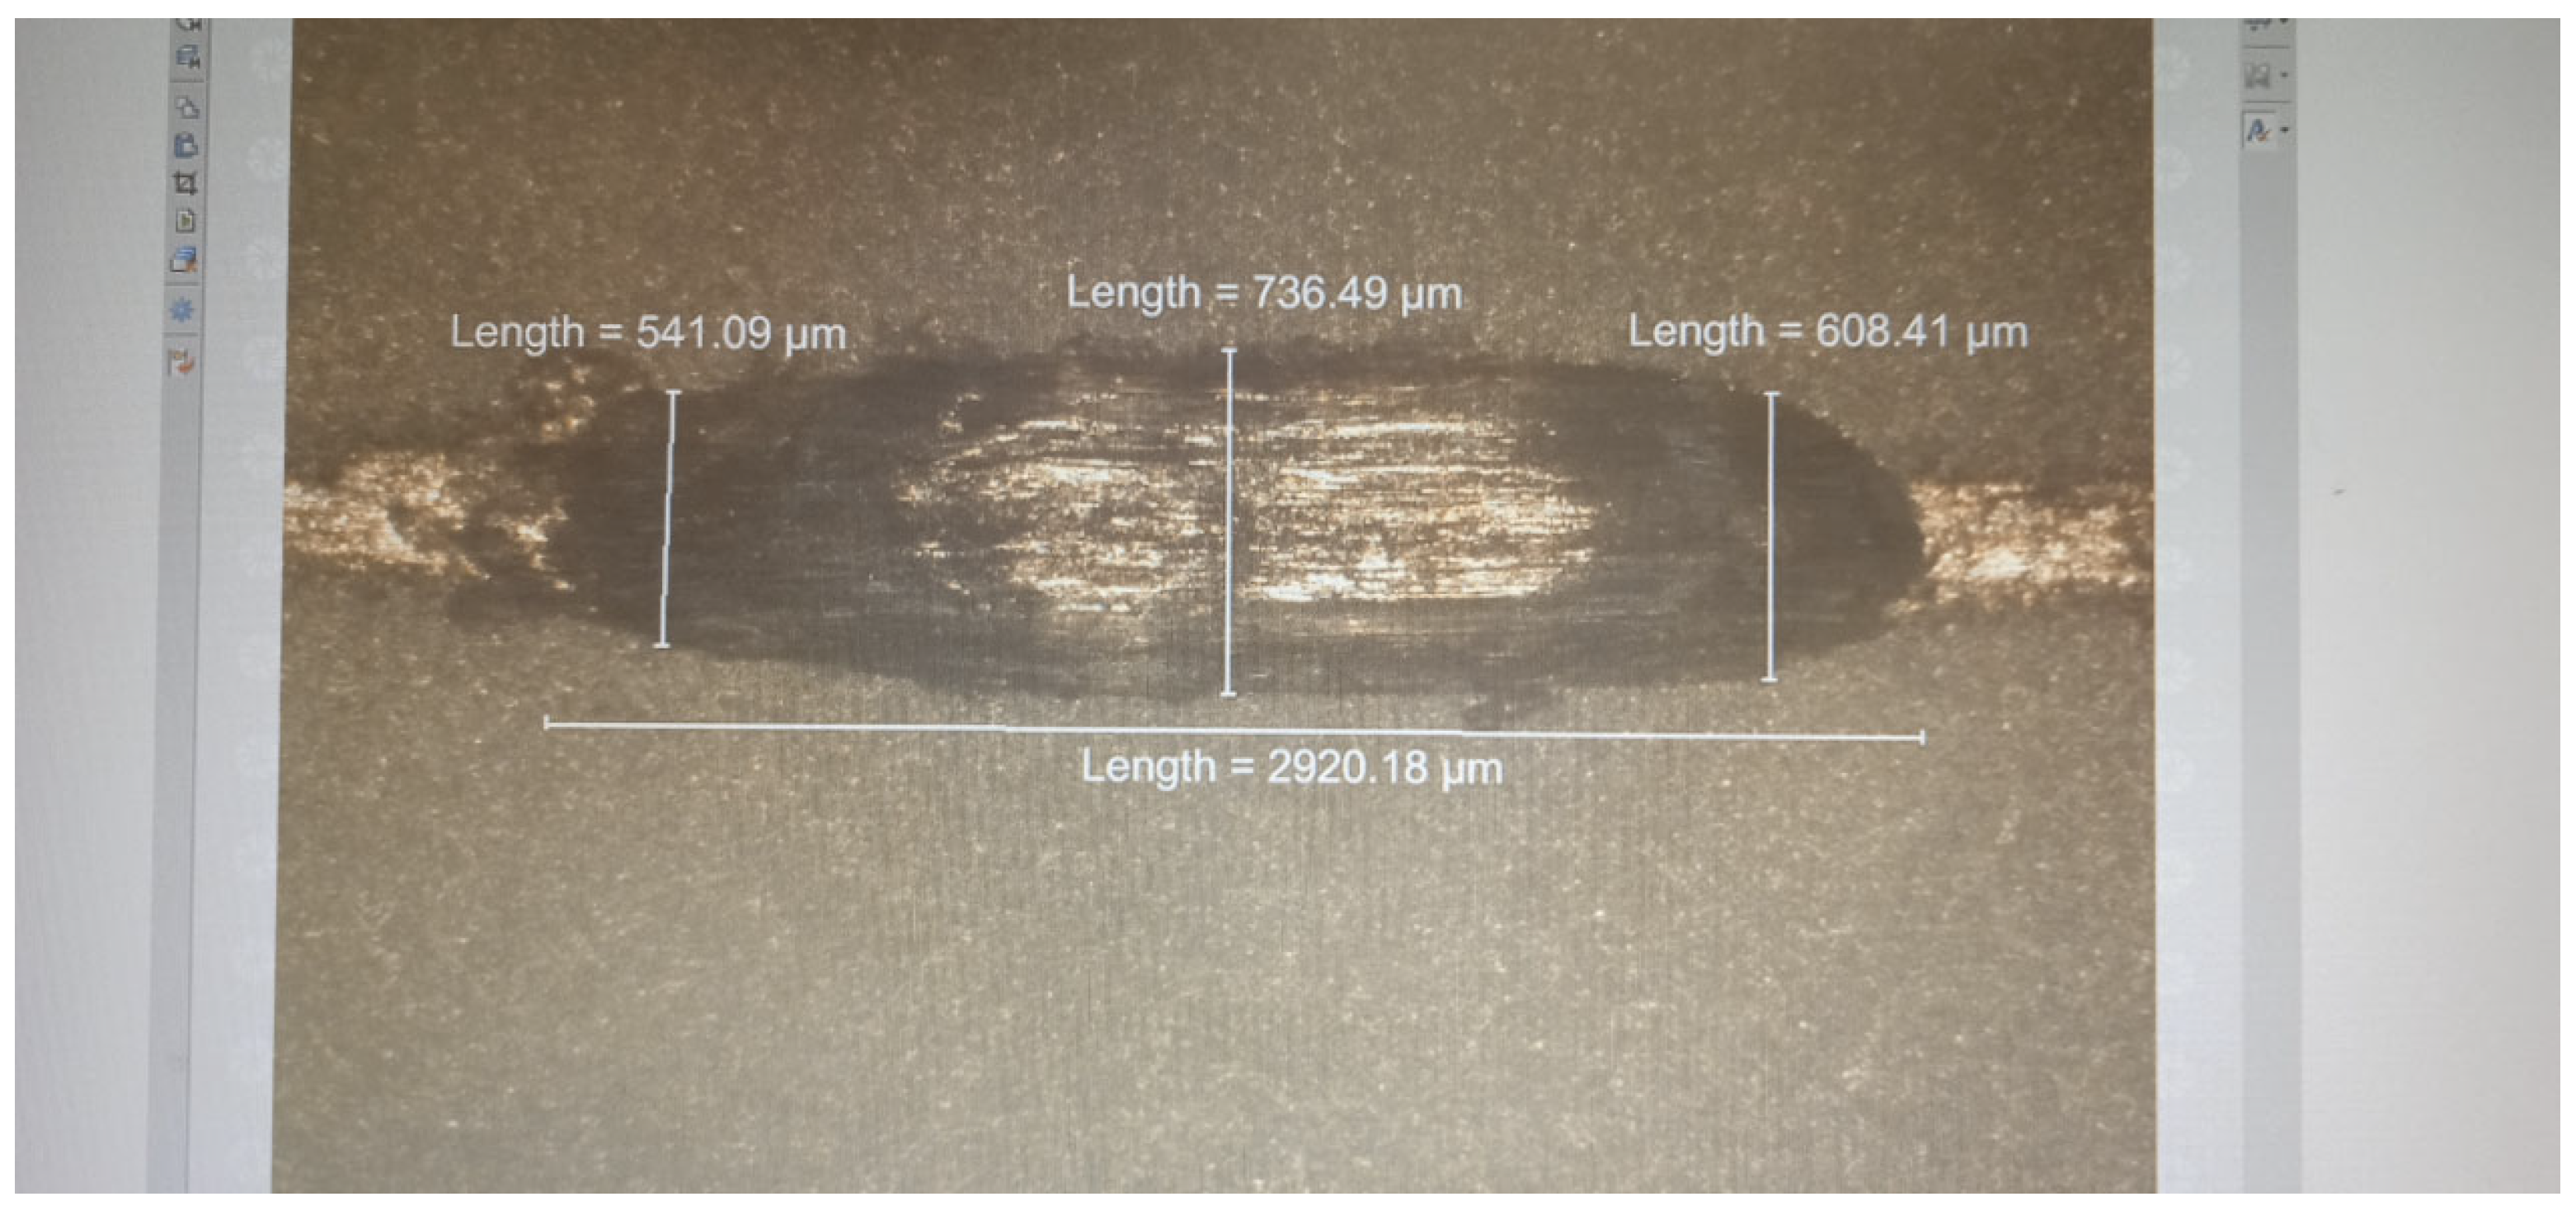
Moreover, microscope shown in
Figure 15 is used to determine the physical dimensions of the scratching track (
Figure 16) which were smooth and measurable.
The data measured from the scratch test is shown in
Table 1 and was used to compute the material removal volume
. The scratching energy factor at
j division,
is computed by Eq.(1) as listed in
Table 1. From
Table 1, it is observed that
increases linearly with
j. Simultaneously,
increases with
j with larger linear rate. As a result,
decreases with
j but gets saturated at four divisions test. Overall scratching performance
, decreases with
j. This is in agreement with the slightly increasing trend seen in
and
estimations. On the other hand,
is fluctuating around a constant value and is independent of the performance. Hence it is independent of
i or
j, and is in agreement with the energy conservation principle in Eq. (1).
4. Conclusions
In this paper, a scratching damper is developed based on the scratching device. Cyclic vibration load is applied by the damper creating highly repeatable load-path loop. Smooth fracture surface was obtained and was measurable at microscopic scale. Round head indenter is used to provide pure damping motion, while pin head indenter is used to produce significant scratching motion. Scratching energy release rate was generated using free energy density and displacement gradient. and are computed to estimate . is found to be stable round agreeing with the energy conservation principle. Upon comparing the Young’s modulus,from tensile test, it is 4.55% more than that of obtained from scratch test. Moreover, hardness, is only 6.89% more than . The results discussed here furthers work into innovative methods in developing devices and approaches to determine material properties.
Author Contributions
Conceptualization, CN Wong and WO Wong; methodology, CN Wong and A Vyas.; software, CN Wong.; validation, CN Wong, WO Wong and A Vyas; formal analysis, CN Wong; investigation, CN Wong.; resources, WO Wong and R Sun.; data curation, CN Wong and A Vyas; writing—original draft preparation, CN Wong.; writing—review and editing, A Vyas and WO Wong; visualization, CN Wong and A Vyas ; supervision, WO Wong.; project administration, WO Wong; All authors have read and agreed to the published version of the manuscript.
Funding
This research received no external funding.
Data Availability Statement
Research data may be shared upon request.
Acknowledgments
The authors would like to thank The Hong Kong Polytechnic University for the laboratory support of the experiments in this research.
Conflicts of Interest
The authors declare no conflicts of interest.
References
- K. Kamplade, D. Biermann, Examination of the Material Removal of unreinforced, thermoplastic Polymers by Scratch Tests. Production Engineering 2019, 13, 713–719. [CrossRef]
- M. Varga, S. Leroch, H. Rojacz, M. R. Ripoll, Study of wear mechanisms at high temperature scratch testing. Wear 2017, 388-389, 112–118. [CrossRef]
- H. Li, X. Zhang, Xiufeng Yang, Numerical study of liquid sloshing using smoothed particle hydrodynamics with adaptive spatial resolution. Engineering Analysis with Boundary Elements 2024, 159, 272–287. [CrossRef]
- Akono, F. Ulm, An improved technique for characterizing the fracture toughness crack growth. Wear 2014, 313, 117–124. [CrossRef]
- A.R. Torabi, B. Shahbazian, Notch tip plastic zone determination by extending Irwin’s model. Theoretical and Applied Fracture Mechanics 2020, 108, 102643. [CrossRef]
- J.M. Souza, H.N. Yoshimura, F.M. Peres, C.G. Schön, Effect of sample pre-cracking method and notch geometry in plane strain fracture toughness tests as applied to a PMMA resin. Polymer Testing 2012, 31, 834–840. [CrossRef]
- W. Zheng, Y. Wang, M. Zhou, et.al., Material deformation and removal mechanism of SiCp/Al composites in ultrasonic vibration assisted scratch test. Ceramics International 2018, 44, 15133–15144. [CrossRef]
- Z. Qiu, C. Liu, X. Yang, et.al., Crack propagation and the material removal mechanism of glass–ceramics by the scratch test. Mechnical behavior of biomedical materials 2016, 64, 75–85. [CrossRef] [PubMed]
- S. Al Wakeel, M.H. Hubler, Introducing heterogeneity into the micro-scratch test fracture toughness relation for brittle particle composites. Experimental Mechanics 2018, 58, 1237–1247. [CrossRef]
- Akono, F. Ulm, Fracture scaling relations for scratch tests of axisymmetric shape. Mechanics and Physics of Solids 2012, 60, 379–390. [CrossRef]
- K. Kamplade, D. Biermann, Examination of the material removal of unreinforced, thermoplastic polymers by scratch tests. production engineering 2019, 13, 713–719. [CrossRef]
- M. Su, B. Young, Material properties of normal and high strength aluminum alloys at elevated temperatures. Thin-Walled Structures 2019, 137, 463–471. [CrossRef]
- L. Hemmouche, D. Chicot, A. Amrouche, et al., An analysis of the elastic properties of a porous aluminum oxide film by means of indentation techniques. Materials Science and Engineering: A 2013, 585, 155–164. [CrossRef]
- J. Kovacik, F. Simancik, Aluminum foam - Modulus of elasticity and electrical conductivity according to percolation theory. Scripta Materialia 1998, 39, 239–246. [CrossRef]
- M.M. Ali, A.N.M. Omran, M.A. Mohamed, Prediction the correlations between hardness and tensile properties of aluminum-silicon alloys produced by various modifiers and grain refineries using regression analysis and an artificial neural network model. Engineering Science and Technology 2021, 24, 105–111.
|
Disclaimer/Publisher’s Note: The statements, opinions and data contained in all publications are solely those of the individual author(s) and contributor(s) and not of MDPI and/or the editor(s). MDPI and/or the editor(s) disclaim responsibility for any injury to people or property resulting from any ideas, methods, instructions or products referred to in the content. |
© 2024 by the authors. Licensee MDPI, Basel, Switzerland. This article is an open access article distributed under the terms and conditions of the Creative Commons Attribution (CC BY) license (http://creativecommons.org/licenses/by/4.0/).
