Submitted:
07 May 2024
Posted:
07 May 2024
You are already at the latest version
Abstract
Keywords:
1. Introduction
2. Materials and Experiments
2.1. As-Received Material
2.2. Mechanical Tests
2.3. Microstructure Characterization
3. Shakedown Theory Model
3.1. Main Equations
3.2. Ohno-Abdel-Karim Nonlinear Kinematic Hardening
3.3. Determination of Material Parameters
4. Results and Discussion
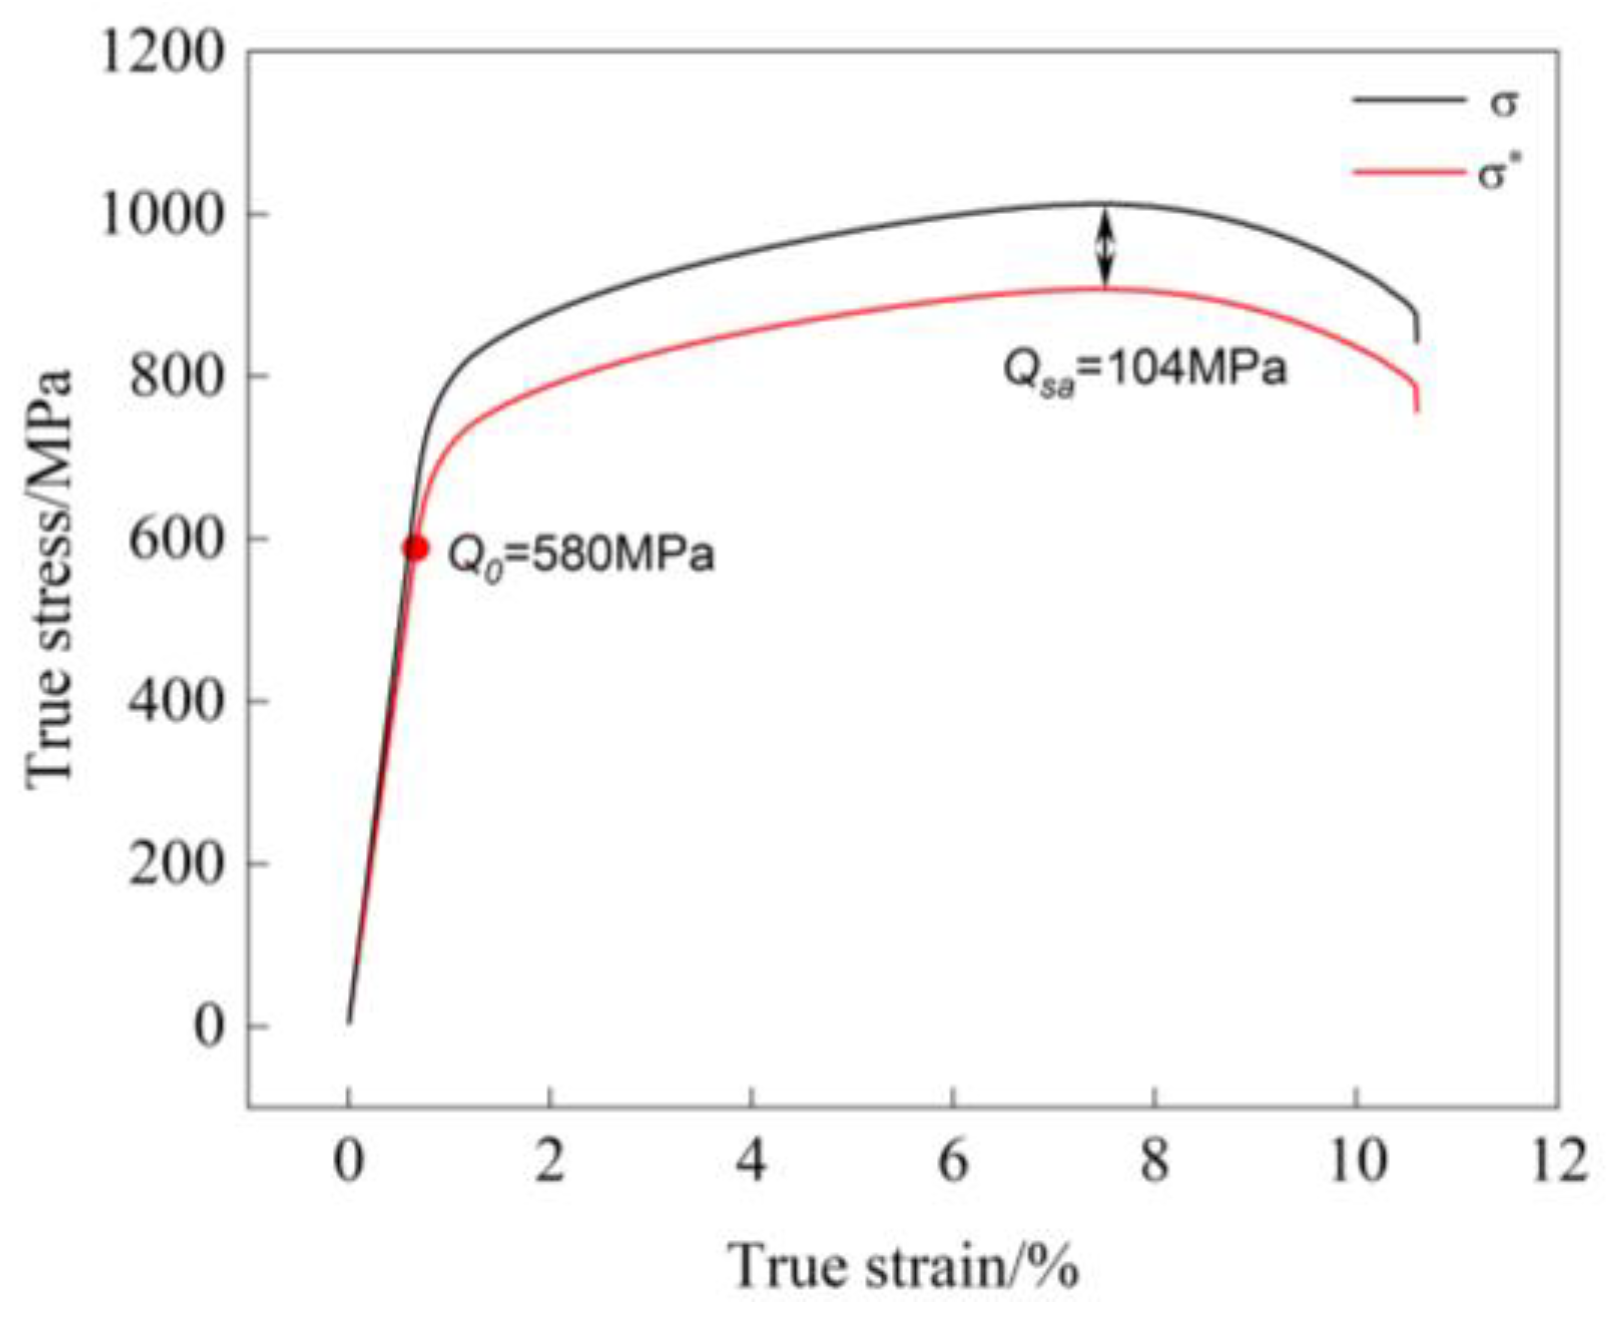
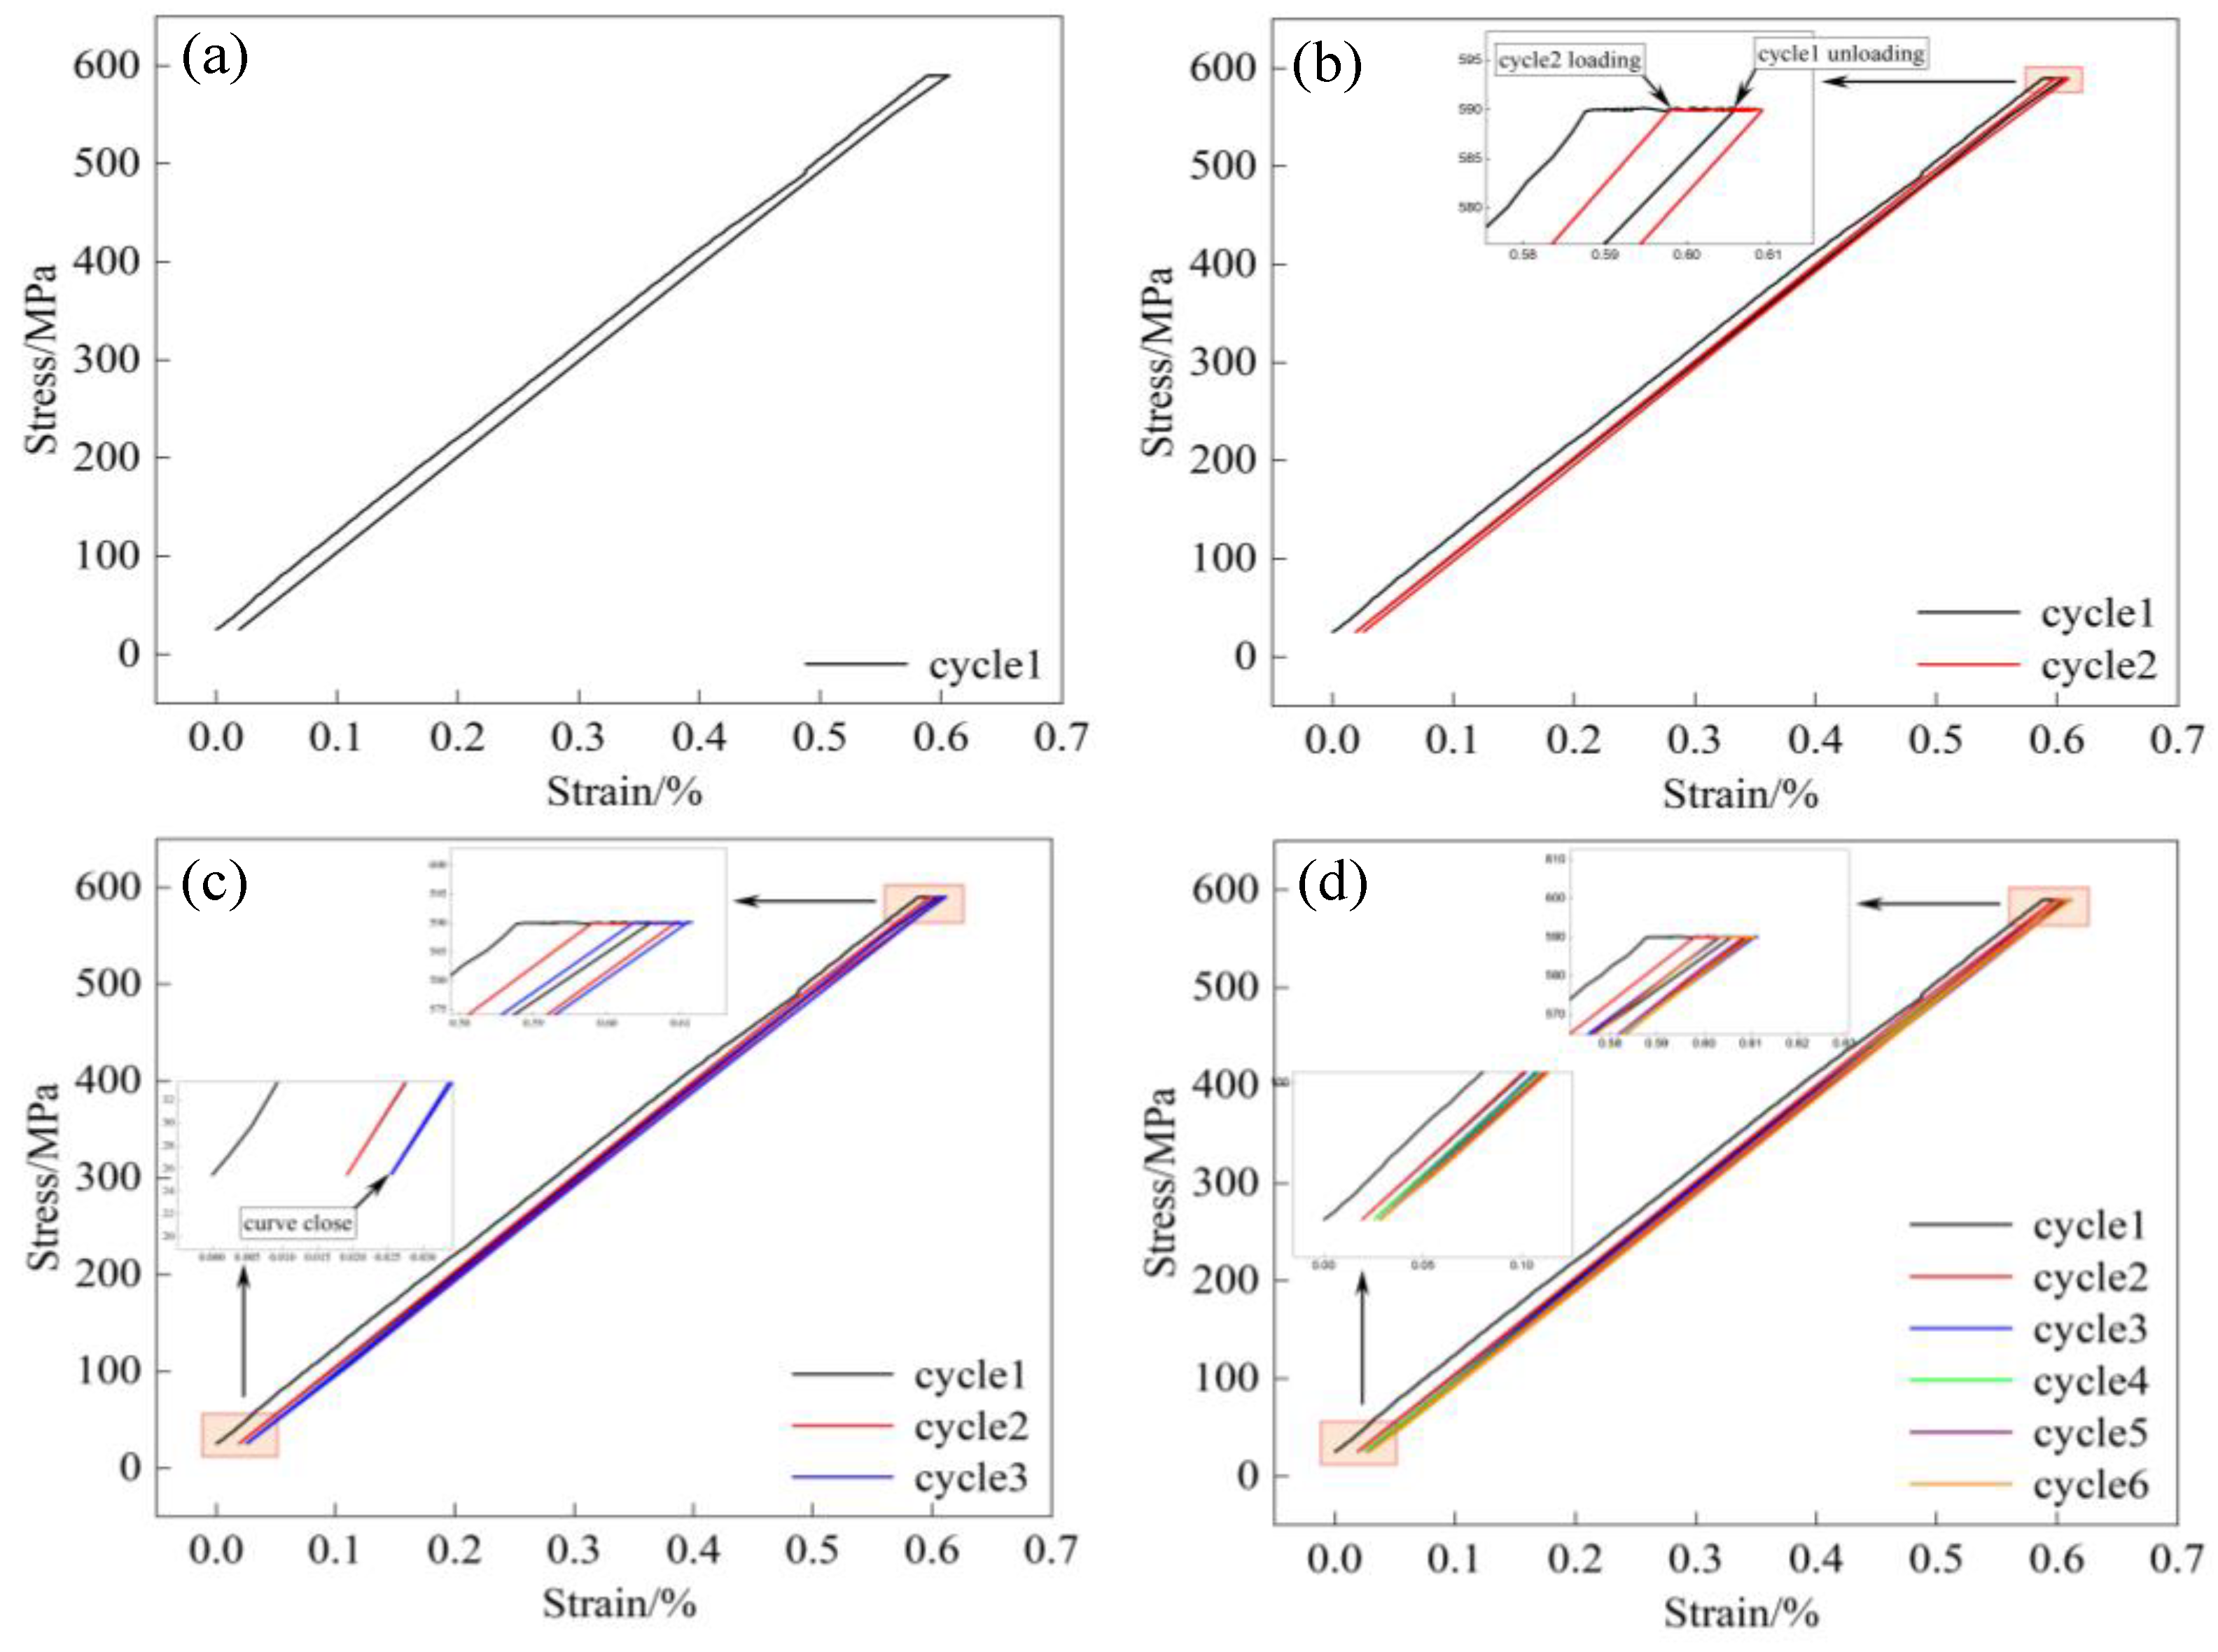
4.1. Stress-Strain Curves
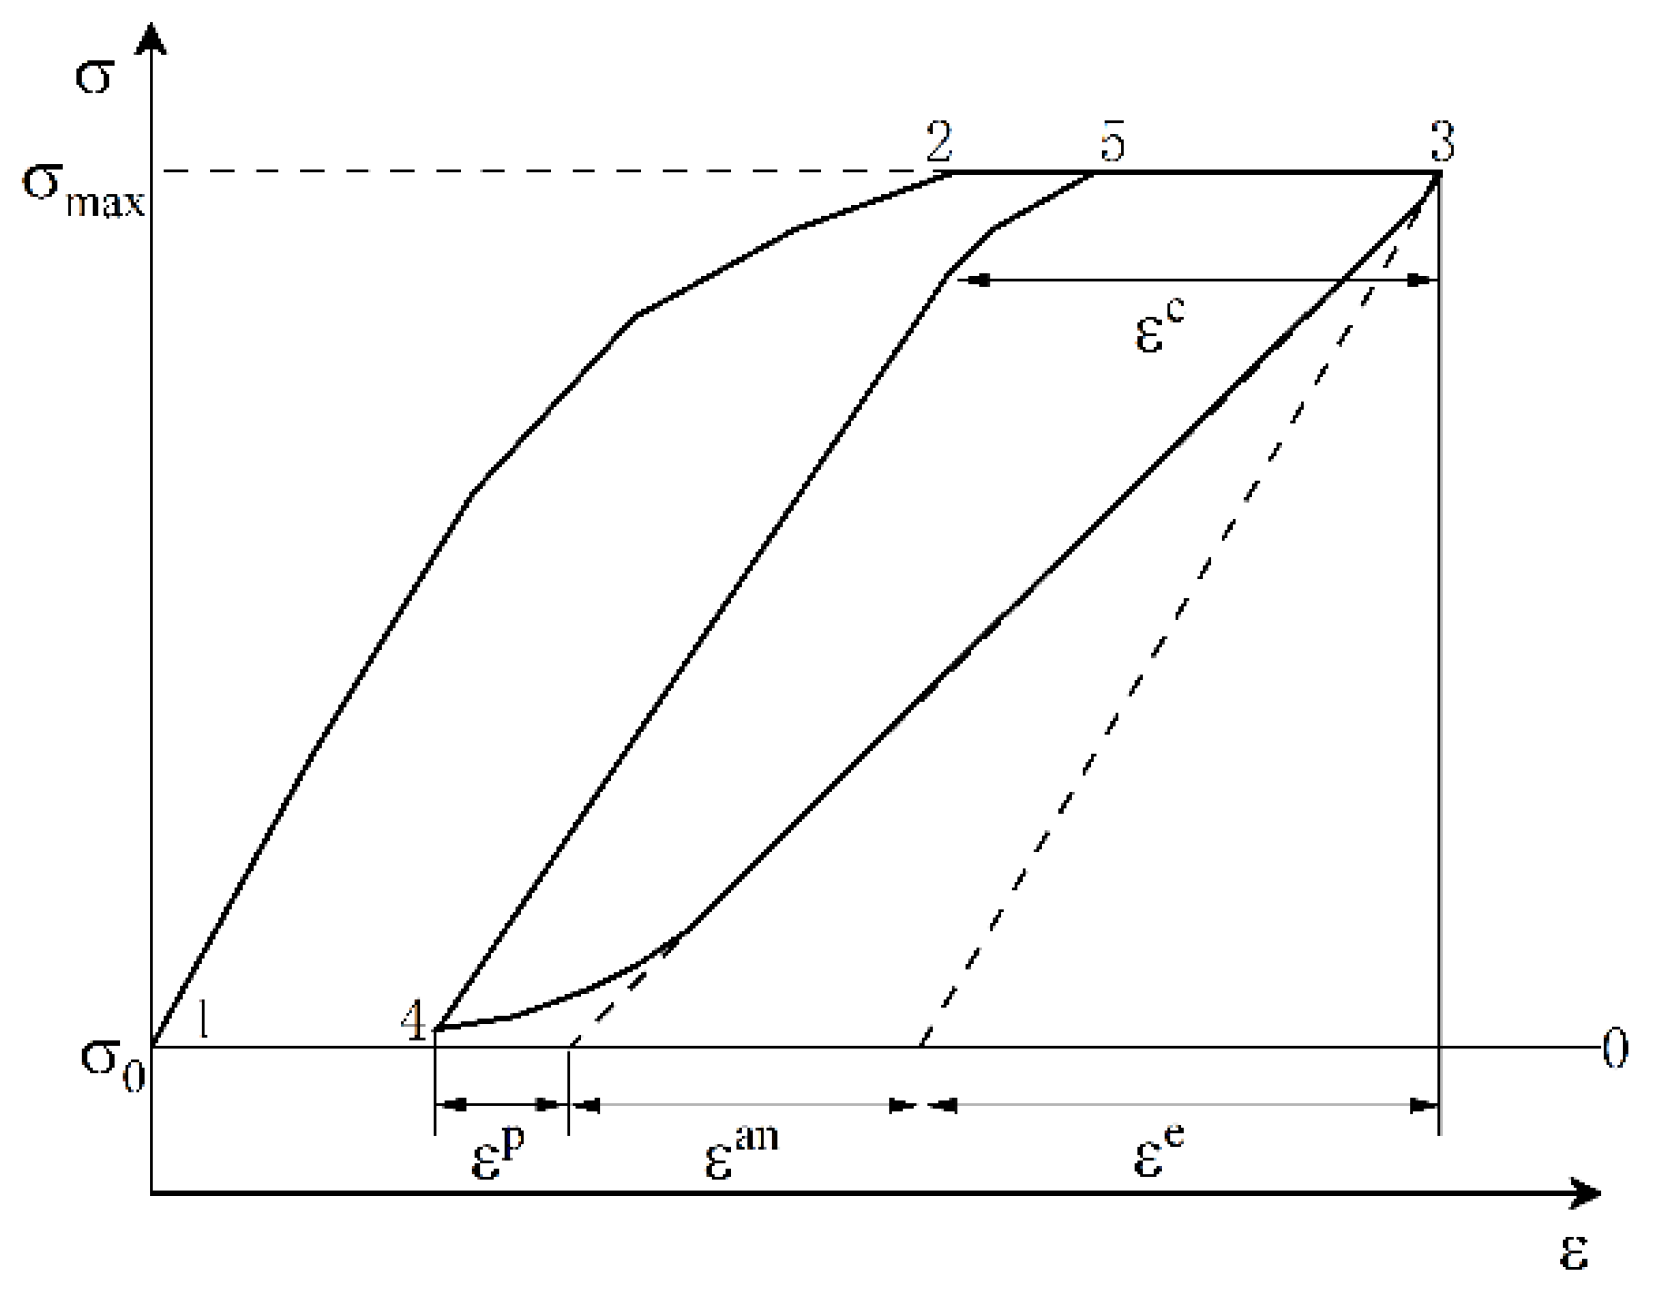
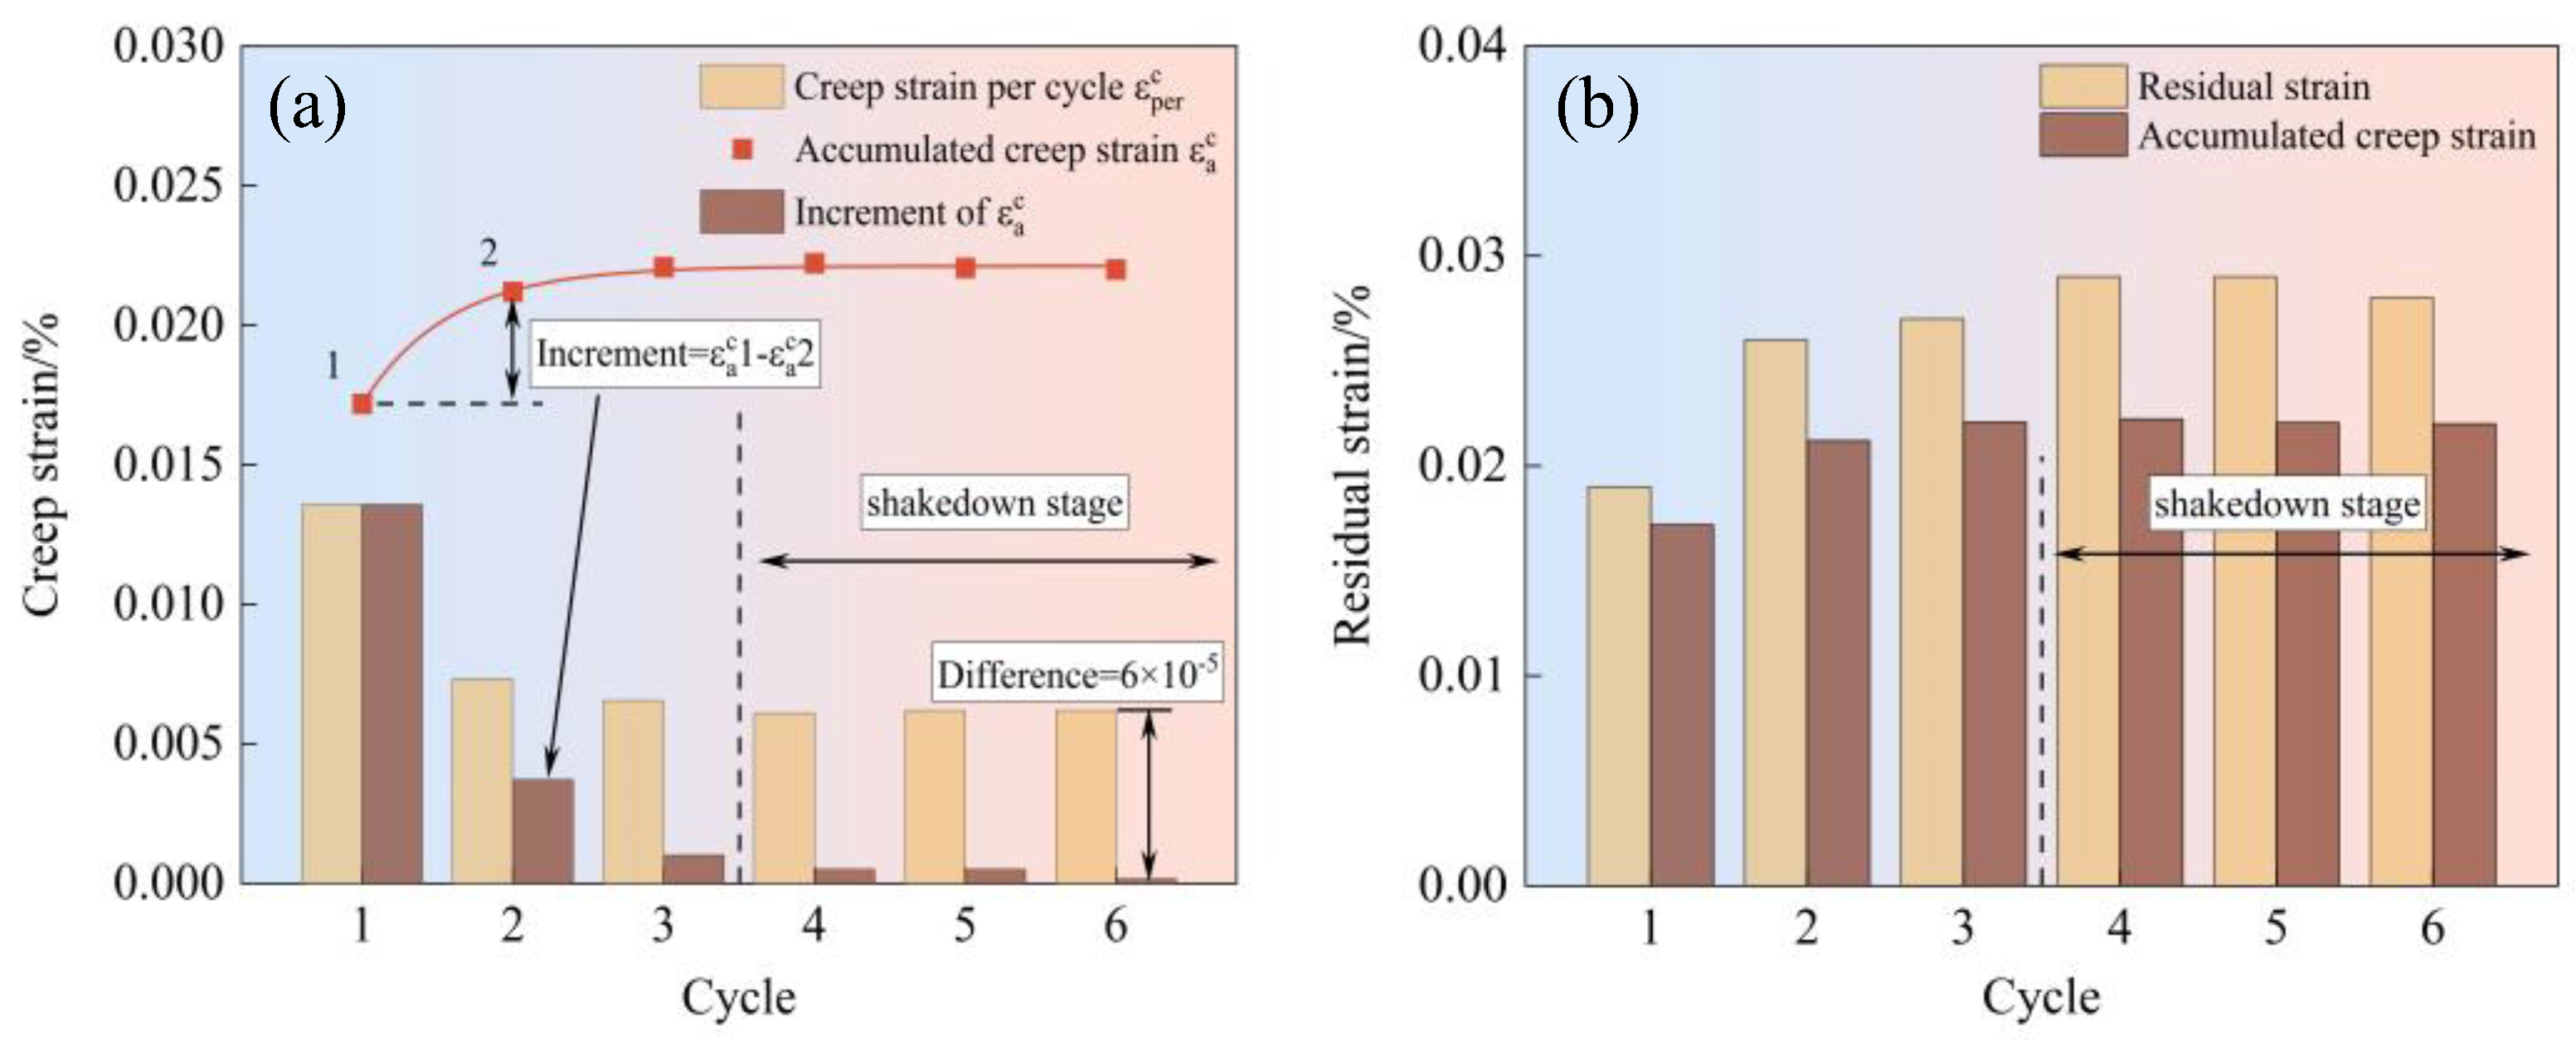
4.2. The Evolution of Strain Components
4.3. Validation of Shakedown Theory Model
4.4. Microscopic Mechanisms of Plastic Shakedown
5. Conclusions
Acknowledgments
References
- D. G. Shi, X. Y. Xu, Y. Wu, Y. C. Qi. Factors Influencing and Research Progress on Dwell Fatigue of Titanium Alloys. Chinese Journal of Materials Research, 2019, 38(7): 722-728.
- J. C. Sui, T. Guo, Z. W. Meng, X. L. Tian. Process Research on Integrated Three-level Disc Shaft. China New Technologies and Products, 2015(22): 56.
- M. R. Bache. A Review of Dwell Sensitive Fatigue in Titanium Alloys: the Role of Microstructure, Texture and Operating Conditions. International Journal of Fatigue, 2003, 25(9-11): 1079-1087. [CrossRef]
- K. M. Chen, R. Z. Tian, S. J. Guo, R. Z. Wang, C. C. Zhang, H. F. Chen, X. C. Zhang, S. D. Tu. Prediction of Creep-fatigue Life of Aviation Turbine Discs under Cyclic Thermal-mechanical Loading. Acta Aeronautica et Astronautica Sinica, 2022, 43(5): 1-10.
- F. Z. Xuan, X.T. Zheng. Stability Analysis and Design of Pressure Equipment. Beijing: Science Press, 2020: 1-4.
- A. Boiler. ASME boiler and pressure vessel code: an international code. New York: American Society of Mechanical Engineers, 1998.
- Y. Ota, K. Kubushiro, Y. Yamazaki. The Life Evaluation by Linear Cumulative Damage Rule for Cold Dwell Fatigue of Ti-6Al-4V Alloy. Fatigue & Fracture of Engineering Materials & Structures, 2022: 45(1), 259-269. [CrossRef]
- M. D. Zhang, J. X. Cao, Z. J. Zhai, Z. N. Yang, B. Zhang, N. Sui, X. Huang. Influence of Dwell Time and Stress Ratio on Stress-strain Response of Ti6242 Alloy. The Chinese Journal of Nonferrous Metals, 2022, 32(6), 1685-1692.
- J. Kumar, A. V. Rao, S. G. S. Raman, V. Kumar. Creep-fatigue Damage Simulation at Multiple Length Scales for an Aeroengine Titanium Alloy. International Journal of Fatigue, 2018, 116: 505-512. [CrossRef]
- L. R. Zeng, L. M. Lei, X. M. Luo, G. P. Zhang. Toward an Understanding of Dwell Fatigue Damage Mechanism of Bimodal Ti-6Al-4V Alloys. Journal of Materials Science & Technology, 2022, 108, 244-255. [CrossRef]
- Y. Han, F. Zhao, Y. Liu, C. W. Huang. Quantitative Relationships between Mechanical Properties and Microstructure of Ti17 Alloy after Thermomechanical Treatment. Metals. 2020, 10(1): 67-83. [CrossRef]
- J. Z. Sun, M. Q. Li, H. Li. Deformation Behavior of TC17 Titanium Alloy with Basket-weave Microstructure during Isothermal Compression. Journal of Alloys and Compounds, 2018, 730: 533-543. [CrossRef]
- P. Guo, H. Pan, G. Y. Jia, H. M. Hou. Conventional Low-cycle Fatigue and Dwell Fatigue Damage Behavior of TC17 Titanium Alloy under High Load Conditions. Rare Metal Materials and Engineering, 2022,51(1): 301-305.
- G. Z. Kang, Q. H. Kan. Constitutive Modeling for Uniaxial Time-dependent Ratcheting of SS304 Stainless Seel. Mechanics of Materials, 2007, 39: 488-499. [CrossRef]
- Q. H. Kan. Constitutive Description of Correlated Ratcheting Behavior of SS304 Stainless Steel under Uniaxial Tension. Nuclear Power Engineering, 2007, 28(4): 66-71.
- N. Ohno, J. D. Wang. Kinematic Hardening Rules with Critical State of Dynamic Recovery, Part II: Application to Experiments of Ratchetting Behavior. International Journal of Plasticity. 1993, 9(3): 391-403. [CrossRef]
- Y. Cao, X. Cui, D. M. Ji. Creep-fatigue Damage Behavior of P92 Steel and the Development of Damage Constitutive Model. Mechanical engineering materials, 2021, 45(10): 50-65.
- G. Z. Kang, Q. Gao, X. J. Yang. A Visco–Plastic Constitutive Model Incorporated with Cyclic Hardening for Uniaxial/Multiaxial Ratcheting of SS304 Stainless Steel at Room Temperature. Mechanics of Materials, 2022, 34(9): 521-531. [CrossRef]
- T. Fang. Experimental and Theoretical Models on Ratcheting-fatigue Interaction of wheel and Rail Steels. Chengdu: Southwest Jiaotong University, 2014: 28-30.
- M. Abdel-Karim, N. Ohno. Kinematic Hardening Model Suitable for Ratchetting with Steady-State. International Journal of Plasticity, 2000, 16(3-4): 225-240. [CrossRef]
- F. L. Liu. Study on Plastic Shakedown State of Metallic Materials. Mechanical Engineering and Automation, 2005, 1: 47-50.
- J. Y. Shi, M. Zhang, Y. D. Cheng, B. K. Wang, F. L. Liu. A Study on the Shakedown Mechanism of Mining Ring Chain Steel 23MnNiCrMo54. Journal of Heat Treatment of Materials, 2005, 26(3): 90-92.
- G. Z. Kang, Y. F. Sun, J. Zhang, Q. H. Kan. Time-dependent Ratcheting Behavior of SS304 Stainless Steel under Cyclic Loading at Room Temperature. Acta Metallurgica Sinica, 2005, 41(3): 277-281.
- Q. H. Kan, G. Z. Kang, J. Zhang. Constitutive Description of Uniaxial Ratcheting Behavior of SS304 Stainless Steel. Nuclear Power Engineering, 2007, 28(04): 66-71.
- L. Yu, X. P. Song, L. You, Z. H. Jiao, H. C. Yu. Effect of Dwell Time on Creep-Fatigue Life of a High-Nb TiAl Alloy at 750℃. Scripta Materialia, 2015, 109: 61-63. [CrossRef]
- X. T. Zheng. Shakedown Analysis and Evaluation Approaches to Structures under Complicated Conditions. Shanghai: East China University of Science and Technology, 2012: 69-74.
- M. Es-Souni. Primary, Secondary and Anelastic Creep of a High Temperature Near a-Ti Alloy Ti6242Si. Maretials Characterization, 2000, 45: 153-164. [CrossRef]
- A. Głuchowski, W. Sas. Long-term Cyclic Loading Impact on the Creep Deformation Mechanism in Cohesive Materials. Materials, 2020, 13(17): 3907. [CrossRef]
- S. L. Zhang, F. Z. Xuan, S. J. Guo, P. Zhao. The Role of Anelastic Recovery in the Creep-fatigue Interaction of 9-12% Cr Steel at High Temperature. International Journal of Mechanical Sciences, 2017, 122: 95-103. [CrossRef]
- G. X. Chen, Y. Peng, C. Y. Liu. Periodic Plastic Deformation Behavior of Ti-6Al-4V Titanium Alloy Based on Strain Controlling Mode. Journal of Failure Analysis and Prevention, 2020, 20: 597-604. [CrossRef]
- Y. Zhou, Y. H. Pang, Y. G. Zhou. Deformation Characteristics and Dislocation Structures of TC11 Titanium Alloy under Creep-fatigue Interaction. Acta Aeronautica et Astronautica Sinica, 1994, 15(6): 691-695.
- F. C. Sun. Possible dislocations in alpha titanium alloys. Rare Metal Materials and Engineering, 1985(1): 1-4.
- J. Huang, Z. Wang, K. Xue. Cyclic Deformation Response and Micro-mechanisms of Ti Alloy Ti–5Al–5V–5Mo–3Cr–0.5Fe. Materials Science and Engineering: A, 2011, 528(29-30): 8723-8732. [CrossRef]
- N. E. Paton, W. A. Backofen. Plastic Deformation of Titanium at Elevated Temperatures. Mechanical Behavior, 1970, 1(10): 2839-2847. [CrossRef]
- X. X. Li, C. Q. Xia, Y. L. Qi, Z. H. Wang, G. S. Niu, W. Sun. Study on High-temperature Tensile Creep Behavior of TC6 Titanium Alloy. Rare Metal Materials and Engineering, 2013, 42(9): 1901-1904.
- H. F. Xu. Study on Low-cycle Fatigue Mechanical Behavior and Life Prediction Energy Model of Ti-6Al-4V Alloy Based on Internal Stress. Hangzhou: Zhejiang University, 2018.
- C. Y. Lu, P. Wang, S. Y. Luo, Y. F. Li, R. Z. Wang, Y. M. He, Z. L. Gao, S. T. Tu. Influence of Anelastic Recovery on the Cyclic Creep Behavior of AlCoCrFeNi2.1 Eutectic High-entropy Alloy. International Journal of Fatigue, 2024 180: 10811. [CrossRef]
- C. H. Ying, L. J. Chen, T. L. Liu, L. Q. Guo. Influence of Hold Time on Cyclic Creep Behavior of 409 Ferritic Stainless Steel. Journal of Shenyang University of Technology, 2016, 38(6): 634-638.
- A. Rao, R. J. Bouchard, S. M. Northover, M. E. Fitzpatrick. Anelasticity in Austenitic Stainless Steel. Acta Materialia, 2012, 60(19): 6851-6861. [CrossRef]
- V. C. Nardone, D. E. Matejczyk, J. K. Tien. A Model for Anelastic Relaxation Controlled Cyclic Creep. Metallurgical Transactions A, 1985, 16: 1117-1122. [CrossRef]
| Element | Al | Sn | Zr | Mo | Cr | Fe | C | N | H | O | Ti |
|---|---|---|---|---|---|---|---|---|---|---|---|
| Wt/% | 5.0 | 2.1 | 1.9 | 3.9 | 4.0 | 0.30 | 0.05 | 0.05 | 0.0125 | 0.08 | Bal. |
| Temperature | Material parameters |
|---|---|
| 300℃ |
E=102GPa, ν=0.30, Q0=580Mpa, Qsa=104MPa, K=665MPa, n=150, γ=29.8, μ=0.05, x(k)=2.9e-9, m(k)=3.5, M=8; ζ(1)=522.2, ζ(2)=309.7, ζ(3)=257.1, ζ(4)=176.9, ζ(5)=118.3, ζ(6)=75.4, ζ(7)=43.6, ζ(8)=26.6; r(1)=6.61, r(2)=5.28, r(3)=18.31, r(4)=37.93, r(5)=20.93, r(6)=21.79, r(7)=30.41, r(8)=41.26 |
| Cycle | 1 | 2 | 3 | 4 | 5 | 6 |
|---|---|---|---|---|---|---|
| Error value/% | 0.020 | 0.021 | 0.018 | 0.014 | 0.008 | 0.006 |
| Percentage /% | 3.26 | 3.41 | 2.96 | 2.20 | 1.28 | 0.99 |
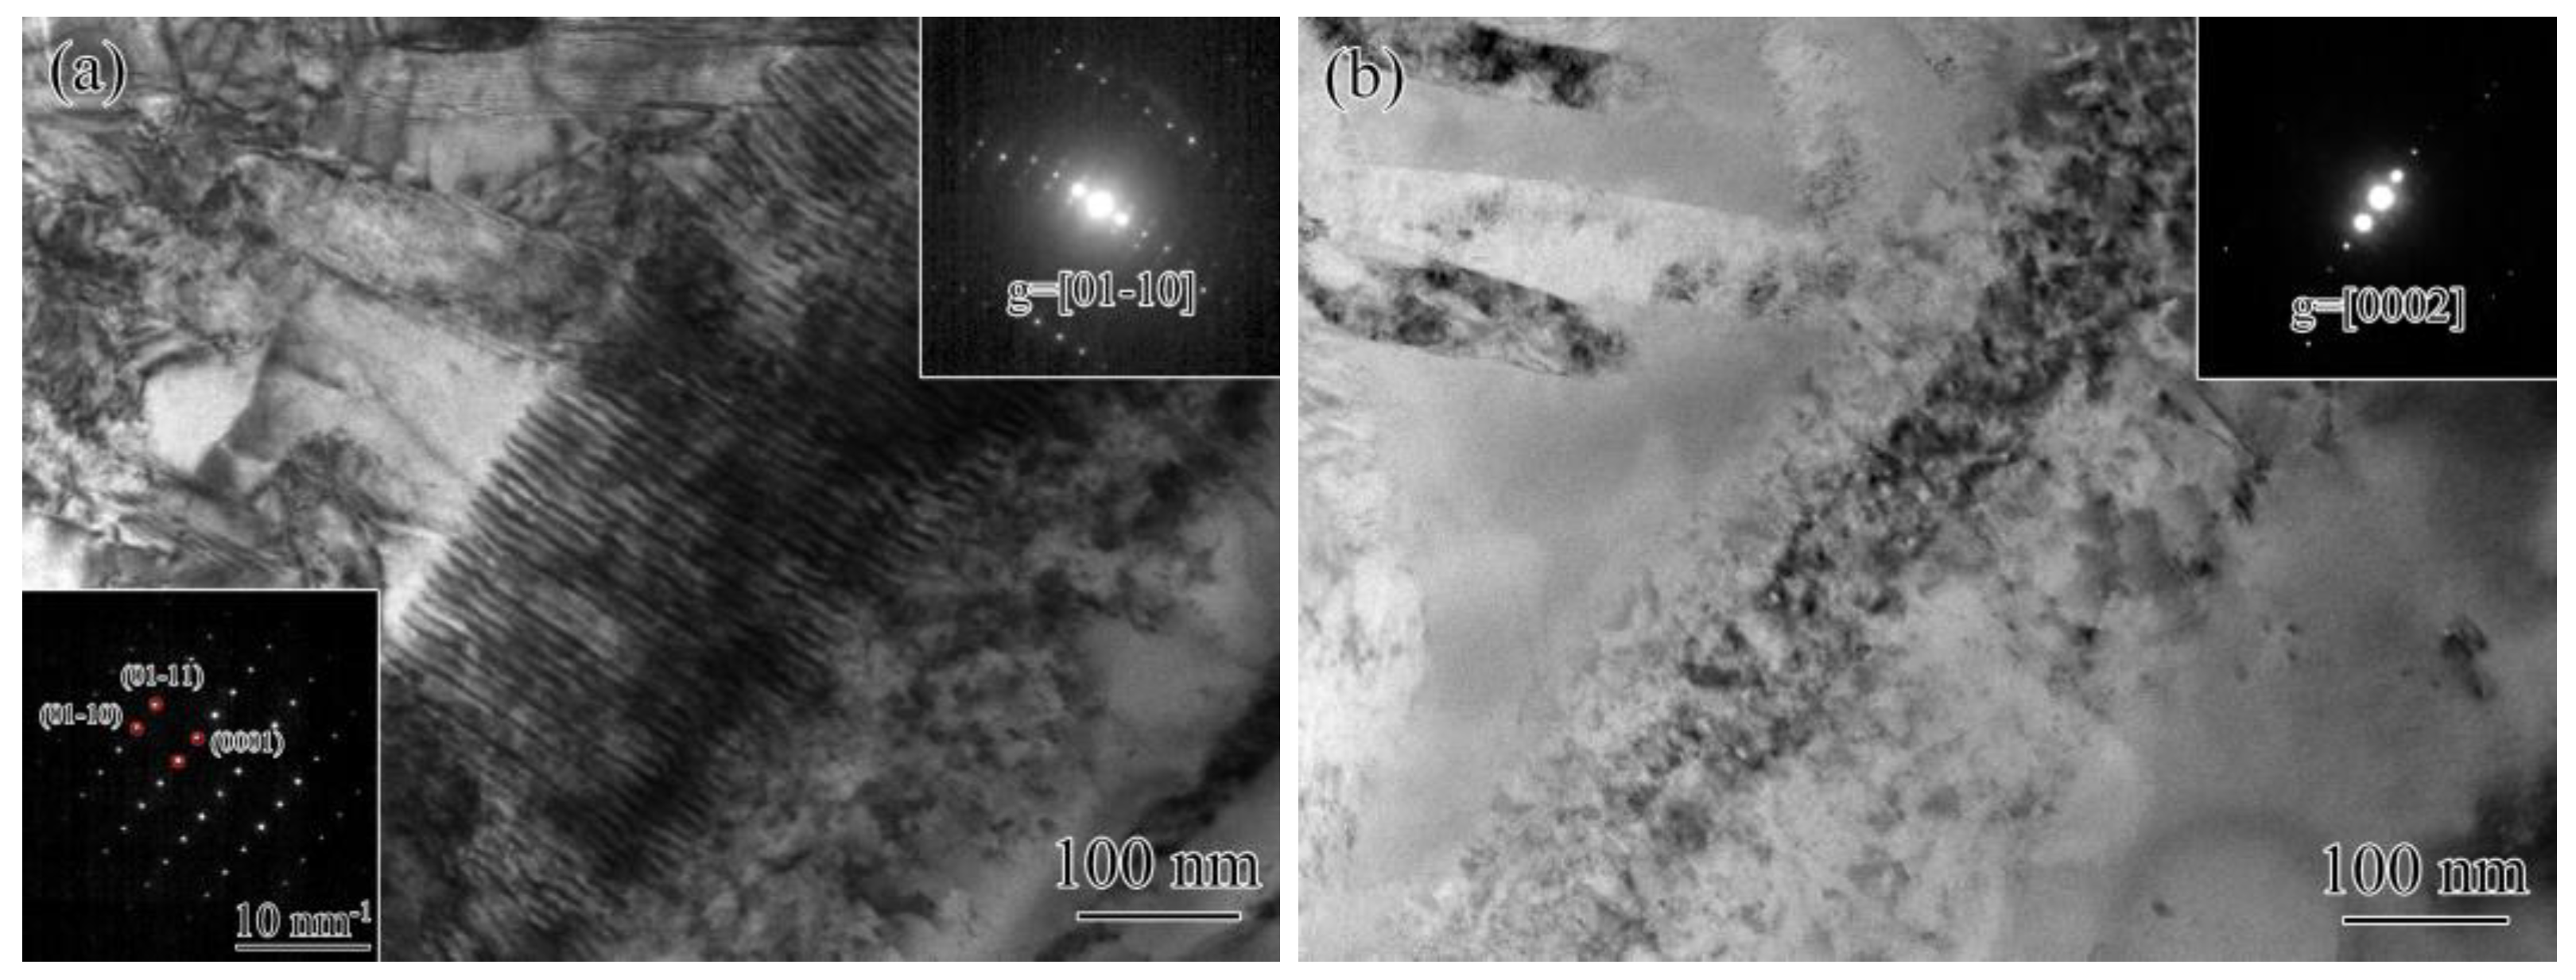
| g | <a> | <c> | <a+c> |
|---|---|---|---|
| 1/3<11-20> | [0001] | 1/3<11-23> | |
| 0002 | None | All | All |
| 01-10 | All | None | All |
| -2110 | All | None | All |
Disclaimer/Publisher’s Note: The statements, opinions and data contained in all publications are solely those of the individual author(s) and contributor(s) and not of MDPI and/or the editor(s). MDPI and/or the editor(s) disclaim responsibility for any injury to people or property resulting from any ideas, methods, instructions or products referred to in the content. |
© 2024 by the authors. Licensee MDPI, Basel, Switzerland. This article is an open access article distributed under the terms and conditions of the Creative Commons Attribution (CC BY) license (http://creativecommons.org/licenses/by/4.0/).


