
Submitted:
07 May 2024
Posted:
07 May 2024
You are already at the latest version
Abstract
Phosphorus (P) concentration in rivers and lakes receives greater attention due to its significance in contributing to eutrophication. This study aimed at profiling phosphorus species in Vembanad lake (Ramsar site) and its adjoining rivers. Four phosphorus fractions (total reactive phosphorus (TRP), total acid hydrolysable phosphorus (TAHP), total organic phosphorus (TOP) and total phosphorus (TP)) were monitored according to premonsoon and postmonsoon seasons. Meenachil river mouth is a hotspot for eutrophication with high values of most of the phosphorus fractions. Among the four fractions TRP, TOP and TP were recorded maximum concentration during the premonsoon and postmonsoon seasons. Each fraction of TRP, TAHP, TOP, and TP had an average concentration of more than 300 µgL-1 P throughout two seasons, which is highly eutrophic. The result reveals that the surface water of Vembanad lake is highly polluted with phosphorus input and it may trigger algal growth and consequent destruction of the biodiversity rich wetland system.
Keywords:
Vembanad lake
; adjoining rivers
; eutrophication
; phosphorus speciation
; inorganic and organic phosphorus.
1. Introduction
Wetlands represent vital ecosystems, where land and water converge to provide invaluable benefits to both humanity and wildlife [1,2]. Serving as natural filters, they enhance water quality by absorbing excess nutrients and pollutants, while also regulating water levels to mitigate floods and protect coastal areas from erosive forces [3]. Despite their critical role, wetlands face a mounting threat from human activities, leading to widespread degradation and loss [4].
One of the most pressing challenges to wetland health is eutrophication, a process driven by the accumulation of nutrients like phosphate and nitrate [5]. This nutrient overload disrupts the delicate balance of aquatic ecosystems, triggering harmful algal blooms, oxygen depletion, and biodiversity loss [6]. The root causes of eutrophication are manifold, including agricultural runoff, urban development, and untreated waste discharge, which have led to a surge in nutrient levels in rivers and lakes worldwide [7].
Of particular concern is the role of phosphorus, a key nutrient in freshwater environments, in fuelling eutrophication [8]. Even slight increases in phosphorus concentrations can have profound consequences, stimulating rapid plant and algae growth, reducing oxygen levels, and disrupting aquatic ecosystems. Phosphorus enters water bodies through various pathways, including fertilizers, manure, and industrial waste, exacerbating eutrophication in vulnerable ecosystems [9].
Understanding the complex dynamics of phosphorus cycling within aquatic systems is essential for assessing and managing eutrophication [10]. Phosphorus exists in multiple forms, including orthophosphate, inorganic phosphates, and organic phosphates, each with distinct transformations and interactions with water and sediment [11]. These processes, influenced by physicochemical and biological factors, govern the distribution and availability of phosphorus in aquatic environments [12,13].
Against this backdrop, the Lake Vembanad emerges as a critical case study, representing one of India's largest and most ecologically significant wetland ecosystems [14]. Designated as a Ramsar Site for its rich biodiversity [15,16], the lake faces mounting pressures from human activities, including agricultural runoff and industrial pollution [17].
Six major rivers flow into Vembanad Lake, draining along its eastern bank before reaching the Arabian Sea. Notably, no rivers feed into the lake from the west bank. The Thanneermukkom bund divides the lake, with the southern portion dominated by freshwater and the northern portion by saltwater. In the southern area, agriculture practices, especially in low-lying fields, heavily rely on fertilizers, pesticides, and herbicides, contributing significantly to phosphorus loading. This southern region has become a focal point for nutrient accumulation and the proliferation of invasive species. Additionally, the construction of the Thanneermukkom Bund, designed to regulate water exchange between the Arabian Sea and the freshwater habitats, exacerbates these issues by accumulating agricultural residues and promoting the rapid spread of harmful aquatic vegetation. Such degradation poses significant threats to public health and environmental sustainability, underscoring the urgent need for comprehensive monitoring and management strategies.
Given this context, our focus was on specifically examining the influence of phosphorous loading from the four rivers that drain into the southern part of Vembanad Lake, which pass through vast agricultural fields. The confluence points of these rivers within the lake system serve as hotspots for phosphorous loading. Addressing these challenges is central to the lack of data on the influx of phosphorus species into the lake system.
In summary, the health of Vembanad Lake can serve as a model for the broader challenges facing wetland ecosystems worldwide. By elucidating the intricate temporal dynamics of phosphorus species and its implications for eutrophication, this study aims to provide essential insights for the preservation and sustainable management of this natural resource.
2. Materials and Methods
2.1. Study Area
The study area is situated in Kerala, located in the southwestern part of India, which is characterized by a network of 44 rivers, with 41 flowing westward and the remaining three flowing eastward. These westward-flowing rivers terminate either in a lake or merge with the sea on the western coast. Our research specifically delved into the phosphorous speciation in Vembanad Lake, a designated Ramsar site and the largest estuarine system in Kerala, covering approximately 256 km² spanning latitudes 9030’-10.20’N and longitudes 76013’-760.50’E (Figure 1). The lake is renowned for its elongated axes running parallel to the sea coast and features two permanent openings, Azhikod and Cochin, facilitating direct connections to the Arabian Sea and contributing to its status as a highly productive estuary system [20].
Vembanad Lake receives nourishment from seven major rivers, five of which - Muvattupuzha, Meenachil, Manimala, Pamba, and Achankovil - originate from the south, while the remaining two, Periyar and Chalakudi, originate from the north of Thanneermukkom bund. Notably, Manimala, Achankovil, and Pamba flow into the lake's southernmost part at Alappuzha, while Meenachil joins the eastern portion of the lake after passing through the Thannermukkom bund. Collectively, these rivers contribute an estimated 297,010 m3 of fresh water annually [21], along with an annual sediment flow from catchments totaling around 329,106 tonnes [22]. Influenced predominantly by the monsoon, these rivers contribute approximately 71% of yearly precipitation [23].
Our research specifically focuses on the effects observed at the mouths of four rivers: Meenachil, Manimala, Pamba and Achankovil. These rivers traverse through the agricultural lands of Kuttanad, resulting in extensive agricultural runoff that may be enriched with phosphorus content.
2.2. Sample Collection and Preservation
Water samples were collected from 16 distinct sampling points in the southern arm of Vembanad lake over the period from March to December 2019, encompassing both the pre-monsoon and post-monsoon seasons. These samples were obtained from different rivers before their convergence with the lake system, with an additional samples gathered from locations where rivers merge with the lake. Additionally, a representative sample of the entire lake was collected from the middle of the lake (Figure 1). Samples from the lake points were collected by reaching the sites by boat. At some points in the river, we used a boat to reach the sampling location, while at other points samples were obtained directly.
In order to ensure the accuracy of the analysis, surface water samples were collected using polypropylene containers that were thoroughly rinsed with river water prior to each sampling. The samples were then stored in PTFE bottles pre-cleaned with phosphate- free detergent and rinsed with double-distilled water [24]. Subsequently, the samples were transported to the laboratory in an ice box and preserved at 4°C prior to analysis.
2.3. Sample Analysis
The collected water samples underwent comprehensive analysis for various physico-chemical parameters, including temperature, pH, conductivity, total dissolved solids (TDS), total hardness (TH), salinity, dissolved oxygen (DO), and both anions and cations. Real-time measurements of temperature, pH, conductivity, TDS, salinity, and DO were conducted using the Aquaprobe AP 5000 plus. Total hardness was determined using titration technique, while ion chromatography (Dionex ICS 1100 plus) was employed to analyze major ionic composition such as chloride (Cl), nitrate (NO3), sulphate (SO4), sodium (Na), potassium (K), magnesium (Mg), calcium (Ca), and ammonium (NH4). The identification of anions was performed using an AS12A/AG12A column with ASRS suppressor, while major cations were analyzed using a CS12A/CG12A column and CSRS suppressor.
Phosphomolybdate blue colorimetric method, in combination with a UV-visible spectrophotometer, was utilized to quantify different phosphorus species [25]. Total reactive phosphorus (TRP) (unfiltered sample) was obtained from the non-digested water sample and total acid hydrolysable phosphorus (TAHP) (unfiltered) was obtained from the digested water sample. The difference between TRP and TAHP provided the TAHP concentration. Additionally, total phosphorus (TP) and total organic phosphorus (TOP) samples were digested for 2 hours using potassium persulfate on a hotplate. TOP was calculated as the difference between TP and the sum of TAHP and TRP [26].
2.4. Data Analysis
In the data analysis phase, two main software tools were utilized: Microsoft Excel 2016 and IBM SPSS Statistics 22. These tools provided the necessary functionalities for conducting a comprehensive examination of the collected data.
Various statistical tests were employed to assess different aspects of the data. The Shapiro-Wilk test and Kolmogorov-Smirnov test were utilized to assess the normality of data distributions. These tests help to determine whether the data follows a normal distribution, which is essential for certain statistical analyses.
The Spearman correlation test was conducted to evaluate the relationships between different variables in the dataset. This non-parametric test assesses the strength and direction of monotonic relationships between variables, providing insights into potential associations among water quality metrics.
Additionally, a one-way ANOVA (Analysis of Variance) test was performed to compare means across multiple groups. This test allowed for the examination of potential differences in water quality metrics among different sampling sites or seasons.
Principal component analysis (PCA) was employed to identify underlying patterns and extract relevant information from the dataset. PCA is a multivariate statistical technique used to reduce the dimensionality of data by transforming correlated variables into a smaller set of uncorrelated variables called principal components. By doing so, PCA helps uncover hidden elements influencing surface water quality and facilitates the interpretation of complex datasets.
Furthermore, Hierarchical cluster analysis (HCA) was utilized to identify groups of similarity among sampling sites and/or water quality metrics. HCA is a technique used to classify objects or variables into homogeneous groups based on their similarities or dissimilarities. By clustering similar sampling sites or water quality metrics together, HCA provides valuable insights into the overall structure of the dataset and helps identify distinct patterns or trends.
3. Results and Discussions
3.1. pH, Water Temperature, Conductivity, TDS, Salinity and Total Hardness
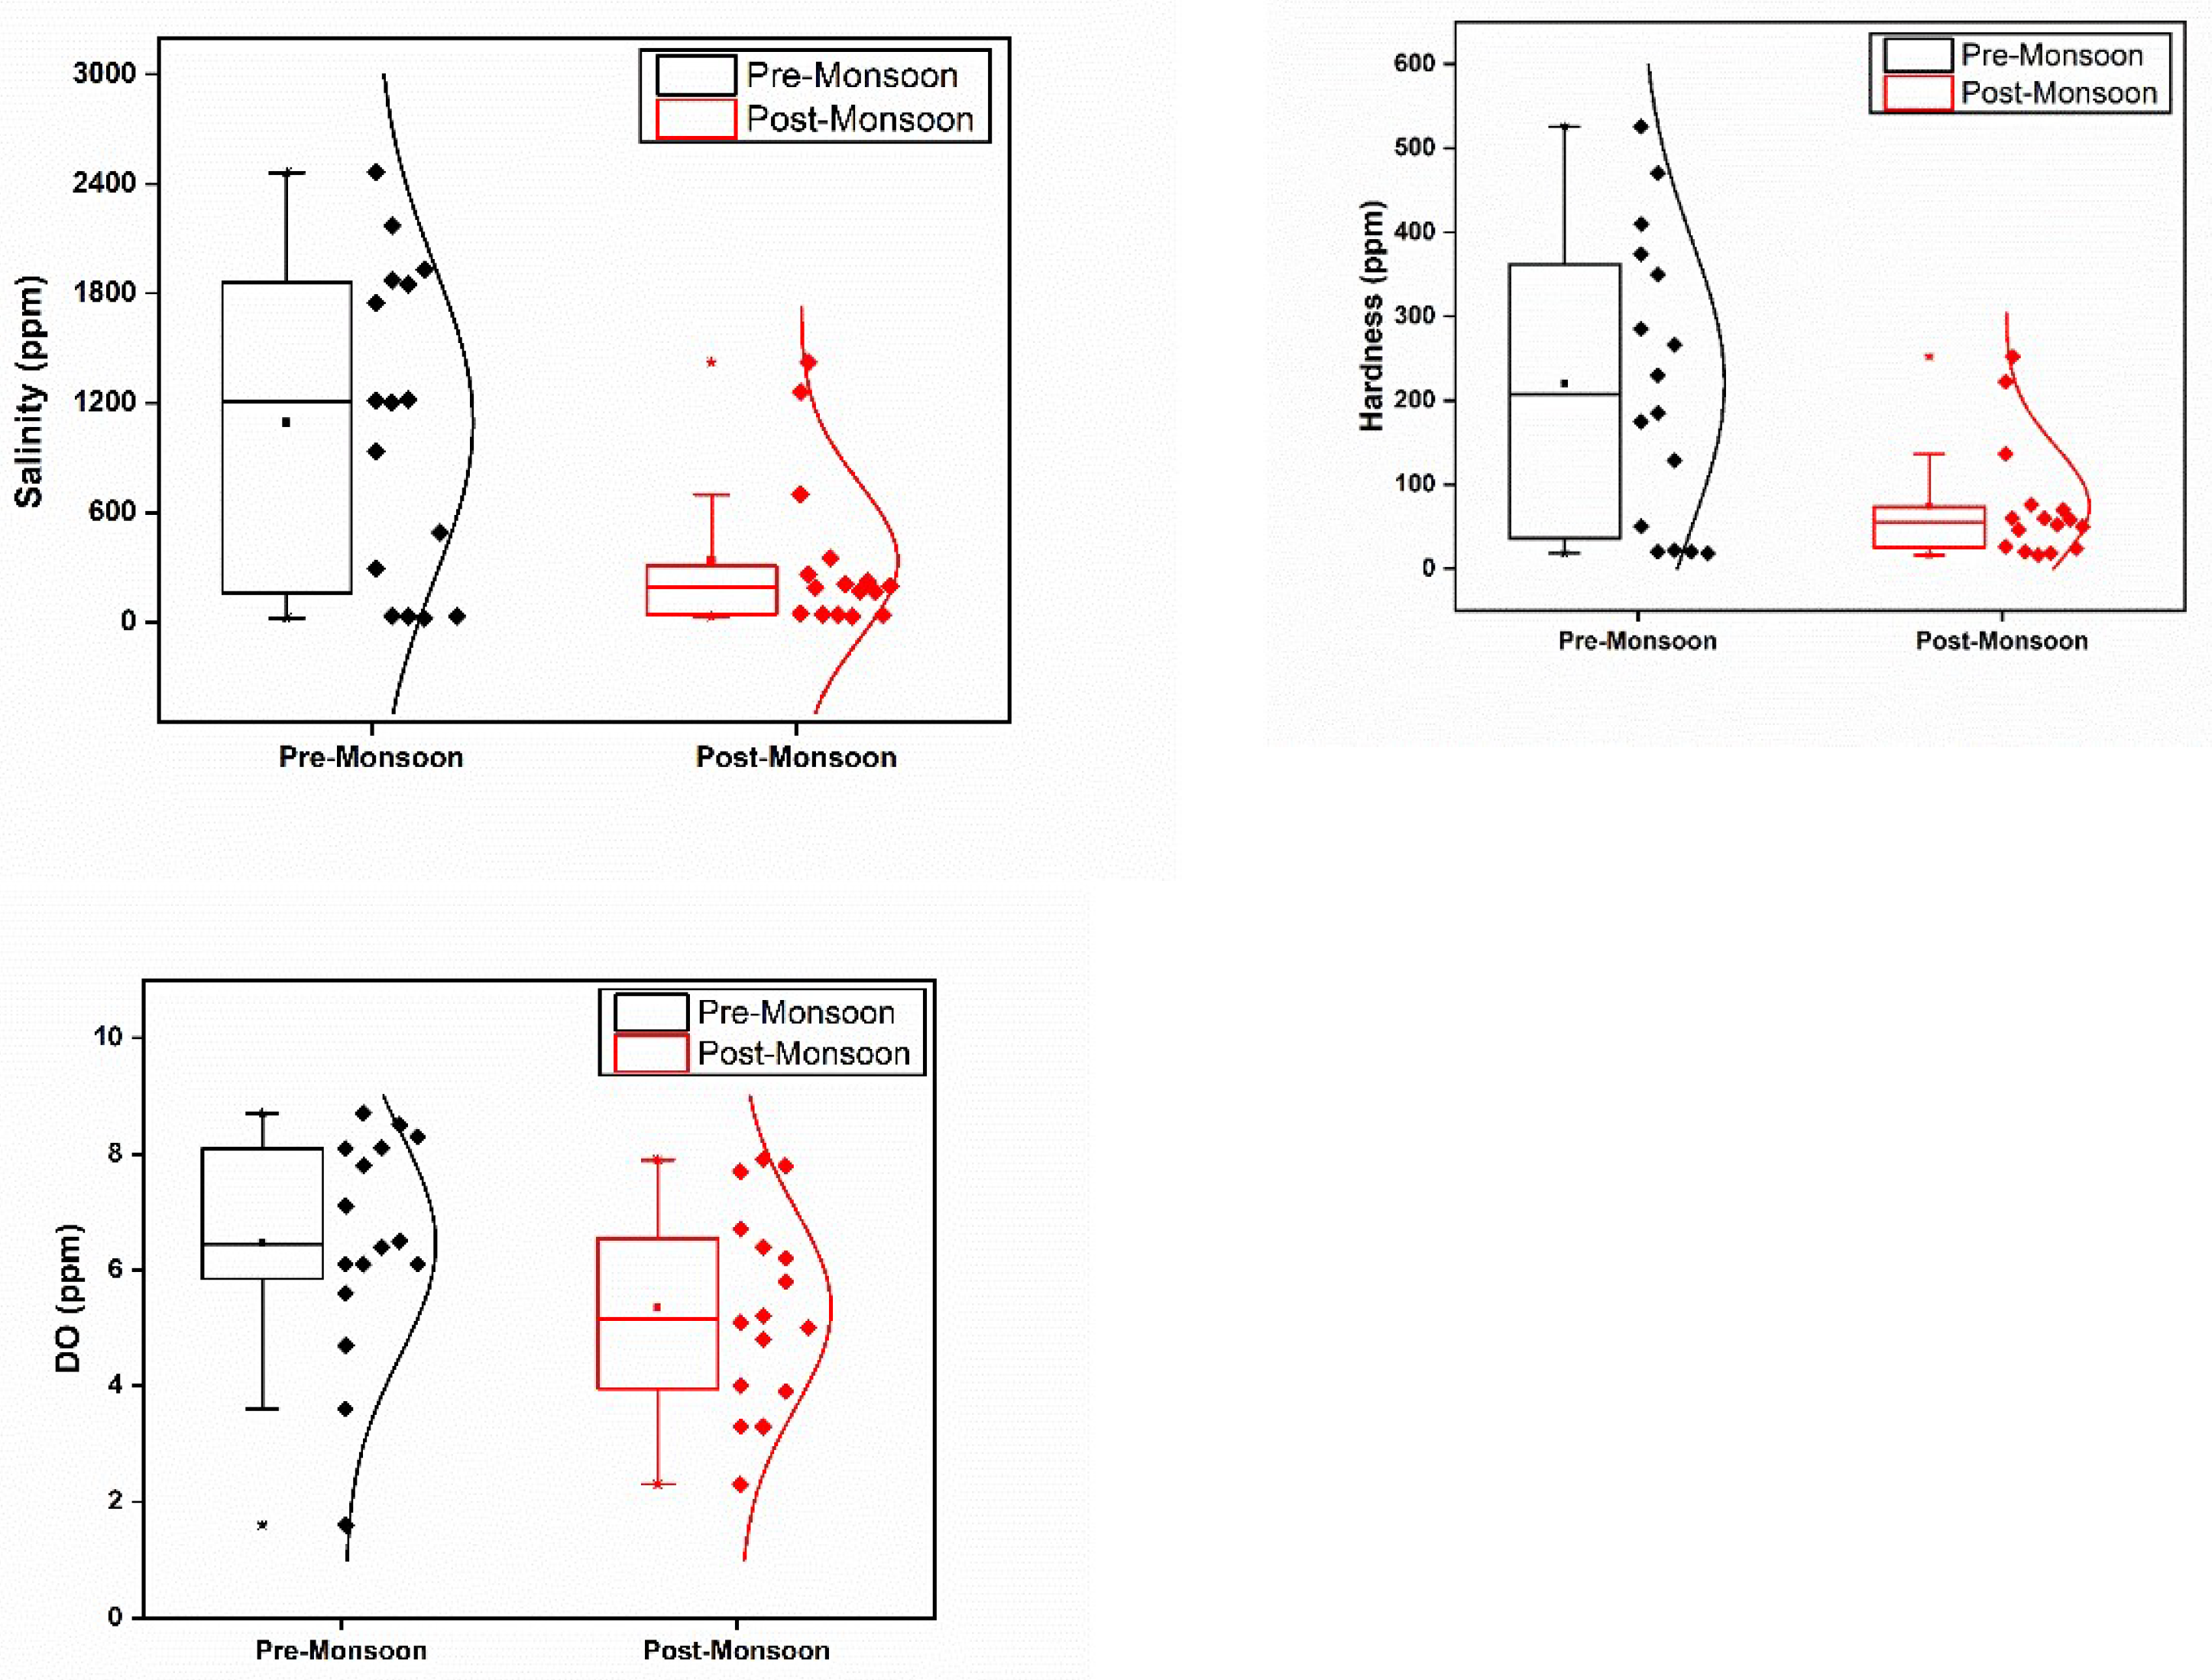
The physico-chemical parameters of the surface water samples collected from Vembanad Lake and its adjoining rivers in the pre-monsoon (PRM) and post-monsoon (POM) seasons are presented in Figure 2 The pH values of the samples ranged between 5.1 to 7.8 and 5.3 to 7.2 in PRM and POM, respectively. However, there was no significant variation (p>0.05) in pH between the seasons. A significant difference in water temperature (p<0.05) between the seasons was noticed, with temperatures ranging between 28.5 to 32.2⁰C and 26.8 to 30.8 ⁰C in PRM and POM seasons, respectively. Higher conductivity was recorded in samples in PRM (mean: 2128.75 μS/cm) than in POM (mean: 669.45 μS/cm) with a significant variation (p<0.05) in conductivity during these seasons. Furthermore, there was a significant deviation (p<0.05) in the total dissolved solids (TDS) of samples between the seasons, whereas salinity did not vary significantly. The TDS in the water samples ranged from 41 to 3003 ppm and 32.2 to 1970 ppm in PRM and POM, respectively. Salinity varied from 20 to 2460 ppm and 28.2 to 1420 ppm during PRM and POM, respectively, with higher salinity in samples recorded during PRM. Total hardness in the samples varied between 18.0 to 526.0 ppm in PRM and 16.0 to 252.0 ppm in POM season. The hardness was higher in the PRM season (mean: 220.56 ppm) than in POM. Furthermore, a significant deviation in hardness levels was also noted between seasons (p<0.05).
3.2. Dissolved Oxygen (DO)
The mean dissolved oxygen (DO) concentration was recorded to be greater in the PRM season (6.45 ppm) than in POM (5.26 ppm) (Figure 2). Upon comparing both PRM and POM, it was noticed that distributaries (S1- S5) of the Meenachil river, had relatively lower DO content, indicative of organic pollution in these locations [27]. The minimum DO concentration was recorded at S1 during both seasons (1.6 and 3.3 ppm in PRM and POM, respectively). S1 is a site in the river-lake interface point, where the excessive salinity load as a consequence of sea water mixing [28], along with domestic waste effluents, might have led to the reduction in DO content. Interestingly, very low DO levels were recorded at S11 (a site at the interface point of River Pamba and Lake Vembanad) during the POM season, which can be attributed to high organic waste disposal during the pilgrimage season (December to January) at Sabarimala. Previous reports have also correlated the high degree of contamination in the River Pampa with pilgrimage season [29]. In the case of DO levels, ANOVA analysis revealed no significant (p<0.05) seasonal variation among the sampling locations.
Figure 2.
Spatial and temporal variations in physico-chemical parameters in the study area.
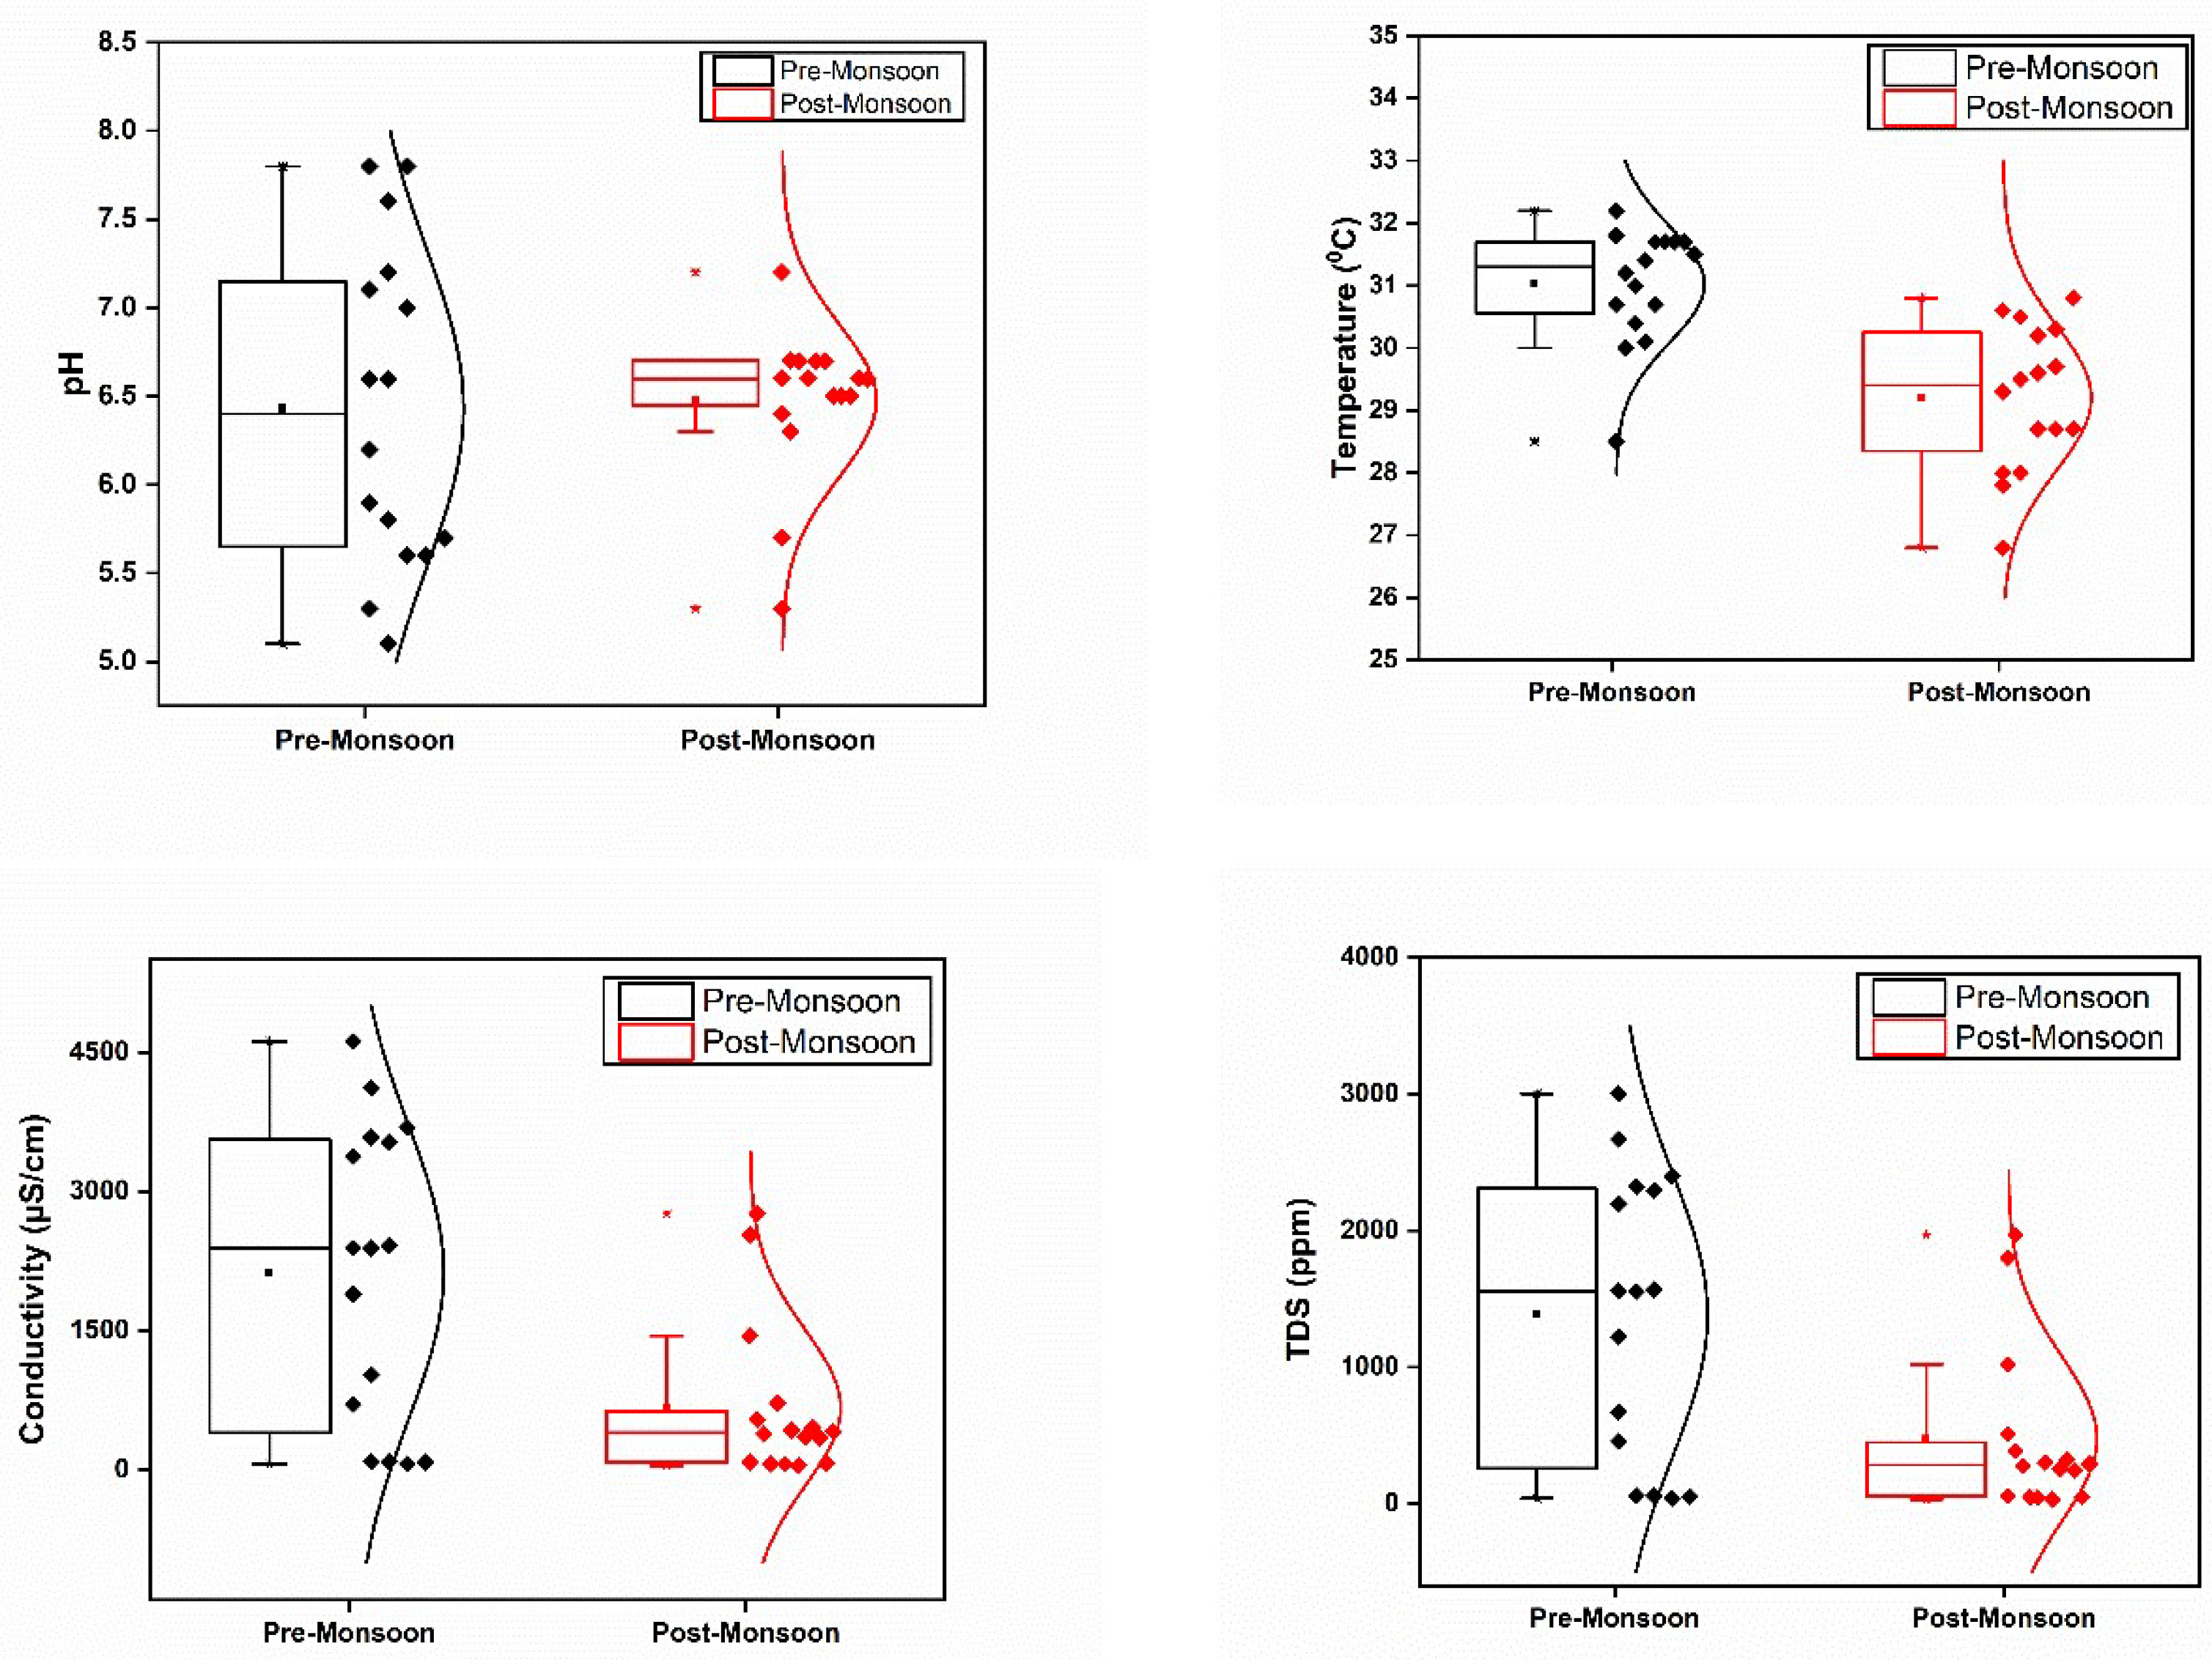
In general, higher pH, water temperature, conductivity, TDS, salinity, DO, and hardness levels were recorded in the PRM season. During PRM, the site S7 at the mouth of River Meenachil had the highest conductivity, TDS, salinity, and hardness values in the PRM season; this is where the primary channels of the River Meenachil drain into the lake. While, Puthankayal (S12), another interface of River Pamba with Lake, exhibited the highest conductivity, TDS, salinity, and hardness levels in the POM season. Thus, these results clearly highlight the role of the river mouth points in controlling the water chemistry of Lake. Strong positive correlations were observed between conductivity, total dissolved solids, salinity, total hardness, chloride, sulphate, sodium, magnesium, potassium, and calcium values. Additionally, a strong positive correlation was observed between pH and DO. Temperature displayed a moderate positive correlation among chloride, sulphate, sodium, potassium, magnesium, and DO (Table 2).
3.3. Ionic Levels
In the pre-monsoon (PRM) season, notably high concentrations of sulphate and chloride were found in water samples collected from Vembanad Lake and its adjoining rivers (Figure 3). Specifically, sampling points, S7 (located at the mouth of River Meenachil) and S8 (Manimala) exhibited the highest levels of both ions during PRM. Conversely during the post-monsoon (POM) season, S12 (Puthankayal), S15 (chloride), and S6 (sulphate) recorded the highest values. The elevated chloride levels in the lower reaches of River Meenachil during PRM could be attributed to saline water intrusion, with [30] chloride contamination serving as an indicator of chloride-rich sewage effluent discharge. The decrease in ion concentration during POM could be due to dilution during the monsoon season. In contrast to other parameters, elevated nitrate concentration in surface water was observed during POM, followed by the PRM season. Despite being low in both seasons, nitrate concentrations ranged between 0.24 – 2.11 ppm in PRM season and 0.38 – 4.2 ppm in POM. (Table 1) The presence of nitrate, although typically not detrimental to health, can lead to eutrophication and pose harm to aquatic systems [31]. The chloride, nitrate, and sulphate levels exhibited significant variation between PRM and POM seasons. Additionally, a strong positive association between chloride and sulphate suggested a common source of origin (Table 2). However, there was no association between sulphate and chloride with nitrate levels, indicating a potentially different source for nitrate contribution.
In terms of cation analysis, concentrations of Na, Mg, K, and Ca peaked during PRM compared to POM (Figure 3). Although no significant difference was observed between ammonium and calcium levels, the maximum concentration of Na, Mg, Ca, and K during PRM were recorded at S1. These ions, particularly Na, showed higher concentrations near the lake-river interface, primarily due to saline water intrusion. Moreover, strong positive associations were observed between Na and various parameters, indicating a common source (Table 2). Notably, a significant seasonal variation (p<0.05) in Na concentrations was noted.
Figure 3.
Spatial and temporal variations in the ionic concentration of the study area.
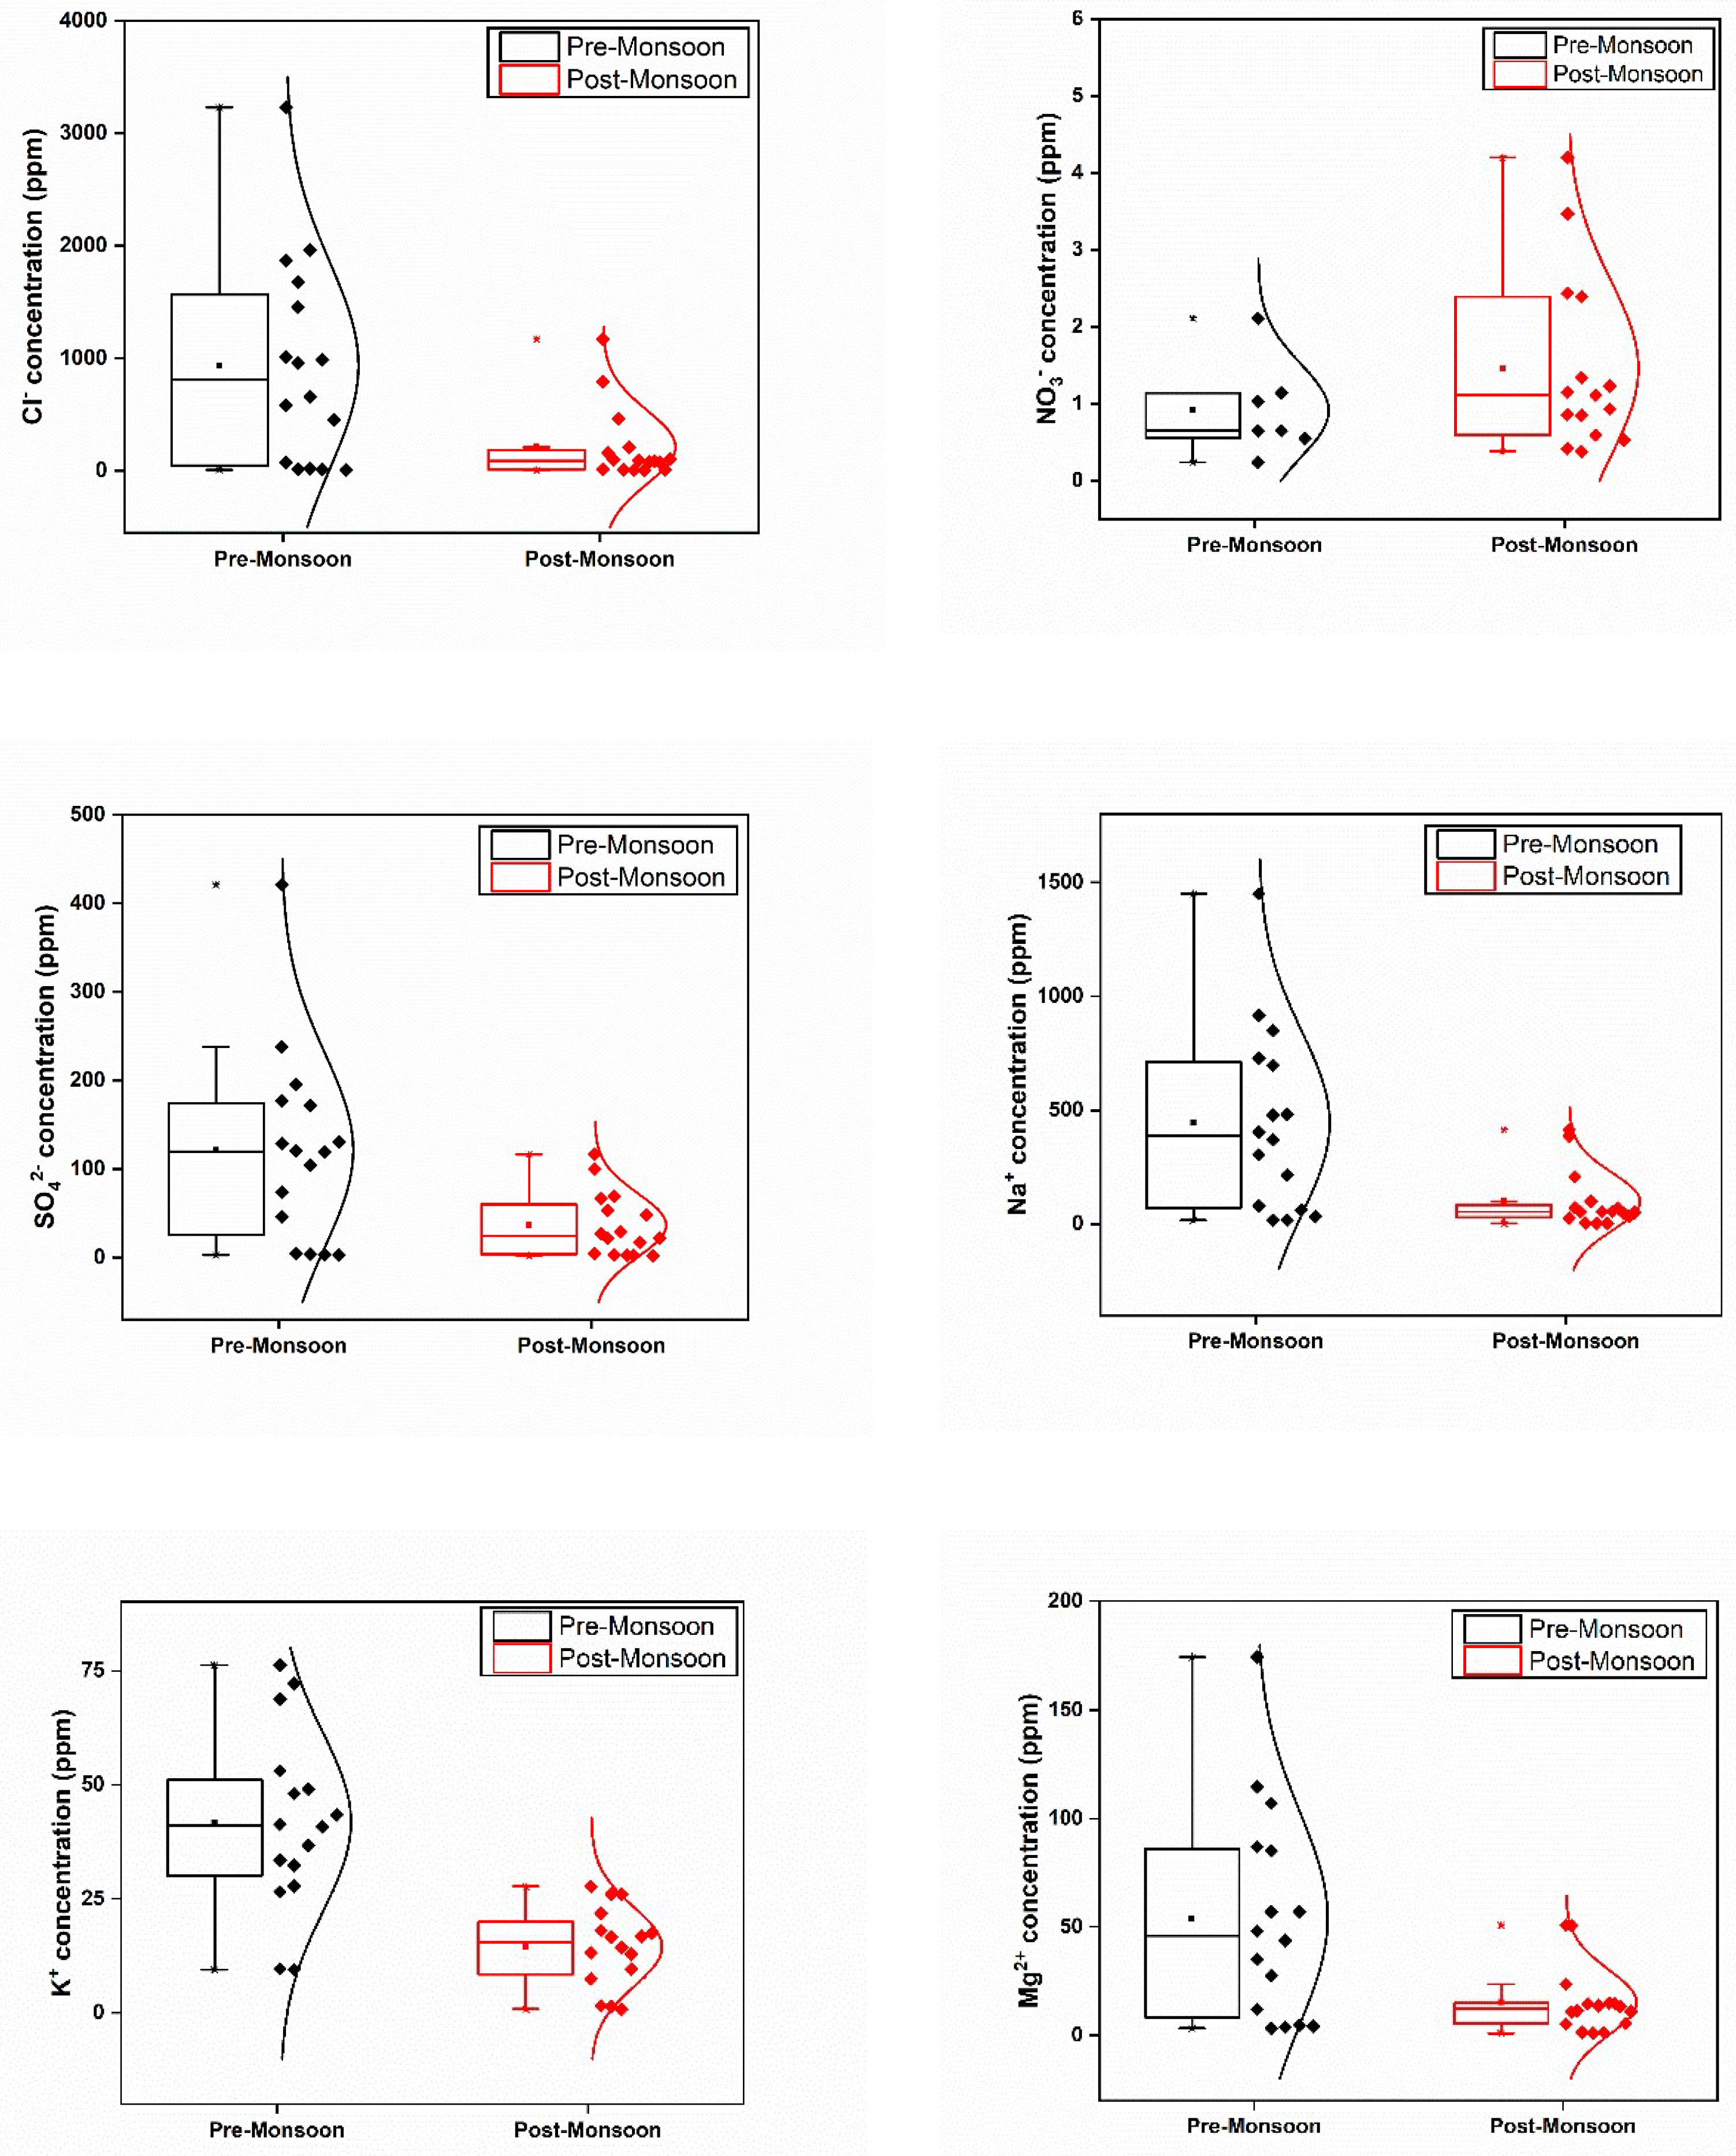
Before reaching the Vembanad Lake, the neighbouring rivers traverse around the Kuttanadu Padashekaram, where paddy cultivation occurs below sea level, a characteristic feature of this study area. Potassium (K), a key component of many artificial fertilizers, exhibited concentrations varying from 9.49 to 76.2 ppm during PRM and 0.81 to 27.71 ppm during POM. The annual fertilizer input of K into River Pamba is approximately 6207 tonnes/year [29]. K displayed significant positive correlations with various parameters, indicating a common source. Additionally, significant seasonal differences were observed for K (p<0.05).
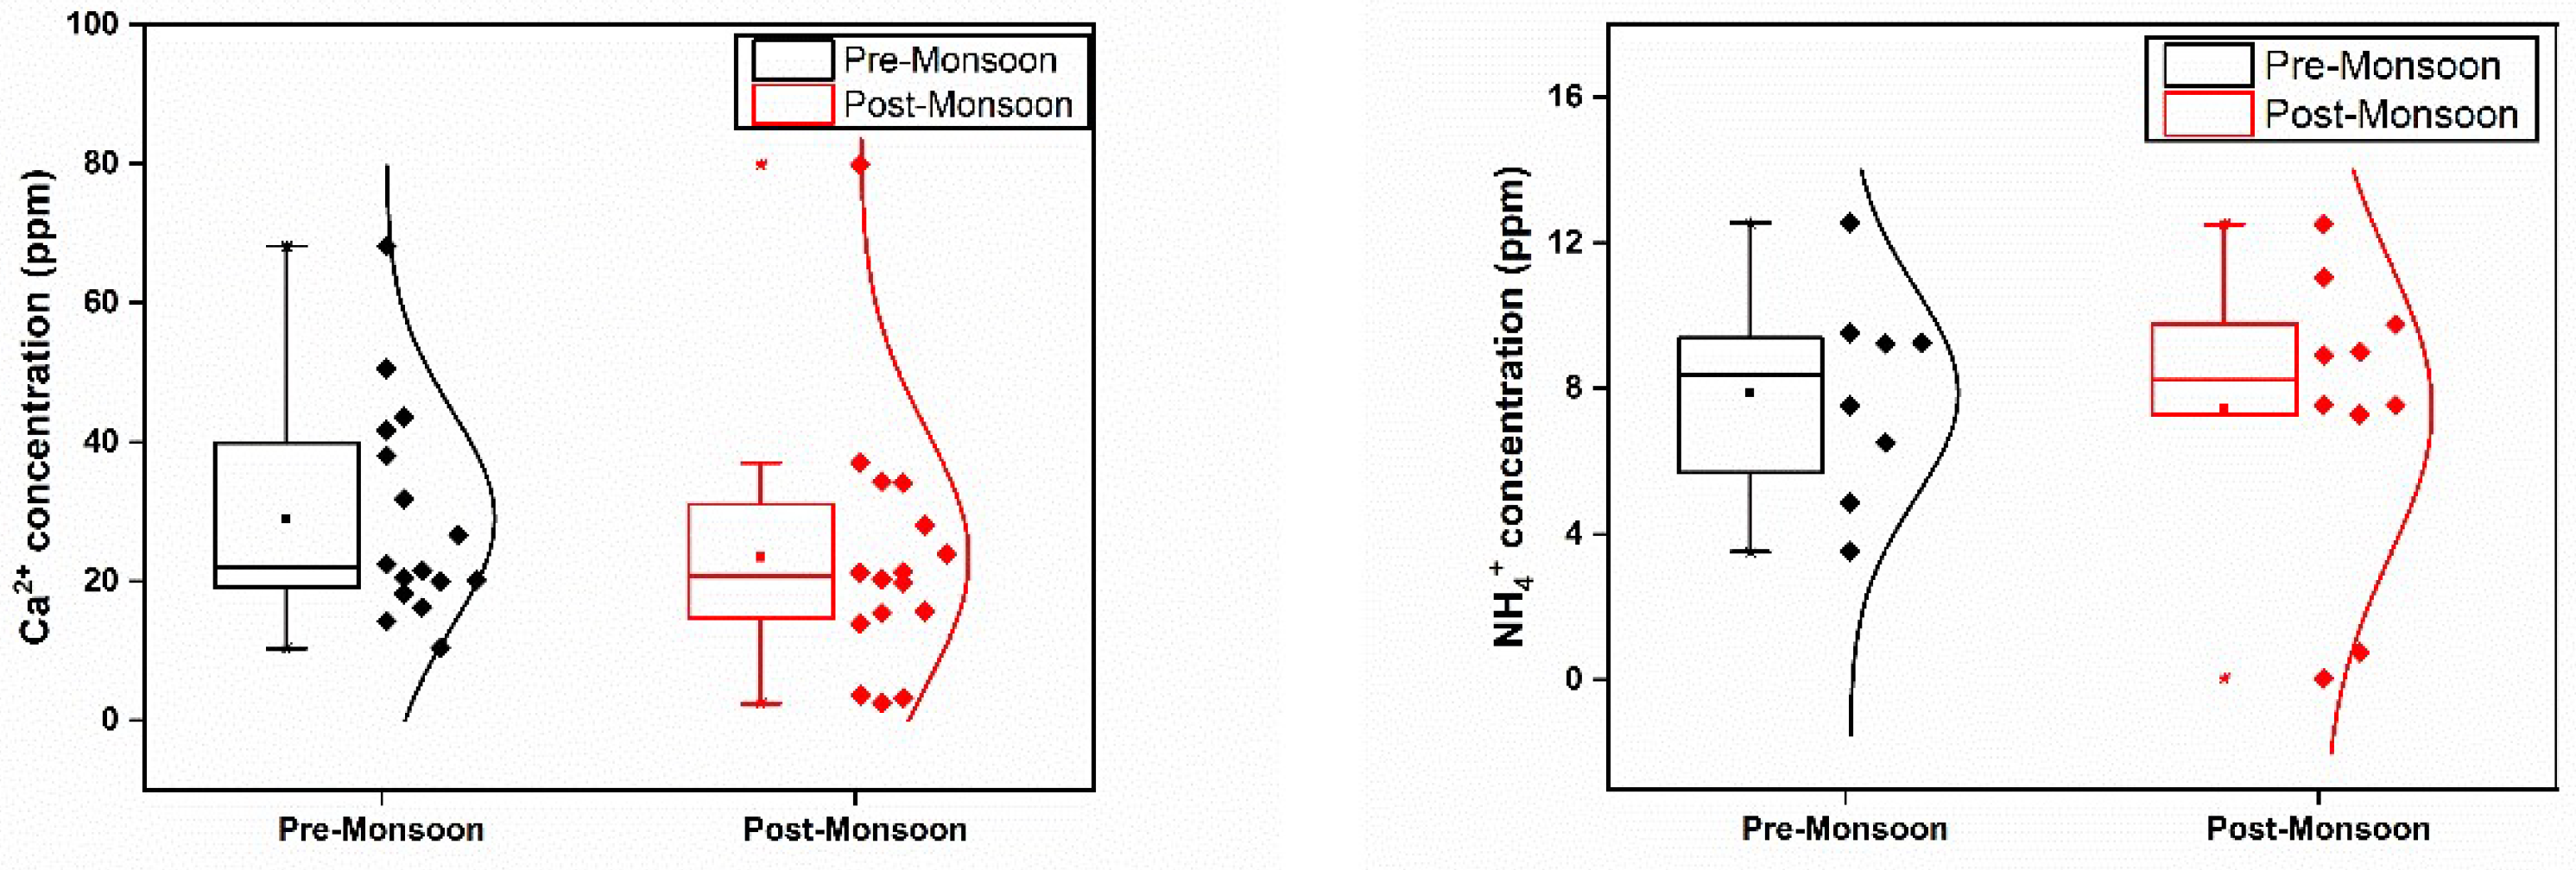
Significant variations were also observed for Mg and Ca levels between the two seasons, with higher concentrations recorded during PRM. Mg ions exhibited a seasonal average value greater than Ca ions during PRM, while the opposite trend was observed during the POM. The presence of a lime industry near certain sampling station (S1) may contribute to the significant loading of Ca ions in both seasons. Strong positive correlations were observed for Mg and Ca with various parameters, indicating potential common sources.
Ammonium ions, recognized as good indicators of eutrophication, exhibited concentration variation from 3.52 to 12.55 ppm during PRM and 0.04 to 12.52 ppm during POM (Figure 3). The maximum NH4 concentration in PRM was observed at S10, while S14 recorded the highest NH4 concentration in POM. River Pamba contributes dissolved inorganic nitrogen to Lake Vembanad, with chemical fertilizers and animal waste effluents potentially contributing to nitric acid pollution of water [29,32]. Negative correlations were observed between NH4 and conductivity, TDS, and salinity, with no significant variation in NH4 concentration between seasons (Table 2).

Table 1.
Variations in hydrographical parameters in the study area. Results of ANOVA also presented.
Table 1.
Variations in hydrographical parameters in the study area. Results of ANOVA also presented.
| Parameter | Seasonal Variations |
ANOVA- p value (Seasonal) |
|||
| Premonsoon | Postmonsoon | ||||
| Range | Mean | Range | Mean | ||
| Temperature (⁰C) | 28.5-32.2 | 31.01 | 26.8-30.8 | 29.2 | .000 |
| pH | 5.1-7.8 | 6.43 | 5.3-7.2 | 6.47 | .862 |
| Conductivity (μS/cm) | 64-4618 | 2128.75 | 46.1-2760 | 669.45 | .014 |
| TDS (ppm) | 41-3003 | 1382.75 | 32.2-1970 | 475.71 | .017 |
| Salinity (ppm) | 20-2460 | 1092.5 | 28.2-1420 | 332.23 | .051 |
| DO (ppm) | 1.6-8.7 | 6.45 | 2.3-7.8 | 5.26 | .094 |
| Hardness (ppm) | 18-526 | 220.56 | 16-252 | 74.12 | .035 |
| Chloride (ppm) | 8.31-3230.57 | 936.06 | 4.01-1168.33 | 210.92 | .021 |
| Nitrate (ppm) | ND-2.11 | 0.91 | ND-4.2 | 1.45 | .002 |
| Sulphate (ppm) | 2.74-420.93 | 121.25 | 1.89-116.23 | 36.53 | .007 |
| Sodium(ppm) | 16.34-1449.55 | 443.85 | 2.72-413.73 | 98.69 | .005 |
| Ammonium(ppm) | ND-12.55 | 7.88 | ND-12.52 | 7.44 | .564 |
| Potassium(ppm) | 9.49-76.2 | 41.82 | 0.81-27.71 | 14.49 | .000 |
| Magnesium(ppm) | 3.26-174.51 | 54.06 | 1.01-50.77 | 15.23 | .023 |
| Calcium(ppm) | 10.36-68.17 | 29.01 | 2.45-79.88 | 23.38 | .254 |
Table 2.
Correlation matrix for the different physicochemical parameters of surface water measured in Vembanad lake and adjoining rivers. *Correlation is significant at the 0.05 level (2-tailed), **Correlation is significant at the 0.01 level (2-tailed).
Table 2.
Correlation matrix for the different physicochemical parameters of surface water measured in Vembanad lake and adjoining rivers. *Correlation is significant at the 0.05 level (2-tailed), **Correlation is significant at the 0.01 level (2-tailed).
| TRP | TAHP | TOP | Cl | NO3 | SO4 | Na | NH4 | K | Mg | Ca | Temp | pH | EC | TDS | Salinity | DO | TH | |
|---|---|---|---|---|---|---|---|---|---|---|---|---|---|---|---|---|---|---|
| TRP | 1.000 | |||||||||||||||||
| TAHP | -.232 | 1.000 | ||||||||||||||||
| TOP | -.067 | -.400* | 1.000 | |||||||||||||||
| Cl | .399* | -.359* | .222 | 1.000 | ||||||||||||||
| NO3 | -.054 | .056 | -.133 | -.216 | 1.000 | |||||||||||||
| SO4 | .359* | -.300 | .216 | .952** | -.176 | 1.000 | ||||||||||||
| Na | .424* | -.348 | .229 | .960** | -.177 | .934** | 1.000 | |||||||||||
| NH4 | -.352* | .288 | .020 | -.395* | .059 | -.361* | -.337 | 1.000 | ||||||||||
| K | .375* | -.402* | .289 | .713** | -.263 | .708** | .833** | -.223 | 1.000 | |||||||||
| Mg | .469** | -.322 | 190 | .953** | -.069 | .950** | .964** | -.370* | .775** | 1.000 | ||||||||
| Ca | .326 | -.035 | -.118 | .682** | .111 | .669** | .705** | -.132 | .616** | .786** | 1.000 | |||||||
| Temp | .052 | -.313 | .321 | .487** | -.399* | .519** | .469** | -.105 | .534** | .431* | .261 | 1.000 | ||||||
| pH | -.043 | .133 | -.033 | -.117 | -.237 | -.146 | -.169 | .280 | -.212 | -.180 | -.156 | .007 | 1.000 | |||||
| EC | .317 | -.364* | .217 | .960** | -.187 | .940** | .940** | -.415* | .689** | .937** | .665** | .444* | -.201 | 1.000 | ||||
| TDS | .321 | -.372* | .230 | .956** | -.171 | .941** | .935** | -.418* | .679** | .935** | .652** | .421* | -.199 | .999** | 1.000 | |||
| Salinity | .322 | -.313 | .222 | .941** | -.107 | .927** | .929** | -.425* | .662** | .933** | .644** | .378* | -.214 | .984** | .988** | 1.000 | ||
| DO | -.084 | -.020 | .354* | -.047 | -.257 | -.010 | -.046 | .100 | .056 | -.081 | -.257 | .396* | .615** | -.084 | -.085 | -.087 | 1.000 | |
| TH | .404* | -.278 | .202 | .975** | -.143 | .968** | .957** | -.386* | .707** | .974** | .727** | .442* | -.155 | .959** | .957** | .957** | -.082 | 1.000 |
3.4. Phosphorus Speciation in Surface Water
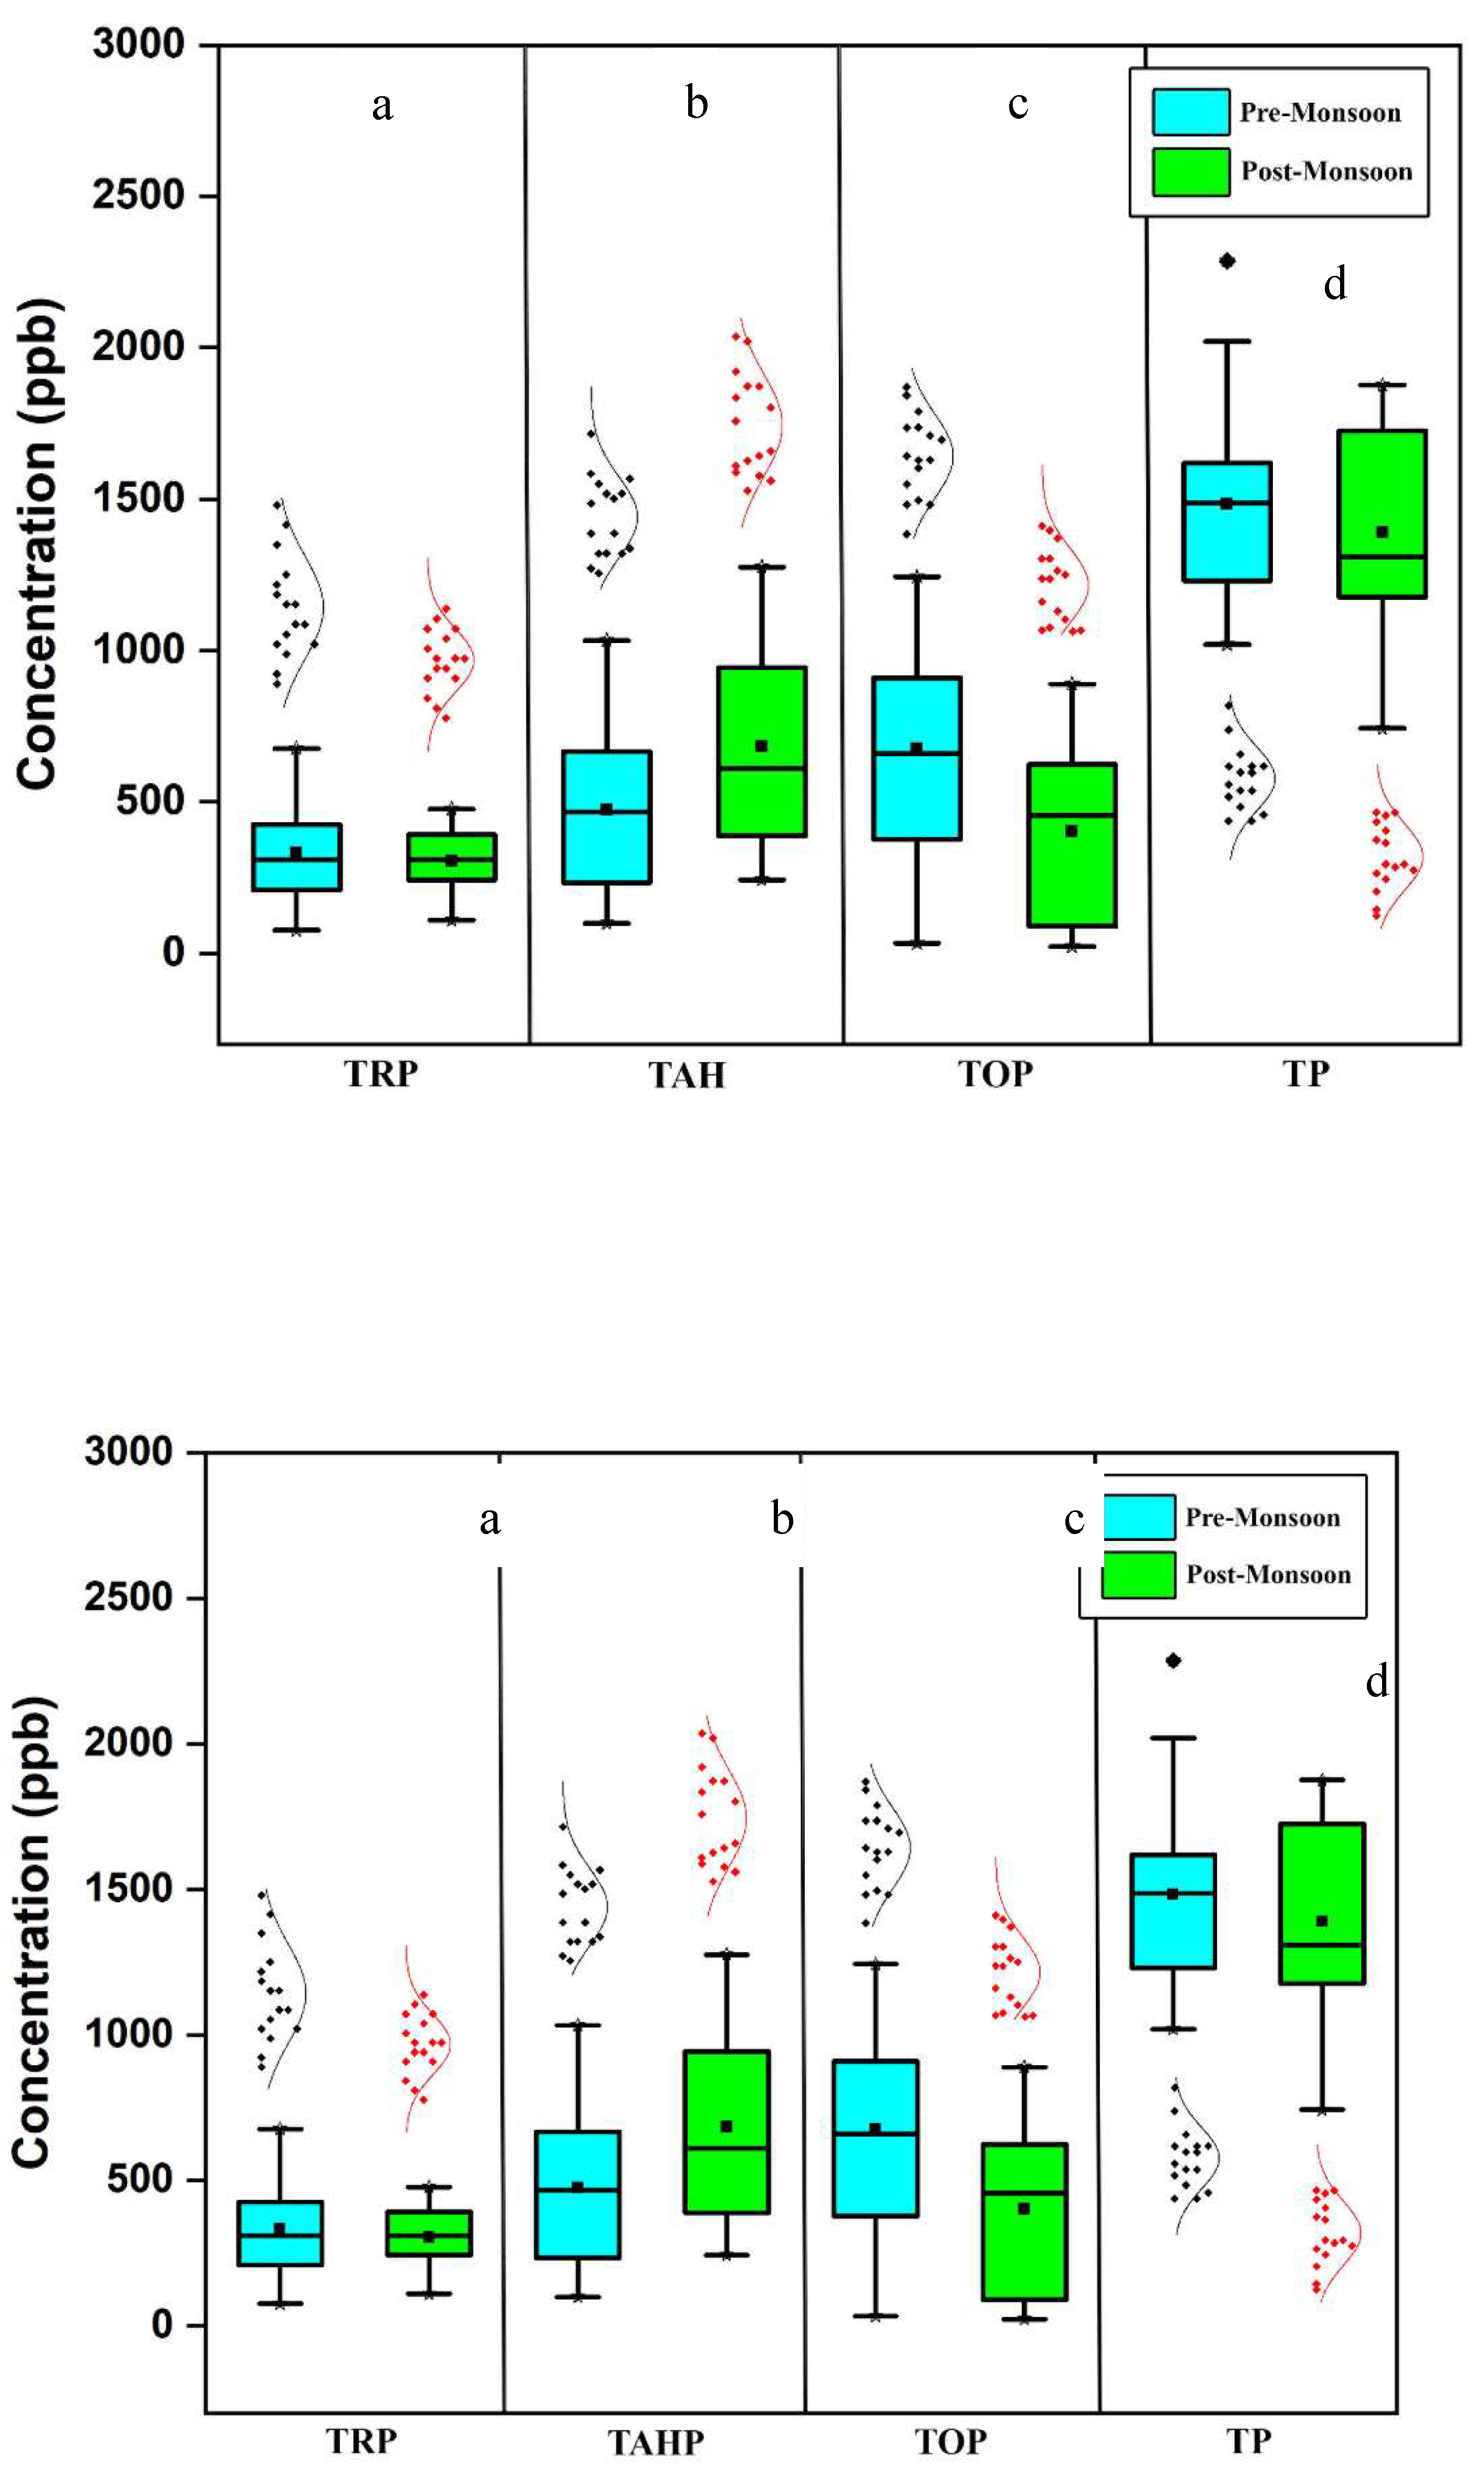
The concentration of total reactive phosphorus (TRP) ranged from 76.66 - 676.66 ppb during the Pre-Rainy Monsoon (PRM) and 110.0 - 476.66 ppb during the Post-Rainy Monsoon (POM). However, no significant temporal variation was observed across different seasons (Figure 4 a). Elevated phosphorus levels in lakes typically occur in areas where there is a significant influx of sediments carrying human and animal waste fertilizers into water bodies [33]. Higher concentrations were recorded at S7 (Meenachil river mouth), where all the distributaries of River Meenachil drain into Lake Vembanad. The PO4 concentrations were high during the PRM concerning POM. One factor that might have been involved in raising the phosphate levels is the reduced water level in the aquatic matrices leading to a concentration of ions. Other factors may involve the surge in microbial activity and the rise in phosphorus release from sediment at elevated temperatures [34]. Similar trends were observed in phosphate content in the 'Cochin estuary, draining into Vembanad lake [16], and River Sitalakhya (Bangladesh) [35]. Soluble reactive phosphate concentration of over 0.025 ppm is usually considered showing eutrophic conditions [36]. In this context, the level of PO4 in Vembanad lake and its tributaries is high enough to support eutrophication. There was also a significant positive correlation observed between reactive phosphorus, Cl (r =.399), SO4 (r =.359), Na (r =.424), K (r =.375), Mg (r =.469) and hardness (r =.404) (Table 2).
The total acid hydrolysable phosphorus (TAHP) ranged from 100.0 - 1033.33 ppb and 243.33 - 1276.67 ppb in PRM and POM seasons, respectively (Figure 4 b). TAHP concentrations were maximum at S8 (River Manimala) and S6 (River Meenachil) during PRM and POM, respectively. TAHP levels did not show significant variation (p>0.05) among seasons. In general, TAHP concentrations were noticed to be higher in POM. During POM, millions of devotees perform rituals as a part of their belief in River Pampa. Bathing and laundry activities by the devotees could very well lead to the substantial influx of polyphosphate into the aquatic matrix. Phosphates are added to detergents as sodium tripolyphosphate (STPP), and In India, their composition levels in products vary from 8 - 35% [37]. STPP is an acid hydrolysable phosphorus that can quickly hydrolyse to orthophosphate in water. River Manimala basin also receives significant amounts of inorganic phosphate and other ions through effluents discharge from commercial centers and restaurants [38].
Concentration of total organic phosphorus (TOP) ranged from 33.33 - 1243.34 ppb in PRM and 23.33 to 890.0 ppb in POM (Figure 4 c). TOP recorded the maximum concentration at S3 in PRM and S5 in POM. Both are river mouths of River Meenachil. These stations are at the downstream portion of the river, which carries significant quantities of organic/inorganic wastes. Previous records have also highlighted the effects of anthropogenic influences on the River Meenachil [39,40,41]. Only a few reports are focused on organic phosphorus in rivers/lakes, as it was previously believed that organic phosphorus contributes insignificantly to the phosphate levels in the water. However, recent studies have revealed that orthophosphate in agricultural watersheds can be released from particulate organic phosphorus [42]. Because bioavailable P, besides orthophosphate, is present in the phosphorus-containing fertilizers used in agricultural watersheds. Particulate organic phosphorus in the river has a significant chance of supplying PO43- into the river water [43,44]. This can trigger eutrophication in water bodies. After flowing across the extensive agricultural region, the tributaries enter Vembanad lake which may carry tons of organic phosphorus into the lake system. In Kerala, organic fertilizers like animal manure, and bone meal along with chemical fertilizers are widely applied before the onset of South-West and North-East monsoon [29]. In our study, TOP concentration was greater when the water level is low during the PRM season. TOP showed significant (p<0.05) seasonal difference, and it is positively correlated with DO (r =.354). A significant negative correlation was observed between TOP and TAHP (Table 4).
Total phosphorus (TP) ranged between 1020 - 2286.66 ppb in PRM and 743.33 - 1876.66 ppb in POM. We could not notice any significant (p > 0.05) variation among seasons (Figure 4 d). The maximum value of TP was recorded at S14 (Manimala and Pamba) in PRM. With POM, the highest values were recorded at S6 (Meenachil) and S15 (Achankovil). Overall, the sampling stations in River Meenachil showed unusually higher values for most of the phosphorus fractions. The concentration gradations of the four phosphorus species observed are TRP>TAHP>TOP>TP in PRM and TRP>TOP>TAHP>TP in POM. The mean TRP, TOP and TP concentrations were high at PRM when compared to POM. The absorption of TRP and TP by phytoplankton might be one reason responsible for this phenomenon [45]. Apart from this, the quantity of diffuse-source phosphorus entering the adjoining rivers is mostly determined by rainfall, hydrological conditions, and land use in their watersheds [46]. The excessive fertilization of the soil with chemical fertilizers or the growth of algae that are capable to bind directly to PO43- from the air, are both responsible for the high amounts of phosphorus [47]. The contaminants accumulated in the estuaries because of anthropogenic activities and the dynamics of rivers and lakes may also have increased the quantities of nitrogen and phosphorus [48]. The landscape surrounding the Vembanad lake is mainly agrarian, particularly enriched with paddy cultivation. It can contribute a large quantity of fertilizers into the aquatic system. Vembanad lake was the recipient of the 47 tonnes/year of PO43- that is transported by the River Pamba [29]. Correlation studies reveal that a strong positive correlation exists between TP and TOP; however, a moderate positive correlation between TP and TAHP was also noticed. No correlation existed between TRP with any other phosphate species (Table 4). Variation of TRP, TAHP, TOP and TP concentration in water according to seasons is shown in Figure 4, respectively.
Figure 4.
Seasonal variation in concentration of a-total reactive phosphorus (TRP), b-total acid hydrolysable phosphorus (TAHP), c-total organic phosphorus (TOP) and d-total phosphorus (TP).
Figure 4.
Seasonal variation in concentration of a-total reactive phosphorus (TRP), b-total acid hydrolysable phosphorus (TAHP), c-total organic phosphorus (TOP) and d-total phosphorus (TP).
Aquatic weeds including Eichhornia crassipes, Monochoria vaginalis, and Salvinia are proliferating unchecked in Vembanad and its interconnecting waterways. This rampant growth serves as a clear indicator of nutrient contamination in the southern part of Vembanad lake. Eichhornia crassipes, in particular, is highly prevalent in tropical and subtropical water bodies due to its high nutrient content. This nutrient abundance stems from agricultural land runoff, deforestation, and inadequate water treatment processes [49].
Following the construction of the Thanneermukkom Bund, the southern section transformed into a dumping ground for pesticides, herbicides, fertilizers, and other agrochemicals utilized in the surrounding paddy fields. [50]. The construction of the Thanneermukkom bund has led to the southern section of the Vembanad lake becoming a freshwater-dominant zone. This alteration was intended to facilitate double cropping in "Kuttanadu." However, the absence of salinity in the water actively encourages the growth of Eichhornia, exacerbating the proliferation of this invasive species. [51]. The eutrophication of the Vemband lake system stands as the primary environmental factor fueling the growth of waterweeds. The combination of nutrient abundance and freshwater conditions within the lake system fosters the unchecked proliferation of these weeds. However, Eichhornia can be harvested promptly for use as compost, vermicompost, or biochar. These products not only decrease the nutrient levels in the water body but also improve soil fertility and crop productivity. [52,53,54,55].
Table 3.
Minimum, maximum and average values of total reactive phosphorus (TRP), total acid hydrolysable phosphorus (TAHP), total organic phosphorus (TOP) and total phosporus (TP).
Table 3.
Minimum, maximum and average values of total reactive phosphorus (TRP), total acid hydrolysable phosphorus (TAHP), total organic phosphorus (TOP) and total phosporus (TP).
| Period of Sampling | Phosphate species | Lowest | Highest | Average | Phosphate Species | ANOVA(Seasonal) |
| PRM | TRP (ppb) | 76.66 | 676.66 | 332.91 | TRP | 0.567 |
| TAHP (ppb) | 100.0 | 1033.33 | 475.0 | |||
| TOP (ppb) | 33.33 | 1243.34 | 676.04 | TAHP | 0.064 | |
| TP (ppb) | 1020.0 | 2286.66 | 1483.95 | |||
| POM | TRP (ppb) | 110.0 | 476.66 | 303.74 | TOP | 0.024 |
| TAHP (ppb) | 243.33 | 1276.67 | 683.12 | |||
| TOP (ppb) | 23.33 | 890.0 | 402.29 | TP | 0.459 | |
| TP (ppb) | 743.33 | 1876.66 | 1389.16 |
Table 4.
Correlation between phosphate species, correlation is significant at p<0.05.
| TRP | TAHP | TOP | TP | |
| TRP | 1 | |||
| TAHP | -0.232 | 1 | ||
| TOP | -0.067 | -0.400* | 1 | |
| TP | 0.11 | 0.41 | 0.60 | 1 |
3.5. Principal Component Analysis
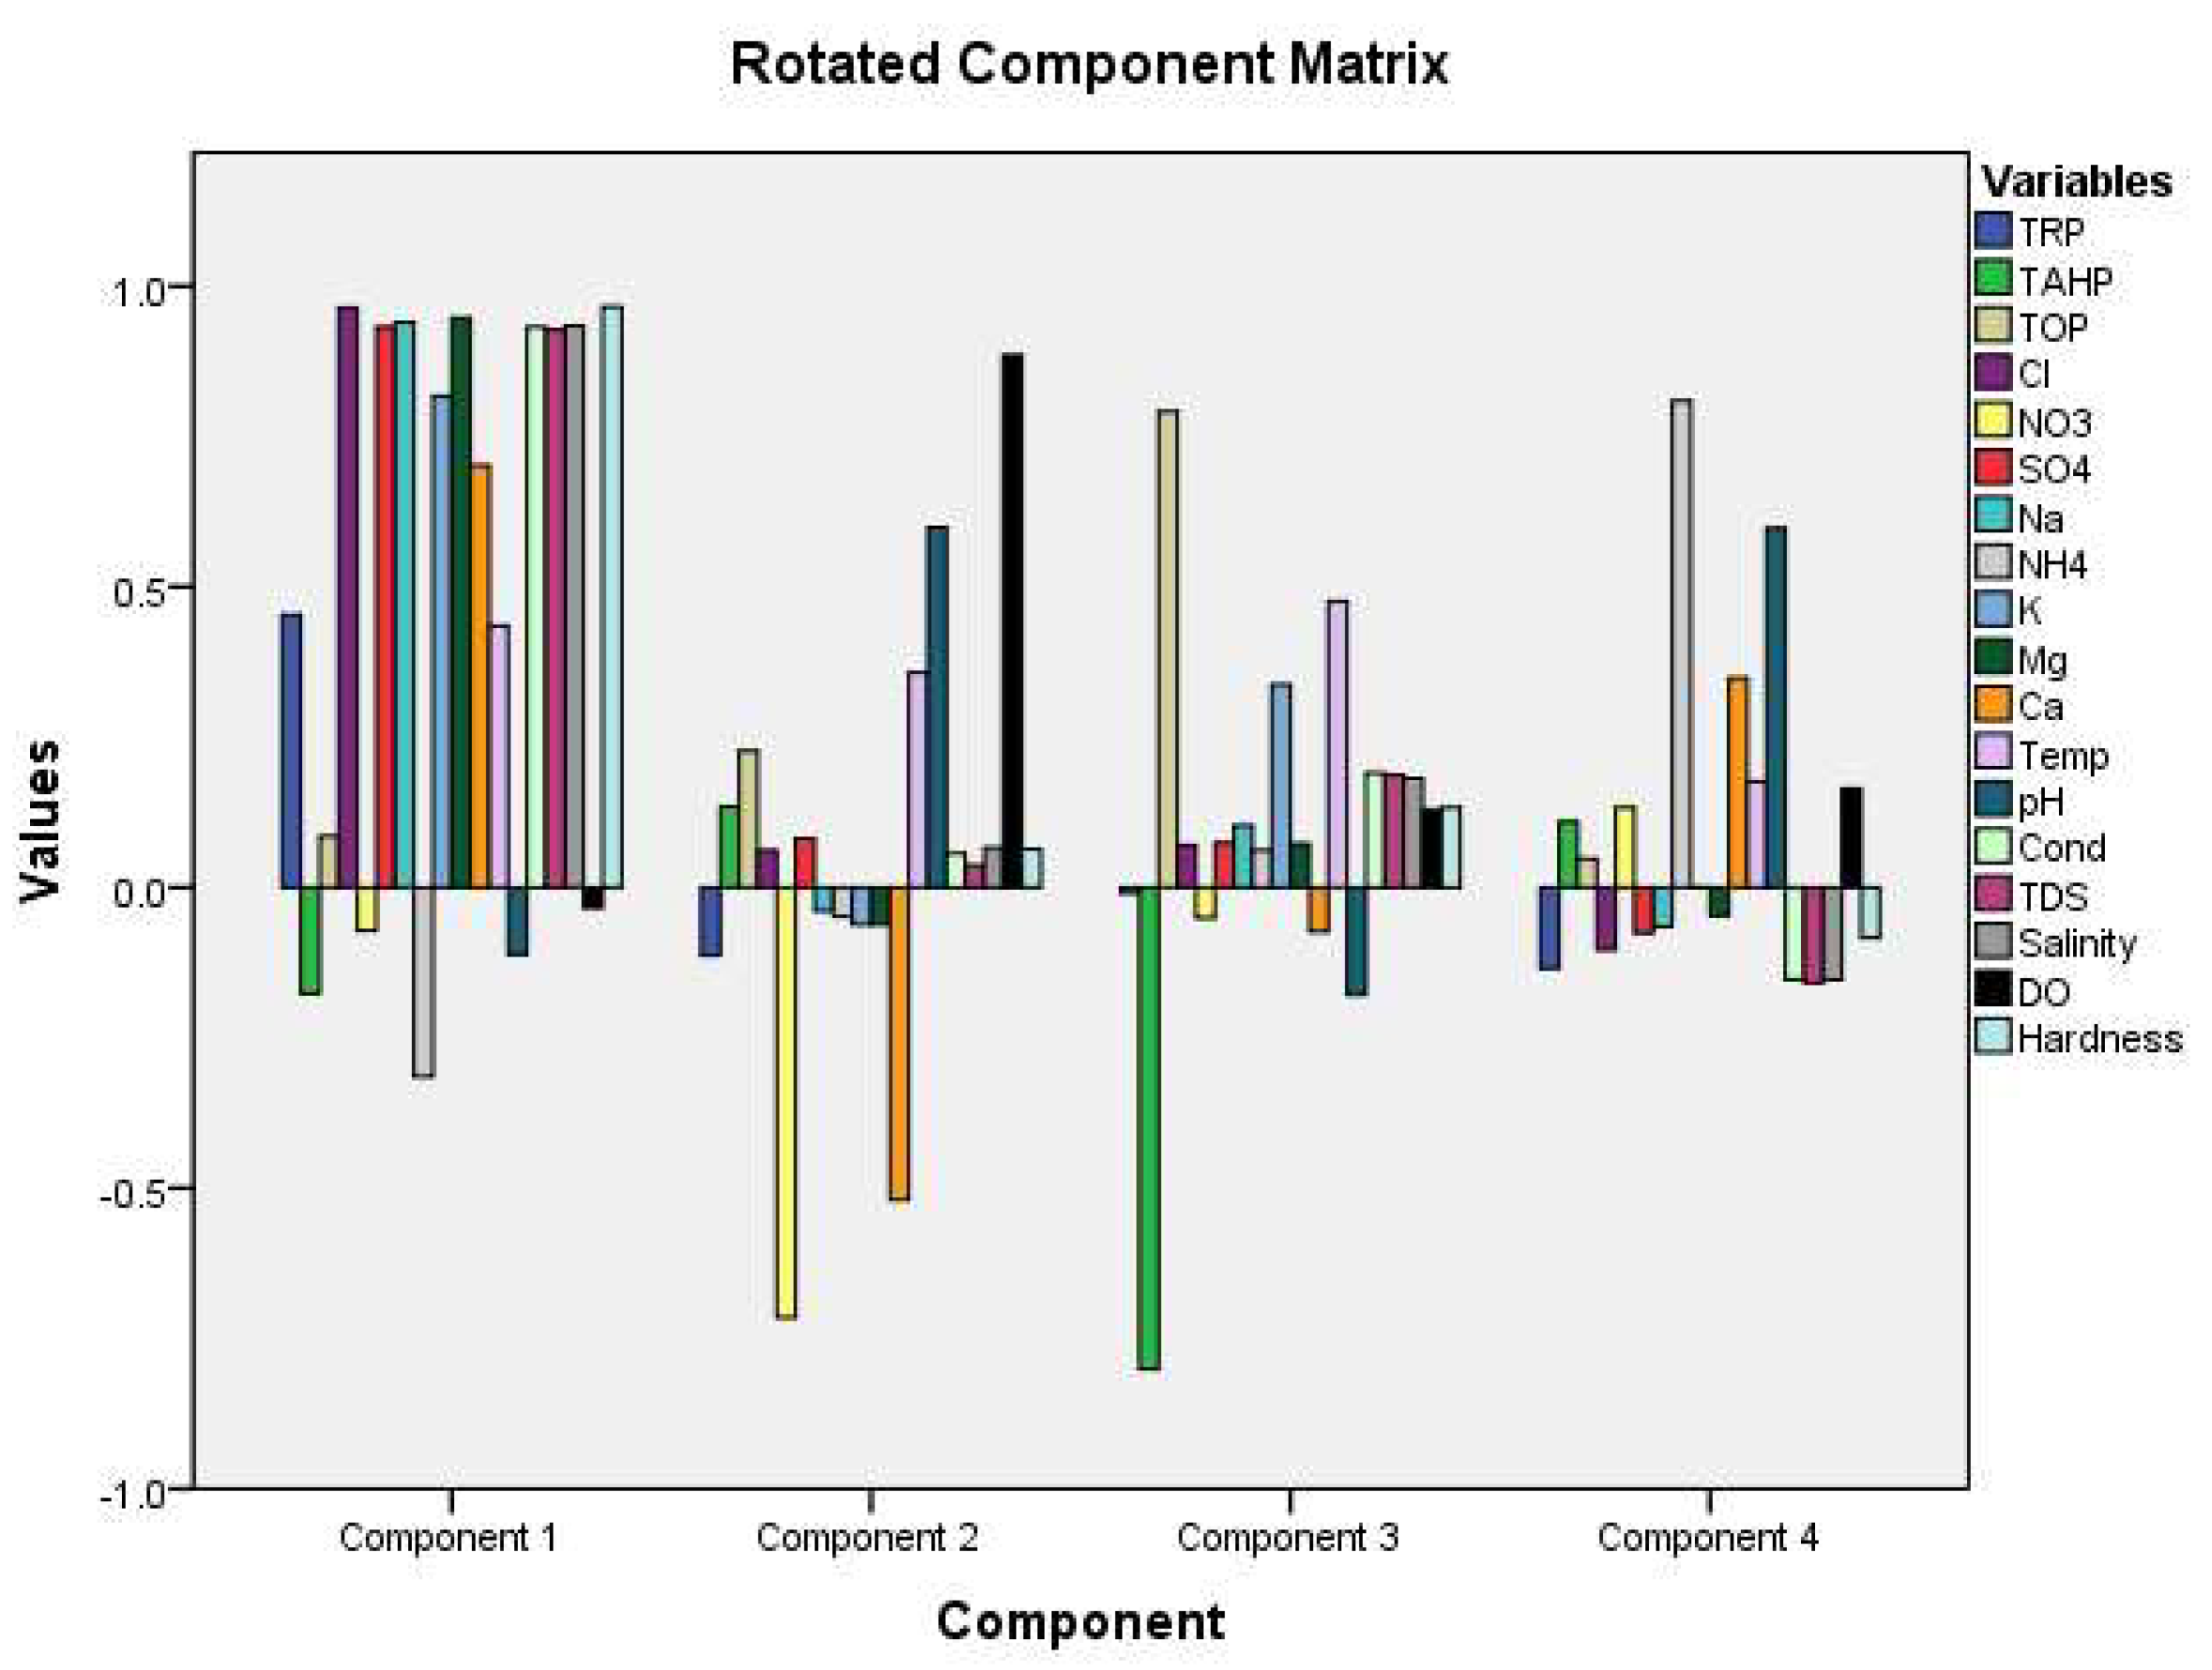
To identify the processes driving the speciation of phosphorus (P) in the study region, we conducted a principal component analysis of P speciation and physicochemical factors in water (Table 5). Based on the eigenvalues, we extracted four components (PC1, PC2, PC3, and PC4) using 18 variables, explaining most of the total variance, which is 78.6%. From these four components, we deduced necessary interpretations.
Explaining the physicochemical and nutrient dynamics at river-lake interfaces is a challenging endeavor since they are dynamic and complicated systems. PC1 accounted for a total variance of 51.5% and exhibited strong positive loadings on total reactive phosphorus (TRP), chloride (Cl), sulfate (SO4), sodium (Na), potassium (K), magnesium (Mg), calcium (Ca), temperature, electrical conductivity (EC), total dissolved solids (TDS), salinity, and total mercury (TH). The high loading of phosphate along with chloride, sodium, and potassium indicates the discharge of sewage and agricultural runoff. Correlation analysis shows that TRP has a positive correlation with Cl, SO4, Na, K, and Mg ions.
PC2 represents 13.16% variance with positive loading on dissolved oxygen (DO) and pH and negative loading on nitrate (NO3) and calcium (Ca). DO and pH have a strong positive correlation (p = 0.05, r = .615**). Eutrophication in the aquatic matrix was noted, where a strong positive correlation existed between DO and pH. Proliferation of aquatic plants was visible during the sampling time. Positive loading on total organic phosphorus (TOP) and temperature defined the third component, which made up 7.49% of the overall variance. An increase in temperature can cause sediments to release phosphorus into the water column above. Spearman’s correlation also showed a positive correlation that exists between TOP and temperature (r = .321).
PC3 shows significant negative loading of total acid-hydrolyzable phosphorus (TAHP), suggesting that the distribution of TOP in the study area is mostly associated with the input of organic matter except for detergent. PC4 comprises positive loading of ammonium (NH4) and pH; ammonium may enter water through droppings of migratory birds, poultry farming, and ammonium-based fertilizers. However, no significant correlation was observed between ammonium and pH. A diagram of factor loading for the variables obtained from PCA is given in Figure 5.
Table 5.
Principal component analysis.
| Component | ||||
| C1 | C2 | C3 | C4 | |
| TRP | .454 | -.113 | -.010 | -.134 |
| TAHP | -.177 | .135 | -.801 | .110 |
| TOP | .085 | .227 | .791 | .048 |
| Cl | .965 | .062 | .071 | -.104 |
| NO3 | -.072 | -.715 | -.051 | .133 |
| SO4 | .932 | .081 | .074 | -.076 |
| Na | .940 | -.039 | .103 | -.066 |
| NH4 | -.314 | -.049 | .062 | .809 |
| K | .817 | -.062 | .337 | .000 |
| Mg | .948 | -.062 | .073 | -.047 |
| Ca | .702 | -.520 | -.074 | .348 |
| Temperature | .435 | .357 | .476 | .176 |
| pH | -.112 | .599 | -.178 | .598 |
| Conductivity | .932 | .057 | .190 | -.153 |
| TDS | .928 | .037 | .188 | -.159 |
| Salinity | .934 | .066 | .182 | -.154 |
| DO | -.034 | .885 | .130 | .165 |
| Hardness | .966 | .064 | .133 | -.084 |
Extraction Method: Principal Component Analysis.
Rotation Method: Varimax with Kaiser Normalization.
Rotation converged in 6 iterations
Figure 5.
Principal component analysis-factor loadings for the variables.
3.6. Hierarchical Cluster Analysis (HCA)
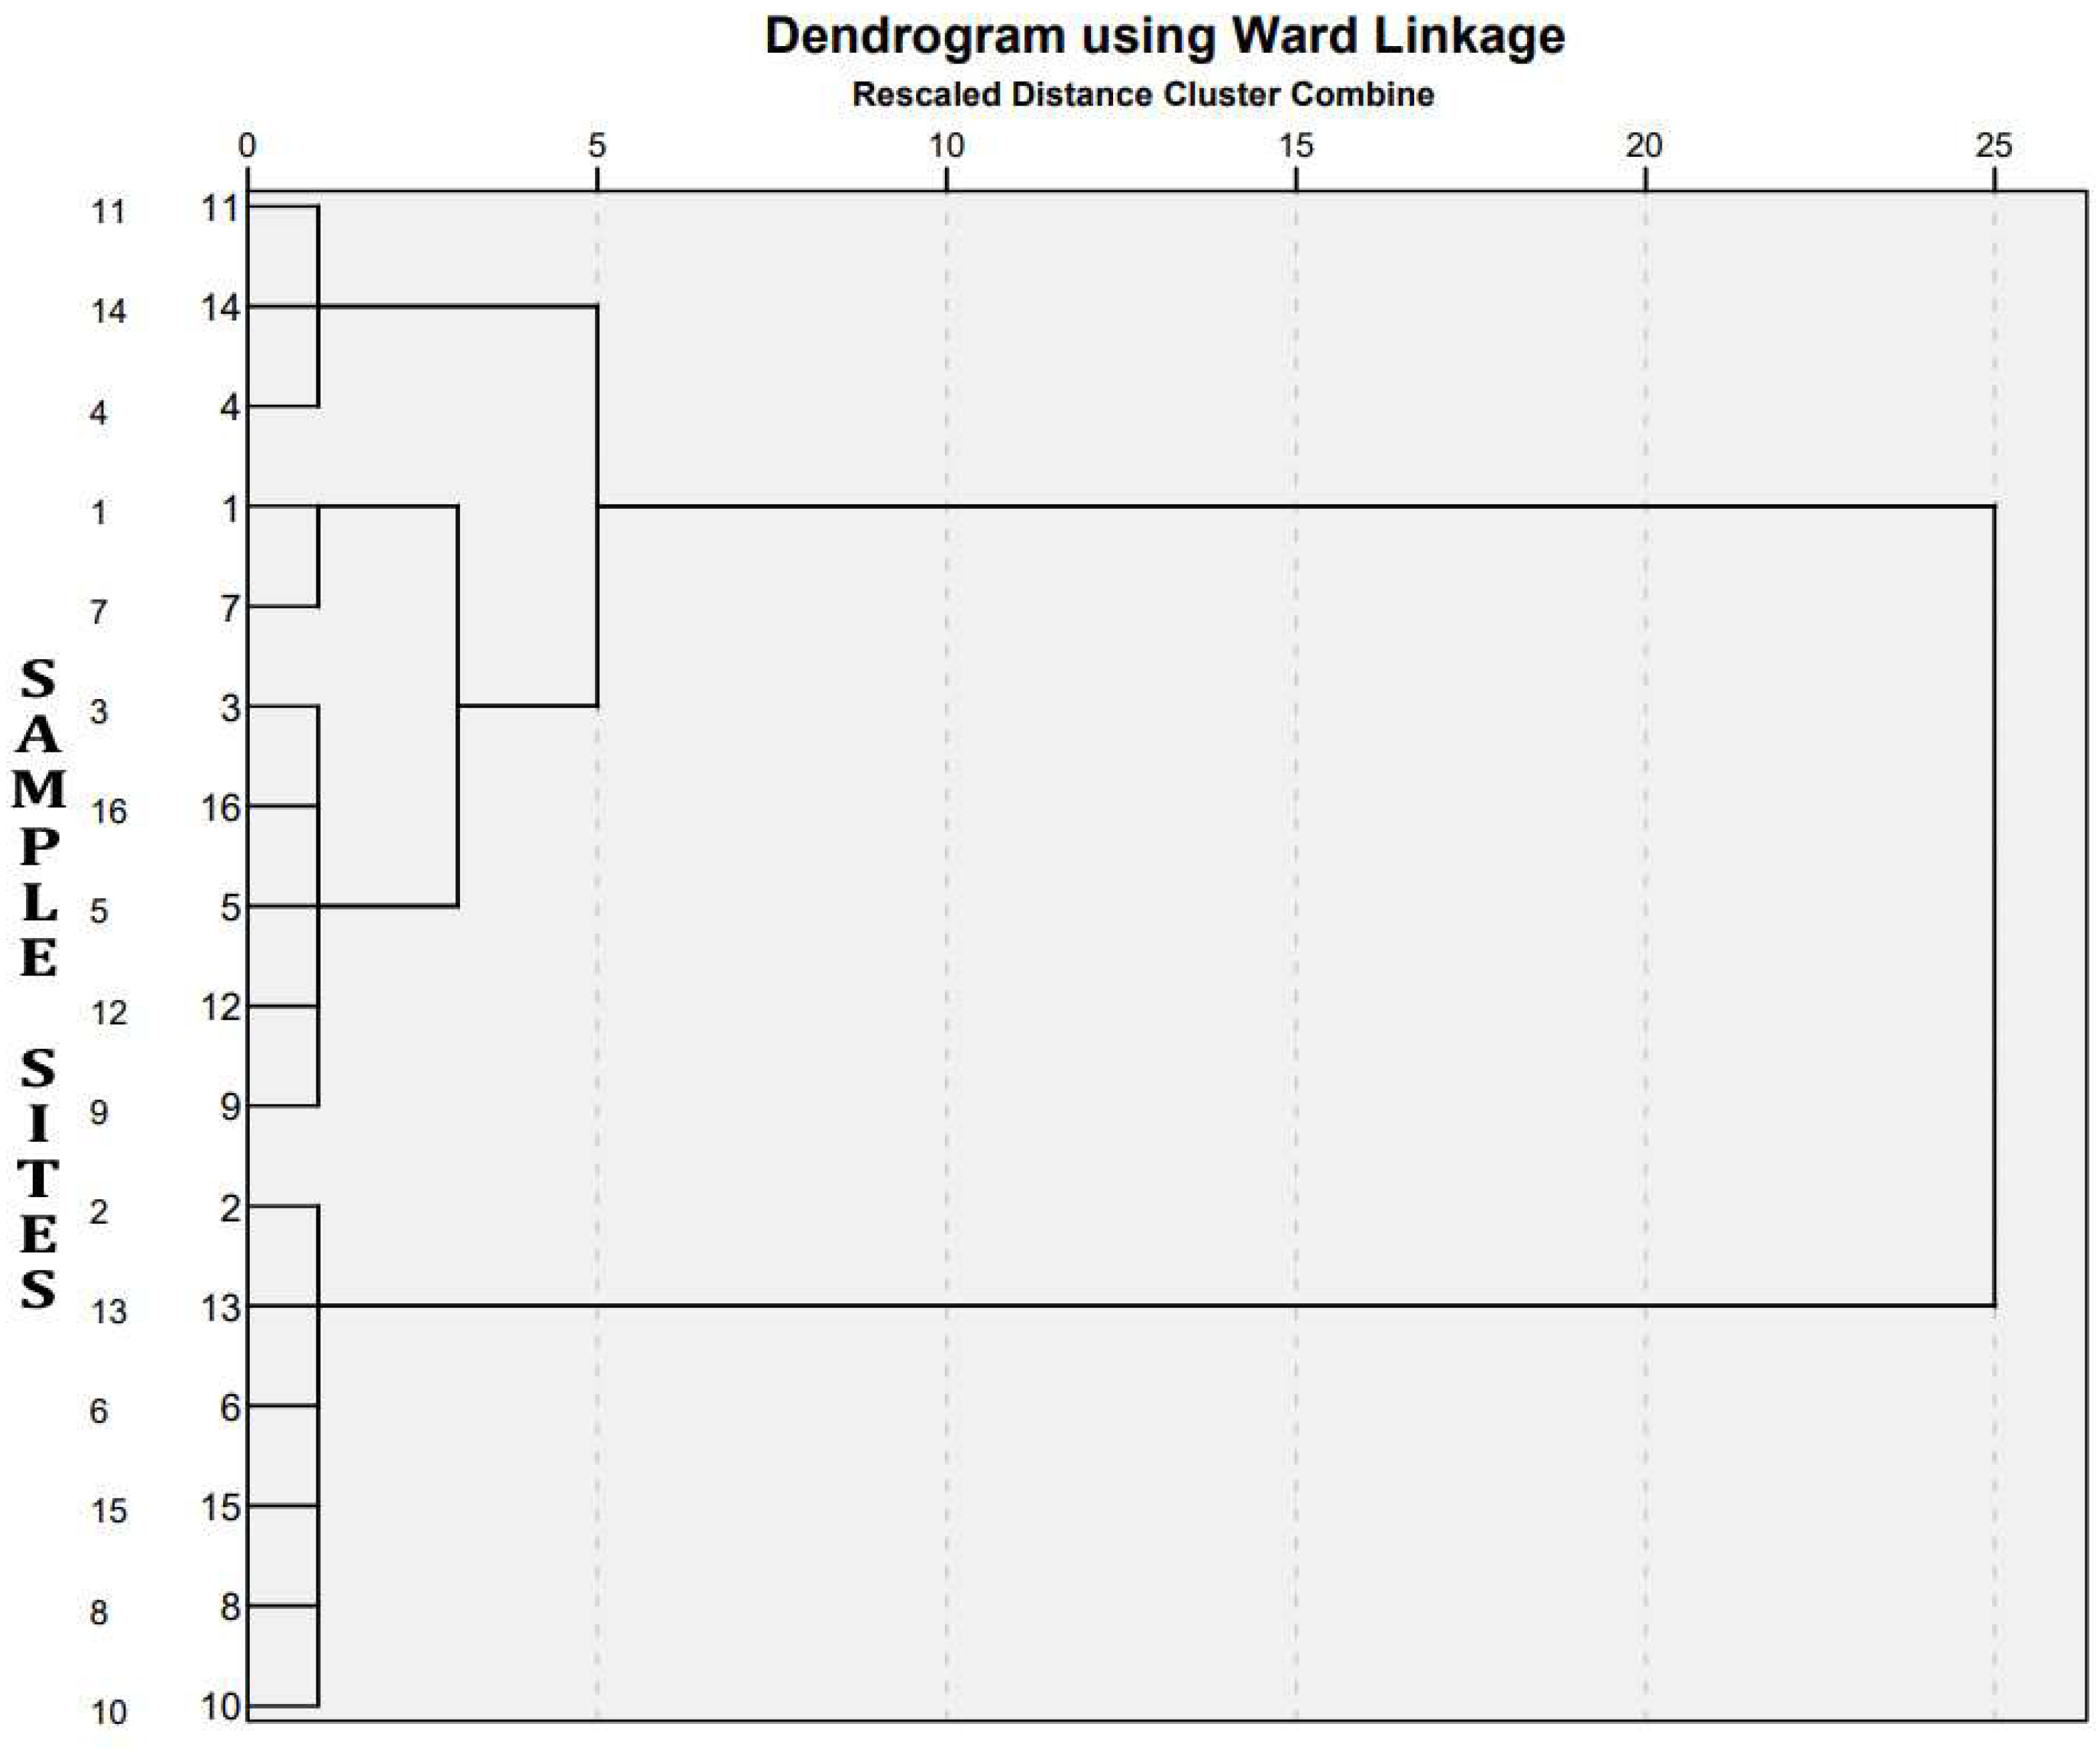
Normally, cluster analysis serves to elucidate similarities between sampling sites. However, in this study, we employed hierarchical cluster analysis (HCA) to group sites with similar origins of pollutants and comparable water quality parameters. The HCA generated a dendrogram (Figure 6), revealing four significant clusters with related characteristics.
Cluster 1 included sites S2 (Illikkal), S13 (Chithirapally), S6 (Sooryakalady), S15 (Peringilipuram), S8 (Thengeli), and S10 (Arattupuzha). Sites S2 and S6 denote river points of the Meenachil river, while S15, S8, and S10 represent individual river points of the Achankovil, Manimala, and Pamba rivers, respectively. In Cluster 1, parameters such as electrical conductivity (EC), total dissolved solids (TDS), salinity, total mercury (TH), chloride (Cl), sulfate (SO4), sodium (Na), potassium (K), calcium (Ca), and magnesium (Mg) exhibited lower values.
Cluster 2 comprises stations S3 (Cheepunkal), S16 (Vembanad middle), S5 (Kaipuzhamuttu), S12 (Puthankayal), and S9 (Pallikayal). Points S3, S5, S12, and S9 are river–lake interface points, while S16 is entirely within the lake. Various physicochemical parameters (EC, TDS, TH, salinity, Cl, SO4, Na, Mg, and K) were significantly higher at these points.
Cluster 3 corresponds to S1 (Achinakam) and S7 (Meenachil river mouth). A sharp increase in conductivity, TDS, salinity, hardness, Cl, and SO4 was observed from S1 to S7.
Cluster 4 corresponds to S11 (Vilakumaram), S14 (Marthandam), and S4 (Kavanattinkara). In these locations the physicochemical parameters and ions like Cl, Na, K, and Mg were similar in concentration at cluster 4, with high values observed at these points.
4. Conclusions
In this study, we conducted an extensive assessment of phosphorus (P) levels in the water of Vembanad lake, a Ramsar site, focusing particularly on the mouths of the rivers flowing into the lake. Our findings revealed widespread contamination by phosphates at the majority of our sampling sites. Mean concentrations of Total Reactive Phosphorus (TRP), Total Acid Hydrolyzable Phosphorus (TAHP), Total Organic Phosphorus (TOP), and Total Phosphorus (TP) exceeded the permissible limits set by USEPA for uncontaminated lakes, causing a troubling level of eutrophication.
The presence of dense mats of Eichhornia and Monochoria across Vembanad lake suggests an environment enriched with nutrients. One of the in-flowing rivers, Meenachil, stood out as a hotspot for TRP and TOP concentrations during both pre-monsoon (PRM) and post-monsoon (POM) seasons. Moreover, confluences of River Meenachil exhibited high values of TOP, TAHP, and TP during POM. Interestingly, while significant seasonal variations were observed for TOP, no such fluctuations were evident for TRP, TAHP, and TP.
During PRM, elevated concentrations of ions, notably chlorides, sulfates, sodium, potassium, and magnesium, were positively associated with reactive phosphate, indicating a common source of origin. Given the predominantly agrarian nature of Vembanad lake and its surroundings, characterized by unique paddy cultivation below sea level, extensive fertilizer use and the local landscape play a significant role in phosphate accumulation in the lake system. Additionally, tourism activities in the region may exacerbate phosphate pollution.
Understanding the individual contributions of each adjoining river to phosphate loading is paramount. Our study offers crucial baseline data for phosphorus mapping in Vembanad lake and its adjoining rivers, emphasizing the urgent need for a systematic and scientific approach to managing nutrient inputs into these aquatic ecosystems.
We advocate for measures aimed at reducing or preventing nutrient loads, alongside regular openings of the Thanneermukkom saltwater barrage, as effective strategies to curb the proliferation of aquatic weeds. This research underscores the importance of proactive initiatives to safeguard the ecological equilibrium of Vembanad lake and its surrounding river networks.
Ethical Approval
Not applicable.
Consent to Participate
Not applicable.
Consent to Publish
Not applicable.
Author Contributions
Anjali Venukumar: Conceptualization, Methodology, Formal analysis, Writing – original draft: Abdugani M. Azimov: Methodology, part of writing. Gani M. Iztleuov: Methodology, review and editing. Vishnu S Moorchilot: Formal analysis, part of writing. Marat I. Sataev: Writing, review & editing. Valsamma J. Koshy: Methodology, Editing, Usha K Aravind: Writing – review & editing, Supervision. Charuvila T. Aravindakumar Writing – review & editing, Supervision.
Funding
The research work was carried out on the basis of project No. 30-PCF-23-24 dated January 25, 2023, subject: BR18574143 «Development and implementation of groundwater purification technology and provision of drinking water to the population and animals of an agricultural enterprise» financed by Ministry of Science and Higher Education of the Republic of Kazakhstan. Partial funding from RUSA and SPARC is also acknowledged.
Competing Interests
The authors declare that they have no known competing financial interests or personal relationships that could have appeared to influence the work reported in this paper.
Acknowledgments
AV is thankful to UGC-RGNF (F1-17.1/2016-17-SC-KER-18885) for the doctoral research fellowship.
Data Availability
Data will be made available on request.
References
- R. Crocker, W.H. Blake, T.H. Hutchinson, S. Comber, Spatial distribution of sediment phosphorus in a Ramsar wetland, Sci. Total Environ. 765 (2021) 142749. [CrossRef]
- B. Bahilu, M. Tadesse, Review on distribution, importance, threats and consequences of wetland degradation in Ethiopia, Int. J. Water Resour. Environ. Eng. 9 (2017) 64–71. [CrossRef]
- E.B. Barbier, M. Acreman, D. Knowler, Economic valuation of wetlands. A guide for policy makers and planners, 1997.
- E.B. Barbier, Valuing ecosystem services for coastal wetland protection and restoration: Progress and challenges, Resources 2 (2013). [CrossRef]
- C.H. Sujatha, N. Benny, R. Raveendran, C.L. Fanimol, N.K. Samantha, Nutrient dynamics in the two lakes of Kerala, India, Indian J. Mar. Sci. 38 (2009) 451–456.
- D.M. Anderson, P.M. Glibert, J.M. Burkholder, Harmful algal blooms and eutrophication: Nutrient sources, composition, and consequences, Estuaries 25 (2002). [CrossRef]
- C.P. Mainstone, W. Parr, Phosphorus in rivers - Ecology and management, Sci. Total Environ. 282–283 (2002) 25–47. [CrossRef]
- H.L. Golterman, N.T. De Oude, Eutrophication of Lakes, Rivers and Coastal Seas, Handb. Environ. Chem. 5 (1991). [CrossRef]
- R. Bhateria, D. Jain, Water quality assessment of lake water: a review, Sustain. Water Resour. Manag. 2 (2016) 161–173. [CrossRef]
- D. Liu, X. Li, Y. Zhang, Z. Lu, L. Bai, Q. Qiao, J. Liu, Spatial–temporal distribution of phosphorus fractions and their relationship in water–sediment phases in the tuojiang river, china, Water (Switzerland) 14 (2022). [CrossRef]
- B.Y.A. Spivakov, T.A. Maryutina, H. Muntau, Phosphorus speciation in water and sediments (Technical Report), Pure Appl. Chem. 71 (1999) 2161–2176. [CrossRef]
- P. Resmi, M.N. Manju, T.R. Gireeshkumar, C.S. Ratheesh kumar, M. Movitha, K. Shameem, N. Chandramohanakumar, Phosphorous fractionation in mangrove sediments of Kerala, south west coast of India: the relative importance of inorganic and organic phosphorous fractions, Environ. Monit. Assess. 188 (2016). [CrossRef]
- H.S. Jensen, P.B. Mortensen, F. 0. Andersen, E. Rasmussen, A. Jensen, Phosphorus cycling in a coastal marine sediment, Aarhus Bay, Denmark, Limnol. Oceanogr. 40 (1995). [CrossRef]
- R.P. Kumar, A. Amin, C. Adnan Amin, The physico-chemical characteristics of vembanad backwaters at Eramalloor region, Alappuzha district, Kerala, India, ~ 258 ~ Int. J. Fish. Aquat. Stud. 5 (2017) 258–262. www.fisheriesjournal.com.
- K.R. Renjith, N. Chandramohanakumar, M.M. Joseph, Fractionation and bioavailability of phosphorus in a tropical estuary, Southwest India, Environ. Monit. Assess. 174 (2011) 299–312. [CrossRef]
- K.R. Renjith, J.M. Mary, C.S.R. Kumar, M.N. Manju, N. Chandramohanakumar, Nutrient Distribution and Bioavailability in a Tropical Microtidal Estuary, Southwest India, J. Coast. Res. 32 (2016) 1445–1455. [CrossRef]
- Gayathri, J. Meenakshi, P. Resmi, A.S. Ragi, V.B. Rakesh, P.M. Salas, R.K. Ratheesh, Geochemical distribution and dynamics of sedimentary phosphorous fractions in Vembanad wetland ecosystem, Reg. Stud. Mar. Sci. 44 (2021) 101717. [CrossRef]
- K.P. Kannan, Ecological and socio-economic consequences of water-control projects in the Kuttanad region of Kerala, Proc. Indian Acad. Sci. Sect. C Eng. Sci. 2 (1979). [CrossRef]
- A.N. Balchand, Kuttanad: A case study on environmental consequences of water resources mismanagement, Water Int. 8 (1983). [CrossRef]
- Bijoy Nandan, Final Project Report HYDROCHEMISTRY OF VEMBANAD BACKWATER WITH SPECIAL REFERENCE TO POLLUTION PROBLEMS AND ITS MANAGEMENT MEASURES Submitted to KERALA STATE POLLUTION CONTROL BOARD GOVERNMENT OF KERALA Title of the project : Hydrochemistry of Vembanad backwater with special reference to pollution problems and its management measures, 2019.
- K. Srinivas, C. Revichandran, P.A. Maheswaran, T.T.M. Asharaf, N. Murukesh, Propagation of tides in the Cochin estuarine system, southwest coast of India, Indian J. Mar. Sci. 32 (2003) 14–24.
- T. K.T, Economic and Social Issues of Biodiversity Loss In Cochin Backwaters, Rep. Submitt. to Kerala Res. Program. Local Lev. Dev. Cent. Dev. Stud. Trivandrum (2002). http://www.cds.ac.in/krpcds/report/thomson.pdf.
- A.A. Jayaprakash, Long term trends in rainfall, sea level and solar periodicity: A case study for forecast of Malabar sole and oil sardine fishery, 2002. http://eprints.cmfri.org.in/1992/ (accessed October 28, 2023).
- P. Worsfold, I. McKelvie, P. Monbet, Determination of phosphorus in natural waters: A historical review, Anal. Chim. Acta 918 (2016) 8–20. [CrossRef]
- J. Murphy, J.P. Riley, A modified single solution method for the determination of phosphate in natural waters., Anal. Chim. Acta 27 (1962) 31–36.
- APHA, Standard Methods for Examination of Water and Wastewater, twentieth ed, Stand. Methods (1998).
- D.K.. Divya.K.R, Assessment of Water Quality of River Kalpathypuzha, Palakkad District, Kerala., IOSR J. Environ. Sci. Toxicol. Food Technol. 4 (2013) 59–62. [CrossRef]
- US EPA, Ambient aquatic life water quality criteria for dissolved oxygen (saltwater): Cape Cod to Cape Hatteras, EPA822-R-00-012. Off. Water, Off. Sci. Technol. Washington, DC, Off. Res. Dev. Natl. Heal. Environ. Eff. Res. Lab. Atl. Ecol. Div. Narragansett, Rhode Isl. (2000). https://www.epa.gov/sites/default/files/2018-10/documents/ambient-al-wqc-dissolved-oxygen-cape-code.pdf (accessed December 4, 2023).
- S.E. David, M. Chattopadhyay, S. Chattopadhyay, T.C. Jennerjahn, Impact of human interventions on nutrient biogeochemistry in the Pamba River, Kerala, India, Sci. Total Environ. 541 (2016) 1420–1430. [CrossRef]
- J. Thomas, S. Joseph, K.P. Thrivikramji, T.M. Manjusree, K.S. Arunkumar, Seasonal variation in major ion chemistry of a tropical mountain river, the southern Western Ghats, Kerala, India, Environ. Earth Sci. 71 (2014). [CrossRef]
- K. Loucif, S. Neffar, T. Menasria, M.C. Maazi, M. Houhamdi, H. Chenchouni, Physico-chemical and bacteriological quality assessment of surface water at Lake Tonga in Algeria, Environ. Nanotechnology, Monit. Manag. 13 (2020). [CrossRef]
- M. Lagnika, M. Ibikounle, J.C. Montcho, V.D. Wotto, N.G. Sakiti, Caractéristiques physico-chimiques de l’eau des puits dans la commune de Pobè (Bénin, Afrique de l’ouest), J. Appl. Biosci. 79 (2014). [CrossRef]
- H.S. Garn, Effects of Lawn Fertilizer on Nutrient Concentration in Runoff from Lakeshore Lawns , Lauderdale Lakes , Wisconsin, USGS Water-Resources Investig. Rep. (2002).
- M. Beyhan, M. Kaçıkoç, Evaluation of water quality from the perspective of eutrophication in Lake Eǧirdir, Turkey, Water. Air. Soil Pollut. 225 (2014). [CrossRef]
- Alam, A.B.M. Badruzzaman, M.A. Ali, Spatiotemporal Assessment of Water Quality of the Sitalakhya River , Bangladesh, Internatinal J. Eng. Technol. 2 (2012) 953–962.
- DWAF, South African Water Quality Guidelines. Volume 7: Aquatic ecosystems, 1996.
- V. Pattusamy, N. Nandini, K. Bheemappa, Detergent and Sewage Phosphates entering into Lake Ecosystem and Its Impact on Aquatic Environment, Int. J. Adv. Res. 1 (2013).
- D. Padmalal, S.I. Remya, S.J. Jyothi, B. Baijulal, K.N. Babu, R.S. Baiju, Water quality and dissolved inorganic fluxes of N, P, SO 4, and K of a small catchment river in the Southwestern Coast of India, Environ. Monit. Assess. 184 (2012) 1541–1557. [CrossRef]
- V. Nair, K. Singh, M. Arumugam, D. Clarson, Monitoring of trace metal pollution in meenachil river at Kottayam, Kerala (India), E-Journal Chem. 8 (2011) 257–263. [CrossRef]
- P. George, S. Joseph, S. Chidambaram, Prominence of seasonal water quality assessment in a tropical river using multivariate analysis: Kerala, India, Appl. Water Sci. 7 (2017). [CrossRef]
- G. Chellaiah, D.B. Eazon, Hydrologic flow regimes in humid tropics river basin, Water Sci. Technol. 84 (2021) 3143–3154. [CrossRef]
- R. Shinohara, K. Tsuchiya, A. Kohzu, The composition of organic phosphorus in a river during the springtime irrigation period, J. Hydrol. Reg. Stud. 44 (2022). [CrossRef]
- K.E. Annaheim, A.L. Doolette, R.J. Smernik, J. Mayer, A. Oberson, E. Frossard, E.K. Bünemann, Long-term addition of organic fertilizers has little effect on soil organic phosphorus as characterized by 31P NMR spectroscopy and enzyme additions, Geoderma 257–258 (2015). [CrossRef]
- B.L. Turner, A.B. Leytem, Phosphorus compounds in sequential extracts of animal manures: Chemical speciation and a novel fractionation procedure, Environ. Sci. Technol. 38 (2004). [CrossRef]
- K.K. Satpathy, A.K. Mohanty, G. Sahu, S. Sarguru, S.K. Sarkar, U. Natesan, Spatio-temporal variation in physicochemical properties of coastal waters off Kalpakkam, southeast coast of India, during summer, pre-monsoon and post-monsoon period, Environ. Monit. Assess. 180 (2011) 41–62. [CrossRef]
- J.M. Dorioz, E.A. Cassell, A. Orand, K.G. Eisenman, Phosphorus storage, transport and export dynamics in the Foron River watershed, Hydrol. Process. 12 (1998). [CrossRef]
- E. MUTLU, B. KUTLU, T. DEMİR, T. YANIK, Assessment of metal concentrations and physicochemical parameters in the waters of Lake Tecer, Kastamonu Üniversitesi Orman Fakültesi Derg. 18 (2018). [CrossRef]
- V. Gopal, A. Shanmugasundaram, B. Nithya, N.S. Magesh, M. Jayaprakash, Water quality of the Uppanar estuary, Southern India: Implications on the level of dissolved nutrients and trace elements, Mar. Pollut. Bull. 130 (2018). [CrossRef]
- A.M. Villamagna, B.R. Murphy, Ecological and socio-economic impacts of invasive water hyacinth (Eichhornia crassipes): A review, Freshw. Biol. 55 (2010). [CrossRef]
- B.Y.T.G. Sitharam, K. Sreevalsa, Thaneermukkom Salt Water Barrier To Prevent Salt Water Intrusion : an Overview of Kuttanad Low Land Development, Hydrolink (2018) 14–15.
- N. Arunpandi, R. Jyothibabu, P. Dhanya, L. Jagadeesan, C.P. Rashid, S. Sarath, Alarming waterweeds proliferation in the Vembanad Lake System might significantly increase water loss through transpiration, Environ. Monit. Assess. 194 (2022). [CrossRef]
- Ayanda, T. Ajayi, F.P. Asuwaju, Eichhornia crassipes (Mart.) Solms: Uses, Challenges, Threats, and Prospects, Sci. World J. 2020 (2020). [CrossRef]
- L. Bottezini, D.P. Dick, A. Wisniewski, H. Knicker, I.S.C. Carregosa, Phosphorus species and chemical composition of water hyacinth biochars produced at different pyrolysis temperature, Bioresour. Technol. Reports 14 (2021). [CrossRef]
- S. Sridevi, M. Prabu, N.G. Tamilselvi, Bioconversion of Water Hyacinth into Enriched Vermicompost and its Effect on Growth and Yield of Peanut, Int. J. Curr. Microbiol. Appl. Sci. 5 (2016). [CrossRef]
- S. Vidya, L. Girish, Water Hyacinth as a Green Manure for Organic Farming, Int. J. Res. Applied, Nat. Soc. Sci. 2 (2014) 65–72. www.impactjournals.us.
- C. Zang, S. Huang, M. Wu, S. Du, M. Scholz, F. Gao, C. Lin, Y. Guo, Y. Dong, Comparison of relationships between pH, dissolved oxygen and chlorophyll a for aquaculture and non-aquaculture waters, Water. Air. Soil Pollut. 219 (2011). [CrossRef]
- T.R. Gireeshkumar, P.M. Deepulal, N. Chandramohanakumar, Phosphorous speciation in surface sediments of the Cochin estuary, Environ. Monit. Assess. 185 (2013) 2535–2552. [CrossRef]
- X. Cheng, Y. Huang, R. Li, X. Pu, W. Huang, X. Yuan, Impacts of water temperature on phosphorus release of sediments under flowing overlying water, J. Contam. Hydrol. 235 (2020). [CrossRef]
Figure 1.
Map of the sampling location along the Vembanad lake and adjoining rivers.
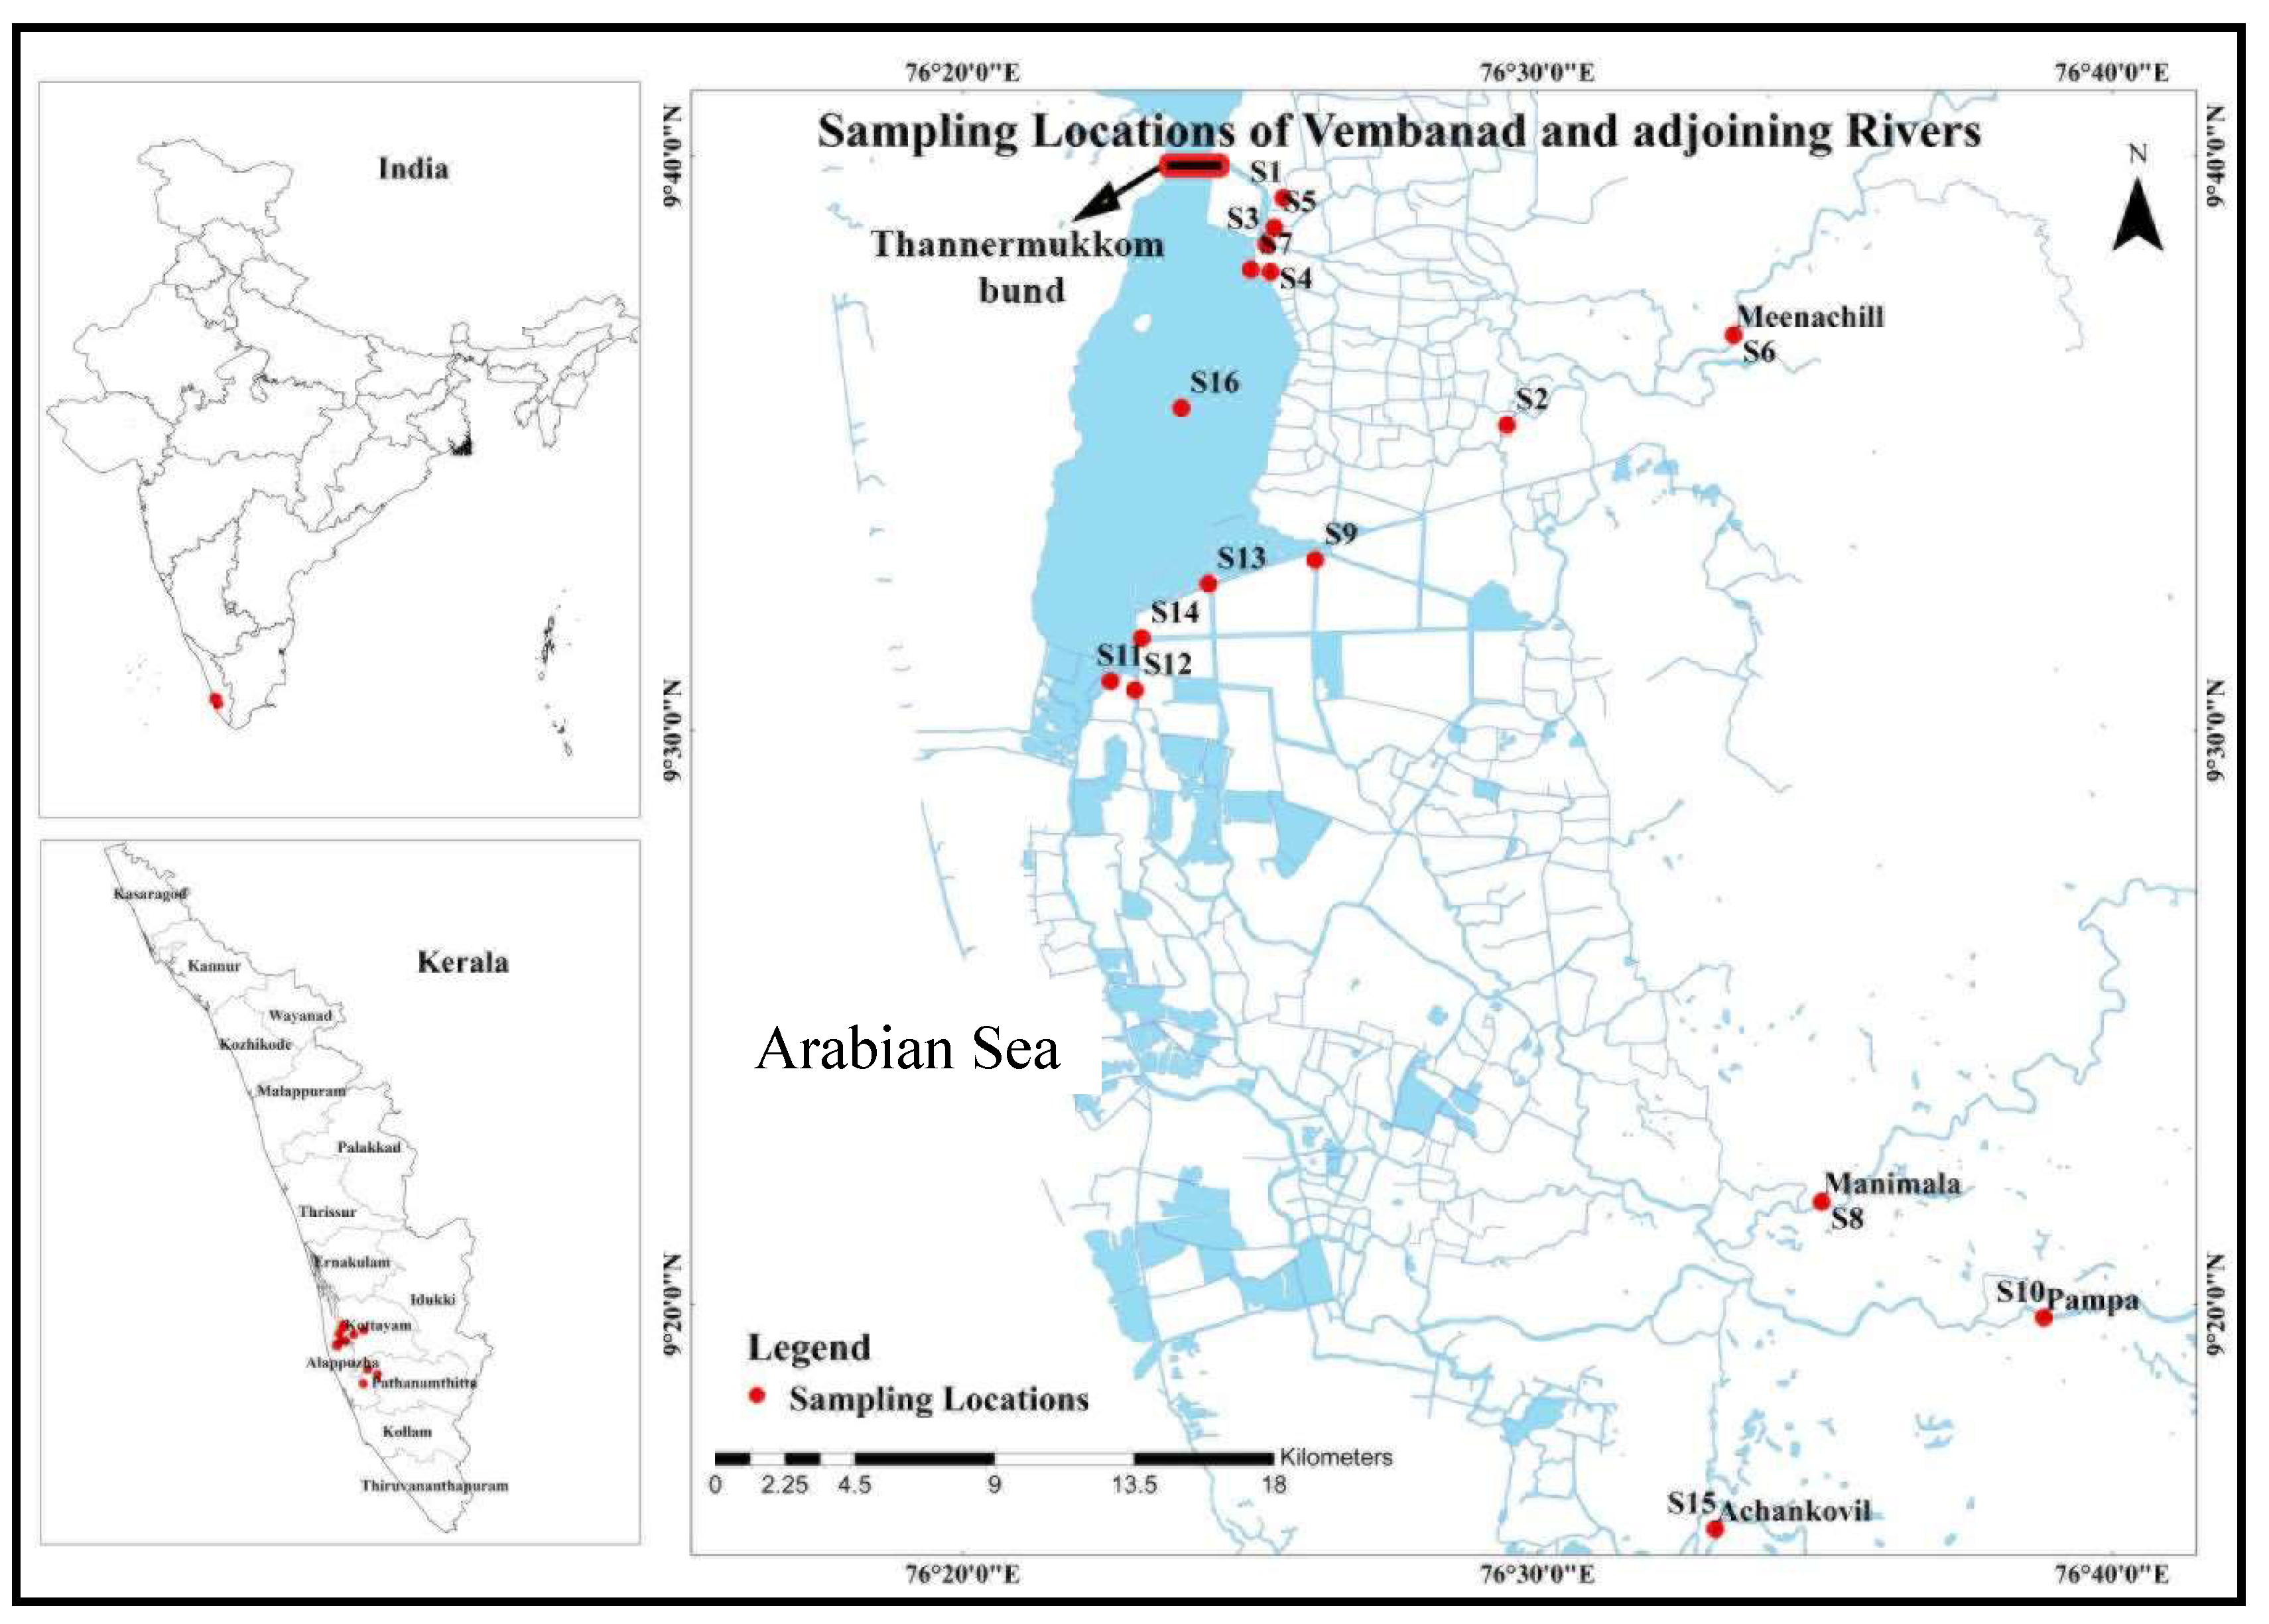
Figure 6.
Dendrogram from HCA of sampling sites.
Disclaimer/Publisher’s Note: The statements, opinions and data contained in all publications are solely those of the individual author(s) and contributor(s) and not of MDPI and/or the editor(s). MDPI and/or the editor(s) disclaim responsibility for any injury to people or property resulting from any ideas, methods, instructions or products referred to in the content. |
© 2024 by the authors. Licensee MDPI, Basel, Switzerland. This article is an open access article distributed under the terms and conditions of the Creative Commons Attribution (CC BY) license (http://creativecommons.org/licenses/by/4.0/).
Copyright: This open access article is published under a Creative Commons CC BY 4.0 license, which permit the free download, distribution, and reuse, provided that the author and preprint are cited in any reuse.


