1. Introduction
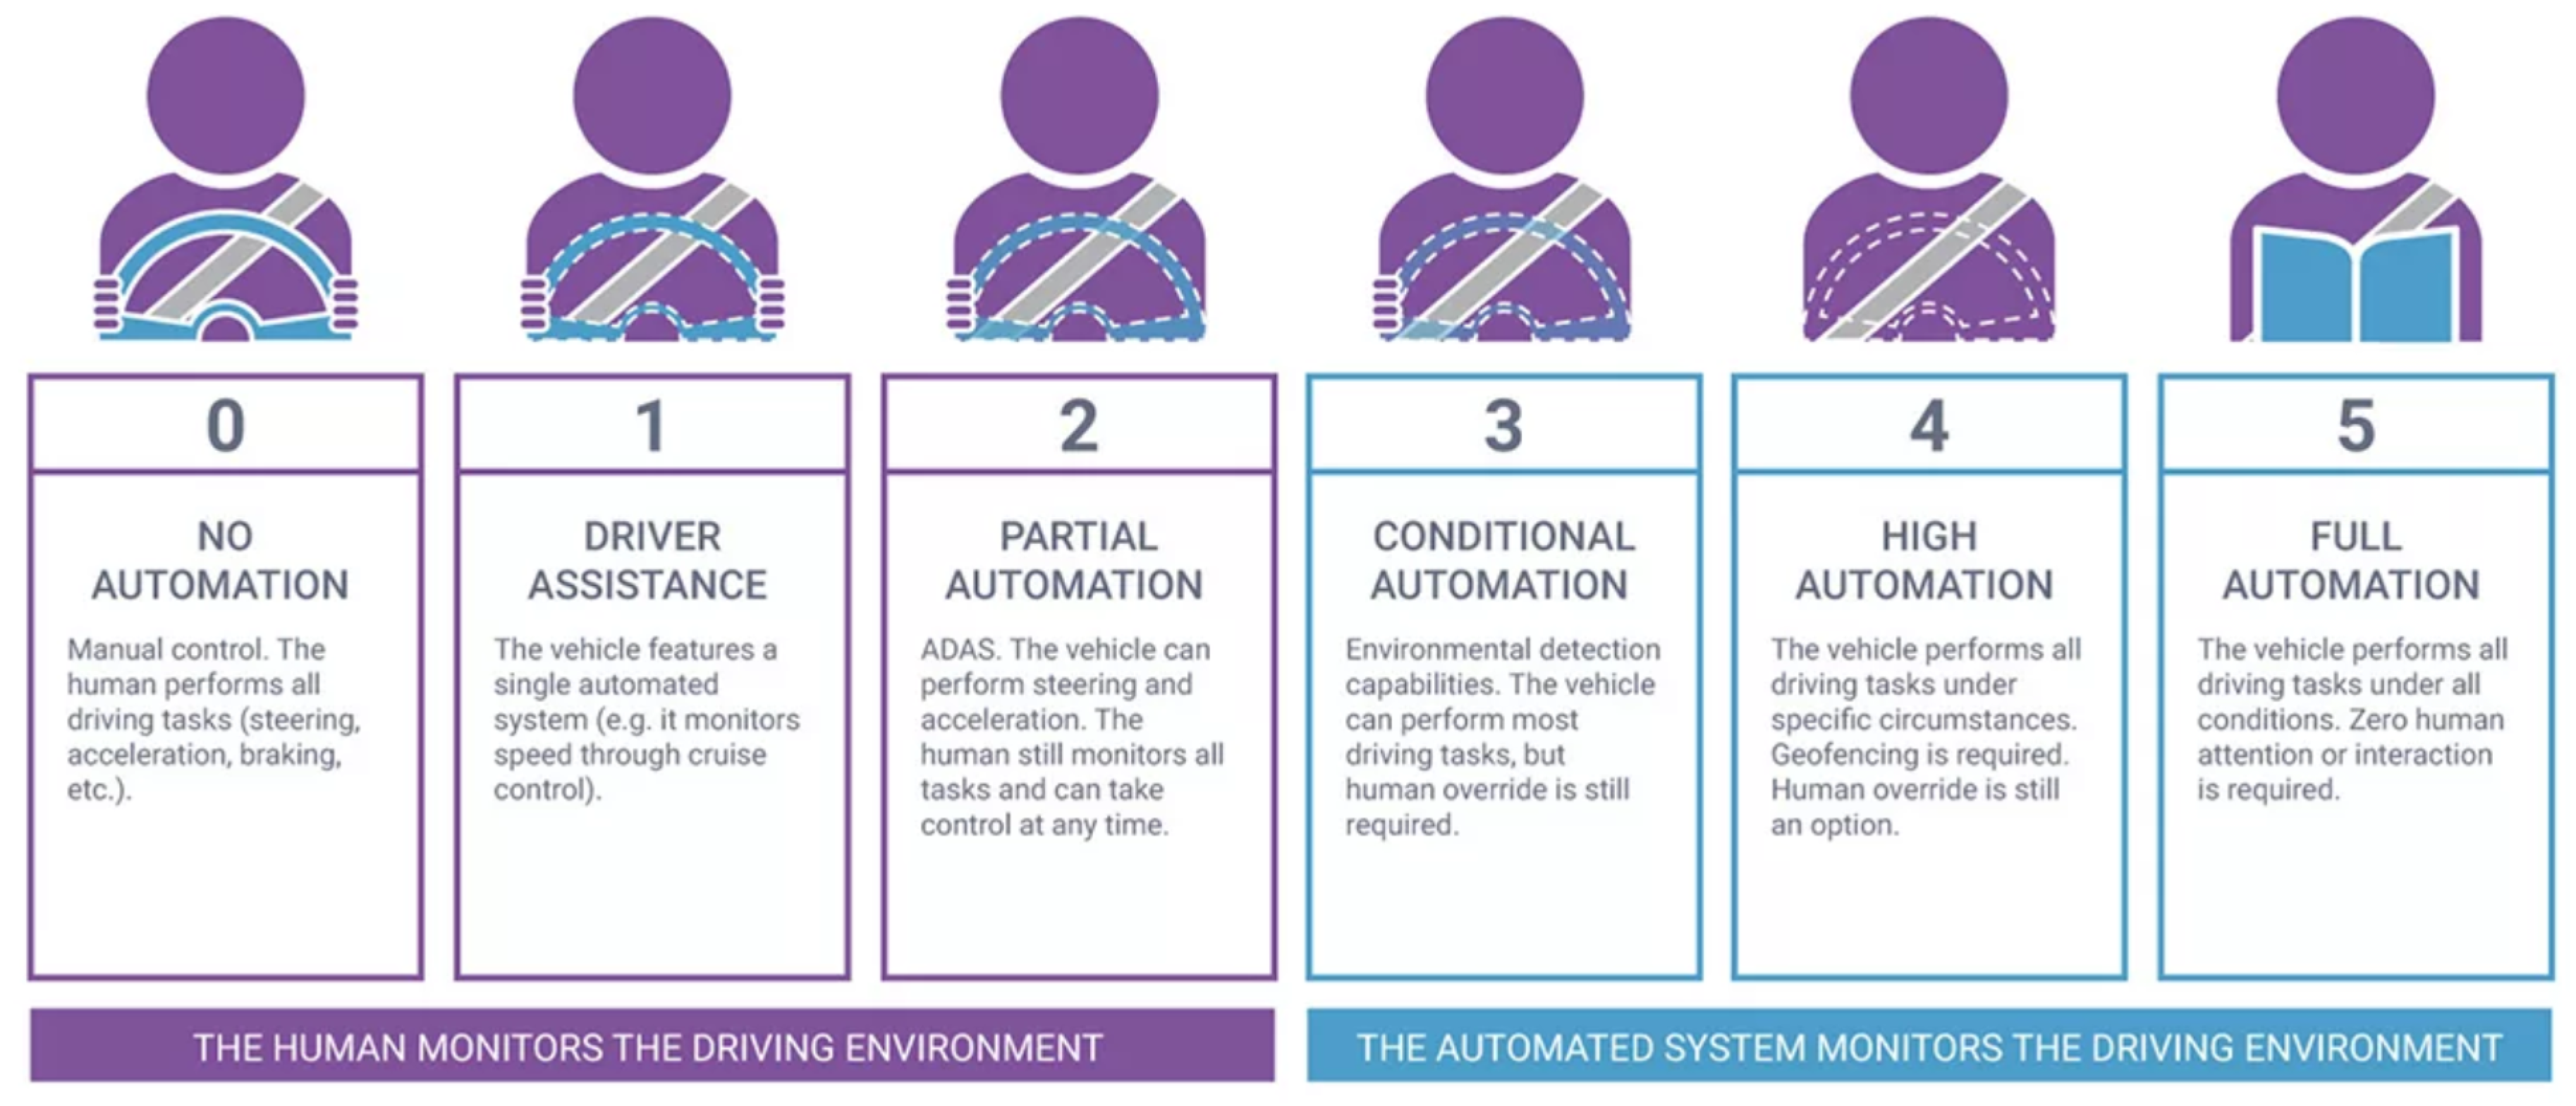
Autonomous Driving is a dream come true. Despite the restricted laws preventing fully automated vehicles, researchers and scientists do not spare any efforts in the field to prove its stability as a counter-push against these laws. The US department adopted 6 levels of driving automation [
1] as shown in Synopsys
Figure 1 ranging from 0 (fully manual) to 5 (fully autonomous). These levels can be categorized into 2 categories; a human driver
must monitors the surrounding environment, this is at levels (0-2), and an automated system monitors the environment, this is at levels (3-5).
Level 0-No Driving Automation is the level at which the driver fully controls the vehicle.
Level 1-Driver Assistance is the level in which the adaptive cruise control (ACC) [
2] system is already integrated vehicle keeping the ego-vehicle at a safe distance from the up-front vehicle, however, the human driver monitors other control actions like steering and braking.
Level 2-Partial Automation is the level at which the advanced driver assistance system (ADAS) [
3] is integrated, so the vehicle controls both steering and acceleration/deceleration. Still, the driver can take control of the vehicle at any time. Tesla [
4] and General Motors (GM) [
5] are the largest companies in the field that achieve supercruise systems as Level-2.
Level 3-Conditional Driving Automation is the level in which environmental detection capabilities are integrated, and the vehicle can take control actions but with human driver override who is necessary to take control actions in case of the system executes wrongly.
Level 4- High Automation is the level at which a failure system is integrated so that the vehicle can perform control actions and, in case of failure, a system can perform the right actions without human-driver interaction; however, the driver override is still an option. The vehicle can be operated in self-driving mode within low-speed and limited areas like urban areas in which the vehicle speed does not exceed 30 kmph; this is also geofencing. Volvo [
6], Waymo [
7], and Baidu [
8] are the most significant companies at this level.
Level 5-Full Driving Automation is the level at which human attention and interaction are not needed at all, the vehicle will take control actions in both urban and Highway areas. Our proposed system targets this level.
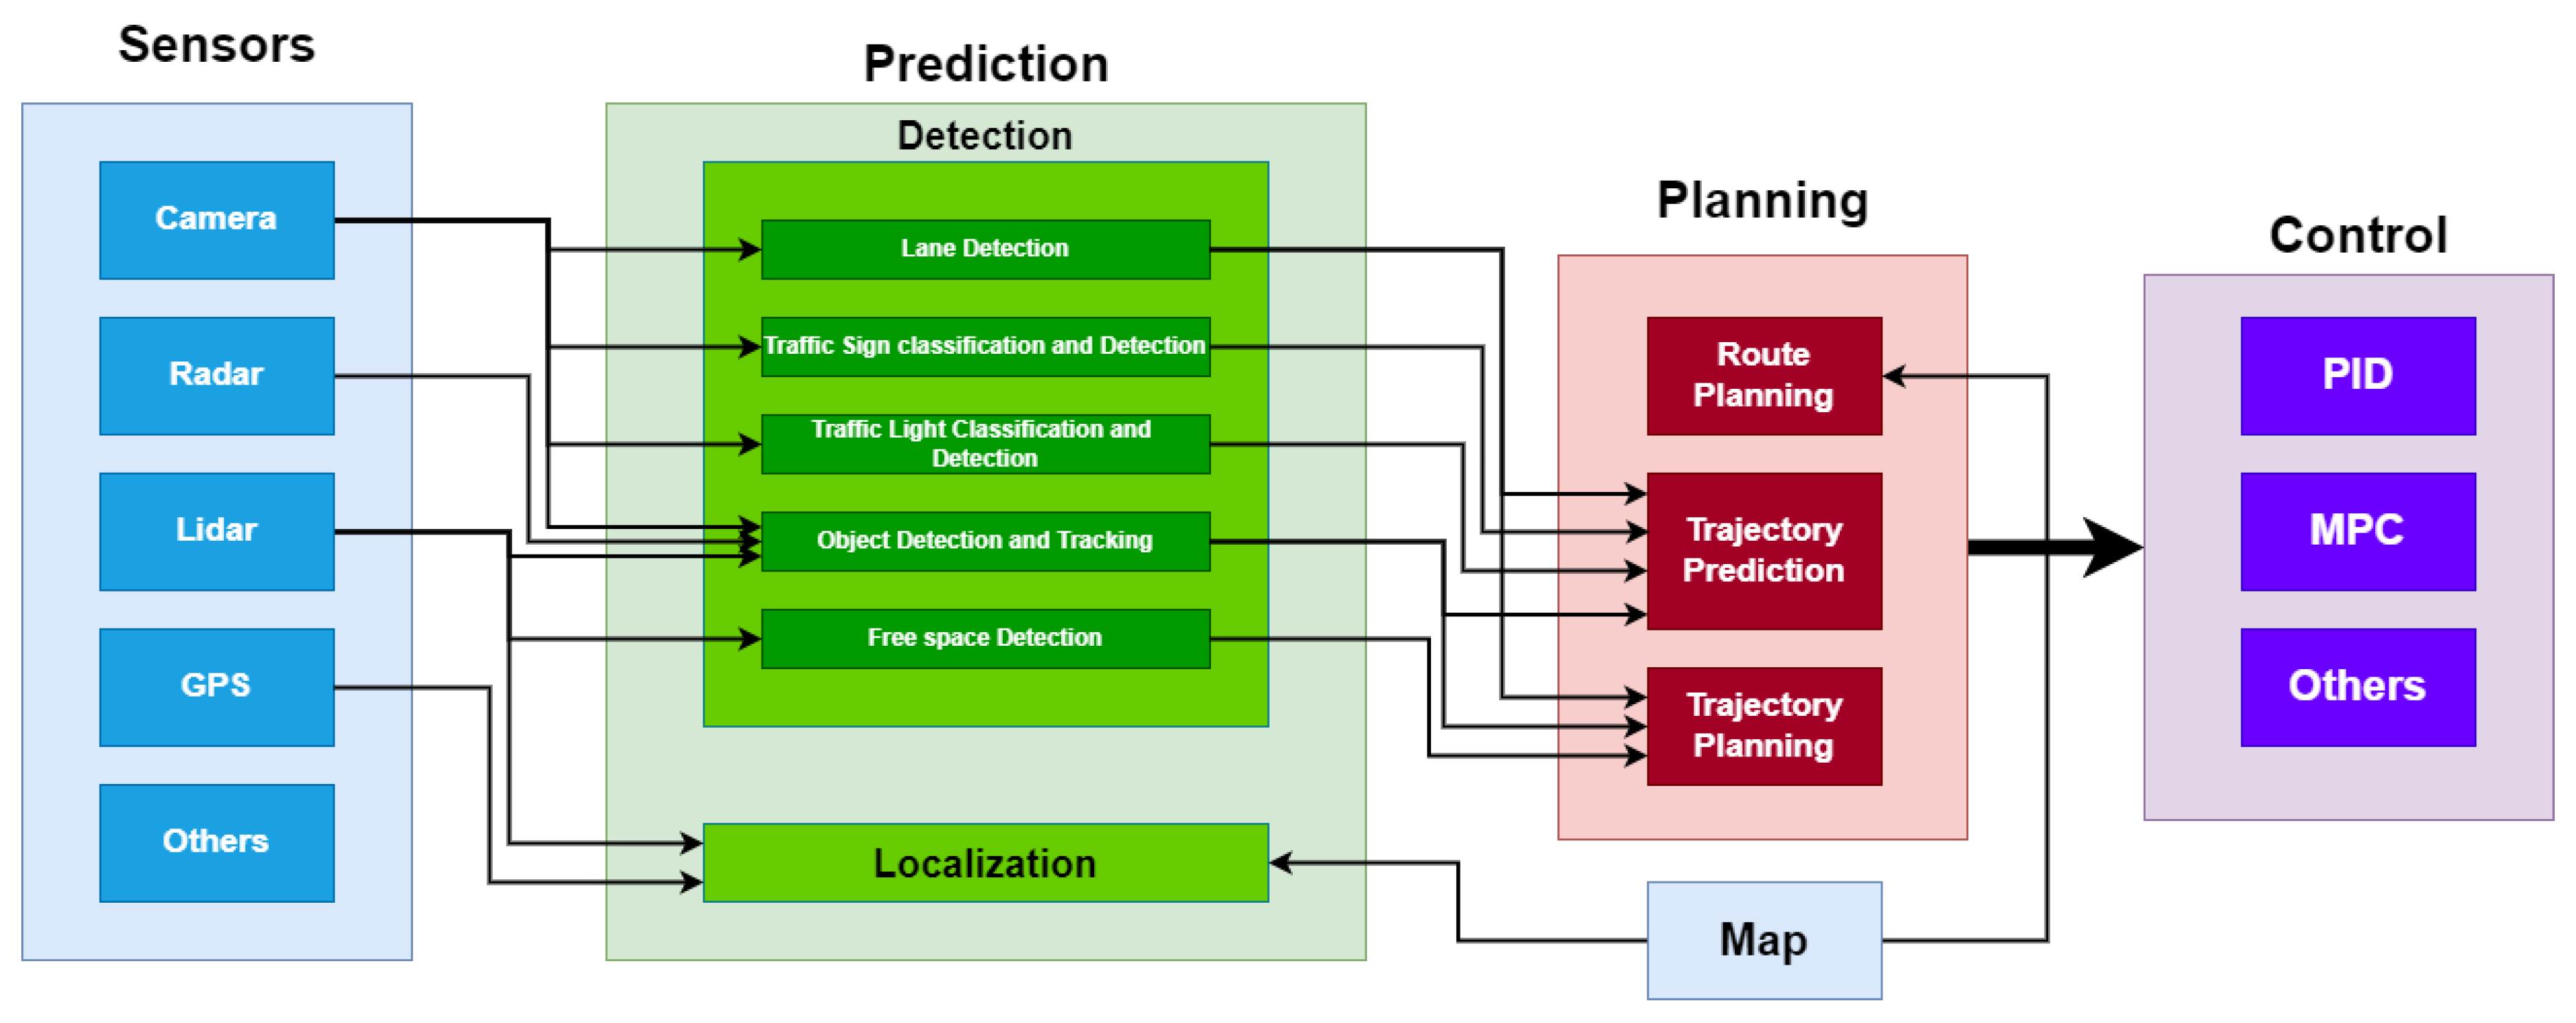
The self-driving car pipeline consists of 3 main phases as shown in
Figure 2: Perception, Planning, and Control.
Perception of the environment is the main building block of autonomous driving. Perception is implemented by collecting sensor readings from different sensors like lidars, radars, camera sensors, and more, then fusing these sensor readings to achieve robust information about the surroundings [
9]. Perception is decomposed into two sub-blocks: detection and localization. The detection part aims to classify and detect all the concerned objects around the vehicle by applying some sophisticated algorithms: lane detection, traffic light detection and classification, and object detection and tracking. The localization part aims to localize the ego vehicle in the world coordinates against the other objects with the help of high definition HD-map.
Path planning [
10] is one of the main blocks of the autonomous driving pipeline that is integrated into the system to identify all relevant control actions. Path planning is considered a multistage step that can be decomposed into the following sub-blocks:
Route Planning: it is also called (Global Planning), which aims to identify the possible routes to reach the desired position by the HD-map assistance,
Trajectory Prediction [
11,
12]: it benefits from the perception for the surrounded objects to identify all the possible trajectories. Trajectory prediction is made based on applying different motion models for the classified and detected objects in which there is a motion model for the cars, a different one for the pedestrians, etc.
Trajectory Planning [
13]: it computes and plans the trajectory based on the perception of the environment. After that, the ego vehicle plans its trajectory safely.
Control [
14,
15] is responsible for taking the relevant and safe actions based on the trajectory planning step. It controls the ego-vehicles’ manipulated variables: throttle, steer, and brake. The control step takes a list of waypoints (trajectories) and target velocities generated by the planning step passing through controller algorithms like PID or MPC, which calculate how much to steer, accelerate, or brake to meet the target trajectory.
In this paper, we introduce the (SDC-Net++) system as an extension to our previous research (SDC-Net) system. SDC-Net++ is an end-to-end system that aims to make vehicles navigate autonomously through the predicted action control: throttle, maneuver, and brake, in addition to a crash detection feature not only to detect crashes but also to help in navigation. SDC-Net++ takes the input of 4 cameras installed around the ego vehicle (camera cocoon) covering around the vehicle. Then, SDC-Net++, following the same way of SDC-Net, applies different input representations: front camera, panorama, and bird’s eye views which input to a multitask deep neural network that can predict the vehicle’s action control and detect crashes. The multitask network differs from the SDC-Net system in which the crash classification network in SDC-Net is replaced by a crash detection network in SDC-Net++; bounding boxes prediction instead of binary classification. SDC-Net++ is attached to IoT platforms that can communicate with other vehicles and share the crash information gathered. Likewise SDC-Net, we created our dataset using the CARLA simulator serving the main goal of having path planning, automatic emergency braking, and crash detection functionalities which are the main building blocks to set up a self-driving car.
The remainder of the paper is decomposed as follows:
Section 2 includes a literature review on self-driving cars including our previous paper (SDC-Net).
Section 3 describes the main contributions showing the SDC-Net++ system and the network architecture. Dataset adaptations and analysis are described in
Section 4. Results and the conducted experiments are shown in
Section 5 comparing crash detection only and multitask results.
Section 6 elaborates meaningful comments on the conducted experiments, and then discusses comparing SDC-Net++ with our previous network SDC-Net. A Summarized conclusion is shown in
Section 7.
2. Literature Review
No vehicle can drive itself, but these come the closest. There is no fully autonomous vehicle for sale today, but some automakers are advancing the field. Over the past few years, a few cars have gone on sale with driver assistance features that take much of the burden off the driver. These systems alleviate driver fatigue by assisting with steering and acceleration. This technology is beneficial for drivers with long commutes. And it can come in handy during road trips requiring lots of driving. Much research has been conducted to achieve self-driving vehicles as soon as possible. Sallab and Abdou et al. proposed a framework in [
16] to achieve autonomous driving, then proved the success of this framework in [
17] when applied their proposed algorithm on TORCS simulator [
18]. Autonomous driving using imitation learning is also tackled in [
14] which is inspired by Intel [
19].
Hoang Duy Loc et al. proposed a fast and accurate 3D multiobject detection framework in [
20] to balance speed and accuracy using bird’s eye view (BEV) representation. Experiments on the challenging KITTI dataset show that this work outperforms other methods by significant margins while running at 62 FPS on a single GTX-1080 GPU. Henan Hu et al. depended on pseudo-LiDAR to achieve monocular 3D object detection in [
21]. The pseudo-LiDAR point cloud is generated using two steps: 1) joint image segmentation and geometric constraints, used to predict the target depth and provide the depth prediction confidence measure. The predicted target depth is fused with the overall depth of the scene and results in the optimal target position, 2) they utilize the target scale, normalized with the gaussian function, as a priori information, so the uncertainty of depth distribution is reduced. With the refined depth information, they convert the optimized depth map into the point cloud representation (pseudo-LiDAR).
Jiayu Zou et al. analyzed the vital differences between camera model-based feature transformation (CBFT) and camera model-free feature transformation (CFFT) in [
22] to perform front BEV semantic segmentation tasks. The CBFT transforms features based on the flat-world assumption, which may distort regions lying above the ground plane. The CFFT is limited in the segmentation performance due to the absence of geometric priors and time-consuming computation. To combine the benefits and avoid the drawbacks of both, they proposed a hybrid feature transformation module (HFT) in which they decouple the feature maps produced by HFT for estimating the layout of outdoor scenes in BEV. A two-stage geometry prior-based transformation framework named GitNet [
23] is proposed to perform the BEV semantic segmentation task. It consists of the geometry-guided pre-alignment and a ray-based transformer. In the first stage, Shi Gong et al. decoupled the BEV segmentation into the perspective image segmentation and geometric prior-based mapping, with explicit supervision by projecting the BEV semantic labels onto the image plane to learn visibility-aware features and learnable geometry to translate into the BEV space. Second, the pre-aligned coarse BEV features are further deformed by ray-based transformers to take visibility knowledge into account.
BEVFormer [
24] learned unified BEV representations with spatio-temporal transformers to support multiple autonomous driving perception tasks: 3D detection and map segmentation based on multi-camera images. BEVFormer exploited both spatial and temporal information by interacting with spatial and temporal space through predefined grid-shaped BEV queries. Regarding Spatial information, Zhiqi Li et al. designed a spatial cross-attention in which each BEV query extracts the spatial features from the regions of interest across camera views. However, regarding the temporal information, they proposed a temporal self-attention to recurrently fuse the history of BEV information. BEVSegFormer [
25] is proposed to have an effective transformer-based method for BEV semantic segmentation from arbitrary camera rigs. This method encoded image features from arbitrary cameras with a shared backbone. These image features were then enhanced by a deformable transformer-based encoder. Moreover, Lang Peng et al. introduced a BEV transformer decoder module to parse BEV semantic segmentation results. An efficient multi-camera deformable attention unit was designed to carry out the BEV-to-image view transformation. The queries were reshaped according to the layout of grids in the BEV and upsampled to produce the semantic segmentation result in a supervised manner.
Oskar Natan and Jun Miura proposed a BEV end-to-end and multi-task learning manners in [
26] to perform both perception and control tasks simultaneously. The model aimed to drive the ego vehicle safely by following a sequence of routes defined by the global planner. The perception part of the model was used to encode high-dimensional observation data provided by an RGBD camera while performing semantic segmentation, semantic depth cloud mapping, and traffic light state and stop sign prediction. The control part then decoded the encoded features along with additional information provided using GPS and a speedometer to predict waypoints that come with a latent feature space. Enze Xie et al. proposed
[
27] which efficiently transformed multi-view 2D image features into the 3D BEV feature in ego-car coordinates. Likewise, this BEV representation is important as it enables different tasks to share a single encoder. This framework contains four important designs that benefit both accuracy and efficiency: (1) an efficient BEV encoder design that reduces the spatial dimension of a voxel feature map, (2) a dynamic box assignment strategy that uses learning-to-match to assign ground-truth 3D boxes with anchors, (3) a BEV centerness re-weighting that reinforces with larger weights for more distant predictions, and (4) large-scale 2D detection pre-training and auxiliary supervision.
CoBEVT [
28], which is a multi-agent multi-camera perception framework, generates cooperatively BEV map predictions. This framework is a transformer-based architecture with a fused axial attention module (FAX). Spatial interactions are captured locally and globally across views and agents achieving state-of-the-art performance when tested on OPV2V [
29] for BEV semantic segmentation. OPV2V is a large-scale V2V perception dataset that depends on the cooperation between OpenCDA [
30] and CARLA [
31], where OpenCDA is a simulator that aims to develop and test Cooperative Driving Automation (CDA) systems. V2VNet [
32] is a V2V communication system that covers a 70m radius of vehicle connectivity, so vehicles can receive and publish information within this area. A spatial graph neural network (GNN) is used to collect information from all of the connected self-driving cars. It is also tested on V2X-Sim. COOPERNAUT [
33] is an end-to-end model that cooperatively drives self-driving cars based on a cross-vehicle perception. It converts lidar information into a point-based representation that can be transmitted wirelessly between the connected vehicles. The authors also developed a CARLA-based framework AUTOCASTSIM with challenging accident-prone scenarios.
Wang et al. proposed DeepAccident [
34] which is the first large-scale V2X autonomous driving dataset that includes various collision accident scenarios. They also introduced an end-to-end motion and accident prediction task with some measurement metrics to assess the accuracy of accident prediction. DeepAccident contains sensor data and annotation labels from four vehicles and infrastructure for each scenario, allowing V2X research for perception and prediction. The proposed DeepAccident also serves as a direct safety benchmark for autonomous driving algorithms and as a supplementary data set for single-vehicle and V2X perception research in safety-critical scenarios.
SDC-Net [
35], which is an end-to-end multitask deep neural network, was designed to navigate safely by performing crash avoidance, path planning, and automatic emergency braking. Mohammed Abdou et al. proposed a full system that combines deep learning with IoT to achieve self-driving cars, they built their dataset using the CARLA simulator due to the lack of real benchmark datasets. There was an initial trial in merging IoT with deep learning in [
36], however, it tackled only crash avoidance functionality. SDC-Net provided a comparative study between different input representations: front camera only, panorama, and BEV to be applied on a single crash avoidance-only task, a single path planning and AEB-only task, or multitask. As expected, they concluded that the multitask BEV experiment outperforms other ones in precision, recall, f1-score, accuracy, throttle MSE, steer MSE, and brake MSE.
3. System Methodology
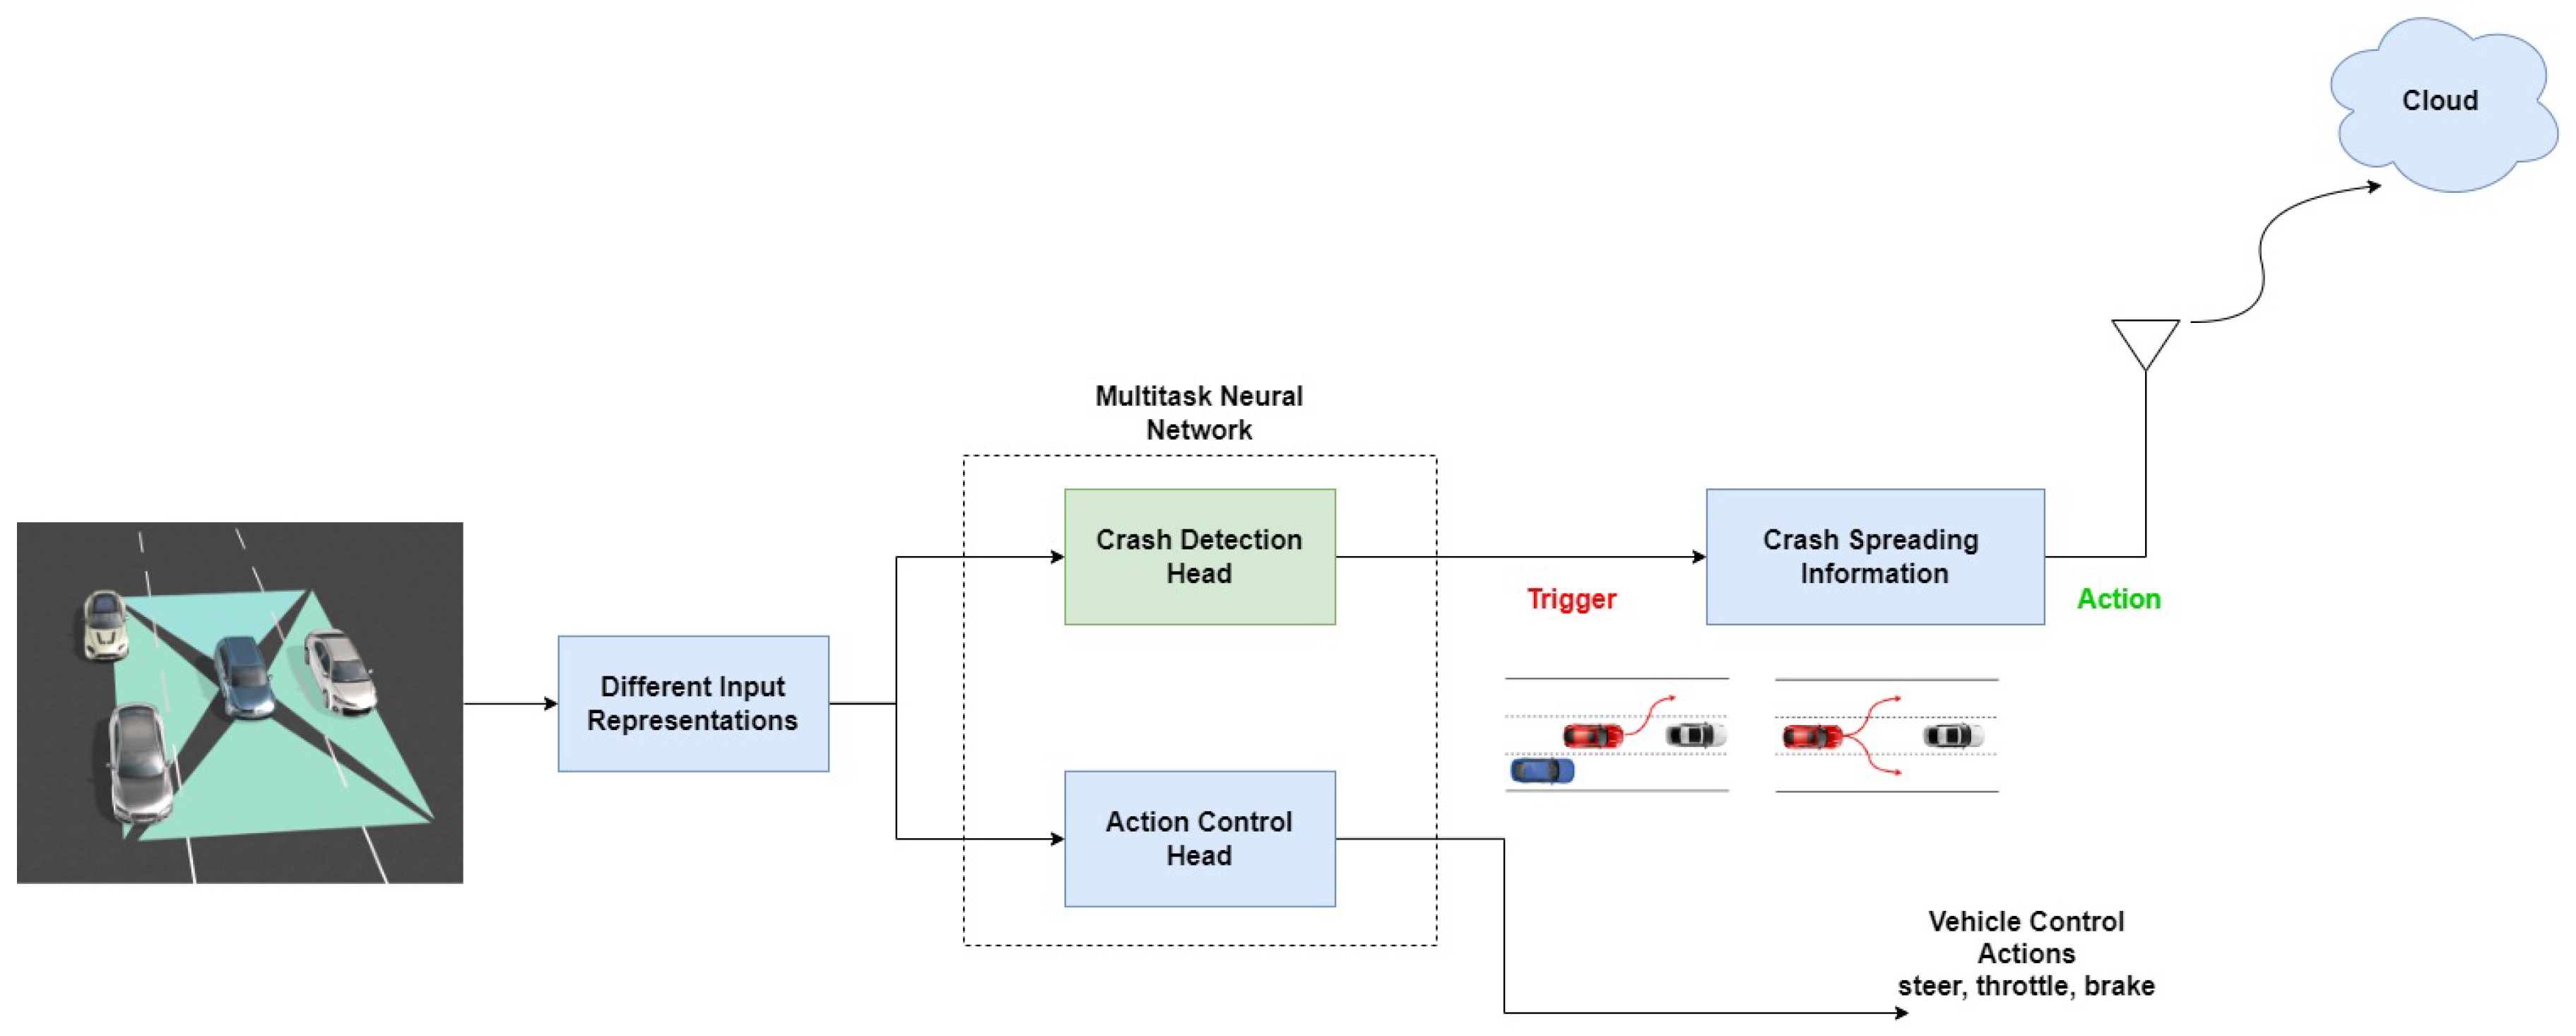
This section tackles system methodology identifying the main modifications done on the SDC-Net system, especially in the detection network.
Figure 3 shows SDC-Net++ system architecture in which the main modification is in the crash detection network, which is green. However, the other blocks are kept to formulate a comparative study between SDC-Net and our proposed system SDC-Net++.
3.1. Multitask Deep Neural Network
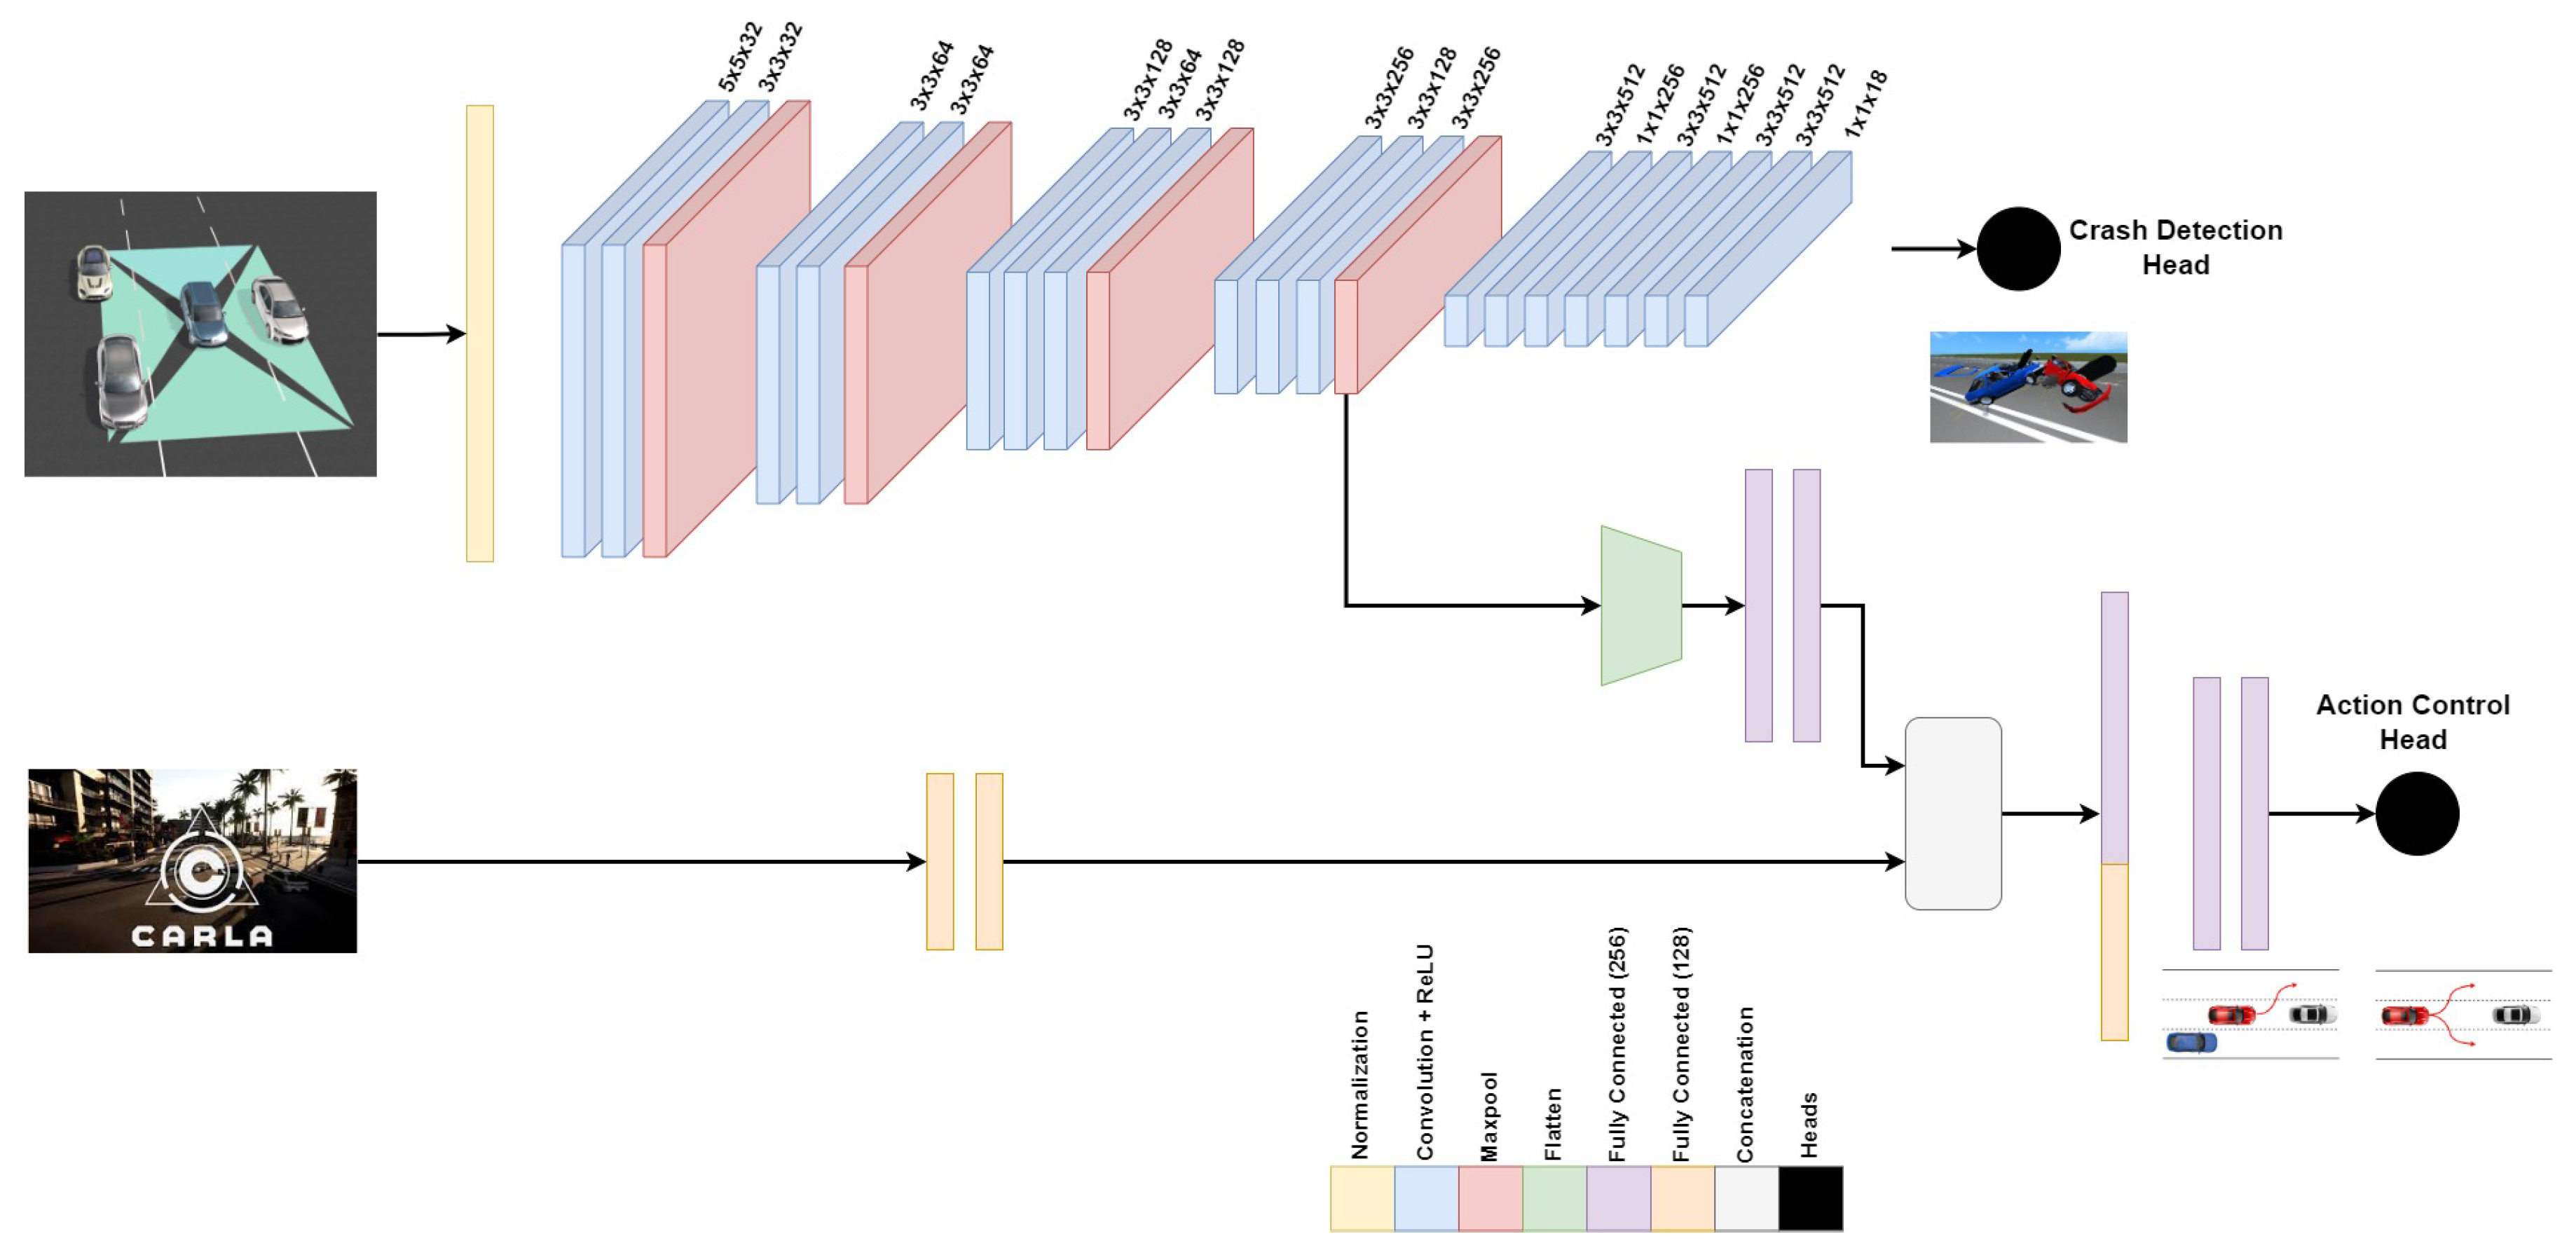
Multitask deep neural network, inspired by [
35] with some modifications, starts with an input normalization phase to ensure a zero mean and one standard deviation. The
feature extraction part for the multitask network is made up of 10 convolution layers, the first having kernel size
, while the remaining 7 layers have kernel sizes
. The first 4 convolution layers have 32 and 64 filters for every two consecutive layers. The next 3 convolution layers have 128, 64, and 128 filters, while the last 3 convolution layers have 256, 128, and 256 filters. Every convolution layer is followed by ReLU activation function introducing nonlinearities. The first and second 2 convolution layers are followed by a max-pooling layer with a
kernel size, while the third and fourth 3 convolution layers are followed by a max-pooling layer with a
kernel size. The
crash detection head is composed of 7 consecutive convolution layers in which the first 6 layers’ kernel sizes are alternating between
, and
, and the applied filters are also alternating between 512 and 256 filters as shown in
Figure 4. However, the last convolution layer is a 1-D convolution, kernel size
, with 18 filters reshaped to
in which 9 regression values correspond to 1 for confidence, 3 for center point (x, y, z), 3 for dimensions (L, W, D), and 2 for two classes (
or
). A Sigmoid activation function is finally applied to output the normalized continuous values for the crash/no crash bounding box and center with their confidence values. The
action control head starts with receiving speed input from the CARLA simulator passed through 2 fully connected layers with 128 neurons each. Then, the output from the feature extraction part is flattened and passed through 2 fully connected layers with 256 neurons each. A concatenation layer is applied to the outcome from the extracted features from CARLA speed information and the feature extraction, after that 2 fully connected layers with 256 neurons are applied to relate the extracted features together. The last 2 fully connected layers with 10 and 3 neurons respectively are applied with a Sigmoid activation function layer to output the normalized continuous values for throttling, braking, and steering between 0 and 1.
Table 1 shows each layer with the output shape, the number of parameters per layer, and the total number of parameters.
As SDC-Net++ design follows the multitask (two heads) networks, the total loss function for the network will be a combined loss between the two heads (loss from the action control part and loss for the detection part) as shown in equation
1.
The action control loss function is a typical mean square error function as shown in equation
2. In which,
m normalized samples whose iterator is
i,
is the output prediction from the regression model,
is the continuous ground truth labels (throttle, steer, brake) corresponding to the inputs,
is the mean square error. However, the detection loss function combines the 4 components shown in equation
3: confidence, bounding box center, bounding box dimensions, and classification components.
The 4 loss components functions are shown in equations
4,
5,
6, and
7. In which,
,
, and
are the weights for confidence prediction, coordinates, and probabilities of the classifications respectively,
is the
grid cells in which the images are decomposed whose iterator is
i,
B bounding boxes predicted in each grid cell whose iterator is
j,
is a binary variable that takes values
as per the ground truth box is in
and
location in which 1 in case of there is a box and 0 is otherwise,
is always the opposite of
,
and
are the predicted and ground truth of the confidence,
and
are the predicted and ground truth of the box center in the 3-D coordinates,
and
are the predicted and ground truth of the box dimensions (width, length, depth),
, and
are the predicted and ground truth probabilities of the classes.
3.2. Input Representations and IoT Integration
SDC-Net uses different input representations to formulate a comparative study and identify which of them is the best one. These input representations are front camera view, panorama with either normal or equirectangular stitching view, and Bird’s eye view. Front camera view means that the SDC-Net takes the front camera image only from the camera cocoon as an input image to the system; however, panorama views take the four camera images of the cocoon, then either stitch them together or tilt the edges of every image to isolate between them. Bird’s eye view depends on the intrinsic and extrinsic camera calibration parameters to warp the four cocoon images forming the BEV shape. SDC-Net++ keeps the same input representations to compare with the SDC-Net results.
SDC-Net uses a trigger-action digital automation platform like Zapier, IFTTT, or Integromat, so in case of an accident (trigger), the system provides connected vehicles with the accident information via IoT. SDC-Net is also integrated with Valeo’s standardized platform specific for automotive that uses digital gate and let’s do (LDO) platforms. SDC-Net++ also maintains the same IoT solution to share the relevant information about the accident, but with the location of the accident (which lane) as additional information. The additional information about the accident location comes out of the modification of changing the classification network to be a detection network so that the accident lane could be identified easily.
4. Dataset Setup
Likewise SDC-Net, due to the lack of datasets that serve our multitask system of controlling vehicle action and detecting crashes, we created our dataset using the CARLA simulator. SDC-Net++ uses exactly the same dataset proposed by SDC-Net to achieve a fair comparative study, so this section tackles the modification done on the dataset labels.
4.1. CARLA Adaptations
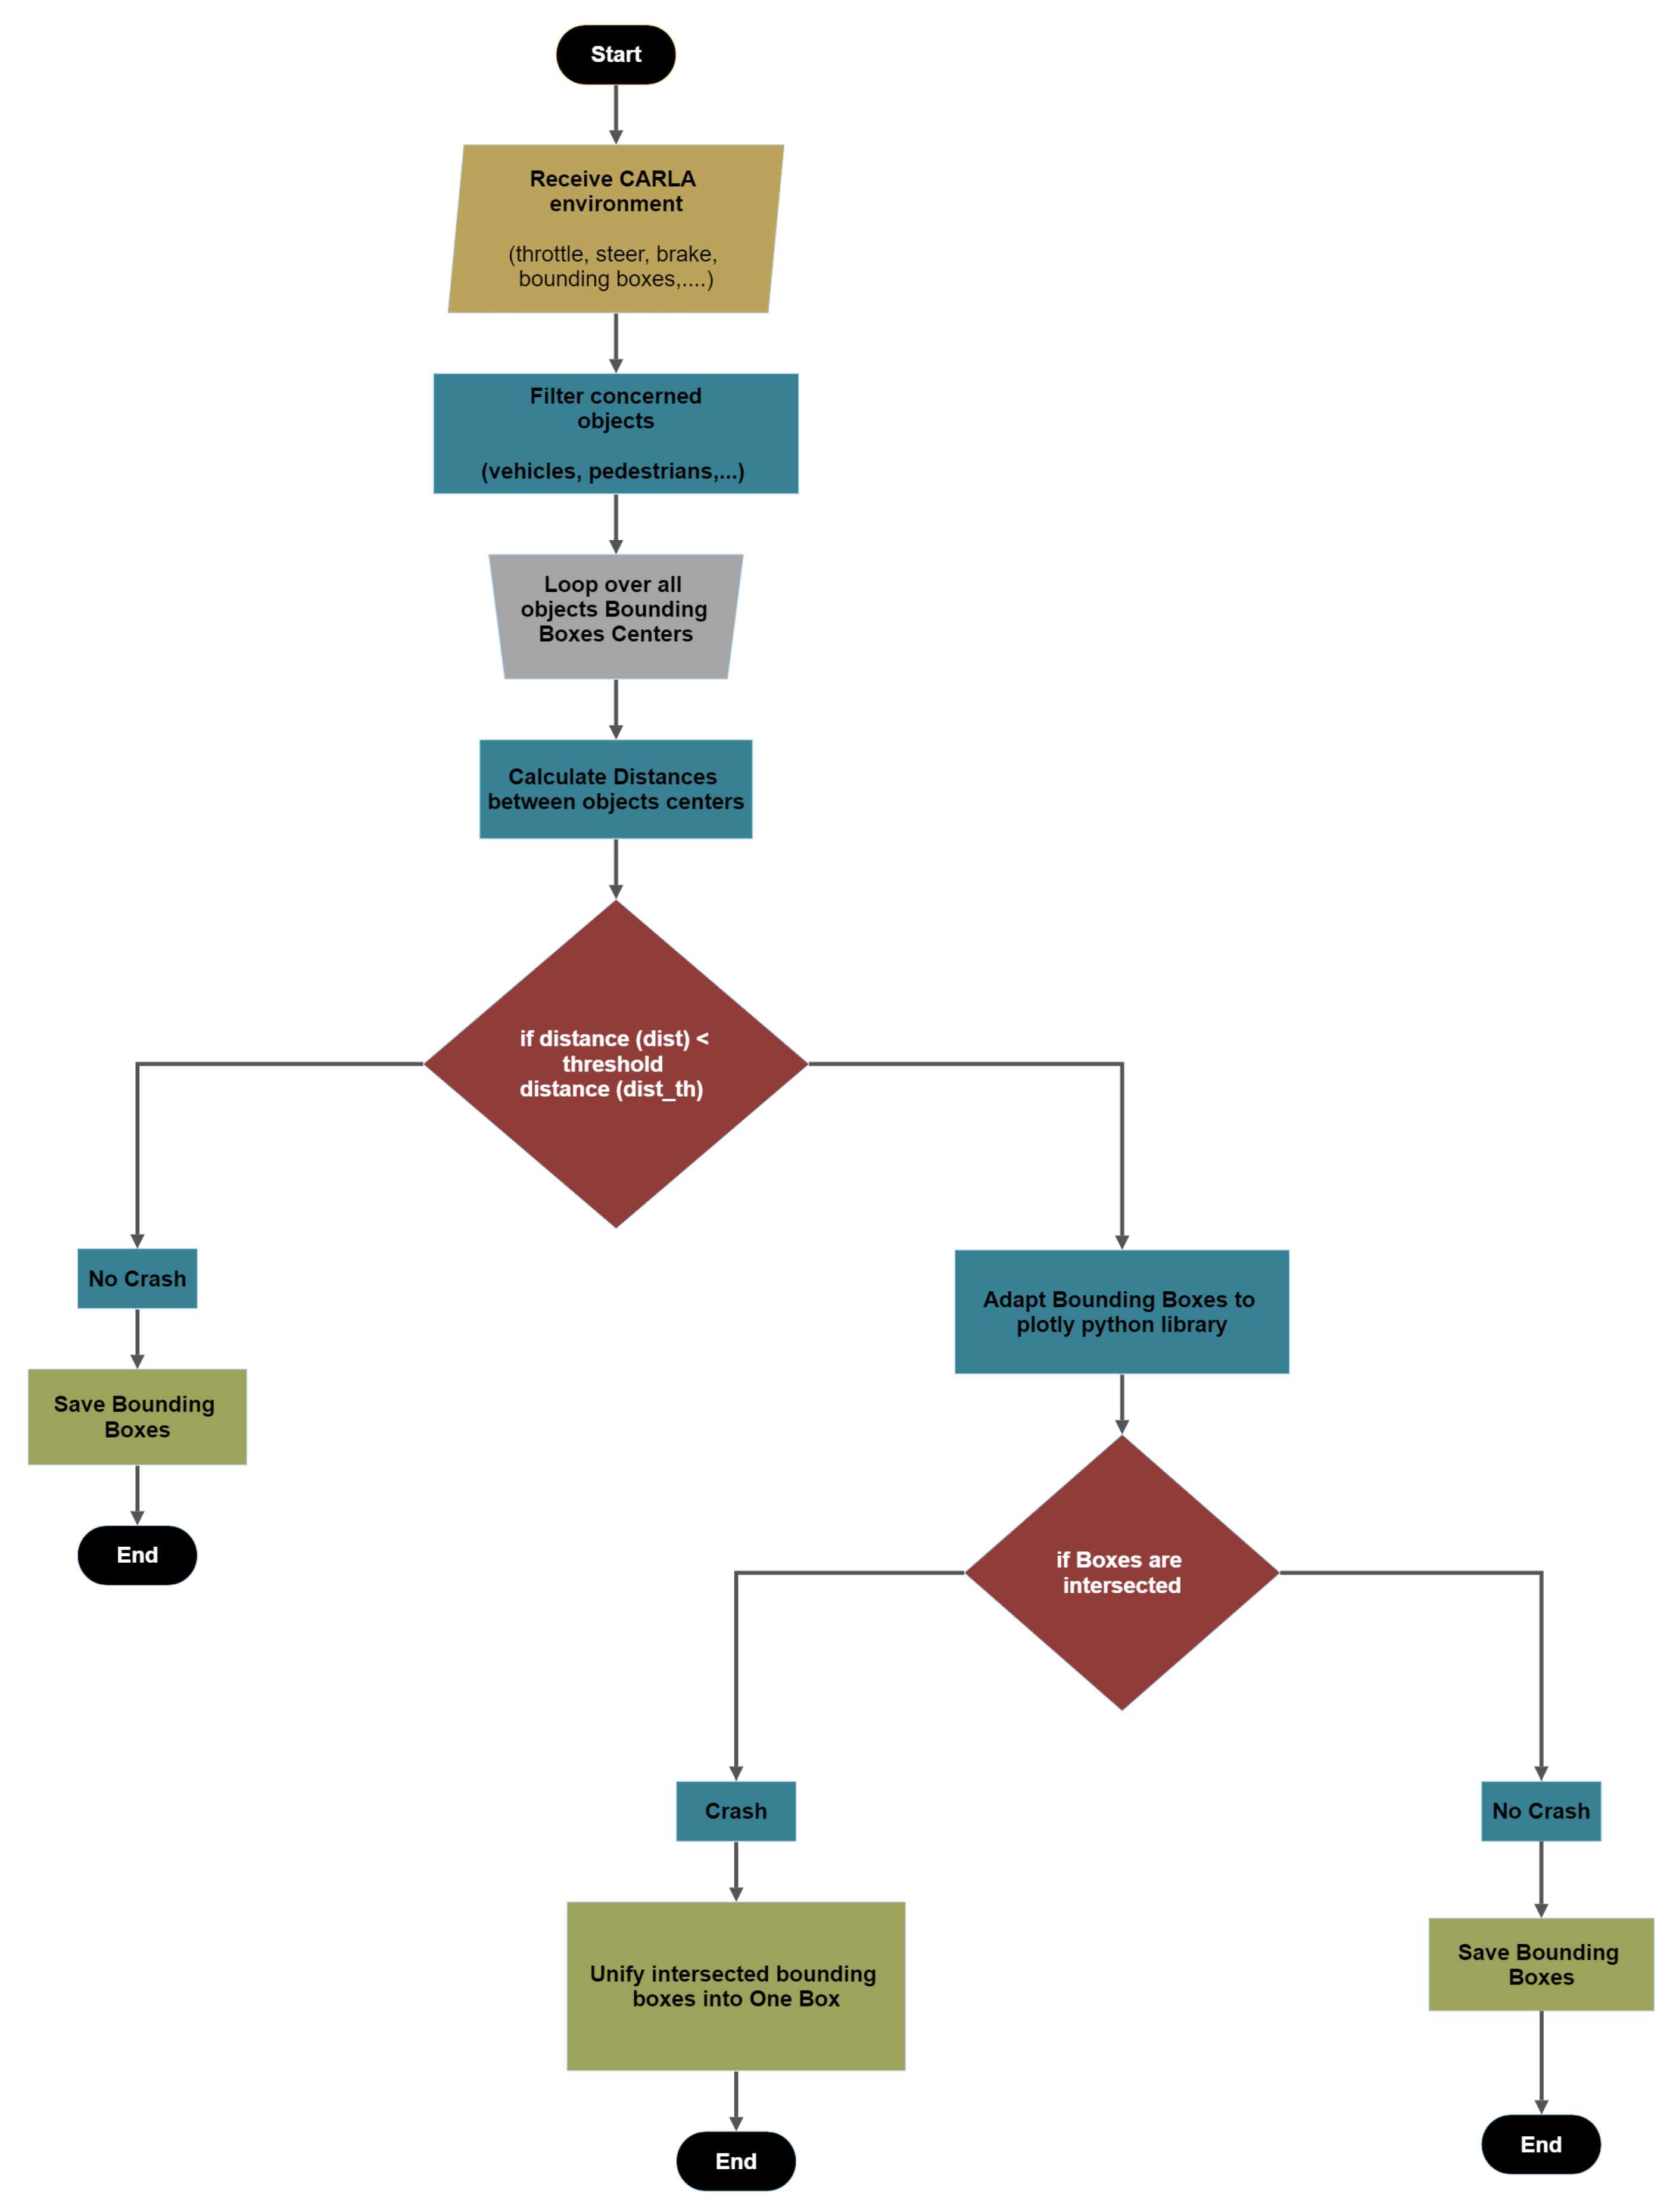
SDC-Net is implemented to have a classification network that can identify if the scene contains an accident or not, so the constructed dataset labels were a binary classification (0, 1) means no accident, and there is an accident respectively. However, the SDC-Net++ detection network needs the bounding boxes generated from the CARLA simulator and then applies some processing over them to save the crash label. The flow chart
Figure 5 shows the accident detection label and the steps are also described as follows:
Filter the objects by keeping only the concerned objects such as vehicles, pedestrians, etc.
Loop over all the bounding box centers received from the CARLA simulator;
Calculate the distances between bounding box centers;
Check if the distances are greater than the threshold tunable distance. If yes, no crash label is applied; however, if no, this means that we have two or more vehicle centers in close proximity to each other;
Adapt the bounding boxes information to the plotly [
37] python library to check if there are two intersecting boxes;
Check if the boxes are intersecting. If yes, unify the two intersected bounding boxes in one box throughout the Min-Max boxes’ boundaries as shown in
Figure 6. If no, save the bounding boxes.
4.2. Data Analysis
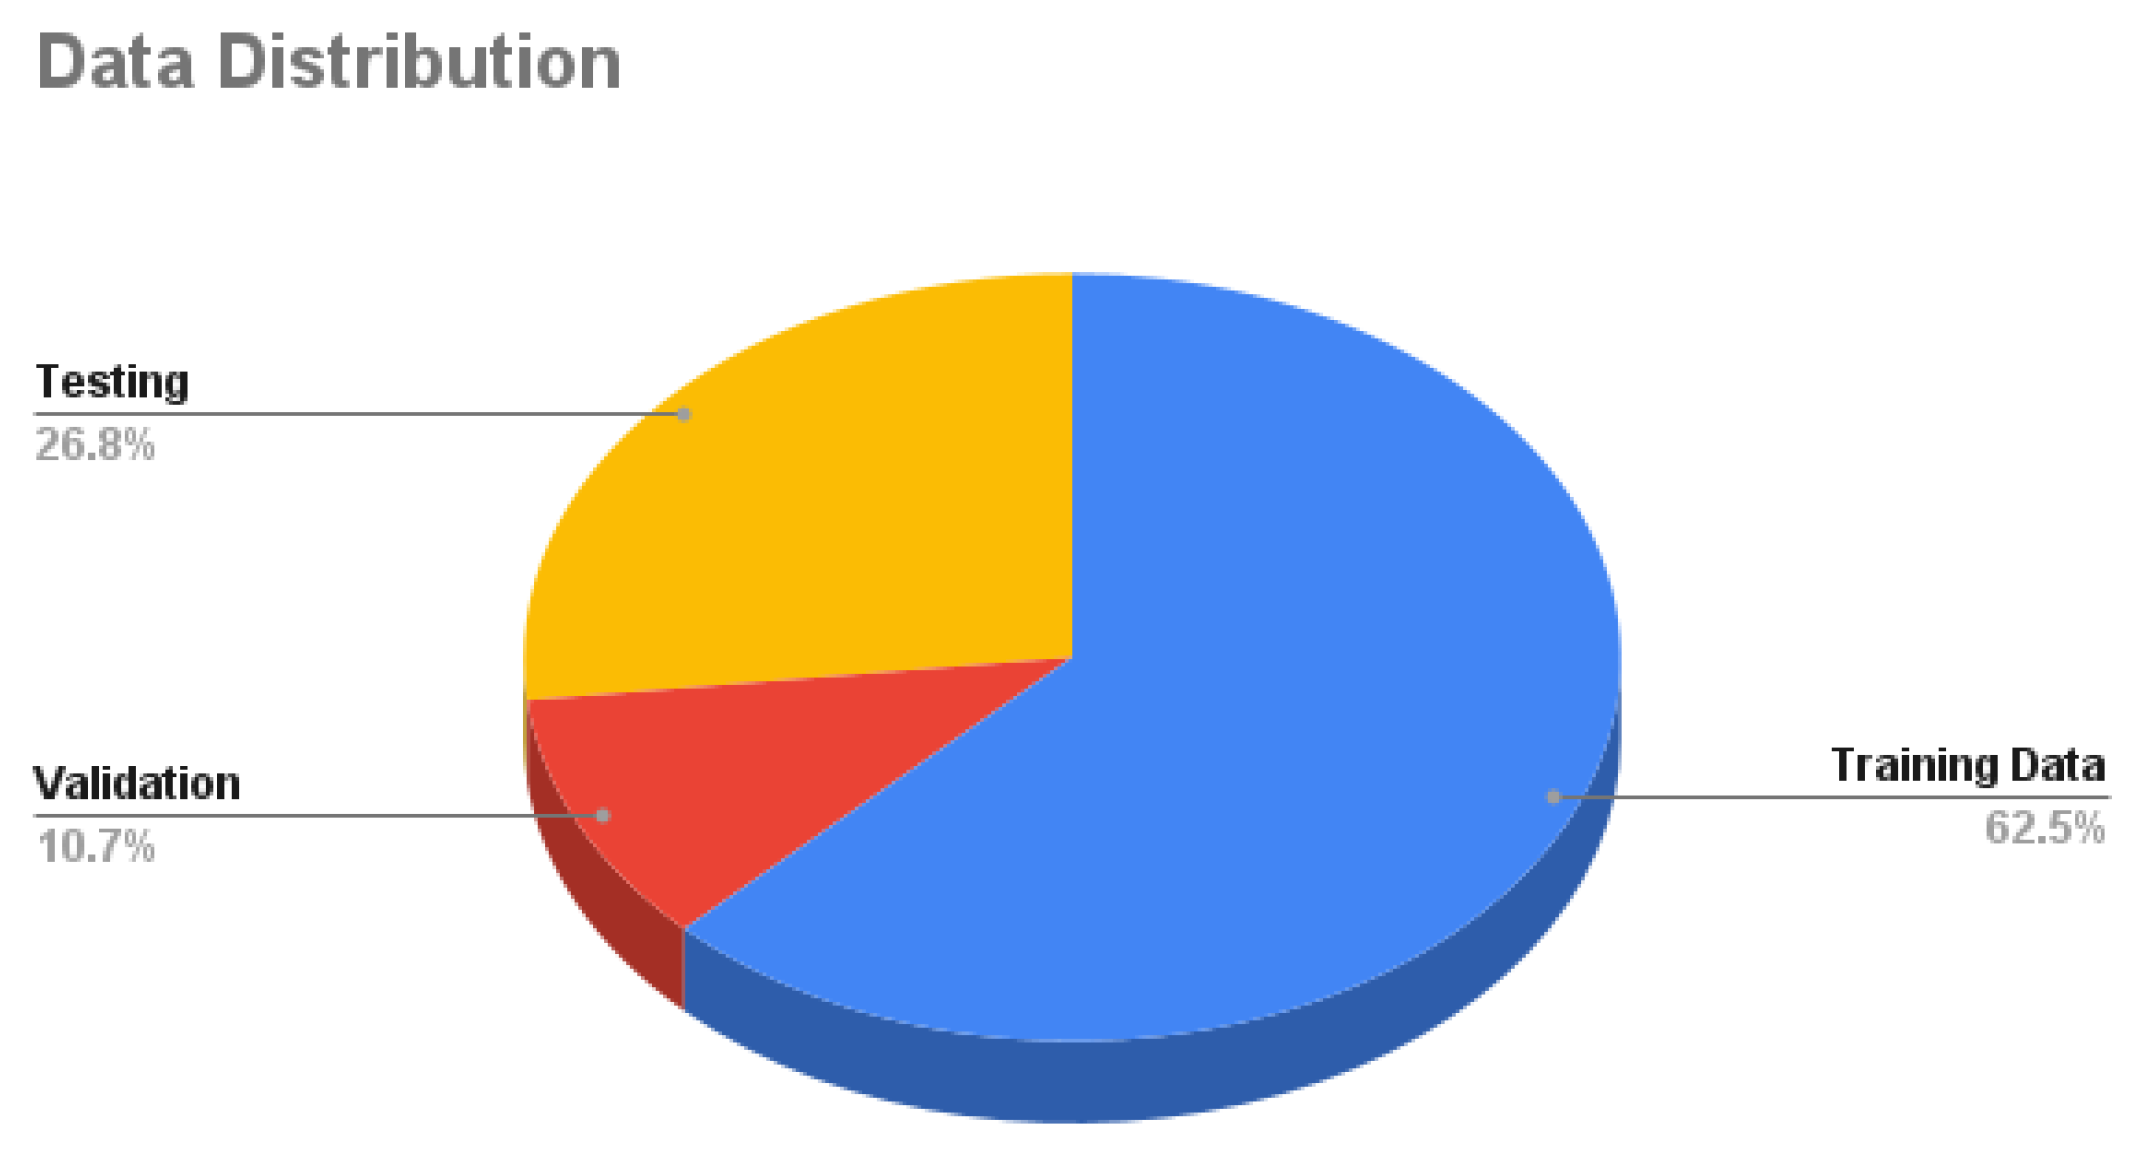
Our Dataset is collected using the CARLA simulator. The total number of samples is
125K samples in which each sample consists of 4 synchronized images: front, left, right, and rear. Around
62.5% of the samples are used as training data,
10.7% for validation, and
26.8% for testing as shown in
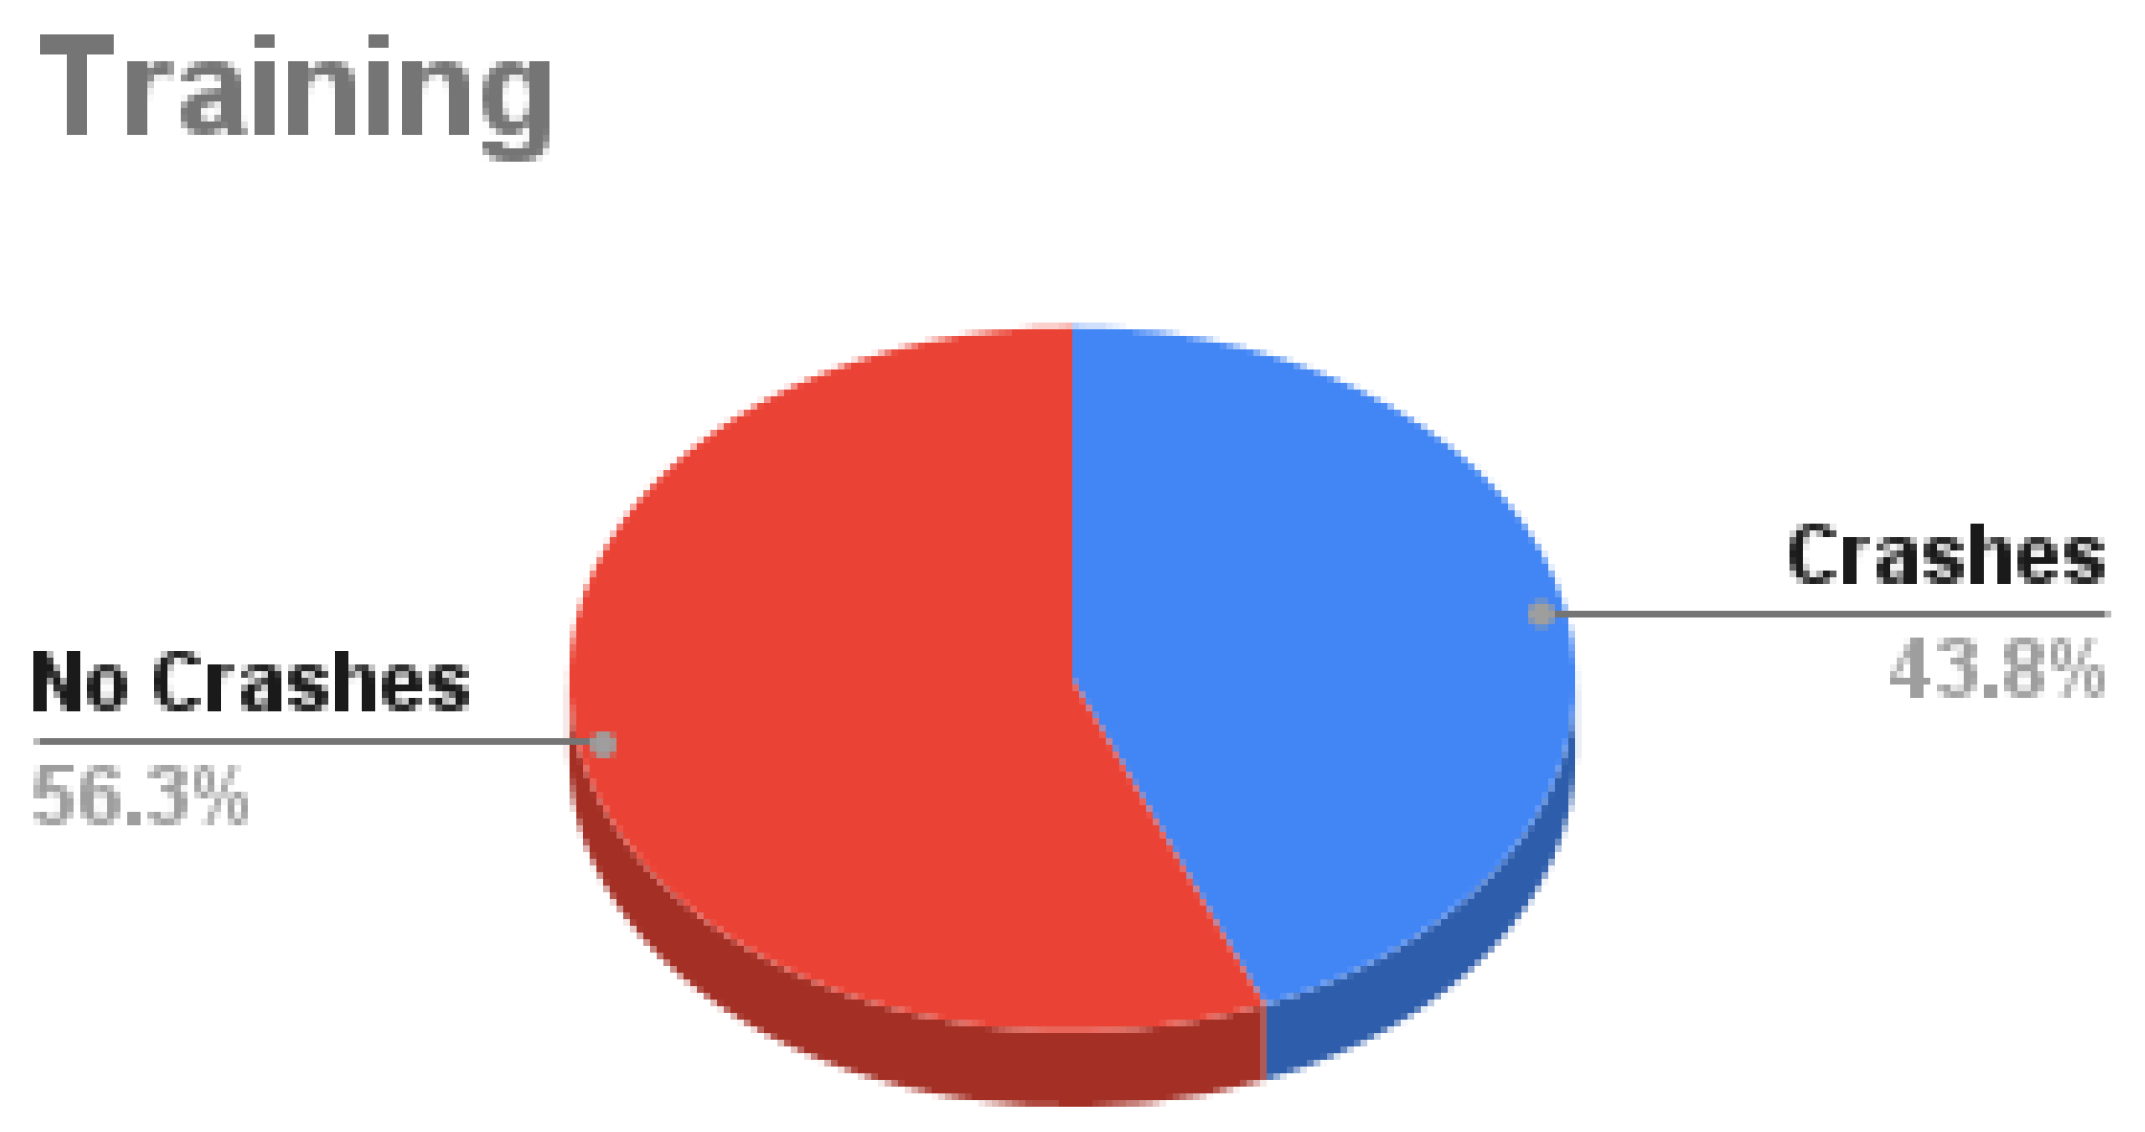
Figure 7. Training data is decomposed into
56.2% with no crashes and
43.8% with crash samples as in
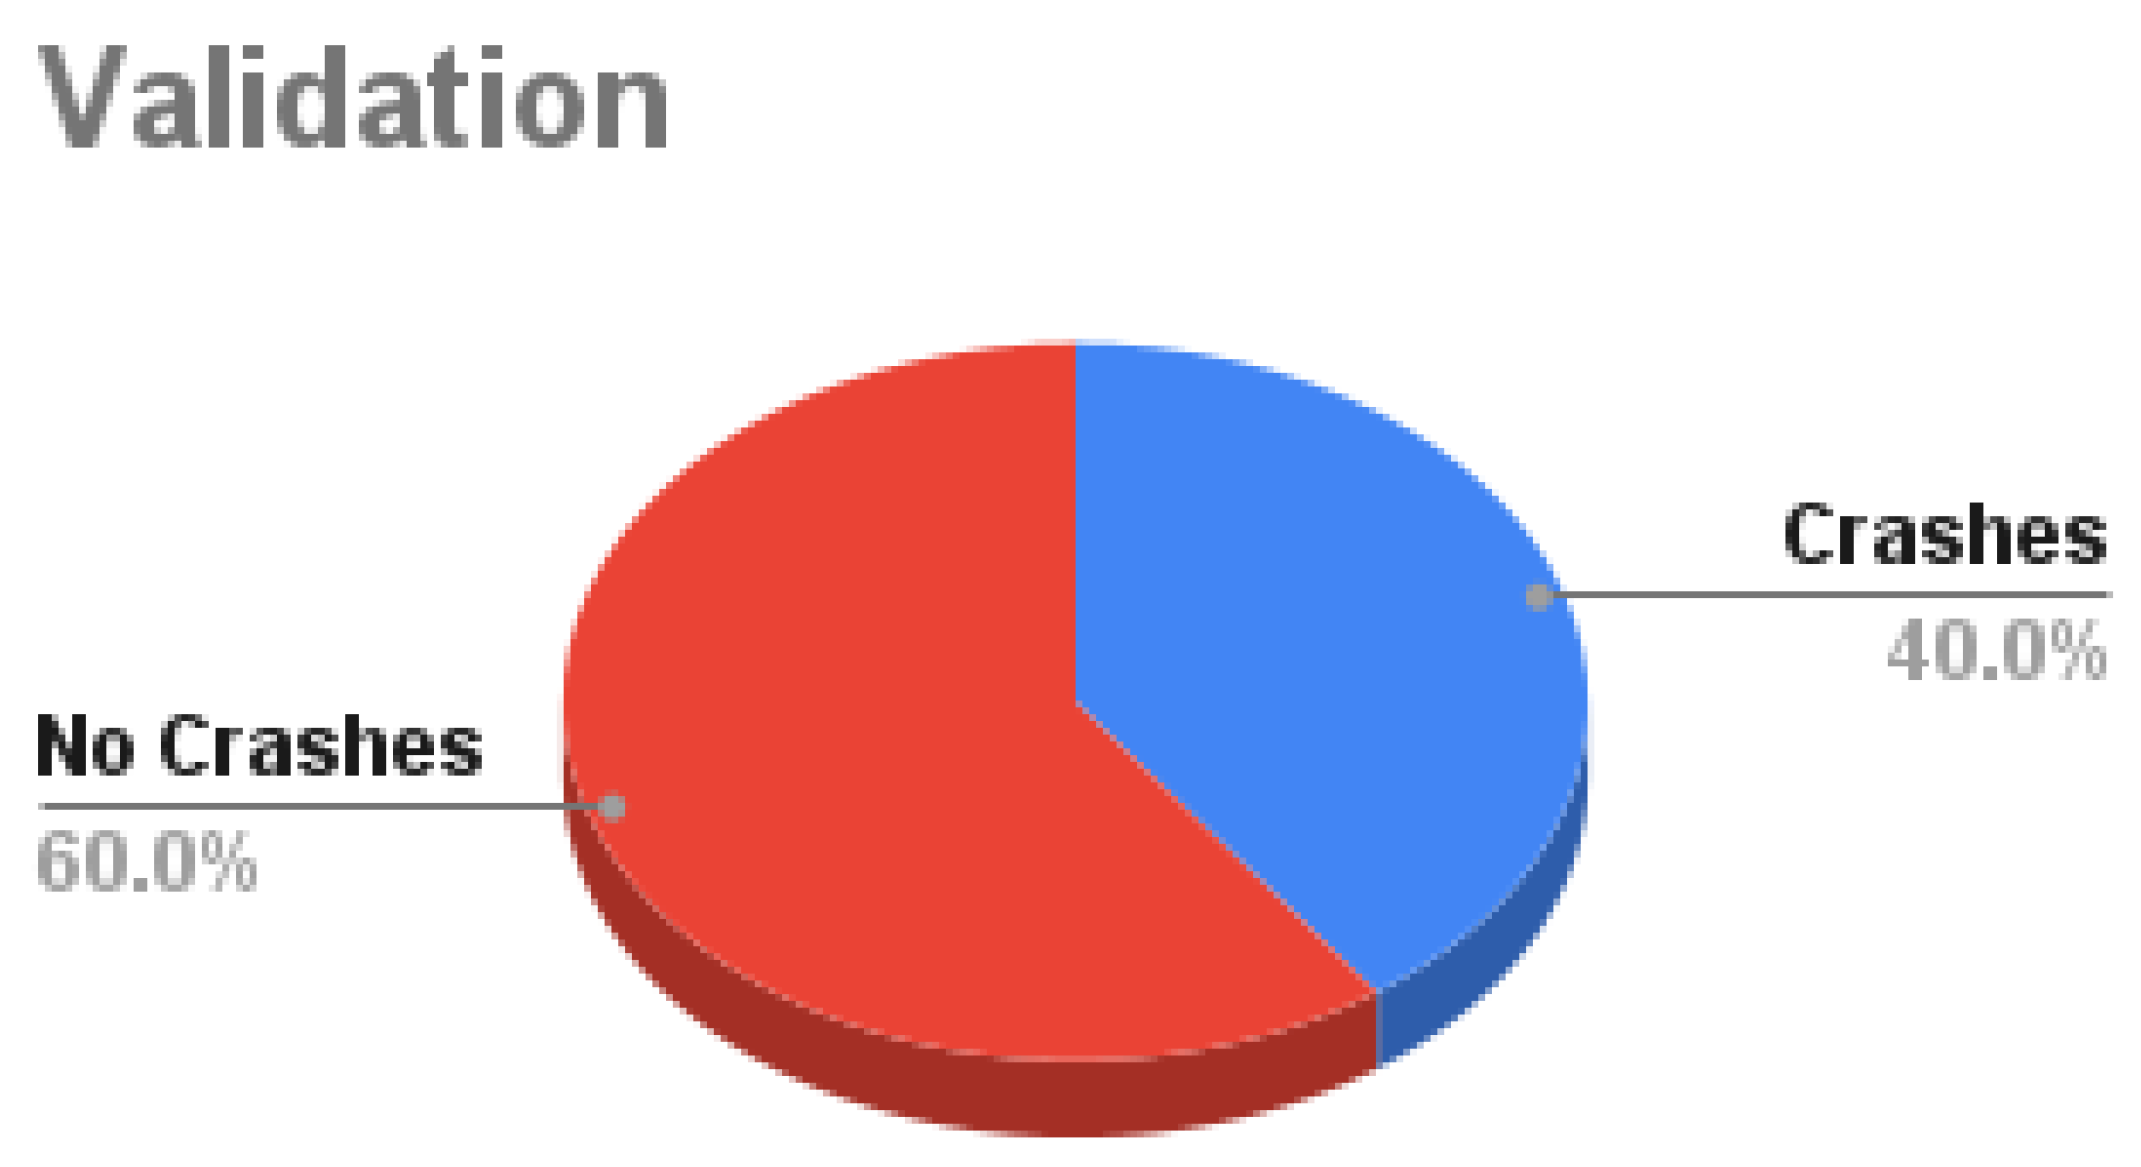
Figure 8. Validation data is decomposed into
60% with no crash and
40% with a crash as in
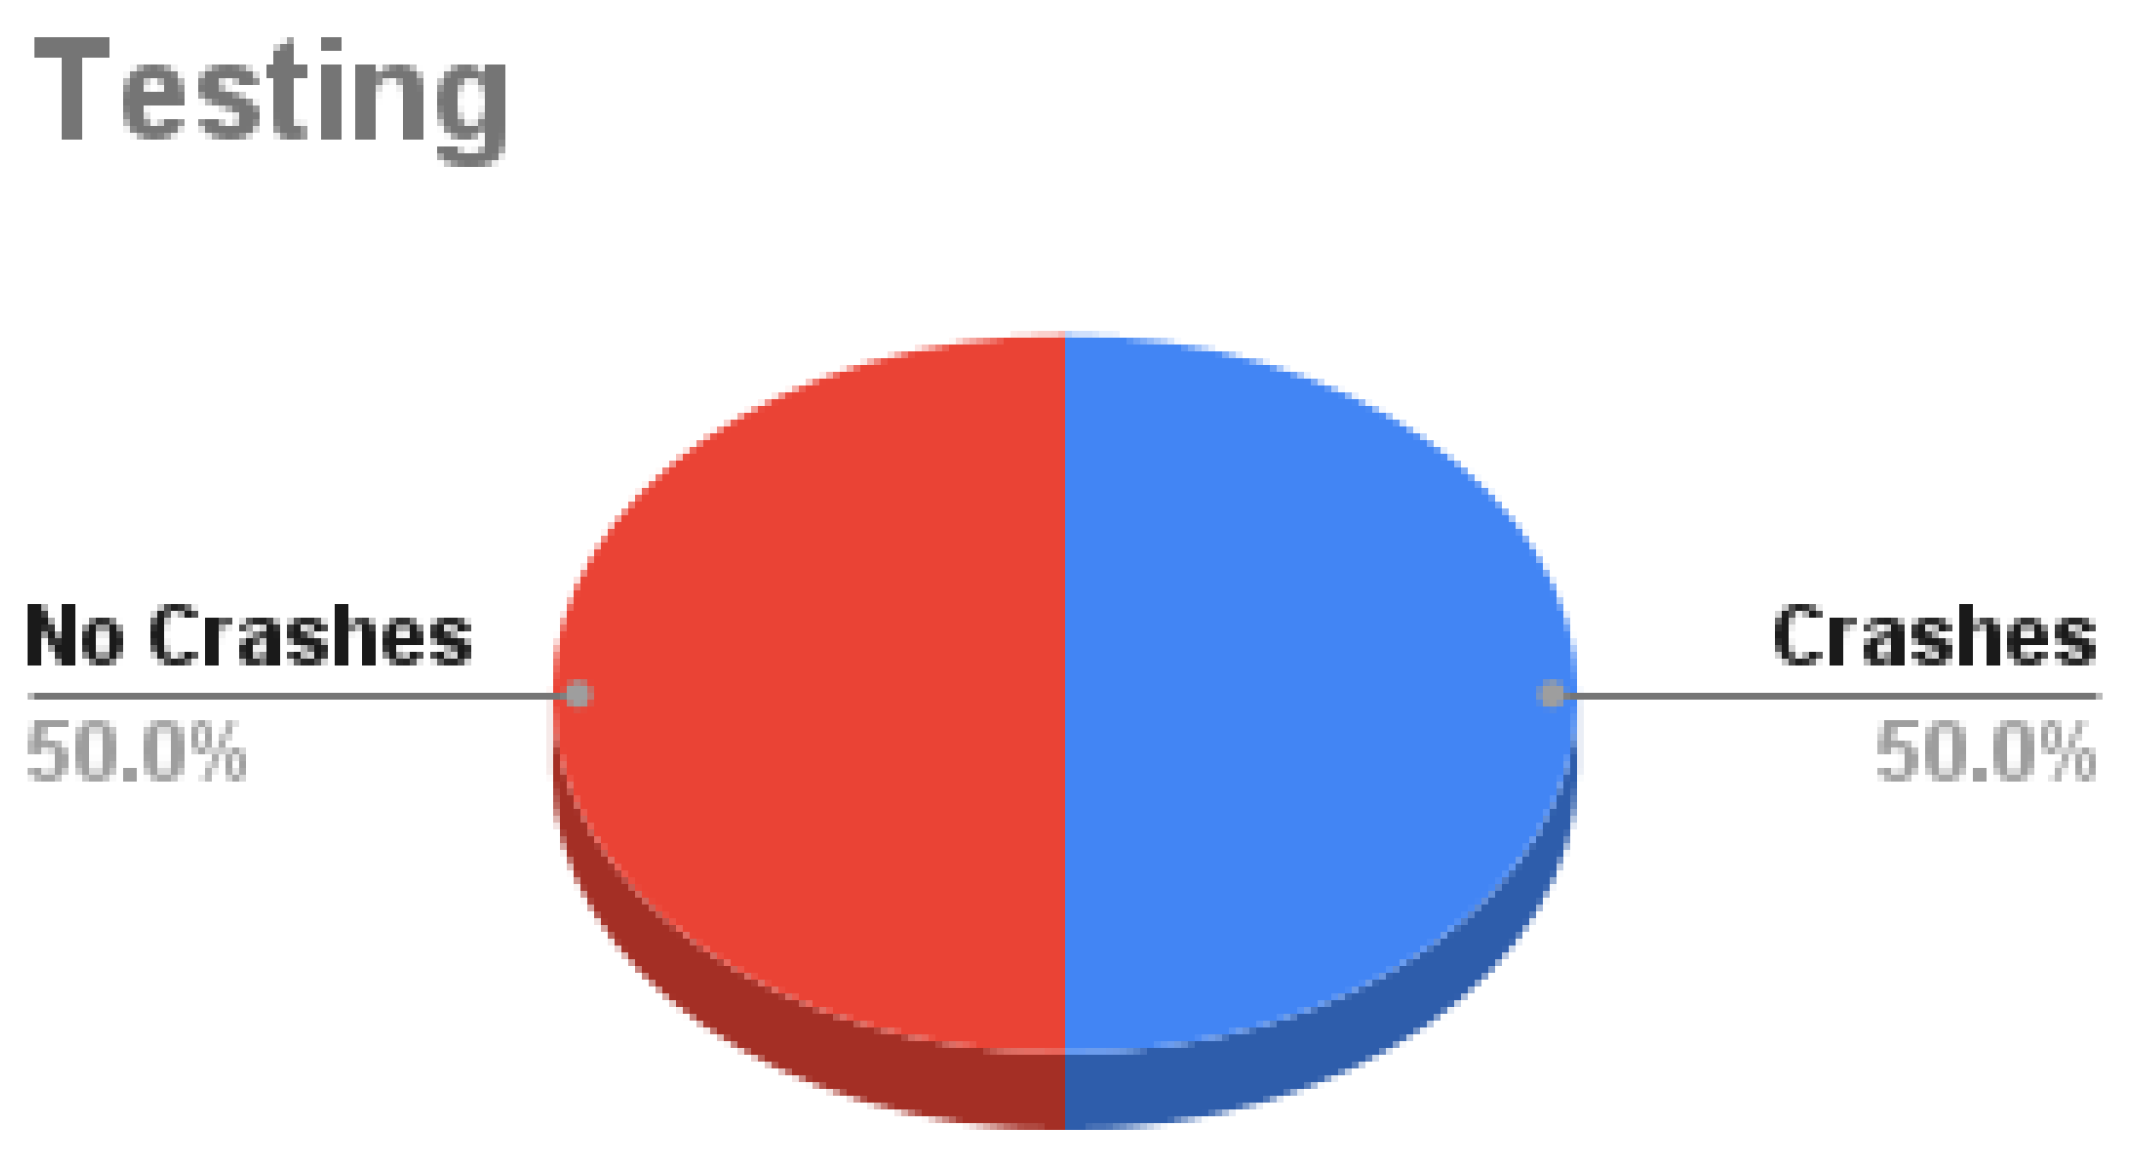
Figure 9. Testing data is decomposed into
50% with and without crashes as in
Figure 10.
5. Results
Likewise SDC-Net, the conducted experiments are decomposed into 2 variants: different input view and single-task network or multitask output. The first variant (input view) is categorized into different views: front camera, panorama, and BEV views; however, the second variant is categorized into running using a single/multiple output head network. As long as SDC-Net++ replaces the classification network with a detection one, the comparative study will tackle only: crash avoidance only and the multitask network (crash avoidance with path planning and AEB) because there is no meaning to run the path planning and AEB only because it will be identical to SDC-Net conducted experiments. This section covers the SDC-Net++ conducted experiments to compare the different input representations as shown in
Table 2 in which the rows show the different input representations and columns show single/multi-task networks. The main measurement metrics reported are identical to SDC-Net: precision, recall, f1-score, accuracy for the detection network, and mean square error (MSE) in the control action regression.
5.1. Crash Detection Only Results
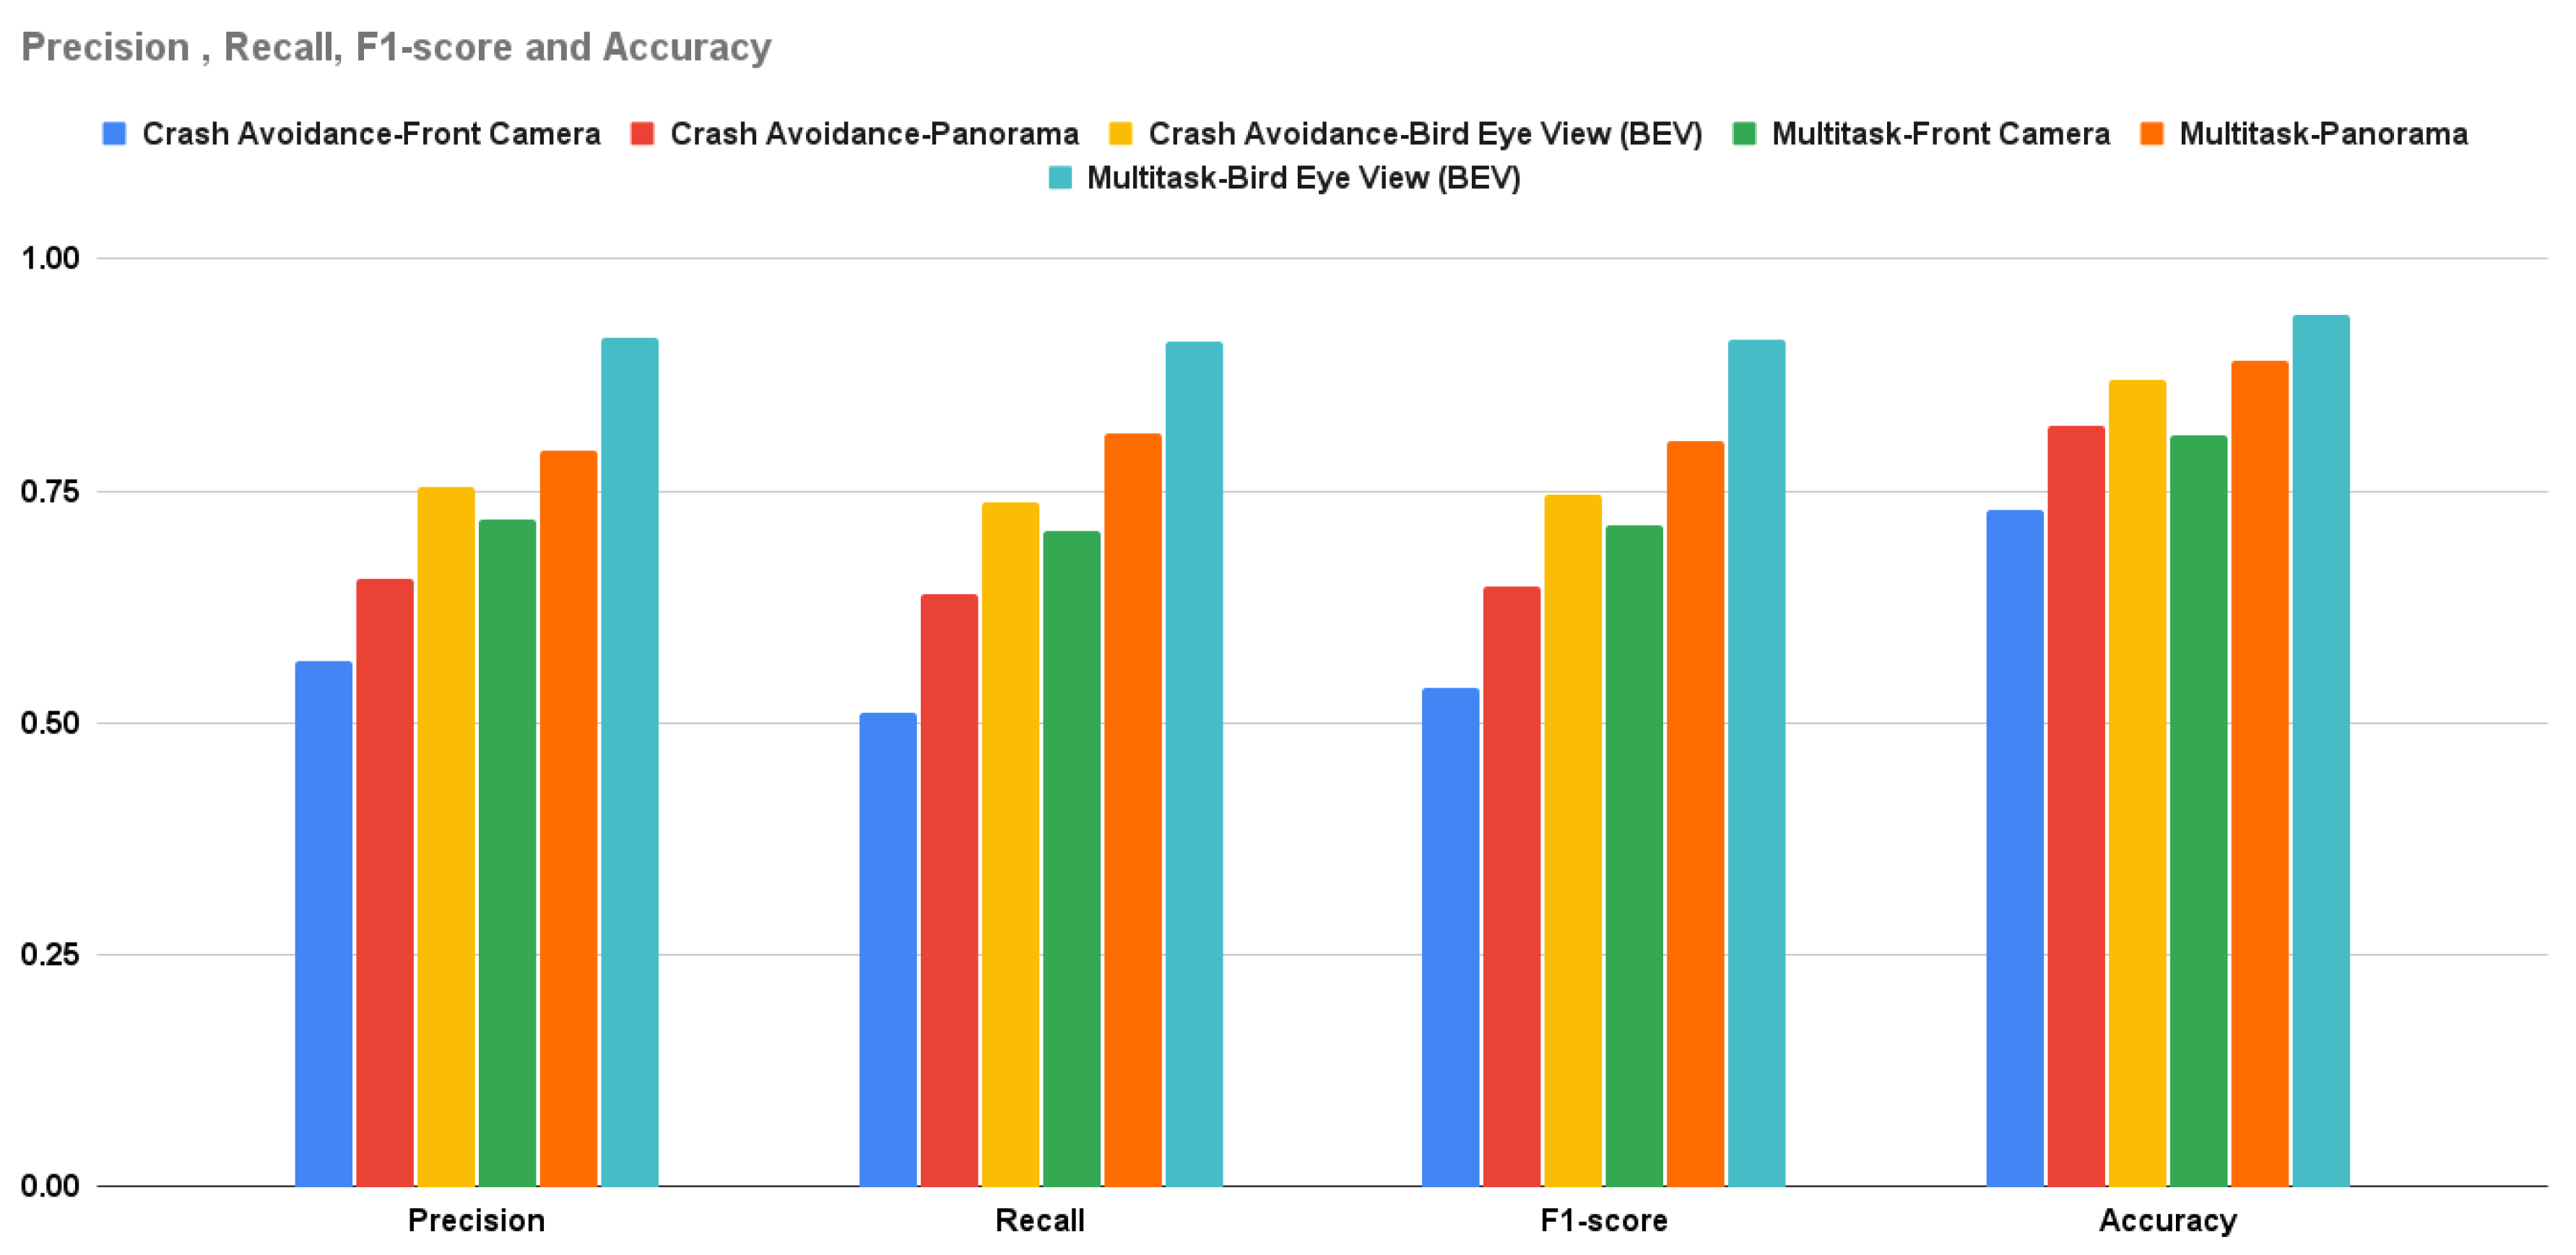
The crash avoidance-only experiment is a single-head detection output network in which the experiment is conducted three times: the first uses the front camera only, the second uses the panorama view, and the last one uses the BEV. Due to the detection problem, the measurement metrics can be intersection over union (IoU), however to compare with SDC-Net, the measurement metrics are only precision, recall, f1-score, and accuracy. It is obvious that the BEV results are better than the panorama camera and front camera results in precision by 15.197% and 33.203%, respectively; in recall by 15.273% and 44.374%, respectively; in f1-score by 15.246% and 38.867%, respectively; and in accuracy by 5% and 14%, respectively.
5.2. Multitask Results
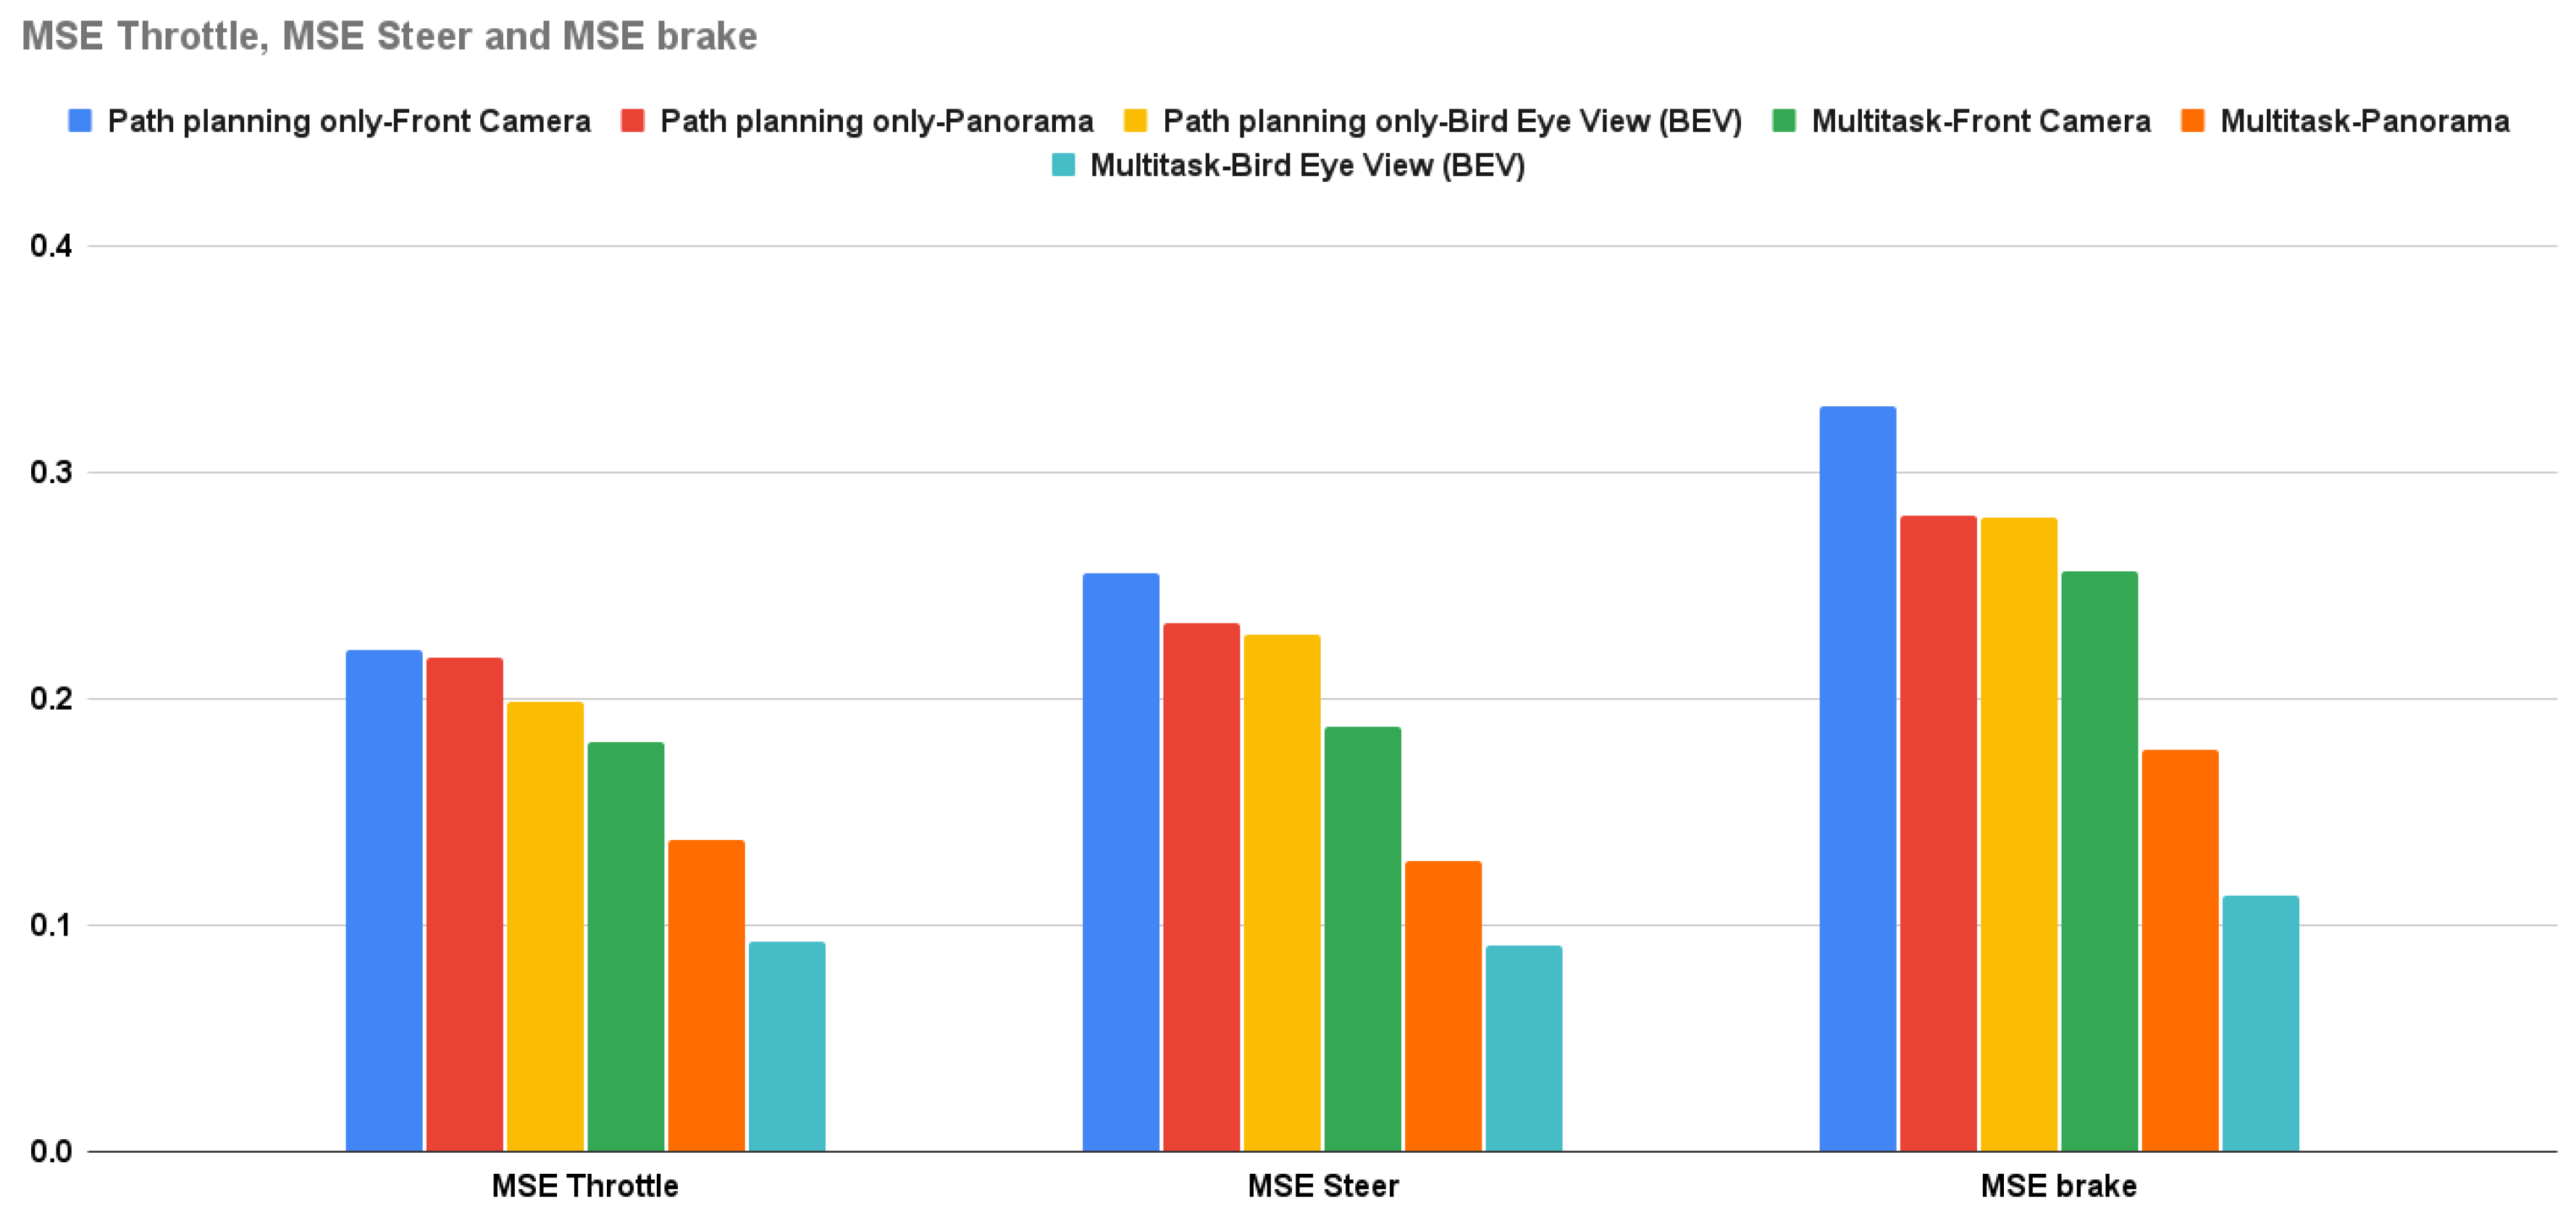
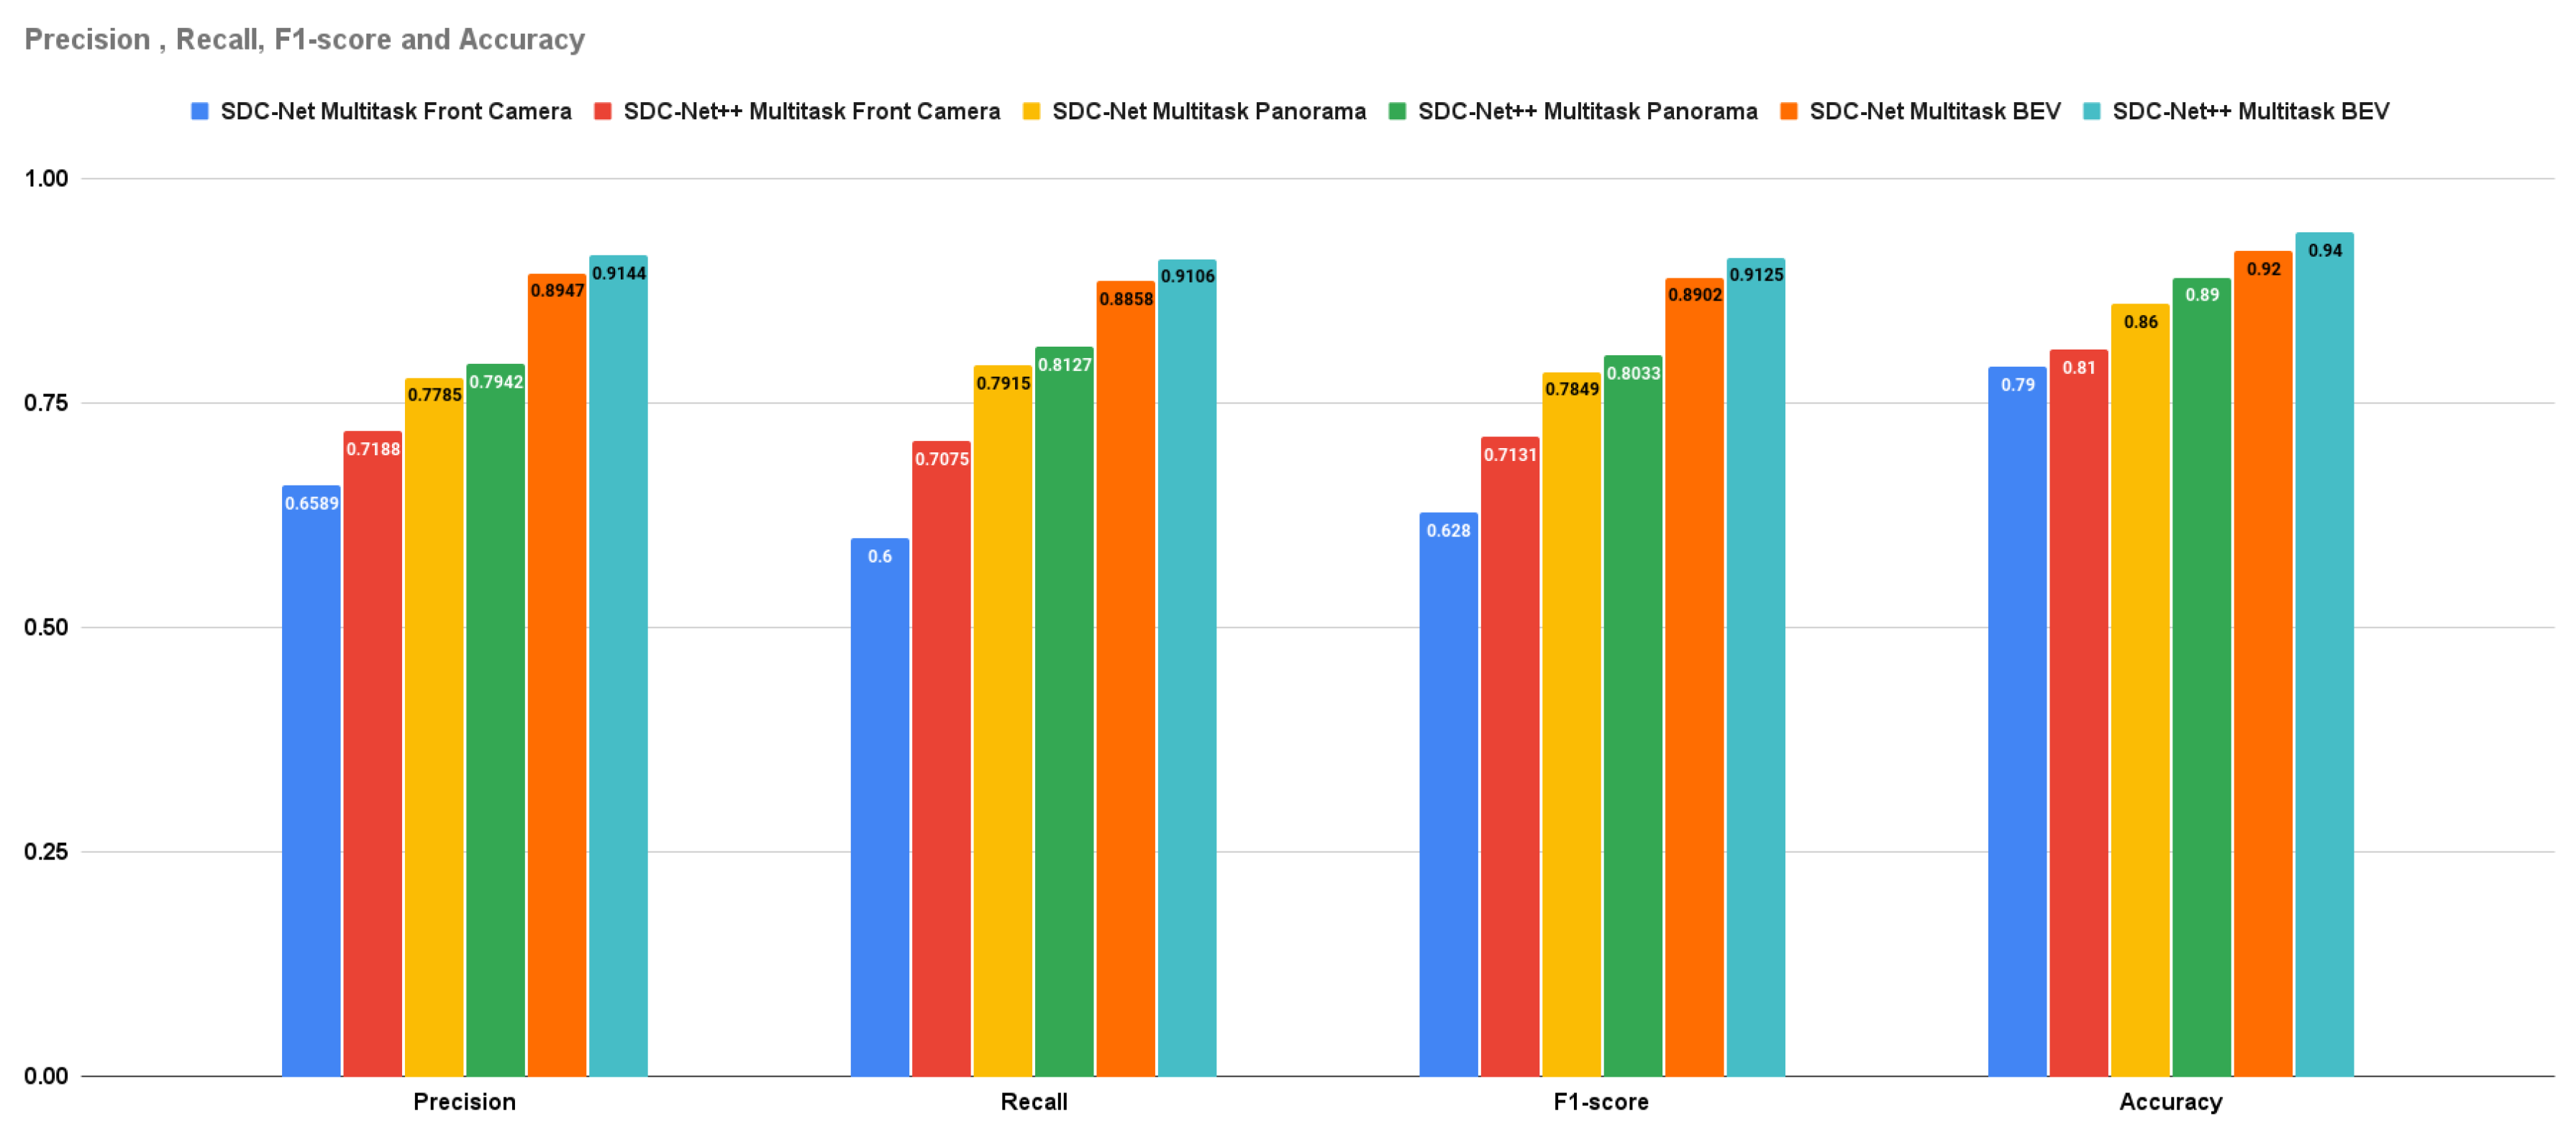
Crash avoidance, path planning, and AEB experiments are multi-head detection-regression output networks (multitask) in which the experiments are conducted three times: the first uses the front camera only, the second uses the panorama view, and the last one uses the BEV. Due to the multitask problem, the measurement metrics are the already previously mentioned ones of precision, recall, f1-score, and accuracy, in addition to the control actions MSE. It is obvious that the BEV results are better than panorama camera (experiments conducted in SDC-Net) and front camera results in precision by 15.134% and 27.212%, respectively; in recall by 12.046% and 28.706%, respectively; in f1-score by 13.593% and 27.962%, respectively; in accuracy by 5% and 13%, respectively; in throttle MSE by 32.97% and 48.835%, respectively; in steer MSE by 29.173% and 51.624%, respectively; and in brake MSE by 36.578% and 55.924% respectively.
6. Discussion
This technical discussion section is decomposed into two sub-sections: the first sub-section tackles the SDC-Net++ results only, however, the second sub-section tackles the comparison between SDC-Net and SDC-Net++ experimental results.
6.1. SDC-Net++ Results Discussion
Regarding crash avoidance-only experiments, the front camera-only experiments detect the accidents in front of the ego-vehicle only, however, it is not able to detect accidents beside and behind. This is due to the absence of sensors that can visually see behind and beside the ego vehicle, so it was expected that the measurement metrics were not so good. Panorama and BEV experiments have better results because depending on the camera cocoon setup that covers 360o around the ego vehicle, in case of an accident that happened beside or behind the vehicle, the sensors will be able to visually see it. Why did the BEV experiments outperform the panorama experiments? Panorama depends on stitching the raw cocoon images together; however, BEV depends on warping the cocoon images as a pre-processing phase before input to the network. BEV indirectly includes the distance factor because of warping, this facilitates detecting collision.
Regarding path planning and AEB experiments, front camera camera-only experiments take control action according to the front image only; however, it fails because it visually cannot see other vehicles besides the ego vehicle, so it takes inaccurate control actions (unsafe) that were expected due to lack of information about the environment. Panorama and BEV experiments have better results due to the different camera cocoon setups that cover 360o around the ego vehicle so that in the case of another vehicle in addition to the ego vehicle, the ego vehicle will not be able to maneuver. Again, we must ask why the BEV experiments outperformed the panorama experiments? BEV depends on warping the cocoon images in which the warped front image becomes in the upper part of the total image, the warped left image becomes in the left part of the total image, the warped right image becomes in the right part of the total image, and the rear warped image becomes in the lower part of the total image. This setup facilitates extracting the environment features compared to stitching the raw cocoon images together, as in the panorama view.
The multitask network outperforms the single task in both detection and regression measurement metrics.
Figure 11 shows the bar charts for precision, recall, f1-score, and accuracy; multitask with the BEV is the best experiment metric.
Figure 12 shows the bar charts for the MSE of throttle, brake, and steer for the conducted experiments; also multitask with BEV is the best lower experiment metric. Conceptually, multitask networks prove their efficiency compared with single-task ones because the presence of two or more tasks supports each other to learn in a better way.
6.2. SDC-Net and SDC-Net++ Results Discussion
Table 3 provides the combined experimental results for both SDC-Net and SDC-Net++. Regarding
crash avoidance only experiments with
front camera input, it is obvious that SDC-Net++ outperforms SDC-Net in precision by 2.702%, recall by 6.203%, f1-score by 4.538%, and accuracy by 2%, with
panorama view input, SDC-Net++ outperforms SDC-Net in precision by 5.291%, recall by 5.794%, f1-score by 5.549%, and accuracy by 4%, and with
BEV input, SDC-Net++ also outperforms SDC-Net in precision by 6.135%, recall by 9.694%, f1-score by 7.951%, and accuracy by 5%. Regarding
multitask with
front camera input, it is obvious that SDC-Net++ outperforms SDC-Net in precision by 9.090%, recall by 17.916%, f1-score by 13.55%, and accuracy by 2%, with
panorama view input, SDC-Net++ outperforms SDC-Net in precision by 2.016%, recall by 2.678%, f1-score by 2.344%, and accuracy by 3%, and with
BEV input, SDC-Net++ also outperforms SDC-Net in precision by 2.201%, recall by 2.8%, f1-score by 2.505%, and accuracy by 2%. Regarding
multitask with
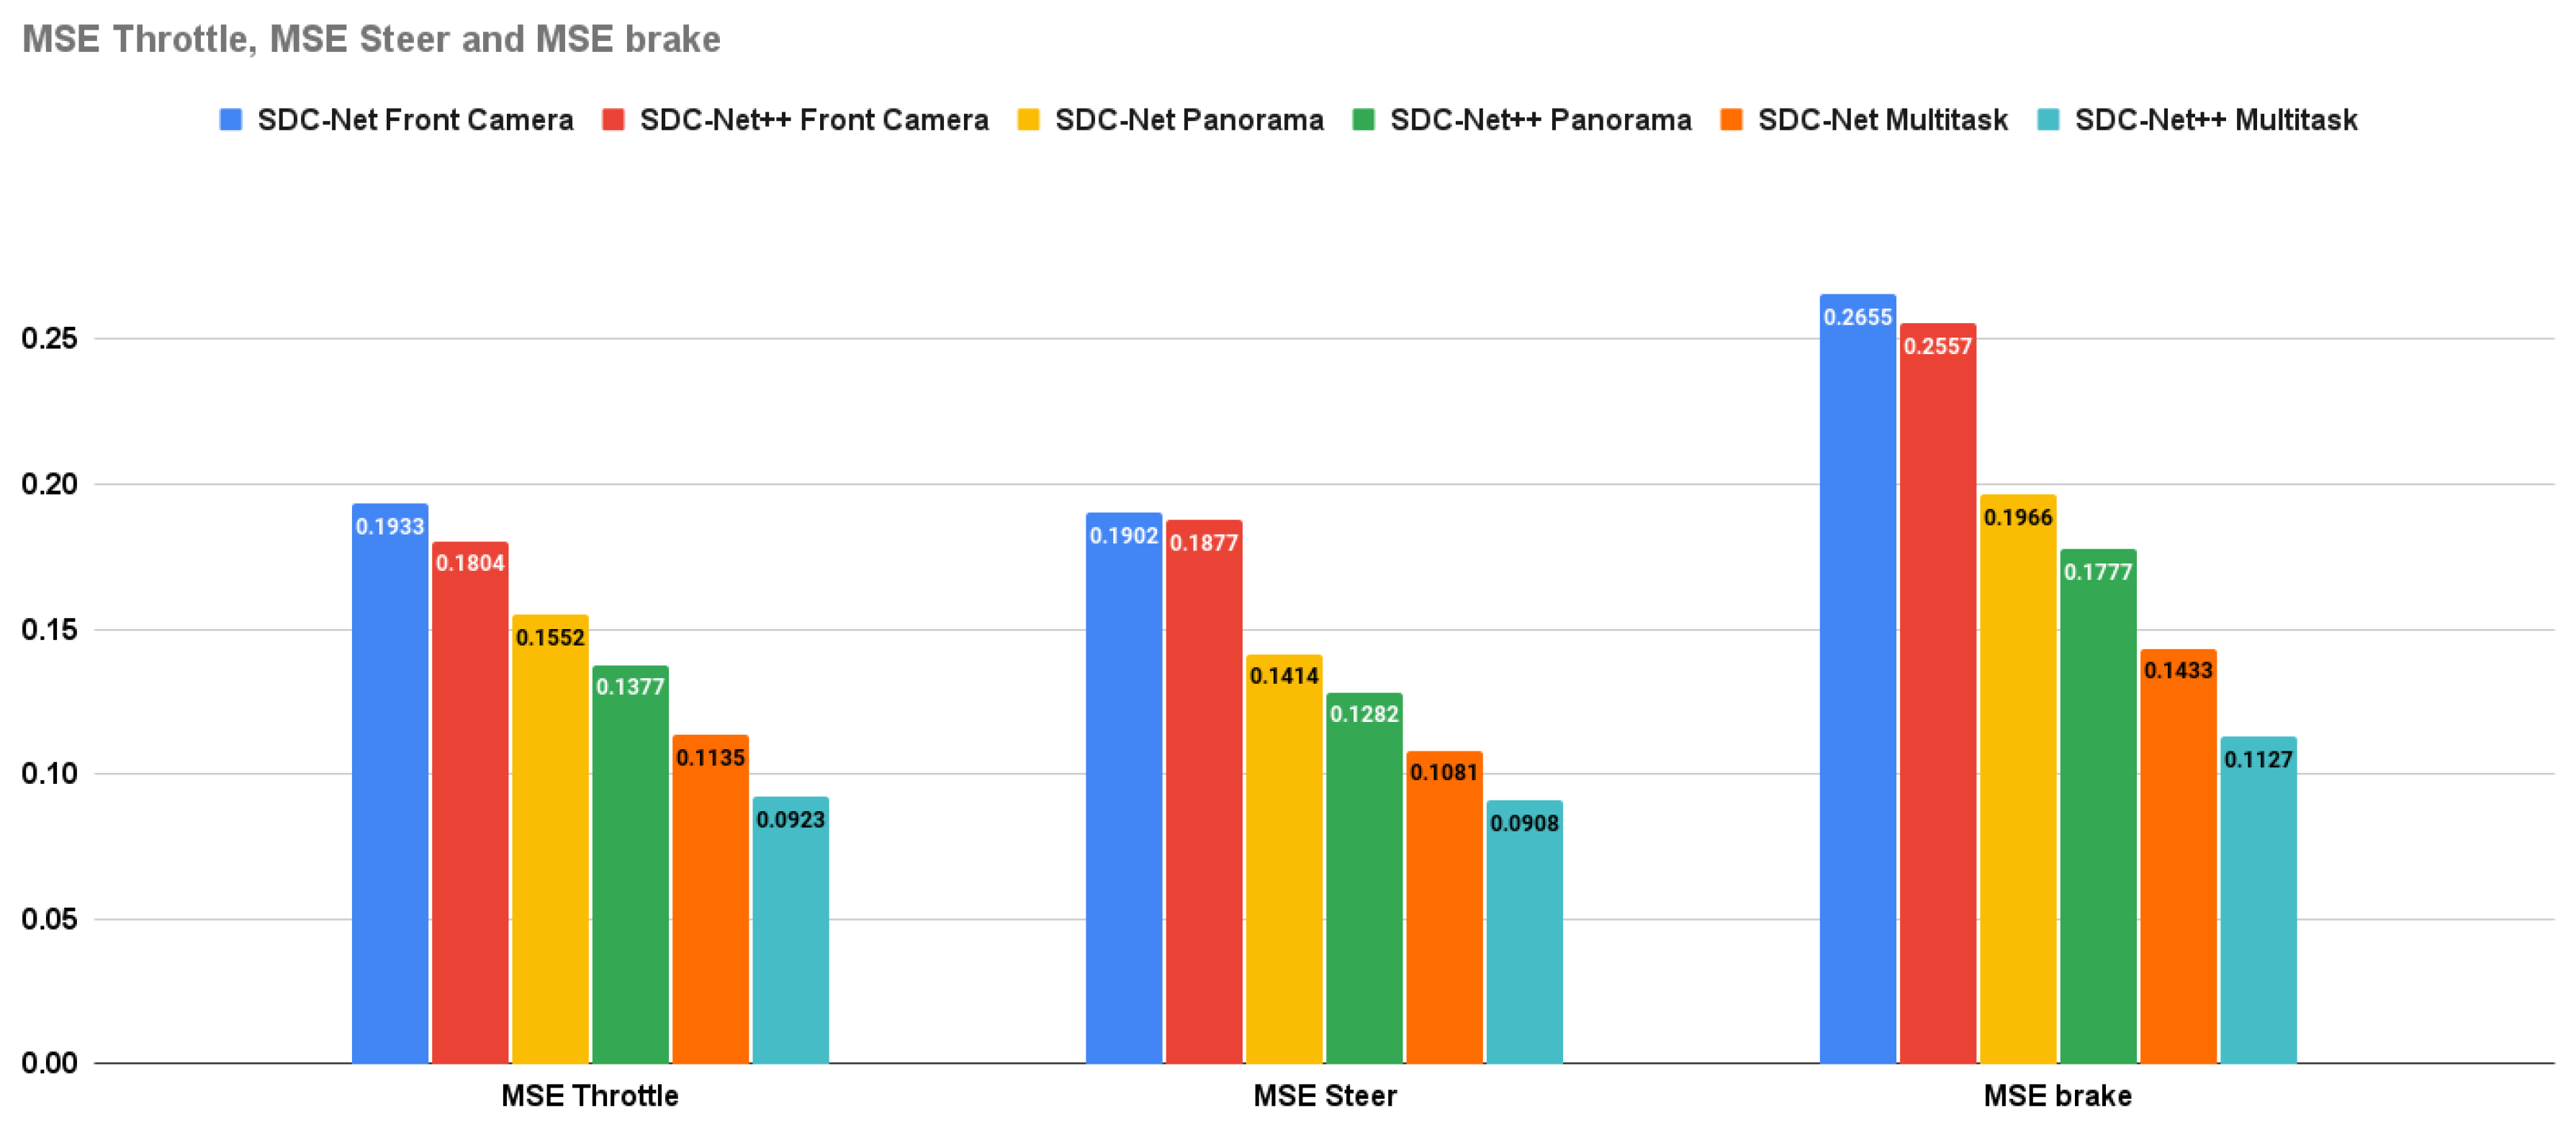
front camera input, it is also obvious that SDC-Net++ outperforms SDC-Net in throttle MSE by 6.673%, steer MSE by 1.314%, and brake MSE by 3.691%, with
panorama view input, SDC-Net++ outperforms SDC-Net in throttle MSE by 11.275%, steer MSE by 9.335%, and brake MSE by 9.613%, and with
BEV input, SDC-Net++ also outperforms SDC-Net in throttle MSE by 18.678%, steer MSE by 16%, and brake MSE by 21.353%.
SDC-Net++ outperforms SDC-Net in both detection and regression measurement metrics.
Figure 13 shows the bar charts for precision, recall, f1-score, and accuracy for both SDC-Net and SDC-Net in the case of crash avoidance only.
Figure 14 shows the bar charts for the MSE of throttle, brake, and steer for both SDC-Net and SDC-Net++. Thus,
Figure 15 shows the bar charts for precision, recall, f1-score, and accuracy for both SDC-Net and SDC-Net in the case of multitask. Conceptually, multitask networks prove their efficiency compared with single-task ones because the presence of two or more tasks supports each other to learn in a better way. Finally, SDC-Net++ detection network enhances the measurement metrics compared with the classification one in SDC-Net, this is because
directing the labels to detect where exactly the accident (bounding box) is in the scene rather than the classification which has only a binary label for the scene if there is an accident or not.
enlarging the size of the network, so enlarging the trainable parameters which means that SDC-Net design was not able to extract the most important features (accident features) in the input scene.
7. Conclusions
Currently, self-driving cars harness the power of the artificial intelligence (AI). Self-driving cars benefit from sensor fusion to perceive and understand the surrounding environment. IoT plays a very vital role in functioning self-driving cars, as it connects vehicles wirelessly sharing environment on-board sensors’ information. Autonomous vehicles utilize this connectivity to update the driving algorithms as a sort of incremental enhancement. Our proposed system, SDC-Net++ which is an end-to-end crash detection and action control self-driving car system, is proposed to enhance a prior study, SDC-Net system, that tackles exactly the same problem. SDC-Net++ replaced the classification network with a detection one keeping the same benchmark dataset to achieve a fair comparative study. SDC-Net++ with BEV input outperforms the nearest representation in precision, recall, f1-score, and accuracy by more than 15.134%, 12.046%, 13.593%, and 5%, respectively. It also outperforms SDC-Net in precision, recall, f1-score, accuracy, and average MSE by more than 2.201%, 2.8%, 2.505%, 2%, and 18.677% respectively.
Author Contributions
Conceptualization, Mohammed Abdou and; methodology, Mohammed Abdou; software, Mohammed Abdou; validation, Mohammed Abdou; investigation, Mohammed Abdou; data curation, Mohammed Abdou; writing—original draft preparation, Mohammed Abdou; writing—review and editing, Mohammed Abdou and Hanan Kamal; visualization, Mohammed Abdou; supervision, Hanan Kamal; All authors have read and agreed to the published version of the manuscript.
Funding
This research received no external funding
Institutional Review Board Statement
Not applicable
Informed Consent Statement
Not applicable
Data Availability Statement
Not applicable
Conflicts of Interest
The authors declare no conflict of interest.
References
- Herrmann, A.; Brenner, W.; Stadler, R. Autonomous driving: how the driverless revolution will change the world; Emerald Group Publishing: 2018.
- Kamal, M.A.S.; Hashikura, K.; Hayakawa, T.; Yamada, K.; Imura, J.i. Adaptive Cruise Control with Look-Ahead Anticipation for Driving on Freeways. Appl. Sci. 2022, 12, 929. [Google Scholar] [CrossRef]
- Greenwood, P.M.; Lenneman, J.K.; Baldwin, C.L. Advanced driver assistance systems (ADAS): Demographics, preferred sources of information, and accuracy of ADAS knowledge. Transp. Res. Part Traffic Psychol. Behav. 2022, 86, 131–150. [Google Scholar] [CrossRef]
- Shao, X.; Wang, Q.; Yang, H. Business Analysis and Future Development of an Electric Vehicle Company–Tesla. Int. Conf. Public Relations Soc. Sci. ICPRSS 2021. [Google Scholar]
- Boudette, N.E.; Davenport, C. GM will sell only zero-emission vehicles by 2035. The New York Times 2021. [Google Scholar]
- Pelliccione, P.; Knauss, E.; Heldal, R.; Ågren, S.M.; Mallozzi, P.; Alminger, A.; Borgentun, D. Automotive architecture framework: The experience of volvo cars. J. Syst. Archit. 2017, 77, 83–100. [Google Scholar] [CrossRef]
- Schwall, M.; Daniel, T.; Victor, T.; Favaro, F.; Hohnhold, H. Waymo public road safety performance data. arXiv 2020, arXiv:2011.00038. [Google Scholar]
- Smith, C.S. Baidu and Geely Will Mass-Produce an Autonomous EV: The Chinese tech giants aim for a fully self-driving car. IEEE Spectrum 2023, 60, 36–37. [Google Scholar] [CrossRef]
- Xu, X.; Zhang, L.; Yang, J.; Cao, C.; Wang, W.; Ran, Y.; Tan, Z.; Luo, M. A Review of Multi-Sensor Fusion SLAM Systems Based on 3D LIDAR. Remote. Sens. 2022, 14, 2835. [Google Scholar] [CrossRef]
- Sang, H.; You, Y.; Sun, X.; Zhou, Y.; Liu, F. The hybrid path planning algorithm based on improved A* and artificial potential field for unmanned surface vehicle formations. Ocean. Eng. 2021, 223, 108709. [Google Scholar] [CrossRef]
- Lin, L.; Li, W.; Bi, H.; Qin, L. Vehicle Trajectory Prediction Using LSTMs With Spatial–Temporal Attention Mechanisms. IEEE Intell. Transp. Syst. Mag. 2021, 14, 197–208. [Google Scholar] [CrossRef]
- Wang, C.; Chen, X.; Wang, J.; Wang, H. ATPFL: Automatic Trajectory Prediction Model Design Under Federated Learning Framework. In Proceedings of the IEEE/CVF Conference on Computer Vision and Pattern Recognition; 2022; pp. 6563–6572. [Google Scholar]
- Quintanar, A.; Fernández-Llorca, D.; Parra, I.; Izquierdo, R.; Sotelo, M. Predicting vehicles trajectories in urban scenarios with transformer networks and augmented information. In Proceedings of the 2021 IEEE Intelligent Vehicles Symposium (IV). IEEE; 2021; pp. 1051–1056. [Google Scholar]
- Abdou, M.; Kamal, H.; El-Tantawy, S.; Abdelkhalek, A.; Adel, O.; Hamdy, K.; Abaas, M. End-to-end deep conditional imitation learning for autonomous driving. In Proceedings of the 2019 31st International Conference on Microelectronics (ICM). IEEE; 2019; pp. 346–350. [Google Scholar]
- Guo, K.; Liu, W.; Pan, J. End-to-End Trajectory Distribution Prediction Based on Occupancy Grid Maps. In Proceedings of the IEEE/CVF Conference on Computer Vision and Pattern Recognition; 2022; pp. 2242–2251. [Google Scholar]
- Sallab, A.E.; Abdou, M.; Perot, E.; Yogamani, S. Deep reinforcement learning framework for autonomous driving. arXiv 2017, arXiv:1704.02532. [Google Scholar] [CrossRef]
- Sallab, A.; Abdou, M.; Perot, E.; Yogamani, S. End-to-end deep reinforcement learning for lane keeping assist. arXiv 2016, arXiv:1612.04340. [Google Scholar]
- Espié, E.; Guionneau, C.; Wymann, B.; Dimitrakakis, C.; Coulom, R.; Sumner, A. TORCS, The Open Racing Car Simulator. 2005.
- Naumann, M.; Poggenhans, F.; Lauer, M.; Stiller, C. Coincar-sim: An open-source simulation framework for cooperatively interacting automobiles. In Proceedings of the 2018 IEEE Intelligent Vehicles Symposium (IV). IEEE; 2018; pp. 1–6. [Google Scholar]
- Loc, H.D.; Kim, G.W. Fast and Accurate Deep Learning-Based Framework for 3D Multi-Object Detector for Autonomous Vehicles. In Proceedings of the 2022 IEEE International Conference on Big Data and Smart Computing (BigComp). IEEE; 2022; pp. 320–322. [Google Scholar]
- Hu, H.; Zhu, M.; Li, M.; Chan, K.L. Deep Learning-Based Monocular 3D Object Detection with Refinement of Depth Information. Sensors 2022, 22, 2576. [Google Scholar] [CrossRef] [PubMed]
- Zou, J.; Xiao, J.; Zhu, Z.; Huang, J.; Huang, G.; Du, D.; Wang, X. HFT: Lifting Perspective Representations via Hybrid Feature Transformation. arXiv 2022, arXiv:2204.05068. [Google Scholar]
- Gong, S.; Ye, X.; Tan, X.; Wang, J.; Ding, E.; Zhou, Y.; Bai, X. GitNet: Geometric Prior-based Transformation for Birds-Eye-View Segmentation. arXiv 2022, arXiv:2204.07733. [Google Scholar]
- Li, Z.; Wang, W.; Li, H.; Xie, E.; Sima, C.; Lu, T.; Yu, Q.; Dai, J. BEVFormer: Learning Bird’s-Eye-View Representation from Multi-Camera Images via Spatiotemporal Transformers. arXiv 2022, arXiv:2203.17270. [Google Scholar]
- Peng, L.; Chen, Z.; Fu, Z.; Liang, P.; Cheng, E. BEVSegFormer: Bird’s Eye View Semantic Segmentation From Arbitrary Camera Rigs. arXiv 2022, arXiv:2203.04050. [Google Scholar]
- Natan, O.; Miura, J. Fully End-to-end Autonomous Driving with Semantic Depth Cloud Mapping and Multi-Agent. arXiv 2022, arXiv:2204.05513. [Google Scholar]
- Xie, E.; Yu, Z.; Zhou, D.; Philion, J.; Anandkumar, A.; Fidler, S.; Luo, P.; Alvarez, J.M. M 2BEV: Multi-Camera Joint 3D Detection and Segmentation with Unified Birds-Eye View Representation. arXiv 2022, arXiv:2204.05088. [Google Scholar]
- Xu, R.; Tu, Z.; Xiang, H.; Shao, W.; Zhou, B.; Ma, J. CoBEVT: Cooperative bird’s eye view semantic segmentation with sparse transformers. arXiv 2022, arXiv:2207.02202. [Google Scholar]
- Xu, R.; Xiang, H.; Xia, X.; Han, X.; Li, J.; Ma, J. Opv2v: An open benchmark dataset and fusion pipeline for perception with vehicle-to-vehicle communication. In Proceedings of the 2022 International Conference on Robotics and Automation (ICRA); IEEE, 2022; pp. 2583–2589. [Google Scholar]
- Xu, R.; Guo, Y.; Han, X.; Xia, X.; Xiang, H.; Ma, J. OpenCDA: an open cooperative driving automation framework integrated with co-simulation. In Proceedings of the 2021 IEEE International Intelligent Transportation Systems Conference (ITSC); IEEE, 2021; pp. 1155–1162. [Google Scholar]
- Dosovitskiy, A.; Ros, G.; Codevilla, F.; Lopez, A.; Koltun, V. CARLA: An open urban driving simulator. In Proceedings of the Conference on robot learning. PMLR; 2017; pp. 1–16. [Google Scholar]
- Wang, T.H.; Manivasagam, S.; Liang, M.; Yang, B.; Zeng, W.; Urtasun, R. V2vnet: Vehicle-to-vehicle communication for joint perception and prediction. In Proceedings of the European Conference on Computer Vision; Springer, 2020; pp. 605–621. [Google Scholar]
- Cui, J.; Qiu, H.; Chen, D.; Stone, P.; Zhu, Y. COOPERNAUT: End-to-End Driving with Cooperative Perception for Networked Vehicles. In Proceedings of the Proceedings of the IEEE/CVF Conference on Computer Vision and Pattern Recognition; 2022; pp. 17252–17262. [Google Scholar]
- Wang, T.; Kim, S.; Ji, W.; Xie, E.; Ge, C.; Chen, J.; Li, Z.; Ping, L. DeepAccident: A Motion and Accident Prediction Benchmark for V2X Autonomous Driving. arXiv 2023, arXiv:2304.01168. [Google Scholar] [CrossRef]
- Abdou, M.; Kamal, H.A. SDC-Net: End-to-End Multitask Self-Driving Car Camera Cocoon IoT-Based System. Sensors 2022, 22, 9108. [Google Scholar] [CrossRef] [PubMed]
- Abdou, M.; Mohammed, R.; Hosny, Z.; Essam, M.; Zaki, M.; Hassan, M.; Eid, M.; Mostafa, H. End-to-end crash avoidance deep IoT-based solution. In Proceedings of the 2019 31st International Conference on Microelectronics (ICM); IEEE, 2019; pp. 103–107. [Google Scholar]
- Inc., P.T. Collaborative data science. https://plot.ly, 2015.
|
Disclaimer/Publisher’s Note: The statements, opinions and data contained in all publications are solely those of the individual author(s) and contributor(s) and not of MDPI and/or the editor(s). MDPI and/or the editor(s) disclaim responsibility for any injury to people or property resulting from any ideas, methods, instructions or products referred to in the content. |
© 2024 by the authors. Licensee MDPI, Basel, Switzerland. This article is an open access article distributed under the terms and conditions of the Creative Commons Attribution (CC BY) license (http://creativecommons.org/licenses/by/4.0/).
