Preprint
Article

Exploring the Microbial Mosaic: Insights into Composition, Diversity, and Environmental Drivers in the Pearl River Estuary Sediments

Altmetrics

Downloads

117

Views

68

Comments

0

A peer-reviewed article of this preprint also exists.

Submitted:

07 May 2024

Posted:

08 May 2024

You are already at the latest version

Alerts
Abstract
River estuaries are dynamic and complex ecosystems influenced by various natural processes, including climatic fluctuations and anthropogenic activities. The Pearl River estuary (PRE), one of the largest in China, receives significant land-based pollutants due to its proximity to densely populated areas and urban development. This study aimed to characterize the composition, diversity, and distribution patterns of sediment microbial communities (Bacteria, Archaea, and Eukaryotes) and investigated the connection with environmental parameters within the PRE and adjacent shelf. Physicochemical conditions, such as oxygen levels, nitrogen compounds, and carbon content, were analyzed. The study found that the microbial community structure was mainly influenced by site location and core depth, which together explained approximately 67% of the variation in each kingdom. Sites and core depths varied in sediment properties such as organic matter content and redox conditions, leading to distinct microbial groups associated with specific chemical properties of the sediment, notably C/N ratio and NH4+ concentration. Despite these differences, certain dominant taxonomic groups were consistently present across all sites: Gammaproteobacteria in Bacteria; Bathyarchaeia, Nitrososphaeria, and Thermoplasmata in Archaea; and SAR in Eukaryota. The community diversity index was the highest in the bacteria kingdom, while the lowest values were observed at site P03 across the three kingdoms and were significantly different from all other sites. Overall, this study underscores the critical role of microbial communities in shaping biogeochemical processes in estuarine environments and their sensitivity to environmental changes, providing valuable information for managing and preserving the health of estuaries and coastal ecosystems.
Keywords: 
Subject: Environmental and Earth Sciences  -   Environmental Science

1. Introduction

River estuaries stand as intricate intersections between terrestrial and marine ecosystems characterized by dynamic conditions perpetually influenced by various natural processes. These transitional zones are subject to climatic fluctuations such as changes in temperature and precipitation, which in turn influence the influx of freshwater, terrestrial runoff, and incoming tides. These fluctuations may alter oxygen levels, salinity, pH, and other environmental parameters (Garvine, 1975; Huang et al., 2019, Howland et al., 2000; Yuan et al., 2020; Li et al., 2006). The confluence of these factors establishes a complex environment that harbors enriched nutrients, mainly carbon and organic matter (Cai, 2011, Callahan et al., 2004). The sources of these nutrients encompass river runoff, land surface runoff, and atmospheric deposition (Huang et al., 2003). These areas which are often characterized by high population density, are additionally exposed to high anthropogenic activity (including domestic sewage, industrial wastewater, agriculture fertilizer and marine culture) which impacts the marine ecosystem through terrestrial runoff (Parida et al., 2022; Rout et al., 2024). The resulting variability in the composition and quantity of materials contributes to a dynamic environment characterized by fluctuating environmental conditions.
Among these estuaries, the Pearl River estuary (PRE), China’s second-largest estuarine system by discharge volume, stands as a poignant example of environmental stress. The large population living near it, the massive regional economic growth and rapid urban development have led to the excessive release of wastes into the estuary (Wen et al., 1995; Huang et al., 2003; Callahan et al., 2004). These waste flows introduce high loads of nutrients and organic matter from both industrial and agricultural sources (Jiang et al., 2009; Huang et al., 2003). The discharge of the river changes between seasons (dry and wet seasons) which affects the biological, physical and chemical processes such as flow of water volume, turbulent dispersion, nutrient amount, oxygen, salinity, algal blooms, etc. (Hoch & Kirchman, 1993; Harrison et al., 2008, Tang et al., 2003). For example, during summer, high concentrations of nutrients (leading to eutrophication) may cause excessive algae blooms and low O2 concentration in bottom waters, even producing hypoxic patches (Xu et al., 2010; Lu et al., 2018).
Due to its ecological complexity and importance, the PRE has been the focus of numerous studies on different facets of this ecosystem. Studies have focused on aspects ranging from organic matter (Callahan et al., 2004; Hu & Chivas, 2009), and fatty acid composition (Hu & Zhang, 2006) to heavy metals (Gu et al., 2014), PFAS concentrations (Gao et al., 2015) and pollutant concentrations along the estuary. The values of these parameters, and other pollutants are used to monitor and follow the environment’s health. Another critical aspect of the environment is the microbiota. Due to their short generation time, high functional diversity and sensitivity, the microbial communities are dynamic and can rapidly respond to physical, chemical or biological changes and therefore may serve as important indicators of environmental changes (Duarte et al., 2012; Kallmeyer et al., 2012). Several articles on PRE have shown the effect of various parameters such as seasonality, salinity and pollution on the composition and diversity of the microbiota (Zhang et al., 2023; Xu et al., 2022, Chen et al. 2021; Hu et al., 2021).
In contrast to highly variable water samples, even diurnally, the sediments are more stable and therefore more probable to produce robust indicators for marine health or presence or persistence of particular pollutants. The sediment which serves as a reservoir and a sink for various compounds, plays an essential environmental role in nutrient cycling and biogeochemical processes, due to its capacity to store or release different compounds from or to the water column (Southwell et al., 2010, 2011). Within the intricate framework of estuarine ecosystems, sediment microbial communities assume a crucial role in governing benthic biological processes. These communities are responsible for many global biogeochemical activities, including pivotal cycles such as nitrogen, carbon, phosphorus, and sulfur (Falkowski et al., 2008; Gray and Elliott, 2009). Additionally, they form the foundational layer of aquatic food chains, contributing to organic matter demineralization and the degradation of pollutants (Xie et al., 2016; Urakawa, 2000). However, the functioning of these microbial communities is notably susceptible to the impacts of changing environments (Suh et al., 2015). The variability in the conditions of the estuarine area has resulted in microbial communities, particularly in surface sediments, displaying richer composition and biodiversity compared to marine ecosystems (Wang et al., 2012; Crump and Bowen, 2023).
This study examined the microbiota at the outskirts of the PRE, aiming to describe key drivers shaping the microbiota structure. To provide a comprehensive description of the microbiota, Bacteria, Archea and Eukaryota were considered with respect commonality and difference in responses to various environmental parameters. The study focused on sediment microbiota, different sites and core depths, a choice based on the consideration of future endeavors to identify microbial markers related to health status of this marine environment.

2. Methods

2.1. Study Site and Sampling Procedure

Sediment samples were collected across the Pearl River Estuary (PRE) and adjacent shelf during July 2021 on the Research Vessel Haike 68. The sampling sites were in a depth range of 16 to 63 meters and comprised the following sites: P02, P03, A01, A01b, and A02 (Figure 1, Table S1). Sites A01b, and A02 are considered as marine sites, they are deeper and are exposed to the open sea. In contrast, sites P02 and P03 are shallower and located near the river estuary. Site A01 is an intermediate point in terms of depth and location. On the one hand it is close to the estuary of the river but on the other hand it is deeper and more exposed to the open sea than P02 and P03. Sediment cores were taken using a Uwitec corer with an 86 mm inner diameter and 60 cm length. Sediment cores were sectioned onboard with a vertical resolution of 1- 5 cm (1 cm at the surface and 5cm at the bottom), in total 9 slices per core. Thus, for the 5 sites we obtained a total of 45 samples. The nine slices for each core were classified into three depth sets: UP (1-3 cm), MED (5-9 cm) and DEEP (10-25 cm) (Table S2). The sediment samples for analysis of DNA and porosity were sectioned in air; sediment samples for analysis of solid and solute chemical substances were sectioned in a glove bag filled with nitrogen gas to avoid oxidation. To analyze the soluble substance, porewater was extracted using Rhizon samplers with 0.1 μm pore size (Rhizosphere Research Products, Netherlands). Samples for analysis of dissolved Fe were preserved with 5% (v/v) nitric acid. Other porewater and sediment samples were stored at -20°C prior to further analysis.

2.2. Environmental Parameters Analysis

We analyzed environmental parameters, including the concentrations of dissolved oxygen (O2), ammonium (NH4+), dissolved iron (Fediss), sediment porosity, total nitrogen (TN), and particulate organic carbon (POC, Table S2). To measure POC and TN, ~ 0.5 g of dried sediments were mixed with hydrochloric acid (0.5 N, 1 mL) overnight to dissolve the particulate inorganic carbon (PIC). The samples were then dried at 60°C and measured for POC and TN using an elemental analyzer (EA, Euro EA3000, Enrovector). Dissolved oxygen was measured using a micro-profiling system assembled with an oxygen sensor (Unisense, Denmark). Fediss concentrations were determined spectrophotometrically with using a Ferrozine method (Viollier et al., 2000). Ammonium concentrations were determined by the indophenol blue method (Bolleter et al., 1961). Sediment porosity was calculated by water content and dry sediment density, which were measured by the weighing method and pycnometers separately (Li, 2014). POC and TN in sediment were treated with hydrochloride acid to remove inorganic C prior to measurement using an elemental analyzer (EA, Euro EA3000, Eurovector) coupled to an Isotope Ratio Mass Spectrometer (IRMS, Nu Perspective, Nu Instruments). The data for O2, POC, and TN and extended materials and methods for these measurements were reported previously in a thesis work (Zhou, 2022).

2.3. DNA Extraction, PCR Amplification and Amplicon Sequencing

From each slice, DNA was extracted using the DNeasy powerSoil Kit (Qiagen, Valencia, CA, USA) following manufacturer instructions. Appropriate controls were included in all parts of the sample preparations (no input reactions). For Bacteria and Eukaryota, primers were used for PCR amplification of SSU rRNA gene fragments, targeting the V4 regions of microbial small subunit ribosomal RNA genes as described in The Earth Microbiome Project (Bacteria, CS1-515F: ACACTGACGACATGGTTCTACAGTGCCAGCMGCCGCGGTAA and CS2-806R: TACGGTAGCAGAGACTTGGTCTGGACTACHVGGGTWTCTAAT (~290 bp); Eukaryota: CS1-Euk1391F: ACACTGACGACATGGTTCTACAGTACACACCGCCCGTC and CS2-EukBr-R: TACGGTAGCAGAGACTTGGTCTTGATCCTTCTGCAGGTTCACCTAC (~200 bp)) (Caporaso et al., 2011; Stoeck et al., 2010). For Archaea, the primer pair used was published in Takahashi et al. (2014) (CS1-ARC344F: ACACTGACGACATGGTTCTACAACGGGGYGCAGCAGGCGCGA and CS2-ARC806R: TACGGTAGCAGAGACTTGGTCTGGACTACVSGGGTATCTAAT (~400 bp). The primers contained 5’ common sequence tags (known as common sequences 1 and 2, CS1 and CS2 (Naqib et al., 2018). Amplicons were generated using a two-stage PCR amplification protocol. Cycling conditions for the first stage PCR were 95°C for 5 minutes, followed by 28 cycles of 95°C for 30 sec, 55°C for 45 sec and 72°C for 60 sec. Library preparation, (including sample barcoding and addition of PhiX DNA spike-in control) pooling and sequencing (Illumina (Fluidigm, South San Francisco, CA; Item# 100-4876) MiSeq (Archaea) or MiniSeq (Bacteria and Eukaryota) were performed at the Research Resources Center (GRC) within the Research Resources Center (RRC) at the University of Illinois at Chicago (UIC). The data are accessible via GenBank under the SRA accession number: PRJNA1031164.

2.4. Sequence Data Processing

Sequence data was processed using the Dada2 pipeline (Callahan et al., 2016). For each sequencing run, a separate analysis was conducted for quality trimming, error model estimation, sequence error correction and amplicon sequence variants (ASVs) inference and quantification. The ASVs and count tables of all runs were merged and suspected chimera were removed. For each ASV, taxonomy was inferred by alignment to the Silva non-redundant small subunit ribosomal RNA database (v138) using the Dada2 command ‘assignTaxonomy’, setting the minimum bootstrap value to 80%. For Eukaryota ASV sequences, taxonomic inference was also achieved by the last common ancestor method (LCA) in MEGAN (MEGAN6, community addition) using as input results of BLASTn against the NCBI nt database with 50 best hits (LCA parameters: minimum score = 100, an e-value < 10-9 and a coverage > 80%). Table S6(a-c) presents the raw count tables and ASVs inferred taxonomy.

2.5. Community Structure with Environmental Variables (metaNMDS)

We used non-metric multidimensional scaling (NMDS) to explore the similarity in community structure between the different samples. We repeated the following analysis for each combination of taxonomic group and aggregation level. We first filtered the OTU and kept only those with a minimum of 5 total individuals. We applied a Wisconsin square root transformation on the raw abundance data before calculating the Bray-Curtis dissimilarity between each sample pair. Next, we selected 33 samples out of 45 that had complete environmental data for the selected variables (CoreDepth, NH4+, Porosity, TN, POC, C/N, and O2; Table S2). The reduced dataset included at least 5 samples from each site. Core depth categories were represented by at least 7 samples. We then fitted a metaNMDS model using the metaMDS function of the vegan R package [v2.5.7] (Oksanen et al., 2022). The lengths of the vectors are scaled by R2 of the multiple regression and are relative. We used vegan’s envfit function (999 permutations) to determine the relative contribution of environmental variables to the separation of the communities along ordination axes. The direction of the environmental vectors is based on multiple regression against the ordination axes, while vector lengths are scaled by the R2 of the regression (Table S3). To examine the contribution of the environmental factors (site and core-depth) to variation in microbiota composition in model samples, permutational analysis of variance (PERMANOVA) was performed (command ‘adonis’ in R package ‘vegan’ [v2.5.7]) base Euclidean distances on log-ratio transformed counts. For each of the three datasets, raw counts were subsampled to the minimum library size and then, a Shannon index was calculated (‘diversity’ function in R package ‘vegan’). In order to test differences in the Shannon index as a function of the environmental variables, aligned rank-transformed (ART) ANOVA was performed.

2.6. Biomarker Identification (LDA and LDM)

Linear discriminant analysis effect size (LEfSe) analysis was chosen to calculate differential abundance and identify putative biomarkers. This method is effective in determining which features, in this case, ASVs, are most likely to explain observed differences among factor levels (Segata et al., 2011). LEfSe was performed using the MicrobiotaProcess R package [v3.16] (Xu et al., 2023). LDA-based effect size analysis is widely implemented in microbiota analysis and can provide valuable insights into the importance of different features in discriminating between different groups, as well as identify the most informative features for classification tasks. We used the CSS normalized data as input and performed the analysis separately once to identify biomarkers and differential abundances for sites, and once for core-depth categories. In both cases, we set the LDA effect size threshold to 1.25 and estimated Benjamini & Hochberg (1995) false discovery rate for multiple comparisons to correct the p-value and reduce false positives. We explored the relative abundances of the identified markers and plotted them on cladograms based on taxonomic relatedness. Linear decomposition model (LDM) analysis (Hu & Satten, 2020) was applied for the detection of ASVs with relative abundance significantly associated with the chemical properties of the sediment. LDM was performed using the R package ‘LDM’ (version 5.0). Significant differential abundance was considered for q value <0.05 in the ‘omni3’ test.

3. Results

3.1. Microbial Composition and Environmental Drivers

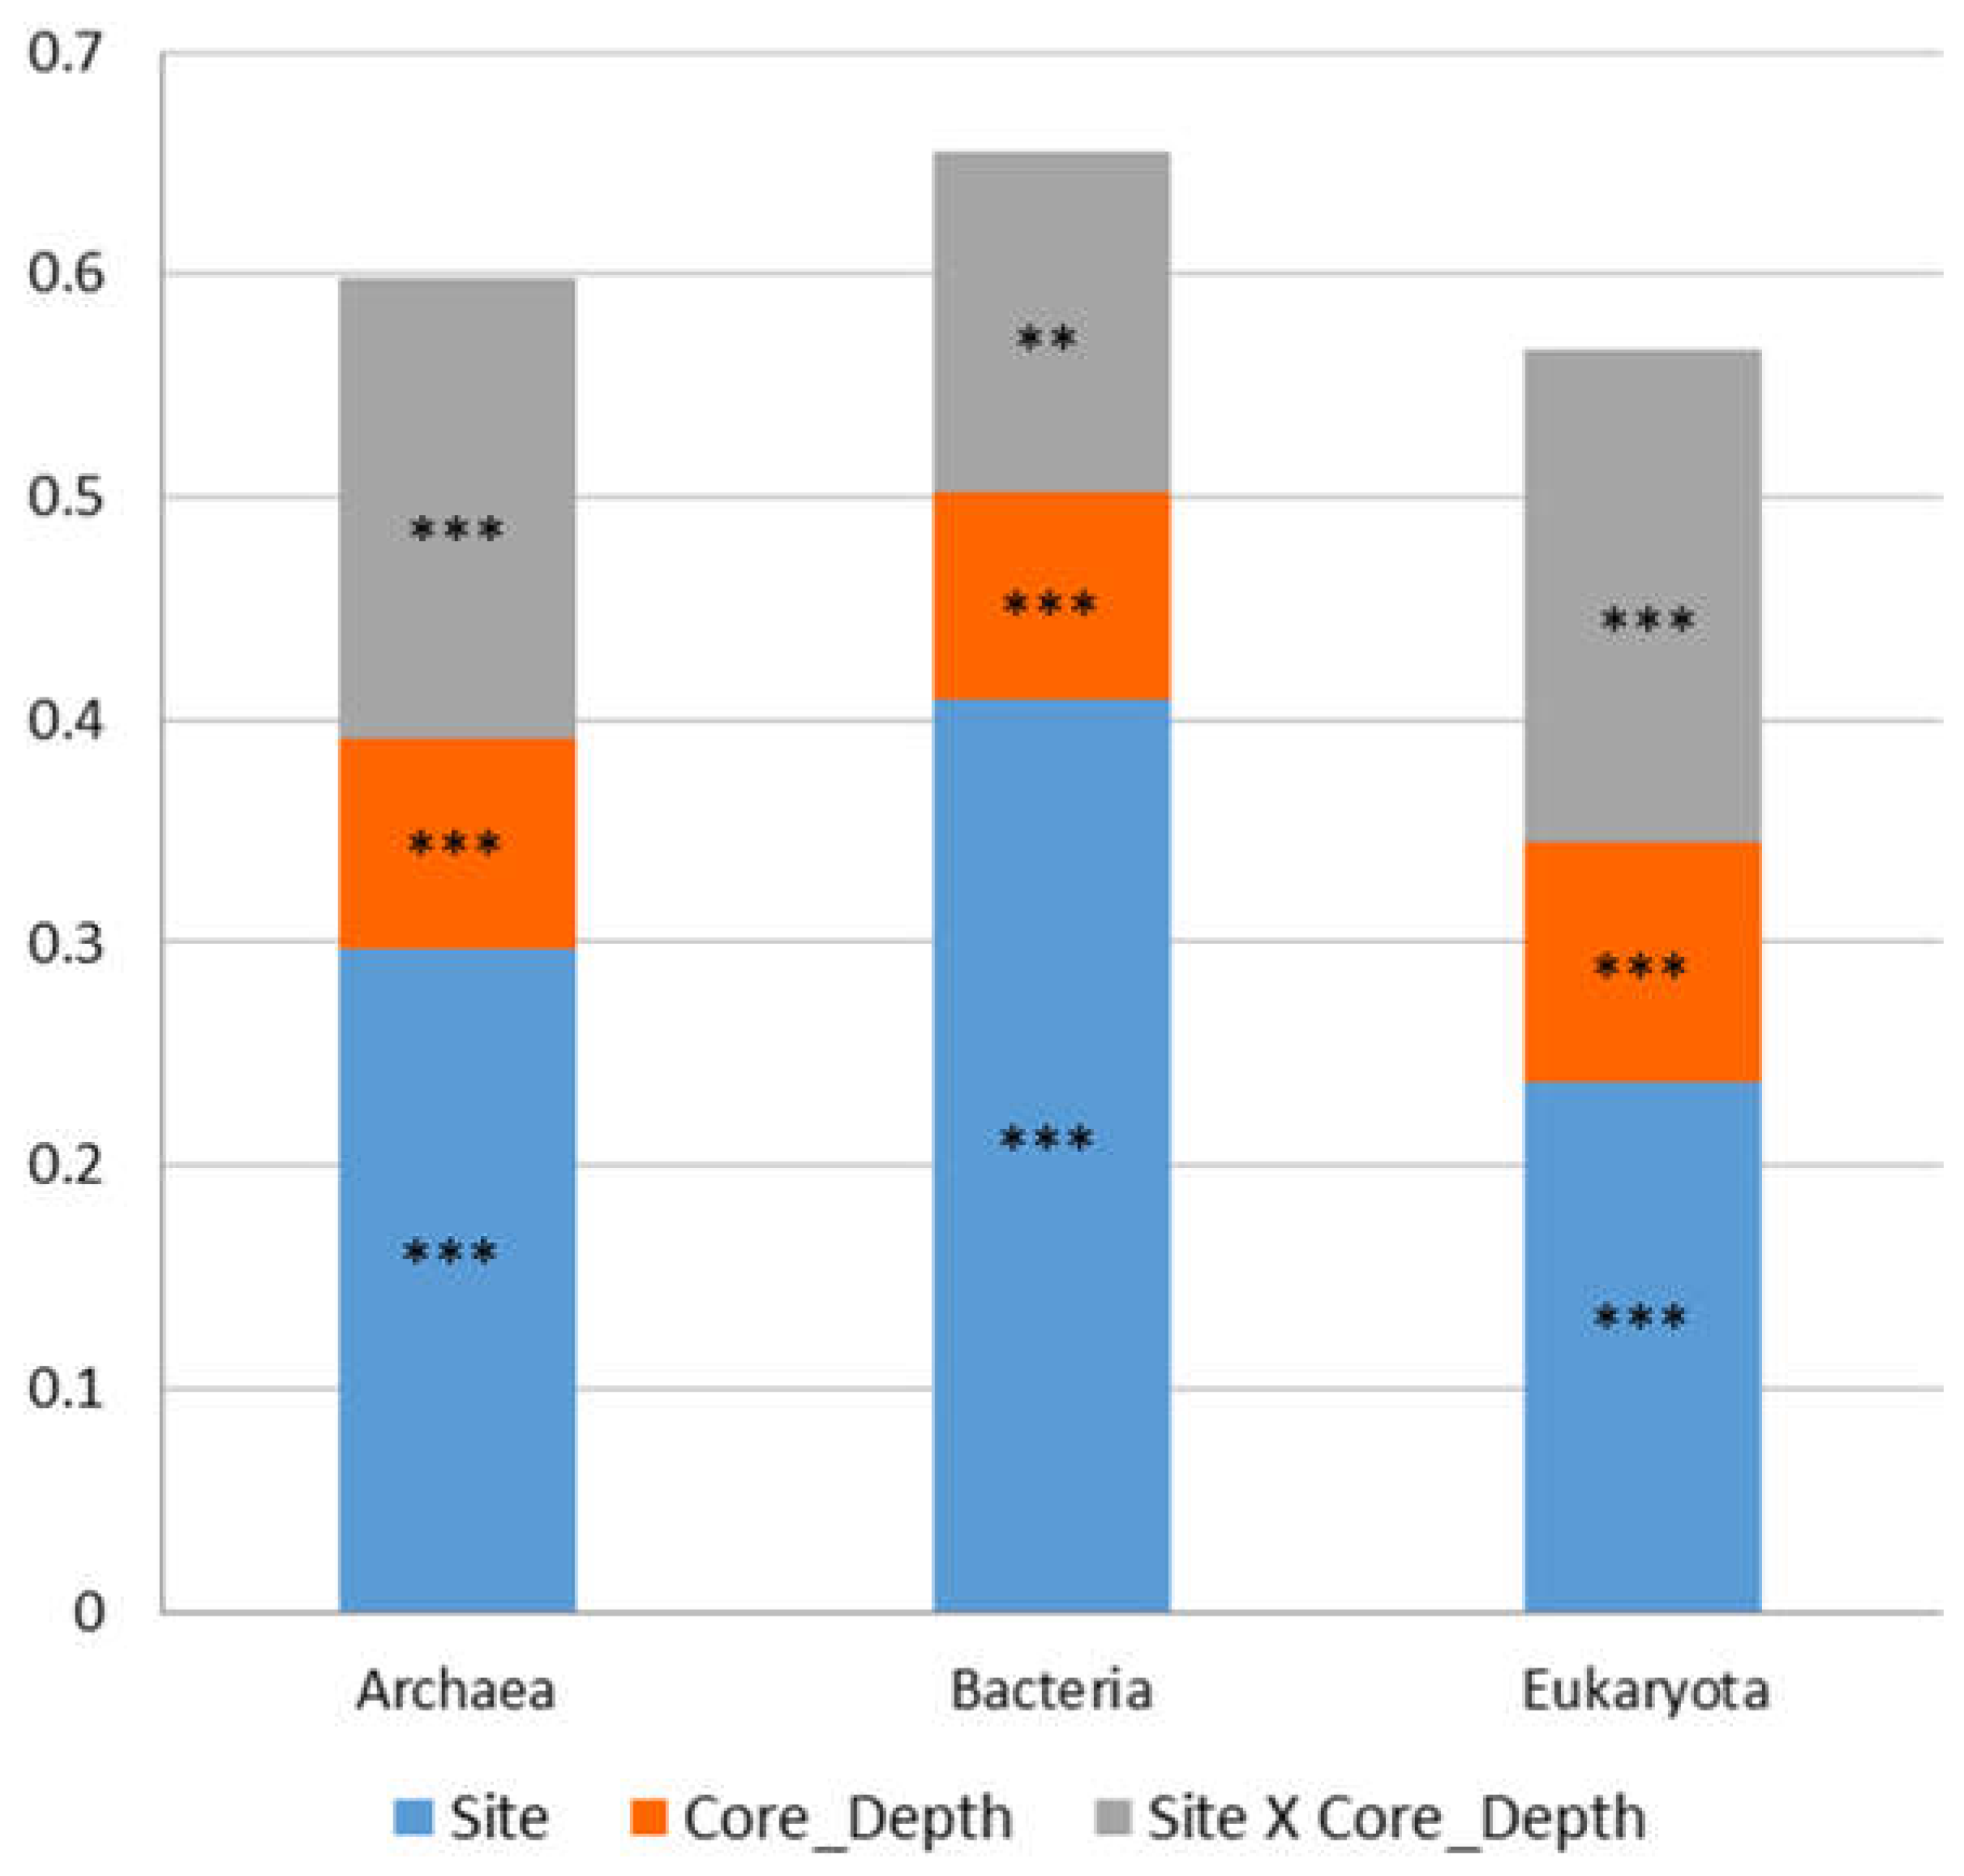
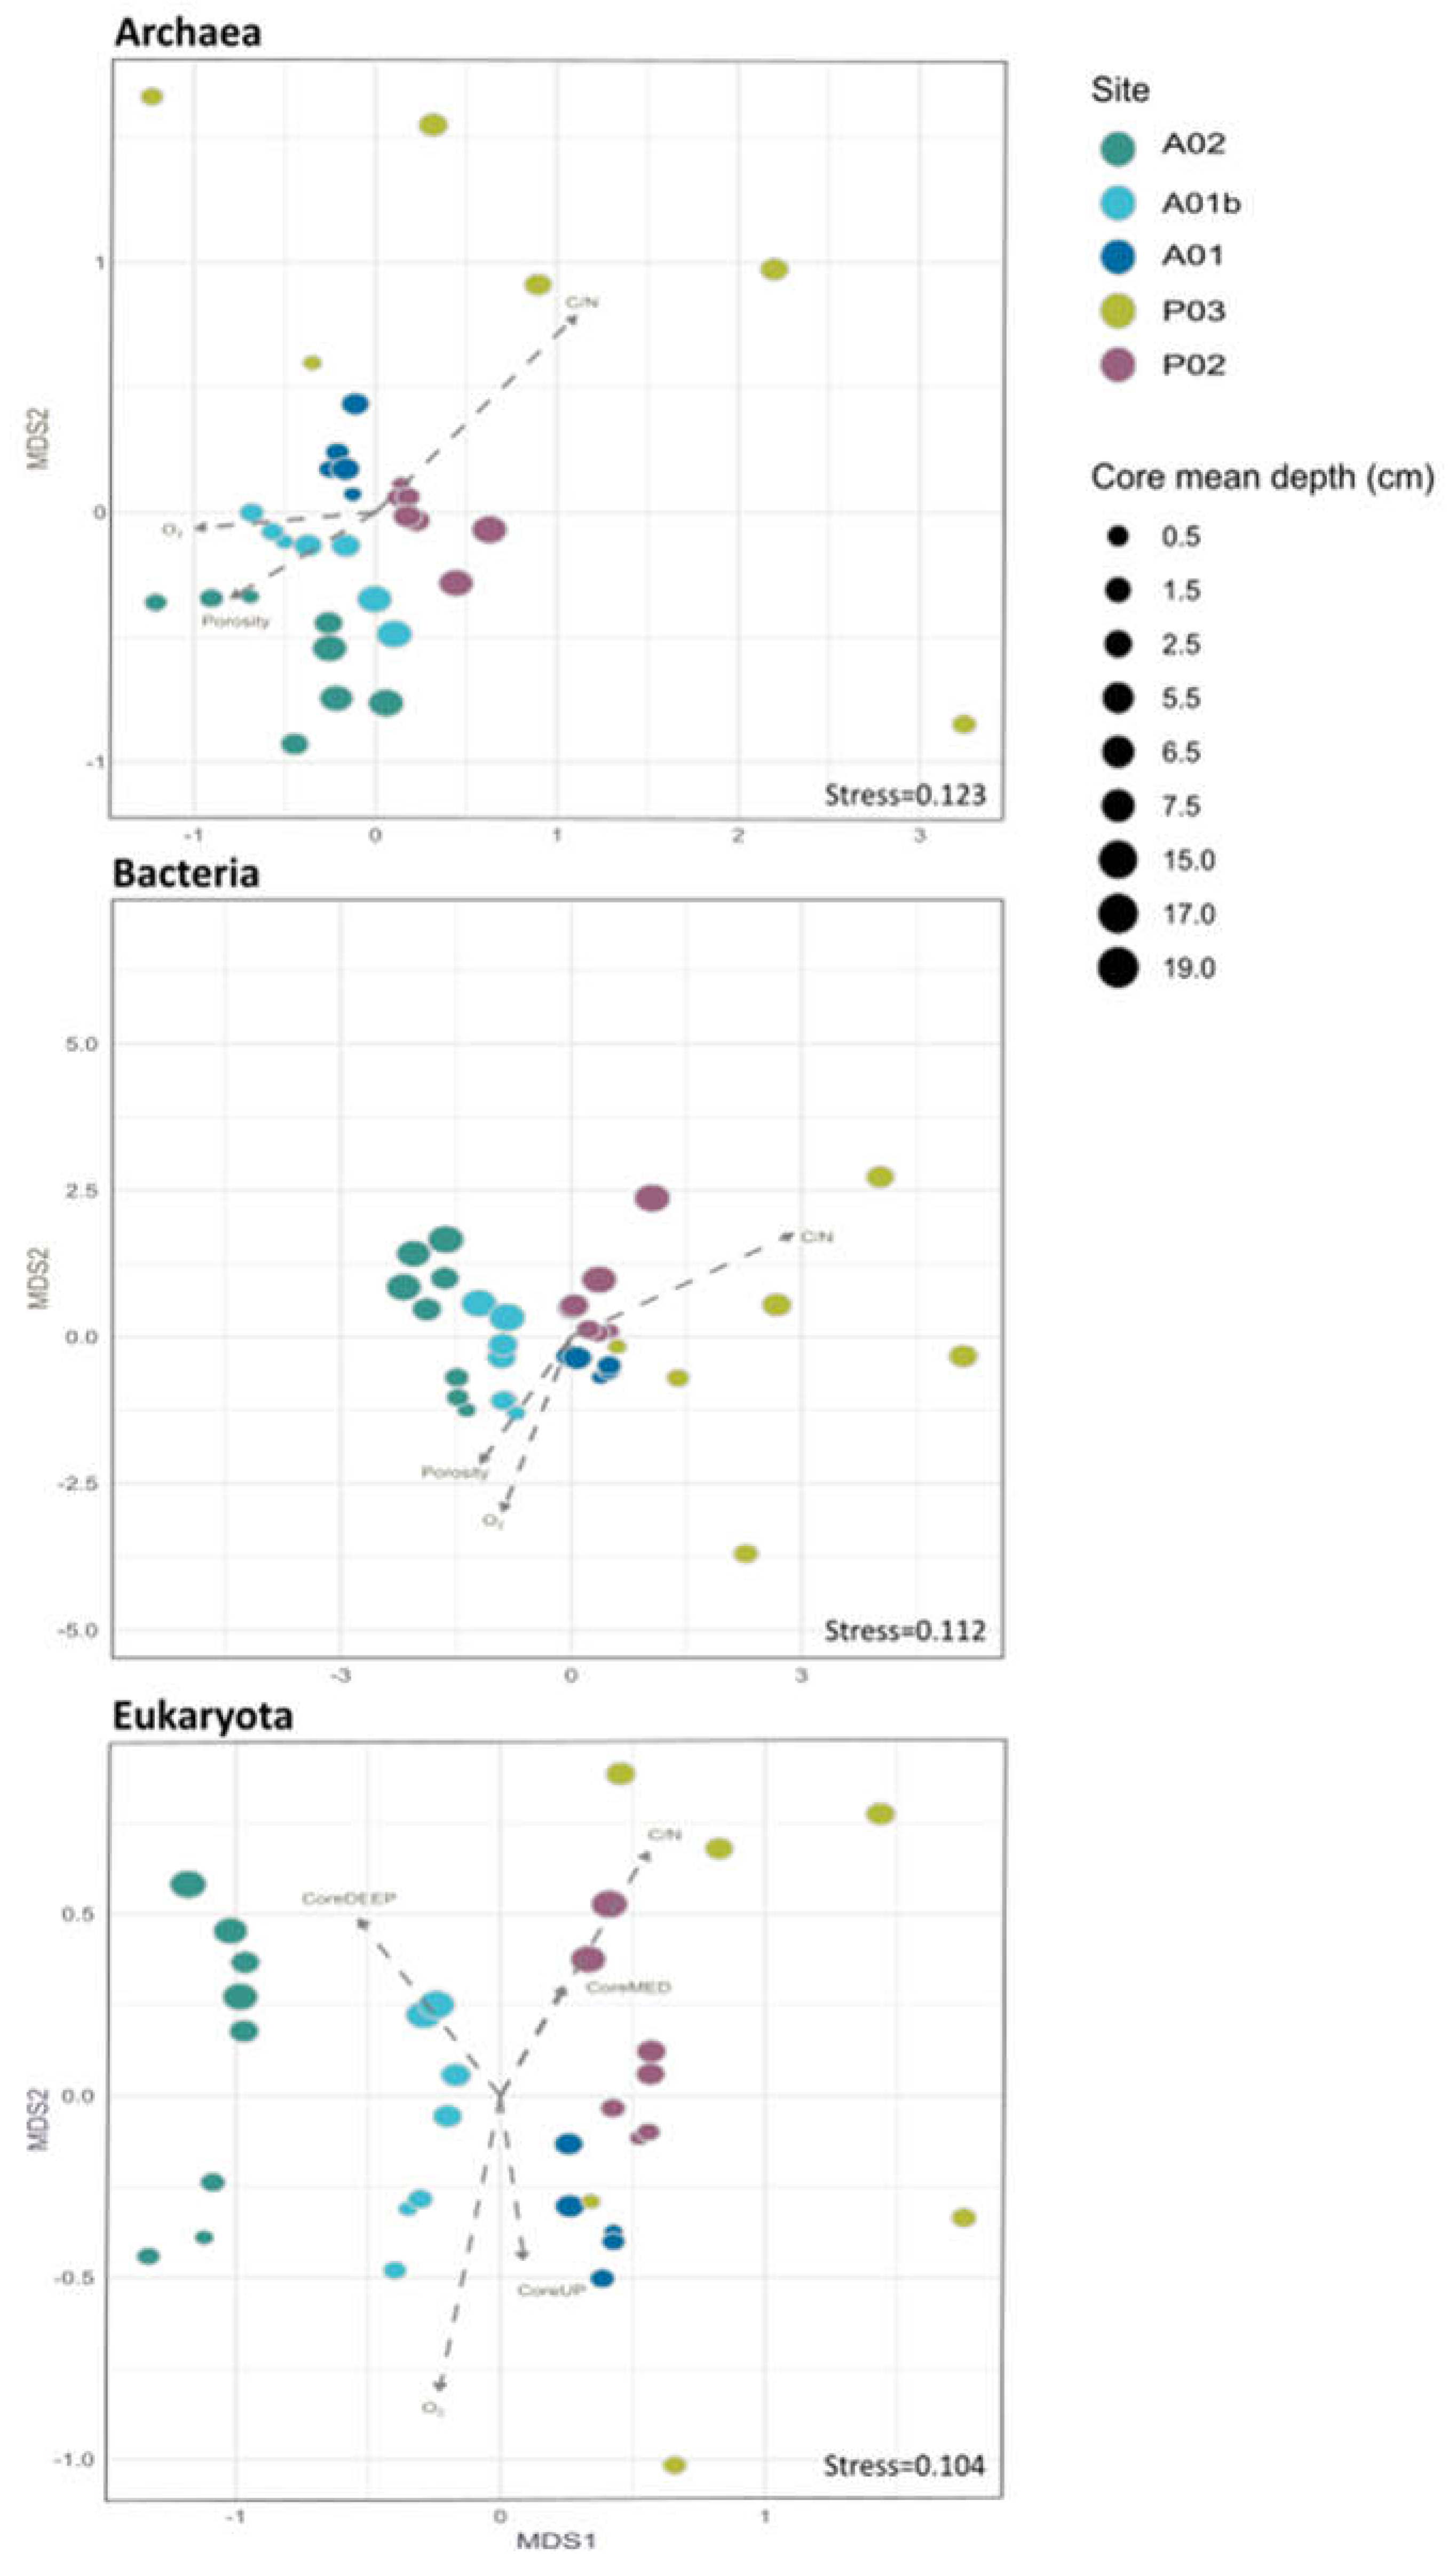
The study characterizes the composition of sediment Bacteria, Archaea and Eukaryotes at five sampling sites along a depth gradient from the Pearl River estuary to the South China Sea (Figure 1, Table S1). The microbiota was compared between sampling sites and core depth and in relation to measured environmental parameters (Table S2). In total, 2,038,667 (993,589 Archaea, 782,063 Bacteria and 263,015 Eukaryota) sequences from 45 sediment samples were analyzed. Following the sequences analysis, 15,220 ASVs were identified (5,478 Archaea, 7,215 Bacteria and 2,527 Eukaryota). We first examined the similarity in microbiota composition among samples. For this purpose, non-metric multidimensional scaling analysis (NMDS) based on Bray-Curtis dissimilarities was calculated for each kingdom. Similar trends were detected in all the kingdoms (Figure 2). The first axis of the ordination was related to the sampling site and samples were organized (left to right) separating the marine sites and estuary sites. Additionally, for each site, samples from deep core layers were separated from the upper ones. Notably, the variance among samples from site P03 was higher compared to other sites across all kingdoms (Figure 2). Multiple regression coefficients between environmental factors and NMDS ordination axes were calculated and indicate some common trends among kingdoms (Figure 2; Table S3). Higher O2 concentration and, for Bacteria and Archaea also porosity were related to negative ordination values, where marine sites were positioned, and higher C/N ratio values were related to positive ordination values, associated with estuary samples. In order to test the contribution and significance of site and core depth and their interaction on variation in microbiota composition, a permutational analysis of variance (PERMANOVA) test was applied. The site, core depth and their interaction were all significant and explained about 67% on average of the variation in each kingdom, where the site was the main factor and explained 33% in eukaryotes, 41% in archaea and 49% in bacteria (Figure 3 and Table S4). Pair-wise test among sites showed significant differences between all the sites (Table S5).
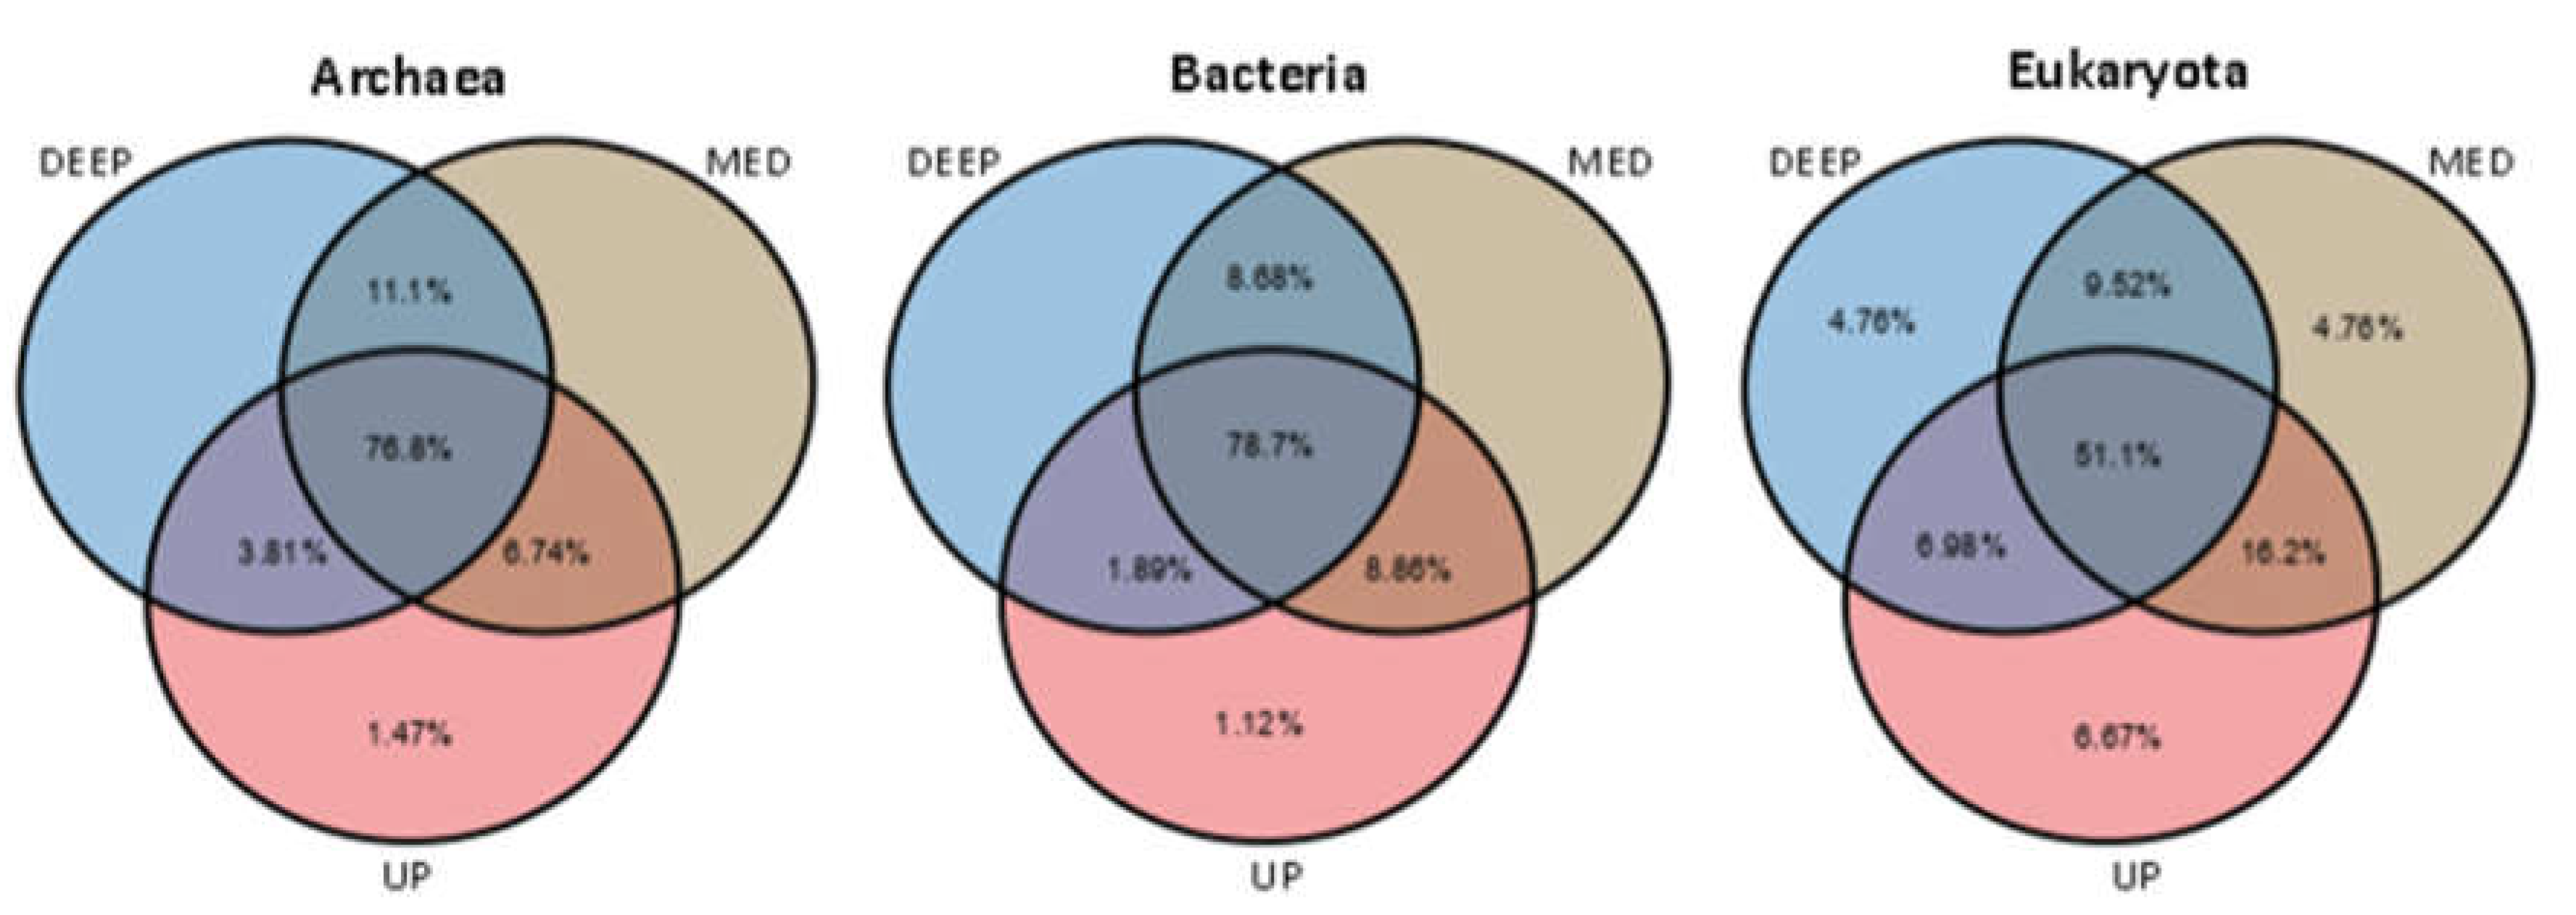
Most of the prevalent ASVs detected (above 10% of samples) appeared at all core depths (UP, MED and DEEP), including 78.7%, 76.8% and 51.1% in Bacteria, Archaea and Eukaryotes, respectively. Unique ASvs of the core depths were negligible and ranged between 0-1.5% in bacteria and archaea and up to 6.7% in eukaryotes. In all cases, the UP layer had the highest percentages of unique ASVs in all kingdoms. As may be expected, higher common ASVs observed between MED and up/deep depths compared to common ASVs between UP and DEEP depths (Figure 4). A comparison of the ASVs between the five sites showed only 7.9% of bacteria, 15% of archaea and 22% of eukaryote ASVs were common to all sites (Figure S1). The unique ASVs in archaea and bacteria were 3.2% and 4.56% in the A02 site, while less than 1% and 2% in the rest sites (respectively). The percentages of unique sequences were higher in eukaryotes at the different sites (2.5-5.7%) except for the P03 site, which had less than 1%.

3.2. Sediment Microbial Taxonomy and Diversity

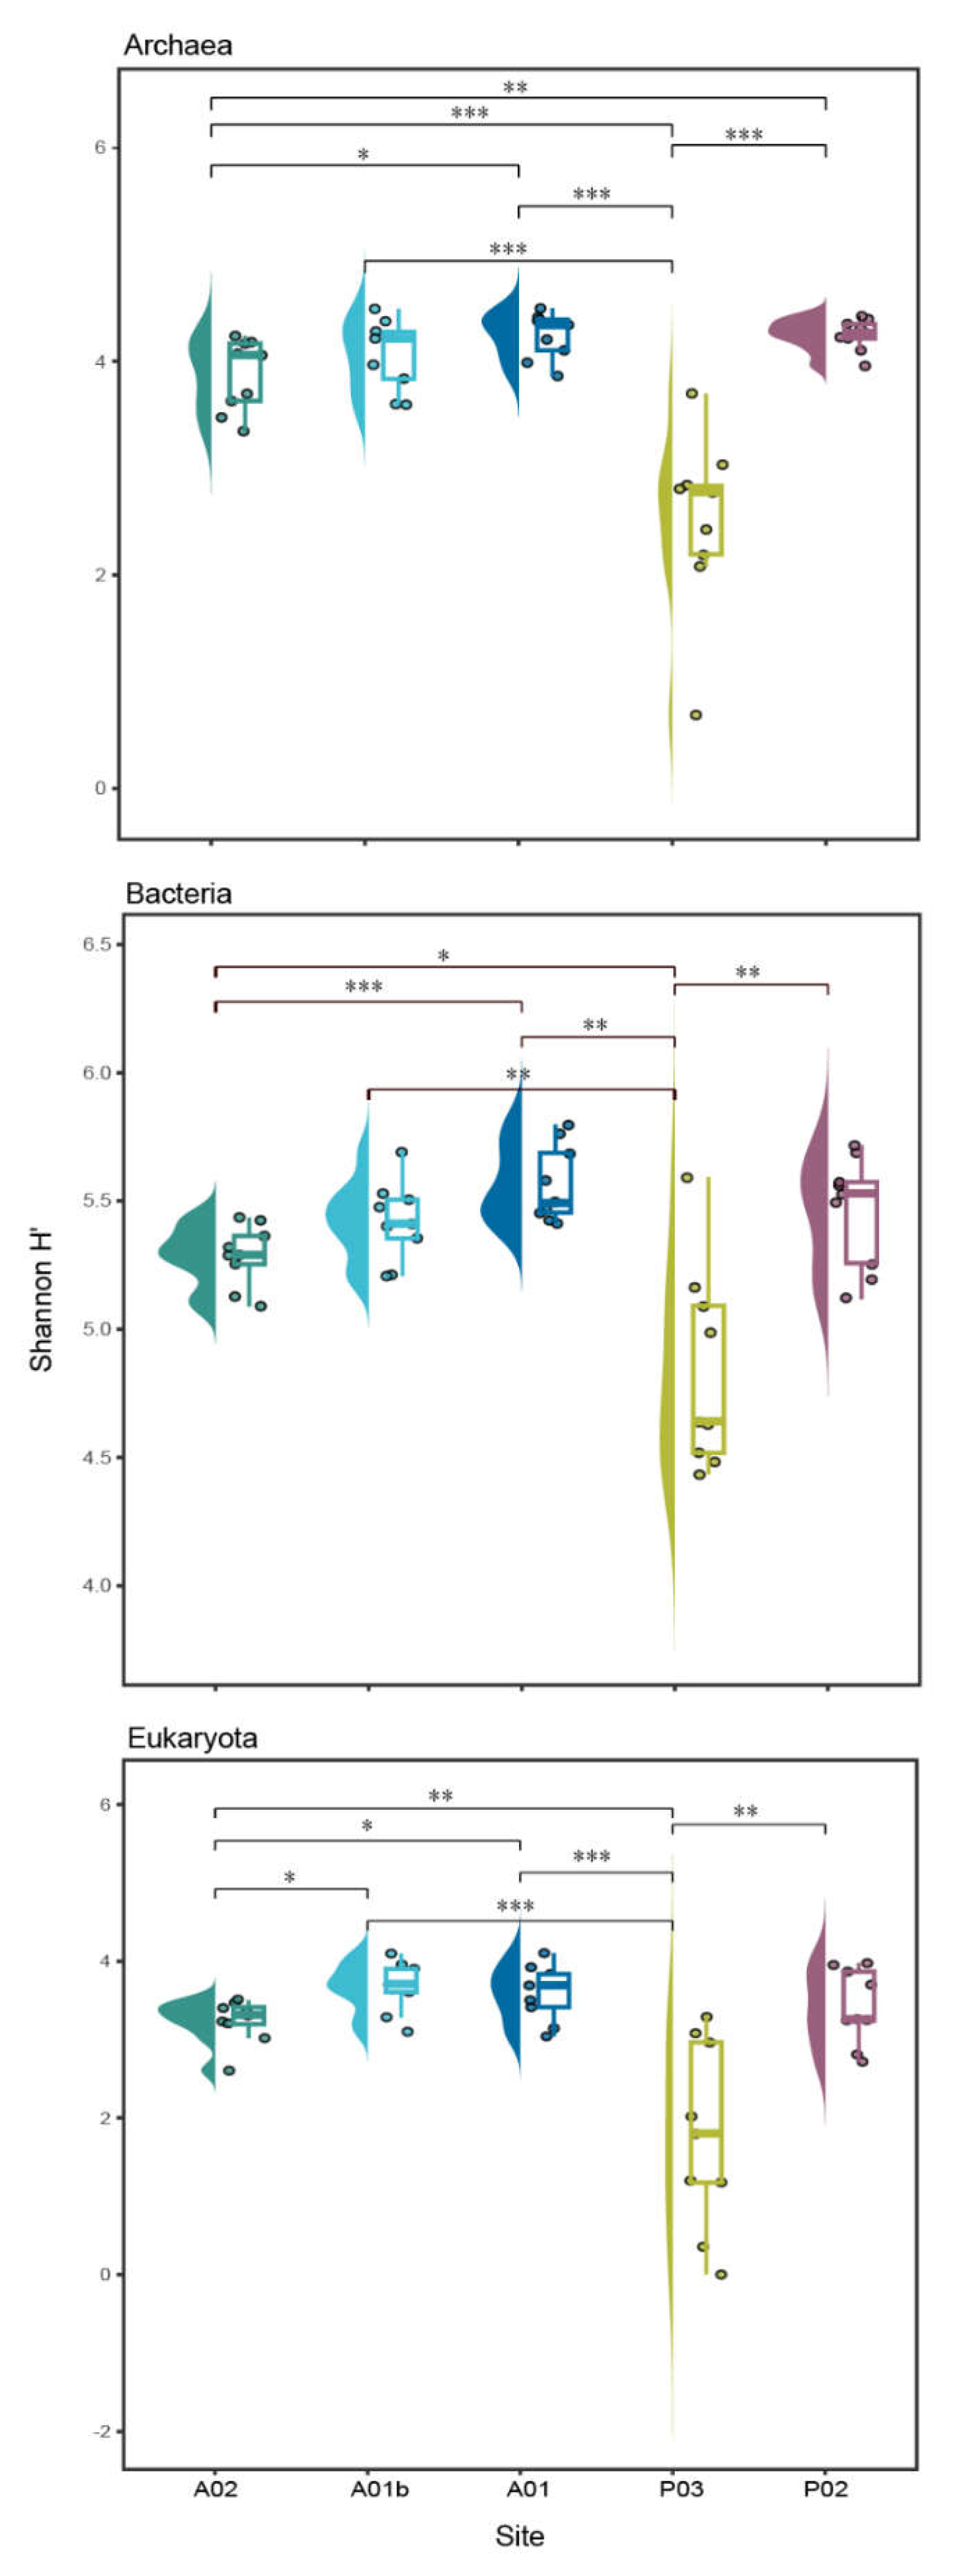
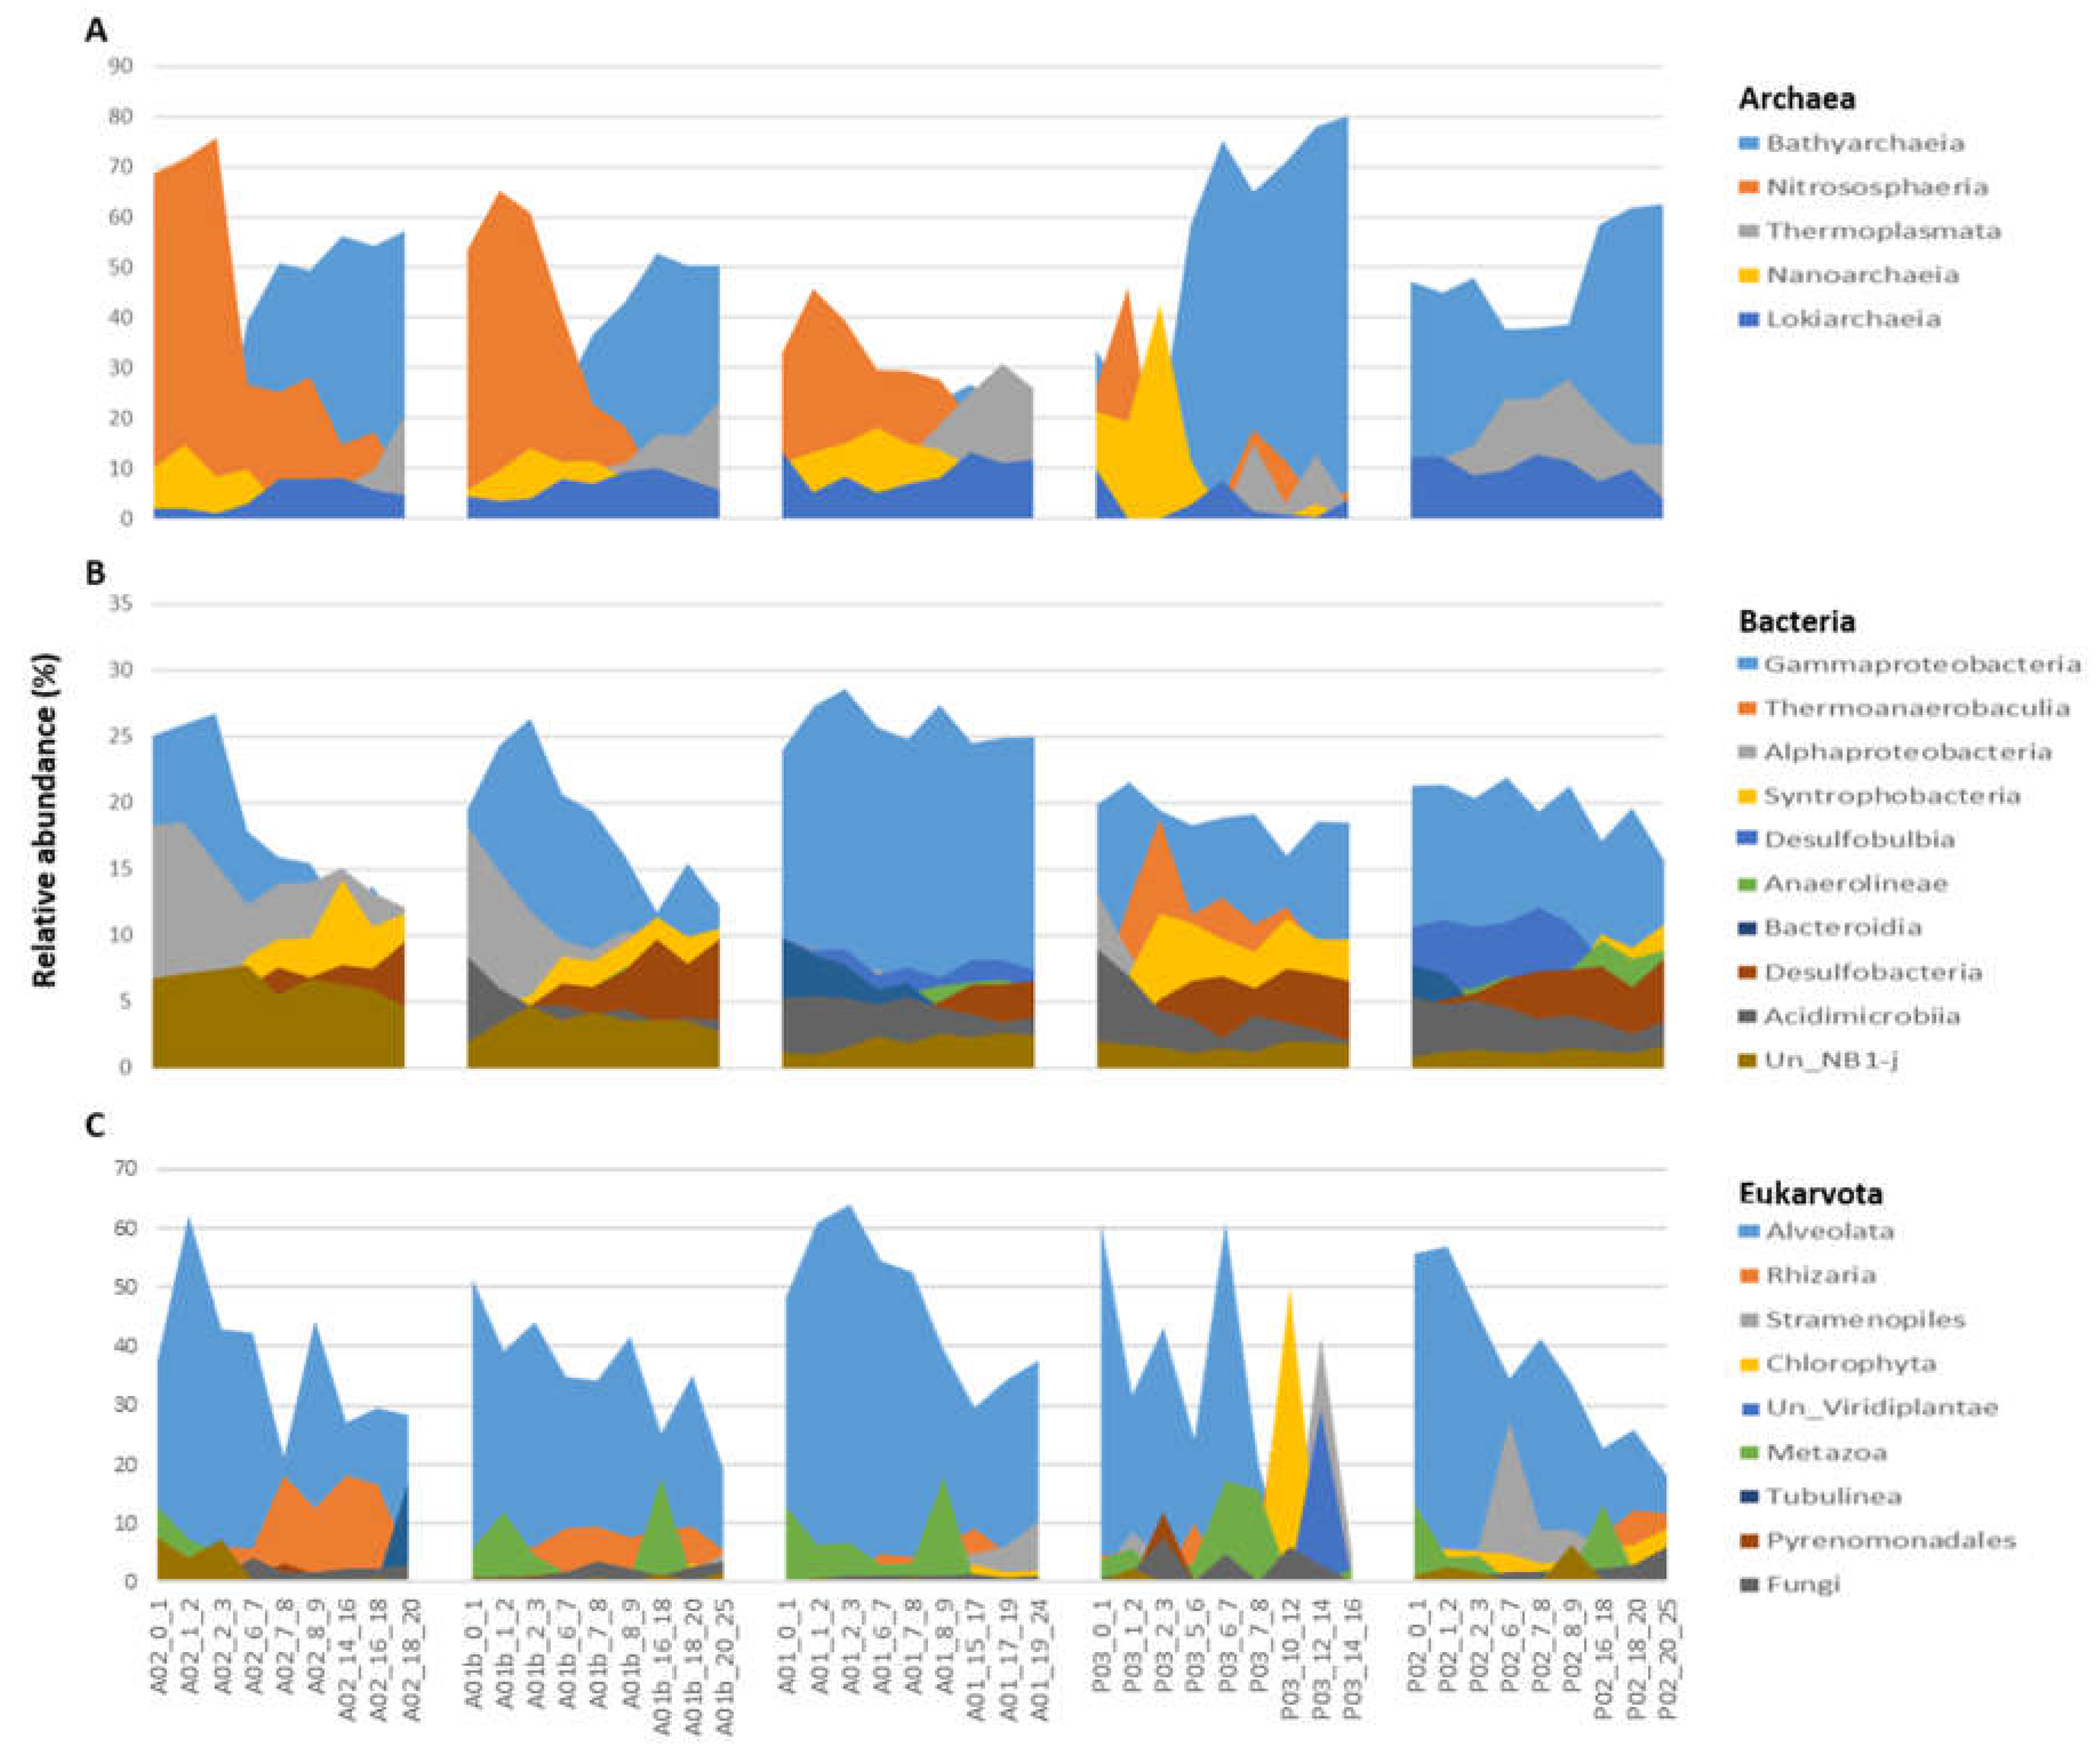
When comparing the diversity index (Shannon H’) between the transect sites, the highest values were observed in the bacteria kingdom. The lowest values of Shannon were indicated at site P03 and were significantly different from all the other sites in the three kingdoms (Figure 5). In contrast to the sites, no significantly difference were observed between the core depths (UP, MED and DEEP), apart from a significant difference in Shannon between UP and DEEP, only in archaea. (Fig. S2). The main taxonomic groups of archaea included 5 main classes Bathyarchaeia, Nitrososphaeria, Thermoplasmata, Nanoarchaeia and Lokiarchaeia, which appeared in all sites and together constituted over 91% of population composition on average. An opposite trend is seen between the sites. At the estuary sites (P03 and P02), Bathyarchaeia were highly dominant (average ~50%) while Nitrososphaeria relative abundance was lower (average ~10%), while at the marine sites (A02 and A01b) Nitrososphaeria dominated and relative abundance of Bathyarchaeia was lower. In addition, there are some trends observed along the core depth, for example, in the sites A02, A01b and A01, the relative abundance of Nitrososphaeria decreased with the core depth while the relative abundance of Thermoplasmata increased (Figure 6A, Table S5a). In Bacteria, Gammaproteobacteria was the main dominant class in all sites. At the marine sits, the relative abundance of Proteobacteria (classes Gammaproteobacteria and Alphaproteobacteria) decreased with core depth while the relative abundance of Syntrophobacteria and Desulfobacteria and Anaerolineae classes had increased. In P03, in contrast to other sites, the Thermoanaerobaculia was the second dominant class while in P02 and A01, the Desulfobulbia. These presented classes constituted together over 70% on average of the bacterial composition (Figure 6b, Table S5b). Identification of Eukaryotic ASVs at a high taxonomic resolution was more challenging. A high percentage of the ASVs (~ 36 %) were identified only at the kingdom level (i.e., unclassified Eukaryota). Most of the identified Eukaryotic ASVs belonged to the SAR group (average of 48% of all the samples), with Alveolata as the dominant group (40% from the SAR). Rhizaria were detected mainly in the marine samples, while Stramenopiles were observed in the estuary sites (Figure 6c, Table S5c).

3.3. Microbial Markers

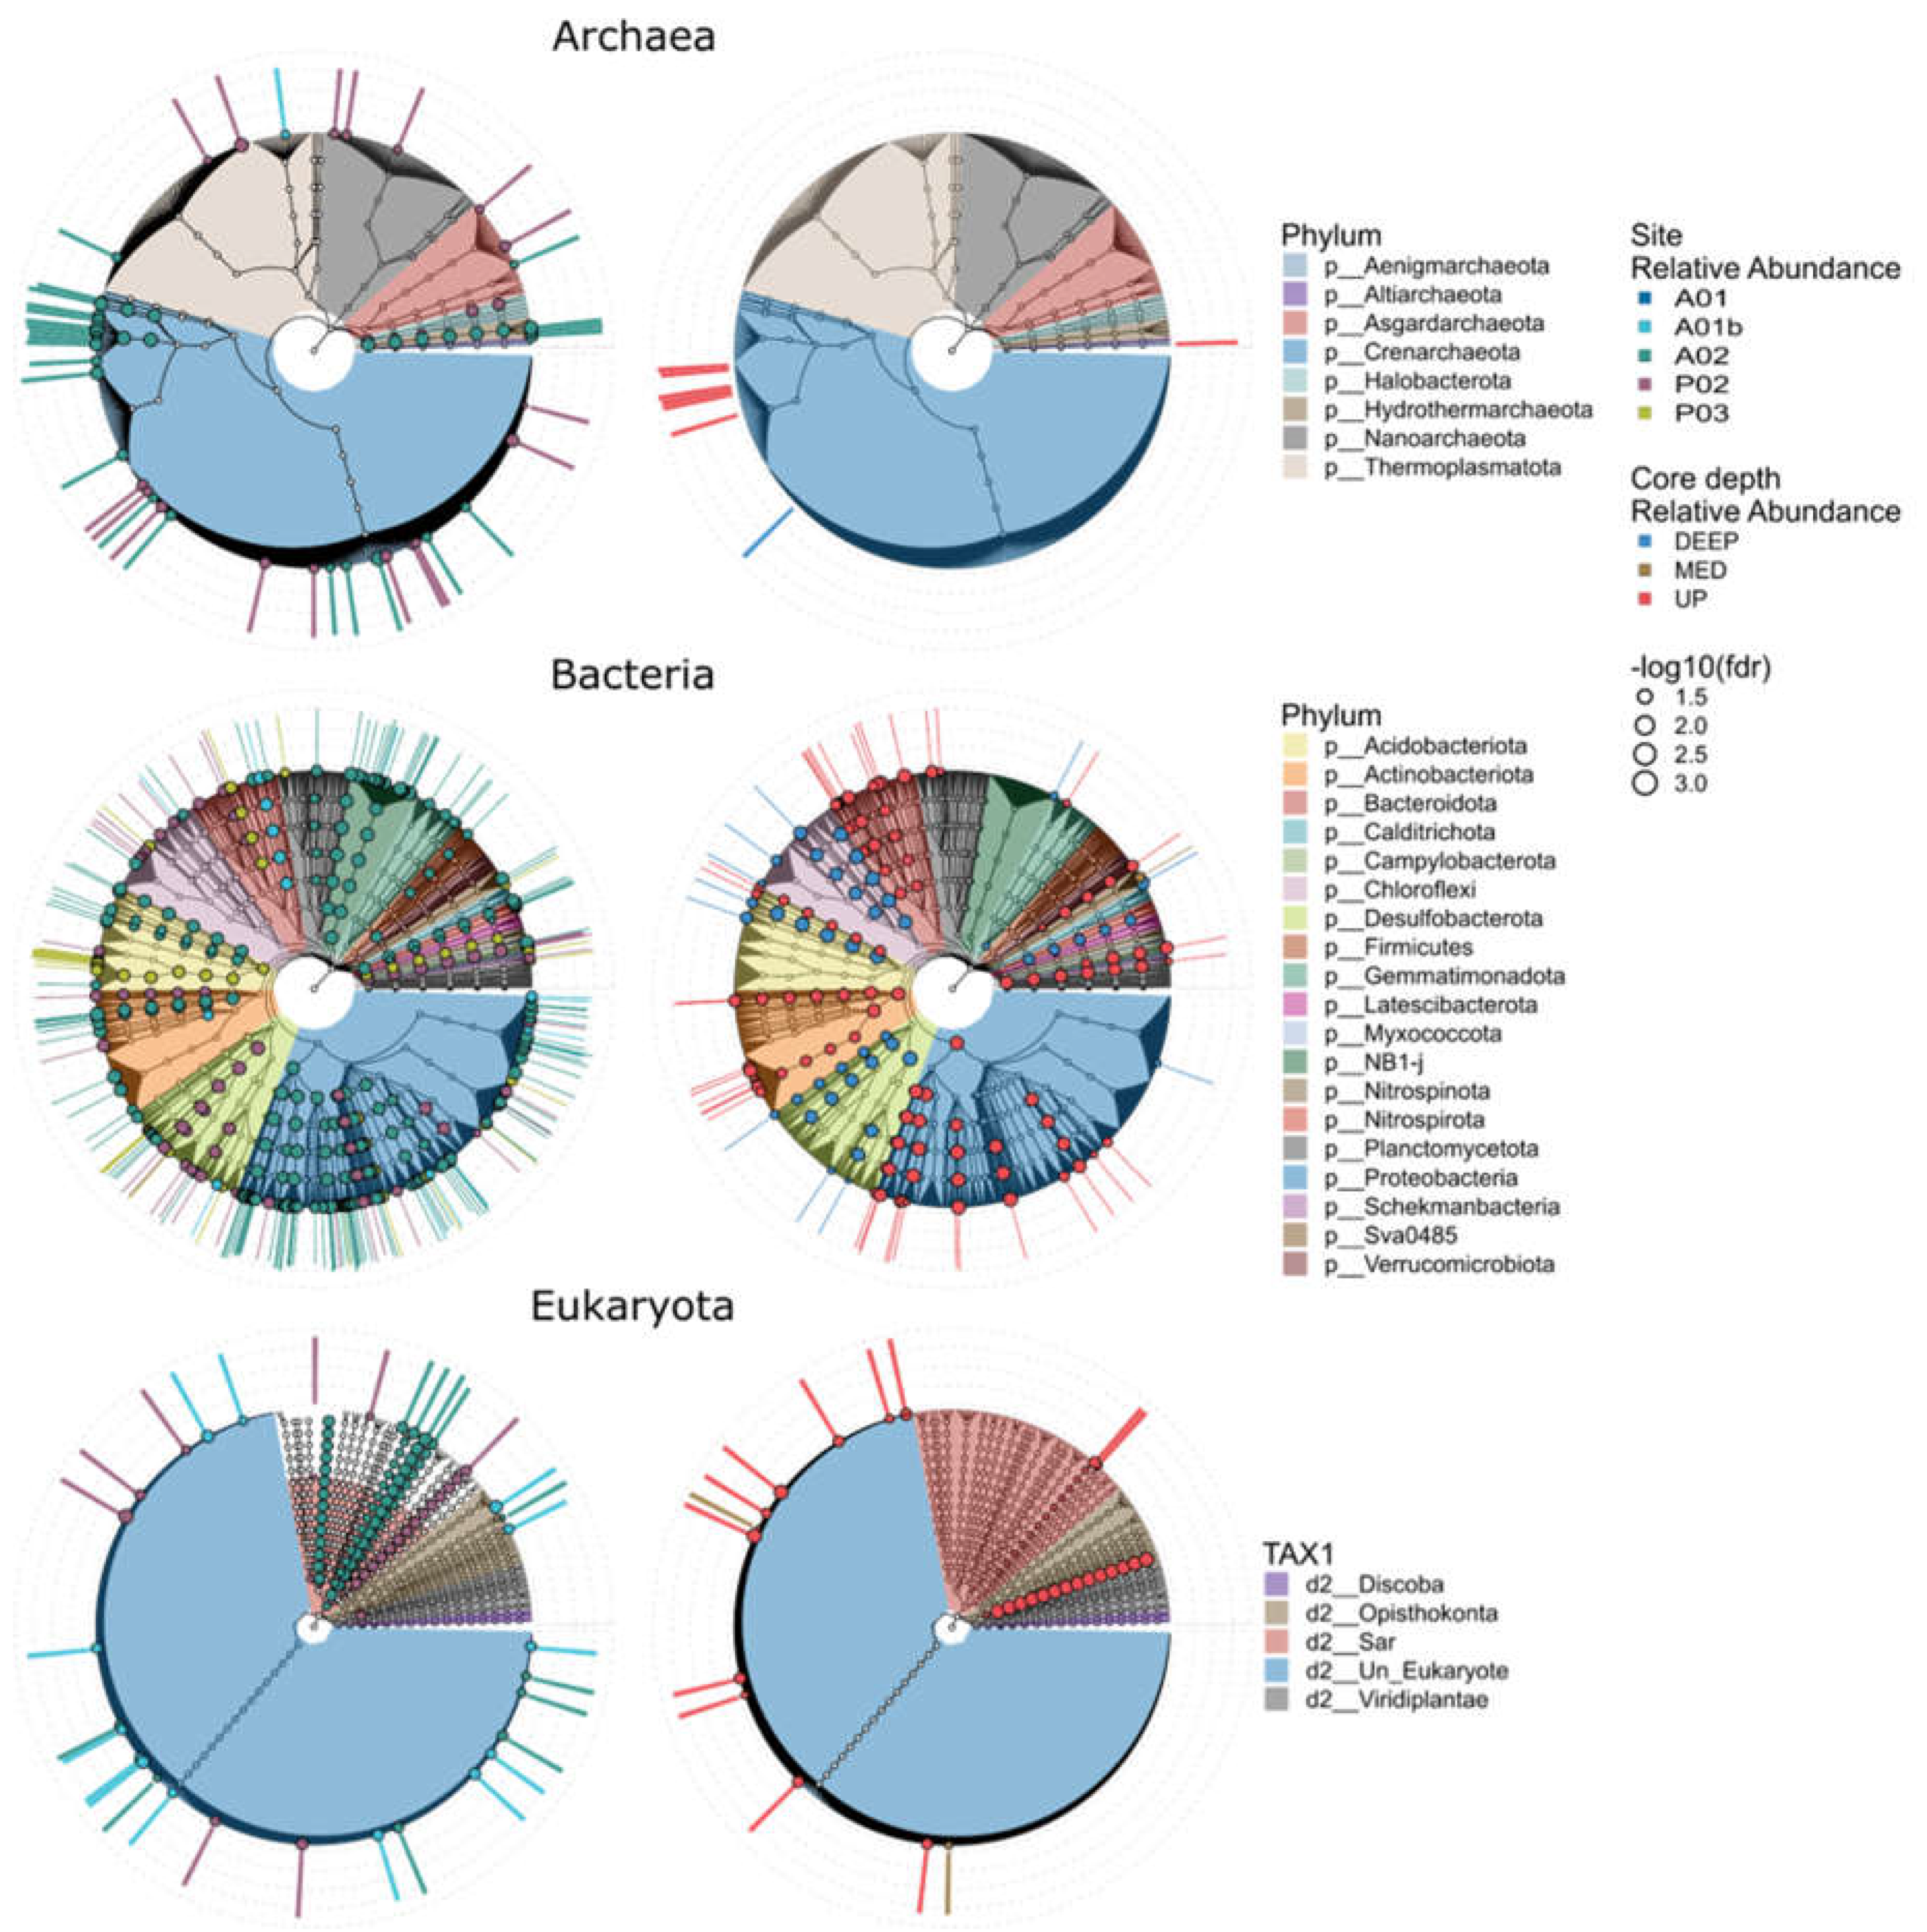
We used Linear discriminant analysis effect size analysis (LEFSe) to search ASVs that exhibit differential abundance patterns in regards to either site identity or core depth. Microbial markers were identified in all kingdoms and included 42, 180 and 32 site markers and 8, 50 and 14 core depth markers for Archaea, Bacteria and Eukaryota, respectively (Figure 7 and Tables S7). Most of the bacterial markers found were associated with site A02, the farthest marine site (Figure 7 and Figure 8). The markers of Archaea were found mainly in the UP layer of the core and belong to the family Nitrosopumilaceae. According to sites, markers belonging to the class Bathyarchaeia were found in sites P02 and A02 sites. Additional markers of A02 belonged to the family Nitrosopumilaceae and the order Hydrothermarchaeales. In Eukaryote, markers were identified mainly in the UP core layer and for sites P02, A02 and A01b, while most of the ASVs belonged to SAR (i.e., Alveolata and Stramenopiles and Rhizaria). In contrast to the previous kingdoms, bacterial markers were found in the DEEP layer as well. For example, in UP core layer, representatives belonged to phylum Actinobacteriota, Bacteroidota and Proteobacteria (gammaproteobacteria and alphaproteobacteria) and in the DEEP layer, Chloroflexi, Desulfobacterota and Acidobacteriota. Markers were found mainly in sites A02 (e.g., Proteobacteria (Alphaproteobacteria, Gammaproteobacteria) and NB1-j), P03 (Acidobacteriota) and P02 (Proteobacteria and Desulfobacterota). In order to identify ASVs significantly associated with chemical properties (e.g., C/N, TN, NH4+, O2) linear decomposition model (LDM) analysis was performed. Figure 8 shows the correspondence between site/core depth specificity and sediment chemical parameters. We found in total 153 ASVs correlated with sites: 23, 124 and 6 (Archaea, Bacteria and Eukaryote, respectively) and with core depth: 12 markers for bacteria and one eukaryote. Common ASVs were identified in four sites and included only the three parameters C/N, NH4+ and TN. Most markers were found in site A02 in all kingdoms and were correlated mainly with C/N and NH4+. ASVs shared between archaea and chemical parameters were found only in sites A02 and P02, with most belonging to Crenarchaeota. Site P03 included only bacterial markers with the highest relative abundance, mainly class Desulfobacteria. Markers related to core depth were identified in the upper (mostly) and deep layers and were mainly correlated with C/N and NH4+. In contrast to the site’s markers, we found in the upper layer markers that are related to the parameters O2 and Fe+2 as well. The most significant markers were Desulfobacteria with C/N in the deep layer and SAR correlation with O2 in the upper layer.

4. Discussion

Microbes are essential, inhabiting every estuarine environment, water and sediment and carrying out biogeochemical processes and ecological functions that affect and shape the environment. Previous studies of the PRE area examined the chemical and physical conditions in the water column and sediment including seasonal variations (Harrison et al., 2008; Cai et al., 2015; Zhang et al., 2013). The samples in this study were collected during the summer season when the amount of nutrients reaching the PRE is high, leading to high organic load and hypoxic conditions (Harrison et al., 2008; Li et al., 2020; Yu et al., 2021). Our study describes the composition and diversity of PRE sediment microbiota of the three kingdoms in relation to site, core depth and physicochemical environmental parameters. The chosen sites differed in their proximity to the mouth of the river and their bottom depth, and therefore subject to different levels of disturbance leading to the formation of different physicochemical conditions, also affecting the characteristics of the sediment core layers.
Locations of the sites (nearshore to offshore) and core depths were the two dominant drivers separating the microbial communities demonstrating a strong link between the community structure and their biogeochemical functions. The first axis of ordination of the NMDS analysis appears to be related to the locations of the sampling sites (Figure 2), which explains the variation in the three kingdoms by using the PERMANOVA test (Figure 3). As heterotrophic processes are fueled by organic matter, the amount of organic matter deposit on the seafloor would also affect the locations of the redox zones. The nearshore stations close to the estuary (P02 and A01) have higher organic carbon contents in the surface sediments compared to the offshore sediments (A01b and A02) (Table S2). In the marine stations (A01b and A02) the values NH4+ and Fe on surface sediment were lower compared to the estuary stations (P02 and A01) as reported in Huang et al. (2021) in PRE as well. The C:N ratios, which are indicators of the freshness of the organic matter (Lamb et al., 2006; Owen, 2005), also suggest that organic matter quality separates the microbial community structures (lower values meaning fresher organic matter that is planktonic origin and higher values meaning relatively refractory and terrestrial origin) (Table S2, Figure 2). The site P03, however, is an outlier, with remarkably low organic carbon content and porosity (Table S2). The sediments there were a mixture of sandy and muddy sediments, which suggest that the sediments have been disturbed (non-steady state sedimentation). This might explain the strong dissimilarity of the microbial communities at different core depths of site P03 (Figure 2), which were also significantly different from all the other sites (Figure 5) (see discussion later).
The second axis of the ordination in the NMDS analysis is likely related to core depth (Figure 2), consistent with the vertical zonation of microbial redox reactions. Microbial heterotrophic reactions typically follow an order of the energy yield of the reaction (Froelich et al., 1979): aerobic respiration (using O2) is the most favorable and thus would occur in the surface sediments, below which when O2 is depleted, Fe manganese and iron reductions, denitrification, sulfate reduction, and methanogenesis would occur one below another, until all reactive organic matter is exhausted. This explains the decrease of O2 and POC with core depth (aerobic respiration), production of Fediss and NH4+ in the anoxic sediment from degradation of organic matter, separating the microbial communities of different core depths (Figure 2).
These two factors, site and core depth, were indeed key drivers influencing the composition explaining 56-65% of microbiota variance among samples for all three kingdoms (Figure 3 and Table S4). Previous studies that examined the effect of site depth and core depth of marine sites (different regions and depths) also found site and core depth as the main drivers (Lalzar et al., 2023, Rubin-Blum et al., 2022). However, the percentages of explained variance in those studies were much lower, indicating a very strong impact of the river mouth on the nearby sites, including the marine sites. The fact that core depths and locations (related to environmental gradient) affect the microbial composition suggests a tight link between microbes and their biogeochemical environments. Therefore, microbial taxa might provide insights into the variability of biogeochemical reactions in the sediments, which are driven by environmental gradients.
The depth of O2 penetrations (OPD) into marine sediments is among the most important parameters determining sediment biogeochemical processes. It controls the vertical zonation and rates of various organic matter mineralization pathways (Li et al. 2018a; Li et al. 2018b), organic carbon reactivity and the fluxes of dissolved substance across the sediment-water interface (Li et al. 2012; Li & Katsev 2014). In sediments, oxygen continues to be consumed and is typically depleted from within a few millimeters in coastal sediment to several centimeters in pelagic sediments (Li et al. 2012; Rasmussen and Jørgensen, 1992). The anoxic sediments below the OPD allow diverse anaerobic heterotrophic carbon mineralization processes (e.g., denitrification, manganese reduction, iron reduction, sulfate reduction, methanogenesis) and chemoautotrophic reactions (e.g., anaerobic methane oxidation) (Hu & Burdige 2007, Wu et al., 2006). Previous studies have shown how a change in the oxygen level causes a shift in the composition of the microbial communities (Spietz et al., 2015; Guo et al., 2022; Broman et al., 2017). In this study, oxygen conditions varied greatly between the upper and lower core layers but also between the different sites (Table S2). Our results suggest that oxygen concentration has a greater effect on the upper sediment layer and the marine sites, which led to a significant markers presence of eukaryote representatives (Bacillariophyta and Alveolata), aerobic archaea (ammonia-oxidizing archaea (AOA) Nitrosopumilaceae and representatives bacteria of Acidimicrobiia in this layer (Figure 7), also noted to be related to oxygen conditions in previous studies (Guo et al., 2022; Stahl & De La Torre, 2012). Additional bacterial markers of the deeper layer represented anaerobic bacteria including Anaeromicrobium, Desulfobacteria and facultative bacteria belonging to Gemmatimonadota (Ohore et al., 2022).
Our microbial community results also provide insights into the sediment nitrogen cycle. Nitrososphaeria (95% of the ASVs belong to order Nitrosopumilales) were highly abundant in the PRE sediments (Zou et al., 2020; Liu et al., 2014; Xie et al., 2014), especially at the marine sites with a decreasing trend in correlation to the core depth (Chen et al., 2020). Nitrososphaeria are Archaea renowned for their aerobic ammonia oxidation (AOA) activity in soils and marine environments (Tourna, et al. 2011). Indeed, Nitrososphaeria relative abundance had decreased with core depth (Figure 6), in parallel with loss of oxygen, that measured zero in all samples below 7 mm (in most samples below 3 mm, Table S2 and Zhou, 2022). However, relative abundance of Nitrososphaeria remained highly dominant in most samples at the anoxic core depths (Table S6a). As we have sampled DNA, we should consider that the source of the Nitrososphaeria at anoxic depth sediment may be residual following deposition of sediment on top of older layers. Conversely, considering their high dominance, these Nitrososphaeria may represent species not obligatory to AOA.
ASVs of the Desulfobacterota (classes Desulfobulbia and anaerobic Syntrophobacteria), sulfate-reducing bacteria (SRB) which are important in the sulfur cycle, were identified as markers for both estuary sites. Desulfobacteria increased with core depth at all sites, consistent with the classic redox sequence that sulfate reduction would occur in deep sediments where other oxidants are exhausted (Jiang et al. 2009). In anoxic environments, such as estuarine sediments, SRBs are major contributors to carbon and sulfur cycles (Nealson, 1997; PD, 1986; Jiang et al., 2009). The fact that Desulfobacteria abundance is similar across the salinity gradient suggests salinity (sulfate concentrations in the overlying waters) is not the major control of sulfate reduction in the deeper sediments (Figure 6). Additionally, Desulfobacteria markers were correlated with C/N, NH4+ and TN parameters in the estuary sites (Figure 8 and Table S8). These results support the hypothesis that Desulfobacteria may be a good indicator of disturbed habitat (such as aquaculture) or environmental degradation (Rubin-Blum et al., 2022; Stoeck et al., 2018; Li et al., 2022). Gammaproteobacteria followed by Alphaproteobacteria (in marine sites) or Desulfobacteria (in estuary sites) which were dominant in the sediment samples, known as the main components of the marine sediment (Petro et al., 2017; Lalzar et al., 2023; Vipindas et al., 2022) and estuary area (Waidner & Kirchman, 2005; Baker et al., 2015). The dominance of Gammaproteobacteria was reported in coastal and estuarine water samples as well (Ghosh & Bhadury, 2019; Feng et al., 2009).
Among sites, P03 was most divergent from all other sites in terms of composition and diversity (Figure 2, Figure 5 and Figure 6). At site P03, the microbial diversity, in all kingdoms, was significantly lower for all kingdoms. A decrease in microbial diversity could indicate critical disturbance as previously described (Moffett et al., 2003; Liu et al., 2020). Variation in composition between core depths for this site was markedly higher than in other sites (Figure 2). Additionally, marker populations of this site were characterized by high relative abundance (Figure 8). Surprisingly, values of the main chemical parameters (e.g., oxygen, C/N, TN) were not apparently extreme compared to other sites. However, the porosity values were the lowest at the P03 site. The effect of porosity and pore size distribution can properly account for shifts in microbiota composition (Hampel et al., 2022; Rubin-Blumet al, 2022). Therefore, porosity (probably influenced by the mixture of sandy and muddy sediments) may explain in part the dramatic difference in composition for site P03. However, the uniqueness of this site remains unexplained.
This study marked proximity to the PRE as the main factor controlling the composition of microbiota in the sediment not only inside the PRE but also at marine sites in the region. Furthermore, we found the effect is similar in size for Bacteria, Archaea and Eukaryota, indicating probable dramatic shifts in microbial activity hence all biogeochemical processes in the sediment. The samples from different sites were characterized by specific marker populations, in turn linked to variations in specific chemical properties of the sediment, particularly C/N ratio and NH4+ concentration. Nevertheless, microbiota composition at specific sites may be related to factors unique to the site (chronic or transient) that should be further uncovered. Therefore, microbiota composition monitoring of PRE may contribute to ongoing efforts for regional control over marine health.

Supplementary Materials

The following supporting information can be downloaded at the website of this paper posted on Preprints.org.

Acknowledgments

The project is supported by the Southern Marine Science and Engineering Guangdong Laboratory (Guangzhou) (SMSEGL20SC01). We thank Lei Zhou (HKUST), Xingyu Yang (HKUST), and the Captain and crewof Haike 68 for assistance in sampling. We thank Dr. Yoni Gavish for the help with the data and analyses.

References

  1. Baker, B. J., Lazar, C. S., Teske, A. P., & Dick, G. J. (2015). Genomic resolution of linkages in carbon, nitrogen, and sulfur cycling among widespread estuary sediment bacteria. Microbiome, 3, 1-12.
  2. Benjamini, Y., & Hochberg, Y. (1995). Controlling the false discovery rate: a practical and powerful approach to multiple testing. Journal of the Royal statistical society: series B (Methodological), 57(1), 289-300.
  3. Bolleter, W. T., Bushman, C. J., & Tidwell, P. W. (1961). Spectrophotometric determination of ammonia as indophenol. Analytical Chemistry, 33(4), 592-594.
  4. Broman, E., Sjöstedt, J., Pinhassi, J., & Dopson, M. (2017). Shifts in coastal sediment oxygenation cause pronounced changes in microbial community composition and associated metabolism. Microbiome, 5(1), 1-18.
  5. Cai, P., Shi, X., Hong, Q., Li, Q., Liu, L., Guo, X., & Dai, M. (2015). Using 224Ra/228Th disequilibrium to quantify benthic fluxes of dissolved inorganic carbon and nutrients into the Pearl River Estuary. Geochimica et Cosmochimica Acta, 170, 188-203.
  6. Cai, W. J. (2011). Estuarine and coastal ocean carbon paradox: CO2 sinks or sites of terrestrial carbon incineration?. Annual review of marine science, 3, 123-145.
  7. Callahan, B. J., McMurdie, P. J., Rosen, M. J., Han, A. W., Johnson, A. J. A., & Holmes, S. P. (2016). DADA2: High-resolution sample inference from Illumina amplicon data. Nature methods, 13(7), 581-583.
  8. Callahan, J., Dai, M., Chen, R. F., Li, X., Lu, Z., & Huang, W. (2004). Distribution of dissolved organic matter in the Pearl River Estuary, China. Marine Chemistry, 89(1-4), 211-224.
  9. Caporaso, J. G., Lauber, C. L., Walters, W. A., Berg-Lyons, D., Lozupone, C. A., Turnbaugh, P. J., ... & Knight, R. (2011). Global patterns of 16S rRNA diversity at a depth of millions of sequences per sample. Proceedings of the national academy of sciences, 108(supplement_1), 4516-4522.
  10. Chen, F., Koh, X. P., Tang, M. L. Y., Gan, J., & Lau, S. C. (2021). Microbiological assessment of ecological status in the Pearl River Estuary, China. Ecological Indicators, 130, 108084.
  11. Chen, Y., Mi, T., Liu, Y., Li, S., & Zhen, Y. (2020). Microbial community composition and function in sediments from the Pearl River mouth basin. Journal of Ocean University of China, 19, 941-953.
  12. Crump, B. C., & Bowen, J. L. (2023). The Microbial Ecology of Estuarine Ecosystems. Annual Review of Marine Science, 16.
  13. Duarte, C. M., Agustí, S., Wassmann, P., Arrieta, J. M., Alcaraz, M., Coello, A., ... & Vaqué, D. (2012). Tipping elements in the Arctic marine ecosystem. Ambio, 41, 44-55.
  14. Falkowski, P. G., Fenchel, T., & Delong, E. F. (2008). The microbial engines that drive Earth’s biogeochemical cycles. science, 320(5879), 1034-1039.
  15. Feng, B. W., Li, X. R., Wang, J. H., Hu, Z. Y., Meng, H., Xiang, L. Y., & Quan, Z. X. (2009). Bacterial diversity of water and sediment in the Changjiang estuary and coastal area of the East China Sea. FEMS microbiology ecology, 70(2), 236-248.
  16. Froelich, P., Klinkhammer, G. P., Bender, M. A. A., Luedtke, N. A., Heath, G. R., Cullen, D., ... & Maynard, V. (1979). Early oxidation of organic matter in pelagic sediments of the eastern equatorial Atlantic: suboxic diagenesis. Geochimica et cosmochimica acta, 43(7), 1075-1090.
  17. Gao, Y., Fu, J., Meng, M., Wang, Y., Chen, B., & Jiang, G. (2015). Spatial distribution and fate of perfluoroalkyl substances in sediments from the Pearl River Estuary, South China. Marine Pollution Bulletin, 96(1-2), 226-234.
  18. Garvine, R. W. (1975). The distribution of salinity and temperature in the Connecticut River estuary. Journal of Geophysical Research, 80(9), 1176-1183.
  19. Ghosh, A., & Bhadury, P. (2019). Exploring biogeographic patterns of bacterioplankton communities across global estuaries. MicrobiologyOpen, 8(5), e00741.
  20. Gray, J. S., & Elliott, M. (2009). Ecology of marine sediments: from science to management. Oxford University Press.
  21. Gu, Y. G., Li, Q. S., Fang, J. H., He, B. Y., Fu, H. B., & Tong, Z. J. (2014). Identification of heavy metal sources in the reclaimed farmland soils of the pearl river estuary in China using a multivariate geostatistical approach. Ecotoxicology and environmental safety, 105, 7-12.
  22. Guo, X., Song, G., Li, Y., Zhao, L., & Wang, J. (2022). Switch of bacteria community under oxygen depletion in sediment of Bohai Sea. Frontiers in Marine Science, 9, 833513.
  23. Hampel, J. J., Moseley, R. D., Mugge, R. L., Ray, A., Damour, M., Jones, D., & Hamdan, L. J. (2022). Deep-sea wooden shipwrecks influence sediment microbiome diversity. Limnology and Oceanography, 67(2), 482-497.
  24. Harrison, P. J., Yin, K., Lee, J. H. W., Gan, J., & Liu, H. (2008). Physical–biological coupling in the Pearl River Estuary. Continental Shelf Research, 28(12), 1405-1415.
  25. Hoch, M. P., & Kirchman, D. L. (1993). Seasonal and inter-annual variability in bacterial production and biomass in a temperate estuary. Marine ecology progress series. Oldendorf, 98(3), 283-295.
  26. Howland, R. J. M., Tappin, A. D., Uncles, R. J., Plummer, D. H., & Bloomer, N. J. (2000). Distributions and seasonal variability of pH and alkalinity in the Tweed Estuary, UK. Science of the total environment, 251, 125-138.
  27. Hu, J., & Chivas, A. R. (2009). Molecular biomarker evidence of origins and transport of organic matter in sediments of the Pearl River estuary and adjacent South China Sea. Applied Geochemistry, 24(9), 1666-1676.
  28. Hu, J., & Zhang, H. (2006). Fatty acid composition of surface sediments in the subtropical Pearl River estuary and adjacent shelf, Southern China. Estuarine, coastal and shelf science, 66(1-2), 346-356.
  29. Hu, X., & Burdige, D. J. (2007). Enriched stable carbon isotopes in the pore waters of carbonate sediments dominated by seagrasses: Evidence for coupled carbonate dissolution and reprecipitation. Geochimica et Cosmochimica Acta, 71(1), 129-144.
  30. Hu, Y. J., & Satten, G. A. (2020). Testing hypotheses about the microbiome using the linear decomposition model (LDM). Bioinformatics, 36(14), 4106-4115.
  31. Hu, Y., Hong, Y., Ye, J., Wu, J., Wang, Y., Ye, F., ... & Long, A. (2021). Shift of DNRA bacterial community composition in sediment cores of the Pearl River Estuary and the impact of environmental factors. Ecotoxicology, 1-15.
  32. Huang, J., Hu, J., Li, S., Wang, B., Xu, Y., Liang, B., & Liu, D. (2019). Effects of physical forcing on summertime hypoxia and oxygen dynamics in the Pearl River Estuary. Water, 11(10), 2080.
  33. Huang, X. P., Huang, L. M., & Yue, W. Z. (2003). The characteristics of nutrients and eutrophication in the Pearl River estuary, South China. Marine pollution bulletin, 47(1-6), 30-36.
  34. Huang, F., Lin, X., Hu, W., Zeng, F., He, L., & Yin, K. (2021). Nitrogen cycling processes in sediments of the Pearl River Estuary: Spatial variations, controlling factors, and environmental implications. Catena, 206, 105545.
  35. Jiang, L., Zheng, Y., Peng, X., Zhou, H., Zhang, C., Xiao, X., & Wang, F. (2009). Vertical distribution and diversity of sulfate-reducing prokaryotes in the Pearl River estuarine sediments, Southern China. FEMS microbiology ecology, 70(2), 249-262.
  36. Kallmeyer, J., Pockalny, R., Adhikari, R. R., Smith, D. C., & D’Hondt, S. (2012). Global distribution of microbial abundance and biomass in subseafloor sediment. Proceedings of the National Academy of Sciences, 109(40), 16213-16216.
  37. Lalzar, M., Zvi-Kedem, T., Kroin, Y., Martinez, S., Tchernov, D., & Meron, D. (2023). Sediment Microbiota as a Proxy of Environmental Health: Discovering Inter-and Intrakingdom Dynamics along the Eastern Mediterranean Continental Shelf. Microbiology Spectrum, 11(1), e02242-22.
  38. Lamb, A. L., Wilson, G. P., & Leng, M. J. (2006). A review of coastal palaeoclimate and relative sea-level reconstructions using δ13C and C/N ratios in organic material. Earth-Science Reviews, 75(1-4), 29-57.
  39. Li, K. Z., Yin, J. Q., Huang, L. M., & Tan, Y. H. (2006). Spatial and temporal variations of mesozooplankton in the Pearl River estuary, China. Estuarine, Coastal and Shelf Science, 67(4), 543-552.
  40. Li, D., Gan, J., Hui, R., Liu, Z., Yu, L., Lu, Z., & Dai, M. (2020). Vortex and biogeochemical dynamics for the hypoxia formation within the coastal transition zone off the Pearl River Estuary. Journal of Geophysical Research: Oceans, 125(8), e2020JC016178.
  41. Li, J., & Katsev, S. (2014). Nitrogen cycling in deeply oxygenated sediments: Results in Lake Superior and implications for marine sediments. Limnology and oceanography, 59(2), 465-481.
  42. Li, J., Brown, E. T., Crowe, S. A., & Katsev, S. (2018a). Sediment geochemistry and contributions to carbon and nutrient cycling in a deep meromictic tropical lake: Lake Malawi (East Africa). Journal of Great Lakes Research, 44(6), 1221-1234.
  43. Li, J., Crowe, S. A., Miklesh, D., Kistner, M., Canfield, D. E., & Katsev, S. (2012). Carbon mineralization and oxygen dynamics in sediments with deep oxygen penetration, Lake Superior. Limnology and Oceanography, 57(6), 1634-1650.
  44. Li, J., Zhang, Y., & Katsev, S. (2018b). Phosphorus recycling in deeply oxygenated sediments in Lake Superior controlled by organic matter mineralization. Limnology and Oceanography, 63(3), 1372-1385.
  45. Li, S., Fang, J., Zhu, X., Spencer, R. G., Álvarez-Salgado, X. A., Deng, Y., ... & Huang, C. (2022). Properties of sediment dissolved organic matter respond to eutrophication and interact with bacterial communities in a plateau lake. Environmental Pollution, 301, 118996.
  46. Liu, J., Yang, H., Zhao, M., & Zhang, X. H. (2014). Spatial distribution patterns of benthic microbial communities along the Pearl Estuary, China. Systematic and applied microbiology, 37(8), 578-589.
  47. Liu, W., Jiang, L., Yang, S., Wang, Z., Tian, R., Peng, Z., ... & Liu, L. (2020). Critical transition of soil bacterial diversity and composition triggered by nitrogen enrichment. Ecology, 101(8), e03053.
  48. Lu, Z., Gan, J., Dai, M., Liu, H., & Zhao, X. (2018). Joint effects of extrinsic biophysical fluxes and intrinsic hydrodynamics on the formation of hypoxia west off the Pearl River Estuary. Journal of Geophysical Research: Oceans, 123(9), 6241-6259.
  49. Moffett, B. F., Nicholson, F. A., Uwakwe, N. C., Chambers, B. J., Harris, J. A., & Hill, T. C. (2003). Zinc contamination decreases the bacterial diversity of agricultural soil. FEMS microbiology ecology, 43(1), 13-19.
  50. Naqib, A., Poggi, S., Wang, W., Hyde, M., Kunstman, K., & Green, S. J. (2018). Making and sequencing heavily multiplexed, high-throughput 16S ribosomal RNA gene amplicon libraries using a flexible, two-stage PCR protocol. Gene expression analysis: Methods and protocols, 149-169.
  51. Nealson, K. H. (1997). Sediment bacteria: who’s there, what are they doing, and what’s new?. Annual Review of Earth and Planetary Sciences, 25(1), 403-434.
  52. Ohore, O. E., Wei, Y., Wang, J., Wang, Y., Ifon, B. E., Liu, W., & Wang, Z. (2022). Vertical characterisation of phylogenetic divergence of microbial community structures, interaction, and sustainability in estuary and marine ecosystems. Science of The Total Environment, 851, 158369.
  53. Oksanen, J., Simpson, G., Blanchet, F., Kindt, R., Legendre, P., Minchin, P., ... & Weedon, J. (2022). Vegan: Community Ecology Package (R Package Version 2.6-2). 2022. Google Scholar There is no corresponding record for this reference.
  54. Owen, R. B. (2005). Modern fine-grained sedimentation—spatial variability and environmental controls on an inner pericontinental shelf, Hong Kong. Marine Geology, 214(1-3), 1-26.
  55. Parida, P. K., Behera, B. K., Dehury, B., Rout, A. K., Sarkar, D. J., Rai, A., ... & Mohapatra, T. (2022). Community structure and function of microbiomes in polluted stretches of river Yamuna in New Delhi, India, using shotgun metagenomics. Environmental Science and Pollution Research, 29(47), 71311-71325.
  56. PD, N. (1986). Determination of monounsaturated fatty acid double bonds and geometry for microbial cultures and complex consortia by capillary GC-MS and their dimethyl disulphide adducts. J Microbiol Methods, 5, 49-55. Jiang.
  57. Petro, C., Starnawski, P., Schramm, A., & Kjeldsen, K. U. (2017). Microbial community assembly in marine sediments. Aquatic Microbial Ecology, 79(3), 177-195.
  58. Rasmussen, H., & Jørgensen, B. B. (1992). Microelectrode studies of seasonal oxygen uptake in a coastal sediment: Role of molecular diffusion. Marine ecology progress series. Oldendorf, 81(3), 289-303.
  59. Rout, A. K., Tripathy, P. S., Dixit, S., Behera, D. U., Behera, B., Das, B. K., & Behera, B. K. (2024). Metagenomics analysis of sediments of river Ganga, India for bacterial diversity, functional genomics, antibiotic resistant genes and virulence factors. Current Research in Biotechnology, 100187.
  60. Rubin-Blum, M., Sisma-Ventura, G., Yudkovski, Y., Belkin, N., Kanari, M., Herut, B., & Rahav, E. (2022). Diversity, activity, and abundance of benthic microbes in the Southeastern Mediterranean Sea. FEMS Microbiology Ecology, 98(2), fiac009.
  61. Segata, N., Izard, J., Waldron, L., Gevers, D., Miropolsky, L., Garrett, W. S., & Huttenhower, C. (2011). Metagenomic biomarker discovery and explanation. Genome biology, 12, 1-18.
  62. Southwell, M. W., Kieber, R. J., Mead, R. N., Brooks Avery, G., & Skrabal, S. A. (2010). Effects of sunlight on the production of dissolved organic and inorganic nutrients from resuspended sediments. Biogeochemistry, 98, 115-126.
  63. Southwell, M. W., Mead, R. N., Luquire, C. M., Barbera, A., Avery, G. B., Kieber, R. J., & Skrabal, S. A. (2011). Influence of organic matter source and diagenetic state on photochemical release of dissolved organic matter and nutrients from resuspendable estuarine sediments. Marine Chemistry, 126(1-4), 114-119.
  64. Spietz, R. L., Williams, C. M., Rocap, G., & Horner-Devine, M. C. (2015). A dissolved oxygen threshold for shifts in bacterial community structure in a seasonally hypoxic estuary. PloS one, 10(8), e0135731.
  65. Stahl, D. A., & De La Torre, J. R. (2012). Physiology and diversity of ammonia-oxidizing archaea. Annual review of microbiology, 66, 83-101.
  66. Stoeck, T., Bass, D., Nebel, M., Christen, R., Jones, M. D., Breiner, H. W., & Richards, T. A. (2010). Multiple marker parallel tag environmental DNA sequencing reveals a highly complex eukaryotic community in marine anoxic water. Molecular ecology, 19, 21-31.
  67. Stoeck, T., Frühe, L., Forster, D., Cordier, T., Martins, C. I., & Pawlowski, J. (2018). Environmental DNA metabarcoding of benthic bacterial communities indicates the benthic footprint of salmon aquaculture. Marine Pollution Bulletin, 127, 139-149.
  68. Suh, S. S., Park, M., Hwang, J., Kil, E. J., Jung, S. W., Lee, S., & Lee, T. K. (2015). Seasonal dynamics of marine microbial community in the South Sea of Korea. PLoS One, 10(6), e0131633.
  69. Takahashi, S., Tomita, J., Nishioka, K., Hisada, T., & Nishijima, M. (2014). Development of a prokaryotic universal primer for simultaneous analysis of Bacteria and Archaea using next-generation sequencing. PloS one, 9(8), e105592.
  70. Tang, D., Kester, D. R., Ni, I. H., Qi, Y., & Kawamura, H. (2003). In situ and satellite observations of a harmful algal bloom and water condition at the Pearl River estuary in late autumn 1998. Harmful Algae, 2(2), 89-99.
  71. Tourna, M., Stieglmeier, M., Spang, A., Könneke, M., Schintlmeister, A., Urich, T., ... & Schleper, C. (2011). Nitrososphaera viennensis, an ammonia oxidizing archaeon from soil. Proceedings of the National Academy of Sciences, 108(20), 8420-8425.
  72. Urakawa, H., Yoshida, T., Nishimura, M., & Ohwada, K. (2000). Characterization of depth-related population variation in microbial communities of a coastal marine sediment using 16S rDNA-based approaches and quinone profiling. Environmental Microbiology, 2(5), 542-554.
  73. Viollier, E., Inglett, P. W., Hunter, K., Roychoudhury, A. N., & Van Cappellen, P. (2000). The ferrozine method revisited: Fe (II)/Fe (III) determination in natural waters. Applied geochemistry, 15(6), 785-790.
  74. Vipindas, P. V., Jabir, T., Rahiman, K. M., Rehitha, T. V., Sudheesh, V., Jesmi, Y., & Hatha, A. M. (2022). Impact of anthropogenic organic matter on bacterial community distribution in the continental shelf sediments of southeastern Arabian Sea. Marine Pollution Bulletin, 174, 113227.
  75. Waidner, L. A., & Kirchman, D. L. (2005). Aerobic anoxygenic photosynthesis genes and operons in uncultured bacteria in the Delaware River. Environmental Microbiology, 7(12), 1896-1908.
  76. Wang, Y., Sheng, H. F., He, Y., Wu, J. Y., Jiang, Y. X., Tam, N. F. Y., & Zhou, H. W. (2012). Comparison of the levels of bacterial diversity in freshwater, intertidal wetland, and marine sediments by using millions of illumina tags. Applied and environmental microbiology, 78(23), 8264-8271.
  77. Wen, W.Y., Zhang, G.X., & Du, W.C., (1995). A study on water pollution in the Zhujing (Pearl River) estuary. In: Wong, C.K., Chu, K.H., Chen, Q.C., Ma, X.L. (Eds.), Environmental Research in Pearl River and Coastal Area. Guangdong Higher Education Press, Guangzhou, China, pp. 99–108.
  78. Wu, Z., Zhou, H., Peng, X., & Chen, G. (2006). Anaerobic oxidation of methane: geochemical evidence from pore-water in coastal sediments of Qi’ao Island (Pearl River Estuary), southern China. Chinese Science Bulletin, 51, 2006-2015.
  79. Xie, W., Zhang, C., Zhou, X., & Wang, P. (2014). Salinity-dominated change in community structure and ecological function of Archaea from the lower Pearl River to coastal South China Sea. Applied microbiology and biotechnology, 98, 7971-7982.
  80. Xie, Y., Wang, J., Wu, Y., Ren, C., Song, C., Yang, J., ... & Zhang, X. (2016). Using in situ bacterial communities to monitor contaminants in river sediments. Environmental Pollution, 212, 348-357.
  81. Xu, B., Li, F., Cai, L., Zhang, R., Fan, L., & Zhang, C. (2022). A holistic genome dataset of bacteria, archaea and viruses of the Pearl River estuary. Scientific Data, 9(1), 49.
  82. Xu, J., Yin, K., Lee, J. H., Liu, H., Ho, A. Y., Yuan, X., & Harrison, P. J. (2010). Long-term and seasonal changes in nutrients, phytoplankton biomass, and dissolved oxygen in Deep Bay, Hong Kong. Estuaries and coasts, 33, 399-416.
  83. Xu, S., Zhan, L., Tang, W., Wang, Q., Dai, Z., Zhou, L., ... & Yu, G. (2023). MicrobiotaProcess: A comprehensive R package for deep mining microbiome. The Innovation, 4(2).
  84. Yu, L., Gan, J., Dai, M., Hui, C. R., Lu, Z., & Li, D. (2021). Modeling the role of riverine organic matter in hypoxia formation within the coastal transition zone off the Pearl River Estuary. Limnology and Oceanography, 66(2), 452-468.
  85. Yuan, D., Chen, L., Luan, L., Wang, Q., & Yang, Y. (2020). Effect of salinity on the zooplankton community in the Pearl River estuary. Journal of Ocean University of China, 19, 1389-1398.
  86. Zhang, L., Wang, L., Yin, K., Lü, Y., Zhang, D., Yang, Y., & Huang, X. (2013). Pore water nutrient characteristics and the fluxes across the sediment in the Pearl River estuary and adjacent waters, China. Estuarine, Coastal and Shelf Science, 133, 182-192.
  87. Zhang, X., Cui, L., Liu, S., Li, J., Wu, Y., Ren, Y., & Huang, X. (2023). Seasonal dynamics of bacterial community and co-occurrence with eukaryotic phytoplankton in the Pearl River Estuary. Marine Environmental Research, 106193.
  88. Zhou, L. (2022). Sediment Oxygen Uptake and Carbon Mineralization in the Pearl River Estuary and Adjacent Coastal Waters (Doctoral dissertation, Hong Kong University of Science and Technology).
  89. Zou, D., Pan, J., Liu, Z., Zhang, C., Liu, H., & Li, M. (2020). The distribution of Bathyarchaeota in surface sediments of the Pearl river estuary along salinity gradient. Frontiers in microbiology, 11, 285.
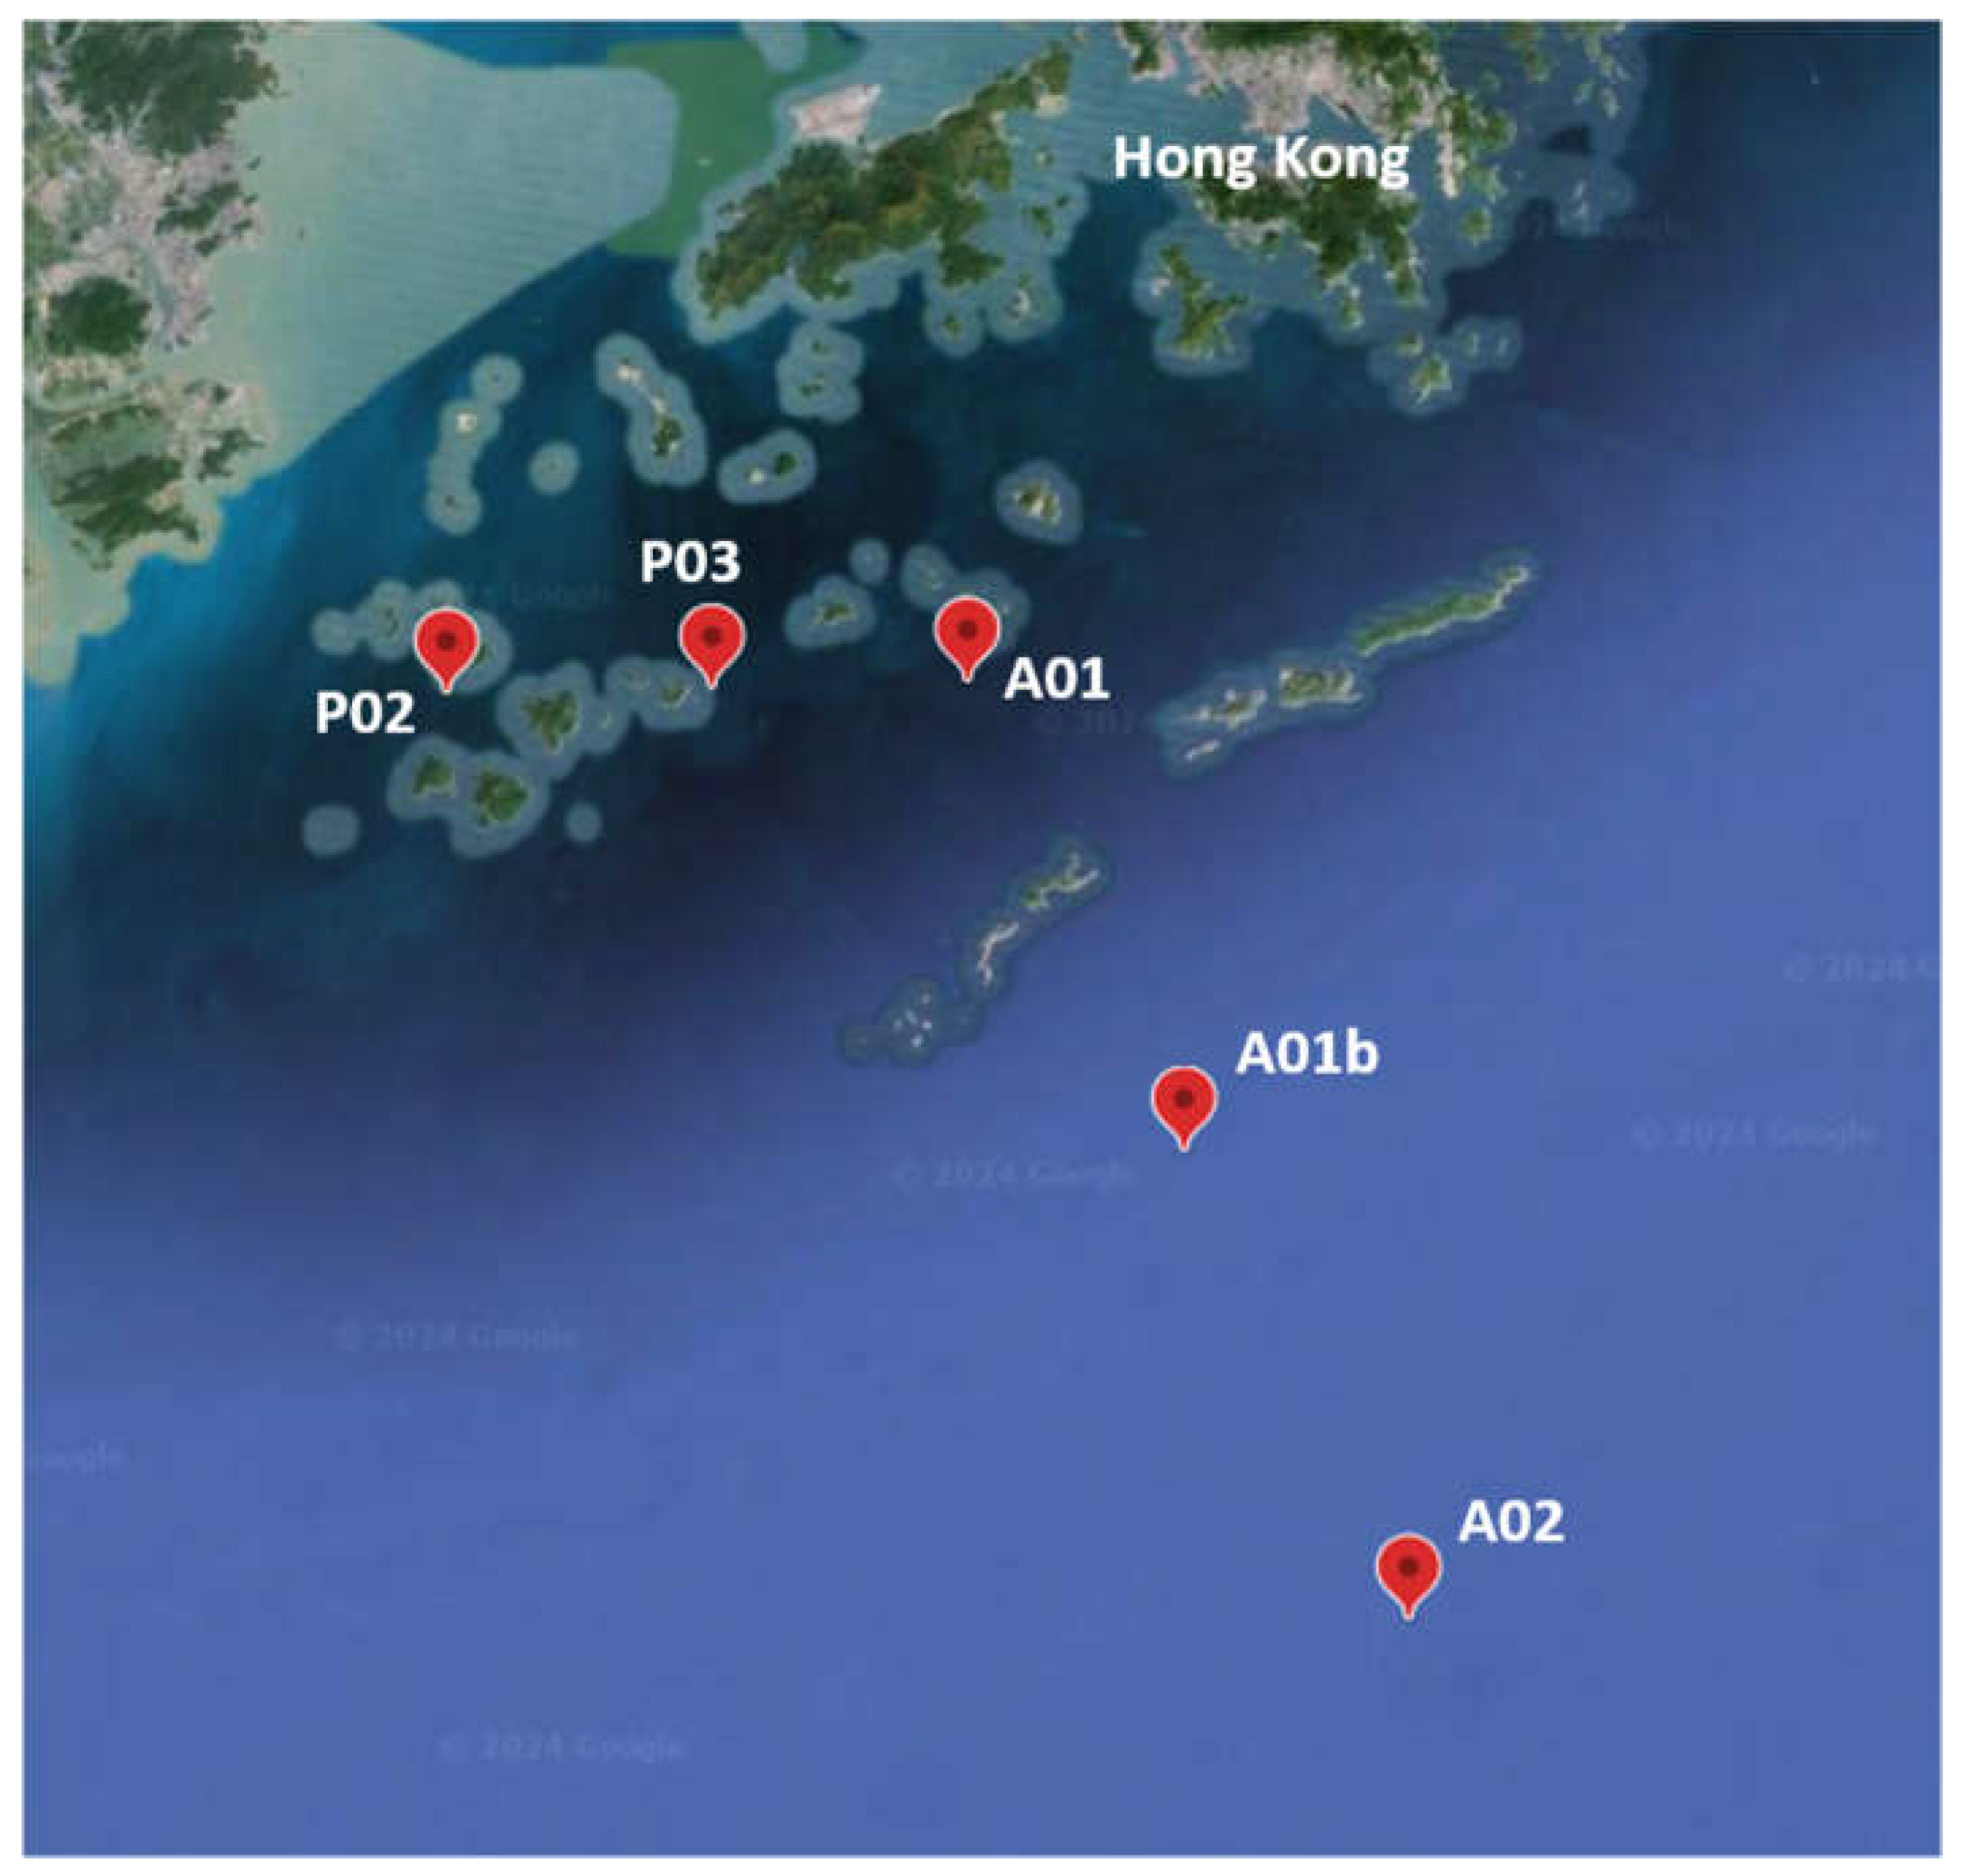
Figure 1. Map of the sampling sites, next to the Pearl River estuary. Site coordinates are presented in Table S1.
Preprints 105840 g001
Figure 2. Non-metric multidimensional scaling analysis (NMDS) of the microbial communities and the relationship between environmental variables and the NMDS ordination axes. The environmental variables vector as identified by the envfit analysis (P values and R2 of multiple regressions against the ordination axes are shown). Of all the measured environmental variables (Table S2), only those that were significant in each kingdom are shown (Table S3).
Preprints 105840 g002
Figure 3. Effect of the site and the core depth and on sediment microbiota. PREMANOVA factorial test results. **P < 0.01, *** P < 0.001.
Preprints 105840 g003
Figure 4. Venn diagrams indicating the distribution of unique and shared microbial ASVs between the core depths (DEEP, MED and UP). ASVs with prevalence >10% of samples were included. Only values above 1% are shown.
Preprints 105840 g004
Figure 5. Boxplot presenting the distribution of Shannon H’ index of diversity within each site at each kingdom. *P<0.05 **P<0.01, *** P<0.001.
Preprints 105840 g005
Figure 6. Composition and structure of sediment microbiota in the sampled sites. (A) Archaea class-level composition. (B) Bacteria class-level composition and (C) Eukaryote TAX 2 level. The groups above 6% relative abundance are shown.
Preprints 105840 g006
Figure 7. Microbial markers of site and core depth are presented by a radial cladogram based on the hierarchical taxonomy, colored by phyla (TAX1 for eukaryotes) with the relative abundance in each site and core depth. The markers were identified by the linear discriminant analysis effect size (LEfSe) methods (BH adjusted P < 0.05, LDA > 2).
Preprints 105840 g007
Figure 8. Correspondence between site (A) or core depth (B) specificity and sediment chemical parameters. Marker populations (ASVs) for each site were determined by linear discriminant analysis (LDA) effect size (LefSe). In parallel, significant effects of sediment physiochemical properties (i.e., C/N, TN, NH4+ and O2) were examined by linear decomposition model (LDM) analysis. ASVs significant for both site/core depth and at least one chemical parameter are presented. The colors in the legend refer to the two parts of the figure.
Preprints 105840 g008
Disclaimer/Publisher’s Note: The statements, opinions and data contained in all publications are solely those of the individual author(s) and contributor(s) and not of MDPI and/or the editor(s). MDPI and/or the editor(s) disclaim responsibility for any injury to people or property resulting from any ideas, methods, instructions or products referred to in the content.
Copyright: This open access article is published under a Creative Commons CC BY 4.0 license, which permit the free download, distribution, and reuse, provided that the author and preprint are cited in any reuse.
Prerpints.org logo

Preprints.org is a free preprint server supported by MDPI in Basel, Switzerland.

Subscribe

© 2024 MDPI (Basel, Switzerland) unless otherwise stated