Introduction
The convergence of art and science plays a pivotal role in elucidating complex data for a variety of audiences in the realm of data visualization and graphical representation. The field, rich in its diversity and applications, spans multiple disciplines, drawing on principles from design, perception, and statistical analysis to effectively communicate and interpret data [
1,
2,
3]. Foundational works in this field provide a comprehensive understanding of the techniques, practices, and principles underlying effective data visualization [
4,
5,
6,
7,
8].
The hippocampus, a key component of the brain located in the medial temporal lobe, plays a crucial role in various cognitive functions, particularly in memory formation and spatial navigation [
9,
10,
11]. Its unique structure and function have made it a focal point of neuroscience research. The hippocampus is integral to the formation of new memories and the consolidation of information from short-term to long-term memory [
12,
13,
14]. It is also essential for spatial memory and navigation, containing specialized cells such as place cells, which become active in specific physical locations, forming a cognitive map of the environment [
15,
16,
17].
Drawing upon insights from various scientific studies, the process of memory acquisition in the hippocampus can be understood as a multi-faceted and complex phenomenon [
18,
19,
20]. The hippocampus begins the memory acquisition process by encoding incoming sensory information and acts as a 'sorting center' where the brain decides what is important enough to be remembered [
21]. The generation of new neurons in the hippocampus, known as neurogenesis, is believed to be crucial for the formation of certain types of memories [
22]. The hippocampus also interacts with other parts of the brain, such as the amygdala for emotional memories and the prefrontal cortex for decision-making and memory retrieval [
23].
Methodology and Results
The exact mechanism the hippocampus uses to achieve its functions is only beginning to be uncovered. This article presents a graphical model of how information can be stored in multiple angles and, by its complexity, provoke the phenomenon of emergence, which is much more than its constituent parts.
The graphs in
Figure 1,
Figure 2,
Figure 3,
Figure 4,
Figure 5,
Figure 6,
Figure 7 and
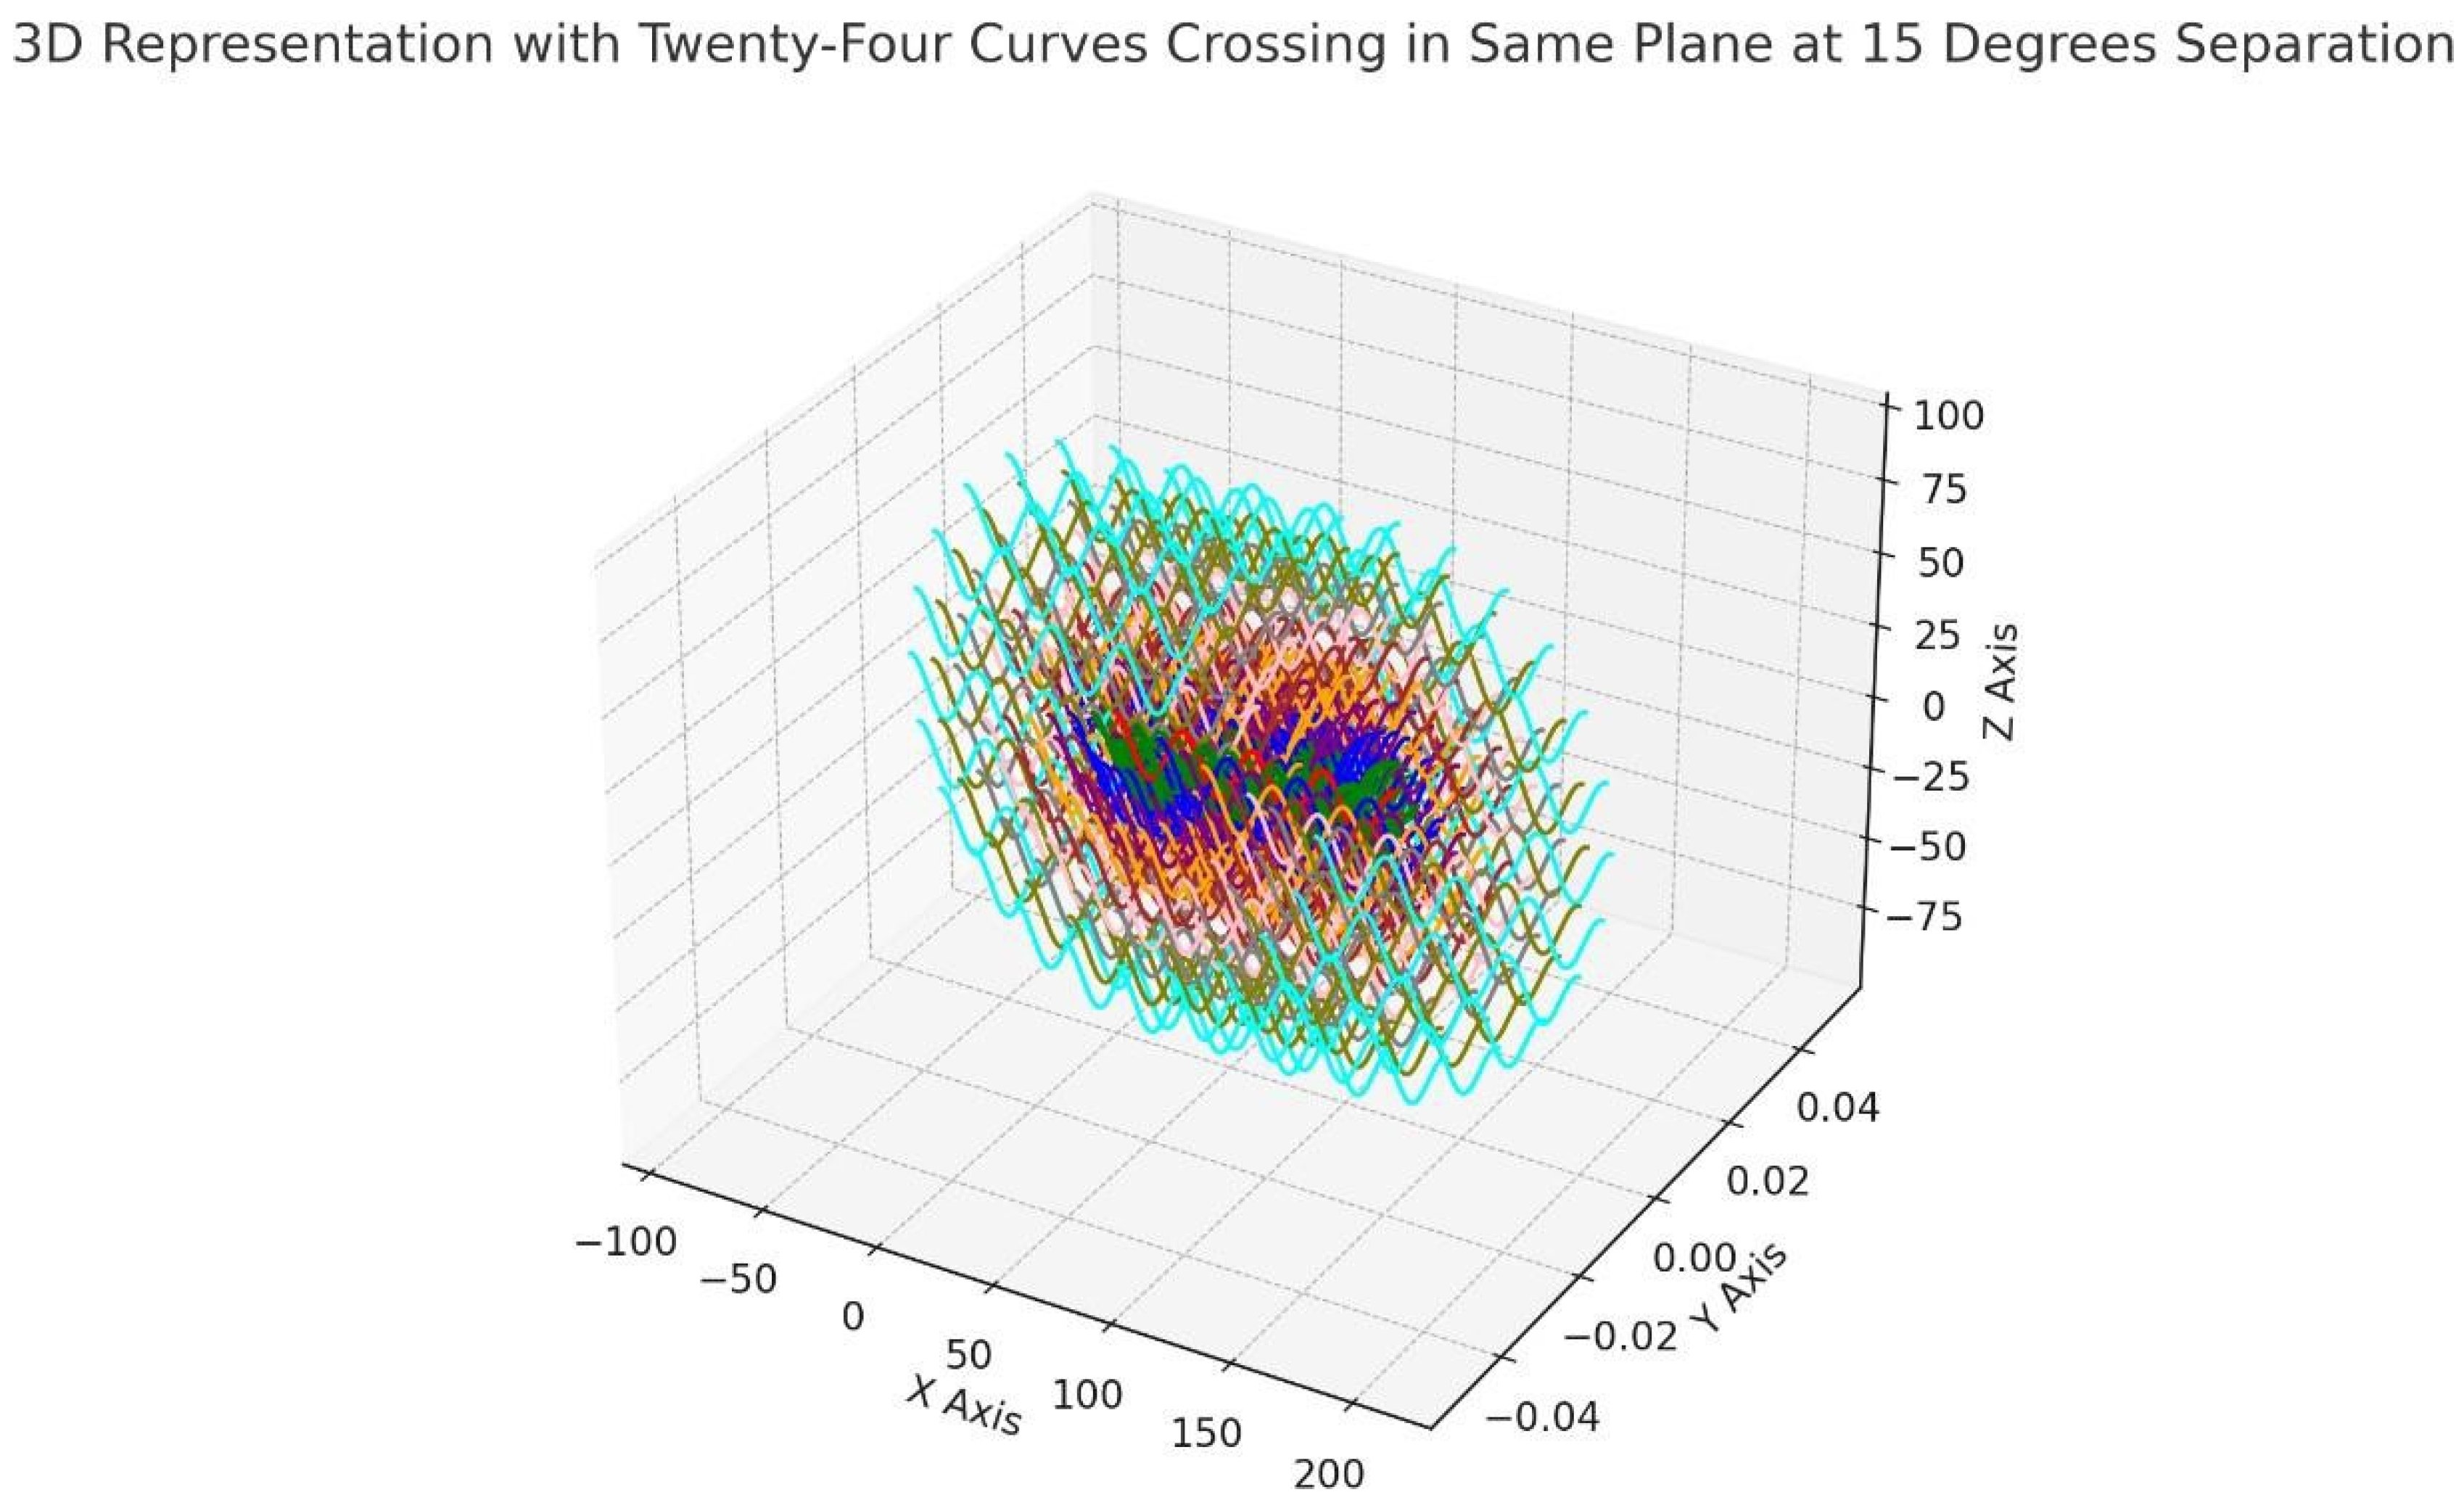
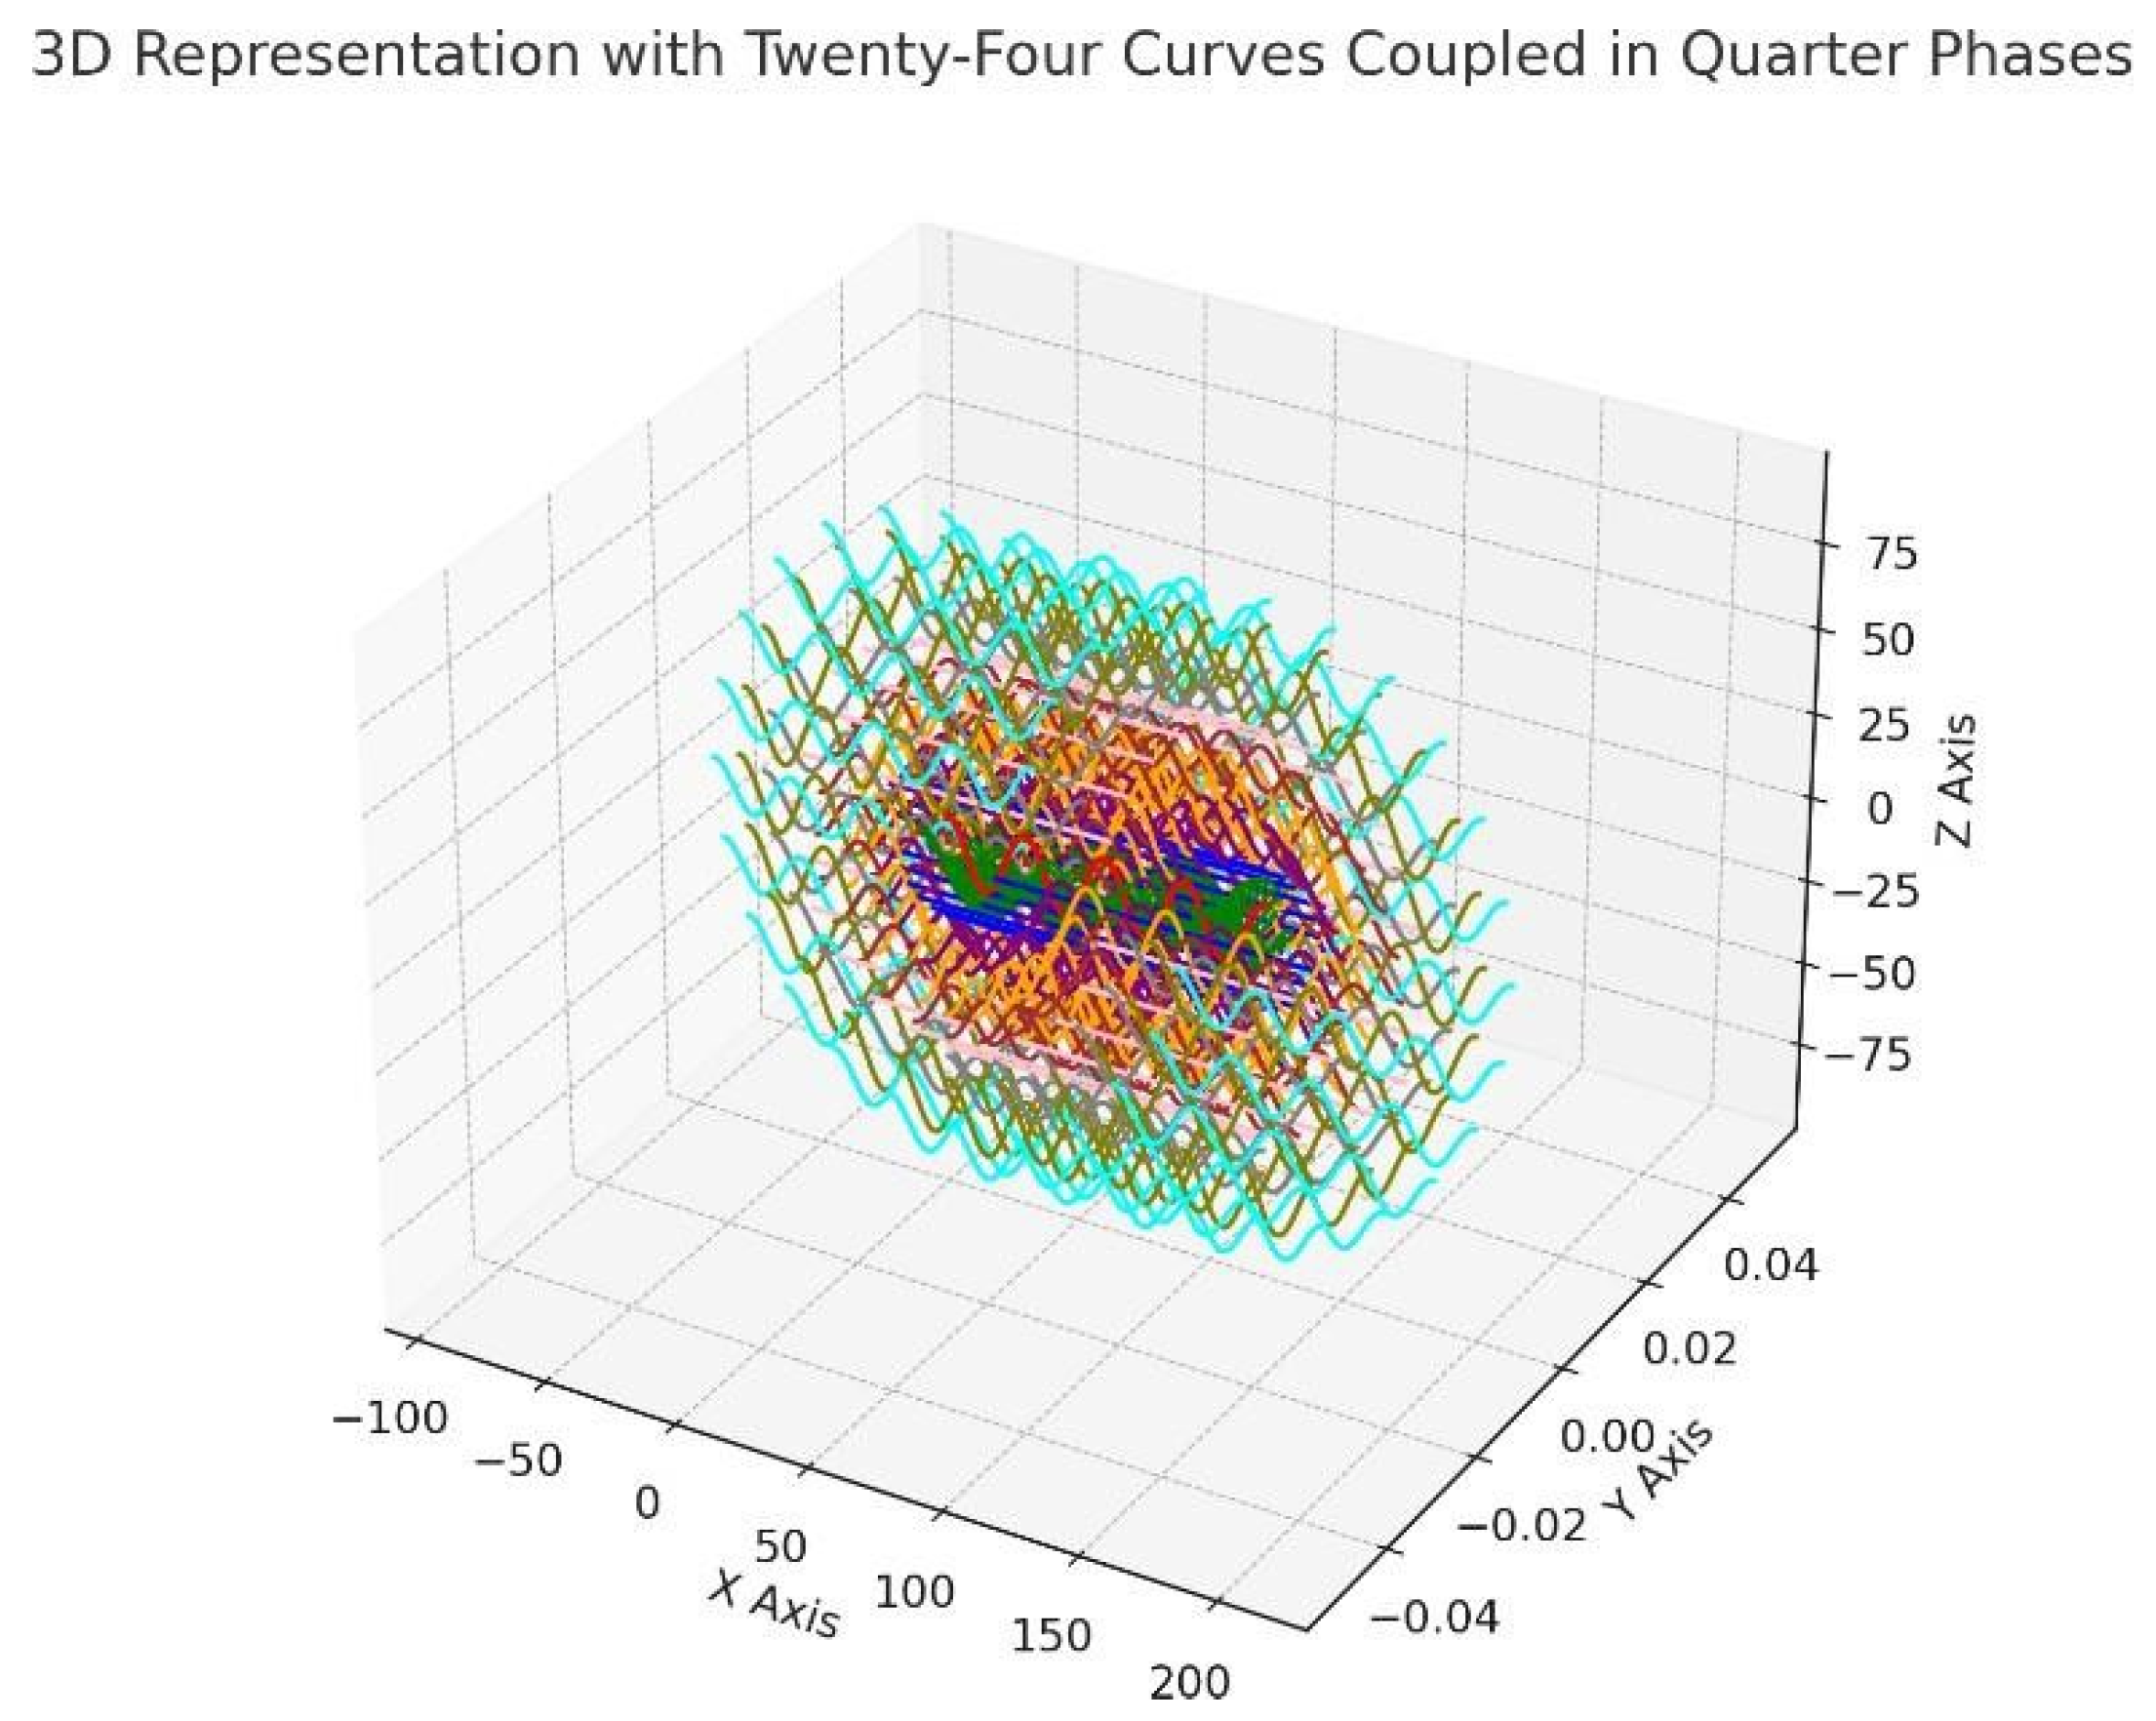
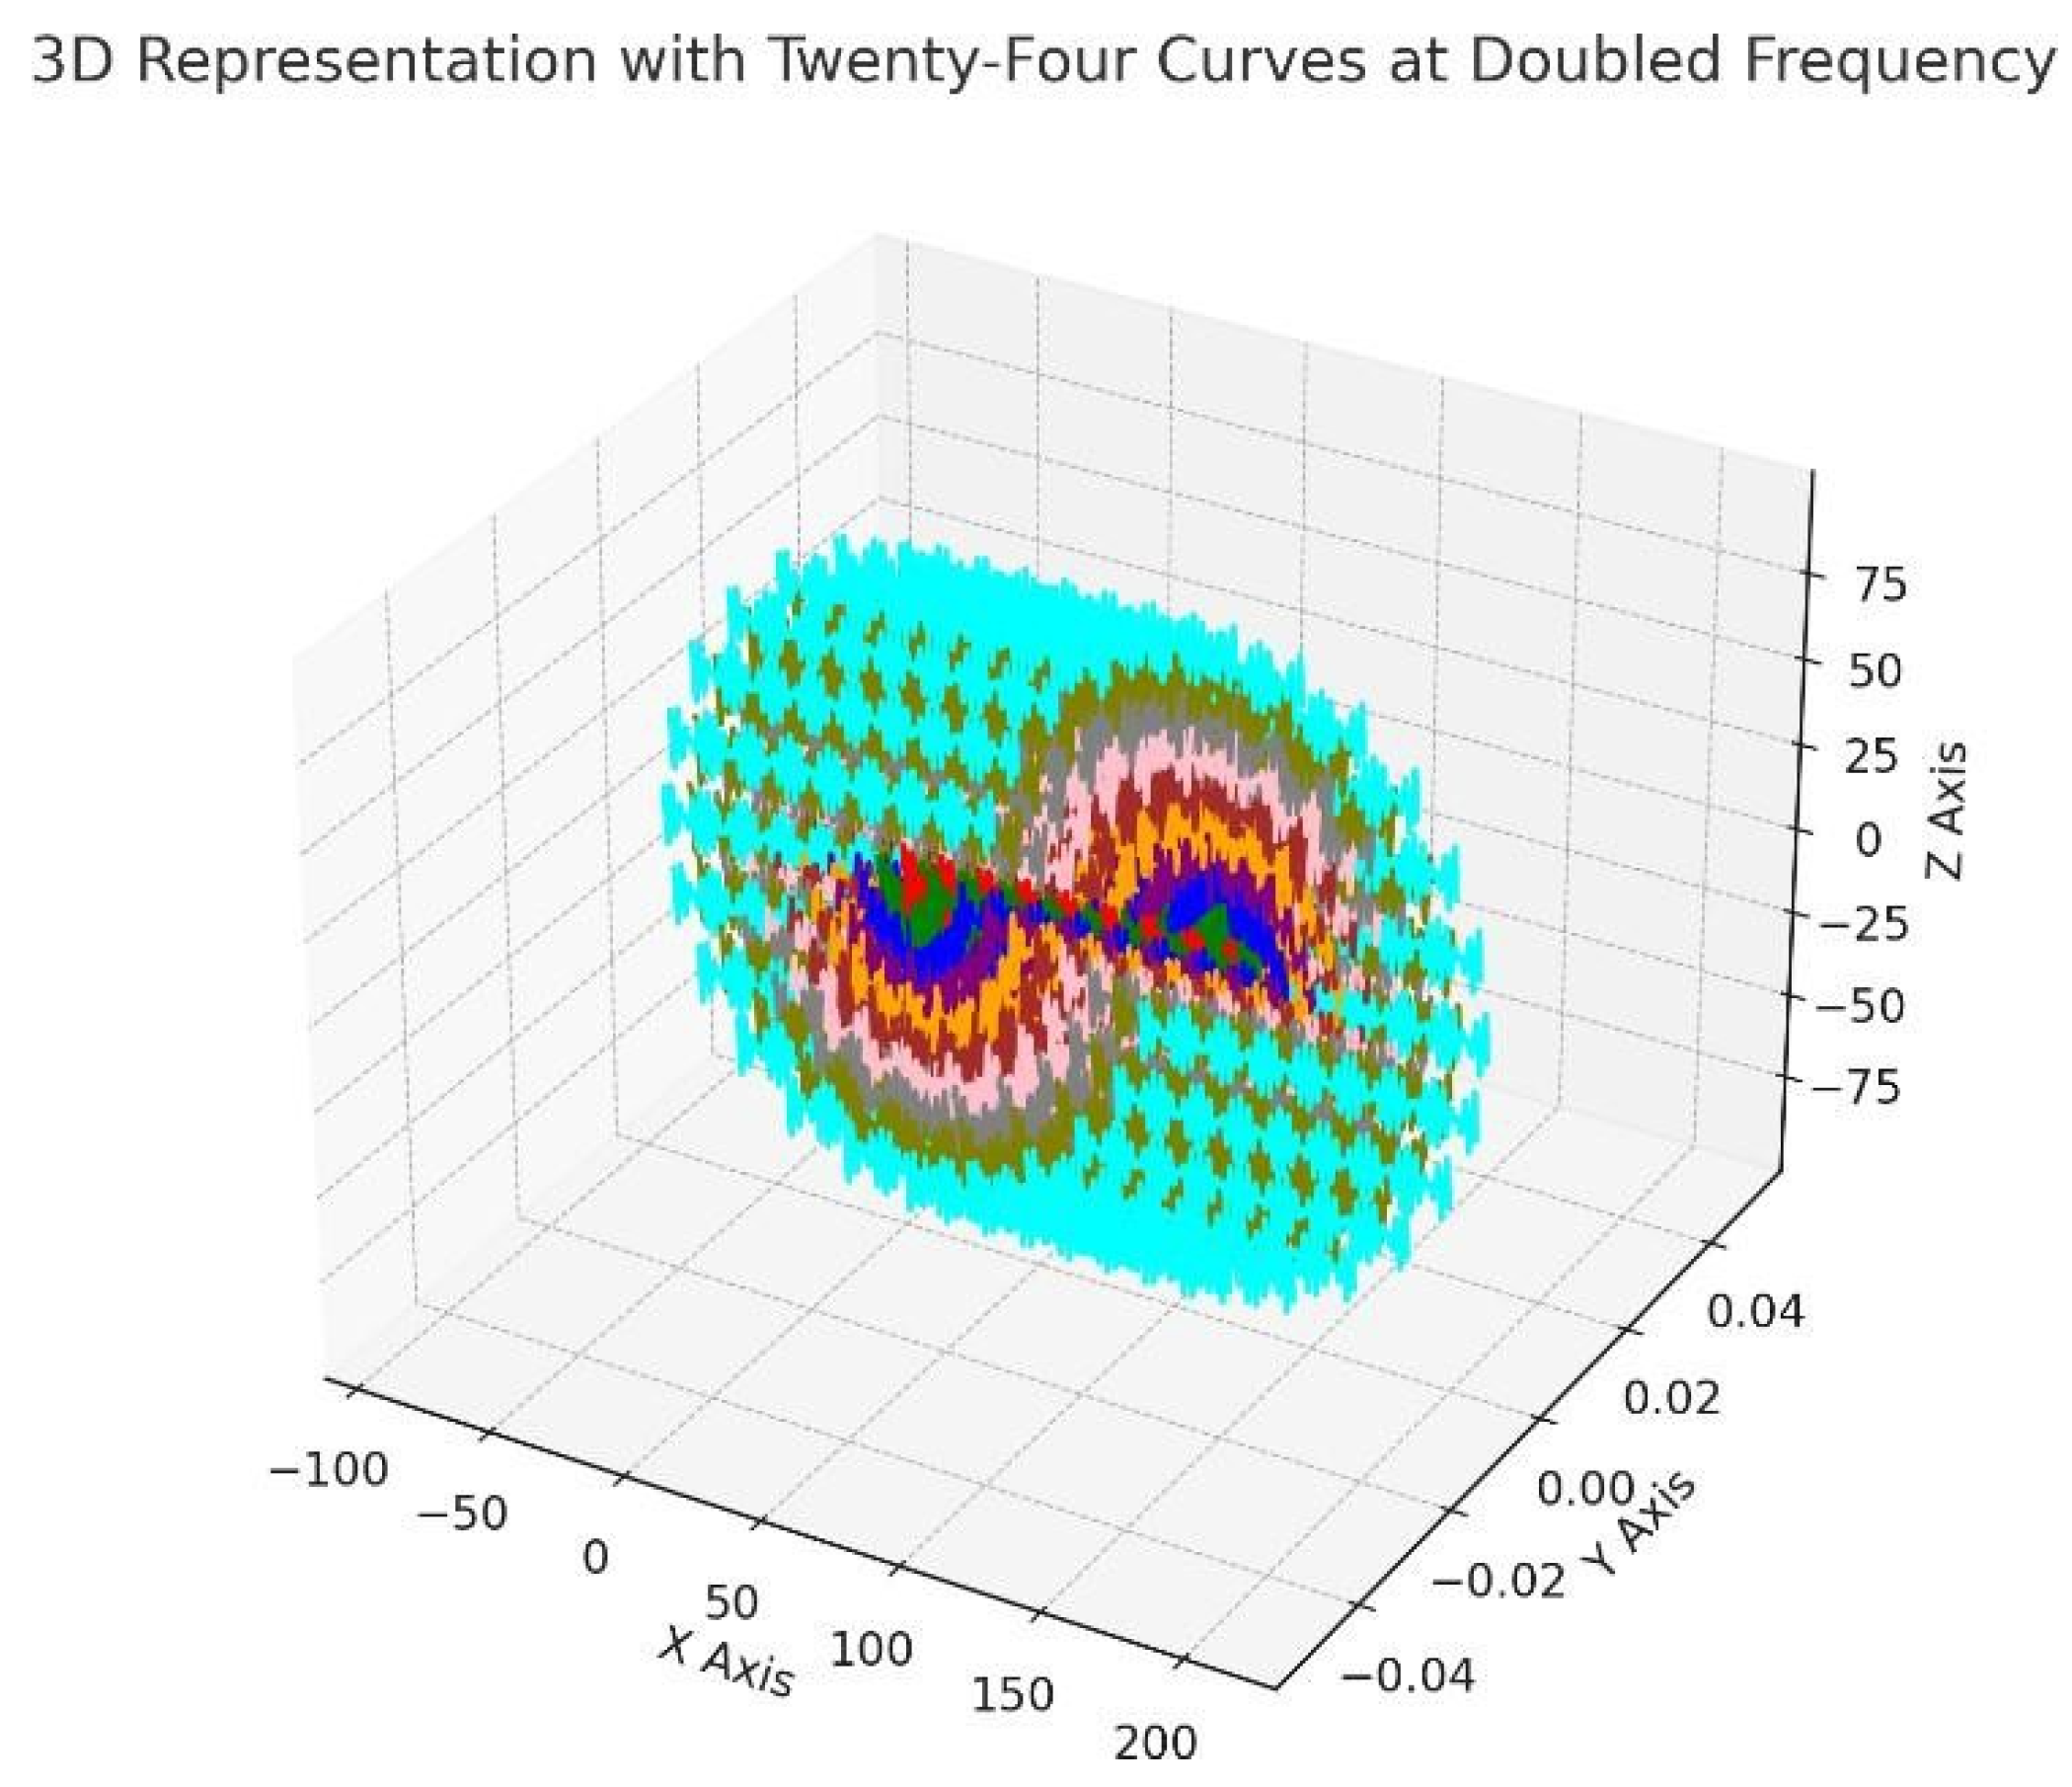
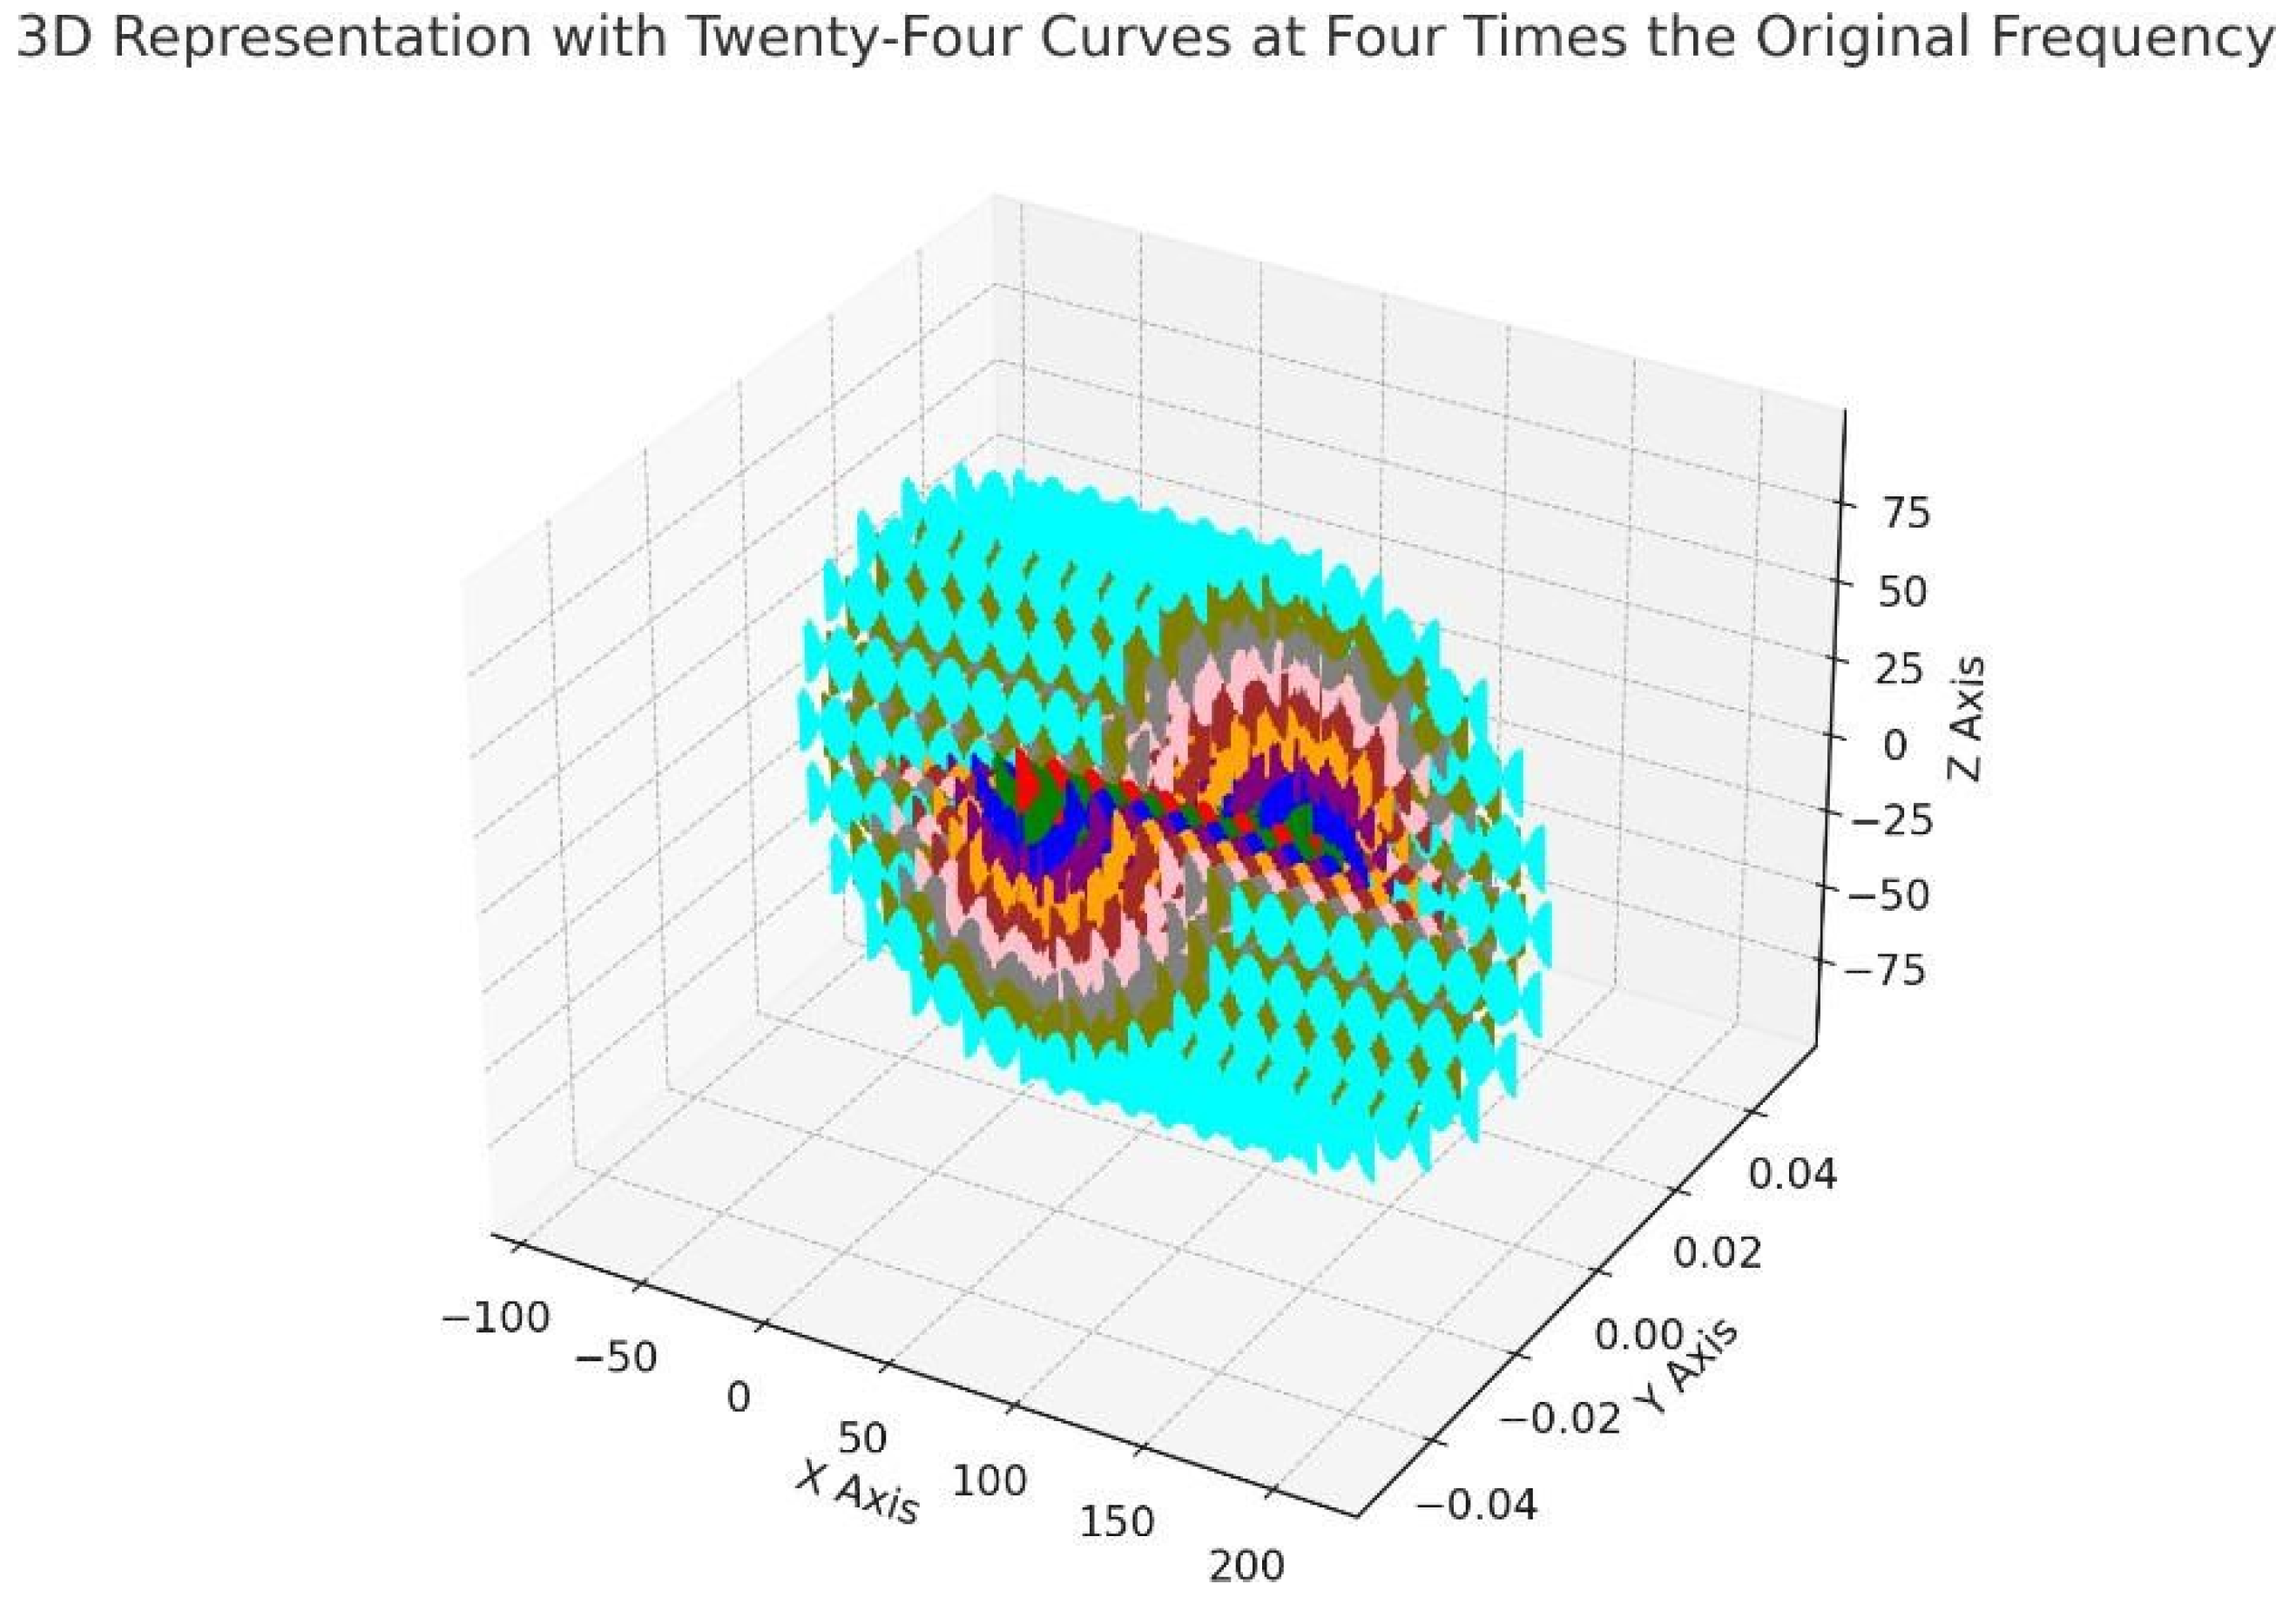
Figure 8 represent a small part of a highly theoretical simplified model of chains of neurons that have spatial structure topology between them and time frequency as a method of storing information. The graphs show a sequence of similar brain waves separated by progressively smaller angles (120, 60, 30, and 15 degrees) and with varying phase shifts and frequencies.
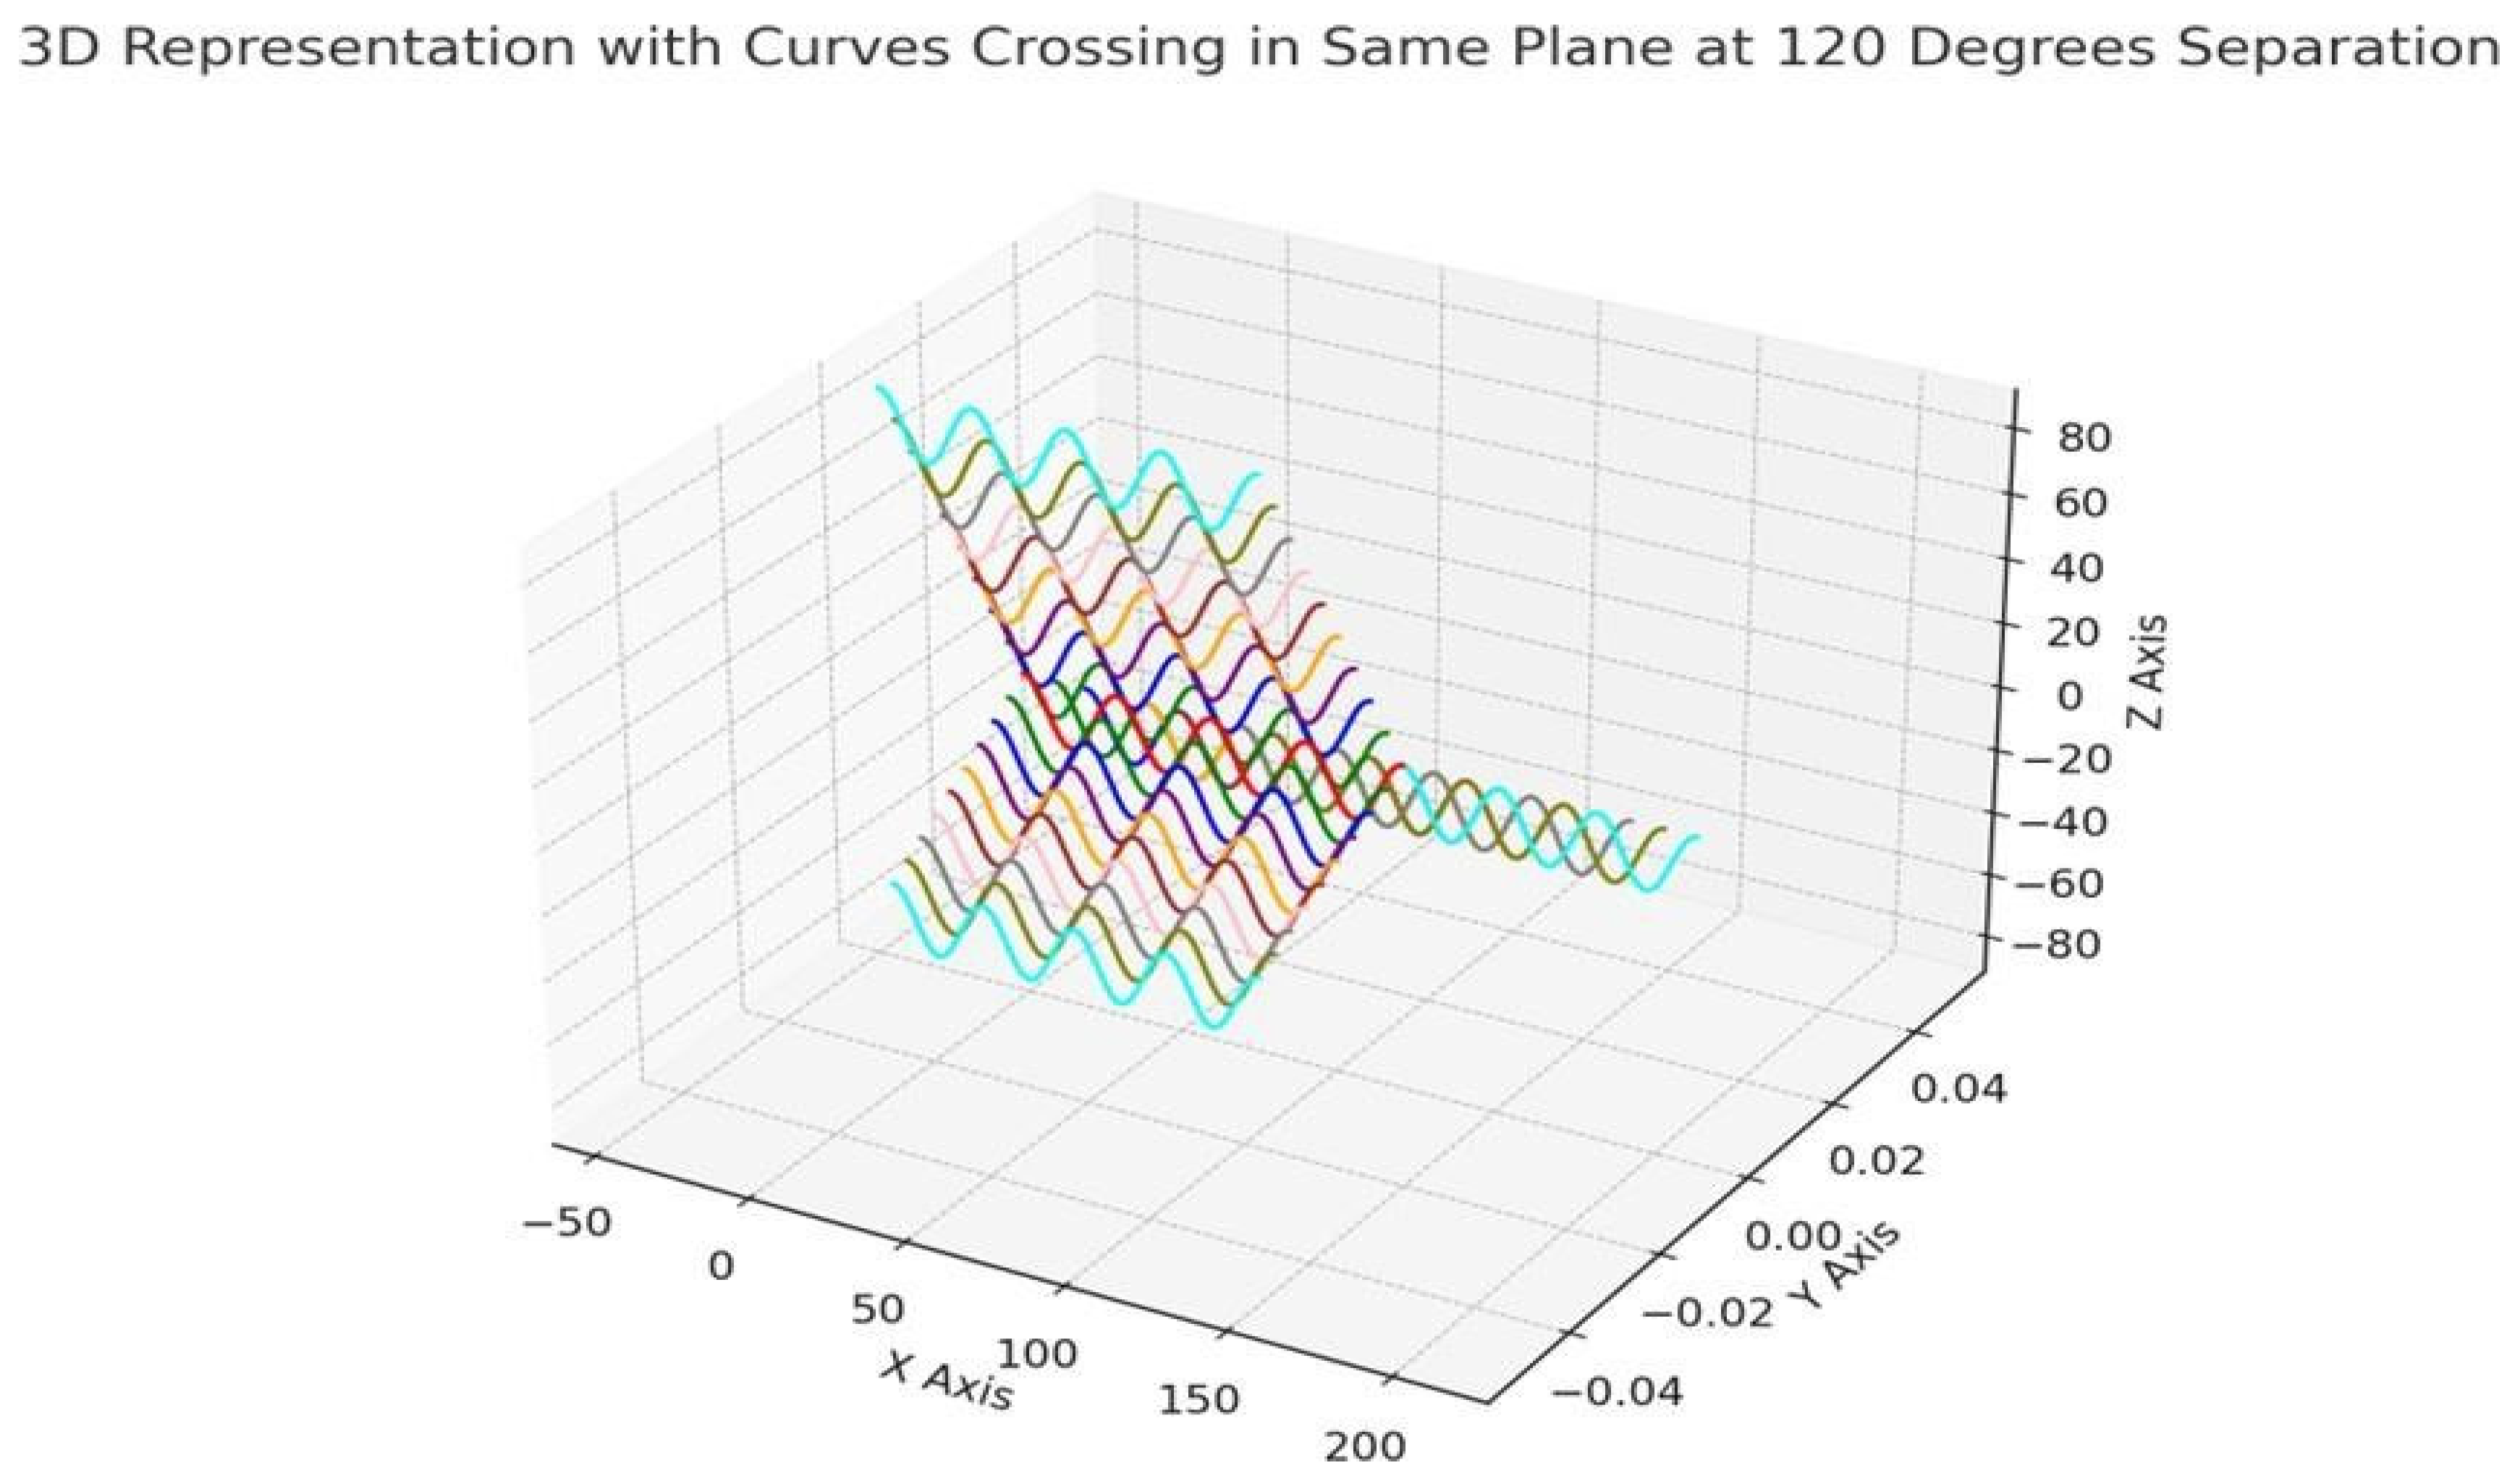
Figure 1 shows the waves crossing in the same plane, separated by 120 degrees, creating a radial pattern with three groups of curves.
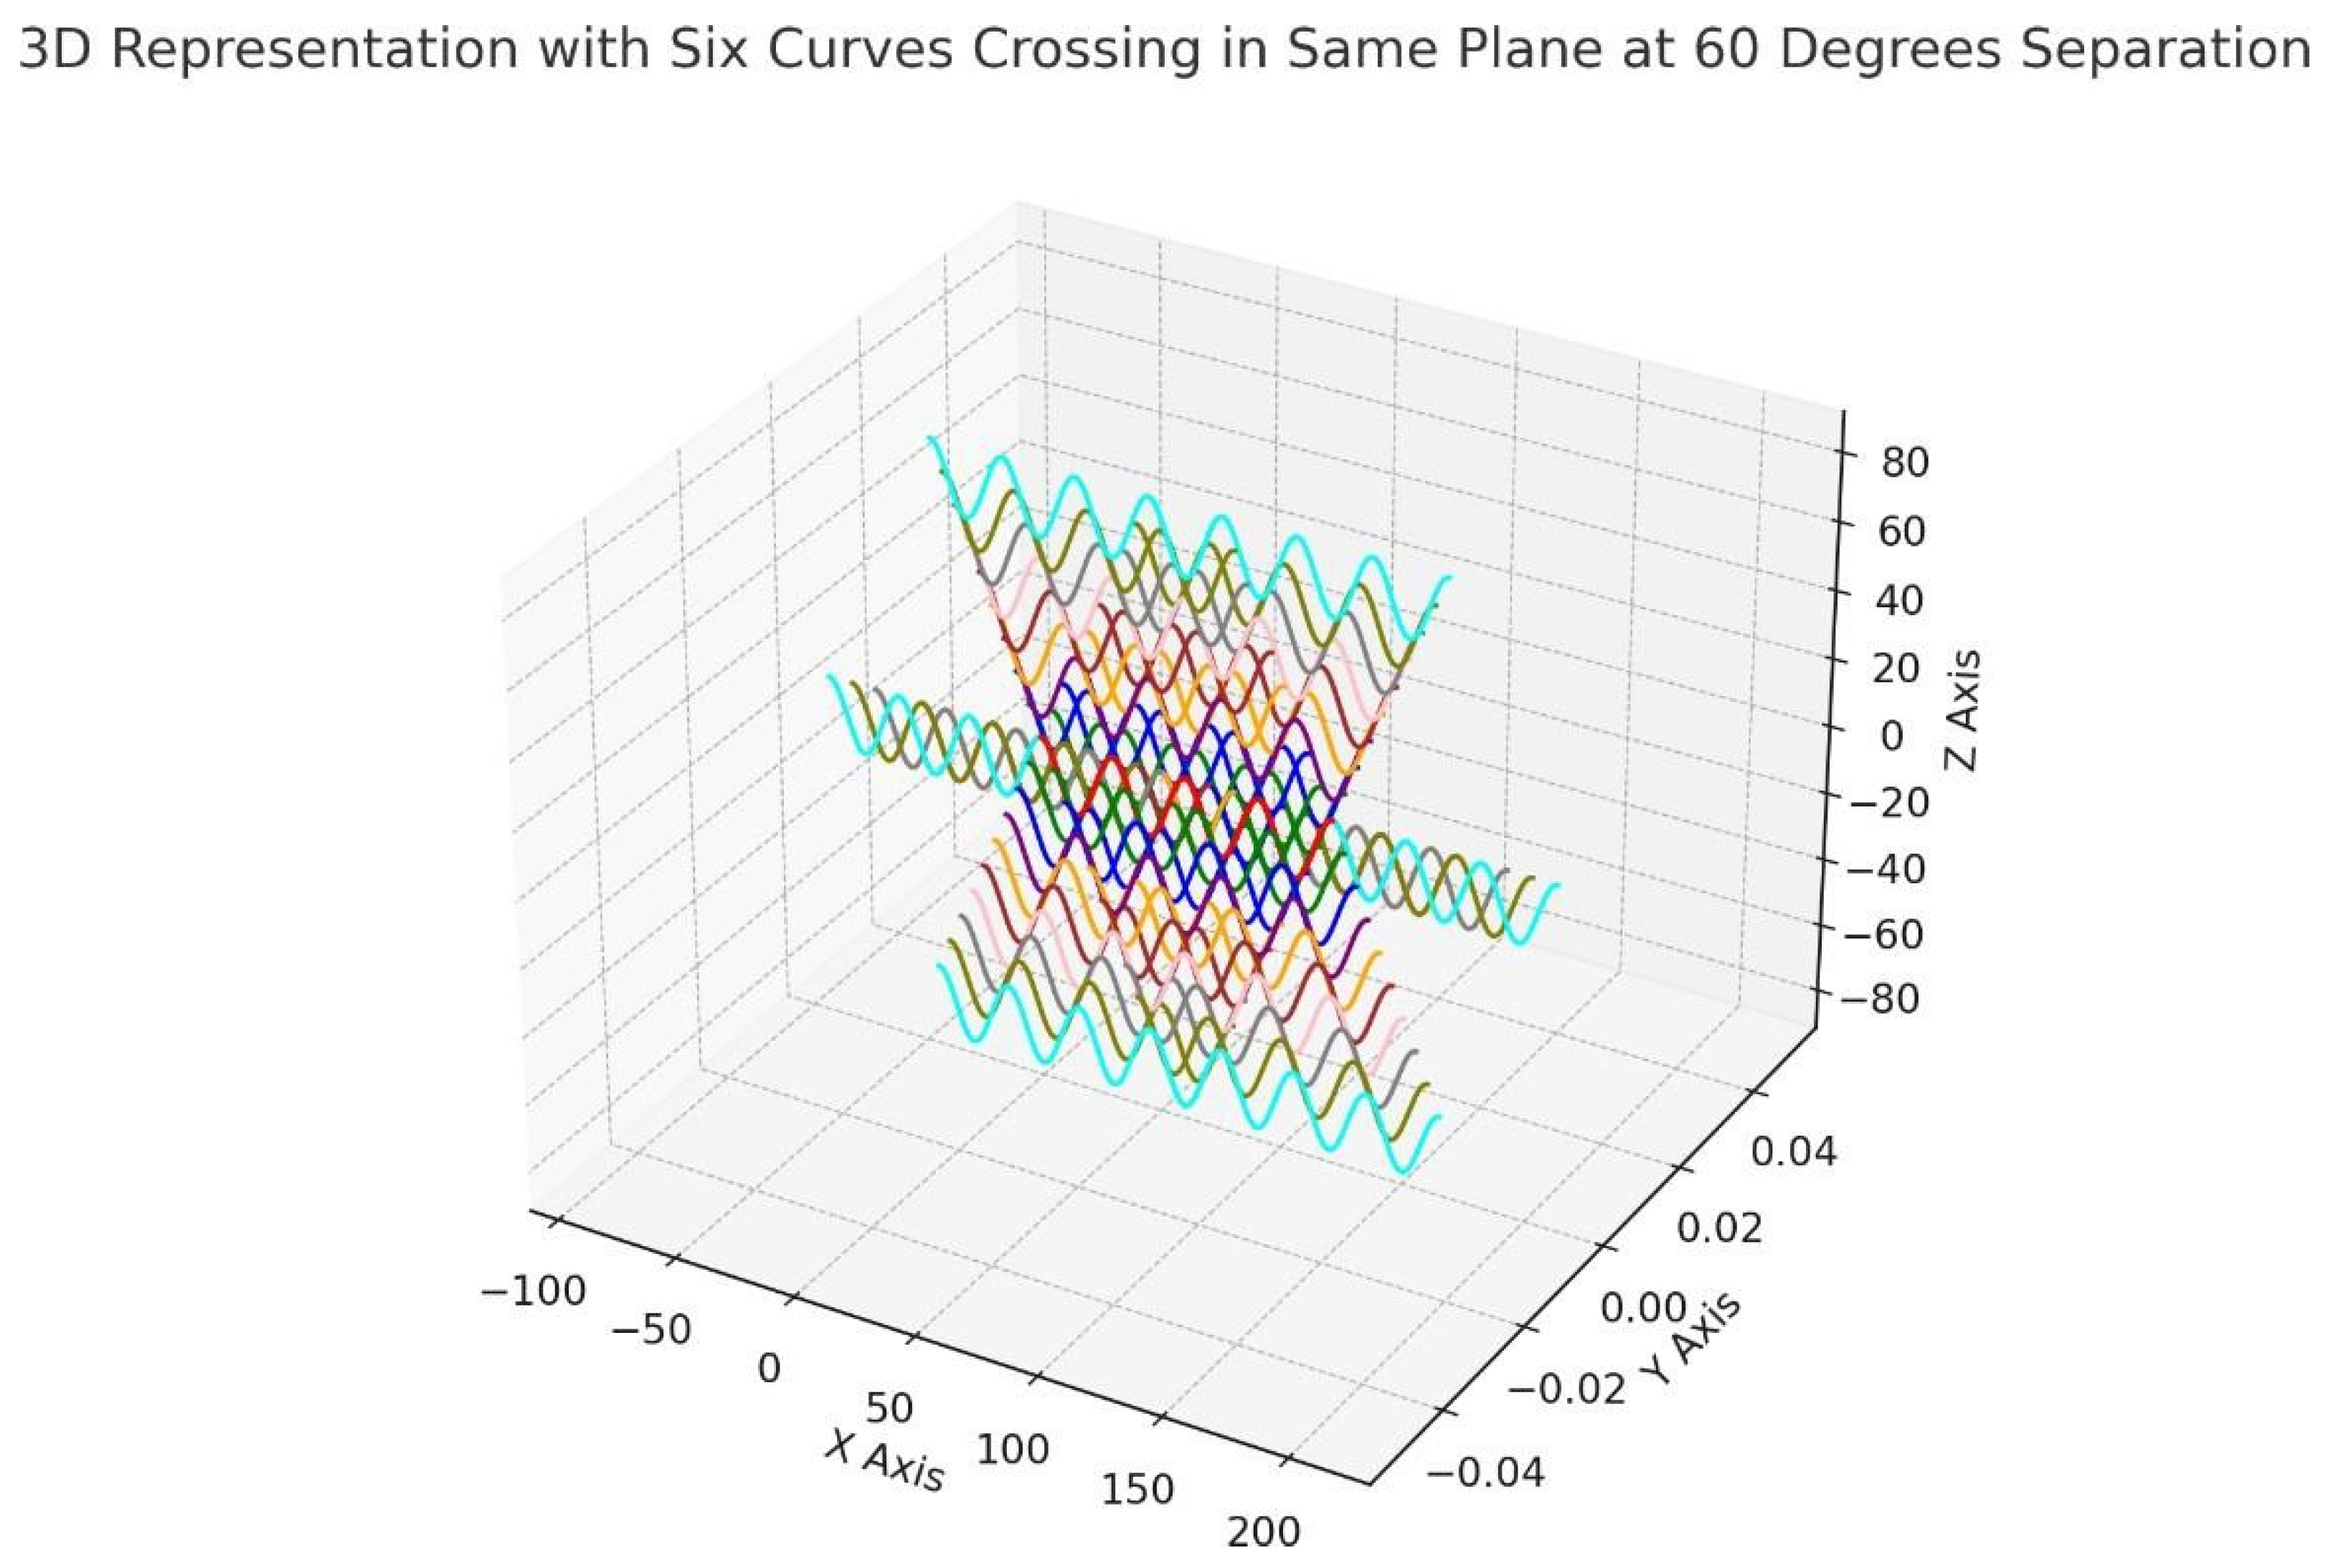
Figure 2 includes six sets of curves, with each set crossing the others at 60-degree intervals, forming a more complex radial pattern.
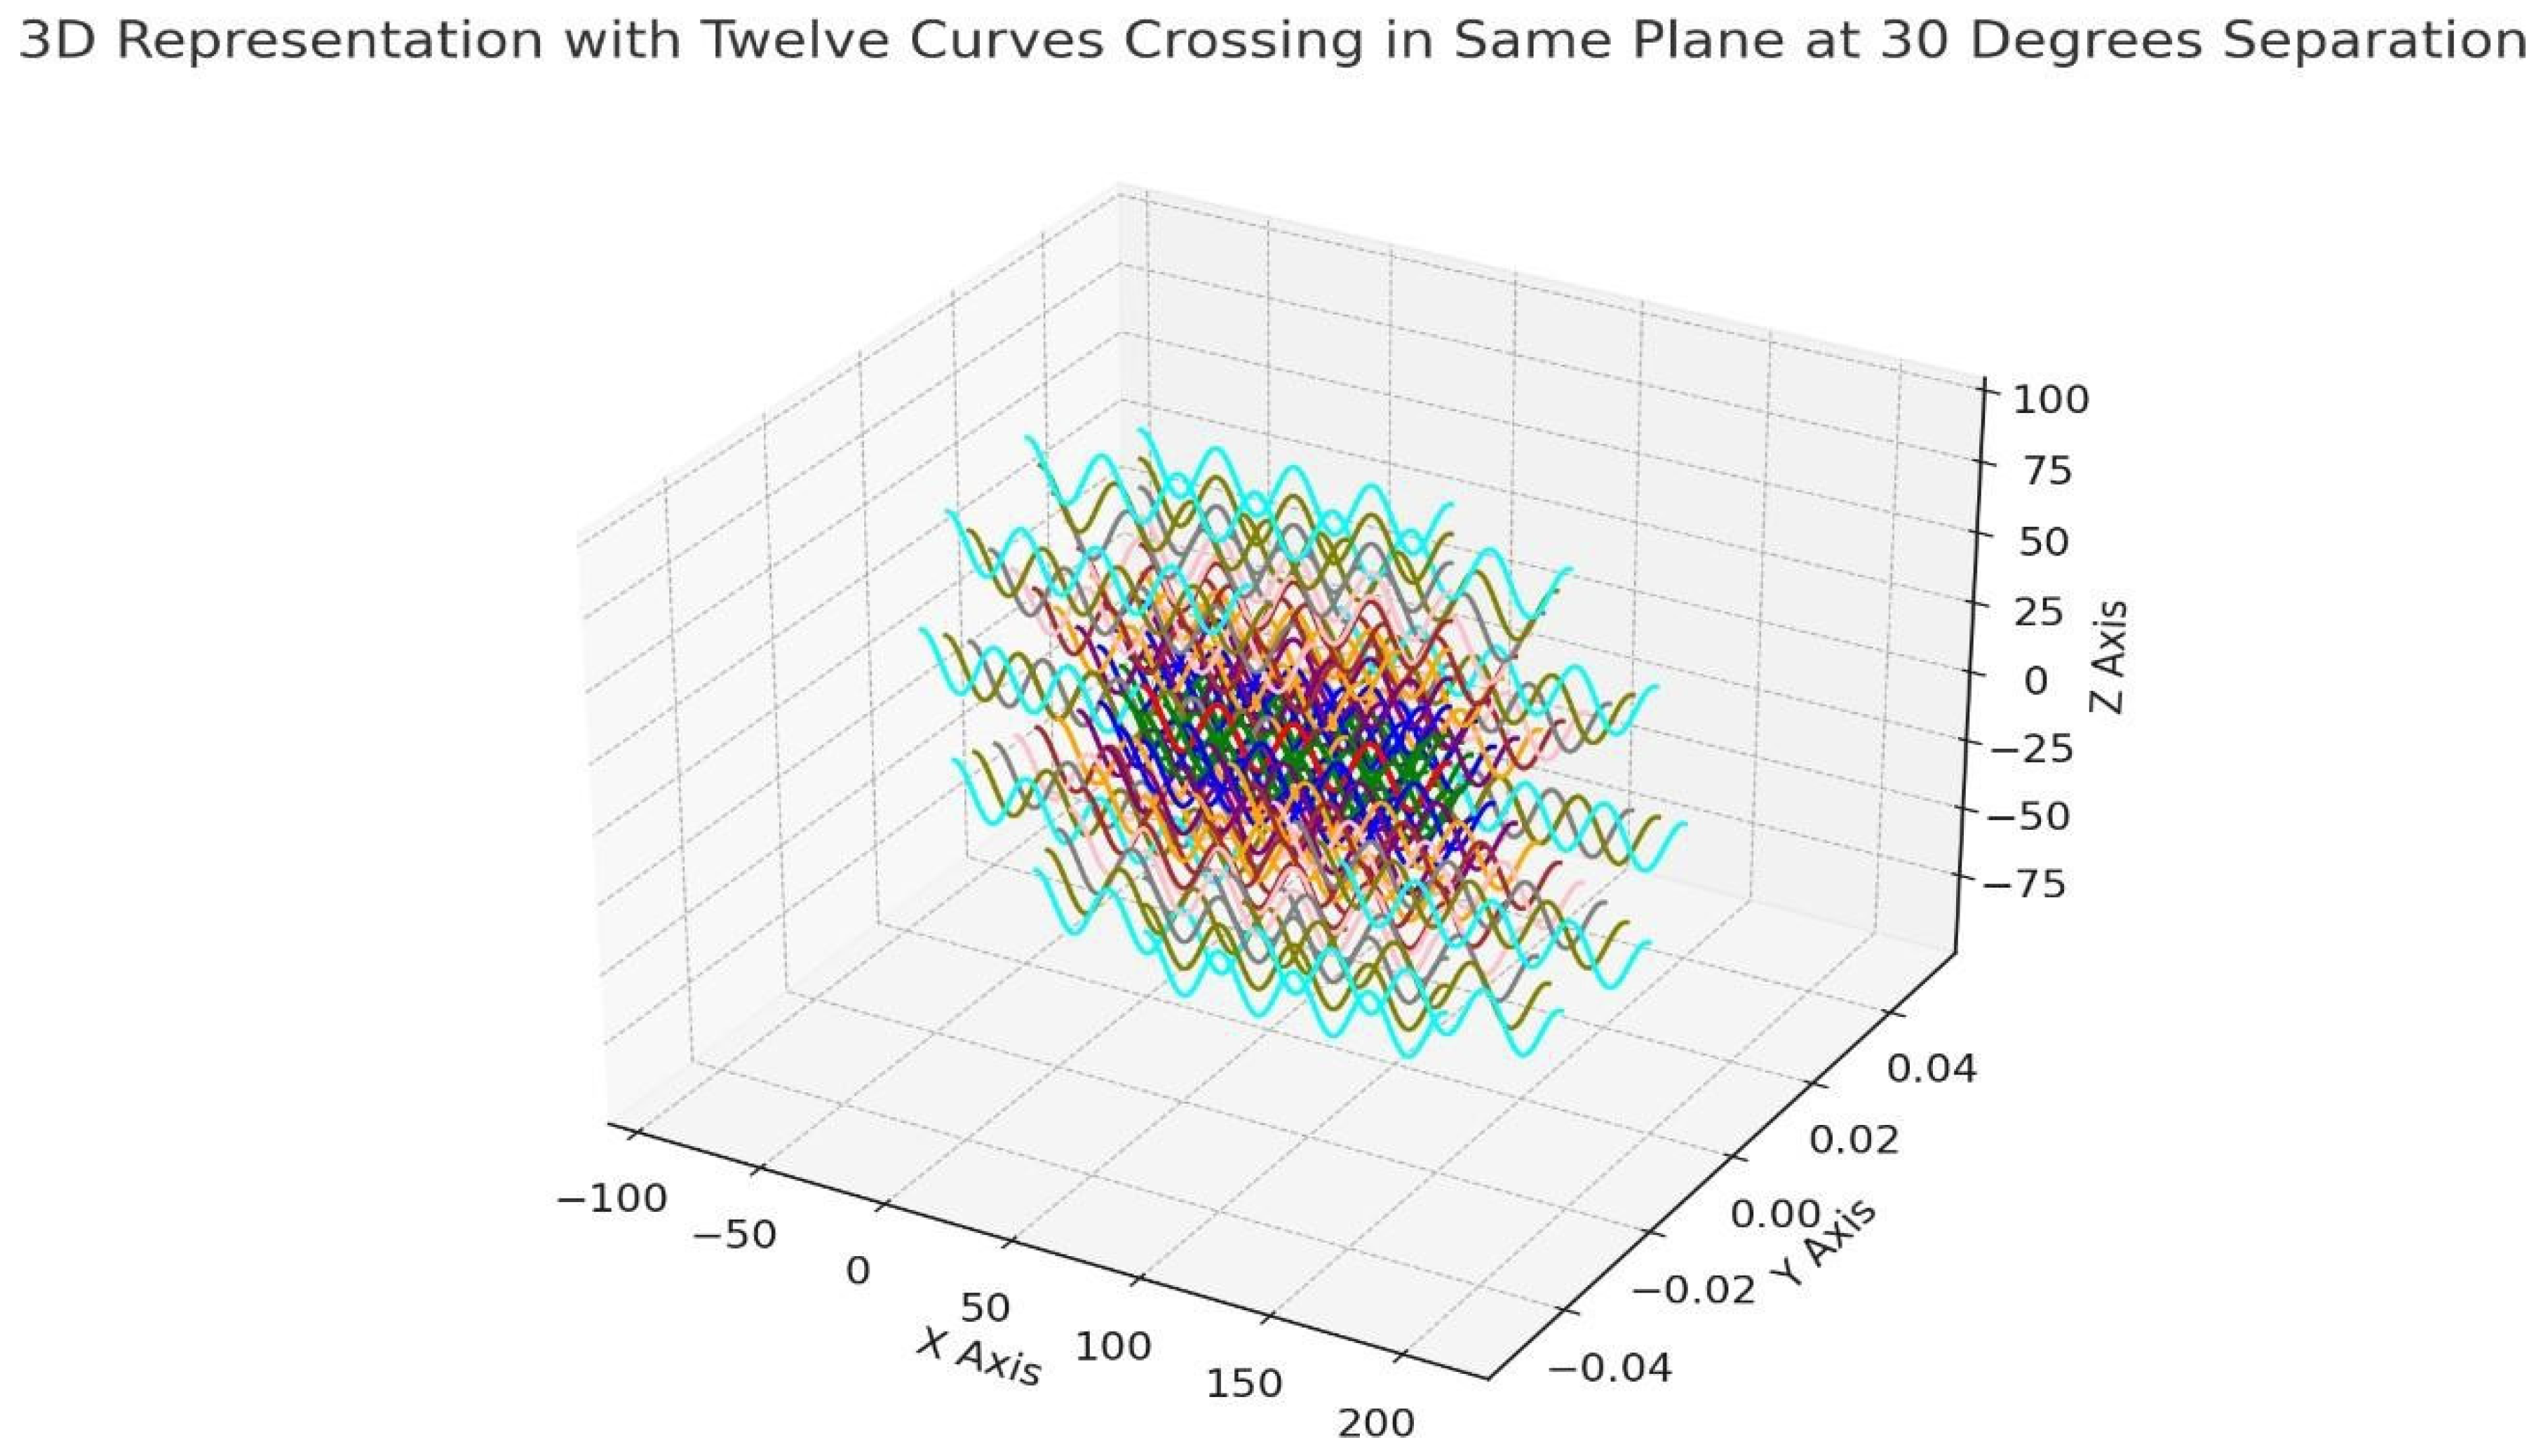
Figure 3 features twelve sets of curves crossing at 30-degree intervals, resulting in a highly intricate radial pattern.
Figure 4 includes twenty-four sets of curves crossing at 15-degree intervals, creating an extremely dense and symmetrical design.
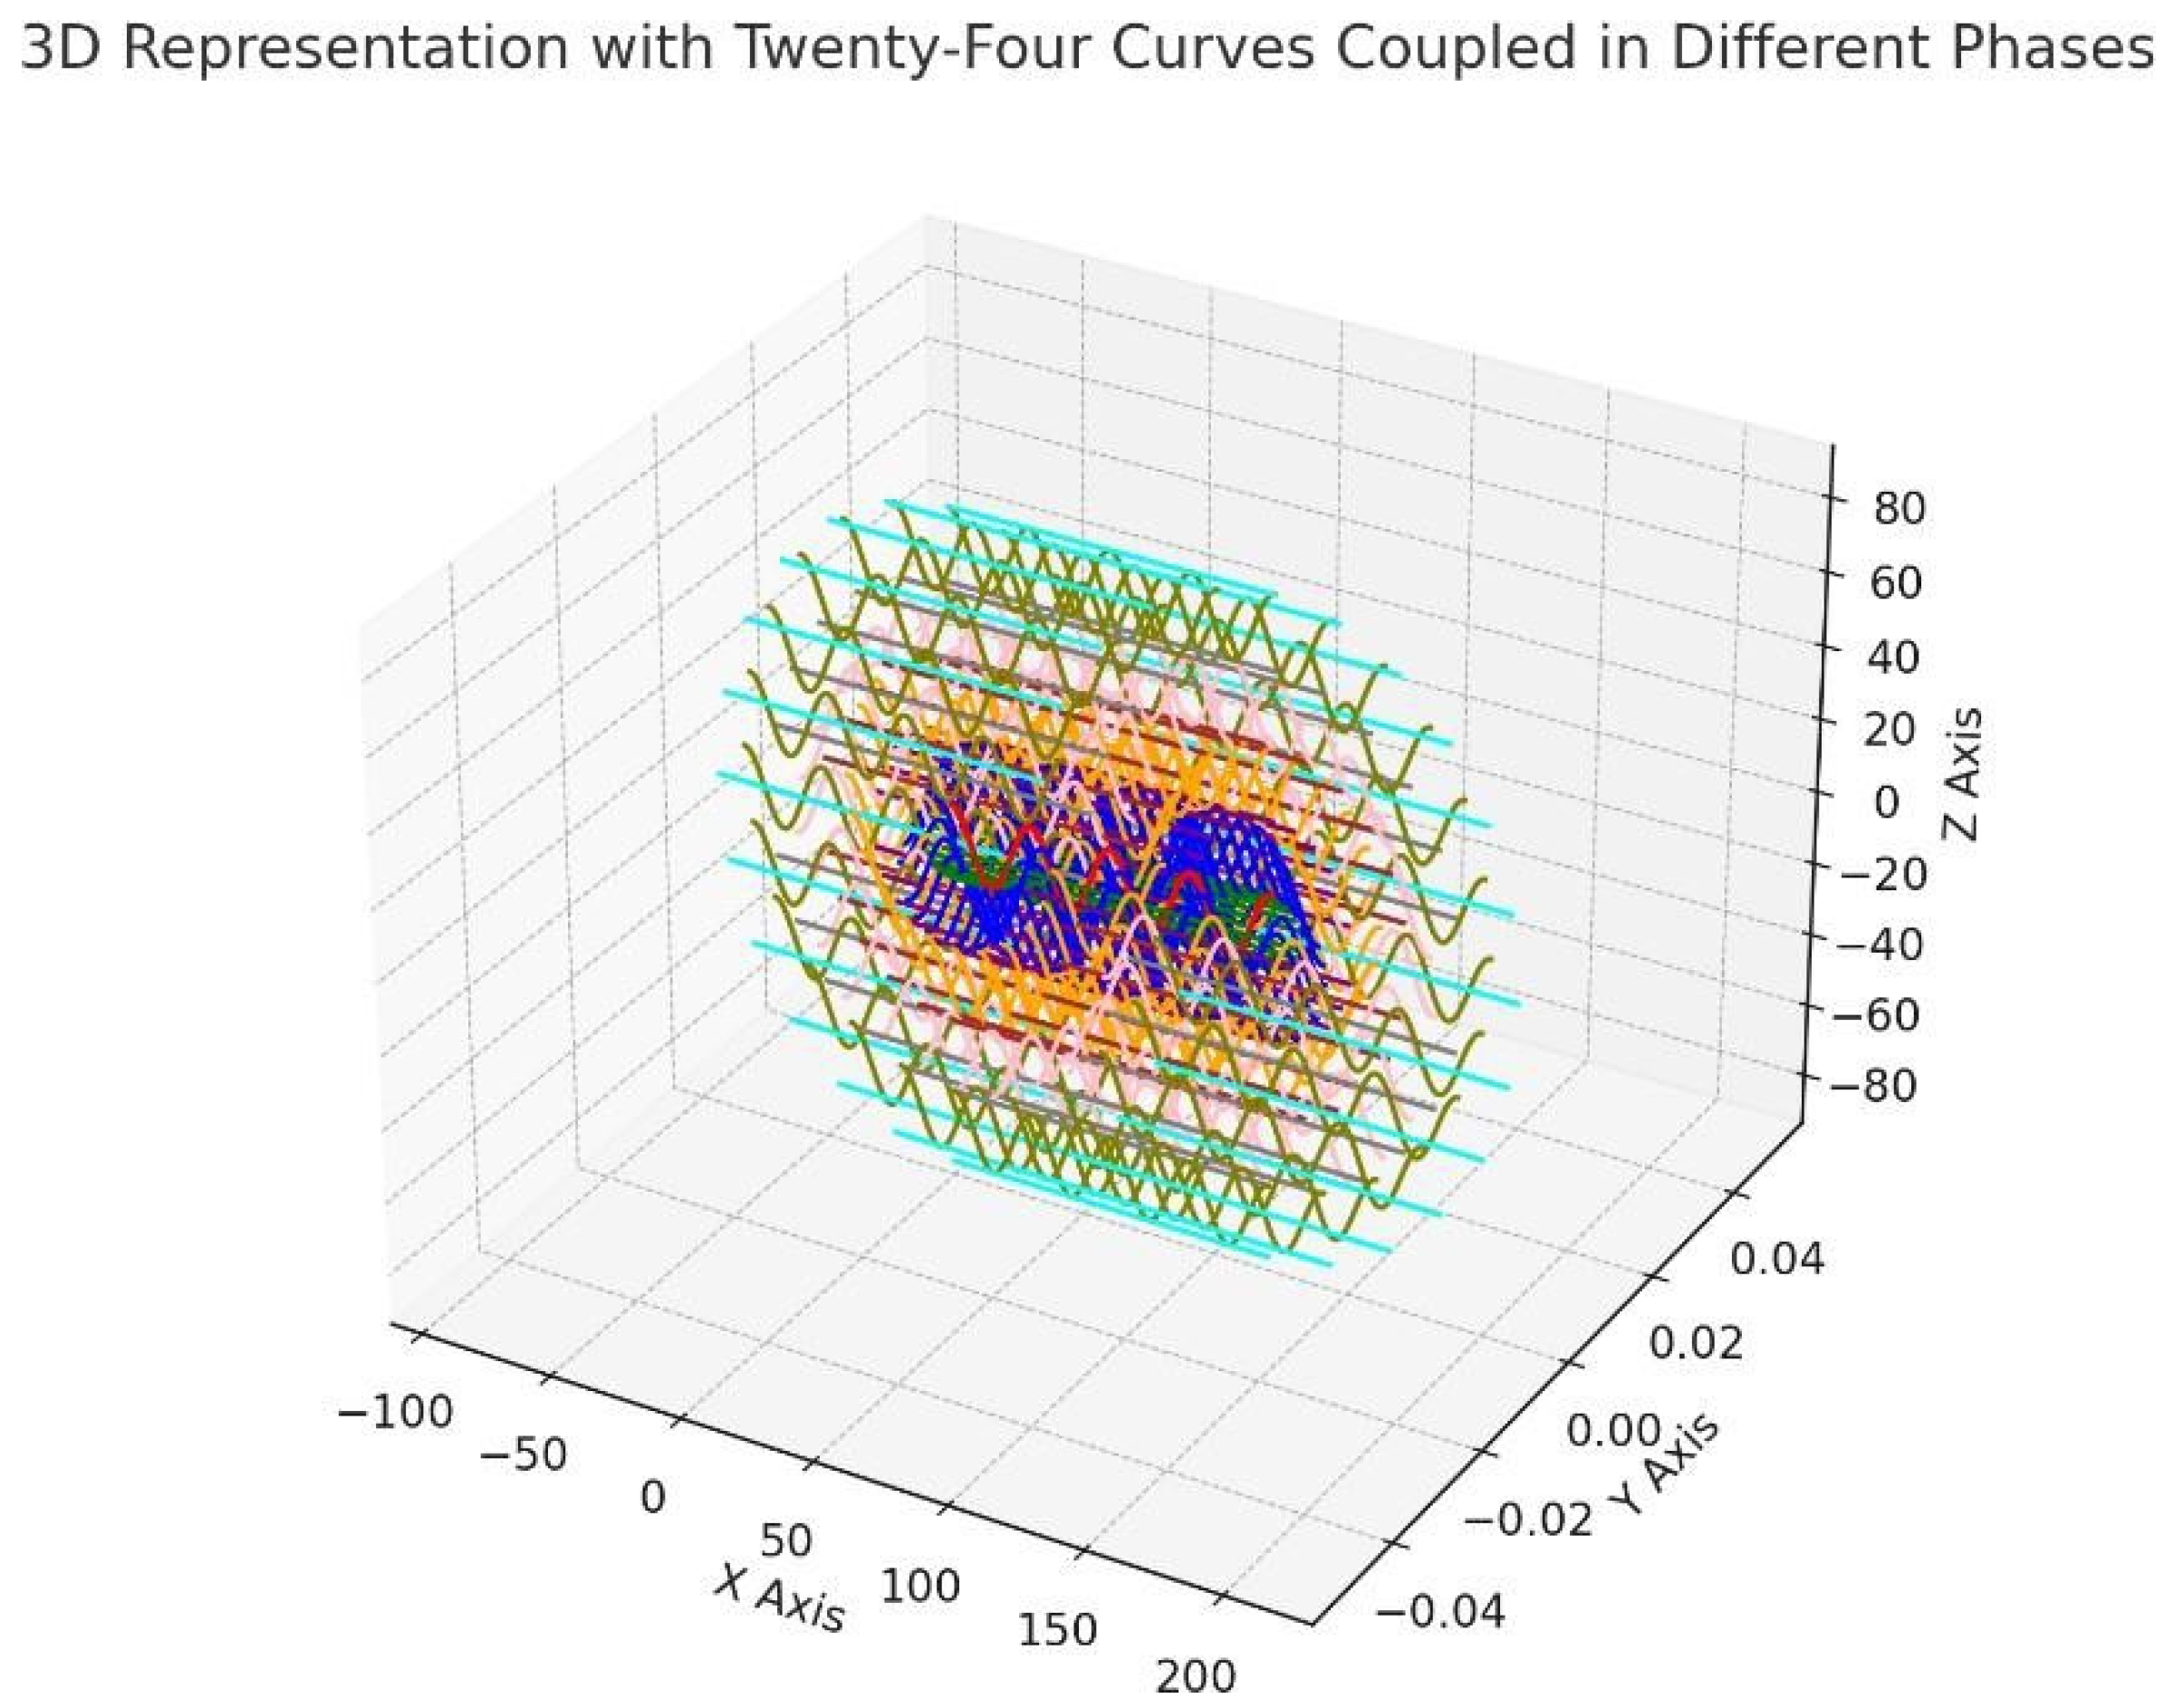
Figure 5 and
Figure 6 demonstrate the effect of phase shifts on the patterns, with the curves coupled in different phases and quarter phases, respectively.
Figure 7 and
Figure 8 show the impact of increasing the frequencies of the curves, resulting in more rapid oscillation patterns and highly detailed waveforms.
Discussion
The exploration of the hippocampus and its role in memory acquisition provides profound insights into one of the most intricate aspects of human cognition. The hippocampus's dual role in encoding sensory information and consolidating memories positions it as a critical gateway in the memory formation process [
24]. The presence of specialized cells like place cells and grid cells within the hippocampus underscores its role in spatial memory and navigation [
25].
The ongoing neurogenesis in the hippocampus echoes the sentiments regarding the evolving nature of graph representations [
26,
27]. The hippocampus's interaction with other brain regions, such as the amygdala for emotional memories, parallels the multi-faceted approach to data visualization [
28]. The concept of synaptic plasticity in the hippocampus, where the strengthening or weakening of synapses underlies memory encoding and storage, reflects the principles in data science and visualization, where flexible and dynamic models are key to accurate representation of information [
29].
Conclusions
The exploration of the hippocampus reveals intricate processes that are fundamental to memory formation, consolidation, and retrieval. This journey into understanding the hippocampus not only illuminates the complexities of the human brain but also mirrors broader principles applicable across various fields, including data visualization and information science.
The study of the hippocampus transcends the boundaries of neuroscience, offering valuable insights into the fundamental nature of information processing, storage, and retrieval, as the sequence of graphs shows. It showcases the interconnectedness of various disciplines and underscores the need for a holistic approach to understanding complex systems. As research continues to unravel the mysteries of the hippocampus, it not only enhances our comprehension of the human brain but also provides guiding principles for fields as diverse as artificial intelligence, psychology, and data science, demonstrating the interconnectedness and universality of knowledge.
References
- Friendly, M. (2006). Data visualization: Principles and practices. Journal of Computational and Graphical Statistics, 15(2), 269-288.
- Ware, C. (2004). Information visualization: Perception, design, and evaluation. Morgan Kaufmann.
- Cleveland, W. S. (1993). Visualizing data: Exploring data analysis with visual methods. Hobart Press.
- Kobler, S. G. (2004). Graph drawing: Algorithms for visualization of graphs. Springer.
- Jackson, B. M., & Holten, D. (2010). The elements of graph drawing. IEEE Transactions on Visualization and Computer Graphics, 16(6), 1059-1068.
- Di Battista, G. , Eades, P., Tamassia, R., & Tollis, I. G. (2002). Graph visualization: A survey. Journal of Graph Algorithms and Applications, 6(1), 1-68.
- Ruley, N. (2020). Visualizing data with Matplotlib. Packt Publishing.
- Allaire, J. J. , Xie, Y., McPherson, J., Luraschi, J., Ushey, K., Atkins, A.,... & Chang, W. (2019). Data visualization with Python and JavaScript. O'Reilly Media.
- Eichenbaum, H. B. (2004). The hippocampus and memory: A review and a hypothesis. Neuron, 44(1), 109-120.
- Burgess, N., Maguire, E. A., & O'Keefe, J. (2002). The human hippocampus and spatial and episodic memory. Neuron, 35(4), 625-641.
- Moser, E. I., & Moser, M. B. (2013). From grid cells to place cells: A tale of spatial memory. Neuron, 80(2), 395-404.
- Squire, L. R. (1992). Memory and the hippocampus: A synthesis from findings with rats, monkeys, and humans. Psychological Review, 99(2), 195-231.
- Tulving, E. (2002). Episodic memory: From mind to brain. Annual Review of Psychology, 53, 1-25.
- Nadel, L., & O'Keefe, J. (1978). The hippocampus as a cognitive map. Oxford University Press.
- O'Keefe, J., & Dostrovsky, J. (1971). The hippocampus as a spatial map: Preliminary evidence from unit activity in the freely-moving rat. Brain Research, 34(1), 171-175.
- Moser, E. I., & Moser, M. B. (2012). Path integration and the cognitive map. Current Opinion in Neurobiology, 22(5), 646-650.
- Hasselmo, M. E., & Giocomo, L. M. (2004). Neural mechanisms of spatial navigation: Role of the hippocampus and entorhinal cortex. Progress in Brain Research, 149, 67-82.
- Buzsáki, G. (2015). Hippocampal sharp wave-ripple: A cognitive biomarker for episodic memory and planning. Hippocampus, 25(10), 1073-1188.
- Lisman, J. E. , & Buzsáki, G. (2009). Distinguishing between information and chaos in hippocampus: A network-based approach. Proceedings of the National Academy of Sciences, 106(14), 5518-5523.
- Eichenbaum, H. B. (2017). The hippocampus: What function does it serve in human memory? Current Opinion in Neurobiology, 43, 26-32.
- Squire, L. R. , & Squire, S. T. (2014). The hippocampus and memory: A historical perspective. In The hippocampus book (pp. 1-23). Oxford University Press.
- Gage, F. H. (2000). Mammalian neural stem cells. Science, 287(5457), 1433-1438.
- Phelps, E. A. (2004). Human emotion and memory: Interactions of the amygdala and hippocampal complex. Current Opinion in Neurobiology, 14(2), 198-202.
- Amarasinghe, D. , & Arvind, V. (2005). Visualization techniques for large-scale datasets. IEEE Transactions on Visualization and Computer Graphics, 11(3), 345-354.
- O'Keefe, J. , & Dostrovsky, J. (1978). The hippocampus as a spatial map: Phase-specific firing of hippocampal neurons during spatial tasks. Science, 201(4358), 621-623.
- Mackinlay, B. (1986). Common graphic elements for interactive applications. Proceedings of the ACM CHI Conference on Human Factors in Computing Systems, 242-247.
- Wilkinson, L. (2005). The grammar of graphics. Springer.
- Bollen, C. R. , Ward, M. O., & Keim, D. A. (2017). Multidimensional data visualization. In Handbook of data visualization (pp. 1-37). Springer.
- Heer, J., & Shneiderman, B. (2009). Interactive dynamics for visual analysis. Queue, 7(2), 30-55.
Figure 1.
The revised graph now accurately represents the waves crossing in the same plane, separated by 120 degrees. This configuration creates a radial pattern with three groups of curves, each set radiating out from the central point in the plane and intersecting in a symmetrical manner. The different colors for each set of curves enhance the visual distinction, illustrating the 120-degree separation between each group.
Figure 2.
The updated graph now includes six sets of curves, with each set crossing the others in the same plane at 60-degree intervals. This arrangement creates a more complex radial pattern, where the groups of curves form a symmetrical, intricate design in the plane. The use of different colors for each set of curves helps in distinguishing them, emphasizing the 60-degree separation and the intersection points.
Figure 3.
The graph now features twelve sets of curves, each crossing the others in the same plane at 30- degree intervals. This configuration creates a highly intricate radial pattern, with the groups of curves forming a dense, symmetrical design. The different colors for each set of curves highlight the complexity and the precision of the 30-degree separation, enhancing the visual impact of their intersections.
Figure 4.
The graph now includes twenty-four sets of curves, each crossing the others in the same plane at 15-degree intervals. This arrangement results in an even more complex radial pattern, with the groups of curves forming an extremely dense and symmetrical design. The use of different colors for each set of curves further accentuates the intricacy of the 15-degree separation, showcasing the detailed intersections in this visually rich 3D space.
Figure 5.
The graph has been adjusted to show the twenty-four sets of curves coupled in different phases. The phase shift applied to each curve results in a variation in the pattern, adding a new dimension to the radial arrangement. This phase variation creates a dynamic and visually striking pattern, where the symmetrical design is maintained but with a noticeable shift in the waveform of each curve, enhancing the complexity and aesthetic appeal of the 3D representation.
Figure 6.
The graph now displays the twenty-four sets of curves with each set coupled in quarter phases. This quarter phase shift (45 degrees) adds a subtle but distinct variation to each curve within the radial pattern. The phase shift creates a unique wave pattern for each curve, contributing to an intricate and layered visual effect. This complexity enhances the overall aesthetic of the 3D representation, demonstrating the dynamic nature of phase relationships in a visually engaging manner.
Figure 7.
The graph now shows the twenty-four sets of curves with their frequencies doubled. This ad- justment results in a more rapid oscillation pattern for each curve, leading to a denser and more intricate waveform within the radial layout. The effect of the doubled frequency is visually striking, creating a complex and detailed pattern that enhances the depth and dynamism of the 3D representation.
Figure 8.
The graph now features the twenty-four sets of curves with their frequencies increased to four times the original. This further amplification of the frequency results in an even tighter oscillation pattern for each curve, creating a highly detailed and compact waveform within the radial layout. The effect of this increased frequency is visually intricate, producing a complex and layered pattern that significantly enhances the depth and visual interest of the 3D representation.
|
Disclaimer/Publisher’s Note: The statements, opinions and data contained in all publications are solely those of the individual author(s) and contributor(s) and not of MDPI and/or the editor(s). MDPI and/or the editor(s) disclaim responsibility for any injury to people or property resulting from any ideas, methods, instructions or products referred to in the content. |
© 2024 by the authors. Licensee MDPI, Basel, Switzerland. This article is an open access article distributed under the terms and conditions of the Creative Commons Attribution (CC BY) license (http://creativecommons.org/licenses/by/4.0/).
