Submitted:
08 May 2024
Posted:
09 May 2024
You are already at the latest version
Abstract
Keywords:
1. Introduction
2. Literature Review
3. Indicator System Construction and Data Sources
3.1. Construction of Input-Output Indicator System
3.2. Spatial Regression Modelling Indicator System
3.3. Sources of Data
4. Spatial Modelling of Forest Carbon Sink Cross-Evaluation System Based on Evidence-Based Reasoning
4.1. Measurement of Cross-Efficiency of Forest Carbon Sinks
4.2. Information Fusion for Cross-Efficiency Based on ER
4.3. Spatial Regression Model
5. Results
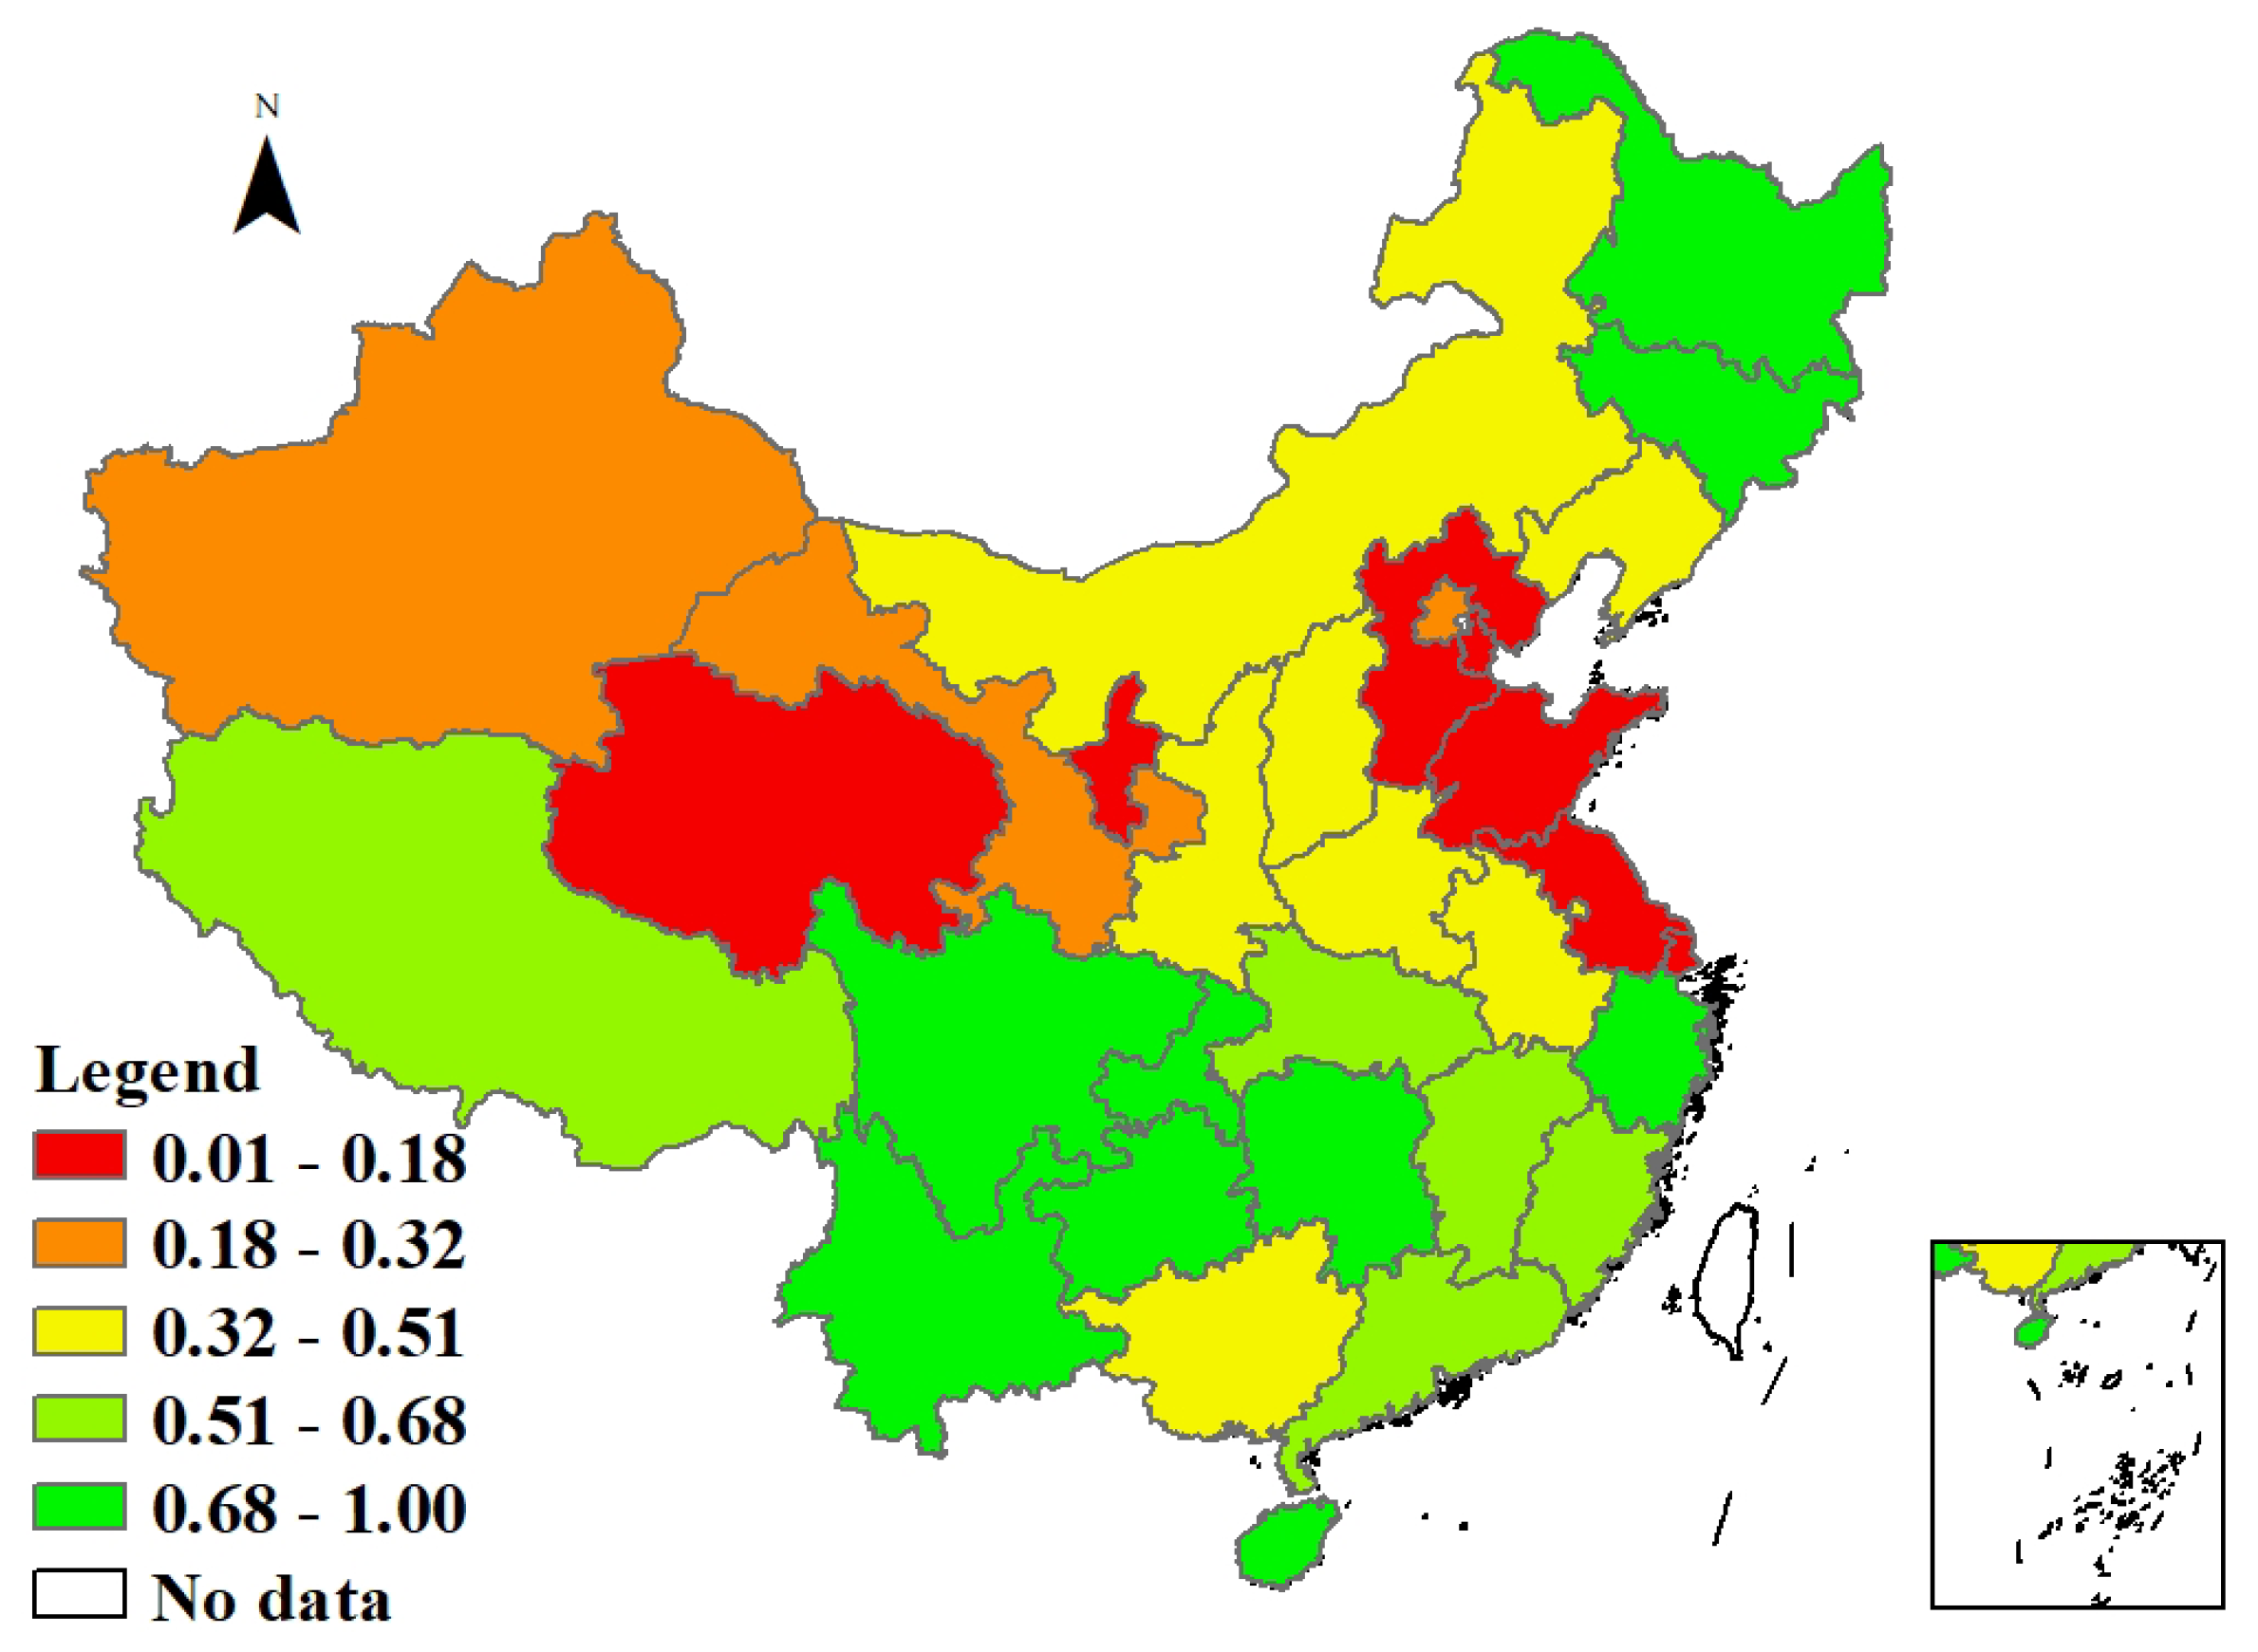
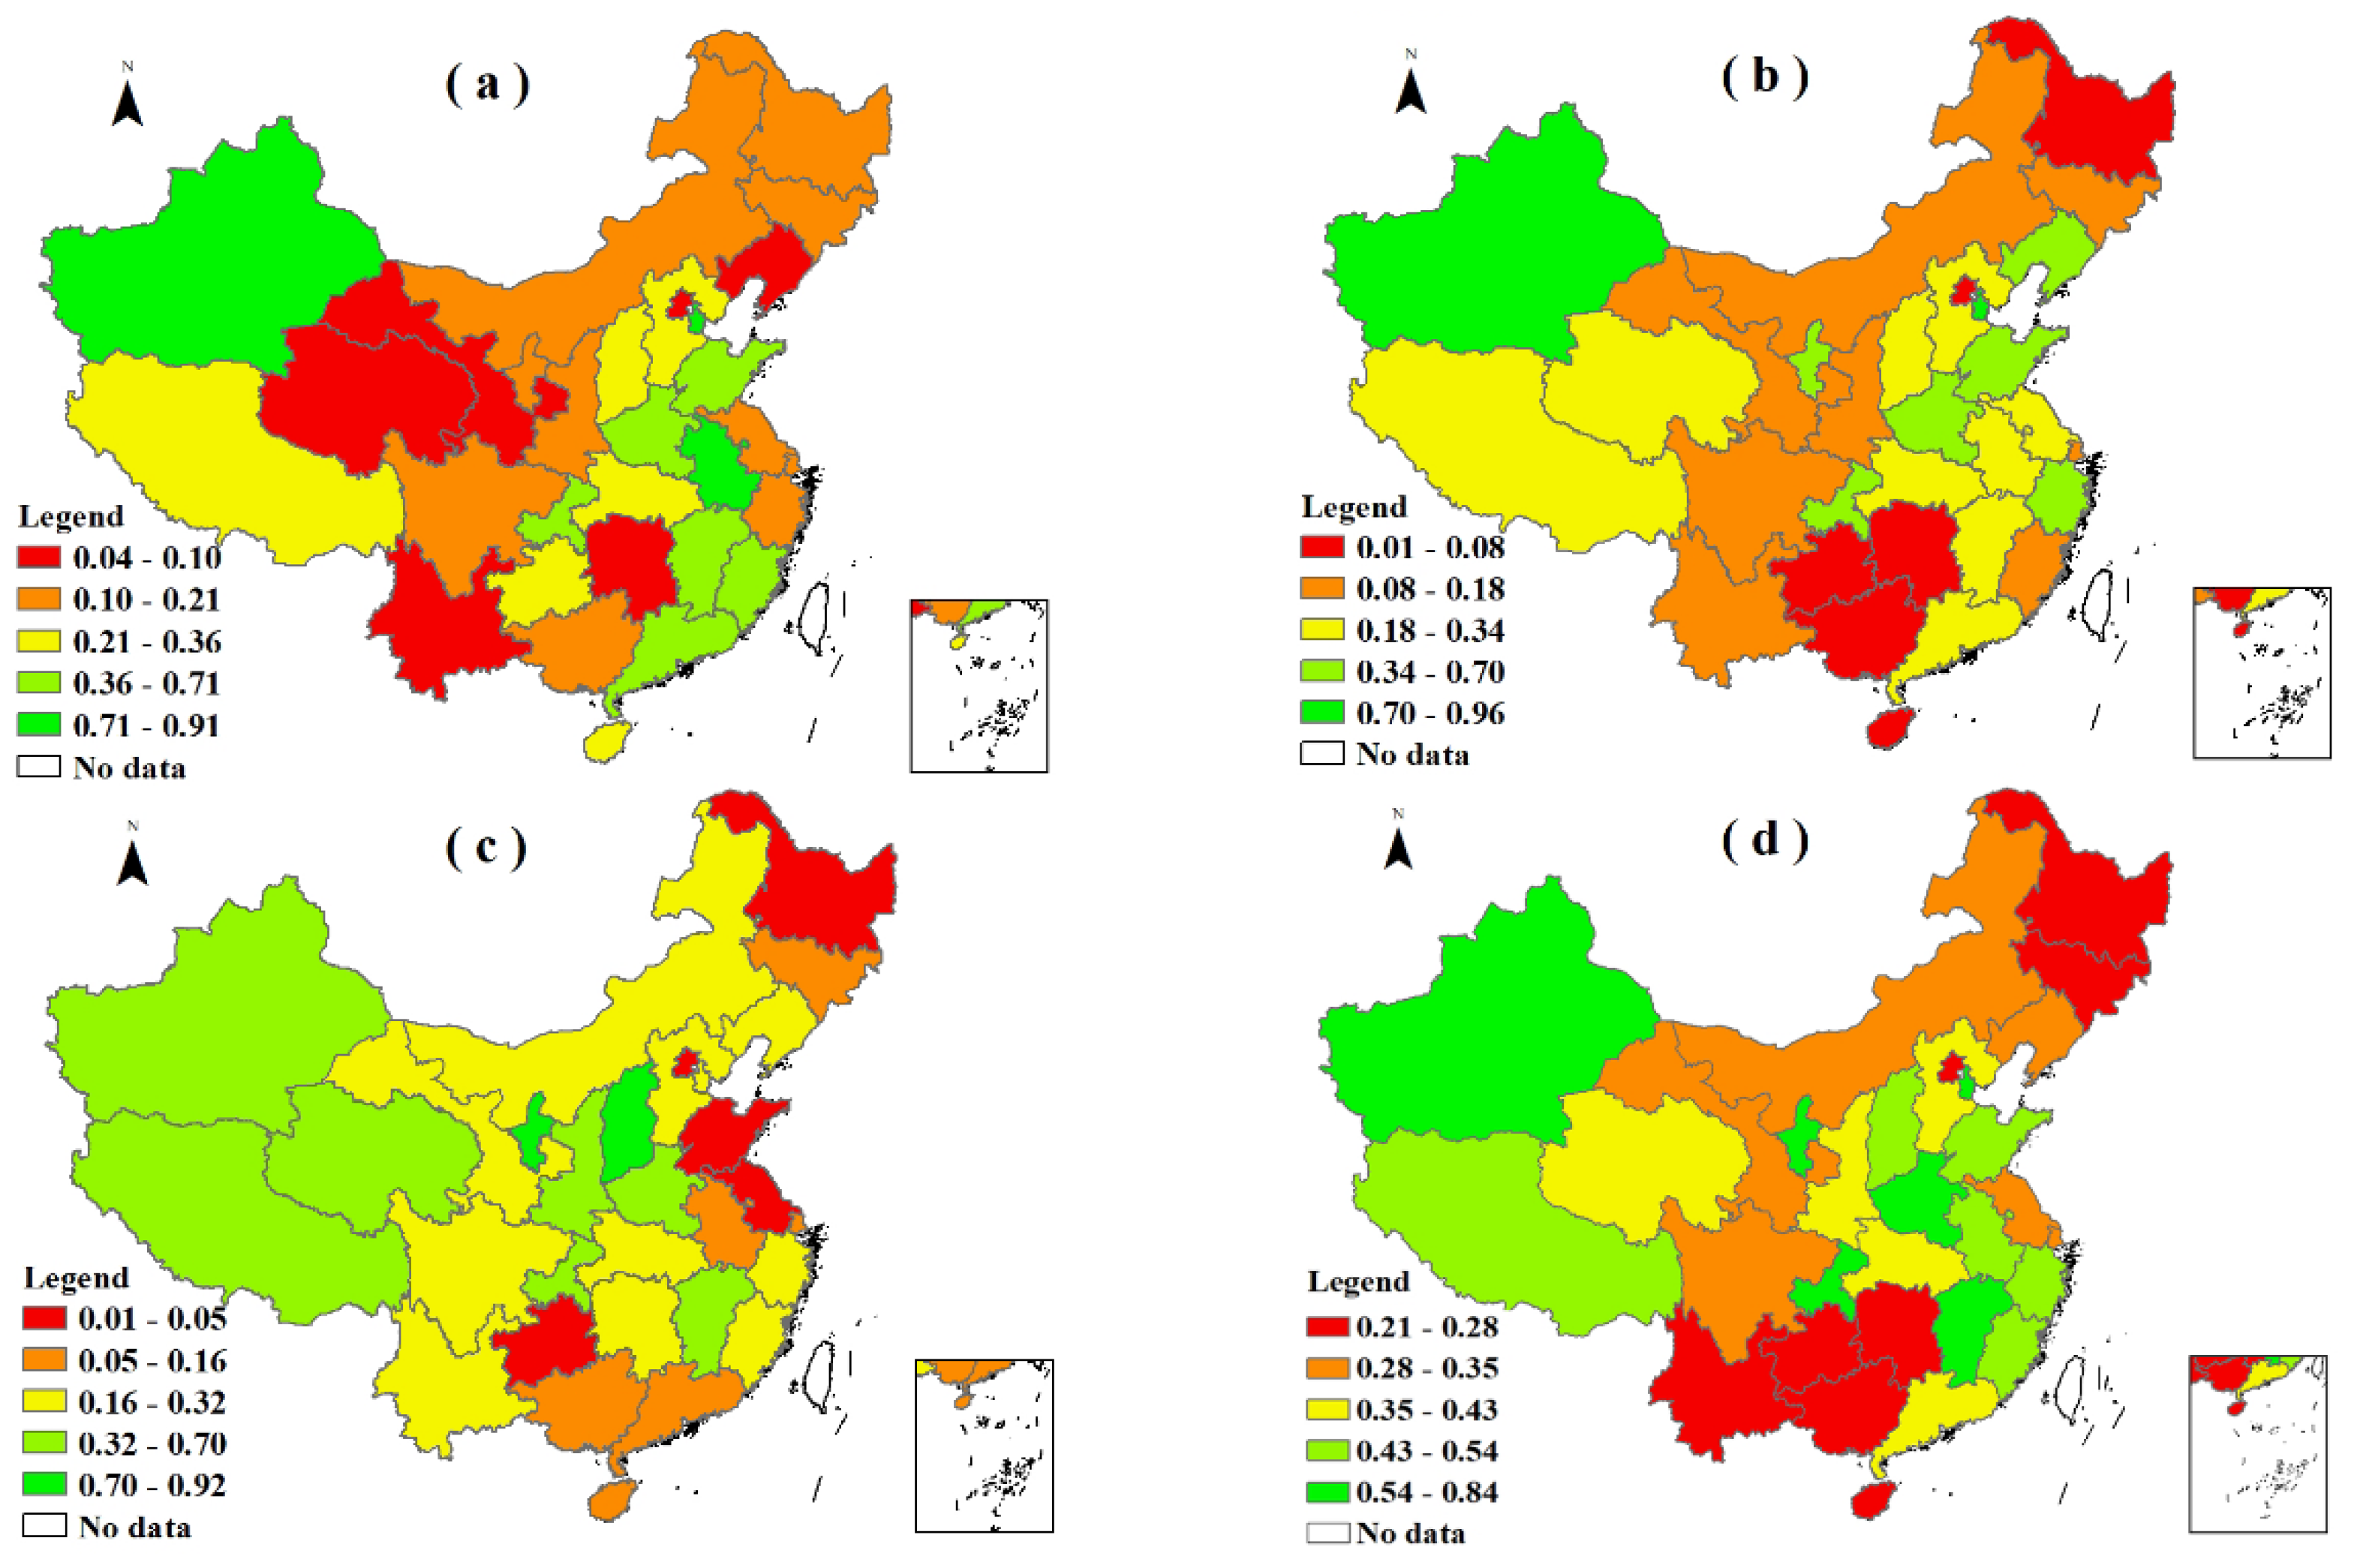
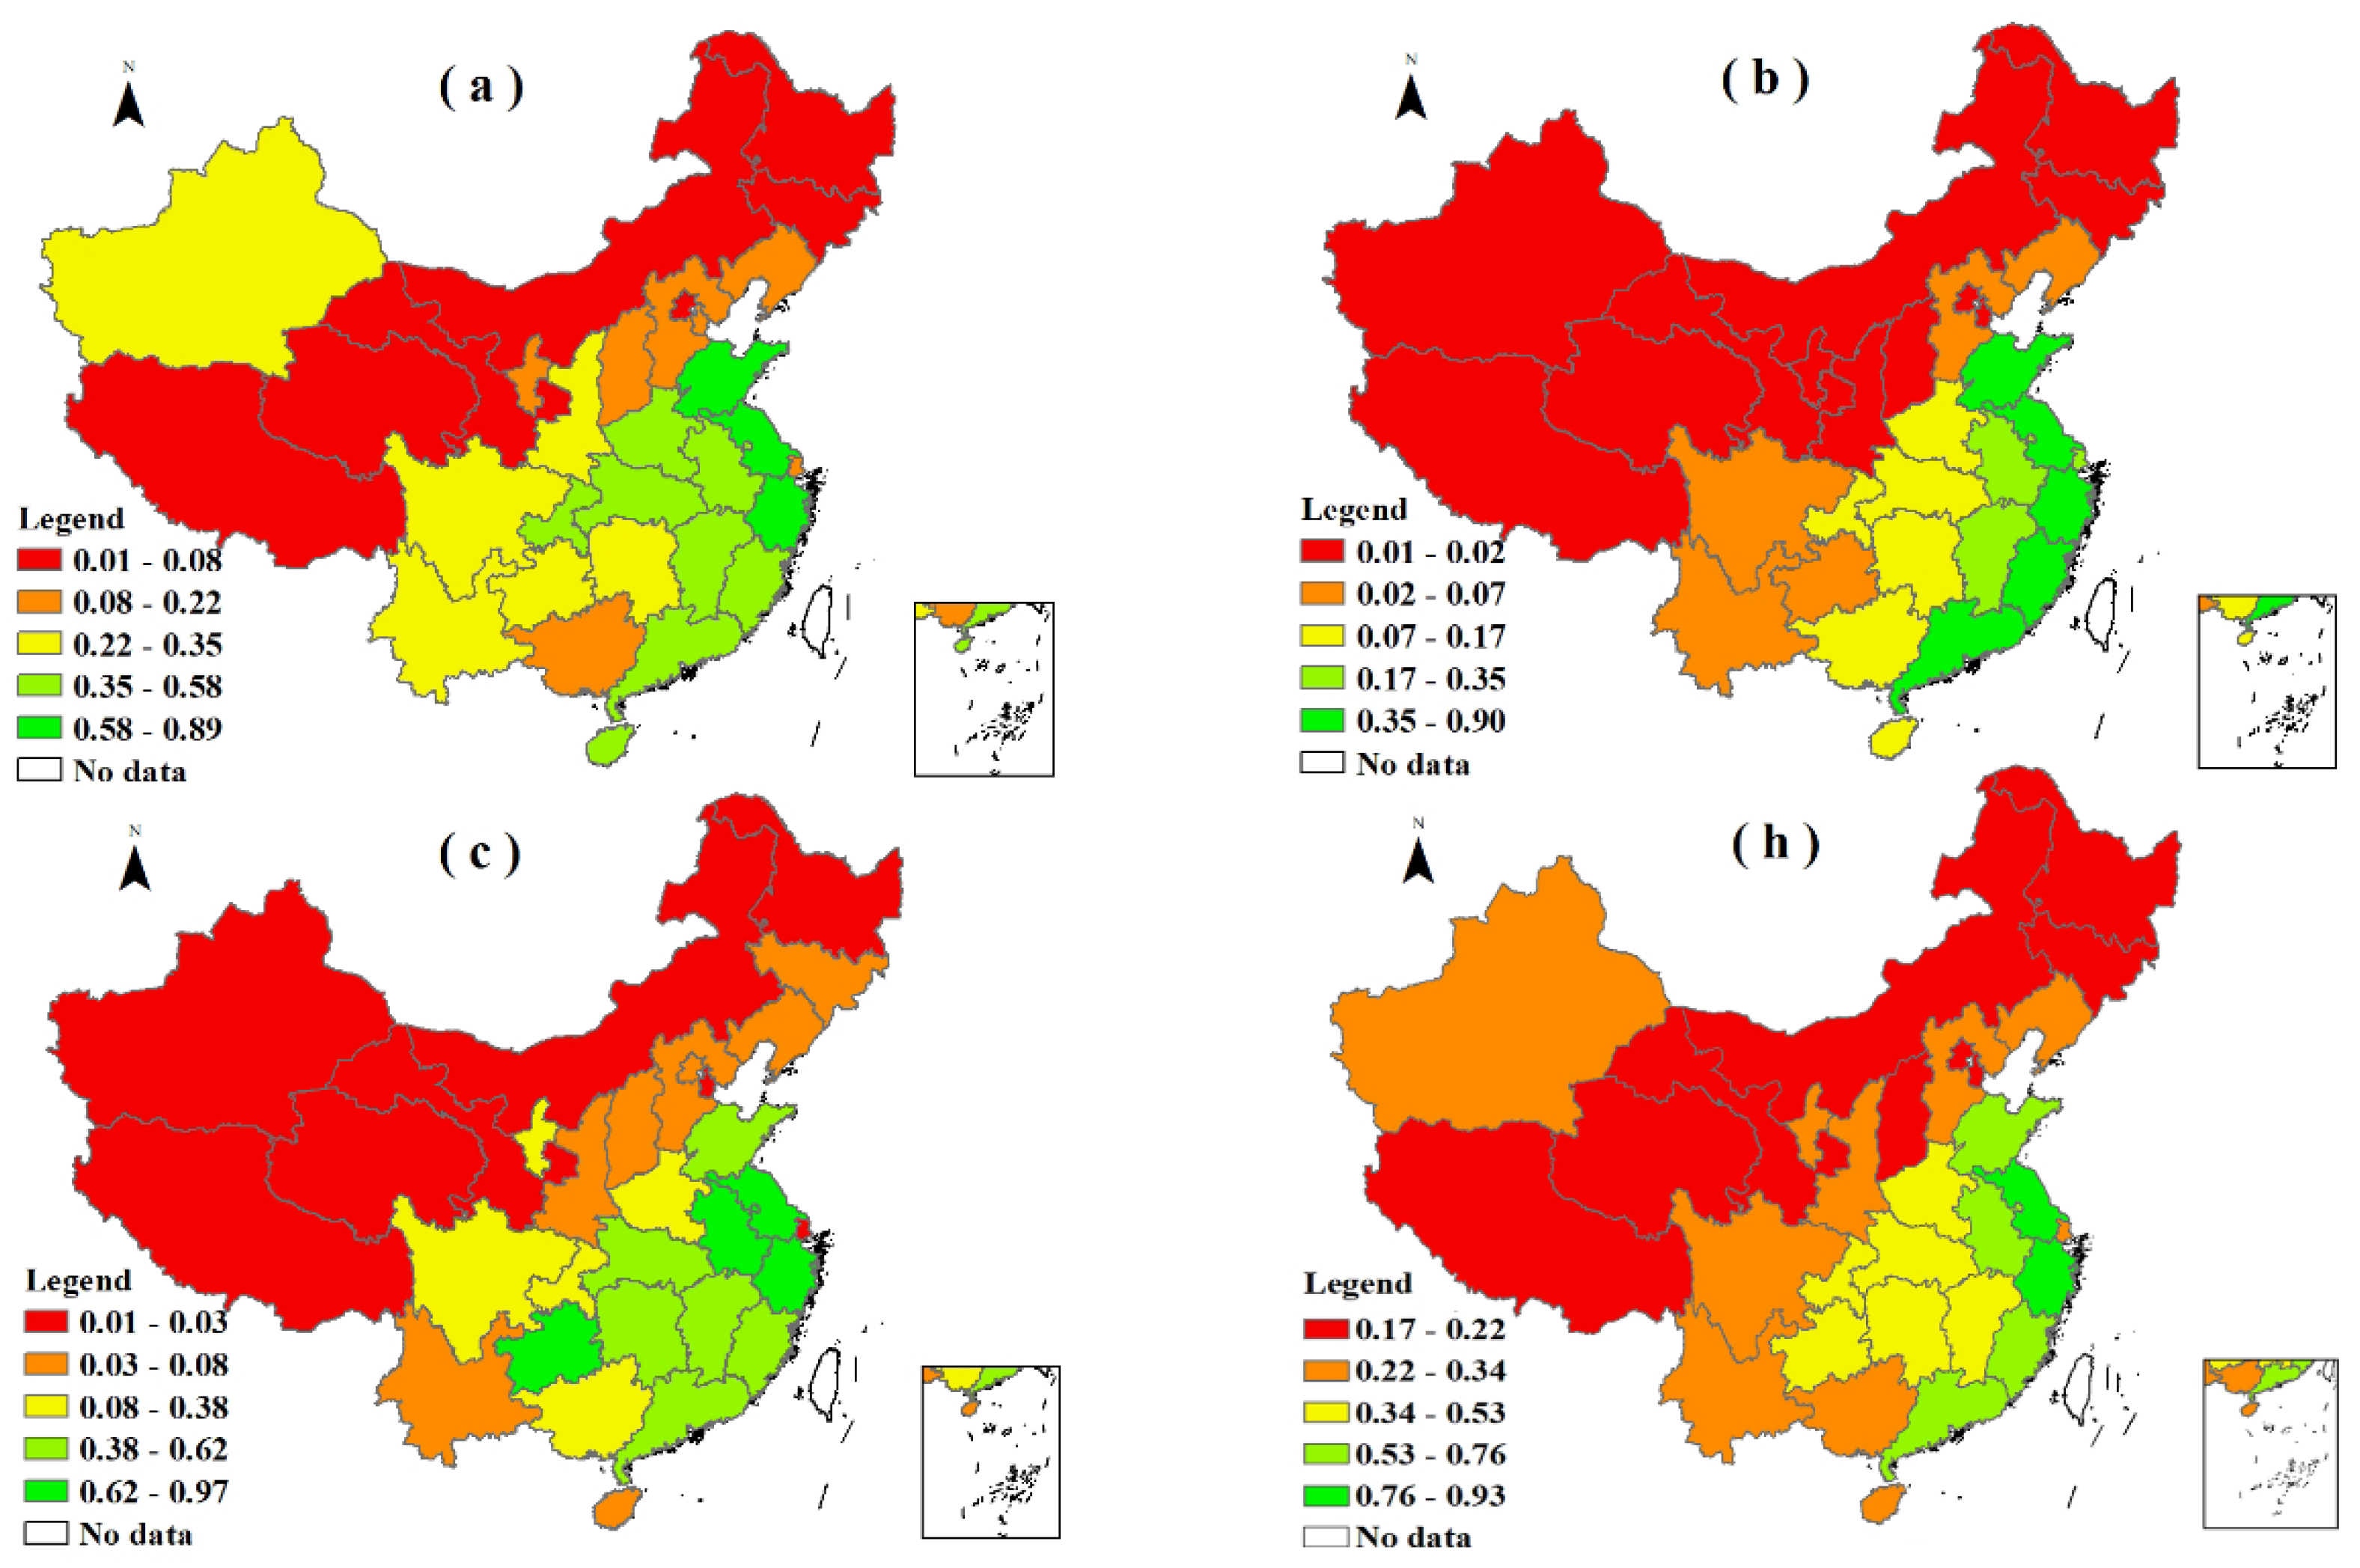
5.1. Results of Cross-Efficiency Evaluation of Forest Carbon Sinks
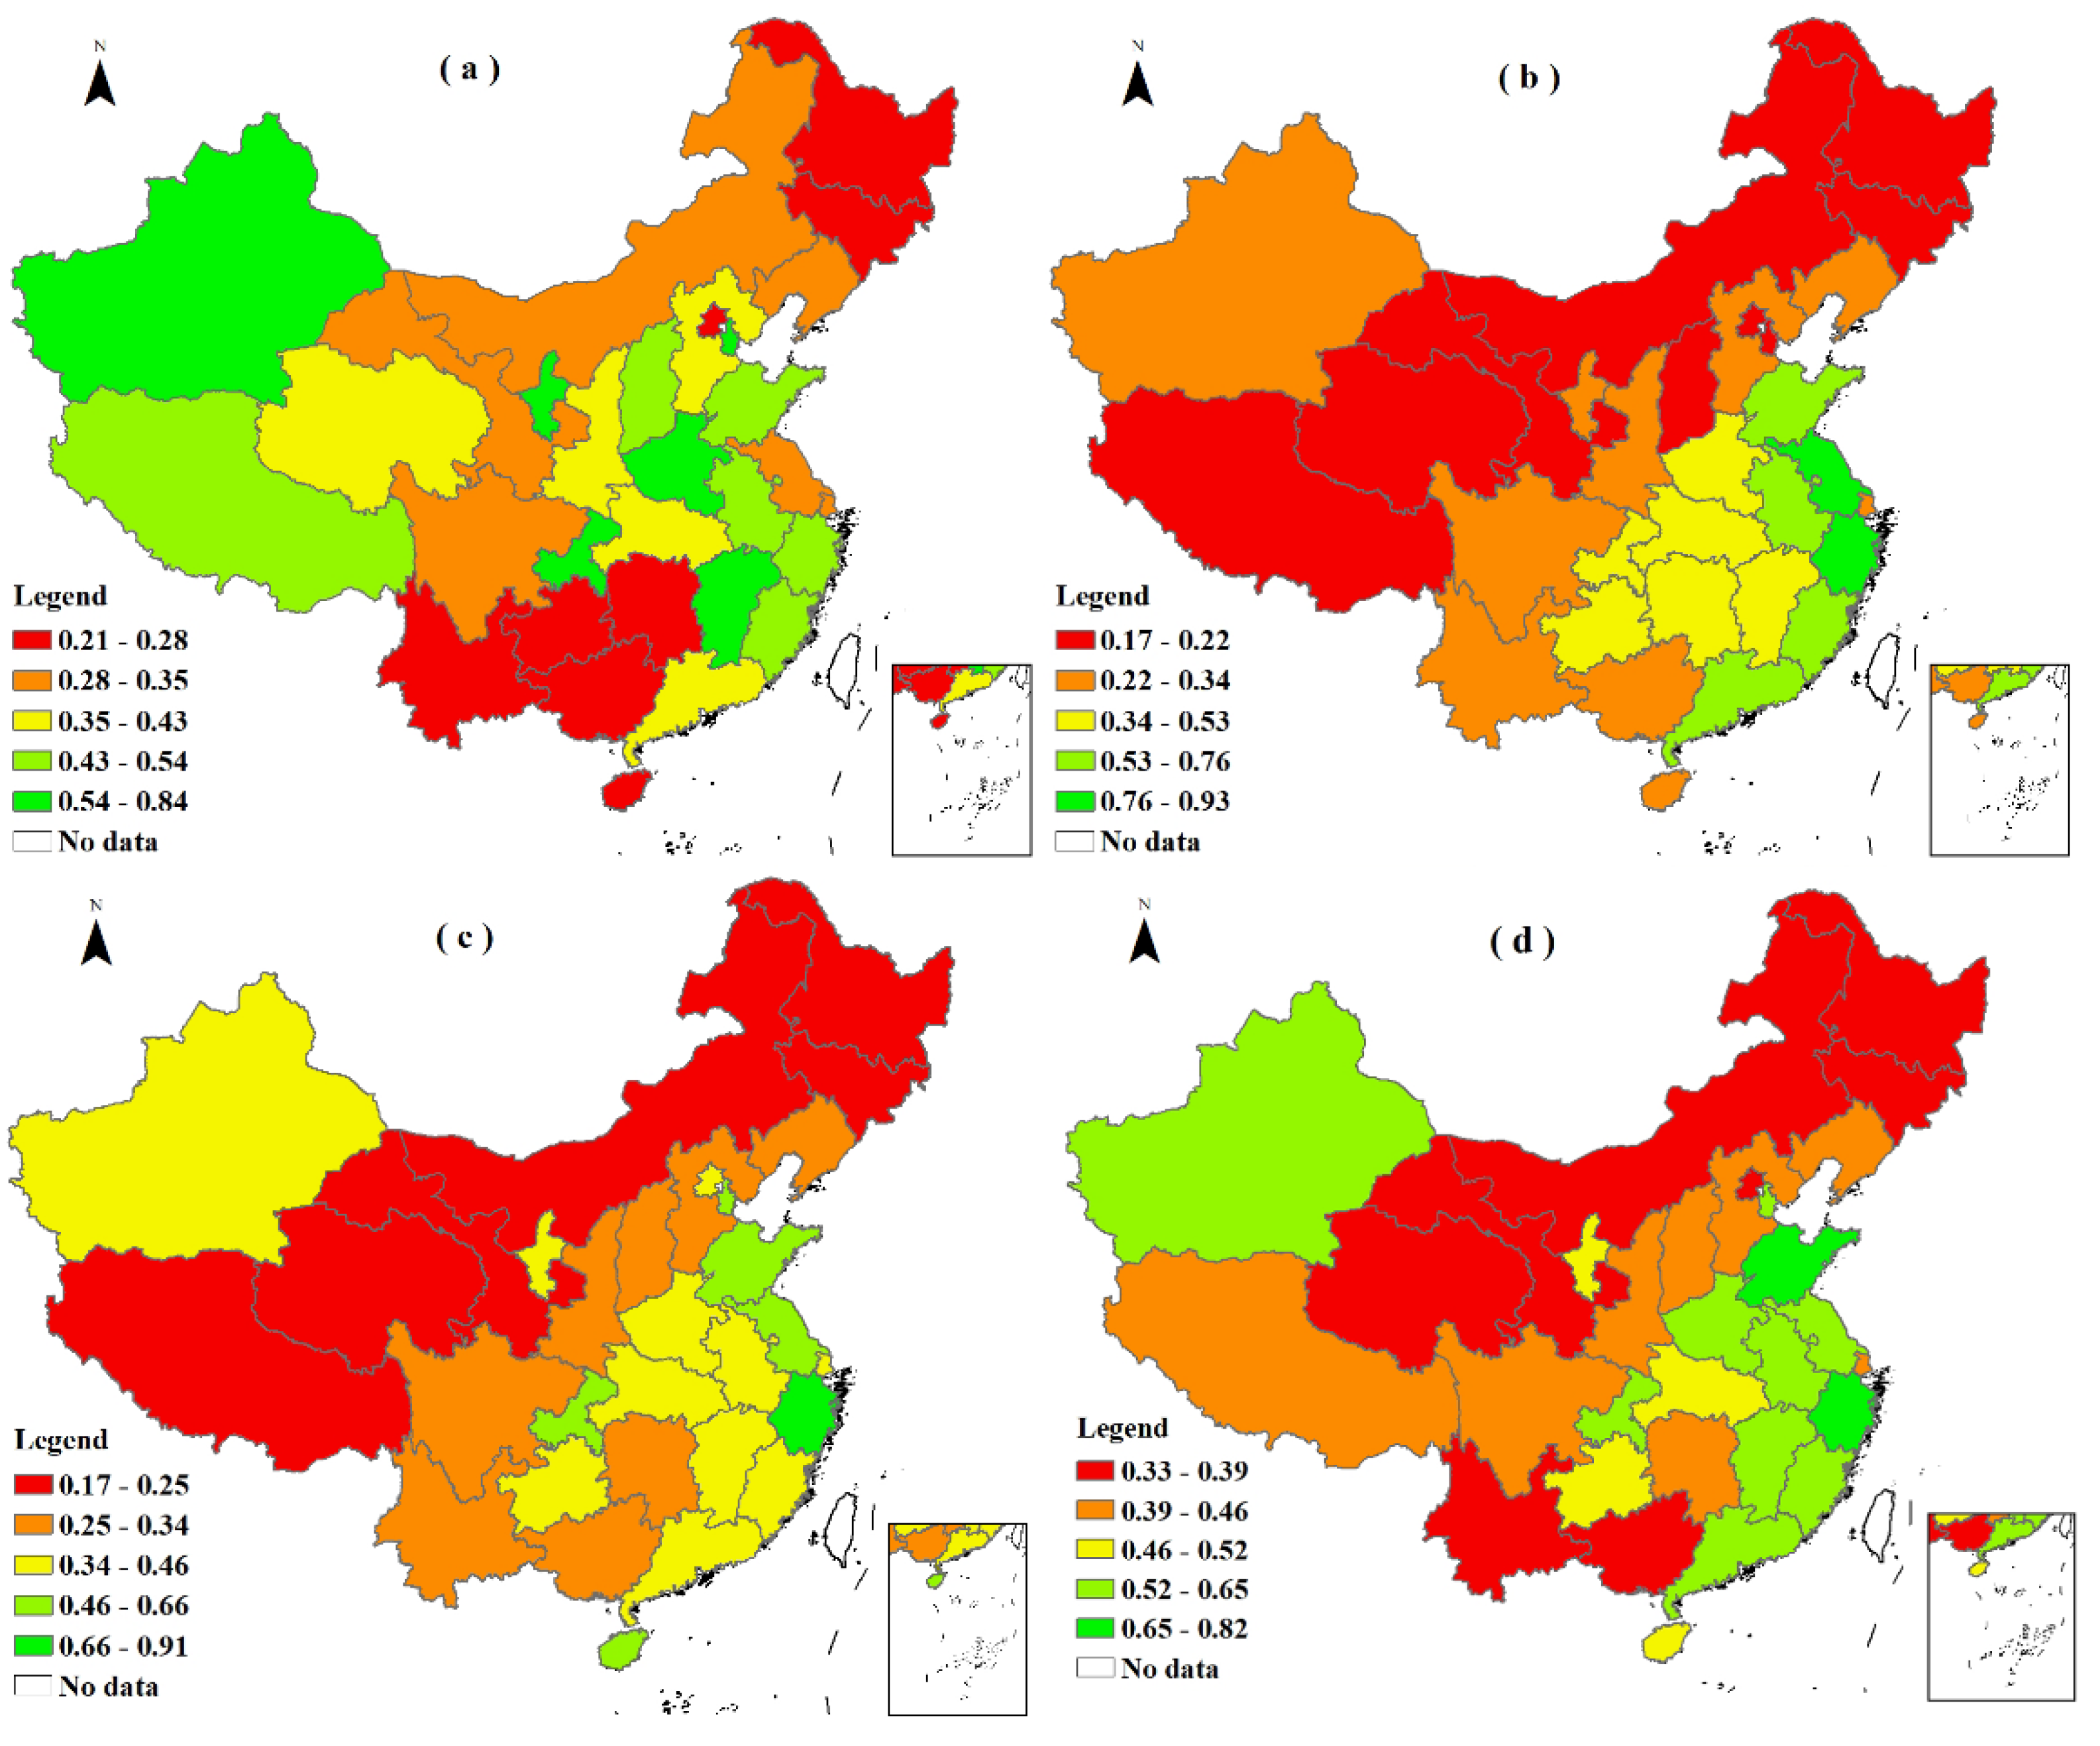
5.2. Spatial Regression Analysis of Forest Carbon Sinks in China
6. Discussion
6.1. Theoretical Implication
6.2. Policy Implications
6.3. Shortcomings and Prospects
7. Conclusion
Author Contributions
Funding
Data Availability Statement
Conflicts of Interest
References
- Hua, Z.Q. Study on Shadow Price of Carbon Sinks under the Perspective of Compensation of Property Value of Forest Carbon Sinks--Taking Hunan Province as an Example. Seeker 2015, (02), 37–42. [Google Scholar]
- Cai, B.F.; Zhu, S.L.; Yu, S.M.; Dong, H.M.; Zhang, C.Y.; Wang, C.K.; Zhu, J.H.; Gao, Q.X.; Fang, S.X.; Pan, X.B.; Zheng, X.H. The Interpretation of 2019 Refinement to the 2006 IPCC Guidelines for National Greenhouse Gas Inventory. Environmental Engineering 2019, 37, 1–11. [Google Scholar]
- Roces-Díaz, J.V.; Vayreda, J.; Banqué-Casanovas, M.; Cusó, M.; Anton, M.; Bonet, J.A.; Brotons, L.; Cáceres, M.D.; Herrando, S.; Aragón4, J.M.D.; de-Miguel, S.; Martínez-Vilalta, J. Assessing the distribution of forest ecosystem services in a highly populated Mediterranean region. Ecological Indicators 2018, 93, 986–997. [Google Scholar] [CrossRef]
- Xiong, S.W.; Yang, F.; Li, J.Y.; Xu, Z.N.; Ou, J.G. Temporal-spatial variation and regulatory mechanism of carbon budgets in territorial space through the lens of carbon balance: A case of the middle reaches of the Yangtze River urban agglomerations, China. Ecological Indicators 2023, 154, 110885. [Google Scholar] [CrossRef]
- Ye, F.F.; Yang, L.H.; Wang, Y.M. An interval efficiency evaluation model for air pollution management based on indicators integration and different perspectives. Journal of Cleaner Production 2020, 245, 118945. [Google Scholar] [CrossRef]
- Ye, F.F.; Yang, L.H.; Wang, Y.M. Estimation of Regional Environmental Pollution Intensity and Its Classified Management. Journal of Systems Science and Mathematical 2020, 40, 984–1003. [Google Scholar]
- Charnes, A.; Cooper, W.W.; Rhodes, E. Measuring the efficiency of decision-making units. European Journal of Operational Research 1978, 2, 429–444. [Google Scholar] [CrossRef]
- Long, F.; Shen, Y.Q.; Wu, W.G.; Qi, H.B.; Zhu, Z.; Zhang, Z. Measurement and optimum design of carbon sequestration efficiency of regional forestland use process. Transactions of the Chinese Society of Agricultural Engineering 2013, 29, 251–261. [Google Scholar]
- Wang, J.F.; Shi, K.H.; Hu, M.X. Measurement of Forest Carbon Sink Efficiency and Its Influencing Factors Empirical Evidence from China. Forests 2022, 13, 1909. [Google Scholar] [CrossRef]
- Wei, J.M.; Shen, M.H. Analysis of the Efficiency of Forest Carbon Sinks and Its Influencing Factors—Evidence from China. Sustainability 2022, 14, 11155. [Google Scholar] [CrossRef]
- Mlynarski, W.; Predki, A.; Kaliszewski, A. Efficiency and factors influencing it in forest districts in southern Poland: Application of Data Envelopment Analysis. Forest Policy and Economics 2021, 130. [Google Scholar] [CrossRef]
- Yin, S.W.; Gong, Z.W.; Gu, L.; Deng, Y.J.; Niu, Y.J. Driving forces of the efficiency of forest carbon sequestration production: Spatial panel data from the national forest inventory in China. Journal of Cleaner Production 2022, 330, 129776. [Google Scholar] [CrossRef]
- Huang, Y.; He, X.; He, S.Z.; Dai, Y.W. Efficiency evaluation of a forestry green economy under a multi-dimensional output benefit in China—Based on evidential reasoning and the cross efficiency model. sustainability 2022, 14, 13881. [Google Scholar] [CrossRef]
- Qi, L.; Zhou, X.L. The Analysis of Forestry Investment Efficiency in China: Perspective of Climate Change. China Soft Science 2018, (06), 35–46. [Google Scholar]
- Lin, B.Q.; Ge, J.M. Carbon sinks and output of China’s forestry sector: An ecological economic development perspective. Science of the total environment 2019, 655, 1169–1180. [Google Scholar] [CrossRef] [PubMed]
- Lu, C.C.; Chiu, Y.H.; Lin, I.F.; Lin, T.Y. Dynamic total factors’ environmental efficiency in European Union countries. Environment, Development and Sustainability 2022. [Google Scholar] [CrossRef]
- Xue, L.F.; Luo, X.F.; Wu, X.R. Carbon Sequestration Efficiency of Four Forest Regions in China: Measurement, Driving Factors and Convergence. Journal of Natural Resources 2016, 31, 1351–1363. [Google Scholar]
- Shu, M.Y.; Wu, J.Z.; Li, C.Y.; Ding, S. Analysis of the Evolution of Forest Carbon Sinks Efficiency in Natural Forest Protection Project Regions. Issues of Forestry Economics 2022, 42, 490–497. [Google Scholar]
- He, X.; Chen, L.Y.; Huang, Y. A Study of Forest Carbon Sink Increment from the Perspective of Efficiency Evaluation Based on an Inverse DEA Model. Forests 2022, 13, 1563. [Google Scholar] [CrossRef]
- Chen, X.Y.; Guan, Z.J. Measurement of China’s Forestry High-quality Development Level and Analysis of Regional Differences. China Forestry Economics 2022, 172, 7–11. [Google Scholar]
- Wen, S.S.; Guan, J.; Yang, Y. Construction of Evaluation Index System and Measurement of High-Quality Development of Forestry in China. Issues of Forestry Economics 2022, 42, 241–252. [Google Scholar]
- Xu, M.; Chen, W.H.; Liu, J.C. Study on Evaluation Index System for Development of Green Economy in Forestry. Forestry Economics 2015, 37, 24–28. [Google Scholar]
- Zhu, H.J.; Yao, S.B. Evaluation methodology for sustainable forestry development based on hybrid evaluation. Statistics & Decision 2015, 429, 64–67. [Google Scholar]
- Sun, N.; Zhao, Z.; Wang, W.L. Study on the Evaluation of Forestry Sustainable Development in Weibei area of the Loess Plateau. Agricultural Research in the Arid Areas 2012, 30, 215–220. [Google Scholar]
- Yang, T.; Kuo, C.W. A hierarchical AHP/DEA methodology for the facilities layout design problem. European Journal of Operational Research 2003, 147, 128–136. [Google Scholar] [CrossRef]
- Lozano, S.; Villa, G. Multiobjective target setting in data envelopment analysis using AHP. Computers & Operations Research 2009, 36, 549–564. [Google Scholar]
- Lin, M.I.; Lee, Y.D.; Ho, T.N. Applying integrated DEA/AHP to evaluate the economic performance of local governments in China. European Journal of Operational Research 2010, 209, 129–140. [Google Scholar] [CrossRef]
- Saen, R.F.; Memariani, A.; Lotfi, F.H. Determining relative efficiency of slightly non-homogeneous decision-making units by data envelopment analysis: a case study in IROST. Applied Mathematics and Computation 2004, 165, 313–328. [Google Scholar] [CrossRef]
- Xue, L.F.; Luo, X.F.; Li, R.R.; Yu, W.Z. Regional Differences and Dynamic Evolution of Forest Carbon Sink in China. Journal of China Agricultural University 2018, 23, 197–206. [Google Scholar]
- Qiu, Z.X.; Feng, Z.K.; Song, Y.N.; Li, M.L.; Zhang, P.P. Carbon sequestration potential of forest vegetation in China from 2003 to 2050: Predicting forest vegetation growth based on climate and the environment. Journal of Cleaner Production 2020, 252, 119715. [Google Scholar] [CrossRef]
- Liu, K.; Jiang, S.H.; Liu, W.Y. Estimation of Carbon Sequestration Value and Analysis of Space Effect of Forests in Guandong Province. Chinese Journal of Agricultural Resources and Regional Planning 2015, 36, 120–126. [Google Scholar]
- Xue, L.F.; Luo, X.F.; Li, Z.L.; Wu, X.R. Spatial Spillover Effects and Influencing Factors of Forest Carbon Sink in China —Spatial Econometric Analysis Based on Forest Resources Inventory in 31 Provinces of the Mainland of China. Journal of Natural Resources 2017, 32, 1744–1754. [Google Scholar]
- Fu, W.; Li, L.; Luo, M.C.; Chen, J.C.; Wang, F.L. Spatial spillover effects and influencing factors of forest carbon sink in China from a provincial perspective. Acta Ecologica Sinica 2023, 43, 4074–4085. [Google Scholar]
- Du, Z.L.; Su, T.; Ge, J.M.; Wang, X. Towards the Carbon Neutrality: The Role of Carbon Sink and Its Spatial Spillover Effects. Economic Research Journal 2021, 56, 187–202. [Google Scholar]
- Liu, Y.; Yang, L.Y.; Zhang, J.; Zhang, J.Z.; Li, X.B.; Zhu, N.G.; Zhou, M.F. Evolution and assessment of forest carbon sink policy over the past 20 years. Acta Ecologica Sinica 2023, 43, 3430–3441. [Google Scholar]
- Gu, J.L.; Lai, Y.M. Exploring and researching the mechanism of precision poverty alleviation by forest carbon sinks. China Soft Science 2022, (S1), 102–107. [Google Scholar]
- Guan, B.; Shi, Z.; Ning, P.; Hou, M.M. The Enhancement Effect of Forest Carbon Sequestration on Yunnan Bridgehead Construction. Green Economy 2012, (07), 66–69. [Google Scholar]
- Wu, G.Z.; Wang, H.P.; Zhou, N.D.; Li, Y.; Zeng, Q.B.; Yang, Y.M. Analysis of the Social Benefit of Forest Carbon Sequestration Industry Development in Hunan Province. Forestry Economics 2015, 37, 90–93. [Google Scholar]
- Chen, Y.Z.; Feng, X.M.; Fu, B.J. Above- and belowground forest biomass carbon pool in China during 2002~2021. National Tibetan Plateau / Third Pole Environment Data Center 2023. [CrossRef]
- Wang, Y.M.; Chin, K.S. A neutral DEA model for cross-efficiency evaluation and its extension. Expert Systems with Applications 2010, 37, 3666–3675. [Google Scholar] [CrossRef]
- Doyle, J.; Green, R. Efficiency and Cross-efficiency in DEA: Derivations, Meanings and Uses. Journal of the Operational Research Society 1994, 45, 567–578. [Google Scholar] [CrossRef]
- Wu, J.; Liang, L.; Yang, F.; Yan, H. Bargaining game model in the evaluation of decision-making units. Expert Systems with Applications 2009, 36, 4357–4362. [Google Scholar] [CrossRef]
- Chen, S.T.; You, C.L.; Wu, N.; Huang, Y. Cross-efficiency Aggregation Based on Interval Conditional Entropy: An Application to Forest Carbon Sink Efficiency. Journal of Intelligent & Fuzzy Systems 2024, 46, 4397–4415. [Google Scholar]
- Yang, J.B. Rule and utility-based evidential reasoning approach for multiattribute decision analysis under uncertainties. European Journal of Operational Research 2001, 131, 31–61. [Google Scholar] [CrossRef]
- Wang, Y.M.; Yang, J.B.; Xu, D.L. Environmental impact assessment using the evidential reasoning approach. European Journal of Operational Research 2006, 174, 1885–1913. [Google Scholar] [CrossRef]
- Sexton, T.R.; Silkman, R.H.; Hogan, A.J. Data Envelopment Analysis: Critique and Extensions. New Directions for Program Evaluation 1986, 32, 73–105. [Google Scholar] [CrossRef]
- Ke, S.F.; Zhang, Z.; Wang, Y.M. China’s forest carbon sinks and mitigation potential from carbon sequestration trading perspective. Ecological Indicators 2023, 148, 110054. [Google Scholar] [CrossRef]
- Lyu, X.; Li, X.B.; Wang, K.; Zhang, C.H.; Dang, D.L.; Dou, H.S.; Lou, A.R. Strengthening grassland carbon source and sink management to enhance its contribution to regional carbon neutrality. Ecological Indicators 2023, 152, 110341. [Google Scholar] [CrossRef]

| Level 1 | Level 2 | Level 3 |
|---|---|---|
| Inputs | Input (land) | Forest area |
| Input (labor) | Forestry practitioners | |
| Input (capital) | Completion of investment in fixed assets in forestry |
|
| Direct output | Output (direct) | Forest carbon sinks |
| Indirect outputs | Output (ecological) | The area of forest conservation |
| Forestry pest control area | ||
| Afforestation area | ||
| Output (economic) | The total output value of the primary industry |
|
| The total output value of the secondary industry | ||
| The total output value of the tertiary industry | ||
| Output (social) | Total forestry tourism | |
| Total economic forest products | ||
| Average annual wage of forest system employees on the job |
| inspect | statistic | p-value |
|---|---|---|
| LM test no spatial error | 242.220*** | 0.000 |
| Robust LM test no spatial error | 41.020*** | 0.000 |
| LM test no spatial lag | 206.810*** | 0.000 |
| Robust LM test no spatial lag | 5.610** | 0.018 |
| LR lag | 40.15*** | 0.000 |
| LR Err | 34.42*** | 0.000 |
| Wald Lg | 16.29*** | 0.003 |
| Wald Err | 18.37*** | 0.001 |
| Hausman | 72.92*** | 0.000 |
| OLS | SAR | SEM | SDM | |
|---|---|---|---|---|
| X | -7.138*** | -7.292*** | -7.365*** | -6.382*** |
| (-8.54) | (-8.92) | (-9.04) | (-7.87) | |
| lnD | 1.062*** | 1.140*** | 1.157*** | 0.882*** |
| (5.81) | (6.24) | (6.62) | (4.98) | |
| lnE | -0.961*** | -0.978*** | -0.909*** | -1.224*** |
| (-2.94) | (-3.03) | (-2.89) | (-3.90) | |
| lnF | -1.680*** | -1.724*** | -1.584*** | -1.738*** |
| (-4.8) | (-4.98) | (-4.74) | (-4.86) | |
| W∙X | 2.071 | |||
| (0.88) | ||||
| W∙lnD | -1.711*** | |||
| (-3.13) | ||||
| W∙lnE | -3.814*** | |||
| (-3.18) | ||||
| W∙lnF | -4.075*** | |||
| (-3.01) | ||||
| λ | 0.330*** | |||
| (3.99) | ||||
| ρ | 0.208*** | 0.385*** | ||
| (3.02) | (4.81) | |||
| sigma2_e | 2.673*** | 2.605*** | 2.375*** | |
| (14.16) | (14.06) | (14.01) | ||
| R^2 | 0.304 | 0.300 | 0.304 | 0.290 |
| direct effect | indirect effect | total effect | |
|---|---|---|---|
| X | -6.408*** | -0.948 | -7.356* |
| (-7.83) | (-0.26) | (-1.93) | |
| lnD | 0.767*** | -2.175** | -1.408 |
| (4.62) | (-2.47) | (-1.46) | |
| lnE | -1.493*** | -6.628*** | -8.121*** |
| (-4.19) | (-2.87) | (-3.21) | |
| lnF | -2.049*** | -7.494*** | -9.543*** |
| (-4.80) | (-3.23) | (-3.68) |
| OLS | SAR | SEM | SDM | |
|---|---|---|---|---|
| A | -1.461** | -1.498*** | -2.060*** | -2.563*** |
| (-2.51) | (-2.63) | (-3.46) | (-4.63) | |
| B | 1.365** | 1.682** | 1.641** | 1.803*** |
| (1.98) | (2.47) | (2.45) | (2.74) | |
| C | -6.498*** | -7.026*** | -6.369*** | -5.710*** |
| (-7.34) | (-7.95) | (-7.40) | (-6.23) | |
| lnD | 0.751*** | 0.770*** | -0.698*** | 0.568*** |
| (3.62) | (3.73) | (3.53) | (2.85) | |
| lnE | -0.618* | 0.579* | -0.589* | -0.592* |
| (-1.92) | (-1.84) | (-1.94) | (-1.89) | |
| lnF | -1.574*** | -1.641*** | 1.543*** | -1.617*** |
| (-4.64) | (-4.94) | (-4.85) | (-4.73) | |
| W∙A | 8.127*** | |||
| -4.99 | ||||
| W∙B | -2.422 | |||
| (-0.97) | ||||
| W∙C | -5.121* | |||
| (-1.81) | ||||
| W∙lnD | -0.114 | |||
| (-0.17) | ||||
| W∙lnE | -0.687 | |||
| (-0.56) | ||||
| W∙lnF | -2.172 | |||
| (-1.63) | ||||
| λ | 0.360*** | |||
| (4.28) | ||||
| ρ | 0.230*** | 0.313*** | ||
| (3.44) | (3.7) | |||
| sigma2_e | 2.440*** | 2.380*** | 2.124*** | |
| (14.16) | (-4.85) | (14.07) | ||
| R^2 | 0.354 | 0.349 | 0.352 | 0.376 |
| direct effect | indirect effect | total effect | |
|---|---|---|---|
| A | -2.161*** | 10.230*** | 8.069*** |
| (-4.13) | (4.22) | (3.36) | |
| B | 1.620*** | -3.089 | -1.469 |
| (2.94) | (-0.97) | (-0.45) | |
| C | -5.967*** | -9.180*** | -15.147*** |
| (-6.48) | (-2.71) | (-3.92) | |
| lnD | 0.592*** | 0.130 | 0.722 |
| (2.6) | (0.12) | (0.61) | |
| lnE | -0.714* | -1.272 | -1.986 |
| (-1.87) | (-0.7) | (-0.98) | |
| lnF | -1.767*** | -3.683** | -5.450** |
| (-4.76) | (-1.72) | (-2.29) |
Disclaimer/Publisher’s Note: The statements, opinions and data contained in all publications are solely those of the individual author(s) and contributor(s) and not of MDPI and/or the editor(s). MDPI and/or the editor(s) disclaim responsibility for any injury to people or property resulting from any ideas, methods, instructions or products referred to in the content. |
© 2024 by the authors. Licensee MDPI, Basel, Switzerland. This article is an open access article distributed under the terms and conditions of the Creative Commons Attribution (CC BY) license (http://creativecommons.org/licenses/by/4.0/).


