1. Introduction
The identification of biological traces through DNA testing is now a well-established technique worldwide. It forms the basis for the construction of DNA databases, allowing for the comparison of traces, unknown individuals, and unidentified bodies through the implementation of genetic profiles generated with the highest quality standards [
1]. The various phases of the techniques used are optimised within each laboratory, as there is no universally certified method issued by a public entity. Therefore, the reference standard is ISO/IEC 17025, which generally pertains to testing laboratories. In this work, we aim to revisit in a detailed manner the phase through which the qualitative and quantitative presence of human DNA in DNA extracts is verified. The importance of this analytical phase is underscored by the early guidelines of the forensic community. Already in 1992 one of the first recommendations of the International Society of Forensic Haemogenetics indicated that
DNA Quantification of DNA is important for improving the quality of PCR-based DNA typing results. Specific working ranges of human DNA to serve as a PCR template are recommended. Therefore, initial quantification of human DNA should be performed [
2]. Actually, in real casework the assumption that a trace may contain human biological material is sometimes contradicted by reality, as it is often possible to identify biological traces at crime scenes that are not of human origin. When it’s possible the spectrophotometric measurement method was chosen for the following reasons: it was simple, quick, very cheap and sufficiently reliable [
3]. Especially when samples are taken after a long time after deposition, it is possible to find DNA of bacterial origin which is co-extracted together with human DNA. It is thus preferable to use real time PCR methods as 260 nm spectrophotometry is not suitable for discriminating the different types of DNA. Over the years, commercially available qPCR kits, such as PowerQuant™ System (Promega, USA) [
4], QuantiFiler™ Trio (Thermo Fisher Scientific, Waltham, MA, USA) [
5] or Investigator Quantiplex Pro (QIAGEN, Hilden, Germany) [
6], were made available by commercial companies. These systems use TaqManR probes labelled with two fluorescent dyes: a reporter dye at the 5′-end and a quencher dye at the 3′end [
7]. Briefly, when the probe is intact the two dyes are in close proximity due to the small size of the probe and the fluorescence of the reporter dye is suppressed. During the extension stage of a qPCR, the 5′-exonuclease activity of DNA polymerase displaces the bound TaqMan probes, and the reporter dye attached to the 5′-end is separated from the quencher dye at the 3′-end. The separation means the energy transfer that suppressed fluorescence when the two fluorophores were in close proximity is no longer occurring and the reporter molecule can now fluoresce. The amount of fluorescence detected correlates directly with the amount of human DNA present in the reaction, as the greater the amount of DNA, the more reporter dye molecules are cleaved, and the greater the fluorescence detected. Typically, as the qPCR program progresses, and the DNA increases exponentially, an amplification curve is generated using these fluorescence data, which (at the end of the qPCR program) are then used to calculate a DNA concentration [
8]. Measured DNA concentrations are used to normalise the amount of DNA template to an optimal range for STR amplification reactions, ensuring STR profiles are in the linear range of the capillary electrophoresis instrument with minimal artefacts and stochastic effects. Every commercially available qPCR assays routinely used to determine the concentration of total human DNA as well human male DNA; they are based on the construction of standard curves with DNA at known concentrations. Each point of the curves is constructed using mean values of serial dilutions assayed in duplicate.
Our experience from 2016 to today is based on use of Quantifiler™ Trio DNA Quantification Kit (ThermoFisher Cat. No. 4482910), for quantification of DNA extract from stains [
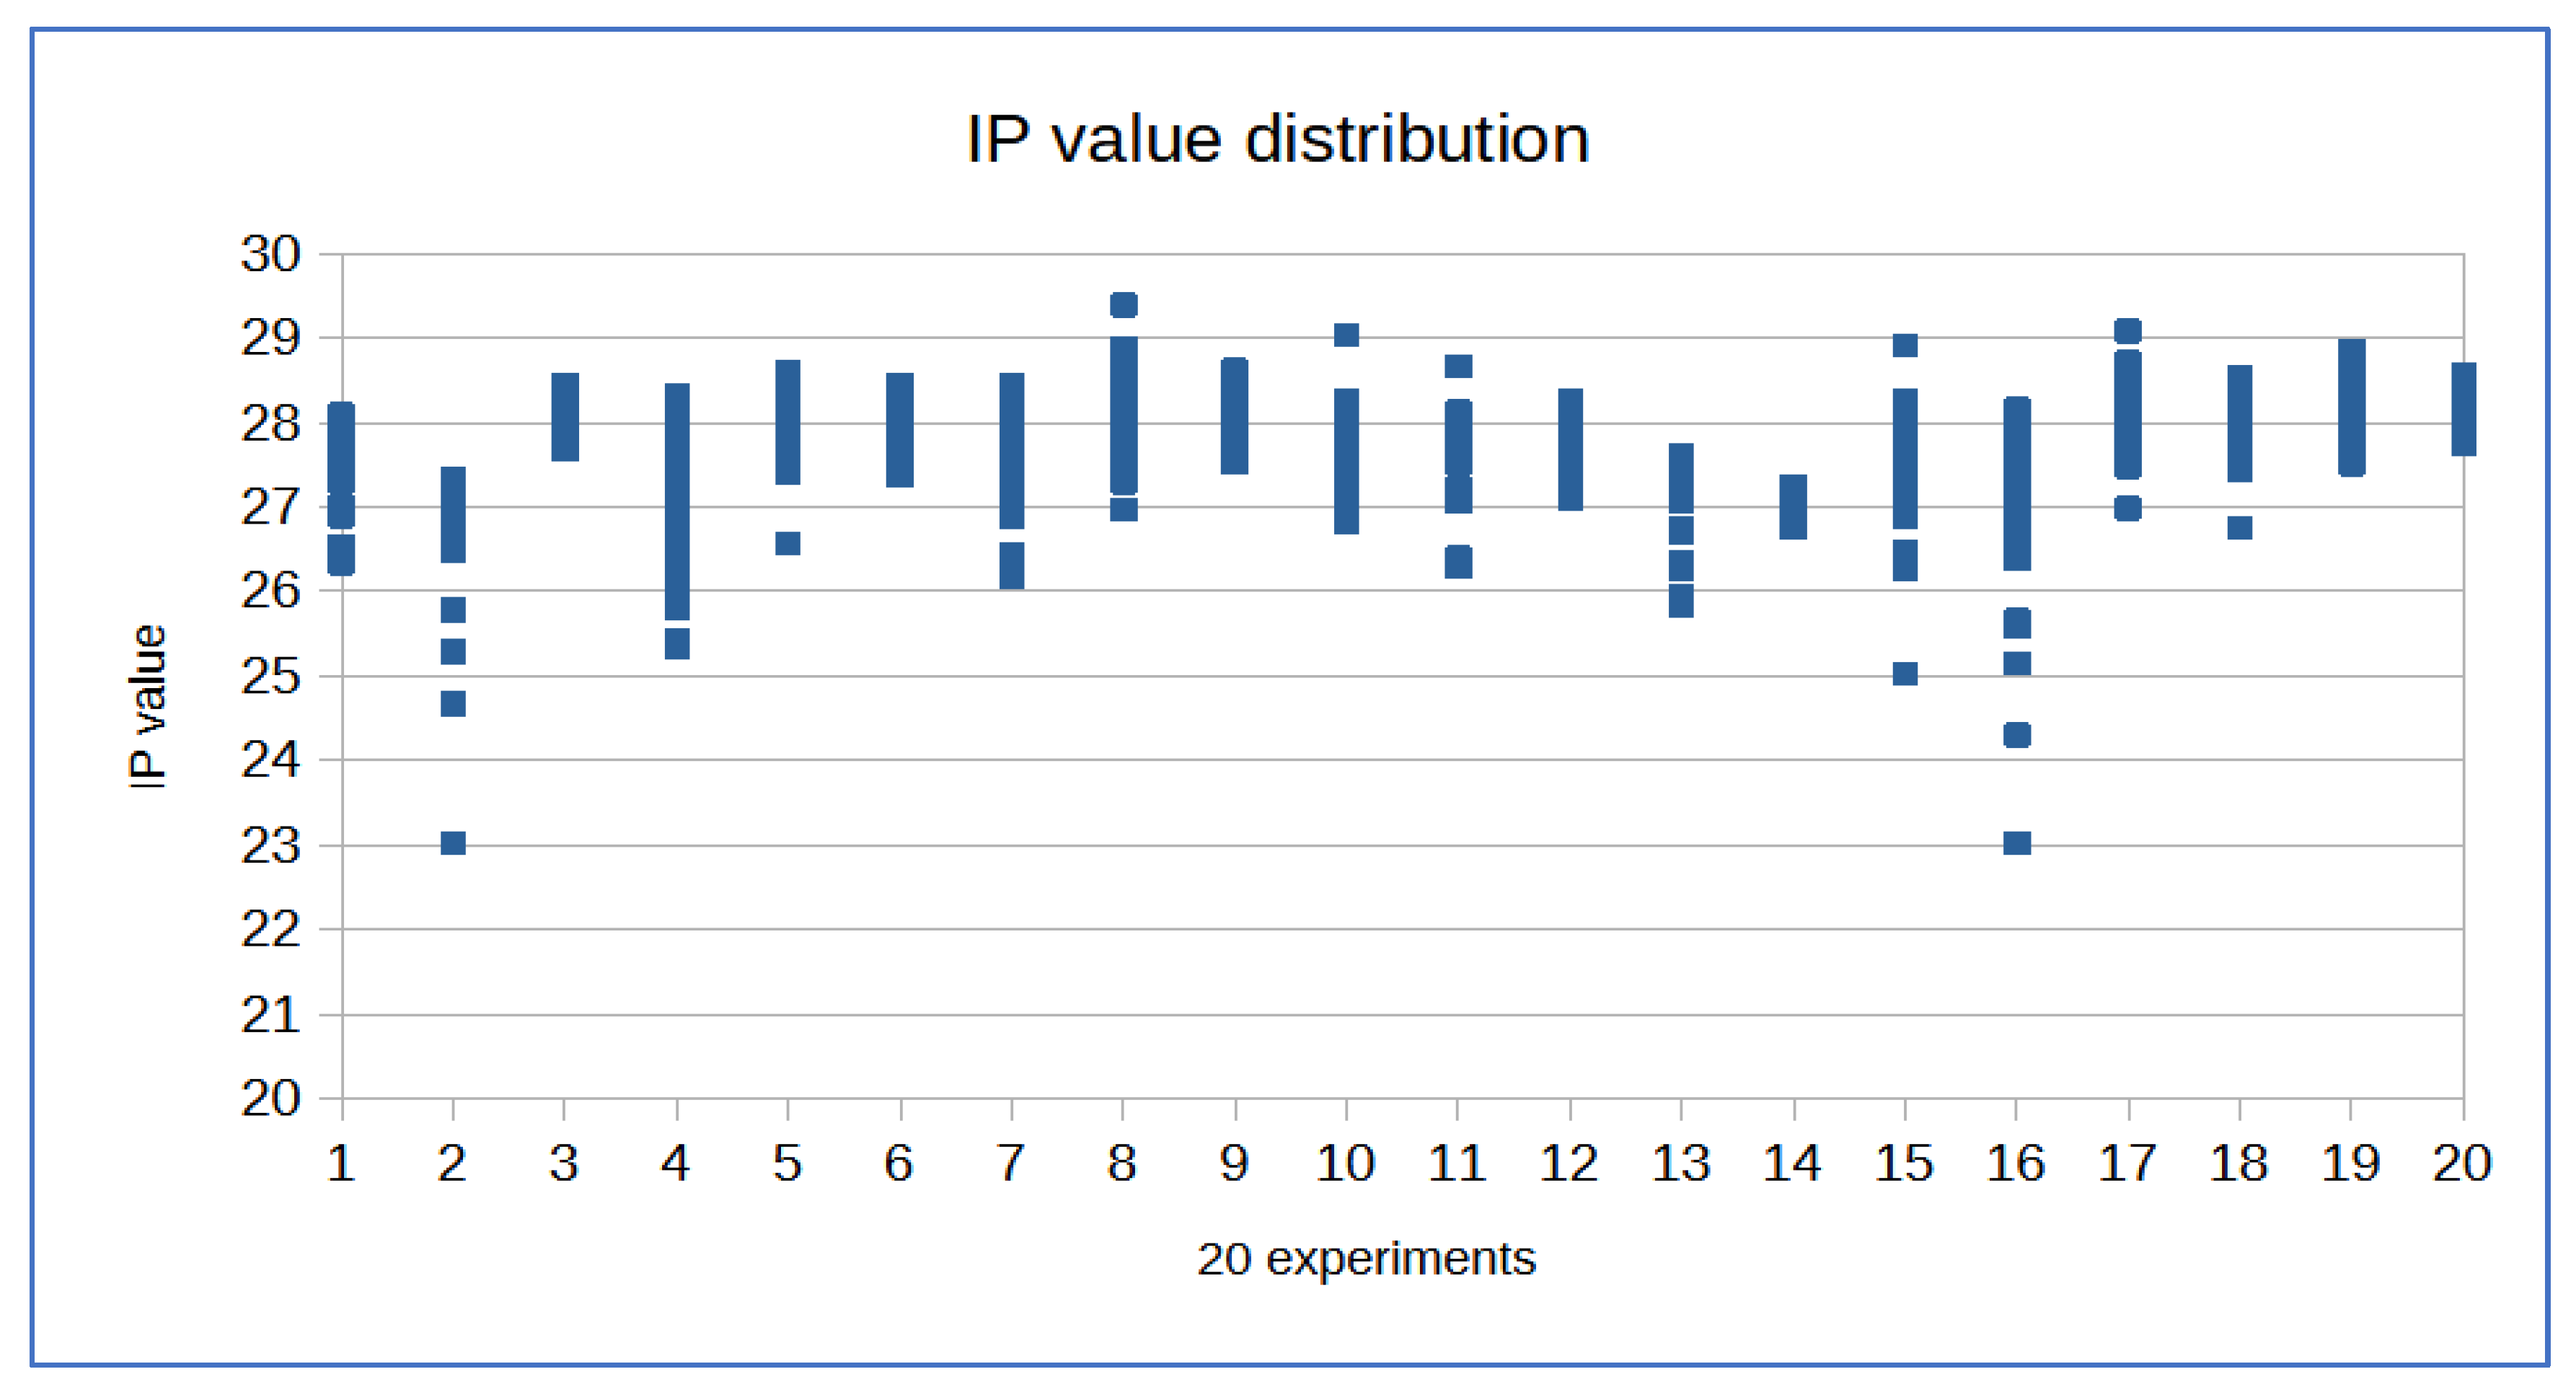
9]. The Quantifiler™ Trio DNA Quantification Kit uses multiple-copy target loci for improved detection sensitivity and combines four 5′ nuclease assays. The human-specific target loci (Small Autosomal, Large Autosomal, and Y-chromosome targets) each consist of multiple copies dispersed on various autosomal chromosomes (Small Autosomal and Large Autosomal), or multiple copies on the Y-chromosome. The two separate target-specific human assays, one with a short PCR amplicon and one with a long PCR amplicon is able to determine the state of degradation of the sample. The fourth target (internal PCR control IPC) is a synthetic probe capable of identifying the presence of inhibitors in extracts. This quantification method is part of the analytical process of the laboratory's ISO/IEC17025 accredited method identified with denomination “DNA typing for human identification, mixed stains, Y-STR, paternity and kinship testing (genetic profile)” with the Italian Accreditation Body, Accredia (Lab nr. 1268) [
10]. In the indicated period it was used for 240 experiments for a total of more than 10000 forensic samples. The amount of DNA in these samples can vary from tens of nanograms to a few picograms, corresponding to a few diploid genomes, or it can yield negative results in the absence of human genetic material.
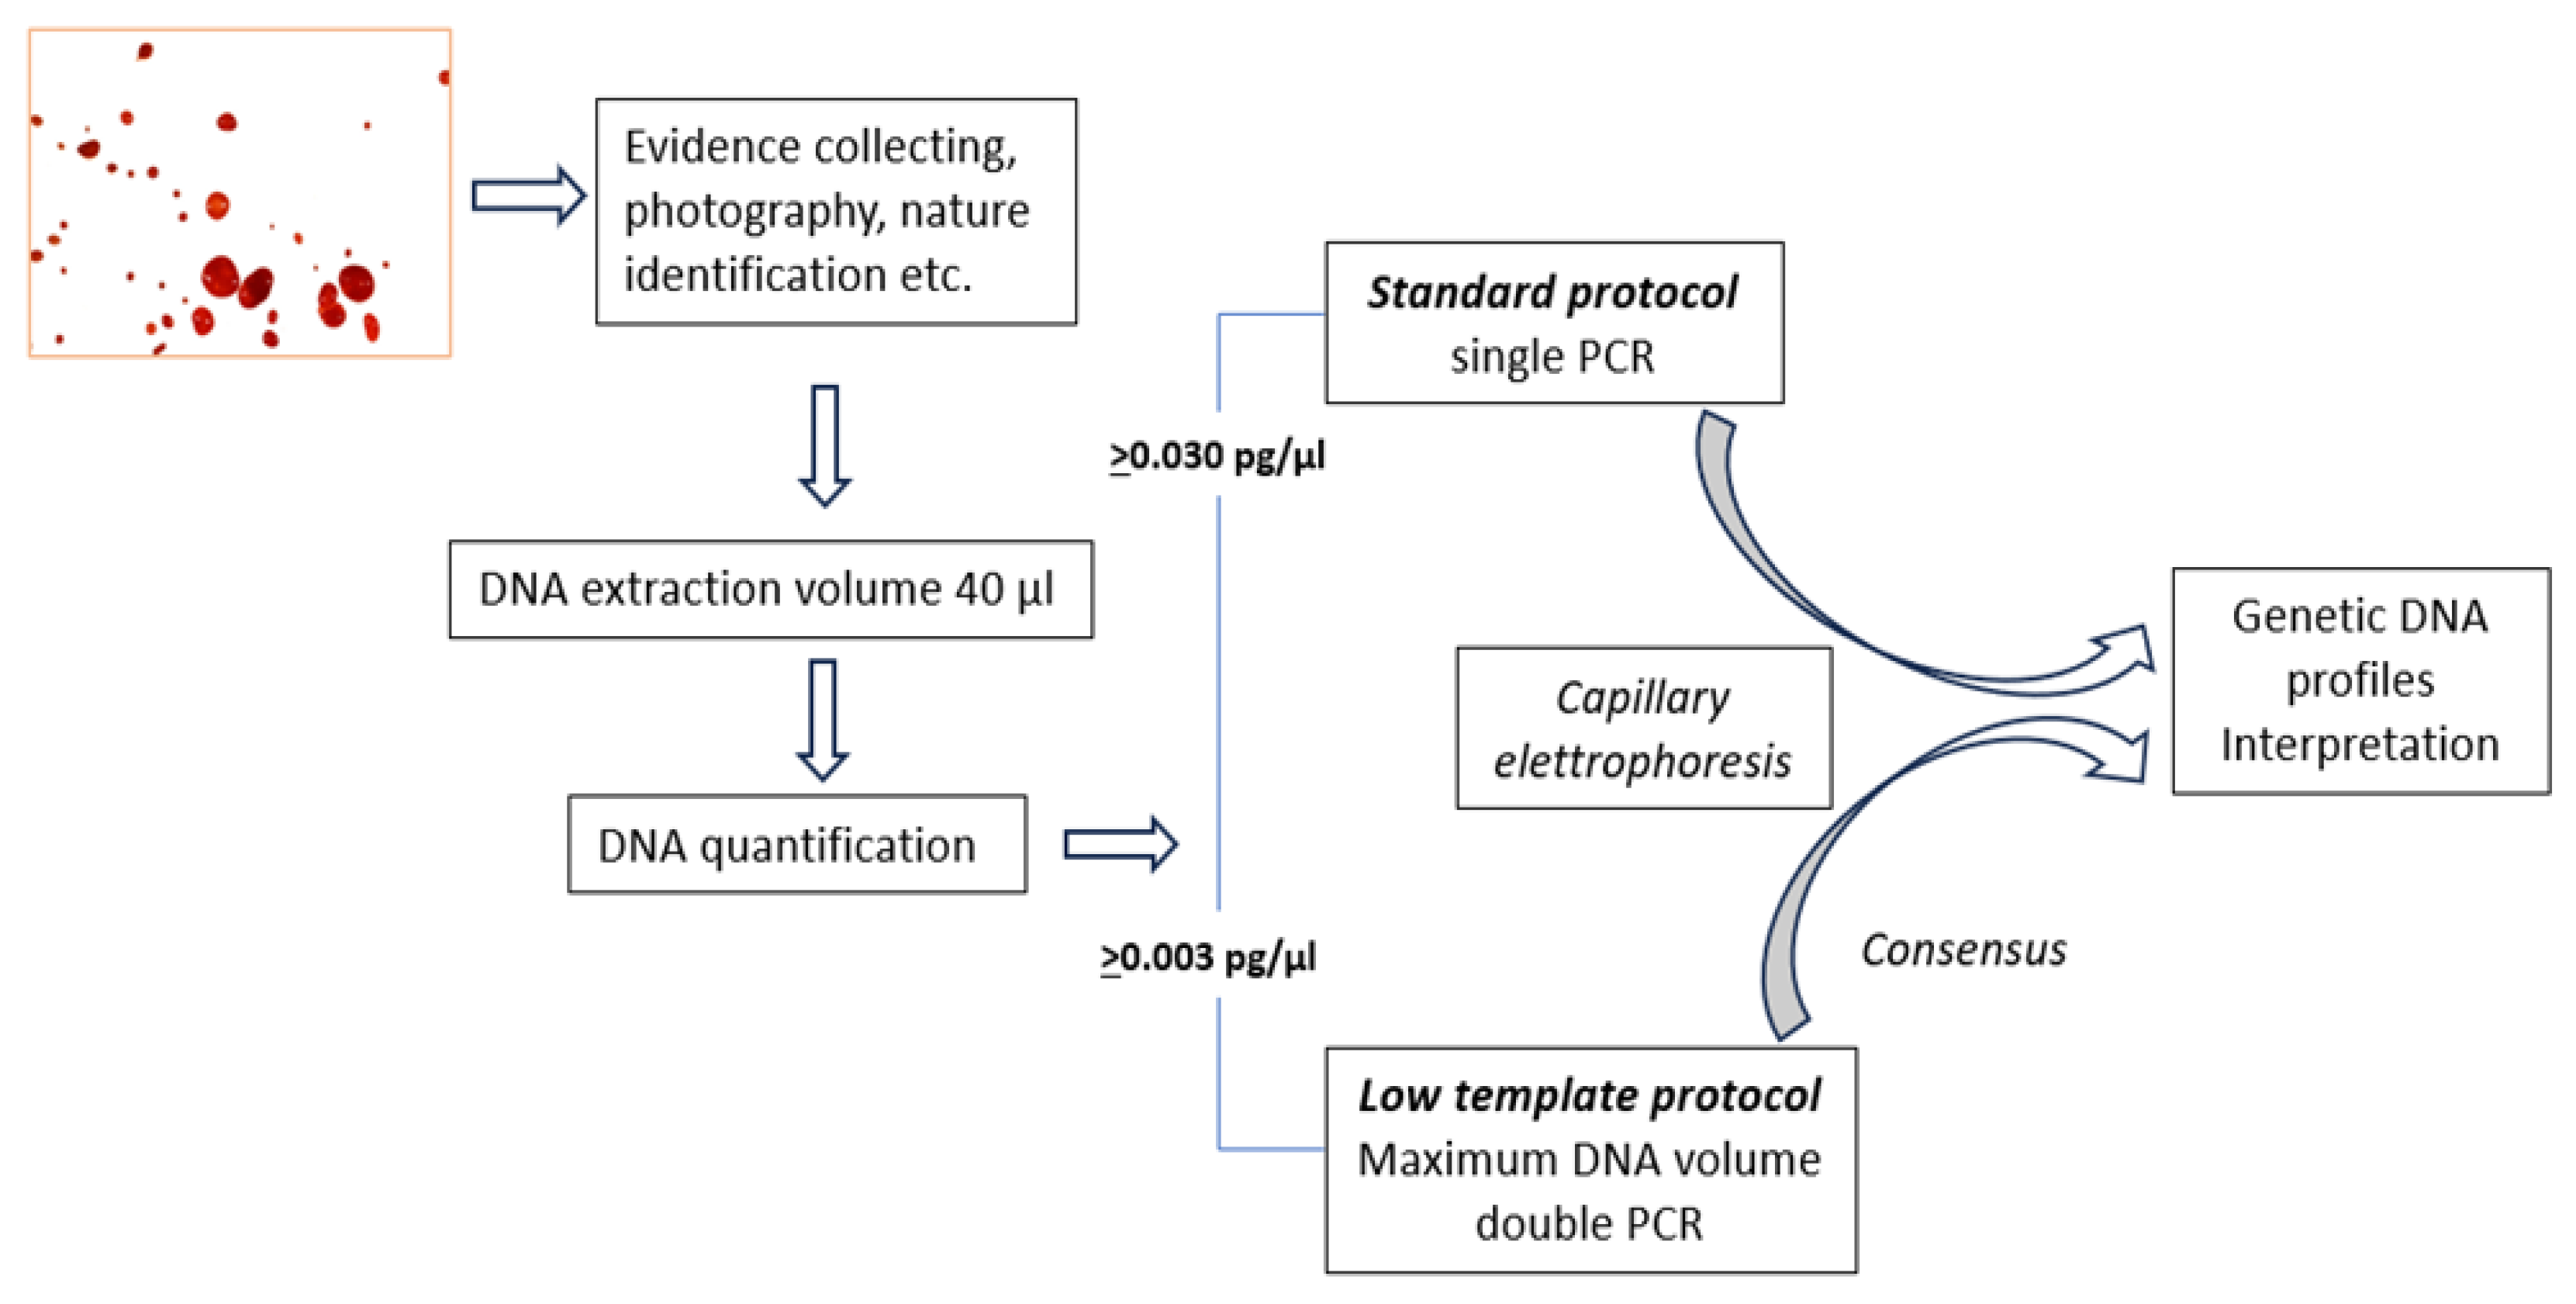
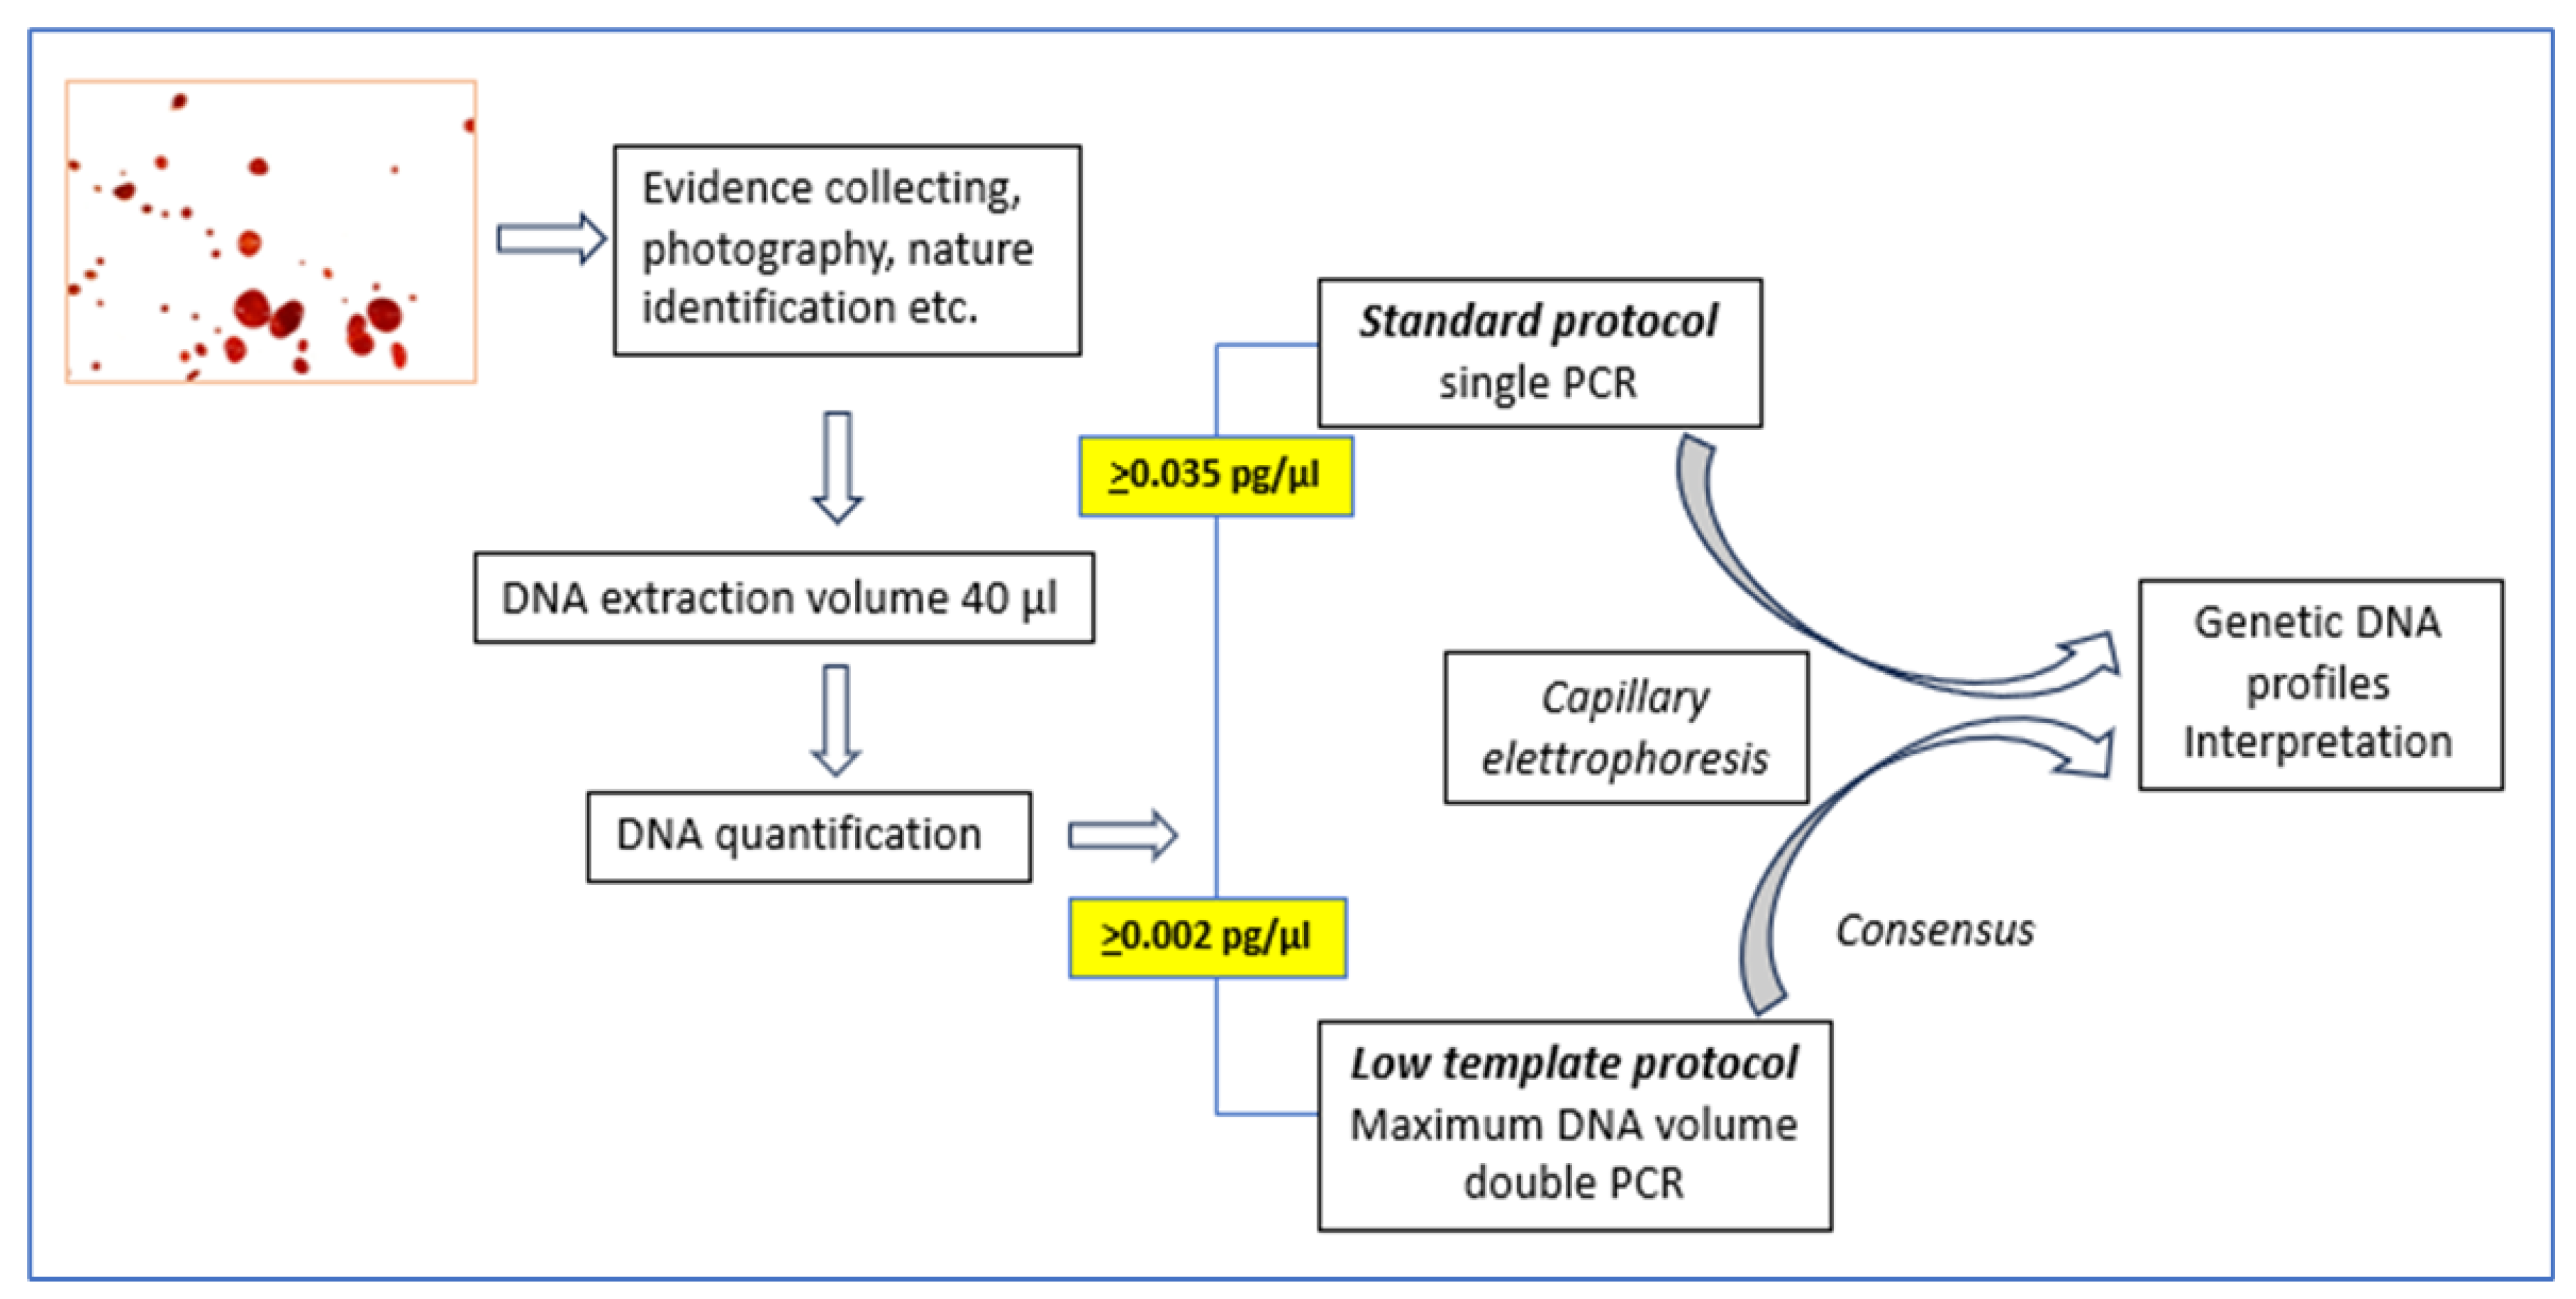
The method we use consists in a “standard protocol” that is used when sufficient DNA is present to obtain genetic profiles from a single PCR reaction and in a so-called “low template scenario” protocol when the amount of template DNA is low. In this case a double amplification of the sample is performed and the results of the analysis is therefore derived from the comparison of the two replicates as described [
11]. If the quantification result is below a certain limit, the PCR reaction is not carried out and the outcome of the assessment is that the sample does not contain sufficient human DNA. With the initial validation process we identified quantitative limits for applying the standard and low template scenario protocols. A visual representation of this protocol is represented in
Figure 1.
Obviously, the analyses with low template scenarios have several limitations. Indeed, allele dropout, stutter, false alleles, and the influence of sporadic background contamination should be considered when interpreting these DNA profiles [
12]. However, these profiles are often found on items touched, which are those most frequently requested by investigators for inclusion in the DNA database. Sometimes the only connection to a crime can be represented by the discovery of such a faint trace. For this reason, it is crucial to pay the utmost attention to extracting as much information as possible from these specimens. However, this activity must be balanced with a robust laboratory routine, identifying an optimal cost-benefit synthesis.
The quantitative limits mentioned above were determined through an initial laboratory validation. In DNA quantification, precision is crucial to ensure that the obtained results are reliable and consistent. Precision refers to the consistency and reproducibility of measurements obtained from repeated analyses of the same sample under the same conditions. Accuracy refers to the closeness of a measured value to the true or accepted value. However, we are aware that certain parameters can influence the final analytical results. One parameter that seems not to be evaluated with due attention is the uncertainty due to the use of measuring instruments and manual activities. This parameter is carefully evaluated in many other fields [
13] and should be carefully assessed even within the forensic context, as suggested by some authors [
14]. Indeed, an important factor regarding the reproducibility of the standard curve is the mixing function during pipetting of the serial dilution by the liquid handling system. In the method used in our laboratory, quantification requires all manual steps, including the construction of the calibration curve with the dilution of the control DNA and pipetting in the sample plate. In DNA quantification, accuracy is essential to ensure that the reported DNA concentration reflects the actual amount of DNA present in the sample. ISO/IEC 17025 mandates that accredited laboratories validate the accuracy of their quantification methods by comparing their results with reference materials of known DNA concentration. Thus, the piston pipettes we used are annually calibrated by an external supplier accredited for calibrations according to Accredia. The bioanalytical approaches used by the supplier involve gravimetry according to ISO 8655 guidelines (ISO 8655-6) [
15]. However, all these precautions can be affected by human random errors in pipetting of standards and samples. Constructing the standard curve with a replicate of each control could compensate for pipetting uncertainty. Using the numerous data available, we have carried out a careful review of the individual points of the construction of the calibration lines, to verify how the revision of the trend of the calibration lines influences the final results. Based on the results obtained, appropriate actions were implemented to optimise this step in the forensic genetic method we use for DNA typing. This analysis can be considered a revalidation of the method, in accordance with point 7.2.2.2 of the ISO 17025:2015 standard [
16].
Finally, we show that, even if the results of the quantifications of DNA extracts from minimal traces are practically zero, it is possible to use a sample concentration approach which in some cases has proven useful for generating genetic profiles of the trace donors. These indications suggest ample room for improvement for a technique that already provides fundamental results in the forensic genetics analysis process used in daily routine.
2. Materials and Methods
2.1. DNA Extraction
For automated purification of DNA from forensic casework and human samples, EZ1® Advanced XL instruments in combination with EZ1 Investigator kit were used (Qiagen, Hilde, Germany). The 40 μl final volume in TE was always used to obtain extracts at the highest possible concentration.
2.2. Analytical Phase of the Quantification Method
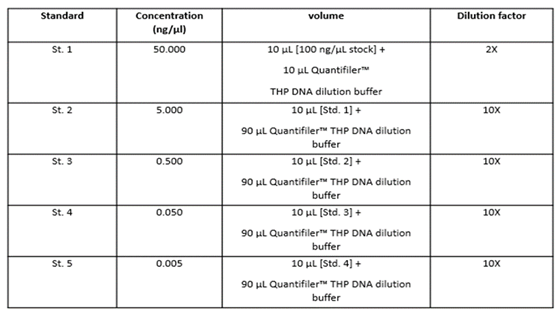
The human DNA used to generate the DNA quantification standards dilution series consists of pooled human male genomic DNA. Standards dilution series with the concentrations ranging from 50 ng/μl (Std. 1) to 0.005 ng/μl, or 5 pg/μl (Std. 5). When 2 μl of a sample at the lowest concentration (5 pg/μl) is loaded in a reaction, the well contains approximately 1.5 diploid human genome equivalents [
17].
Table 1 shows the serial dilution of the control DNA used in double in each experiment. In each experiment, 2 µL of each sample to be dosed were used in single experiments in 96-well plates.
2.3. Validation of the Kit
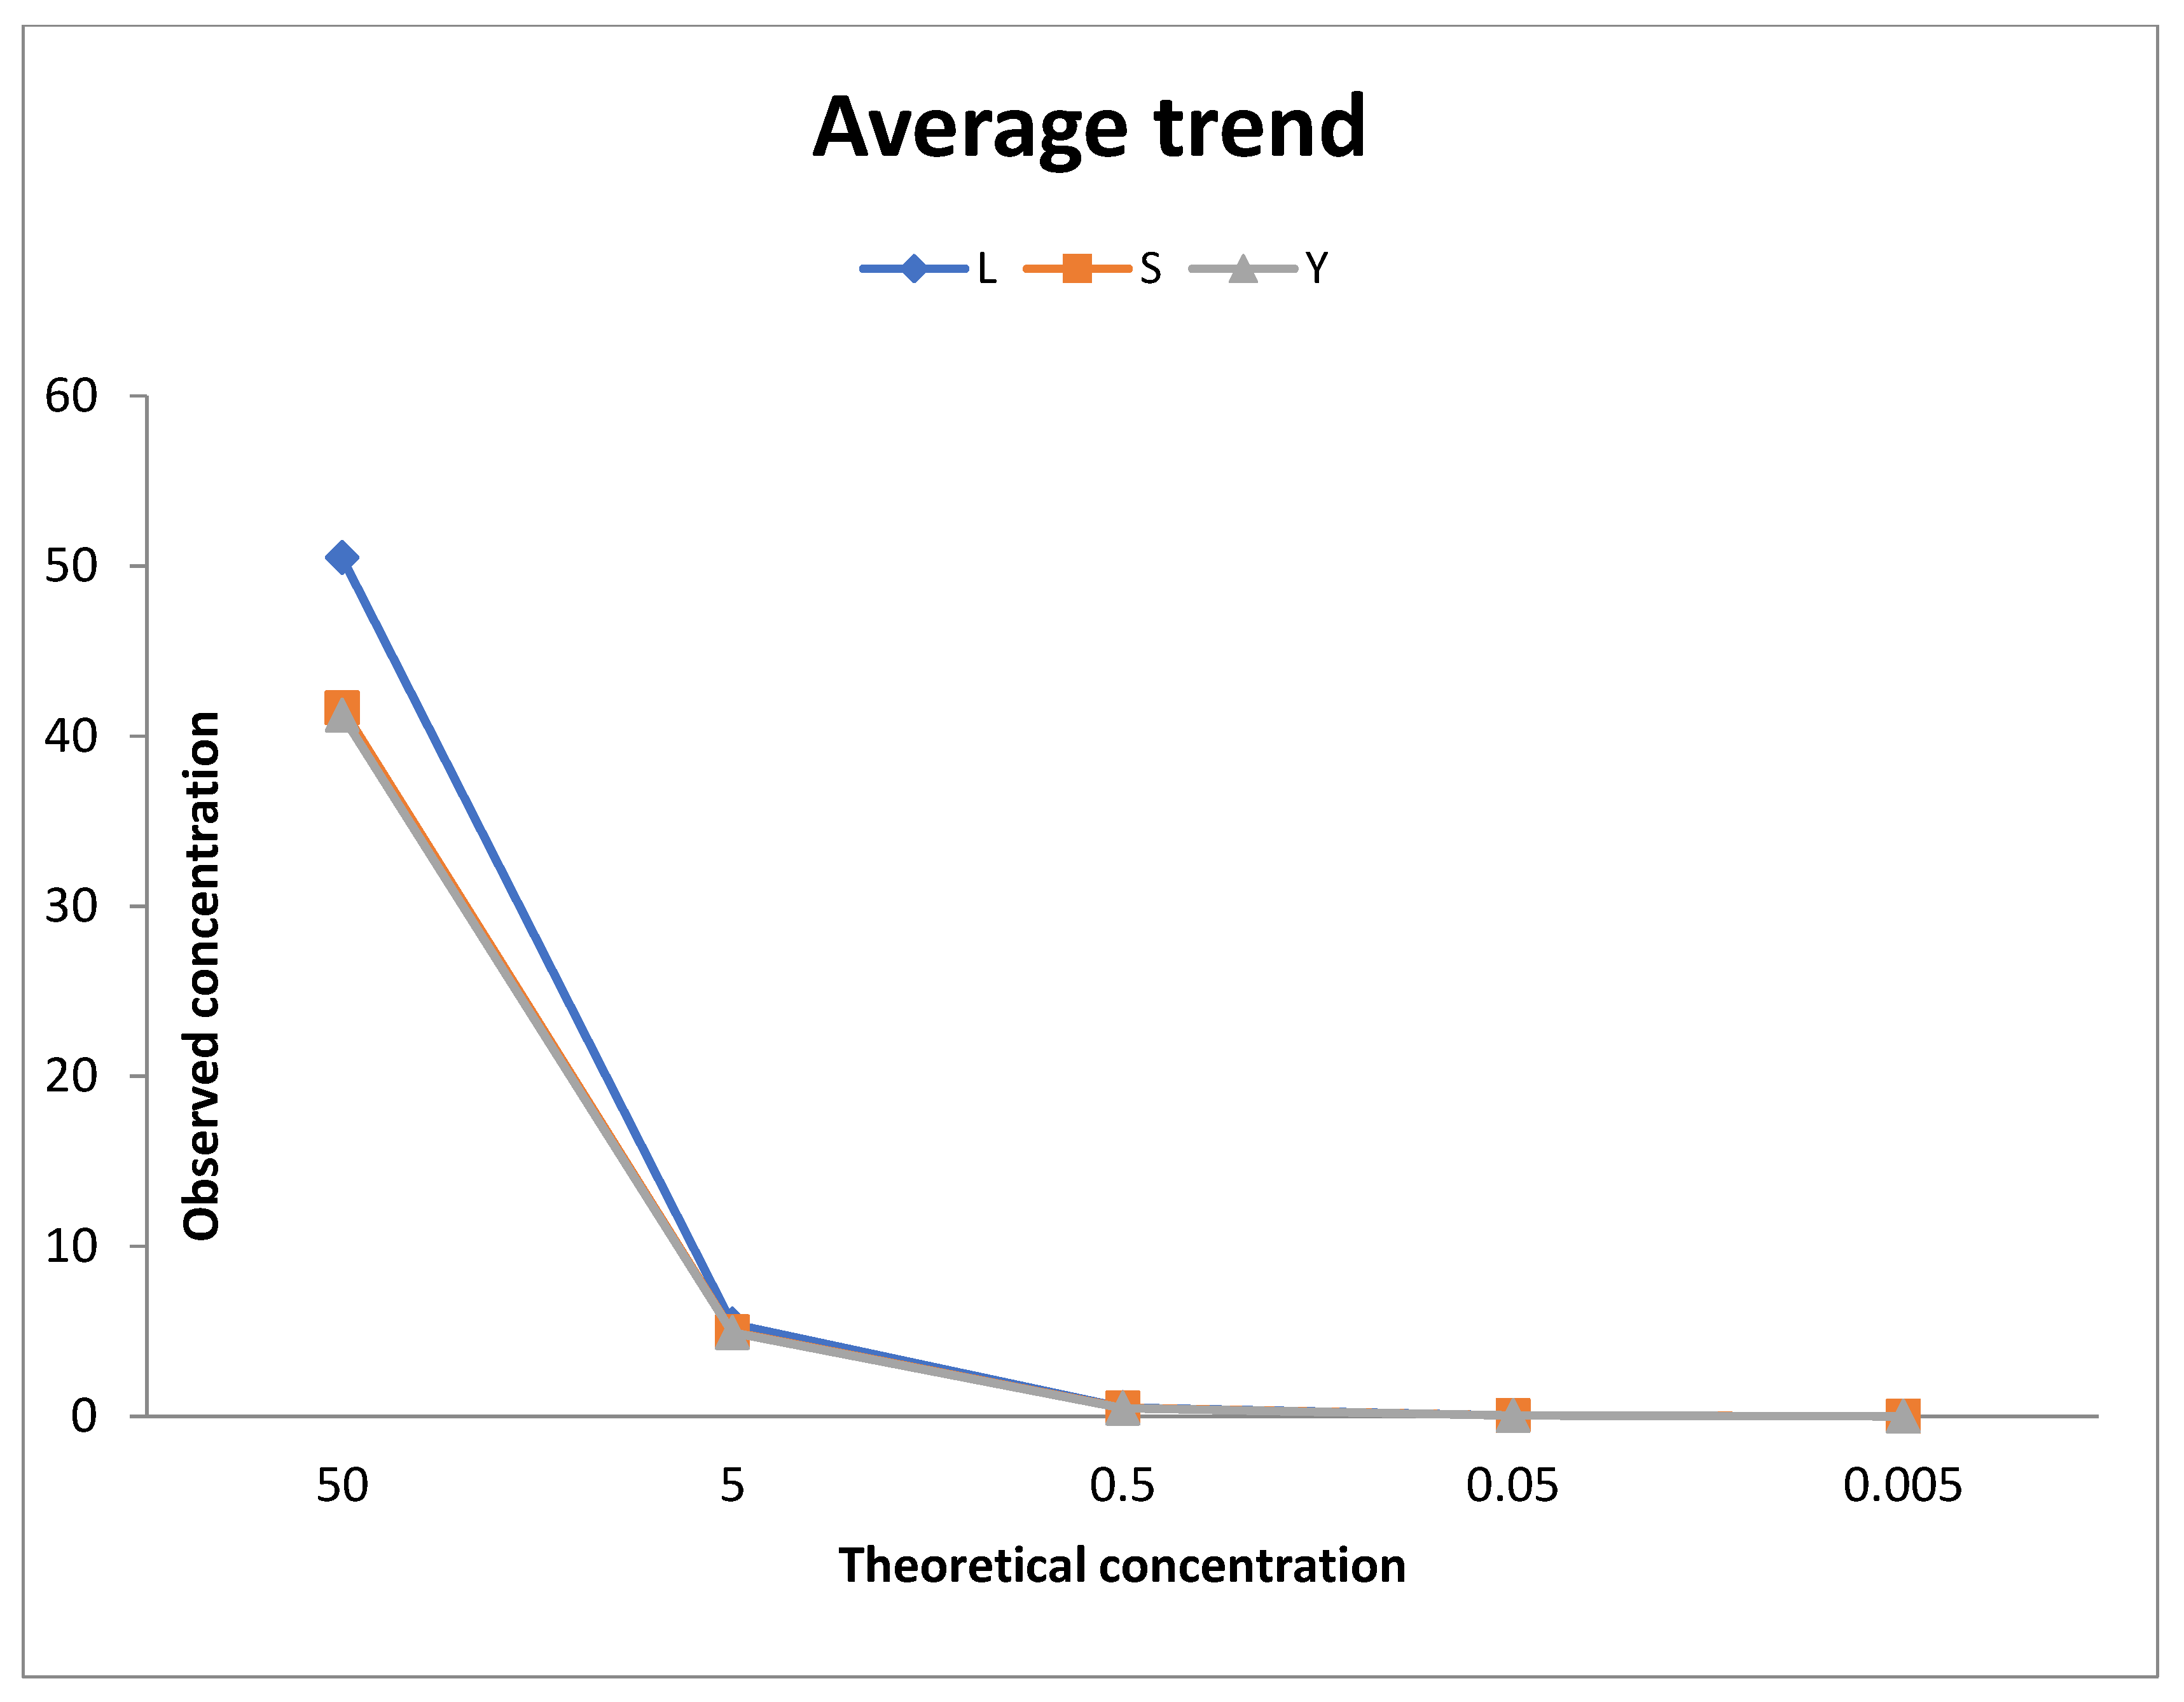
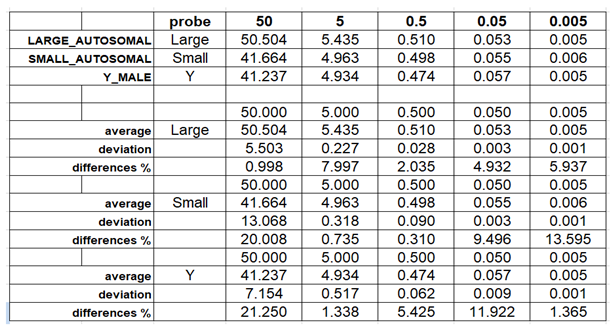
The initial validation of the real time system was carried out by analysing the control DNA available with the kit. Ten-fold dilution series with 5 concentration points as known in
Table 1 were used. The standard curve was carried out using serial two-fold dilutions and quantitative evaluations carried out using mean values. For each point of the curve the same dilutions of the standards were assayed, using them as if they were samples. For each point on the curve, the examination was conducted with five replicates. The degradation index value for these samples was also determined, calculated as the ratio between the concentration of small autosomal DNA and the concentration of large autosomal DNA.
2.4. Reanalysis of the QuantiFiler™ Trio
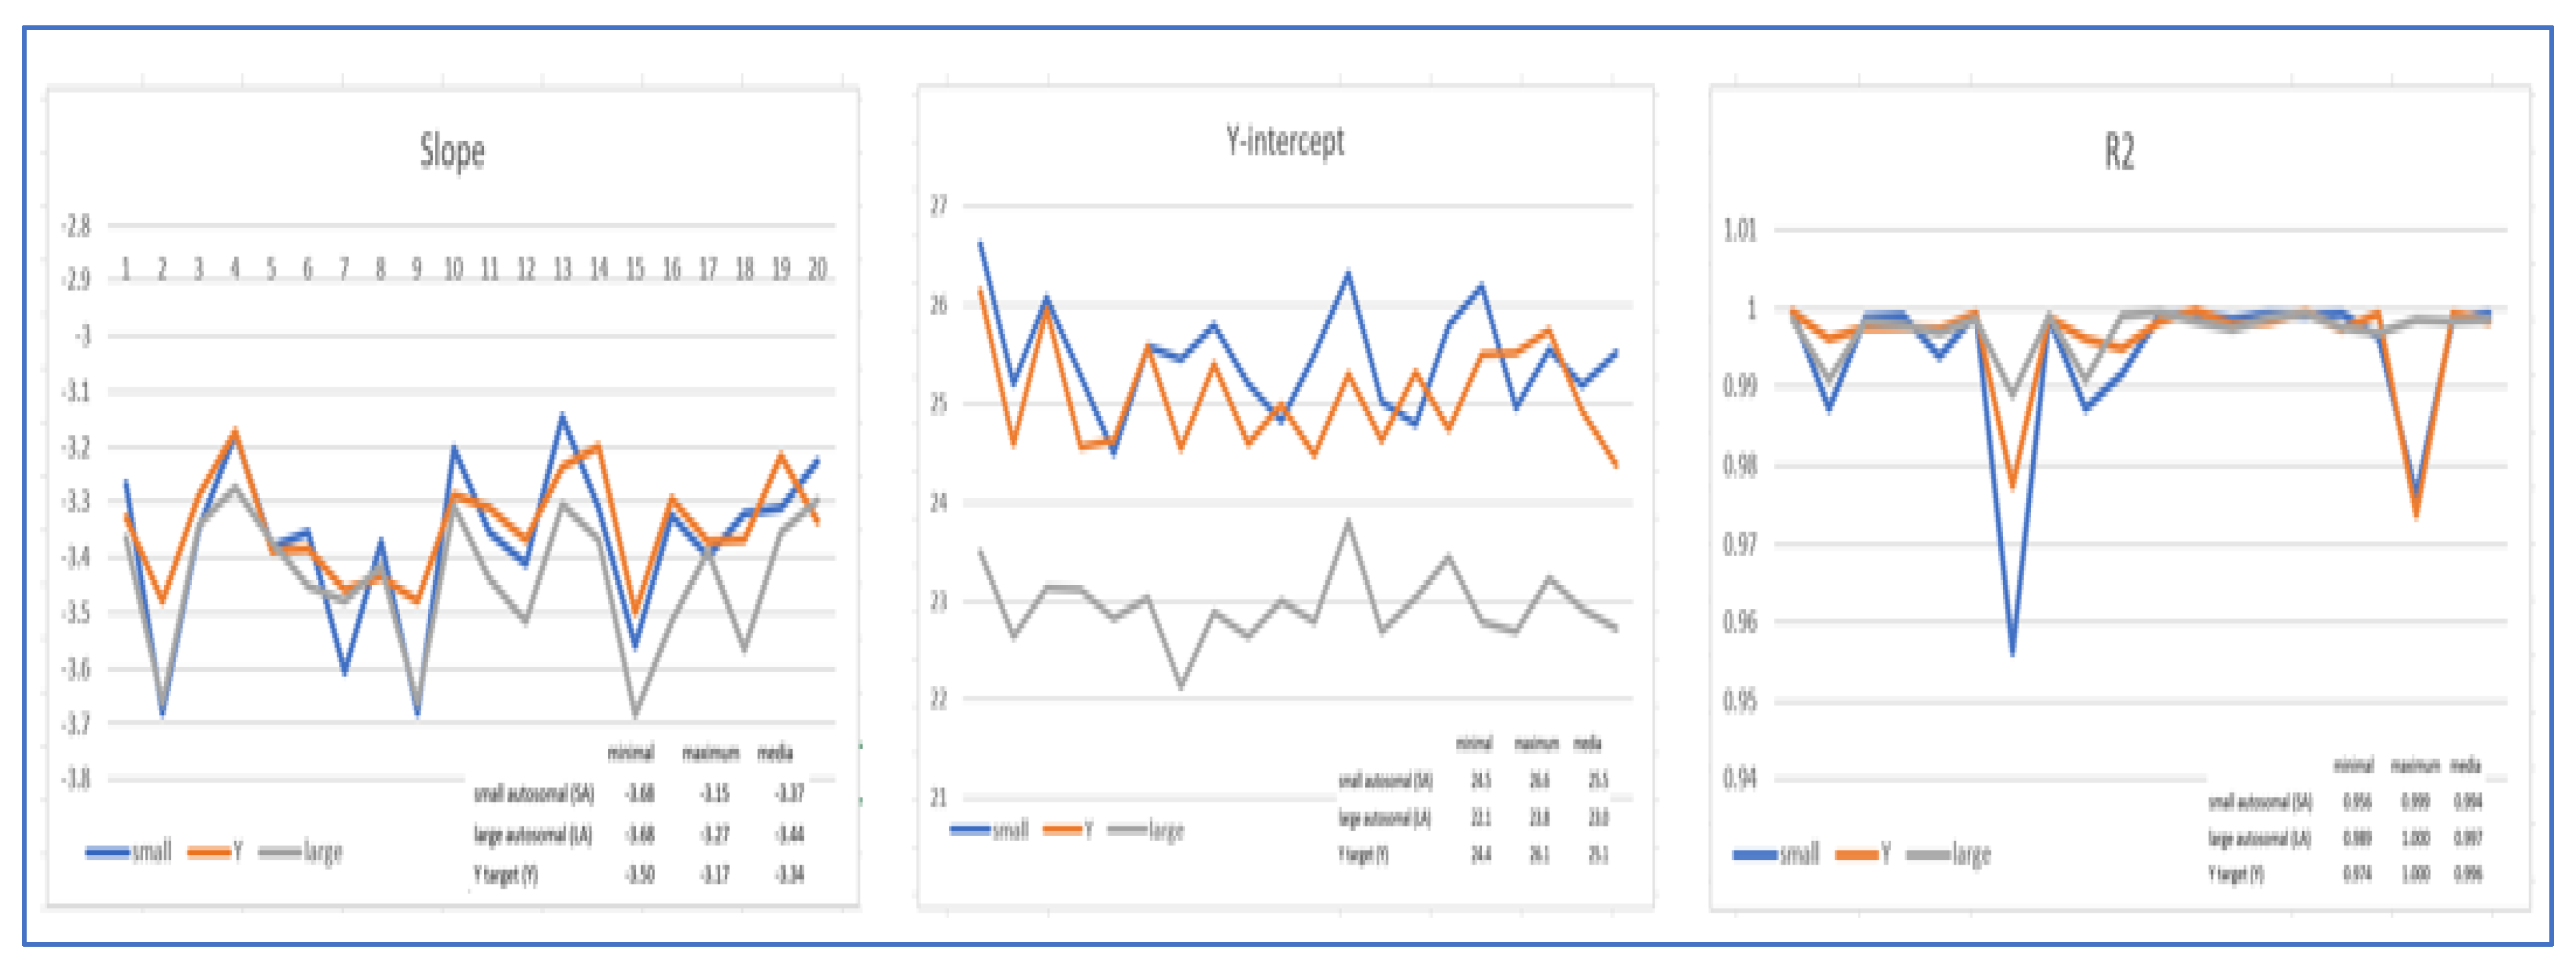
20 different experiments to construct the standard curve were assessed to establish the minimum and maximum values for Slope, Y-intercept, and R2 for each of the probes used. The threshold cycles of the internal IPC control were also observed to determine if the extraction method used ensured sufficient purification of the traces.
For an accurate validation of the system applicable to the internal ISO/IEC 17025 method, 757 samples from 20 independent experiments conducted in the period 2016-2024 were used. These samples all came from real forensic cases and included traces of blood, saliva, semen, epithelial cells, bone fragments, and tissues.
2.4.1. Standard Versus Sample/Sample Versus Standard
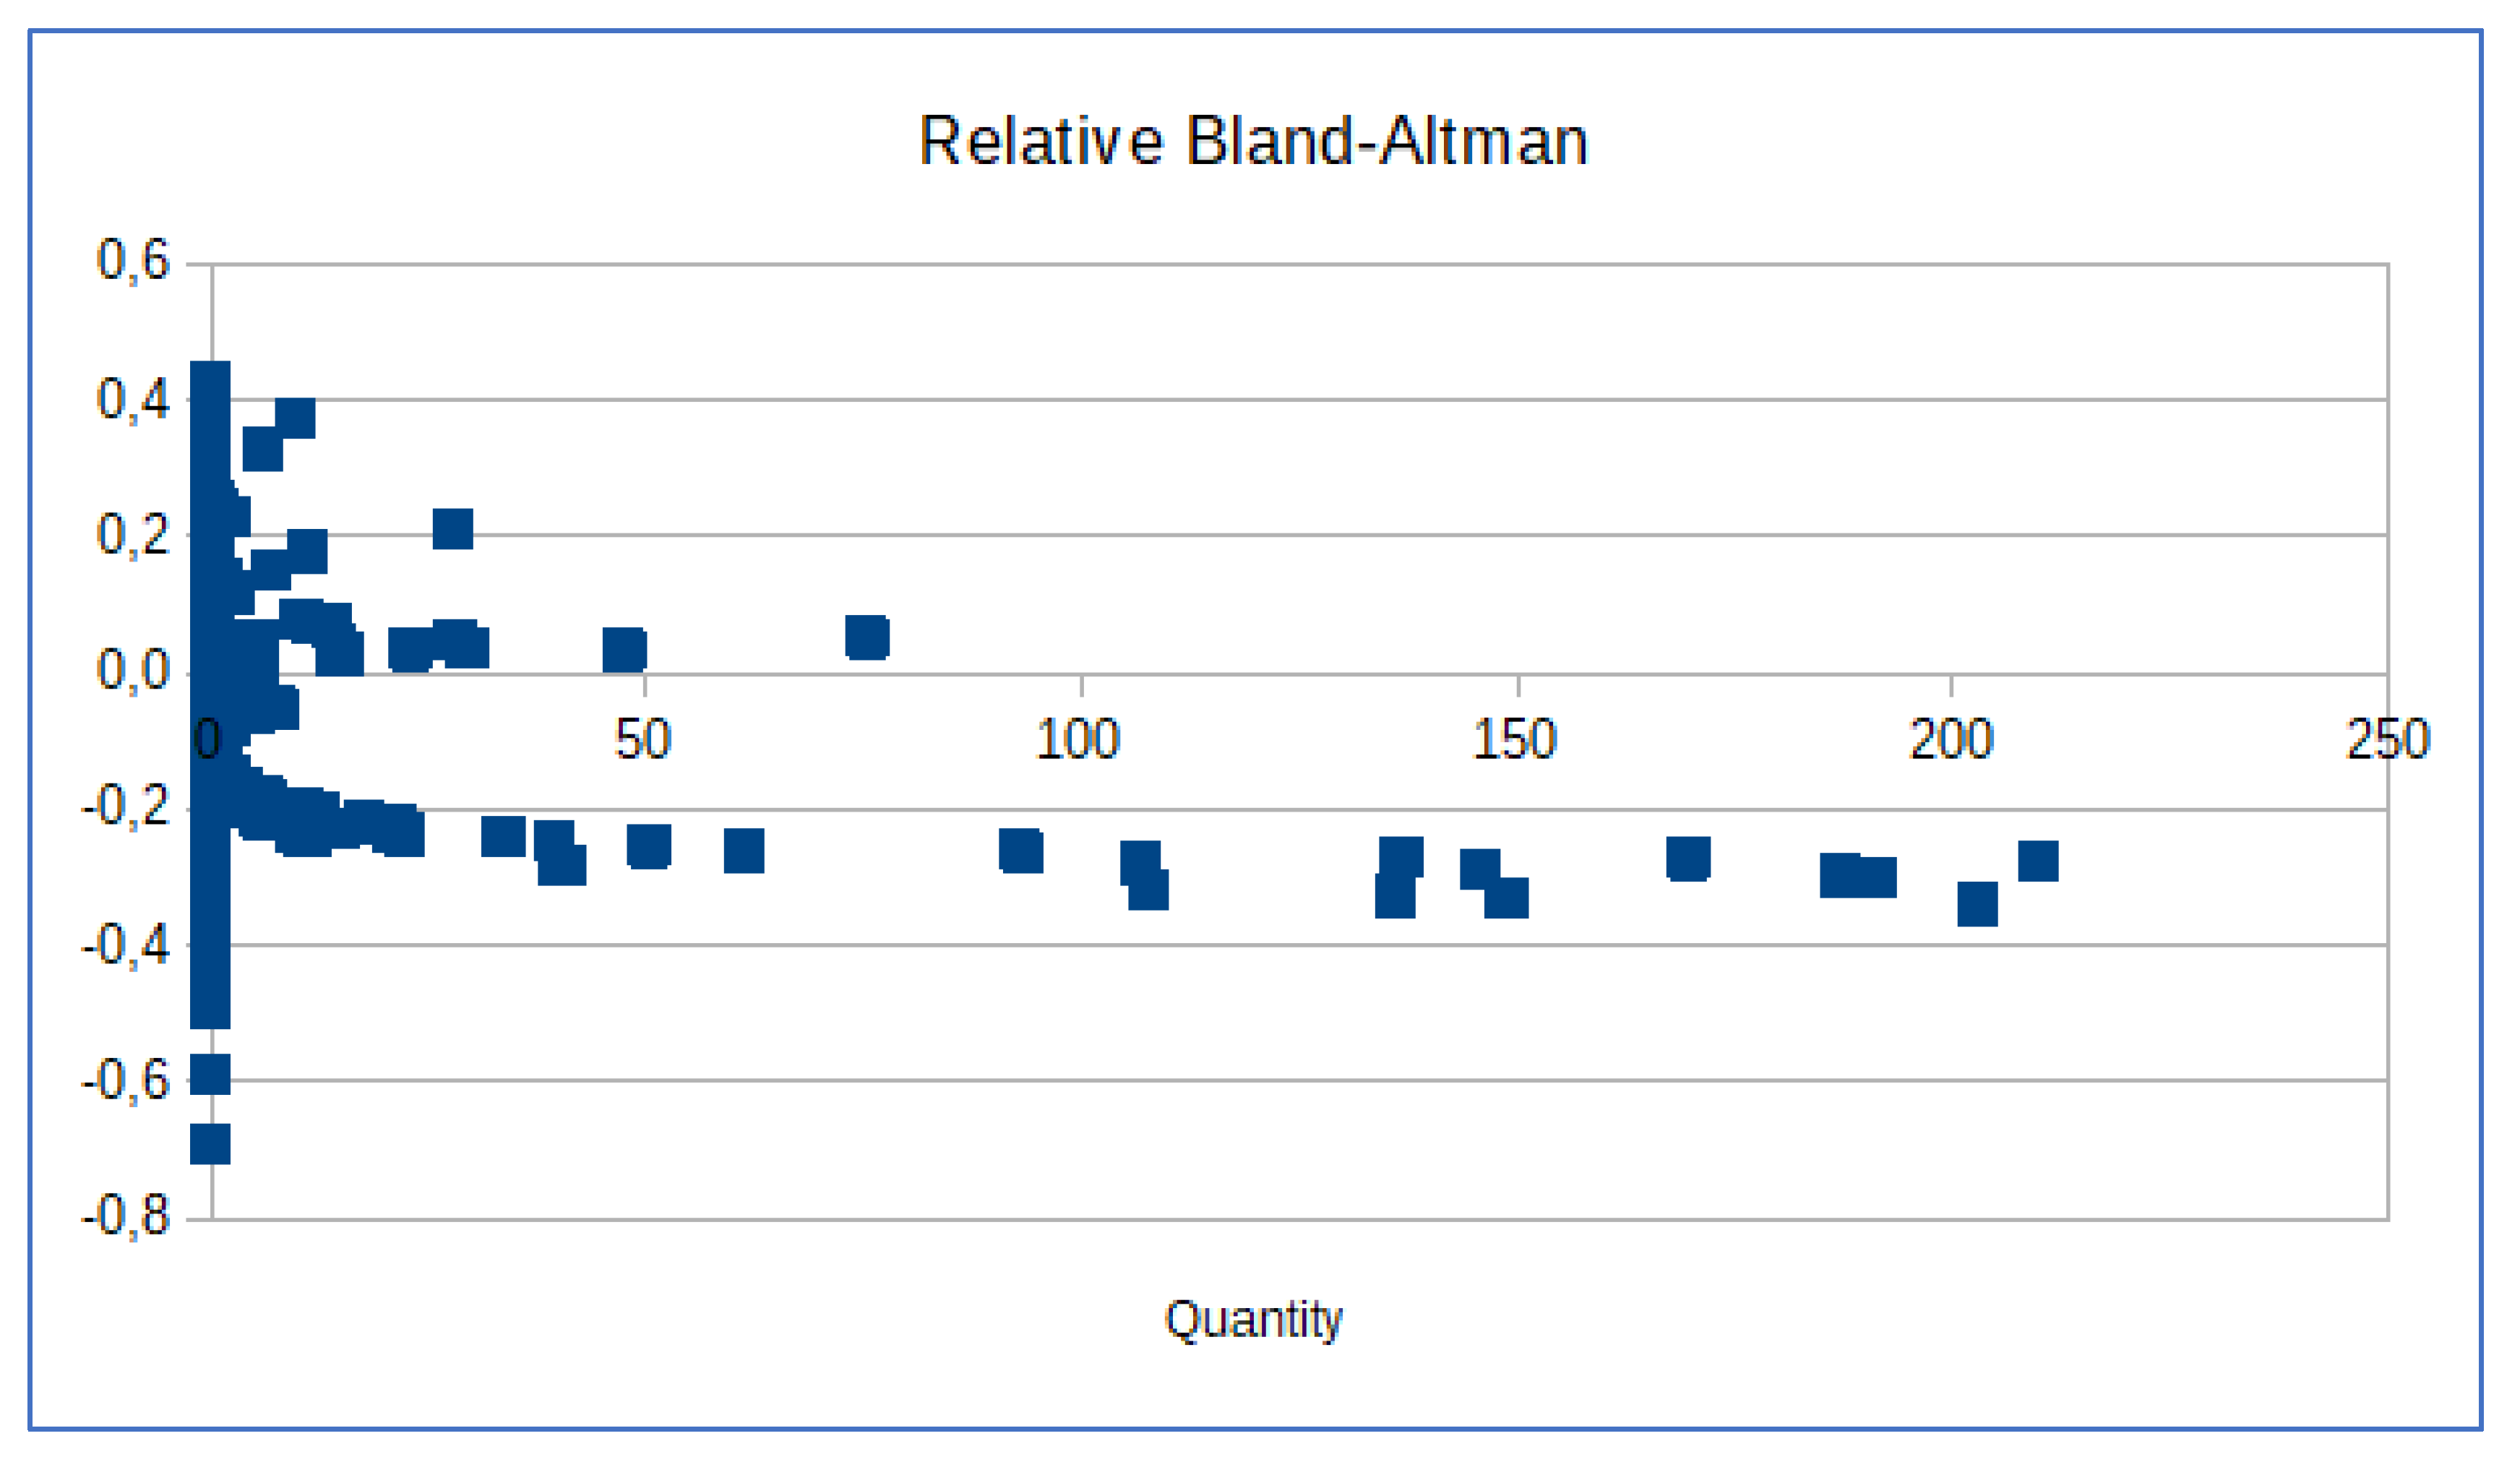
To verify if there were differences between the two replicates used in each of the twenty experiments for constructing the standard curves, the standards were reciprocally used as standards or samples. This was made possible because each experiment could be reanalysed using Design & Analysis Software ver. 2.8.0 (Thermo Fisher Scientific™, USA). We designated each of the two standards as "Sample 1" and "Sample 2" when the other replicate was used as the standard. To assess the differences between the two analyses, we employed the Bland-Altman plot [
18].
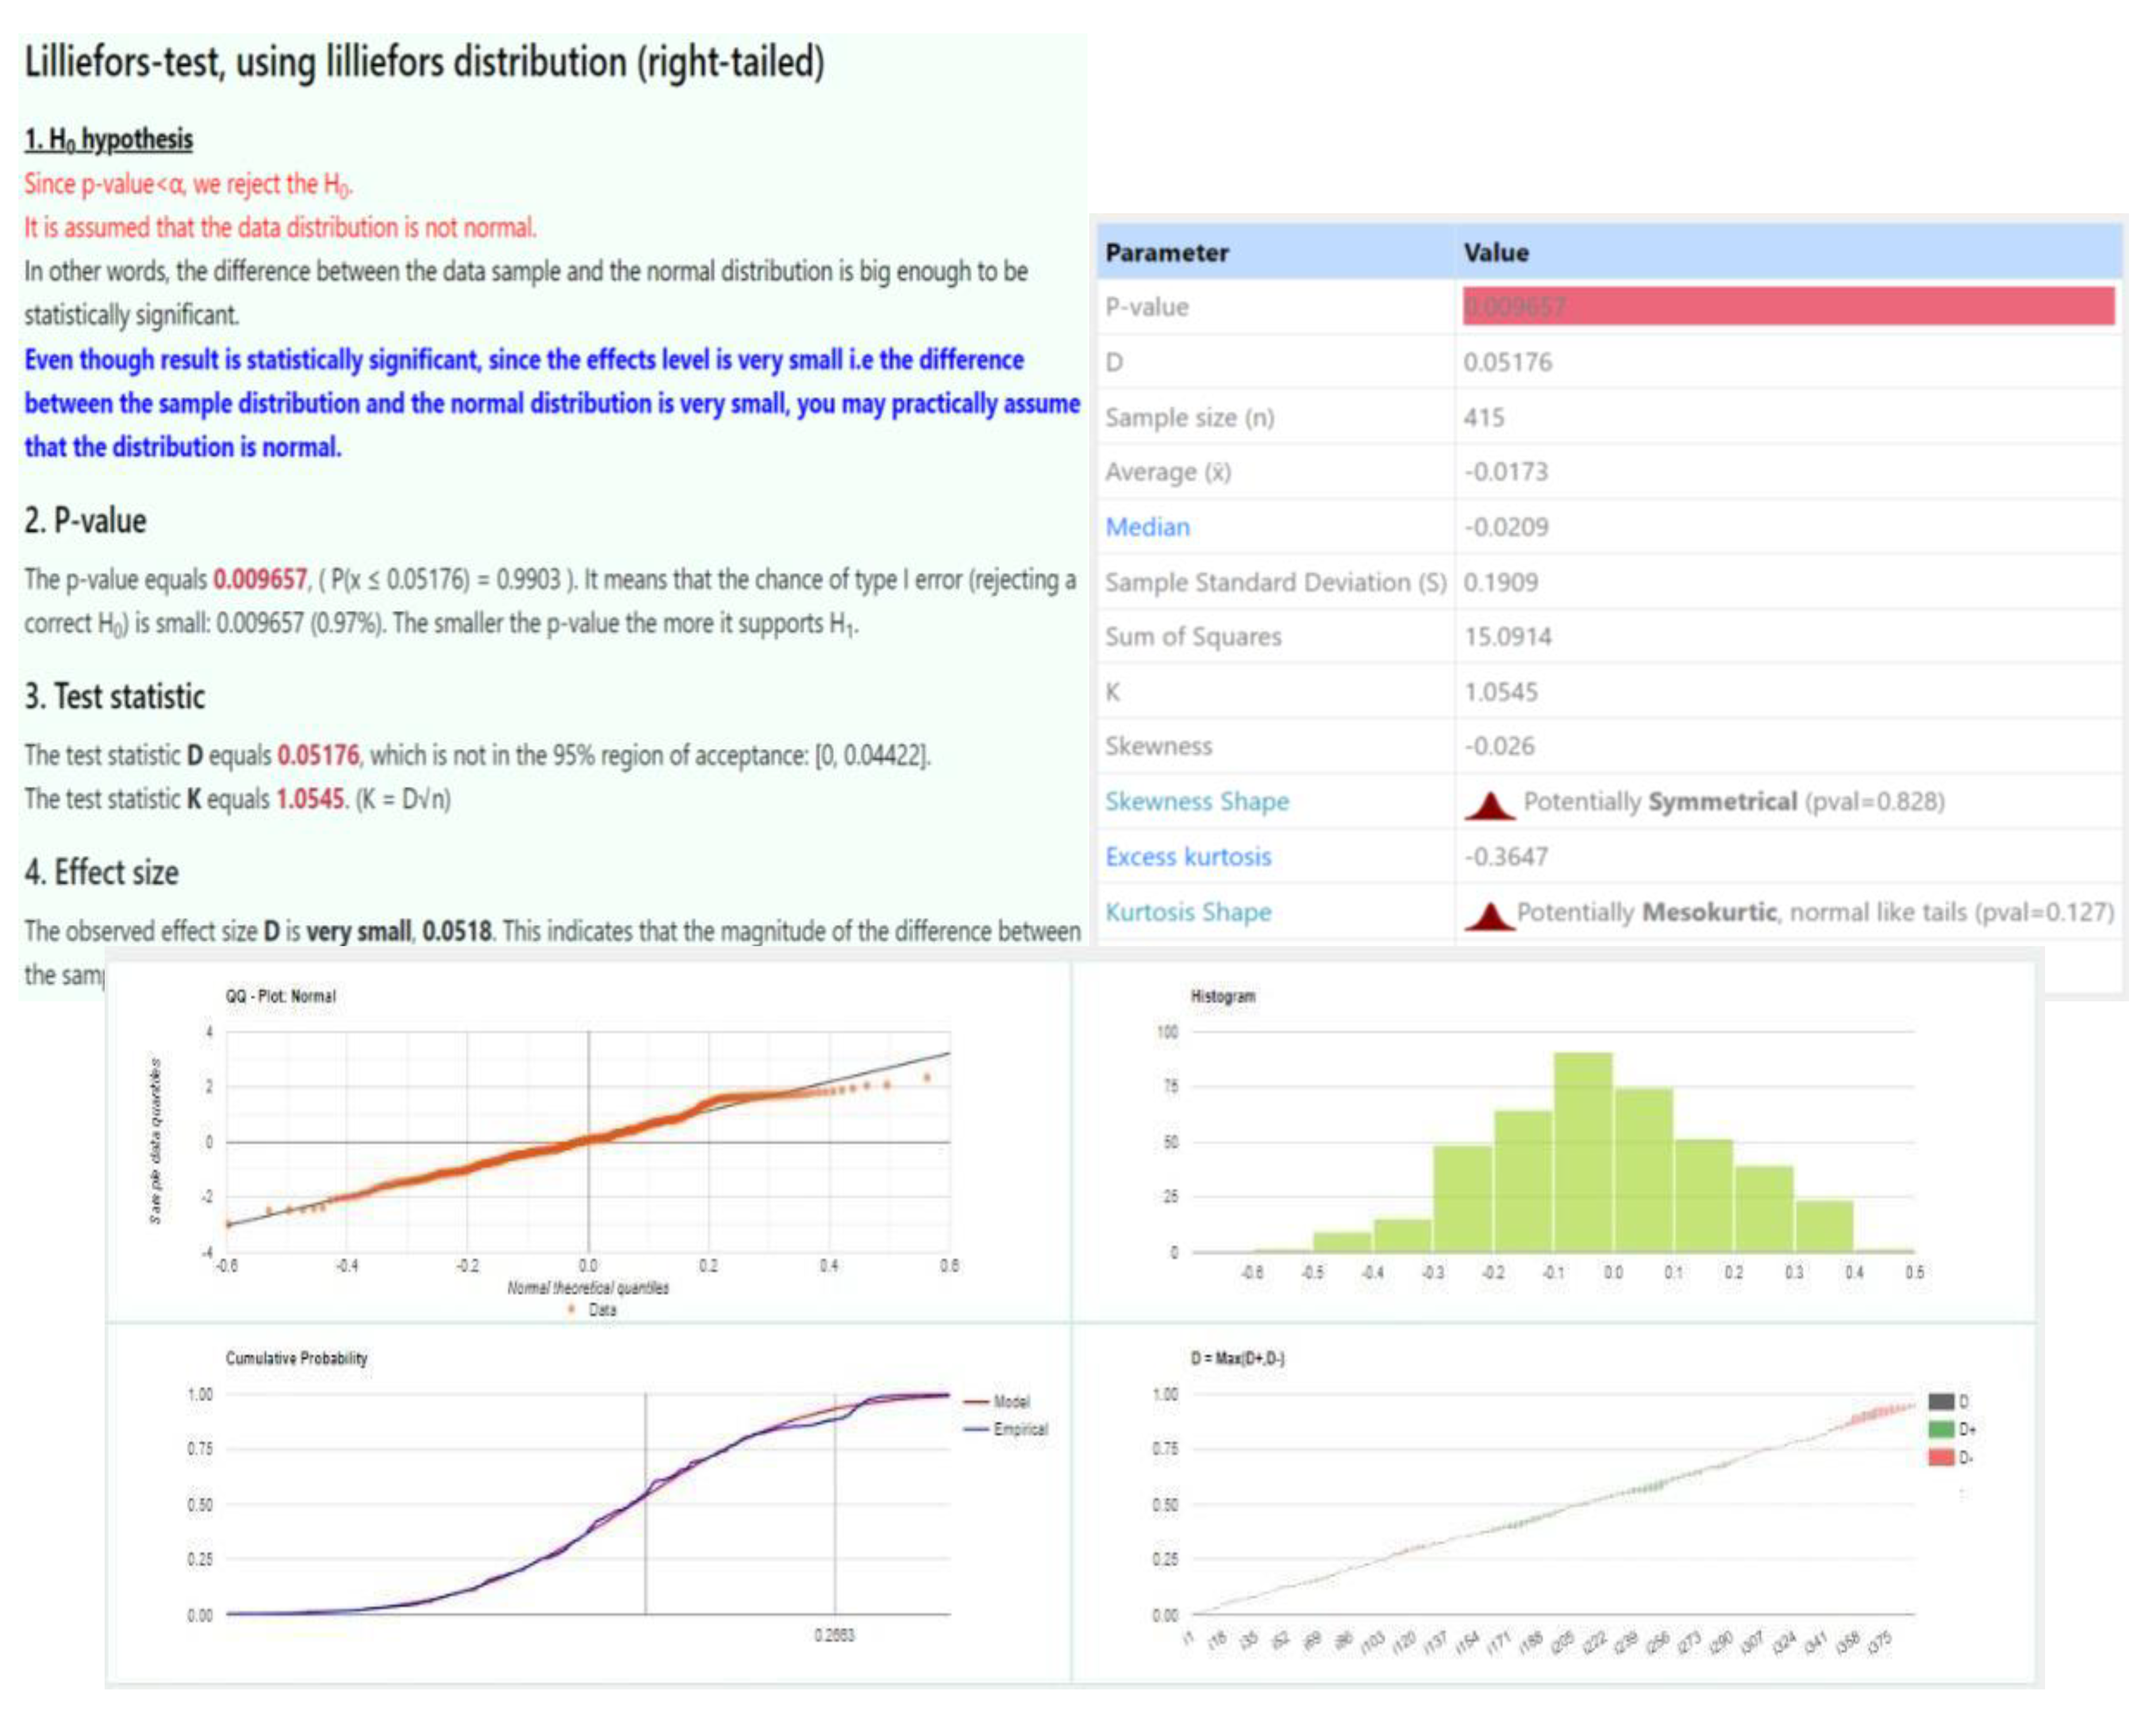
The Bland-Altman plot is used to assess the measurement difference between two different measurement techniques. In fact, if the measurement of differences is normally distributed and the mean difference is statistically different from 0 (i.e., mean ± confidence interval does not contain the zero), then we can assert that the two measurement techniques are statistically different. The normality of the dataset was performed using the Kolmogorov-Smirnov test calculator [
19].
2.5. Concentration of Apparently Negative Samples
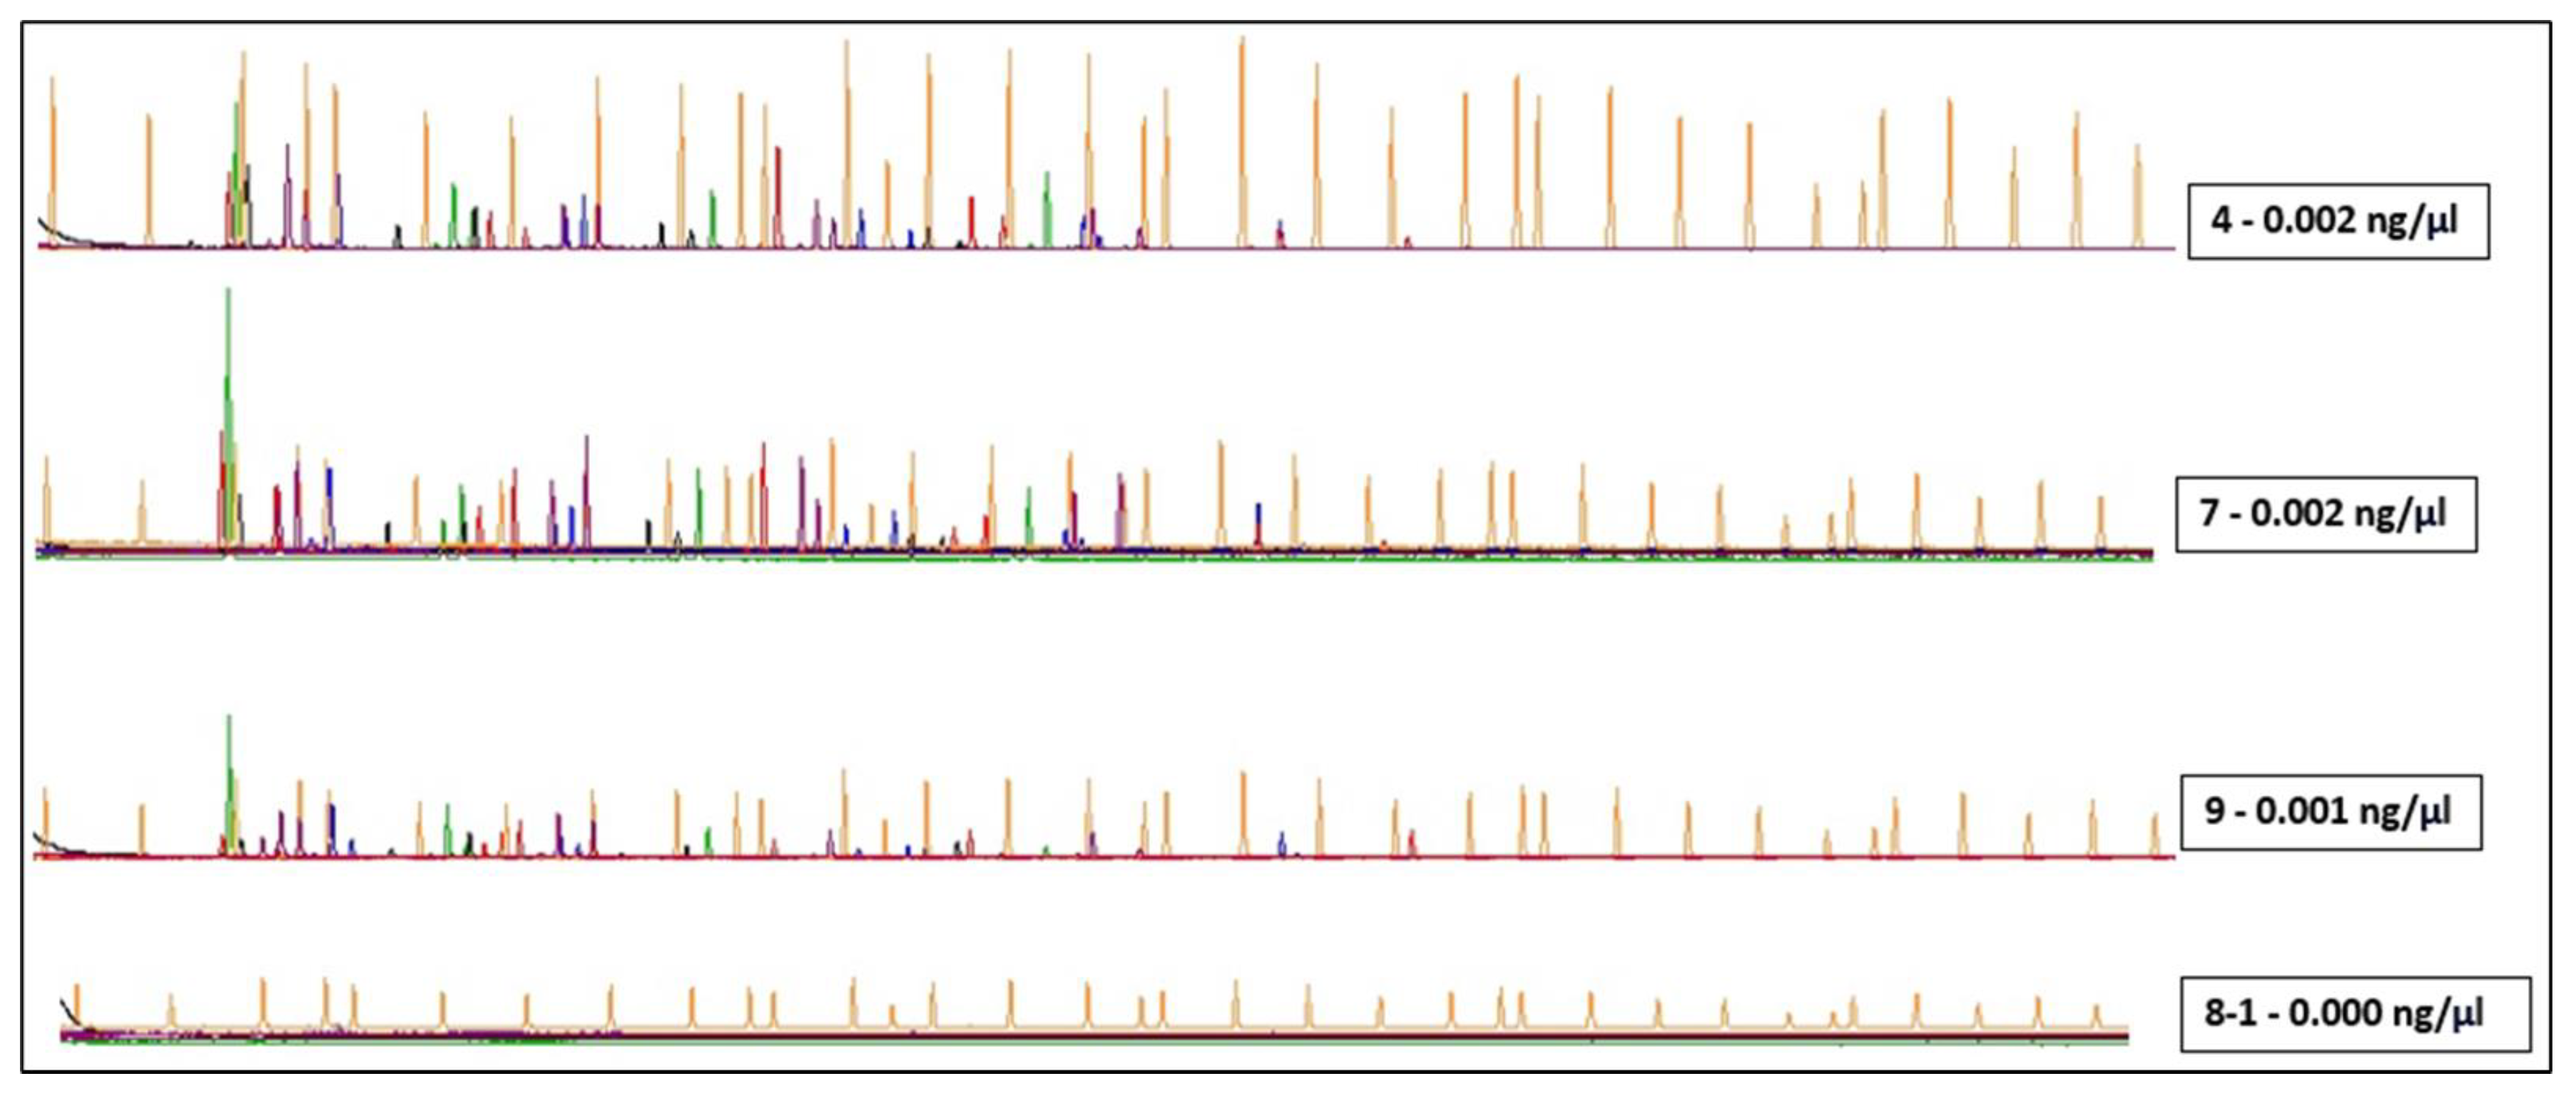
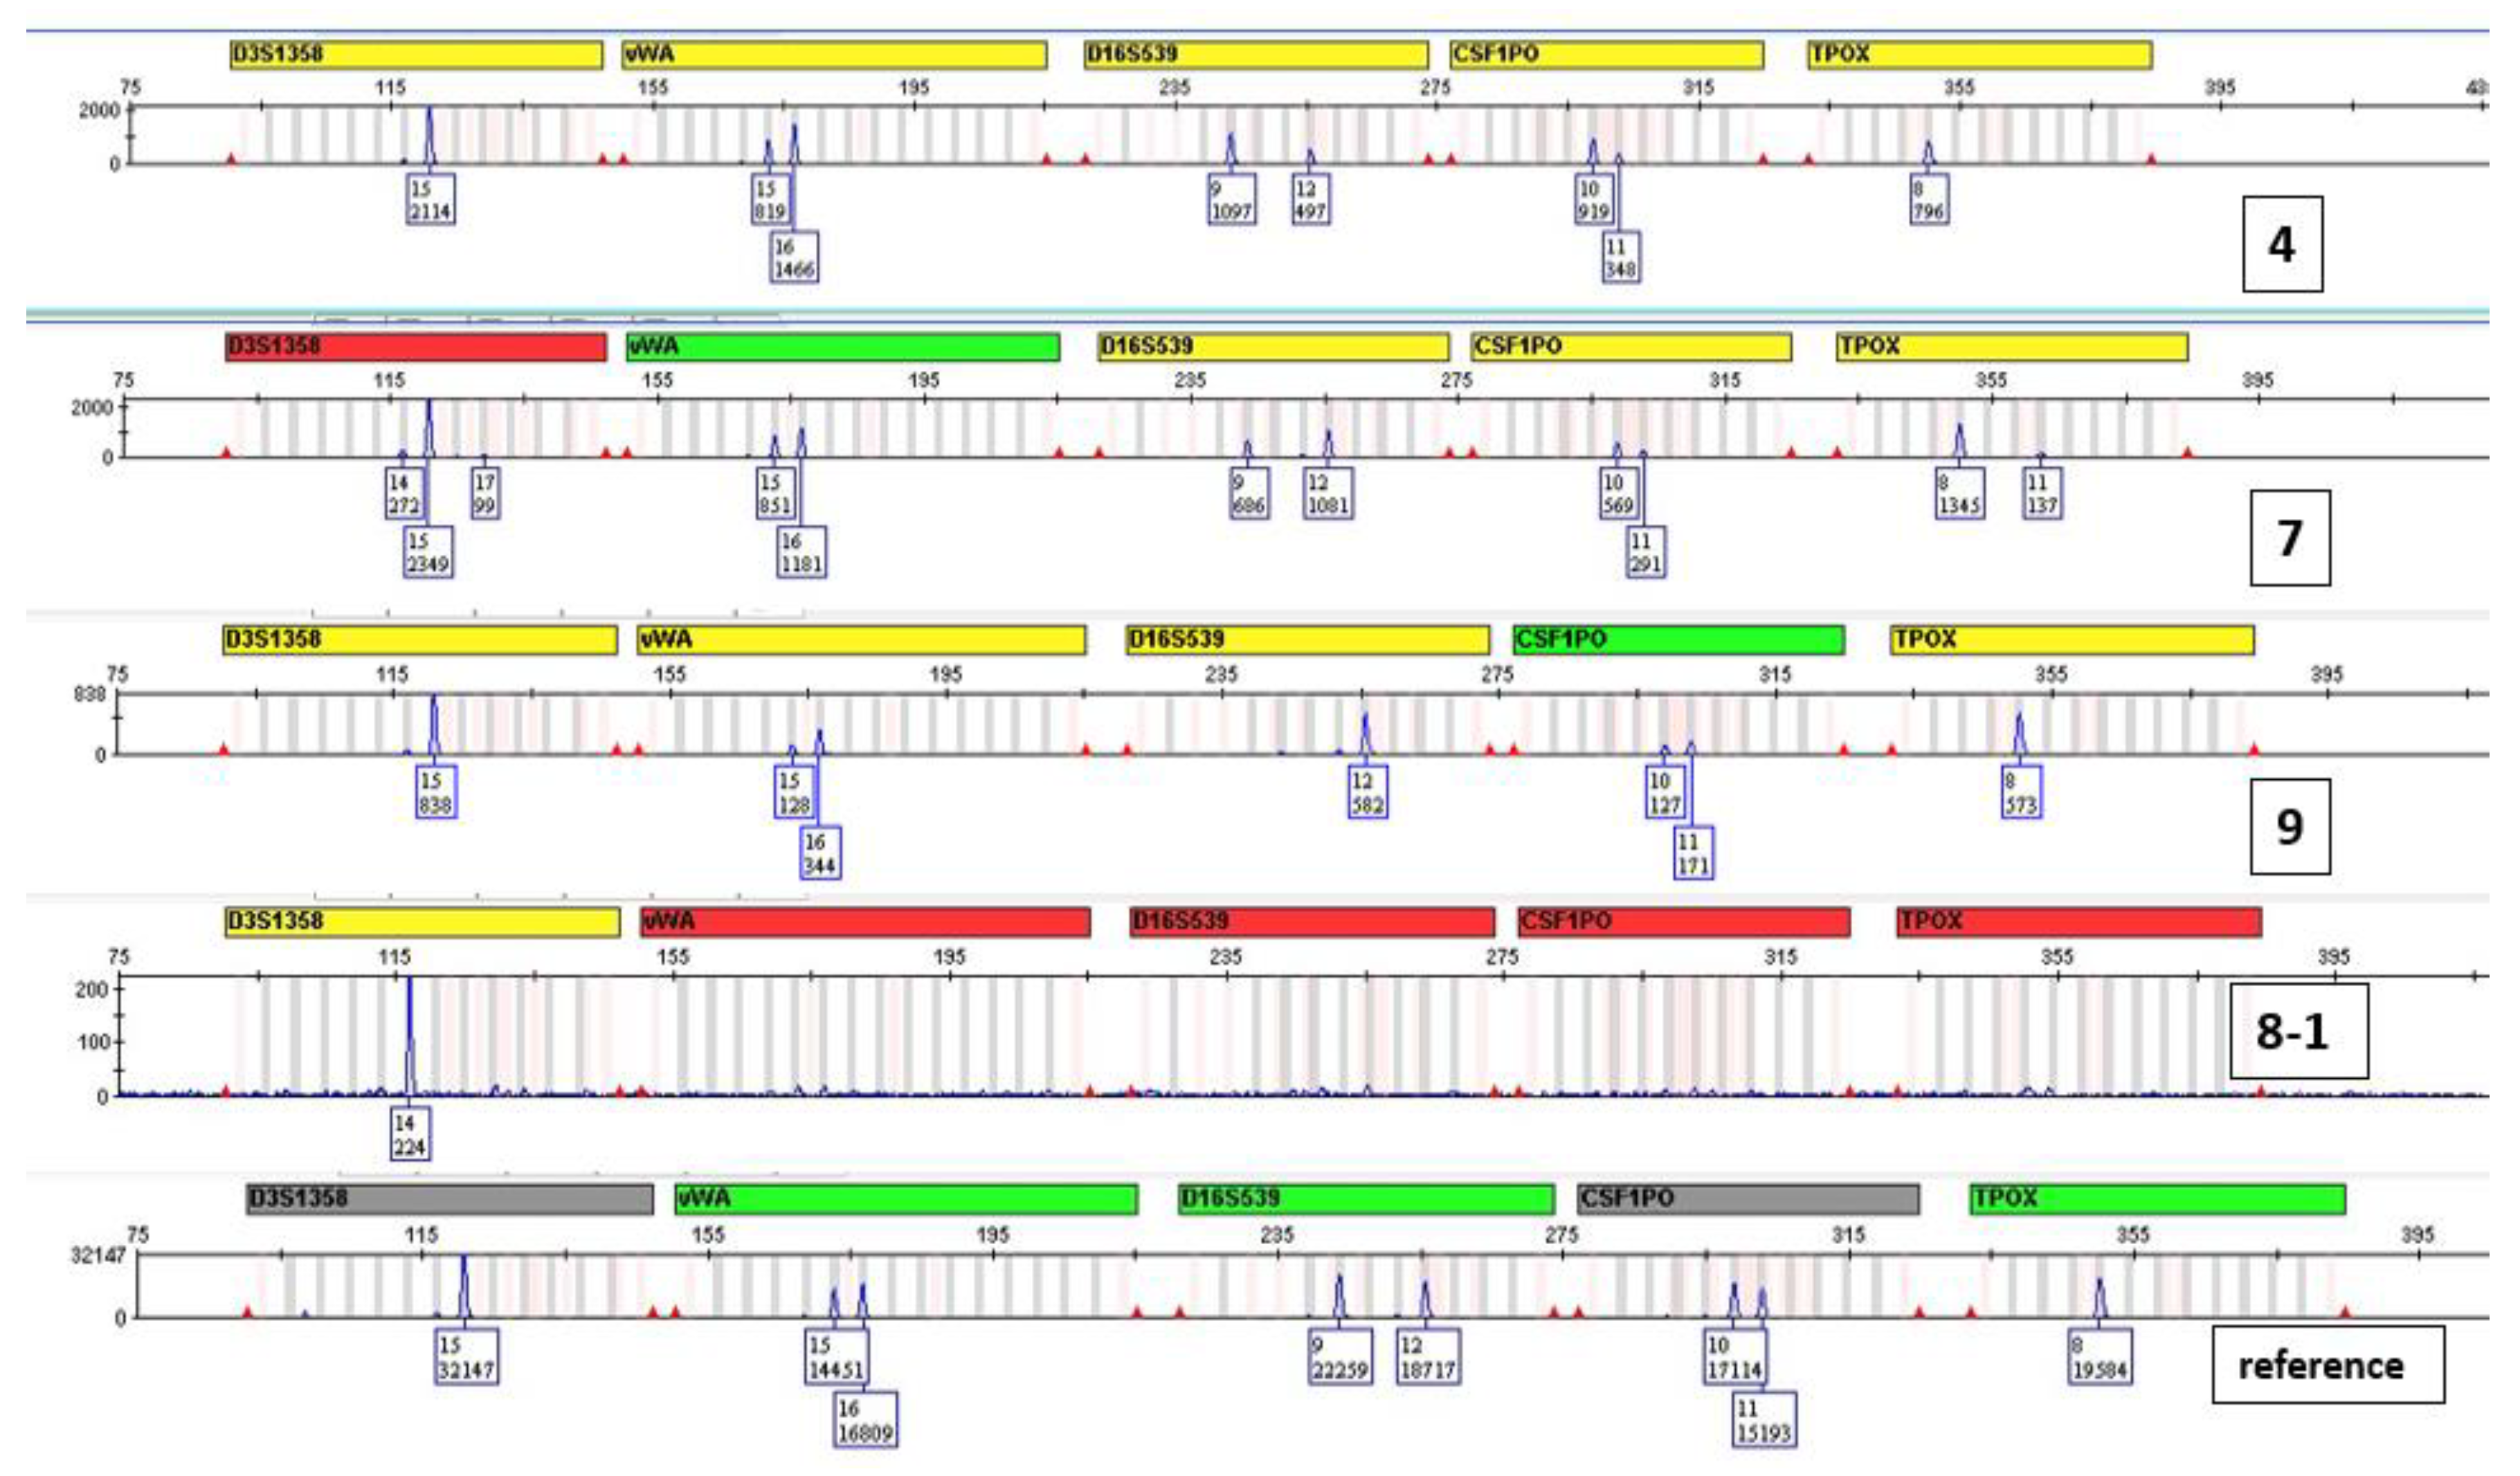
In a preliminary experiment, ten DNA extracts from forensic samples taken from subungual grooves of known individuals that had yielded results <0.003 ng/μl in real-time quantification were concentrated using the Savant SpeedVac™ Vacuum instrument (Thermo Fisher Scientific™, USA). The samples were dried at room temperature and then diluted in TE buffer to 5 μl, suspending them for 30 minutes at 37°C. This way, the DNA extracts were concentrated nearly eightfold compared to the original extracts. No further quantification was performed on these samples.
2.6. Amplification
For the amplification phase, we use both the GlobalfilerTM PCR Amplification kit and the PowerPlex® Fusion 6C, with a maximum volume of 7.5 ul of extracted DNA. When determining the Y chromosome profile, especially in cases of sexual assault, we utilise the kit PowerPlex® Y23. Therefore, at least theoretically, the minimum quantity for an analysis with a low template scenario is at least 22.5 pg/PCR, and for an analysis with a standard protocol, it is 225 pg/PCR. Finally, the concentrated samples were fully amplified using the GlobalFilerTM kit under standard conditions.
4. Discussion
Our service primarily focuses on genetic diagnoses in the prenatal field. However, due to the lack of law enforcement laboratories in the Tuscany region (Central Italy), we established a forensic genetics section in 2009, with an ISO/IEC 17025 accredited test since 2012. The laboratory serves as a reference point for forensic genetics for the Tuscany region [
20]. As of today, there are another eight highly specialised Italian laboratories, not belonging to law enforcement, located in other Italian regions, to produce genetic profiles accredited according to ISO standards. The purpose of our service is to strive for the highest possible outcome for genetic profile determinations from items related to crimes. The ISO/IEC 17025 accreditation issued by the Italian national accreditation body, Accredia, indeed allows our laboratory to submit genetic profiles to the National DNA Database, managed by the Ministry of the Interior in Rome.
The accredited method requires a critical and constant review of the results obtained in the execution of the test. We are aware that to achieve accuracy in DNA quantification, sources of systematic error and measurement distortion, sources of uncertainty, must be minimised. Using real-time methodology, we can ensure the detection of human DNA, the identification of male components, and the presence of any inhibitors that interfere with the PCR phase.
Precision and accuracy are therefore critical aspects of DNA quantification in forensic science. We are aware that in the use of manual methods, especially in the pipetting operations of standards and samples to be quantified, random errors can occur. It is known that real-time PCR tests are extremely sensitive, and the detection of CT values >35 may indicate the presence of extremely low quantities of DNA. In fact, it is possible to detect CT values <40 for extraction control samples and negative control samples while performing a real-time PCR reaction with the QuantiFiler™ Trio DNA quantification kit. The detection of such a low quantity of DNA can vary from amplification to amplification based on stochastic effects. Therefore, it is recommended that each laboratory establish a CT value above which a positive result represents only a background signal [Quantifiler]. From our experience, we have verified the utility of conducting a thorough re-evaluation of the results obtained from numerous real-time experiments. The QuantiFiler™ Trio DNA quantification kit can detect DNA concentrations <5 pg/μl; however, at concentrations <5 pg/μl, stochastic effects or the statistical effect of random sampling of alleles present in a very low number of copies can produce significant variability in assay results. When using samples containing DNA in this concentration range, replicate analyses are indeed necessary to confirm the true absence of DNA. In the review of this phase of the process, it was possible to define more accurate limits based on the quantification results for subsequent choices regarding the possible determination of genetic profiles. This limit has been recalculated considering that the review of the quantifications performed by the laboratory showed that for the lower limits, there was about a 10% difference between measurements made with two different calibration curves. This discrepancy had already been observed in the validation process in which serial dilutions of control DNA had been measured as samples. Although the relative Bland-Altman in our area of interest did not show significantly relevant differences, with an average ratio of 0.02±0.02 (<(x1-x2)/(x1+x2)/2>=0,02±0.02), meaning that on average one of the two measurements differs within a range of approximately 0% to 4% from the other. Therefore, as a precautionary measure, we have decided for the time being to adjust the limits based on the results of the quantification for our method. This allows us to make better choices by optimizing the conduct of the test, pending a more effective implementation that could involve the introduction of an automatic method for the preparation of quantification plates, which could certainly reduce random errors. The vast majority of laboratories use manual methods to quantify forensic extracts, and thus this work should help to pay attention to the execution of this phase. We believe that the critical review of quantifications reported in this study can contribute to an improvement in the entire forensic analysis process, emphasising how to take into account the uncertainty always present in any laboratory activity and, ultimately, the consistency of human activities.
Figure 10 shows the modification in the quantification. Highlights in yellow the new limits adopted in our working protocol in light of this study.
However, there are even more substantial improvements that we plan to implement shortly. In fact, the use of extract concentration, when their concentration is below <0.003 pg/μl applied to some samples obtained from scrapings under the nails of unknown donors, has demonstrated the possibility of generating genetic profiles suitable for comparisons. The concept of usability stems directly from the indications of the Italian DNA Database, for which a profile can be included for comparisons on a national level if at least seven genetic markers are typed, including amelogenin. Of course, this new sample analysis method will require a careful validation process, especially since the profiles were generated with a single PCR. A possible development could therefore involve, after observing quantities <0.002 ng/μl (new lower limit set by this study), a first PCR cycle, followed by verifying the quality of the generated genetic profile. If the result shows an acceptable profile, a second PCR could be performed to generate an additional genetic profile and thus determine a consensus profile. If the generated profile is not usable, the sample could be concentrated and then amplified from the extract suspended in a minimal amount of TE buffer. The method could also be further improved by using a reduced reaction volume, as demonstrated by some authors [
21]. This, in addition to potentially enhancing the functionality of quantifying extracts from forensic samples, will also significantly reduce costs. As already mentioned, an additional improvement to this phase could be the introduction of automation, which helps reduce errors in pipetting standards during calibration curve construction and sample retrieval.
Author Contributions
Conceptualisation, U.R. and D.C..; methodology, U.R. and D.C.; software, D.C..; validation, I.C., C.C., E.P., I.G., M.P. and U.R.; formal analysis, U.R. and D.C..; data curation, D.C..; writing—original draft preparation, U.R.; writing—review and editing, U.R.; supervision, U.R and D.C. All authors have read and agreed to the published version of the manuscript.
