2.1. Study Area and Data
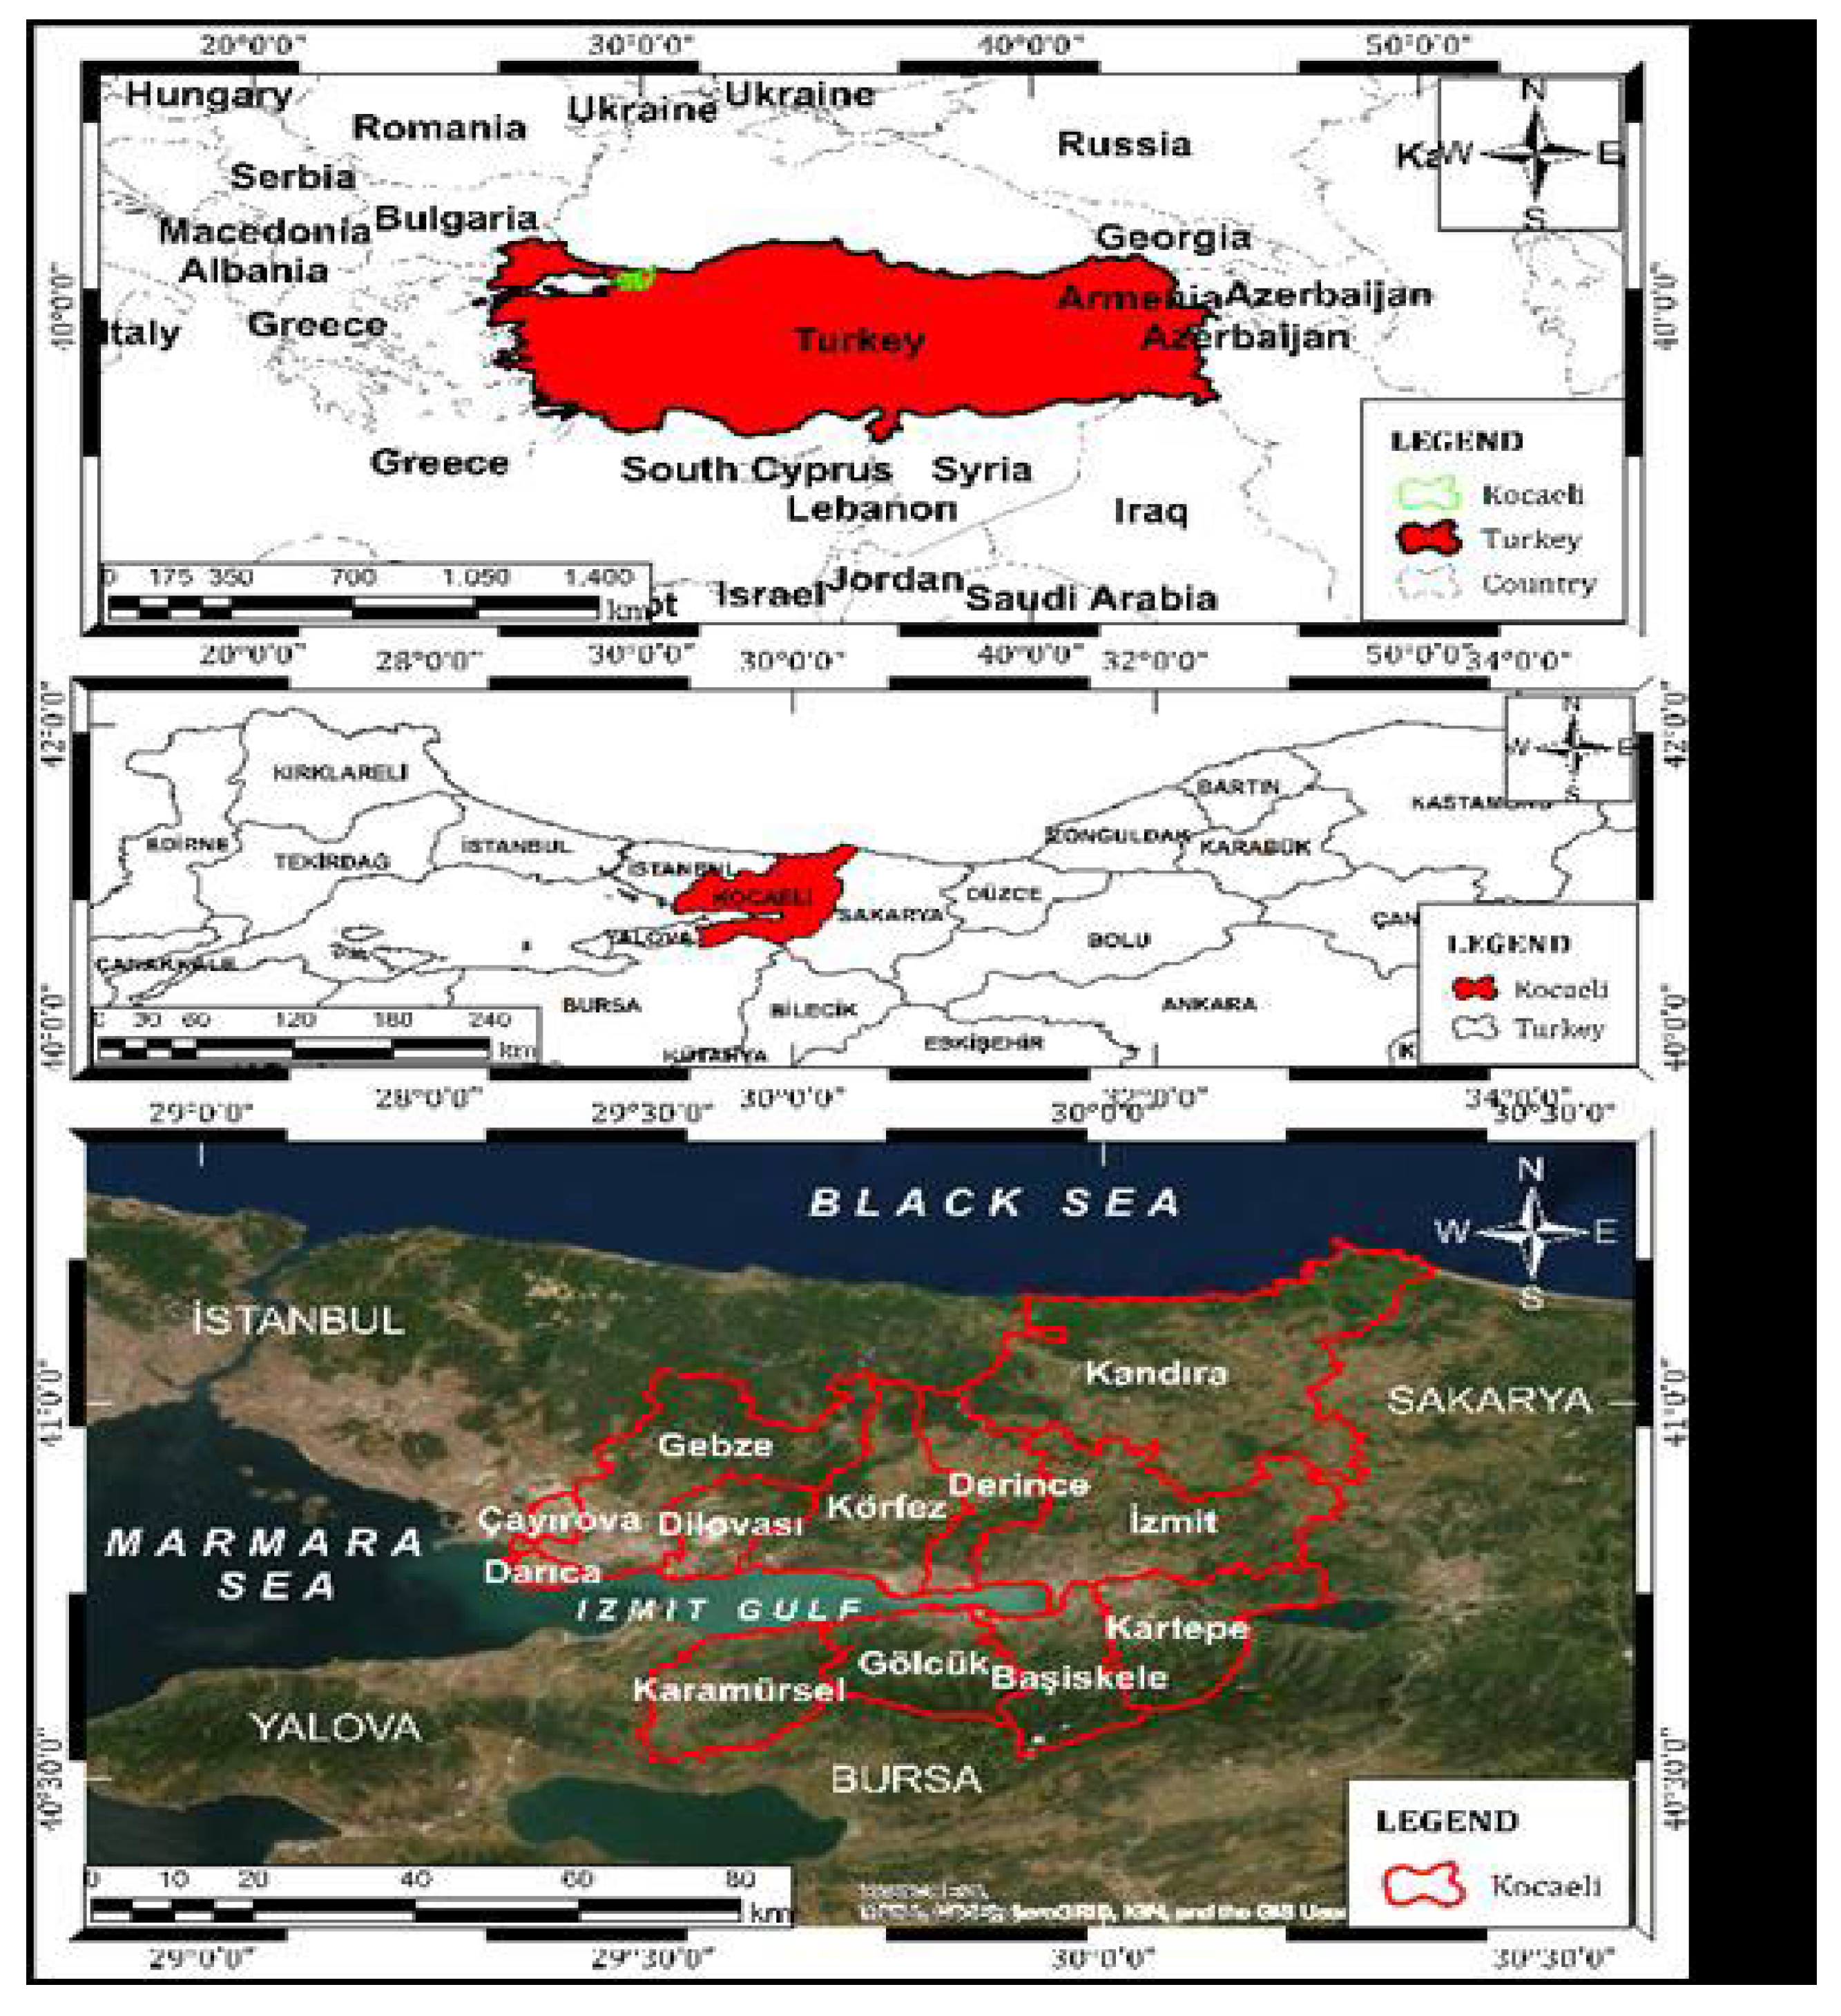
Kocaeli province is located in the Marmara Region of Türkiye.
Figure 2 shows the location of Kocaeli [
27]. Kocaeli is the 10th most populous city in Türkiye and according to 2023 TURKSTAT data, its population is 2.102.907 people and its area is 3626 km
2 [
28].
Since the negative effects of air pollution on human health are known, air quality sampling data should be collected at a certain frequency to determine the level of emissions. For this purpose, 125 air pollution surveys were conducted in 81 provinces between 2005 and 2007 by the Türkiye Ministry of Environment, Urbanization, and Climate Change to measure air pollution accurately, establish air pollution policies in all provinces, and improve the air quality of the provinces within the framework of these policies compared to the values of the previous year. A quality measurement station was established and a National Air Quality Monitoring Network was established throughout Türkiye. Sulfur dioxide (SO2) and particulate matter (PM10) parameters can be measured fully automatically in all established air pollution measurement stations, and in some additionally, nitrogenides (NO, NO2, NOx), carbon monoxide (CO) and ozone (O3). Measurement data collected at measurement stations are monitored and transferred to the Ministry's Environmental Reference Laboratory Data Processing Center via GSM Modems over a special network (VPN) belonging to the Türkiye Ministry of Environment, Urbanization, and Climate Change and published simultaneously at URL-2 [
29]. Verification studies are carried out by examining the data received from the stations in the form of hourly averages, and monthly and annual reports are prepared and published with the data in question. These measurements have been made continuously at stations in Kocaeli province since 1987. Air pollution parameters are measured hourly at Air Pollution Measurement Stations. There are a total of 12 measurement stations in Kocaeli province under the control of the Türkiye Ministry of Environment, Urbanization, and Climate Change [
27].
Monthly average PM10 data for the years 2019-2023 obtained from Kocaeli Central station are given in
Table 2.
According to
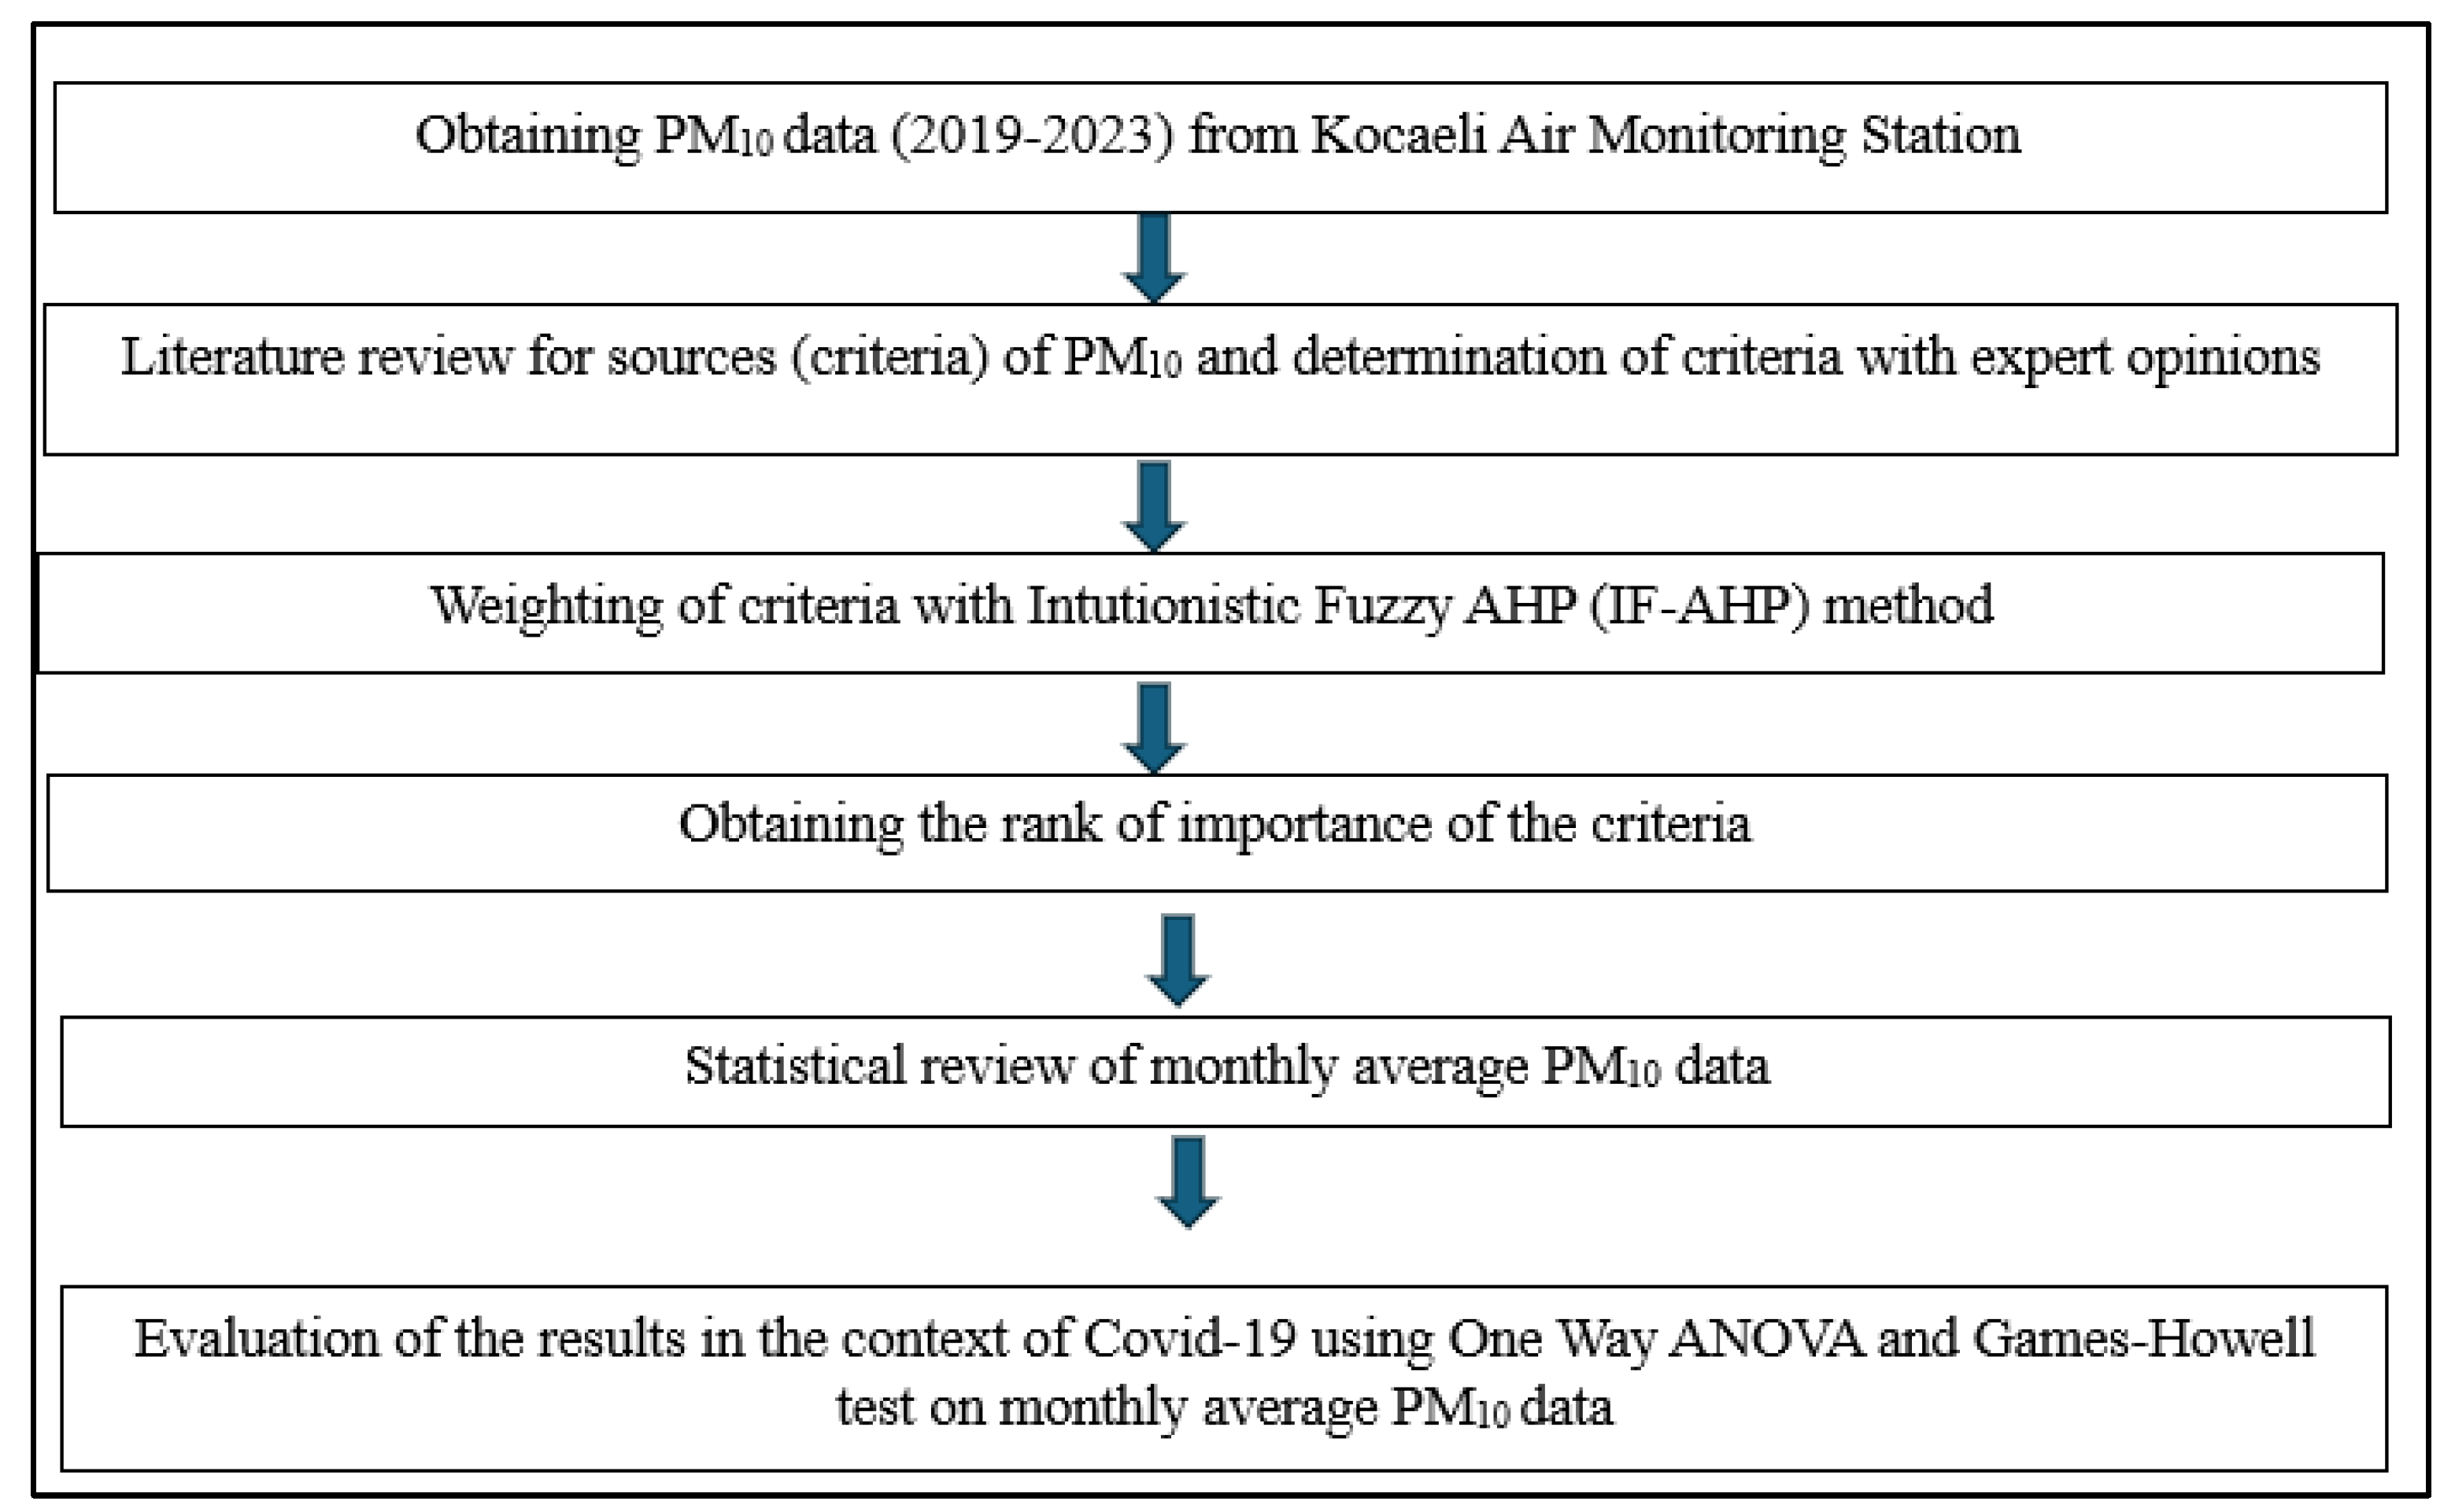
Table 2, Kocaeli's annual average PM10 values are 54.70; 40.12; 42.53; 45.22, and 39.85 between 2019 and 2023, respectively. The highest value of 54.70 was achieved in 2019 when the COVID-19 pandemic had not yet started. Due to restrictions around the world, the annual average PM10 concentration value decreased significantly in 2020. Annual average PM10 concentration value started to increase again in 2021 and 2022. In 2023, it showed a serious decrease again. It can be thought that this decrease is related to the regularization of various measures for air pollution on the agenda and the adoption of the remote working principle by most businesses due to the Covid 19 pandemic. A detailed examination of the criteria affecting PM10 concentration is important in this context. In this study, the criteria affecting PM10 concentration values determined by literature evaluation are weighted with Intuitionistic Fuzzy AHP by taking expert opinion. Thus, the order of importance of the criteria could be obtained from the decision-making perspective. In addition, a statistical analysis is performed on the actual PM10 values, and whether there is a significant difference between the average PM10 values in the context of Covid 19 is evaluated by One-Way ANOVA.
In the following sections, Intuitionistic Fuzzy AHP and One-Way ANOVA methodology are given.
2.2. Intuitionistic Fuzzy AHP (IF-AHP)
The AHP method was developed by Professor Thomas L. Saaty and used for decision-making problems. AHP is a methodology based on one-to-one comparisons of the criteria and sub-criteria affecting the decision according to their degree of importance, using a binary comparison scale in any decision problem. The AHP method also aims to prioritize by distinguishing between alternative options to meet interconnected goals [
30]. However, AHP cannot fully reflect the functioning of the complex human thought system. For this reason, the method has been used by many researchers in problem-solving by combining it with the fuzzy logic approach [
31,
32,
33]. In the following periods, the uncertain and hesitant situations of experts and the decision environment brought about the search for heuristics in the fuzzy AHP method. By developing intuitive fuzzy set theory, this approach has been integrated with the AHP method and investigated by several researchers [
34]. Abdullah and Najib [
34] proposed a new heuristic fuzzy AHP with a new pairwise matching comparison matrix evaluation preference scale. This new preference scale leads to the proposal of a new consistency test for matrix evaluation using the values of the degree of hesitation. The steps of intuitionistic fuzzy AHP method presented by Abdullah and Najib are as follows:
Step 1: A hierarchical structure is created for the decision problem.
Step 2: Pairwise comparison matrices are created with the triangular intuitive fuzzy numbers preference scale in
Table 3.
Step 3: The weights of decision makers are determined. The degree of importance of the decision maker or experts to the decision problem is also expressed by linguistic variables. Triangular intuitive fuzzy numbers defined for linguistic variables are in
Table 4.
is the expression of the degree of importance of expertise of the decision maker “k” for the decision in terms of an intuitive fuzzy number.
The weight of k expert is calculated using Equation (1) [
35].
Where,
Step 4: The collective intuitive fuzzy decision matrix based on the decision maker's opinion is created using the intuitive fuzzy weighted average (IFWA) operator developed by Xu [
36].
The combination form of the IFWA operator is given in Equation (2), where
is the intuitive fuzzy decision matrix of the k. decision maker and
is the weight of all decision-makers.
From here to
);
Step 5: The consistency ratio (CR) is calculated for the collective heuristic fuzzy decision matrix. Since the bulk intuitionistic fuzzy matrix contains the τ (x) value, which is the hesitation value of triangular intuitionistic fuzzy numbers, a new method is presented for calculating the consistency ratio (Abdullah and Najib, 2014). Random index values (RI) were taken from
Table 5 presented by Saaty in the standard AHP method [
37]. According to the new method presented, CR is calculated by the equation in Equation (3). (𝜆𝑚𝑎𝑥 − 𝑛) in Equation (3) is the average of the τ(𝑥) values in the aggregated intuitive fuzzy matrix of each criterion. The value of n is the size of the matrix.
The matrix is confirmed to be consistent if the CR value does not exceed 0.10. If this value is greater than 0.10, there is an inconsistent decision matrix and, in this case, it is necessary to reconstruct the comparison matrices.
Step 6: The intuitive fuzzy entropy weights of the aggregated weighted intuitive fuzzy decision matrix are calculated with the equation given in Equation (4) and the final weights are calculated with the equation in Equation (5). Afterwards, final criterion weights can be reached by taking arithmetic averages.
The matrix is confirmed to be consistent if the CR value does not exceed 0.10. If this value is greater than 0.10, there is an inconsistent decision matrix and, in this case, it is necessary to reconstruct the comparison matrices.
Step 6: The intuitive fuzzy entropy weights of the aggregated weighted intuitive fuzzy decision matrix are calculated with the equation given in Eq. (4) and the final weights are calculated with the equation in Equation (5). Afterwards, final criterion weights can be reached by taking arithmetic averages.
Some of the criteria in the literature are examined to determine the criteria affecting PM10 concentration and weight them with IF-AHP [
38]. The criteria determined within the scope of this study are given in
Table 6.
Climatic Features (C1): The climate of a region affects the distribution of PM10 substances in the atmosphere [
45]. In recent years, the relationship between air quality and meteorological conditions in cities has been the subject of research [
46]. Basic climatic features such as temperature, humidity, wind speed, and pressure have a positive and negative effect on PM10 values [
47]. Many studies have been conducted in the literature determining the effect of meteorological parameters on PM10 concentrations. In these studies, it was determined that there was a relationship between PM10 level and meteorological conditions [
48].
Density of Industrial Facilities (C2): Pollutants are released into the atmosphere when the fuel used to obtain the energy needed in industrial facilities such as factories, power plants, combustion plants, and industrial facilities is burned. In addition, the concentration of PM10 in the air increases as a result of the burning of solid waste in furnaces and open areas [
49].
Population Growth (C3): Population growth and development are rapidly changing the environment. Due to rapid population growth and increasing industrialization and urbanization, damages such as climate change, difficulty in accessing clean water, air pollution, increase in hazardous waste, deforestation, and desertification occur. It is known that the PM10 rate increases in areas with high population density [
50].
Unplanned Urbanization (C4): Unplanned urbanization along with increasing energy use, the use of coal with high sulfur content in heating, the destruction of nature, and the negative impact on the climate have made air pollution and the increase in PM10 levels an important problem, especially in big cities [
51].
Lack of Green Area (C5): Urban green areas have many important and even vital functions, especially in terms of ecological, economic, social, and planning [
52]. However, infrastructure systems must support ecosystem functions. The function of reducing and balancing air pollution is one of these important functions. The most important role of green areas in reducing air pollution is their ability to absorb particulate matter in the air. The decrease in green areas increases the PM10 rate in the air [
53].
Topographic Structure (C6): The unsuitable topographic features of the settlements have negative effects on air quality [
54]. The topography of the regions affects the distribution of air pollution in the atmosphere. Topographic differences in the city also cause spatial differences in air pollution [
55]. Settlements built without taking into account the topographic characteristics of the areas where cities are established further increase the existing air pollution. In regions with basin geomorphology surrounded by elevations, the amount of PM10 and its residence time in the environment are high. In cases where the topographic features of cities prevent wind flow, PM10 pollutants cannot disperse in the air [
56].
Motor Vehicle Emission (C7): High levels of engine emissions occur due to low levels of engine technology, the lack of a comprehensive vehicle emissions inspection and maintenance program, as well as poor enforcement of vehicle emissions requirements. Toxic hydrocarbons and organic oxygenates, carbon monoxide, nitrogen oxides, and soot particles are released from motor vehicle exhaust, and the PM10 rate also increases [
38].


