Preprint
Article

Compensatory Modulation of Seed Storage Protein Synthesis and Starch Accumulation by Selective Editing of 13 kDa Prolamin Genes in Rice

Altmetrics

Downloads

85

Views

38

Comments

0

A peer-reviewed article of this preprint also exists.

Submitted:

09 May 2024

Posted:

09 May 2024

You are already at the latest version

Alerts
Abstract
Rice prolamins are categorized into three groups by molecular size (10, 13, or 16 kDa), while the 13 kDa prolamins are assigned to four subgroups (Pro13a-I, Pro13a-II, Pro13b-I, and Pro13b-II) based on cysteine residue content. Here, we generated four knockout strains of rice using CRISPR-Cas9, each of which demonstrated selectively reduced expression of specific subgroups of the 13 kDa prolamins. These four mutant rice lines also demonstrated compensatory expression of glutelins and non-targeted prolamins, which resulted in low grain weight, altered starch content and atypically-shaped starch granules and protein bodies. Transcriptome analysis identified 746 transcripts that were differentially expressed in the mutant rice lines during development. These transcripts played roles primarily in RNA processing, protein synthesis, stress response, and transport. After selective suppression/knockout of genes in the Pro13a-I subgroup, compensatory upregulation of genes in the Pro13a-II and Pro13b-I/II subgroups was observed. Compensatory expression of 9 ER stress and 17 transcription factor genes was also observed in mutant rice in which expression of 13 kDa prolamin genes was suppressed. Our results provide valuable insight into the regulatory mechanisms underlying rice seed development and the specific roles played by 13 kDa rice prolamins and their target genes.
Keywords: 
Subject: Biology and Life Sciences  -   Plant Sciences

1. Introduction

Seed storage proteins (SSPs), which are the nitrogen source for developing plant seedlings, are classified into four groups based on their solubility: water-soluble albumins, saline-soluble globulins, dilute acid-/alkali-soluble glutelins, and alcohol-soluble prolamins [1,2,3]. In rice, glutelins account for 60–80% of all SSPs and are encoded by 15 genes classified into four groups based on amino acid sequence similarity: GluA, GluB, GluC, and GluD [4,5]. Prolamins account for 20–30% of SSPs, are encoded by 34 genes [6], and are classified into three groups based on their molecular weight: 10, 13, or 16 kDa. The major group of prolamins are 13 kDa in size, and this group is further divided into four subgroups based on cysteine content: Pro13a-I, Pro13a-II, Pro13b-I, and Pro13b-II [7,8].
SSPs are synthesized at the rough endoplasmic reticulum (ER), translocated to the ER lumen, and then transferred to other intracellular compartments of the plant endomembrane system [9,10]. Prolamins accumulate in the ER-derived protein bodies (PB) I (PB-I), whereas globulins and glutelins accumulate in PB-II structures before subsequently moving to protein storage vacuoles (PSVs) [10,11]. The PB-I particle has a layered structure, with the 10 kDa prolamin in the core (innermost) layer, the Pro13b-I subgroup in the layer surrounding the core, 16 kDa and Pro13a-I/II subgroups in the middle layer, and Pro13b-II subgroup prolamins in the outer-most layer [8].
Multiple transcription factor (TF) genes regulate and coordinate biosynthetic pathways for starch and SSPs in the rice endosperm. TFs specifically involved in rice prolamin gene expression include rice prolamin box-binding factor (RPBF), rice seed basic leucine-zipper 1 (RISBZ1), and NAM, ATAF, and CUC (NAC) TFs (OsNAC20 and OsNAC26). RPBF, a member of the DNA binding with One Finger (DOF) protein family TFs, activates glutelin and prolamin gene expression by binding to the “P box” motif in target gene promoters [12]. RISBZ1 interacts with RPBF and activates expression of SSP synthesis-related genes GluA1, GluA2, GluA3, GluB1, GluD1, 10 kDa prolamin, 13 kDa prolamin, and 16 kDa prolamin [13]. OsNAC20/26 are also important regulators of starch and other SSPs, particularly Pul, GluB4, α-globulin, and 16 kD prolamin [14].
Rice prolamins are deficient in lysine and methionine, two of the nine amino acids considered to be essential in the human diet [2,15,16]. In addition, prolamins are considered indigestible and nutritionally inferior to glutelins [17,18]. Several studies demonstrated that rice SSPs modulate glutathione metabolism, mitigate oxidative damage to lipids and proteins, and provoke antioxidative responses against hypercholesterolemia, although glutelins appeared to be superior to prolamins as antioxidants [18,19,20]. Furthermore, previous research has shown that the production of recombinant proteins is more efficient in mutant rice lacking 13 kDa prolamin (13 kDa Pro-less rice) than in wild-type (WT) control rice [21,22]. Consequently, there is significant interest in rice lines engineered with low prolamin content, based on the idea that such mutant rice lines will facilitate the production and distribution of recombinant and/or therapeutic proteins, and that the grain of such rice lines will be nutritionally superior for humans. Furthermore, engineered mutant rice lines that lack specific prolamin genes are excellent experimental tools for understanding how prolamins and other SSPs influence rice grain development, composition, and properties. Such knowledge will improve our understanding of rice biology and will inform future efforts to improve rice as an agriculturally valuable plant species.
Many published studies demonstrate that the suppression of 13 kDa prolamin expression using RNA-silencing [4,21] and RNA-interference [2,23] was accompanied by compensatory changes in expression of other SSPs and well as ER stress and expression of stress-related proteins. ER stress was associated with increased expression of protein folding -related genes, such as binding protein (BiP), protein disulfide isomerase (PDI), and calnexin (CNX) [24,25,26,27]. BiP - a key ER chaperone, which belongs to the HSP70 family, interacts with and promotes proper folding of prolamins [28,29]. PDI facilitates disulfide bond formation and rearrangement in glutelins and prolamins to promote maturation and proper folding of SSPs during seed maturation. CNX binds to unfolded glycoproteins, preventing misfolded proteins from being transported from the ER to the Golgi apparatus [26,30,31]. As mentioned above, transgenic rice that lack 13 kDa prolamins have increased levels of glutelin, globulin, BiP and PDI [4]. Similarly, in another study, RNAi-treated transgenic rice with low levels of 13 kDa prolamin showed compensatory accumulation of 10 kDa prolamin and glutelins, upregulation of chaperone proteins such as BiP and PDI, and abnormal PB-I bodies [2]. In addition, GPGb-RNAi knock-down (targeting glutelins, prolamins, and globulins) generated a rice line with low levels of glutelin A (GluA), cysteine-rich 13 kDa prolamin, and α-globulin, with higher accumulation of mRNA and protein for glutelin B (GluB) and chaperones (BiP1 and PDIL1-1) [23]. To our knowledge, similar efforts to engineer rice using CRISPR-Cas9 technology have not been reported to date. Therefore, the present study utilized CRISPR-Cas9 to target (downregulate) the Pro13a-I and Pro13b-I/II subgroups of 13 kDa prolamins in rice. Using four distinct engineered 13 kDa-Pro-less lines of rice, we investigated grain characteristics, starch and SSP content and expression in the maturing rice endosperm, and explored compensatory changes in the rice proteome and transcriptome. The results revealed compensatory changes affecting ER stress response and starch synthesis in 13 kDa Pro-less rice.

2. Results

2.1. Design of sgRNA for Targeting 13 kDa Prolamin Genes Using CRISPR-Cas9 Technology

There are four genes encoding 10 kDa prolamins, 28 genes encoding 13 kDa prolamins, and two genes encoding 16 kDa prolamins in the rice genome. The 13 kDa prolamin genes are divided into four subgroups (Pro13a-I, Pro13a-II, Pro13b-I, and Pro13b-II) based on cysteine content and sequence similarity (Figure 1A). The nucleotide sequence similarity between Pro13a.1 and Pro13a.2 of the Pro13a-I subgroup is 92.03%, while these two genes share 75.33 to 78.17% similarity with the four genes in Pro13a-II subgroup (Pro13a.3~6), which are highly similar to each other (e.g, 97.93 to 99.68%). Lastly, the Pro13b-II subgroup includes 18 prolamin genes which demonstrate 87.59 to 100% sequence similarity to each other. The high similarity between 13 kDa prolamin genes in each subgroup indicates that multiple prolamin genes can be edited using one sgRNA. We designed two sgRNAs as shown in Figure S1 and Table S1. sgRNA-pro13a targets two genes in the Pro13a-I subgroup and sgRNA-pro13b targets 17 genes in Pro13b-I/II subgroups. An in vitro assay was used to demonstrate that the sgRNAs efficiently and specifically induce cleavage of their target genes (Figure S2). Subsequently, sgRNA-pro13a and sgRNA-pro13b were cloned into a binary vector for the CRISPR-Cas9 system (Figure 1B and Figure S3). Each pCAMBIA-Cas9-sgRNA binary vector was then introduced into Korean rice cv. Ilmi (Oryza sativa subsp. Japonica) via Agrobacterium-mediated transformation to generate 13 kDa prolamin-knockout rice.

2.2. Generating and Characterizing 13 kDa Prolamin-Knockout Rice

PCR analysis showed that T-DNA targeting genes in Pro13a-I and Pro13b-I/II subgroups was inserted in eight and ten T0 transgenic rice plants, respectively (Figure S4B). Next-generation sequencing was carried out to identify mutations in target genes in two T0 transgenic plants (1a and 2a) in the Pro13a-I subgroup and two T0 transgenic plants (4b and 8b) in the Pro13b-I/II subgroups (Figure S4A and Table S2). The results showed that genes in Pro13a-I subgroup were mutated in the 1a and 2a T0 plants at the frequencies of 51.3 and 28.5%, respectively, and genes in Pro13b-I/II subgroups were mutated in the 4b and 8b T0 plants at the frequencies of 4.8 and 12.6%, respectively.
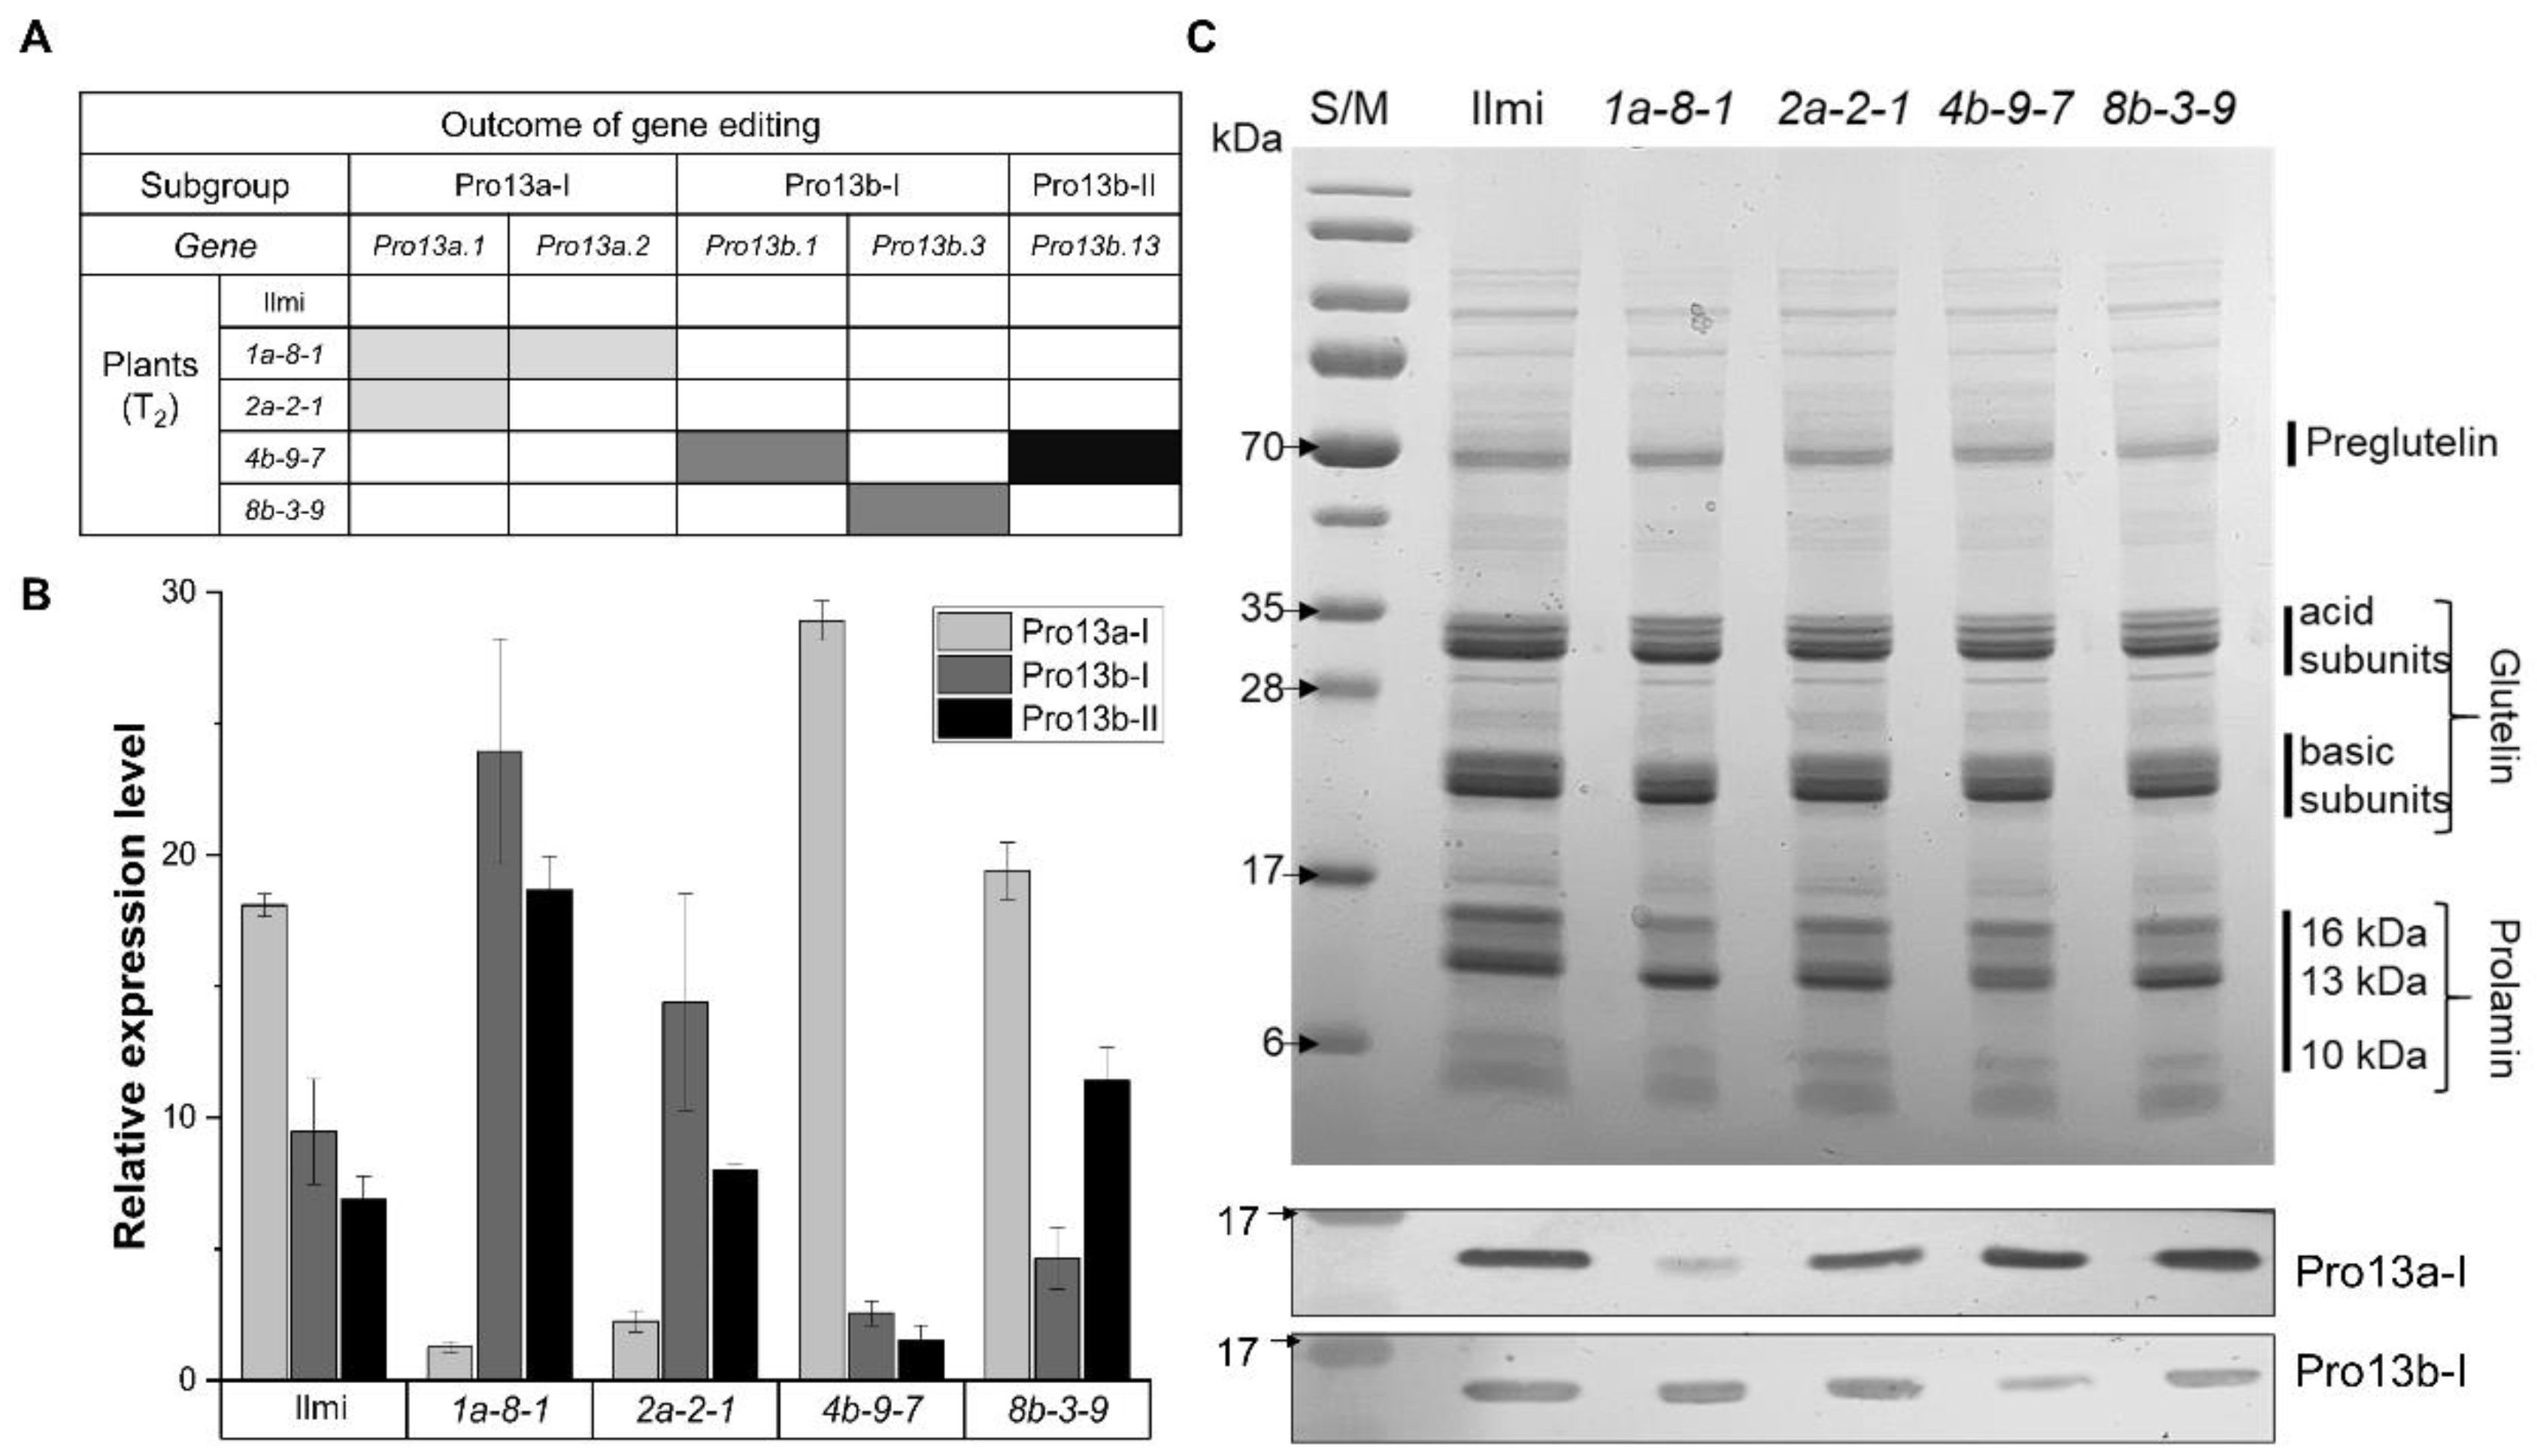
To obtain mutant plants without T-DNA in the T1 generation, PCR was used to screen for the absence of HygR and SpCas9 genes. This identified 4 (1a-6, -8, -10, and -11) and 5 (2a-1, -2, -6, -7, and -9) plants in the 1a and 2a lines, respectively. Similarly, 2 (4b-3, and -9) and 3 (8b-3, -6, and -11) plants were identified in the 4b and 8b lines, respectively (Figure S5). Furthermore, DNA sequence data showed that Pro13a.1 and Pro13a.2 genes are mutated in 1a-6, -8, and -11 plants, while the Pro13a.1 gene is mutated in 2a-1, -2, -7, and -9 plants. In the lines targeting genes in Pro13b-I/II subgroups, the Pro13b.1 and Pro13b.13 genes were mutated in the 4b-9 plant and the Pro13b.3 gene was mutated in 8b-3 and -11 plants (Table S3). Targeted deep-sequencing was conducted and the data used to select four representative homozygous T2 generation plant lines for further study, where the lines were designated 1a-8-1, 2a-2-1, 4b-9-7, and 8b-3-9. More specifically, the Pro13a.1 and Pro13a.2 genes in the 1a-8-1 plant line are mutated at the frequency of 99.5 and 97.3%, respectively; the Pro13a.1 gene in the 2a-2-1 plant line is mutated at 99.1%; the Pro13b.1 and Pro13b.13 genes are mutated in the 4b-9-7 plant line at the frequencies of 98.1 and 99.8%, respectively; and the Pro13b.3 gene is mutated in 8b-3-9 plant at 97.8% (Figure 2A and Table S4).

2.3. Target Gene Expression at Transcriptional and Translational Levels

The expression of prolamin-encoding transcripts was compared in the immature seeds of 13 kDa prolamin-knockout T2 and WT control plants 2 weeks after flowering (2 WAF). The results (Figure 2B) show that transcripts of mutant Pro13a.1 and Pro13a.2 genes were remarkably decreased in 1a-8-1 plants, transcripts of mutant Pro13a.1 gene were strongly reduced in 2a-2-1 plants, transcripts of mutant Pro13b.1 and Pro13b.13 genes were decreased in 4b-9-7 plants; and transcripts of mutant Pro13b.3 were decreased in 8b-3-9 plants. These results are consistent with expectations based on the targeted mutations introduced into these four mutat plant lines. At the translational level, SSP content was analyzed in the mature seeds of T2 plants by SDS-PAGE and Western blot. SDS-PAGE analysis did not show dramatic differences between SSP content/expression in the four mutant plant lines and WT control plants. However, Western blot analysis showed that prolamins in Pro13a-I/II subgroups were strongly and weakly decreased in mature seeds of 1a-8-1 and 2a-2-1 plants, respectively, due to the number of mutated genes. Similarly, expression of Pro13b-I/II prolamin subgroup proteins were strongly and weakly decreased in mature seeds of 4a-9-7 and 8b-3-9 plants, respectively (Figure 2C).

2.4. Morphological Features of 13 kDa Prolamin-Knockout Plants

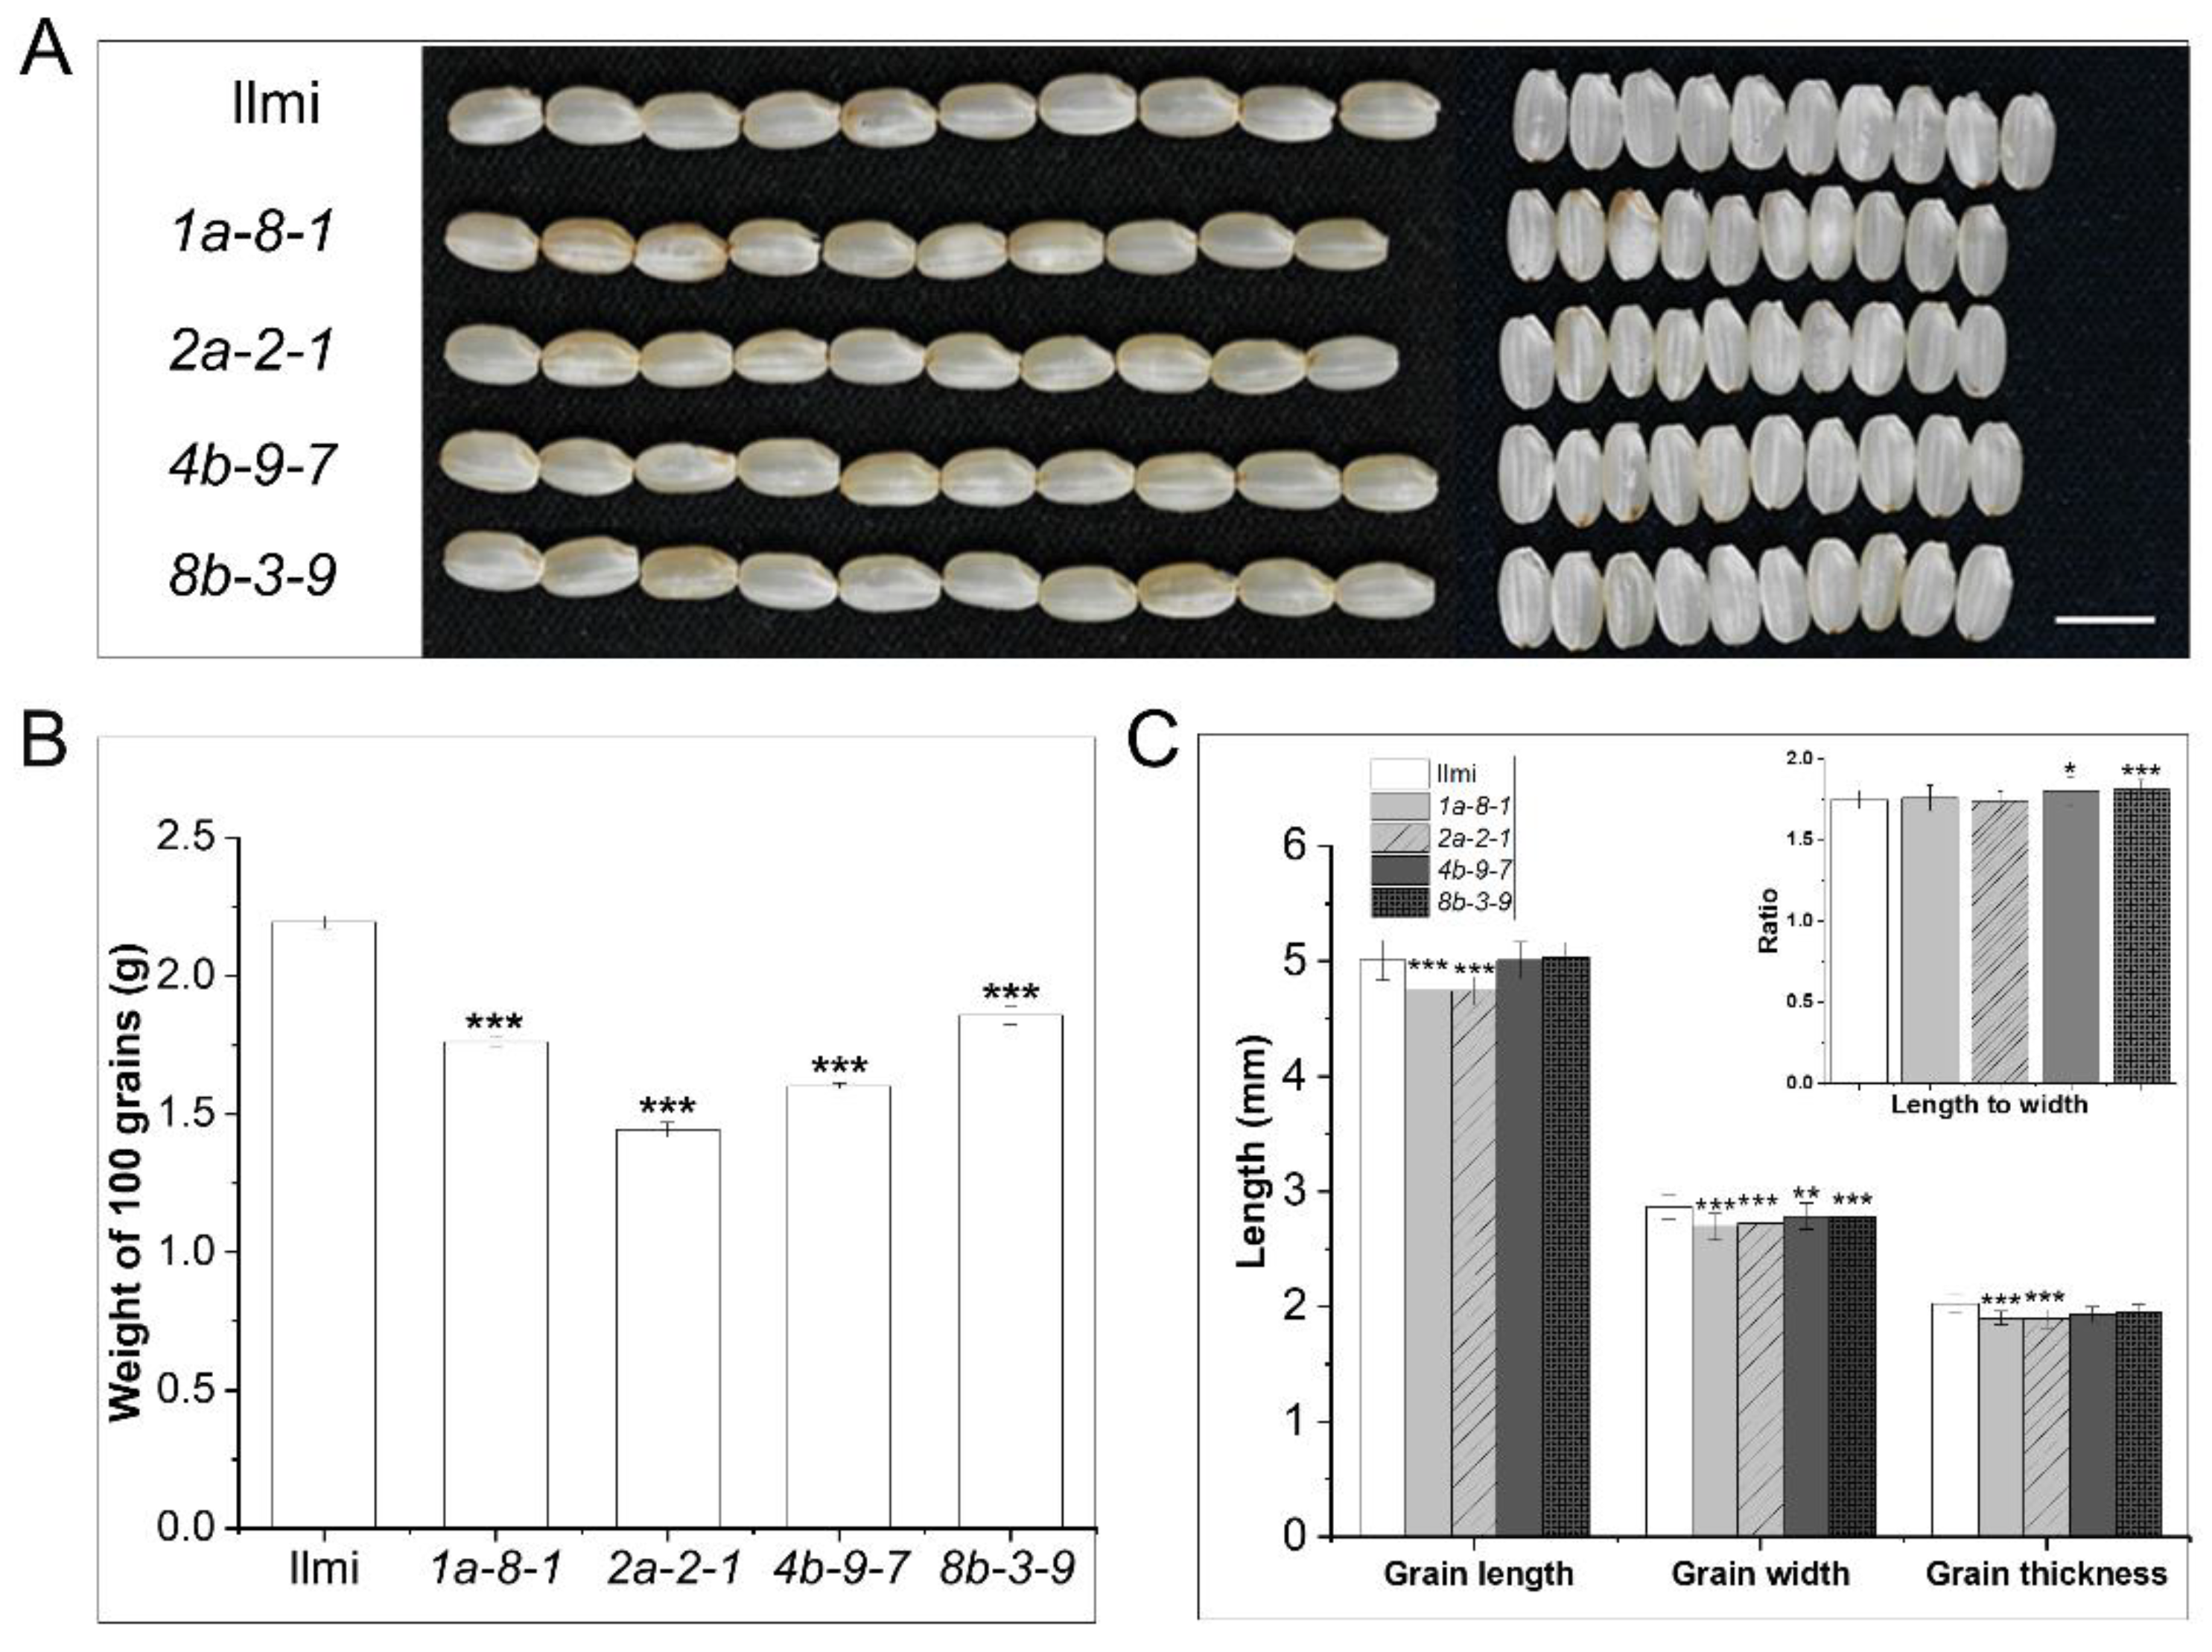
Phenotypic features of de-husked seeds from 13 kDa prolamin-knockout and WT plants were compared, including appearance, length, width, thickness, ratio of length to width, and total weight of 100 grains (Figure 3). In the pro13a.1/13a.2-knockout (1a-8-1) and pro13a.1-knockout (2a-2-1) plants, grain length, width, and thickness were notably smaller than WT. However, in the pro13b.1/13b.13-knockout plant (4b-9-7) and pro13b.3-knockout plants (8b-3-9), the only substantial difference from WT was in grain width (Figure 3C). The morphological differences between the seeds of 13 kDa prolamin-knockout mutant lines and WT were relatively small, and were not large enough to explain the fact that the weight of 100 mutant seeds was 19.8, 34.2, 27.1, or 15.5% lower than WT, respectively, for seeds from 1a-8-1, 2a-2-1, 4b-9-7, and 8b-3-9 mutant plants (Figure 3B).
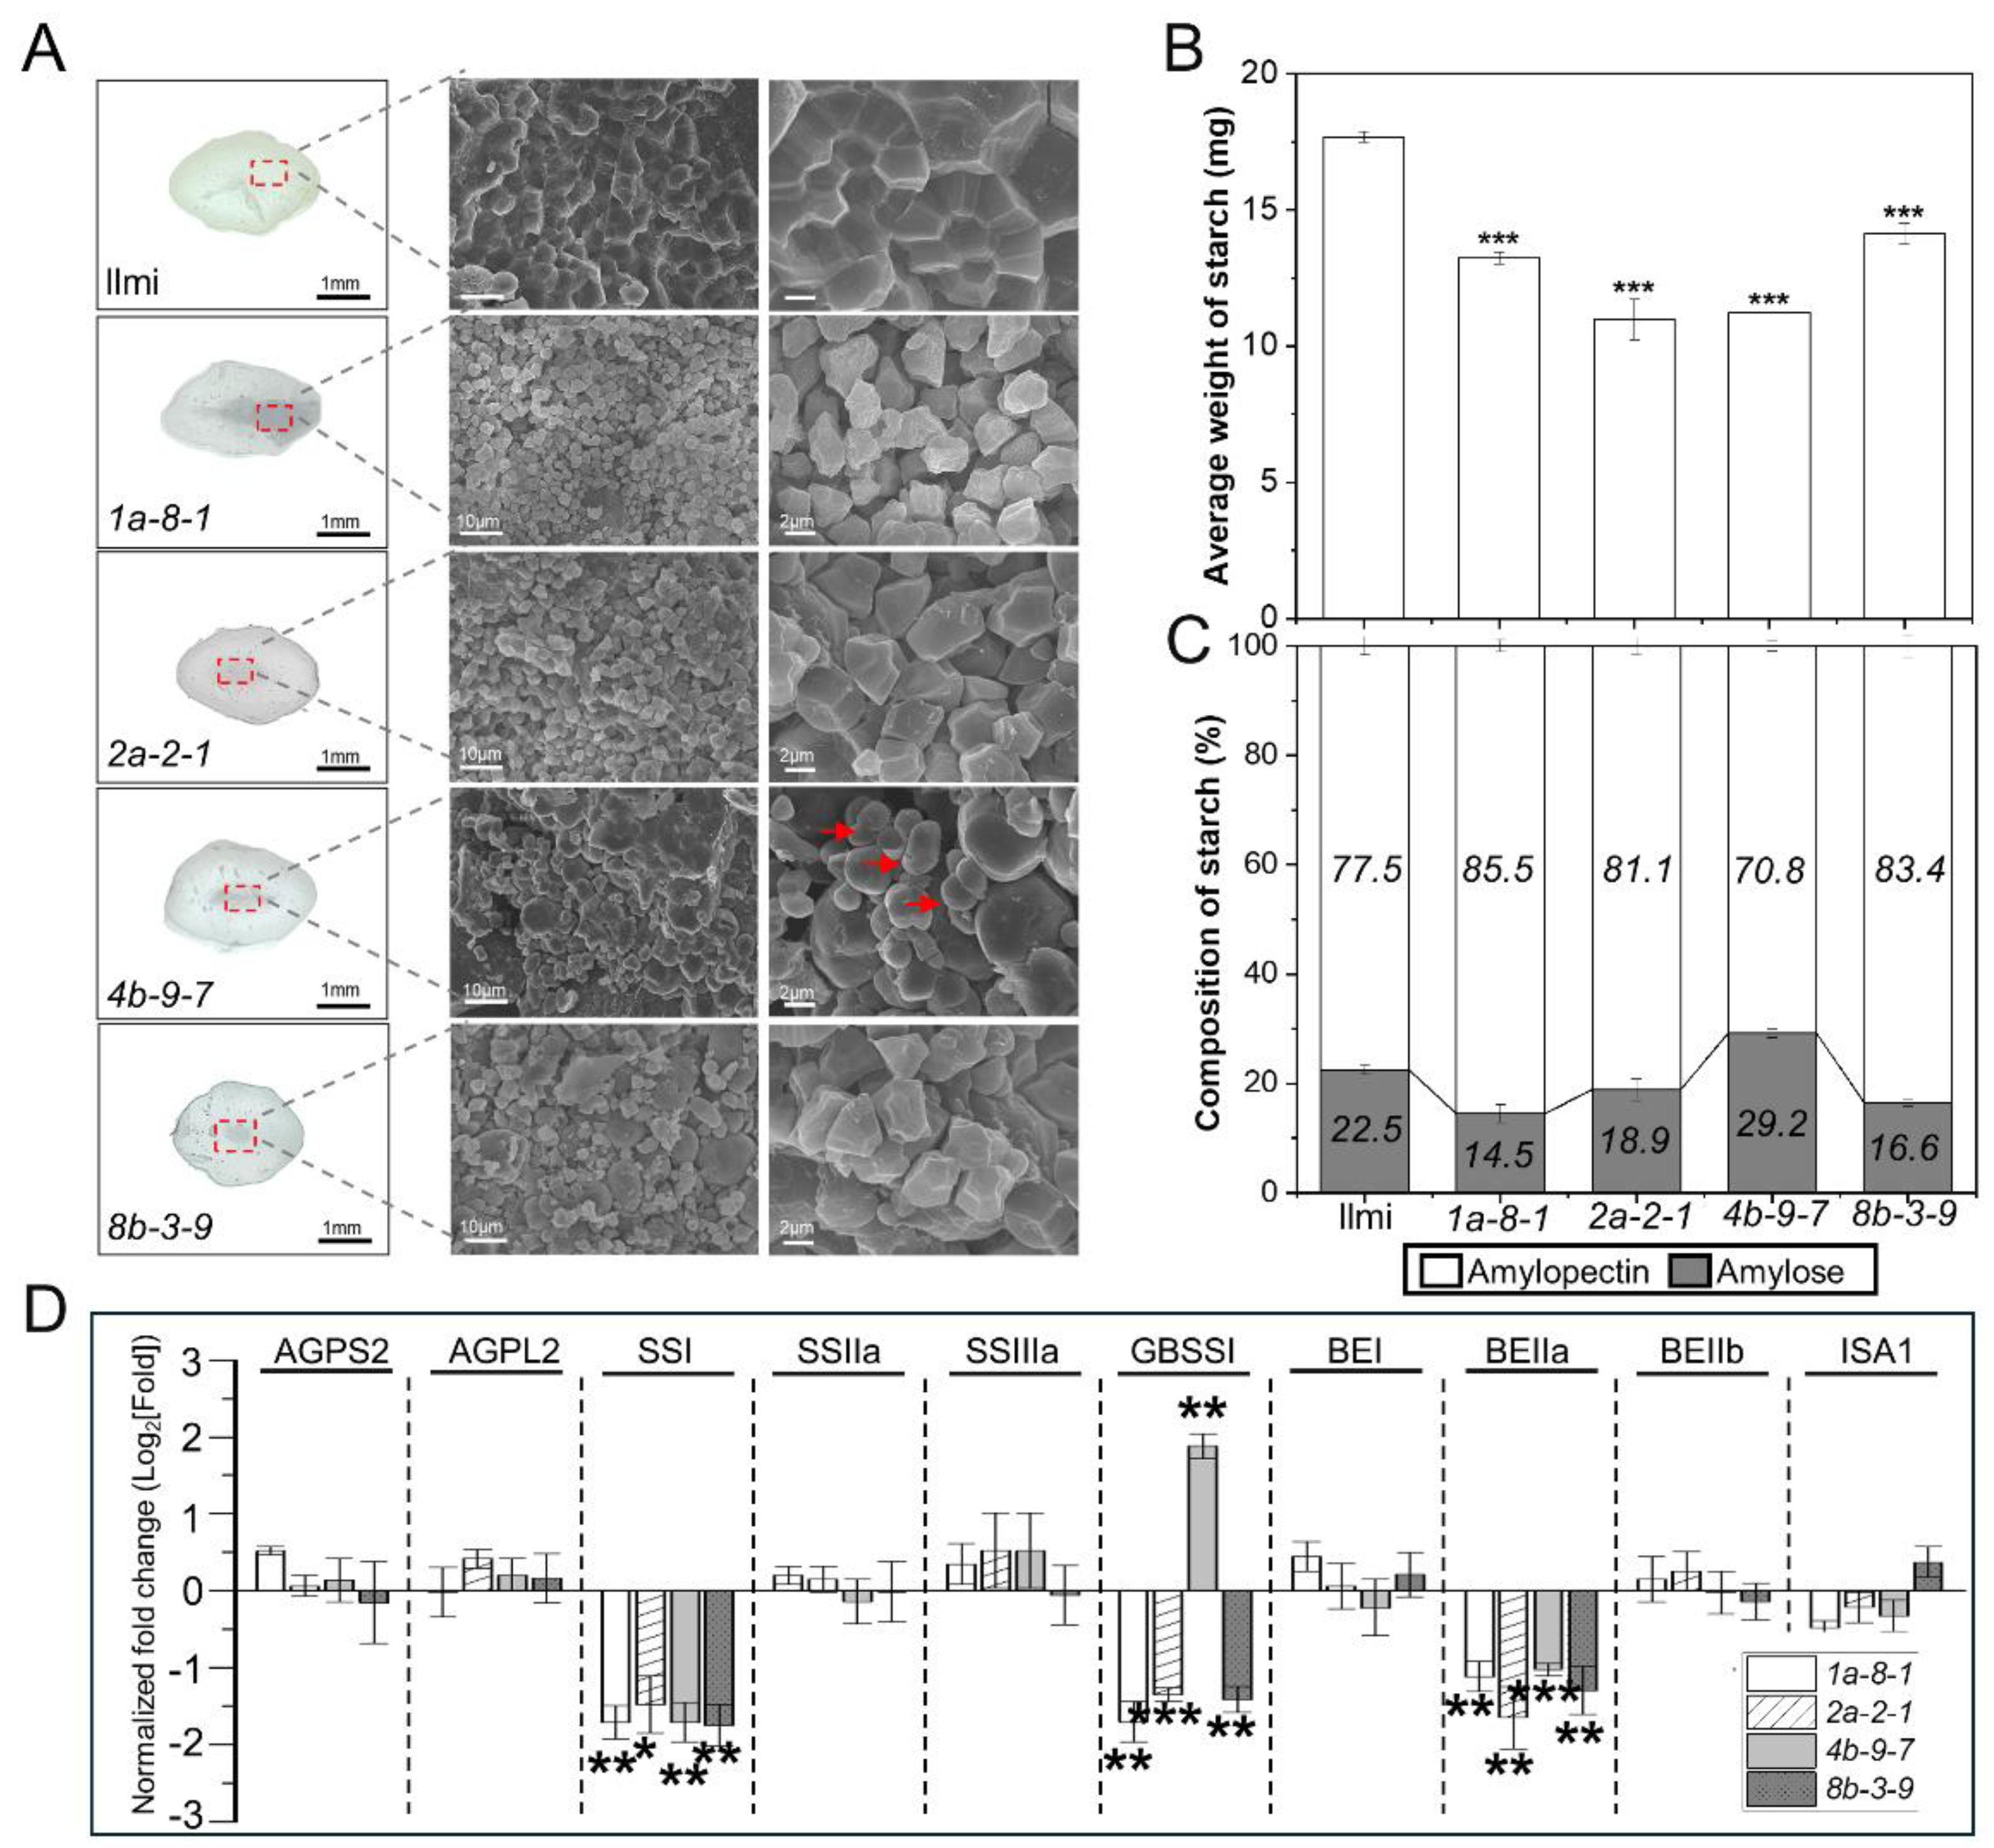
To explore possible explanations for the difference between mutant and WT average weight per 100 seeds, scanning electron microscopy (SEM) was used to examine seed endosperm structure and starch structure and starch composition was analyzed. When seeds were viewed in cross-section, opaque “chalky” areas were observed (Figure 4A). Furthermore, starch granules in WT seeds exhibited a closely packed, dense pattern of uniform polyhedrons, while starch granules in mutant seeds displayed an irregular arrangement and a loosely packed structure (Figure 4A). The starch content was approximately 25.7, 38.0, 36.5, and 20.1% lower in mutant seeds from 1a-8-1, 2a-2-1, 4b-9-7, and 8b-3-9 plants, respectively, than in WT control seeds (Figure 4B). This suggests that the lower average weight of 100 seeds from the 13 kDa prolamin-knockout lines is likely caused by low starch content.
Furthermore, analysis of amylose and amylopectin content of starch granules revealed a lower ratio of amylose to amylopectin in 1a-8-1, 2a-2-1, and 8b-3-9 plant seeds than in WT, and a higher ratio of amylose to amylopectin in 4b-9-7 plant seeds than in WT (Figure 4C). The starch granules formed angular blocky structures in 1a-8-1, 2a-2-1, and 8b-3-9 plant seeds (low amylose content), while starch granules formed spherical structures in 4b-9-7 plant seeds (high amylose content) (Figure 4A). qRT-PCR was performed in WT and mutant plant seeds to determine the level of expression of ten genes involved in starch metabolism including ADP-glucose small and large subunit pyrophosphorylases (AGPS2 and AGPL2), starch synthases (SSI, SSIIa, and SSIIIa), granule-bound starch synthase I (GBSSI), branching enzymes (BEI, BEIIa, BEIIb), and debranching isoamylase (ISA1) (Figure 4D). The results showed that SSI and BEIIa are significantly down-regulated in all four mutant lines. However, GBSSI, implicated in amylose synthesis, was down-regulated in 1a-8-1, 2a-2-1, and 8b-3-9 mutant plants but up-regulated in 4b-9-7 plants. These differences in gene expression probably cause the low average starch mass per grain, altered starch composition, and altered morphology of seeds from the mutant plant lines.

2.5. Protein Body Formation and SSP Composition in 13 kDa Prolamin-Knockout Lines

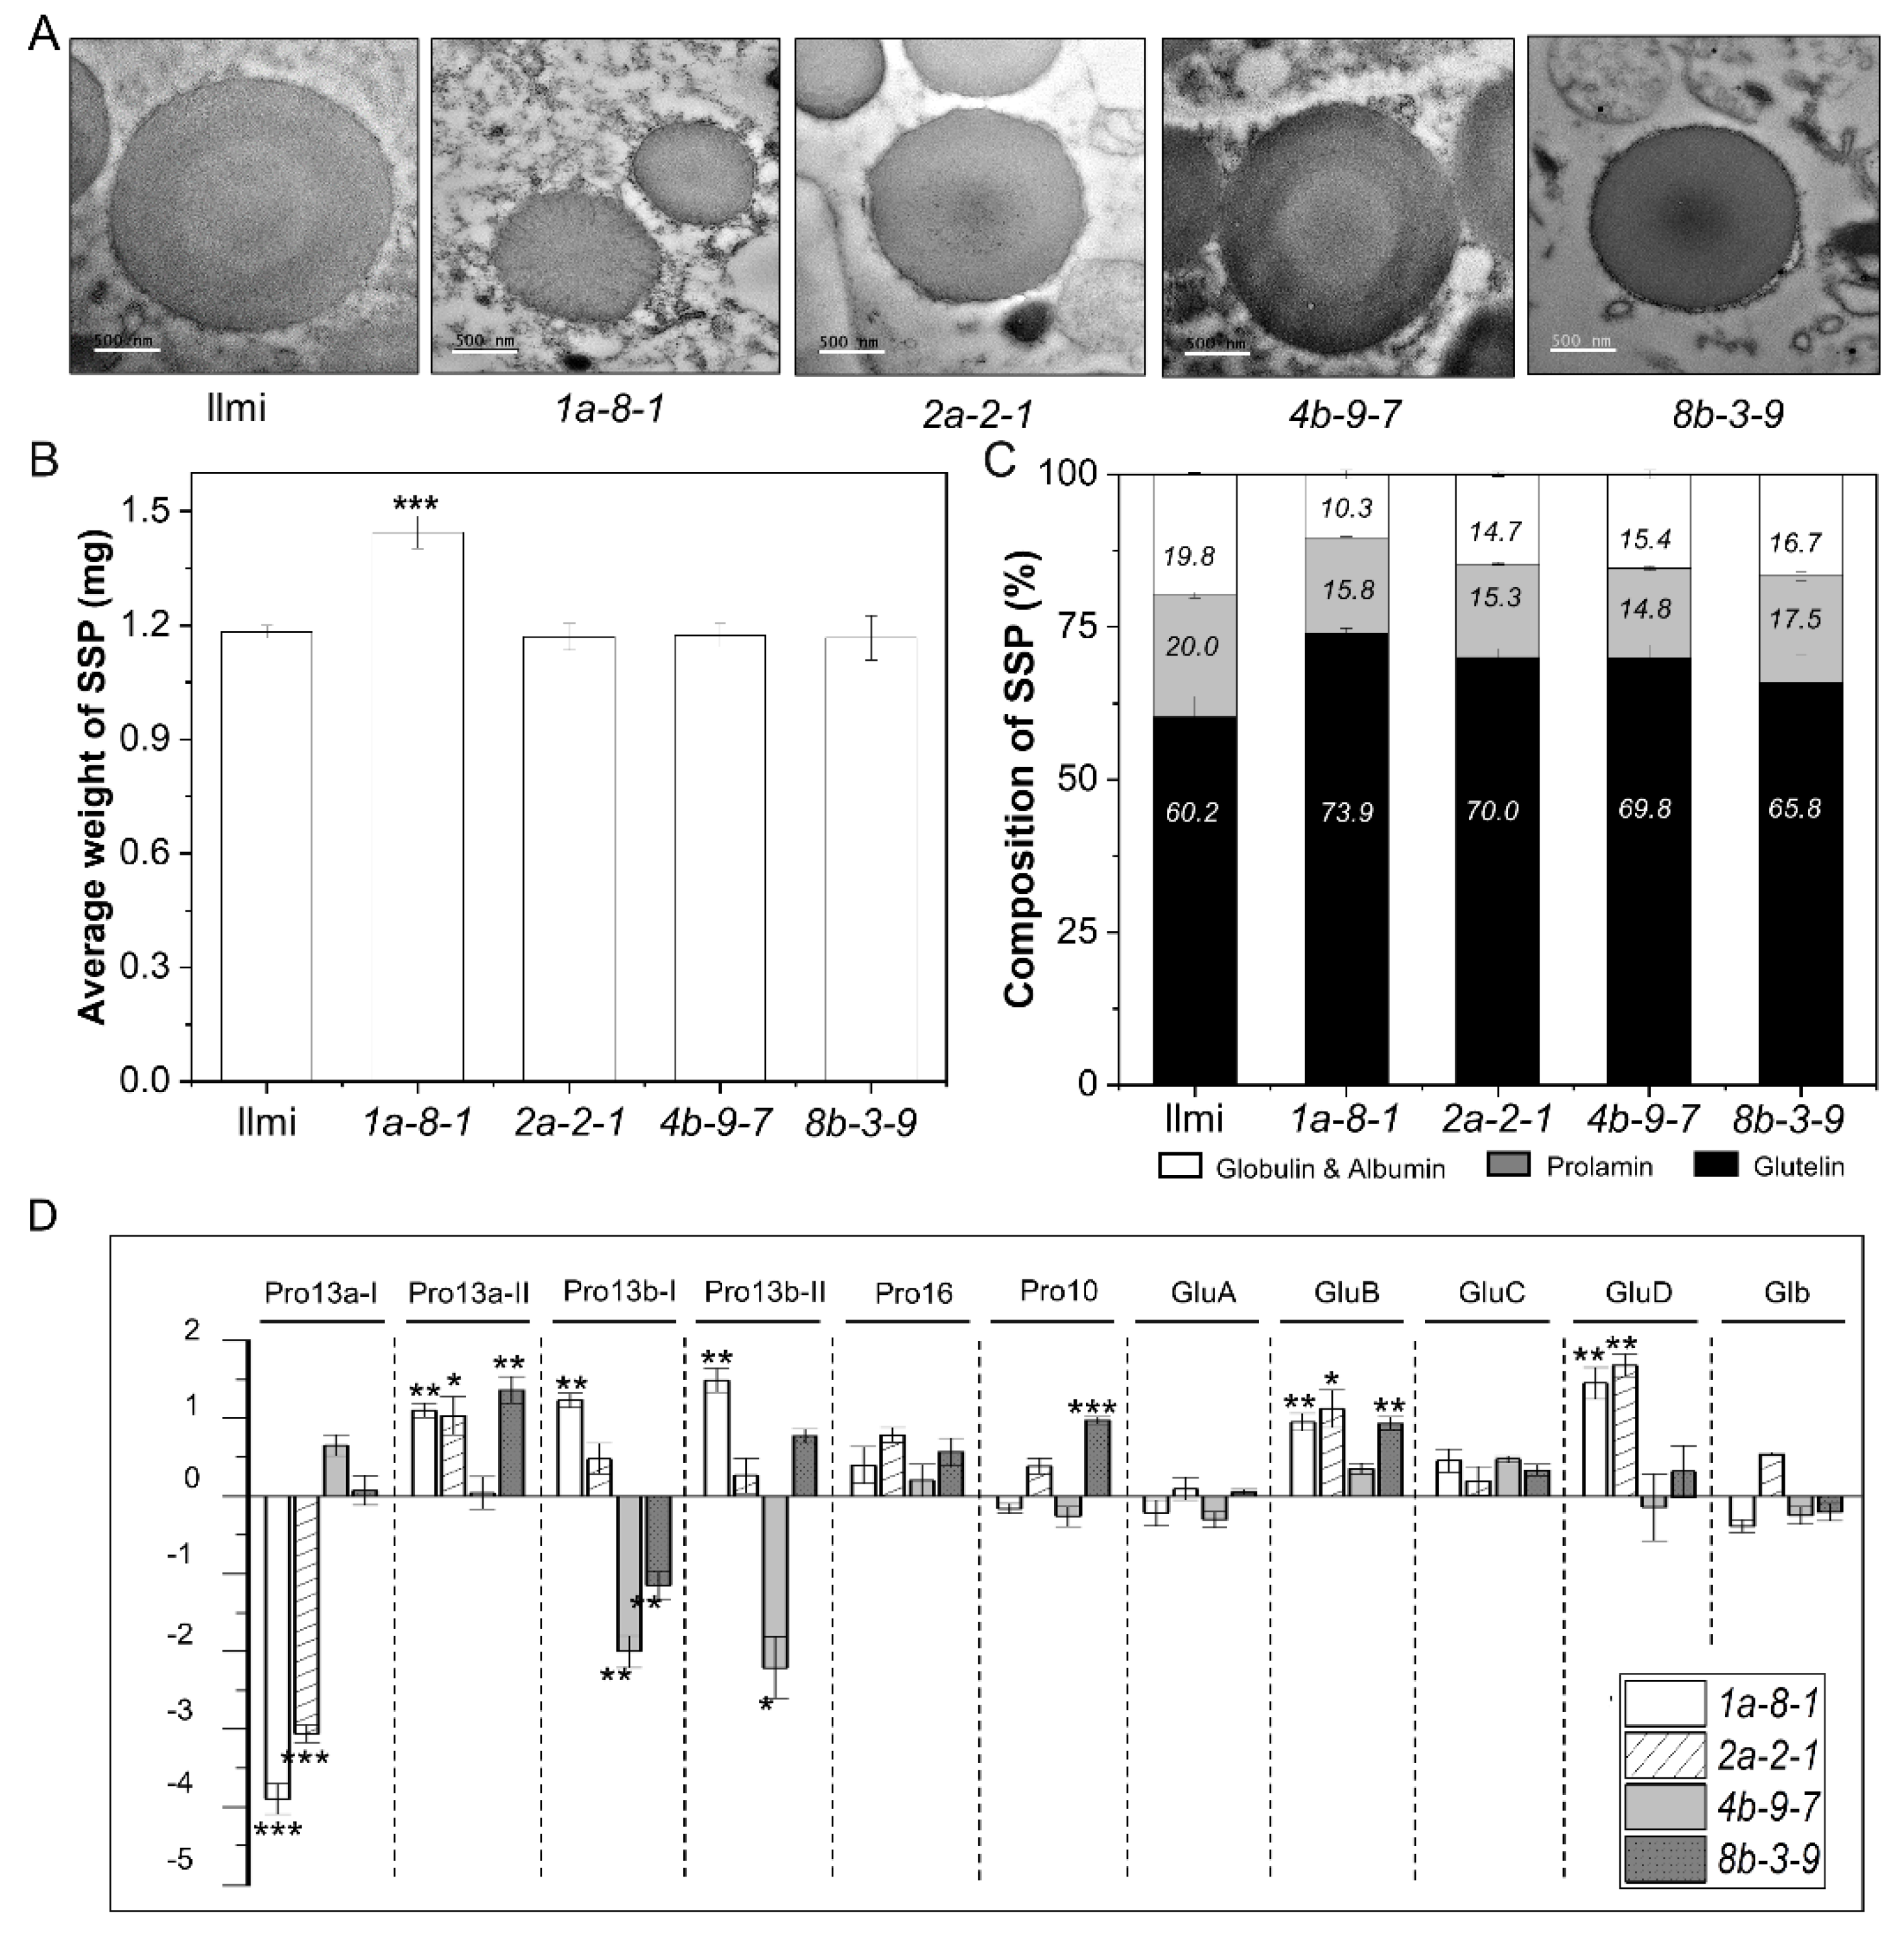
Transmission electron microscopy (TEM) was used to investigate PB-I formation and subcellular structures in the immature seeds collected 2 WAF from WT and 13 kDa prolamin-knockout T2 plants. In WT, PB-I structures form by the sequential accumulation of concentric layers composed of Pro10, Pro13b-I, Pro13a-I/II, Pro16, and 13b-II prolamins outward from the core, thus exhibiting a distinct pattern of electron-dense spherical layers (Figure 5A). In contrast, in pro13a.1/13a.2-knockout (1a-8-1) and pro13a.1-knockout (2a-2-1) plants, PB-I particles were smaller and the layered structure was entirely lacking. On the other hand, in pro13b.1/13b.13-knockout (4b-9-7) and pro13b.3-knockout (8b-3-9) plants, PB-I particles stained more darkly in the outer layers and core than WT PB-I particles. This indicates that the 13 kDa prolamins are critical for forming layered PB-I particles in the seed endosperm of WT rice.
Furthermore, total content of SSP per grain was higher in 1a-8-1 plant seeds than in WT, while total SSP content per grain was similar in WT and the other mutant plant lines (Figure 5B). In contrast, prolamins (all sizes) represented 15.8, 15.3, 14.8, and 17.5 percent of all SSPs in 1a-8-1, 2a-2-1, 4b-9-7, and 8b-3-9 mutant plants, respectively, while prolamins represented 20.0% of WT SSPs (Figure 5C). Conversely, the percent content of glutelins increased significantly from 60.2% in WT to 73.9, 70.0, 69.8, and 65.8 in 1a-8-1, 2a-2-1, 4b-9-7, and 8b-3-9 mutant plant lines, respectively. These results indicate that suppression of expression of certain SSPs was accompanied by compensatory increases in the expression of other SSPs; more specifically, down-regulation of genes in Pro13a-I subgroup was accompanied by up-regulation of genes in the Pro13a-II, Pro13b-I/II, GluB and GluD SSP subgroups. Similarly, decreased transcription of Pro13b-I subgroup prolamins was accompanied by increased transcription of Pro13a-II, Pro10, and GluB SSPs. Nevertheless, down-regulation of genes in Pro13b-I/II subgroups was not accompanied by compensatory changes in expression of SSP genes in other groups (Figure 5D).

2.6. Identification of DEGs in Immature Seeds of 13 kDa Prolamin-Knockout Plants

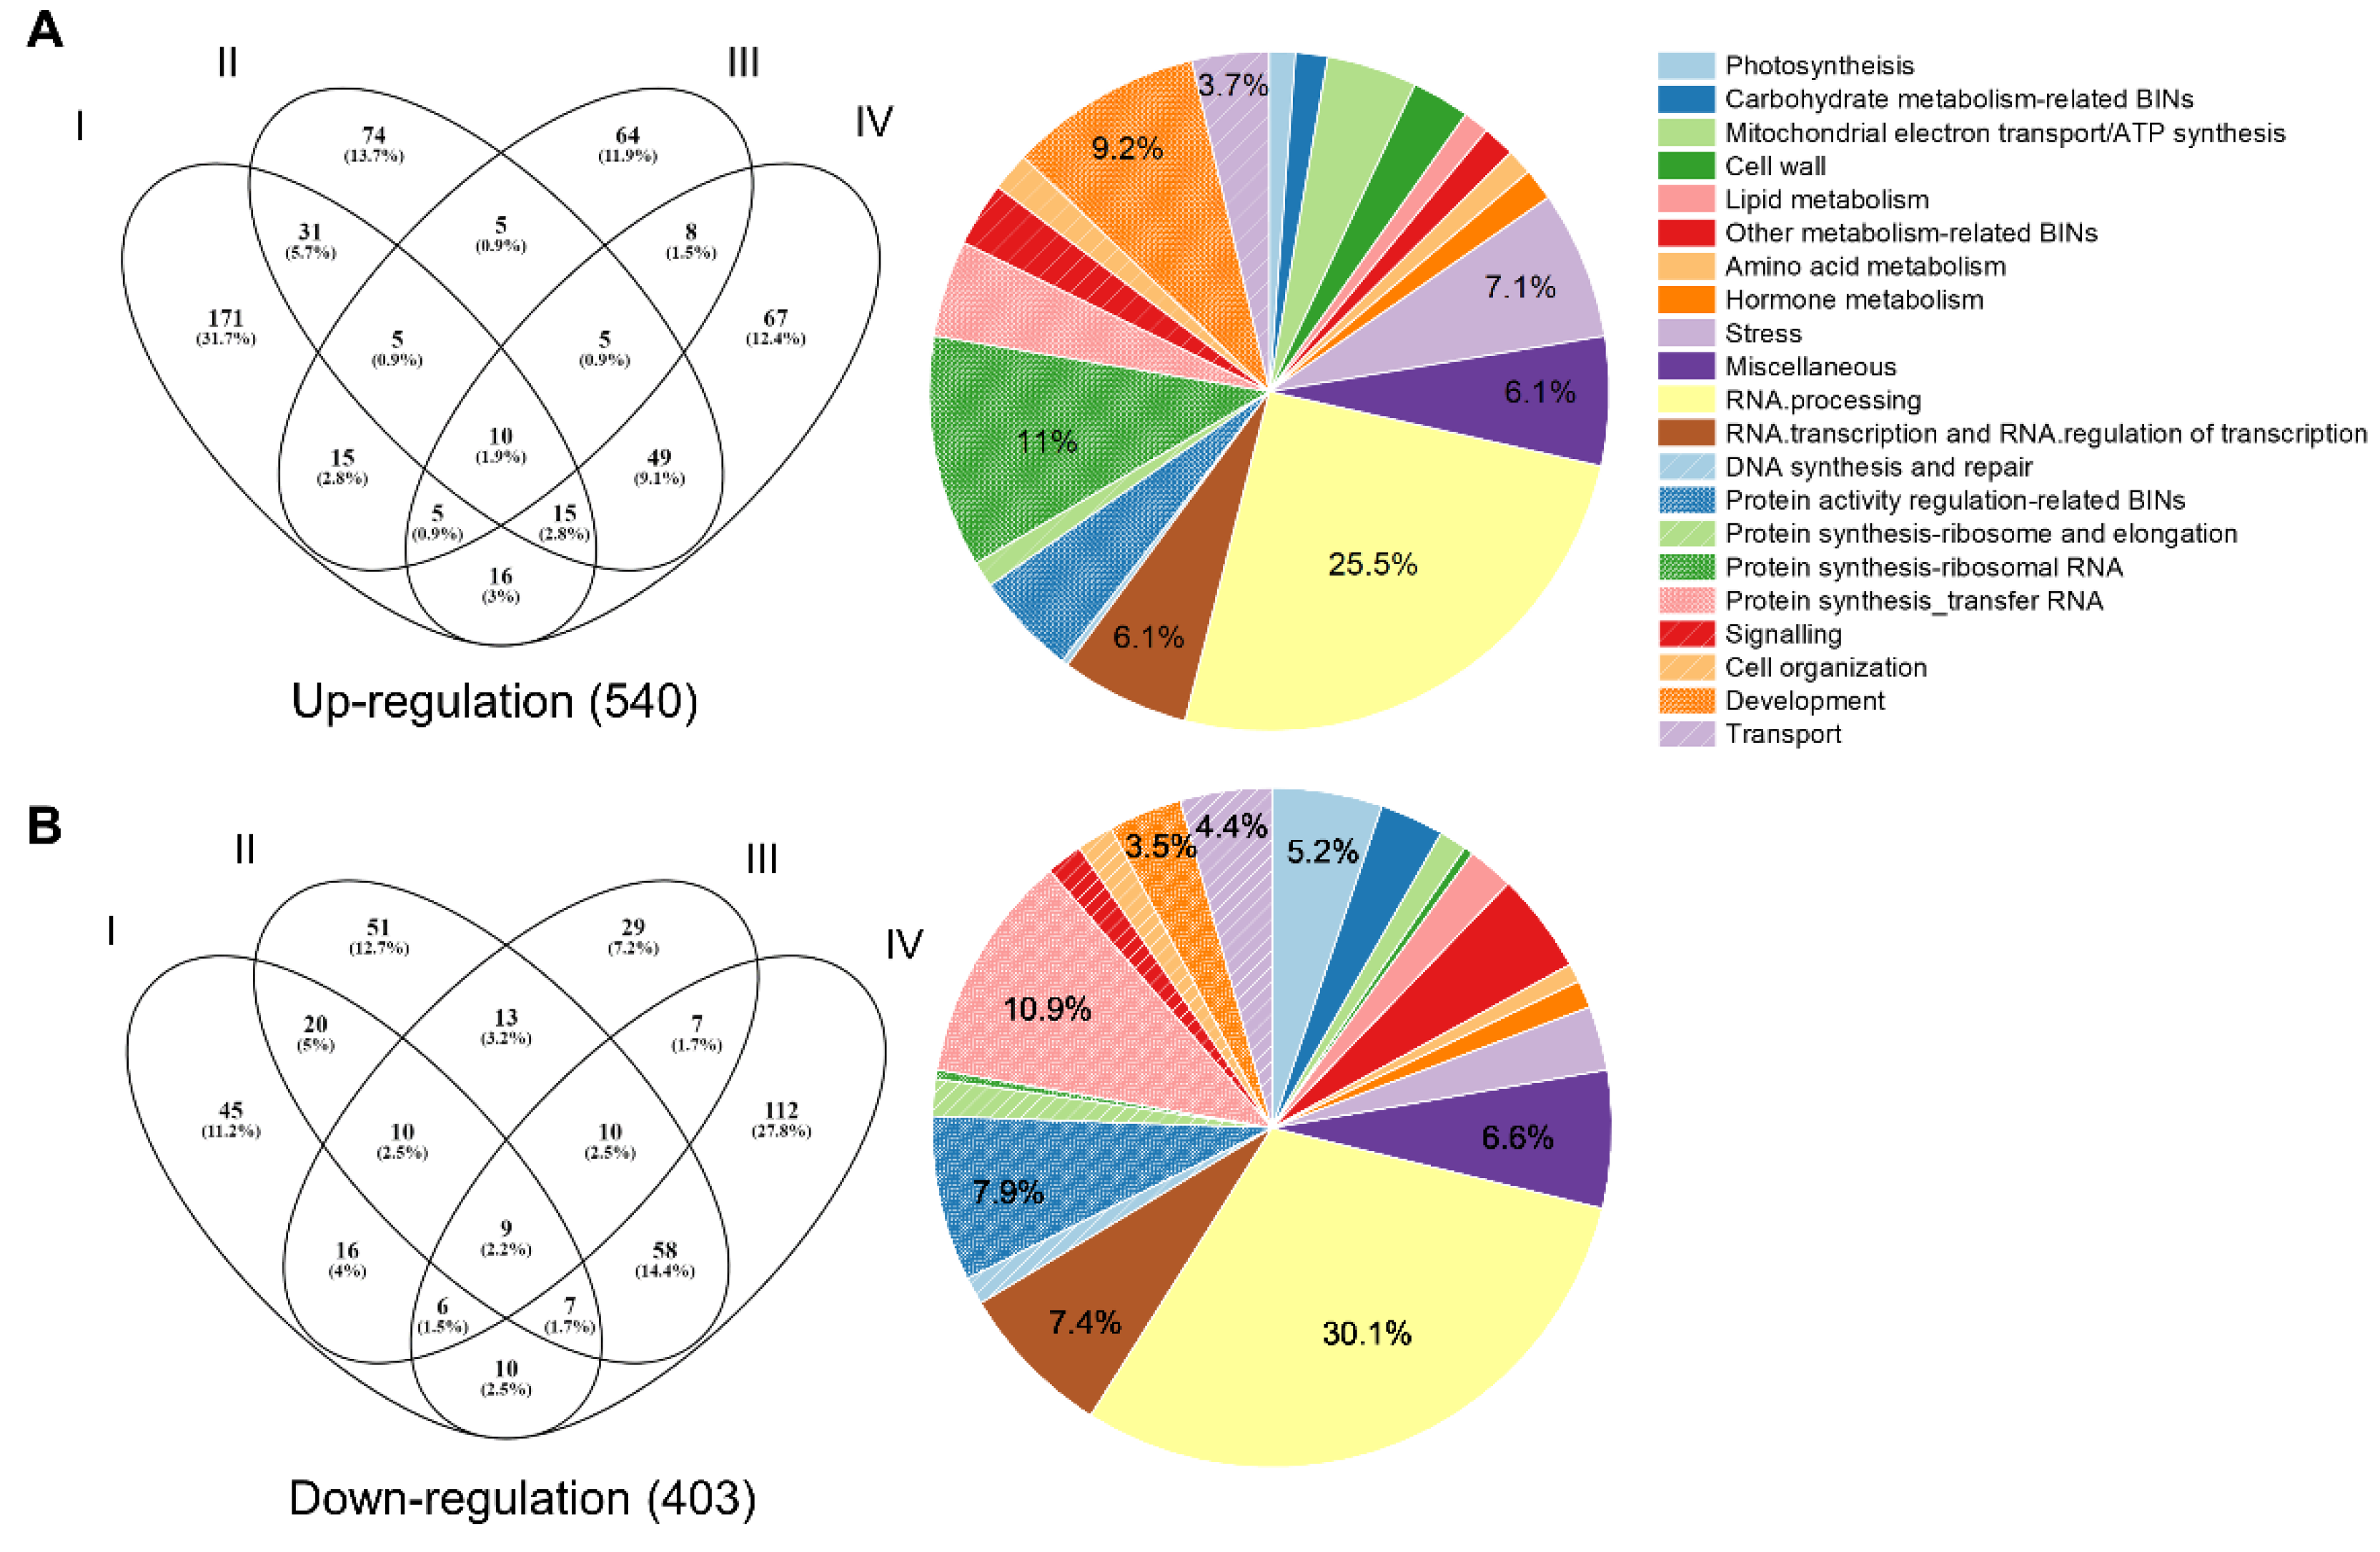
To confirm and extend the above results, RNA-seq analysis was performed using RNA from WT and four mutant plants. The results showed that 391 (268 up, 123 down), 372 (194 up, 178 down), 217 (117 up, 100 down), and 394 (175 up, 219 down) genes were differentially expressed in 1a-8-1, 2a-2-1, 4b-9-7, and 8b-3-9 mutant plants, respectively, relative to WT. Gene ontology (GO) functional analysis of the differentially expressed genes (DEGs) was performed using the MapCave tool from MapMan software (http://mapman.gabipd.org/web/guest/mapcave). A total of 540 up-regulated genes were categorized into functional groups, including RNA processing (25.5%), Protein synthesis ribosome RNA (11%), Development (9.2%), Stress (7.1%), RNA transcription and RNA regulation of transcription (6.1%), Miscellaneous (6.1%), Transport (3.7%), and other minor categories. In addition, 403 down-regulated genes were categorized into functional groups, including RNA processing (30.1%), Protein synthesis transfer RNA (10.9%), Protein activity regulation-related (7.9%), RNA transcription and RNA regulation of transcription (7.4%), Miscellaneous (6.6%), Photosynthesis (5.2%), Transport (4.4%), Development (3.5%), and other minor categories (Figure 6 and Table S5).

2.7. Correlation Network Involving DEGs and 13 kDa Prolamins

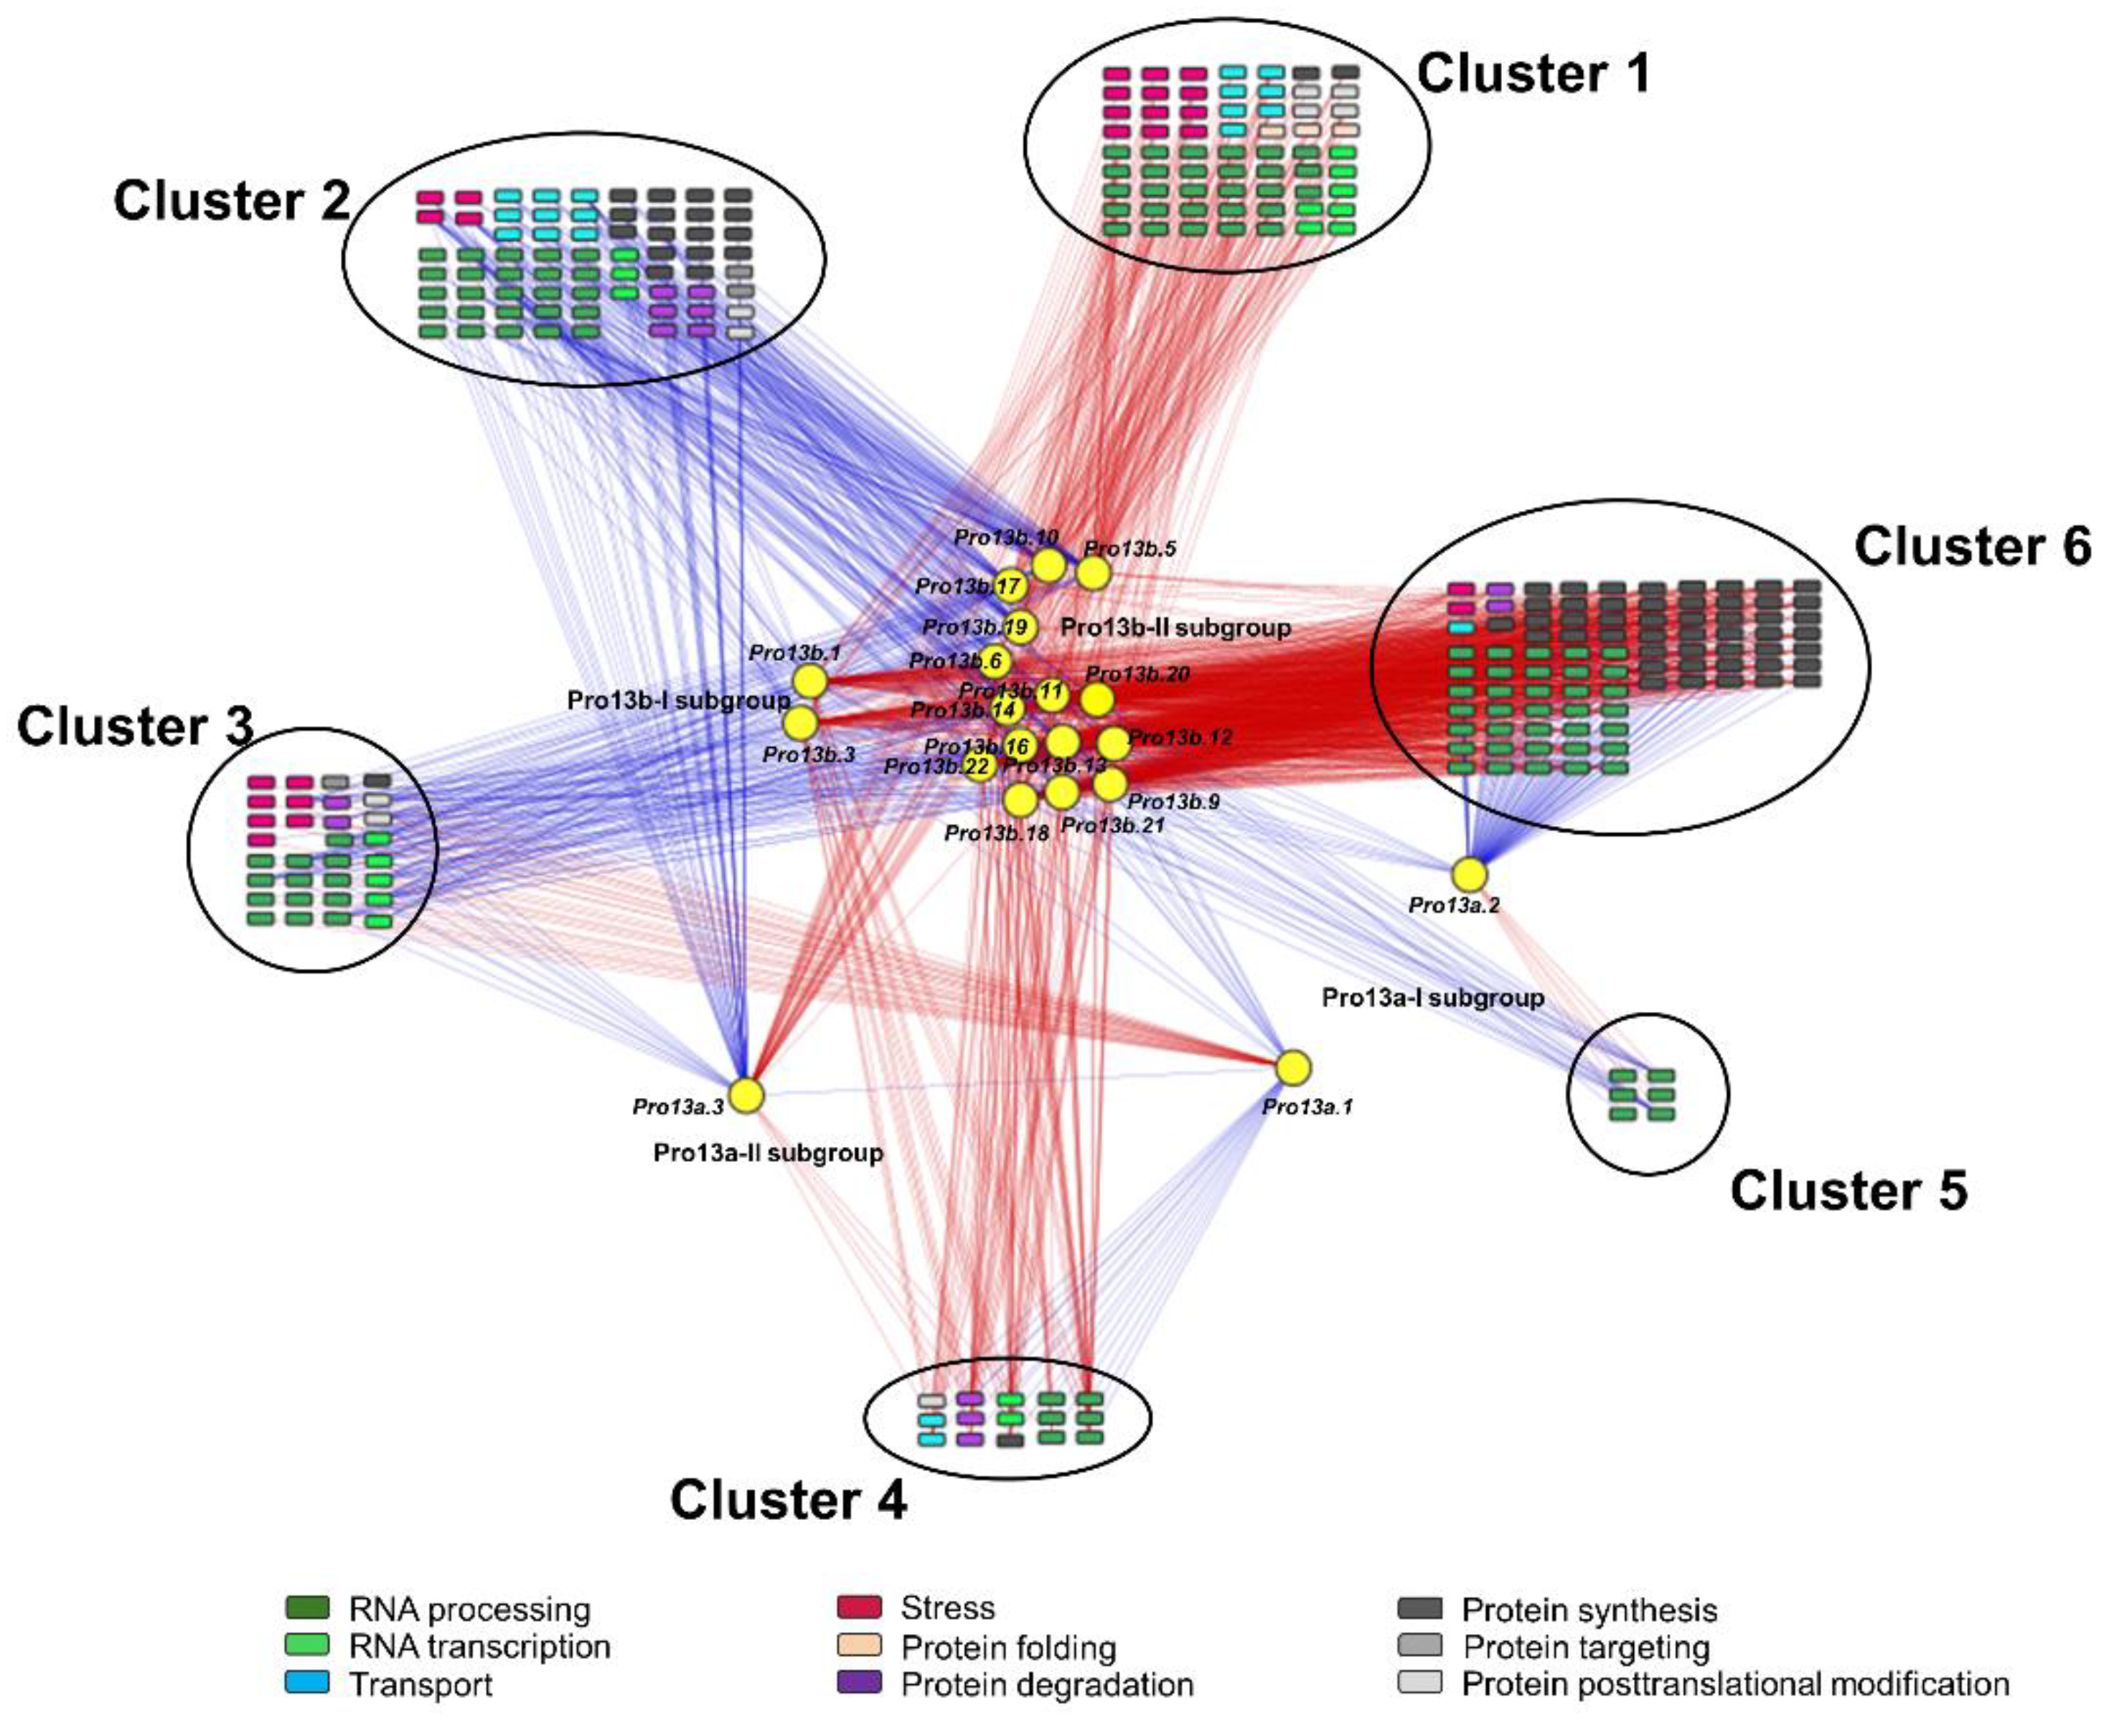
To investigate patterns of transcriptional change among prolamin genes in the immature seeds of WT, 1a-8-1, 2a-2-1, 4b-9-7 and 8b-3-9 plants, Pearson correlation analysis was performed among 927 DEGs and prolamin genes. This analysis identified 746 transcripts with a correlation coefficient ≥|0.7| (Table S6). We then constructed a correlation network based on GO enrichment categories such as RNA processing (BIN27.1), RNA transcription and RNA regulation of transcription (BIN27.2 and 27.3), Protein synthesis ribosome (BIN29.2.1 and 29.2.6), Protein synthesis transfer RNA (BIN29.2.7), Protein synthesis elongation genes (BIN29.2.4), Protein folding (BIN29.6), Protein degradation (BIN29.5), Protein posttranslational modification (BIN29.4), Protein targeting (BIN29.3), Stress (BIN20), and Transport (BIN34) (Figure 7). Furthermore, the results revealed that Pro13a.1 and Pro13a.2 genes in Pro13a-I subgroup are negatively correlated with genes in Pro13a-II and Pro13b-I/II subgroups. Genes in the network formed six clusters with distinct patterns of correlation with prolamin genes, as follows. Cluster 1 shows positive correlation with genes in Pro13a-II and Pro13b-I/II subgroups, Cluster 2 demonstrates an inverse association with Cluster 1, displaying a negative correlation with genes in Pro13a-II and Pro13b-I/II subgroups. Cluster 3 exhibits a positive correlation with the Pro13a.1 gene but a negative correlation with genes in Pro13a-II and Pro13b-I/II subgroups, whereas its opposite is Cluster 4. Similarly, Cluster 5 shows a positive correlation with Pro13a.2 gene and a negative correlation with genes in Pro13a-II and Pro13b-I/II subgroups, with Cluster 6 being its opposite (details in Table S7). The network reveals which genes are correlated with each prolamin gene. Thus, the results suggest that transcriptional regulatory mechanisms may exist and may explain how and why altered expression of some prolamins is accompanied by compensatory changes in expression of other prolamins and other network genes.

2.8. Analysis of Endoplasmic Reticulum Pathway Genes

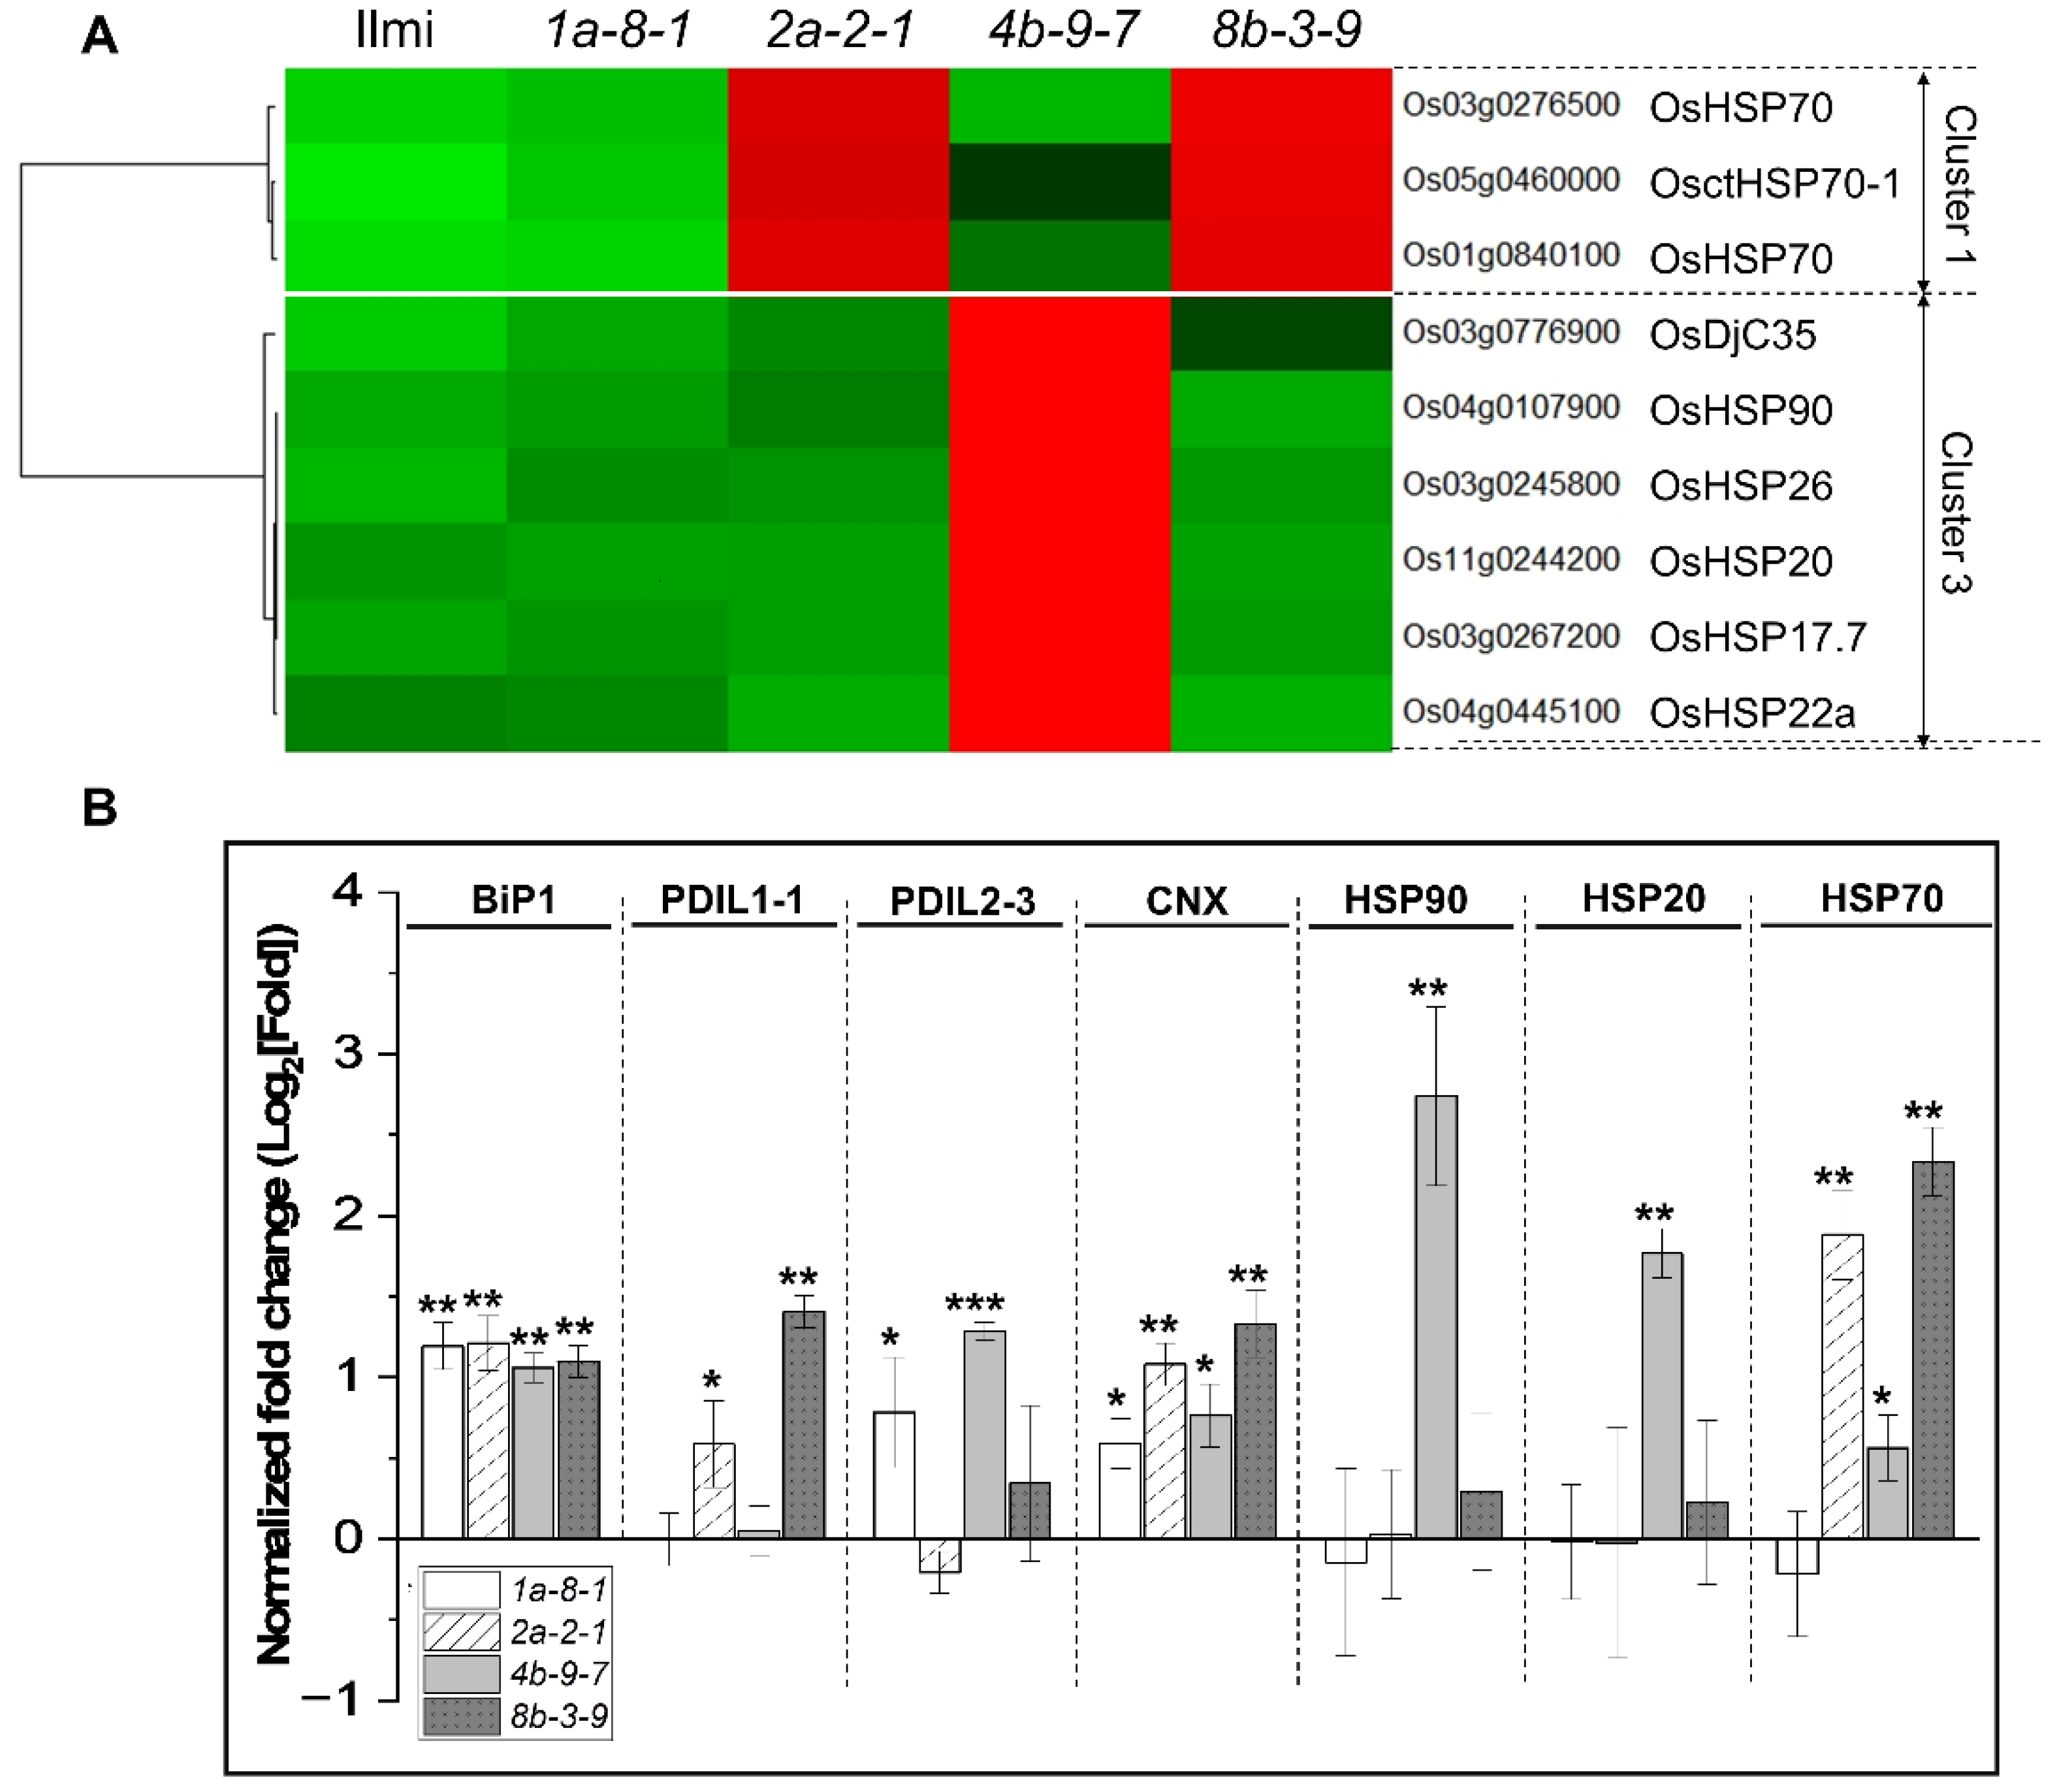
Of the genes involved in the "Protein processing in the endoplasmic reticulum" pathway, nine genes play roles in ER-associated degradation processing (ERAD). These include HSP70 (Os03g0276500, Os05g0460000, and Os01g0840100) in Cluster 1 and OsDjC35 (Os03g0776900), HSP90 (Os04g0107900), HSP26 (Os03g0245800), HSP20 (Os11g0244200), HSP17.7 (Os03g0267200), and HSP22a (Os04g0445100) in Cluster 3. Three HSP70 genes in Cluster 1, which are positively correlated with prolamin genes in Pro13a-II and Pro13b-I/II subgroups, were up-regulated in 2a-2-1 and 8b-3-9 mutants. Six genes in Cluster 3, which are positively correlated with Pro13a.1 gene but negatively correlated with Pro13a.3 and prolamin genes in Pro13b-I/II subgroups, exhibited increased expression in 4b-9-7 mutants (Figure 8A). qRT-PCR analysis of the expression of HSP20, HSP70, and HSP90 revealed a strong correlation between RNA-seq and qRT-PCR estimates of expression of these genes (see Pearson's correlation plot in Figure S6). Furthermore, the expression of four genes, BiP-1, PDIL-1-1, PDIL-2-3, and CNX, which are associated with misfolded protein repair, was also examined (Figure 8B). The results showed that transcription of BiP-1 and CNX genes was consistently 1.5 to 2-fold higher in the immature seeds of the 13 kDa prolamin-knockout lines than in WT plants. However, the expression of PDIL1-1 was higher in 2a-2-1 and 8b-3-9 plants than in WT, while expression of PDIL2-3 was higher in 1a-8-1 and 4b-9-7 plants than in WT – showing no consistent trend.

2.9. Role of Transcription Factors in Regulating 13 kDa Prolamin Correlation Network

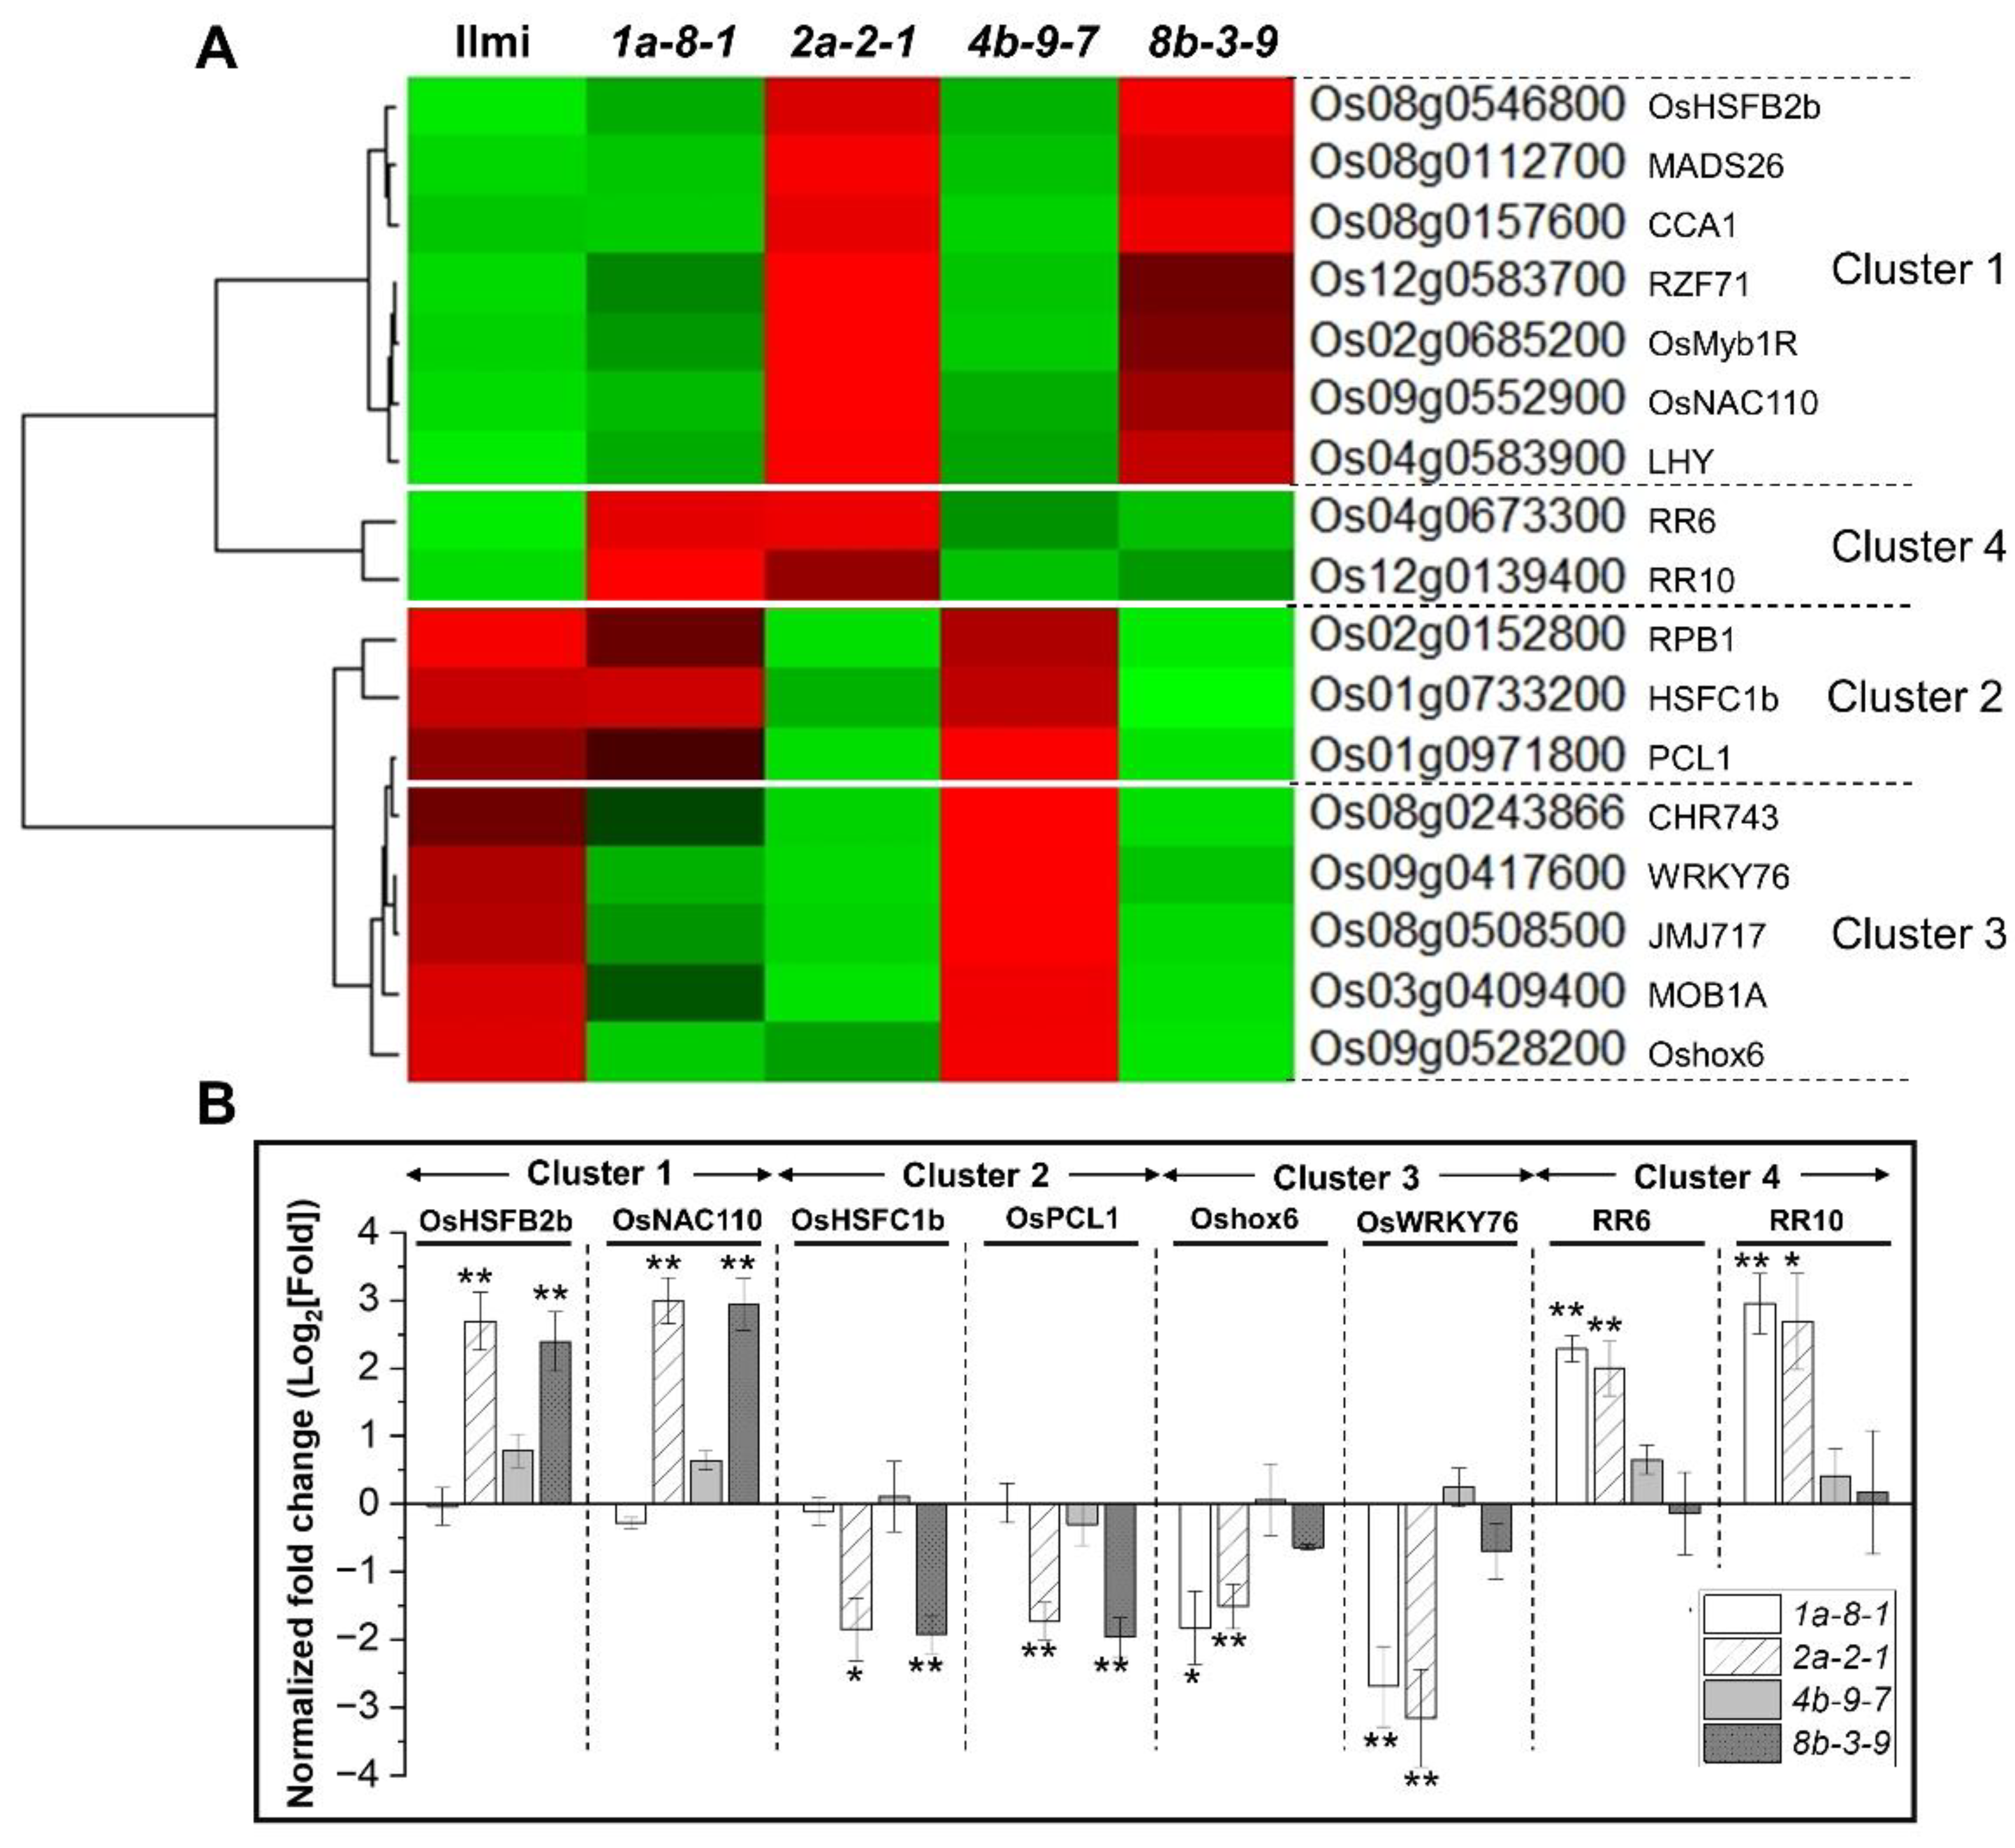
We identified 17 TF genes in Clusters 1, 2, 3, and 4 of the correlation network shown in Figure 7 and Table S7. In particular, the expression of seven TF genes in Cluster 1, encoding heat stress TF (OsHsfB2b, Os08g0546800), MADS-box TF (OsMADS26, Os08g0112700), three MYB TFs (OsCCA1, Os08g0157600; OsMyb1R, Os02g0685200; and OsLHY, Os04g0583900), C2H2 zinc finger protein (RZF71, Os12g0583700), and NAC TF (OsNAC110, Os09g0552900), was significantly higher in 2a-2-1 and 8b-3-9 mutant lines than in WT plants. Conversely, three genes in Cluster 2, encoding a G2-like TF PHYTOCLOCK 1 (OsPCL1, Os01g0971800), a heat stress TF (OsHsfC1b, Os01g0733200), and an RNA polymerase Rpb1 (RPB1, Os02g0152800), demonstrated the opposite trend. Furthermore, we observed marked decreases in the expression of five genes in Cluster 3 in 1a-8-1 and 2a-2-1 plants, including genes encoding Homeobox-leucine zipper protein HOX6 (Oshox6, Os09g0528200), a WRKY TF (OsWRKY76, Os09g0417600), Jumonji 717 (JMJ717, Os08g0508500), a msp one binder kinase activator-like 1A (MOB1A, Os03g0409400), and a Chromatin Remodeling Factor (CHR743, Os08g0243866). They were positively correlated with expression of the Pro13a.1 gene but negatively correlated with Pro13a.3 and genes in Pro13b-I/II subgroups. Conversely, two cytokinin signaling genes (RR6, Os04g0673300 and RR10, Os12g0139400) grouped to Cluster 4 showed significantly increased expression in these lines (Figure 9A).
As above, qRT-PCR analysis was performed to validate the findings observed with RNA-Seq data (Figure 9B). We focused on eight candidate TF genes grouped into four clusters: OsHsfB2b and OsNAC110 in cluster 1, OsPCL1 and OsHsfC1b in cluster 2, Oshox6 and OsWRKY76 in cluster 3, and RR6 and RR10 in cluster 4. In Cluster 1, OsHsfB2b (Os08g0546800) and OsNAC110 (Os09g0552900) exhibited significantly higher expression in lines 2a-2-1 and 8b-3-9, while OsPCL1 (Os01g0971800) and OsHsfC1b (Os01g0733200) in Cluster 2 showed the opposite trend. In addition, Oshox6 (Os09g0528200) and OsWRKY76 (Os09g0417600) in Cluster 3 displayed markedly lower expression in lines 1a-8-1 and 2a-2-1, whereas RR6 (Os04g0673300) and RR10 (Os12g0139400), grouped in Cluster 4, showed significantly higher expression in these lines. Pearson’s correlation analysis indicated a strong correlation between RNA-Seq values and RT-qPCR data for these TFs, demonstrating a high level of agreement between the two datasets (Figure S6).

3. Discussion

3.1. Morphological Differences between Starch Granules in WT and 13 kDa Prolamin-Knockout Rice Plants

In this study, 13 kDa prolamin content in rice seeds was downregulated using CRISPR-Cas9 and sgRNA-pro13a to knockout expression of genes in Pro13a-I subgroup or sgRNA-pro13b to knockout expression of genes in the Pro13b-I/II subgroups. Four mutant lines were generated and characterized, including 1a-8-1 (pro13a.1/13a.2-knockout), 2a-2-1 (pro13a.1-knockout), 4b-9-7 (pro13b.1/13b.13-knockout), and 8b-3-9 (pro13b.3-knockout). Total grain weight in the 13 kDa prolamin-knockout mutant lines was significantly lower in the mutant lines, likely because of lower total starch content. The seeds in the mutant lines showed distinct alterations in starch content, starch granule structure and seed appearance, presenting with a “chalky” phenotype not observed in WT (Figure 4). Expression of starch synthesis genes (e.g., SSI (Starch Synthase I) and BEIIa (Branching Enzyme IIa)), was significantly lower in the immature seeds of the four mutant lines, which could explain the reduced total starch content. The up-regulation of GBSSI (Granule-Bound Starch Synthase I) in the immature seeds of 4b-9-7 (pro13b.1/13b.13-knockout) line and its down-regulation in the immature seeds of other mutant lines is consistent with higher amylose content in starch granules in 4b-9-7 plants and lower amylose content in the other mutant plants. Moreover, rod/filamentous starch granules have been reported previously in grains with high-amylose content [32,33], which is consistent with the idea that rod/filamentous starch granules observed in 4b-9-7 plants are caused by starch with increased amylose content.

3.2. Abnormal PB-1 Morphology in 13 kDa Prolamin-Knockout Plants

In WT rice, PB-I particles form by sequential deposition of concentric circular layers of specific SSPs, where 10kDa prolamin (Pro10) accumulates in the core layer, followed sequentially by cys-poor 13 kDa prolamin (Pro13b-I), cys-rich 13 kDa prolamin (Pro13a-I/II), 16kDa prolamin (Pro16), and an outermost layer of cys-poor 13 kDa prolamin (Pro13b-II) [34,35]. It can be asserted that the specific interactions among rice prolamins play a crucial role in the formation of PB-I structures. Cys-rich prolamins (Pro10, Pro13a, and Pro16) can form intermolecular disulfide bonds in the layer surrounding the central core, while cys-poor 13 kDa prolamins (Pro13b-I/II) may interact with cys-rich prolamins through hydrophobic interactions [34,36]. It has been reported that the composition of prolamins in PB-1 has a profound impact on its layered structure [37,38]. Previous studies reported aberrant PB-1 morphology in rice seeds from 13 kDa-prolamin RNAi-targeted transgenic plants. Specifically, seeds with reduced expression of RM1 (former name of Pro13a.2 in Pro13a-I subgroup), RM2 (former name of Pro13b.2 in Pro13b-I subgroup), RM4 (former name of Pro13b.11/12/13 in Pro13b-II subgroup) and RM9 (former name of Pro13a.4 in Pro13a-II subgroup) displayed PB-Is with cracks and jagged periphery structures [4]. In addition, small PB-Is with no lamella structure were observed when expression of Pro13a-I subgroup was suppressed [2]. Furthermore, the ERAD protein degradation system plays a critical role during seed development, when biosynthesis of SSPs is intensely upregulated. ERAD polyubiquitinates and then helps eliminate misfolded, damaged, and unfolded proteins by a process involving the ubiquitin ligase complex composed of OsHrd1 and OsOS-9 [29,39,40,41]. The functional loss of OsHrd3 and the ubiquitin ligase complex is thought to play a role in forming deformed PB-Is [42] and reduced expression of OsDER1, a protein-interacting partner of OsHrd3, also led to the formation of cracked PB-Is . These results indicate that the quality of SSPs likely has a significant impact on PB-I structure. In this study, knockout of some of the genes in Pro13a-I subgroup (pro13a.1/13a.2 in 1a-8-1 line and pro13a.1 in 2a-2-1) and Pro13b-I/II subgroups (pro13b.1/13b.13 in 4b-9-7 and pro13b.3 in 8b-3-9) also led to notable structural changes in PB-I morphology. Compared to WT, mutant lines with reduced expression of Cys-rich Pro13a-I subgroup 13 kDa prolamins had small PB-I particles lacking lamellar spherical structure. In contrast, mutant lines with low expression of Cys-poor Pro13b-I/II subgroups had PB-I structures with a dark appearance, due to the changes in electron density (Figure 5A).

3.3. Functional Analysis of Genes Correlated with 13 kDa Prolamin Genes

In this study, subsets of 13 kDa prolamin genes were targeted/edited using CRISPR Cas9, but compensatory changes in expression of non-targeted genes were observed. Specifically, in the immature seeds of the pro13a.1/13a.2-knockout mutant line (1a-8-1), the transcription of genes in Pro13a-II and Pro13b-I/II subgroups were up-regulated; in the pro13a.1-knockout mutant line (2a-2-1), the transcription of genes in Pro13a-II subgroup was up-regulated but those in Pro13b-I/II subgroups were not changed. Moreover, in the immature seeds in which transcription of the genes in Pro13b-I/II subgroups were suppressed (4b-9-7), a weak up-regulation of genes in Pro13a-I subgroup was observed but not changed in Pro13a-II subgroup. In the pro13b.3-knockout mutant line (8b-3-9), down-regulation of the genes in Pro13b-I subgroup was accompanied with up-regulation of genes in Pro13a-II, Pro13b-II, and Pro10 groups. Correlation network analysis identified six clusters of DEGs, each of which displayed unique patterns of expression in the four mutant plant lines. The DEGs played roles in RNA processing, RNA transcription, transport, stress response, protein synthesis, protein targeting, protein posttranslational modification, protein folding, and protein degradation.
We showed that nine ERAD-related genes encoding heat shock proteins (three HSP70 and one HSP90), small heat shock proteins (HSP26, HSP20, HSP17.7, and HSP22a), and one co-chaperone (OsDjC35) were grouped in Clusters 1 and 3 (Figure 8, Table S7). Cluster 1 includes genes that are positively correlated with prolamin genes in Pro13a-II and Pro13b-I/II subgroups, including three OsHSP70 genes that are up-regulated in pro13a.1-knockout (2a-2-1) and pro13b.3-knockout (8b-3-9) mutant lines. Cluster 3 contains genes that are negatively correlated with prolamin genes in Pro13a-II and Pro13b-I/II subgroups but positively correlated with Pro13a.1 gene in Pro13a-I subgroup: these include OsHSP90, OsHSP26, OsHSP20, OsHSP17.7, OsHSP22a, and OsDjC35. The genes were only up-regulated in the pro13b.1/13b.13-knockout (4b-9-7) mutant line. HSP70 functions as a molecular chaperone facilitating the proper folding of nascent polypeptides, refolding misfolded proteins, and contributing to substrate degradation via the ubiquitin-proteasome system [43,44]. HSP90, along with its co-chaperones, is involved in ERAD, a sophisticated cellular process responsible for identifying and degrading misfolded proteins through the ubiquitin-proteasome system [45,46,47].The small heat shock proteins (sHSPs) transfer denatured proteins to the HSP 70/90 chaperone system to perform continuous ATP-dependent refolding of these proteins, preventing protein misfolding and aggregation [48]. DjC35, as a member of HSP40 co-chaperones (J-domain proteins), enhances HSP70 function by promoting ATPase activity, stabilizing substrate interactions, and preventing the aggregation of unfolded proteins [49,50,51]. Up-regulation of the genes involved in protein processing pathways in the ER probably indicates that prolamin gene-knockout affects ER chaperones and SSP composition. Many articles report that the suppression of SSP using RNAi and CRISPR-Cas9 systems can impact the expression of ER chaperones and co-chaperones such as BiP, protein folding machinery (CNX, PDIs, and HSPs), and protein-homeostasis-related sHSPs, resulting in ER-stress and altered SSP composition [2,4,23,52]. Moreover, ER-stress has been reported to activate ERAD, reducing grain quality, starch content, and grain weight [29,53]. In the seeds of glutelin gene-knockout mutant lines, expression of ERAD system genes correlated positively with grain quality [52]. In this study, expression of ERAD related genes and SSPs varied in the four mutant plant lines, with variable impact on grain quality. These results suggest that the ERAD system is required to ensure grain quality and SSP composition.
Transcription factors play essential roles in regulating starch and SSP synthesis during seed development in plants [54]. In response to stress, TFs rapidly adjust gene expression to adapt to or alleviate the stress [55]. This study provides evidence that 17 TFs belong to the correlation network affected by 13kDa prolamin gene expression, most of which are responsive to abiotic stress. These TFs belong to Clusters 1, 2, 3, and 4 in the correlation network of genes. There are seven TFs in Cluster 1, including OsHSFB2b, MADS26, CCA1, RZF71, OsMYB1R, OsNAC110, and LHY. OsHSFB2b acts in response to heat stress, drought and salt stress [56], while MADS26 plays diverse roles in plant development, stress response, and pathogen resistance [57,58]. CCA1 and LHY regulate ABF3 expression and seed germination in response to salt stress [59], and RZF71 also enhances tolerance to salinity and drought [60]. NAC110 provides high tolerance to drought and salt stress via an ABA-independent pathway [61]. Conversely, expression of three TFs in Cluster 2 (RPB1, HSFC1b, and PCL1) were negatively correlated with expression of Pro13a.3 and genes in Pro13b-I/II subgroups and were down-regulated in pro13a.1-knockout (2a-2-1) and pro13b.3-knockout (8b-3-9) mutant lines (Figure 9). OsPCL1 positively regulates the response to cold stress [62] and OsHsfC1b is involved in ABA-mediated tolerance to salt stress [63]. The results indicate that TFs correlated with prolamin genes in Pro13a-II and Pro13b-I/II subgroups play a role in stress-response, where knockout of Pro13a.1 or Pro13b.3 genes likely causes stress. Five TFs were identified in Cluster 3, including WRKY76, CHR743, JMJ717, MOB1A, and OsHox6; expression of these TFs was down-regulated in pro13a.1/13a.2-knockout (1a-8-1), pro13a.2-knockout (2a-2-1), and pro13b.3-knockout (8b-3-9) mutant lines. WRKY76, a rice transcriptional repressor, has dual roles in blast disease resistance and cold stress tolerance [64]. OsHox6, belonging to the homeodomain leucine zipper (HD-Zip) protein sub-family I, is upregulated under water-deficit conditions [65]. JMJ717, a member of Jumonji C (jmjC) domain-containing proteins reversing histone methylation, is crucial for various biological processes, including plant defense [66]. RR6, a type-A cytokinin response regulator, is involved in hormone signaling and pathogen response, while RR10, a type-B response regulator, negatively regulates the response to salinity stress [67,68]. Cluster 4 includes two TFs that are positively correlated with Pro13a.3 gene and prolamin genes in Pro13b-I/II subgroups but negatively correlated with the Pro13a.1 gene. RR6 and RR10 were up-regulated in pro13a.1/13a.2-knockout (1a-8-1), and pro13a.2-knockout (2a-2-1) mutant lines. TFs in Clusters 3 and 4 respond to biotic and abiotic stresses and hormones. These findings suggest that targeted editing of prolamin genes using CRISPR/Cass9 causes different types of stress and different stress responses in the mutant plants, depending on the target gene(s). These responses play a role in determining SSP content, the severity of compensatory effects, and overall quality of the mutant seeds.

4. Materials and Methods

4.1. Design of sgRNA

In order to edit genes encoding prolamin in rice, two sgRNAs (sgRNA-pro13a and -pro13b) were designed to target conserved nucleotide sequences in Pro13a-I and Pro13b-I/II subgroup genes, respectively, using CRISPR-P 2.0, an online tool (http://crispr.hzau.edu.cn/CRISPR2/), as described in Figure S1. The sgRNA-pro13a targets Pro13a.1 (Os07g0206400) and Pro13a.2 (Os07g0206500). The sgRNA-pro13b targets 17 genes including Pro13b.1 (Os07g0219250), Pro13b.2 (Os07g0219300), Pro13b.3 (Os07g0219400), Pro13b.4 (Os07g0220000), Pro13b.5 (Os05g0328333), Pro13b.7 (Os05g0328632), Pro13b.8 (Os05g0328800), Pro13b.9 (Os05g0328901), Pro13b.10 (Os05g0329001), Pro13b.11 (Os05g0329100), Pro13b.12 (Os05g0329300), Pro13b.13 (Os05g0329350), Pro13b.14 (Os05g0329400), Pro13b.15 (Os05g0329700), Pro13b.16 (Os05g0329200), Pro13b.17 (Os05g0330150) and Pro13b.18 (Os05g0330600) (Figure 1A and Table S1).
The efficiency of the designed sgRNAs was tested in vitro using the Guide-it sgRNA In Vitro Transcription and Screening System. The designed sgRNAs were produced by in vitro transcription reactions according to instructions of the Guide-it sgRNA In Vitro Transcription Kit (Cat. #632635, Takara). DNA templates were synthesized by PCR with specific primers (Table S8). Then, the synthesized DNA template, sgRNA, and recombinant Cas9 Nuclease were combined as indicated in the Guide-it sgRNA Screening kit (Cat. #632639, Takara) and incubated at 37˚C for 1 hour. Reaction products were analyzed by agarose gel electrophoresis (Figure S2).

4.2. Cloning CRISPR-Cas9 Vector and Agrobacterium-Mediated Generation of 13 kDa Prolamin-Knockout Rice Plants

To insert the designed sgRNAs into the pRGE31 vector, two single-stranded 70 nt DNA oligonucleotides (ssDNA oligo) Table S8) were designed, synthesized, purified and incubated with the pRGE31 backbone vector double-digested with Bsa I (Cat. #R3773, NEB). The construction was carried out using NEBuilder HiFi DNA Assembly Cloning Kit, as described. The assembled reaction mixtures were incubated for 1 hour at 50°C for ligation and then transformed into E.coli DH5-α cells. The recombinant clones were extracted and sequenced as previously described [52] Furthermore, to construct binary vectors for Agrobacterium-mediated rice transformation, the sgRNA cassettes and pCAMBIA-Cas9 binary vector were double-digested with Hind III (Cat. #R3104, NEB) and Bgl II (Cat. #R0144S, NEB), separated by gel electrophoresis, extracted and then ligated using T4 DNA ligase (Cat. #B0202A, NEB) at 16°C (Figure S3). Finally, the ligated binary vector was confirmed by colony PCR and DNA sequencing using primers listed in Table S8.
Finally, the constructed binary vectors (Figure 1B) were transformed into Agrobacterium tumefaciens strain (EHA105) and co-cultured with the calli induced from mature seeds of rice (Oryza sativa L. Japonica cv. ‘Ilmi’). Then, the selection and regeneration of transformed calli were carried out as previously described [69].

4.3. Screening Transgenic Rice Plants

In order to detect T-DNA in transgenic rice plants, genomic DNAs were extracted from leaves (50 mg) of thirty day-old rice plants as previously described [70]. SpCas9 and HygR genes were amplified by PCR using gene-specific primers (Table S9), and reaction products were analyzed by agarose gel electrophoresis (Figure S4). Furthermore, the targeted genes were amplified by PCR with specific primers for deep-sequencing (listed in Table S9), sequenced by the Mini-seq service (Bio-Core center, KAIST, Korea), and then analyzed using RGEN tools (http://www.rgenome.net/).

4.4. RNA Isolation and qRT-PCR

Total RNA was isolated from three immature rice seeds at 2 WAF according to a previously published protocol [71]. The cDNA was synthesized using 1 µg RNA and the QuantiTect Reverse Transcription Kit (Cat. #205311, Qiagen) according to the manufacturer’s instructions. qRT-PCR was performed as described in the QuantiTect SYBR Green PCR Kit (Cat.#204343, Qiagen) in 20 µL reactions containing 5 ng cDNA, 0.5 µM forward primer, 0.5 µM reverse primer, and 2X Master Mix (10 µL). The Qiagen Rotor-gene Q cycler was used with the following settings: an initial denaturation at 95℃ for 10 min, 40 PCR cycles at 95 ℃ for 30s, 60℃ for 30s, and 72℃ for 30s, a final extension at 72℃ for 10 min, and a melting curve analysis from 72 to 95℃. The primers for qRT-PCR are listed in Table S8. Expression levels were normalized using the 2-ΔΔCT method with Ubiquitin (Os02g0161900) as the reference gene and WT as the reference sample [72] and represented as the log2 value of average fold-change calculated from three biological replicates.

4.5. Total Seed Storage Protein Extraction, SDS-PAGE, and Western Blot Analysis

To extract total SSP in rice, three de-husked mature seeds were ground in a mortar and pestle using liquid nitrogen, and mixed with 1 mL SDS-Urea buffer (250 mM Tris-HCl, pH 6.8, 4% SDS, 8 M urea, 20% glycerol, and 5% β-mercaptoethanol (2-ME) [40]. Then, total SSP protein (5 µg) was separated by gradient SDS-polyacrylamide gel electrophoresis (10–17.5%). Proteins were stained with Coomassie Brilliant Blue (CBB). For Western blot analysis, proteins were transferred from the getl to a polyvinylidene difluoride (PVDF) membrane (WestPure PVDF Membrane 0.45 μm, GenDEPOT, Cat # LC7032-300) using a semi-dry blotter (Sigma, USA) as previously described [73]. The membrane was incubated in the diluted (1:2000) Pro13a.2 (Cat #PHY4308A, PhytoAB) and Pro13b.1/2 (Cat #PHY4440S, PhytoAB) antibodies in PBS buffer (10 mM Na2HPO4, 1.8 mM KH2PO4, 137 mM NaCl, 2.7 mM KCl, pH 7.4) containing 2% bovine serum albumin (BSA) for 3 h, washed three times in PBS buffer for 5 min, incubated in diluted (1:10,000) anti-rabbit IgG, alkaline phosphatase-linked secondary antibody (Cat #S3731, Promega), in PBS buffer containing 2% BSA for 1 h, and then washed three times in PBS buffer for 5 min. Proteins were visualized using the NBT/BCIP buffer (Cat# 34070, Thermo scientific) system according to the manufacturer’s instructions.

4.6. SSP Fractionation

Albumin/globulin, prolamin, and glutelin proteins were fractionated based on their solubility using different solvents as previously described [52,74]. Protein content in each fraction was determined by Bicinchoninic Acid (BCA) assay (Pierce BCA Protein Assay Kit, Thermo Fisher, Cat #BCA1) according to the manufacturer’s instructions.

4.7. Measurement of Rice Agronomic Traits and Starch Content

Rice agronomic traits were quantified including the average weight of 100 grains, average length, width, and thickness of one grain. Ten de-husked mature seeds were ground in a mortar and pestle using liquid nitrogen. Starch and amylose content in 25 mg grain powder were measured using an Amylose/Amylopectin Assay Kit (Cat.#K-AMYL, Megazyme) according to the manufacturer’s instructions.

4.8. Microscopic Analysis

To observe morphology of starch granules in rice endosperm, dry mature seeds were transversely cut with a razor blade, mounted on SEM stubs and coated with platinum particles. The mounted specimens were examined by ZEISS Gemini 500 Scanning Electron Microscope (SEM) at 15kV as previously [52]. To observe PB-I and PB-II particles, immature rice seeds at 2 WAF were fixed in 50 mM cacodylate buffer (pH 7.2) containing 2% glutaraldehyde and 2% paraformaldehyde for 4 h at room temperature, washed three times in 50 mM cacodylate buffer (pH 7.2) for 30 min, fixed in 50 mM cacodylate buffer (pH 7.2) containing 1% OsO4 for 1 h, washed three times in 50 mM cacodylate buffer (pH 7.2) for 30 min, dehydrated in a gradient ethanol series (30, 50, 70, 90, 95, and 100%) at 30 min intervals, and then sequentially immersed in a mixture of LR White resin and 100% ethyl alcohol in ratios of 1:2, 1:1, 2:1, and 1:0 at 60°C and 6 h intervals. Samples with LR White resin in a gelatin capsule were cured at 60°C for 24 h, cut to 80–100 µm thickness using an ultra-microtome, mounted on carbon-coated nickel grids, double-stained with 4% uranyl acetate and 0.4% lead citrate, and observed with a JEM-2100F Transmission Electron Microscope (TEM).

4.9. RNA Sequencing

RNA sequencing analysis was performed by DNALINK biotechnology company (Seoul, Republic of Korea) using total RNA extracted from immature rice seeds 2 WAF. The quality of total RNA was analyzed using Agilent 2100 Bioanalyzer Expert. Data were analyzed using a Kallisto tool to align RNA-seq reads with the rice reference genome (Nipponbare rice genome IRGSP-1.0) [75]. RSEM software (v1.3.3) was used to quantify each transcript [76], and the DESeq2 method from the edgeR software was used to identify DEGs [77,78].

4.10. Transcriptome Analysis and Network Visualization

DEGs were annotated according to the databases of Gramene Mart of Gramene (https://www.gramene.org/) linked with Oryza sativa Japonica group genes (IRGSP-1.0), and Osa_RAPDB (Rice Annotation Project Database) reference map of Oryza sativa Japonica group (RAPDB-IRGSP1.0) in MapMan (https://mapman.gabipd.org/home). Venn diagrams of up- and down-regulated DEGs were designed using Venny2.1 (https://csbg.cnb.csic.es/BioinfoGP/venny.html). A Pearson correlation test was performed and highly correlated genes ([r]>0.7) were selected and visualized using Cytoscape software (ver. 3.10.1). Genes involved in RNA processing, RNA transcription, protein synthesis, stress, and transport were correlated with 13 kDa prolamin genes. Expression of candidate genes involved in protein processing in the ER and TFs were visualized as a heat-map using PermutMatrix software (ver. 1.9.3).

Supplementary Materials

The following supporting information can be downloaded at the website of this paper posted on Preprints.org.

Author Contributions

O.H., J.-Y.L., K.C., H.S., H.N.T.T., H.A.P., A.D.T., J.S., and D.C. conceived and designed the research; H.A.P., J.S. and D.C. performed the experiments; H.A.P. and K.C. analyzed the data; H.A.P., A.D.T. and K.C. wrote the manuscript; H.S., H.N.T.T., O.H. and J.-Y.L. reviewed and revised the manuscript. All authors have read and agreed to the published version of the manuscript.

Funding

This work was supported by grants from the Next-Generation BioGreen 21 Program (PJ013149) from Rural Development Administration (RDA) of Republic of Korea, Basic Science Research Program through the National Research Foundation of Korea (NRF) funded by the Ministry of Education (RS-2023-00248217 to K Cho, 2023R1A2C1002936 and 2024H1A7A2A02000017 to O Han).

Institutional Review Board Statement

Not applicable.

Informed Consent Statement

Not applicable.

Data Availability Statement

Data are contained within the article and Supplementary Materials.

Acknowledgments

Authors thank to NRF, RDA, and BK21 FOUR for financial support.

Conflicts of Interest

The authors declare no conflicts of interest.

References

  1. Bechtel DB, Juliano BO: Formation of Protein Bodies in the Starchy Endosperm of Rice (Oryza sativa L. ): A Re-investigation*. Annals of Botany 1980, 45, 503–509. [Google Scholar]
  2. Kim HJ, Lee JY, Yoon UH, Lim SH, Kim YM: Effects of reduced prolamin on seed storage protein composition and the nutritional quality of rice. Int J Mol Sci 2013, 14, 17073–17084. [CrossRef] [PubMed]
  3. Yamagata H, Tanaka K: The Site of Synthesis and Accumulation of Rice Storage Proteins. Plant and Cell Physiology 1986, 27, 135–145.
  4. Kawakatsu T, Hirose S, Yasuda H, Takaiwa F: Reducing rice seed storage protein accumulation leads to changes in nutrient quality and storage organelle formation. Plant Physiol 2010, 154, 1842–1854. [CrossRef] [PubMed]
  5. Krishnan HB, Okita TW: Structural Relationship among the Rice Glutelin Polypeptides. Plant Physiol 1986, 81, 748–753. [CrossRef]
  6. Xu JH, Messing J: Amplification of prolamin storage protein genes in different subfamilies of the Poaceae. Theor Appl Genet 2009, 119, 1397–1412. [CrossRef] [PubMed]
  7. Muench DG, Ogawa M, Okita TW: The Prolamins of Rice. In: Seed Proteins. Edited by Shewry PR, Casey R. Dordrecht: Springer Netherlands; 1999: 93-108.
  8. Saito Y, Shigemitsu T, Yamasaki R, Sasou A, Goto F, Kishida K, Kuroda M, Tanaka K, Morita S, Satoh S et al. : Formation mechanism of the internal structure of type I protein bodies in rice endosperm: Relationship between the localization of prolamin species and the expression of individual genes. Plant J 2012, 70, 1043–1055. [Google Scholar] [CrossRef] [PubMed]
  9. Li X, Wu Y, Zhang DZ, Gillikin JW, Boston RS, Franceschi VR, Okita TW: Rice prolamine protein body biogenesis: A BiP-mediated process. Science 1993, 262, 1054–1056. [CrossRef] [PubMed]
  10. Tanaka K, Sugimoto T, Ogawa M, Kasai Z: Isolation and Characterization of Two Types of Protein Bodies in the Rice Endosperm. Agricultural and Biological Chemistry 1980, 44, 1633–1639.
  11. Sasou A, Shigemitsu T, Morita S, Masumura T: Accumulation of foreign polypeptides to rice seed protein body type I using prolamin portion sequences. Plant Cell Reports 2017, 36, 481–491. [CrossRef]
  12. Yamamoto MP, Onodera Y, Touno SM, Takaiwa F: Synergism between RPBF Dof and RISBZ1 bZIP Activators in the Regulation of Rice Seed Expression Genes. Plant Physiology 2006, 141, 1694–1707. [CrossRef] [PubMed]
  13. Kawakatsu T, Yamamoto MP, Touno SM, Yasuda H, Takaiwa F: Compensation and interaction between RISBZ1 and RPBF during grain filling in rice. Plant J 2009, 59, 908–920. [CrossRef] [PubMed]
  14. Wang J, Chen Z, Zhang Q, Meng S, Wei C: The NAC Transcription Factors OsNAC20 and OsNAC26 Regulate Starch and Storage Protein Synthesis. Plant Physiol 2020, 184, 1775–1791. [CrossRef]
  15. 15. Yang J, Zhou Y, Jiang Y: Amino Acids in Rice Grains and Their Regulation by Polyamines and Phytohormones. Plants (Basel).
  16. 16. Santos KF, Silveira RDD, Martin-Didonet CCG, Brondani C: Storage protein profile and amino acid content in wild rice Oryza glumaepatula. Pesquisa Agropecuária Brasileira.
  17. 17. Resurreccion AP, Li X, Okita TW, Juliano BO: Characterization of poorly digested protein of cooked rice protein bodies. Cereal chemistry (USA).
  18. 18. Wang Z, Li H, Liang M, Yang L: Glutelin and prolamin, different components of rice protein, exert differently in vitro antioxidant activities. Journal of Cereal Science.
  19. Cai J, Yang L, He H-J, Xu T, Liu H-B, Wu Q, Ma Y, Liu Q-H, Nie M-H: Antioxidant capacity responsible for a hypocholesterolemia is independent of dietary cholesterol in adult rats fed rice protein. Gene 2014, 533, 57–66. [CrossRef] [PubMed]
  20. Yang L, Chen J-H, Xu T, Zhou A-S, Yang H-K: Rice protein improves oxidative stress by regulating glutathione metabolism and attenuating oxidative damage to lipids and proteins in rats. Life Sciences 2012, 91, 389–394. [CrossRef]
  21. Kawakatsu T, Takaiwa F: Reduction of 13 kD prolamins increases recombinant protein yield and recovery rate in rice endosperm. Plant Signal Behav 2012, 7, 1402–1403. [CrossRef] [PubMed]
  22. Yang L, Hirose S, Takahashi H, Kawakatsu T, Takaiwa F: Recombinant protein yield in rice seed is enhanced by specific suppression of endogenous seed proteins at the same deposit site. Plant Biotechnology Journal 2012, 10, 1035–1045. [CrossRef]
  23. Cho K, Lee H-J, Jo Y-M, Lim S-H, Rakwal R, Lee J-Y, Kim Y-M: RNA Interference-Mediated Simultaneous Suppression of Seed Storage Proteins in Rice Grains. Frontiers in Plant Science 2016, 7.
  24. 24. Rowling PJ, Freedman RB: Folding, assembly, and posttranslational modification of proteins within the lumen of the endoplasmic reticulum. Subcell Biochem.
  25. Kaufman RJ: Stress signaling from the lumen of the endoplasmic reticulum: Coordination of gene transcriptional and translational controls. Genes Dev 1999, 13, 1211–1233. [CrossRef]
  26. Kleizen B, Braakman I: Protein folding and quality control in the endoplasmic reticulum. Curr Opin Cell Biol 2004, 16, 343–349. [CrossRef]
  27. Satoh-Cruz M, Crofts AJ, Takemoto-Kuno Y, Sugino A, Washida H, Crofts N, Okita TW, Ogawa M, Satoh H, Kumamaru T: Protein Disulfide Isomerase Like 1-1 Participates in the Maturation of Proglutelin Within the Endoplasmic Reticulum in Rice Endosperm. Plant and Cell Physiology 2010, 51, 1581–1593. [CrossRef] [PubMed]
  28. Muench DG, Wu Y, Zhang Y, Li X, Boston RS, Okita TW: Molecular cloning, expression and subcellular localization of a BiP homolog from rice endosperm tissue. Plant Cell Physiol 1997, 38, 404–412. [CrossRef] [PubMed]
  29. Wakasa Y, Yasuda H, Oono Y, Kawakatsu T, Hirose S, Takahashi H, Hayashi S, Yang L, Takaiwa F: Expression of ER quality control-related genes in response to changes in BiP1 levels in developing rice endosperm. Plant J 2011, 65, 675–689. [CrossRef] [PubMed]
  30. Tu BP, Weissman JS: Oxidative protein folding in eukaryotes: Mechanisms and consequences. J Cell Biol 2004, 164, 341–346. [CrossRef] [PubMed]
  31. Onda Y, Kawagoe Y: Oxidative protein folding: Selective pressure for prolamin evolution in rice. Plant Signal Behav 2011, 6, 1966–1972. [CrossRef] [PubMed]
  32. 32. Li J, Kong X, Ai Y: Modification of granular waxy, normal and high-amylose maize starches by maltogenic α-amylase to improve functionality. Carbohydrate Polymers.
  33. Lv X, Hong Y, Zhou Q, Jiang C: Structural Features and Digestibility of Corn Starch With Different Amylose Content. Frontiers in Nutrition 2021, 8.
  34. Nagamine A, Matsusaka H, Ushijima T, Kawagoe Y, Ogawa M, Okita TW, Kumamaru T: A role for the cysteine-rich 10 kDa prolamin in protein body I formation in rice. Plant Cell Physiol 2011, 52, 1003–1016. [CrossRef] [PubMed]
  35. Saito Y, Shigemitsu T, Yamasaki R, Sasou A, Goto F, Kishida K, Kuroda M, Tanaka K, Morita S, Satoh S et al. : Formation mechanism of the internal structure of type I protein bodies in rice endosperm: Relationship between the localization of prolamin species and the expression of individual genes. The Plant Journal 2012, 70, 1043–1055. [Google Scholar] [CrossRef] [PubMed]
  36. 36. Mitsukawa N, Konishi R, Kidzu K, Ohtsuki K, Masumura T, Tanaka K: Amino Acid Sequencing and cDNA Cloning of Rice Seed Storage Proteins, the 13kDa Prolamins, Extracted from Type I Protein Bodies. Plant Biotechnology.
  37. 37. Momma M, Saito M, Chikuni K, Saio K: Ultrastructure of prolamin accumulating protein bodies in endosperm of mutant rice for storage proteins (ultrastructure of protein bodies in mutant rice). Journal of The Japanese Society for Food Science and Technology-nippon Shokuhin Kagaku Kogaku Kaishi.
  38. Ogawa M, Kumamaru T, Satoh H, Iwata N, Omura T, Kasai Z, Tanaka K: Purification of Protein Body-I of Rice Seed and its Polypeptide Composition. Plant and Cell Physiology 1987, 28, 1517–1527.
  39. Qian D, Chen G, Tian L, Qu LQ: OsDER1 Is an ER-Associated Protein Degradation Factor That Responds to ER Stress. Plant Physiol 2018, 178, 402–412. [CrossRef]
  40. Kim Y-M, Lee J-Y, Lee T, Lee Y-H, Kim S-H, Kang S-H, Yoon U-H, Ha S-H, Lim S-H: The suppression of the glutelin storage protein gene in transgenic rice seeds results in a higher yield of recombinant protein. Plant Biotechnology Reports 2012, 6, 347–353. [CrossRef]
  41. He W, Wang L, Lin Q, Yu F: Rice seed storage proteins: Biosynthetic pathways and the effects of environmental factors. J Integr Plant Biol 2021, 63, 1999–2019. [CrossRef] [PubMed]
  42. Ohta M, Takaiwa F: OsHrd3 is necessary for maintaining the quality of endoplasmic reticulum-derived protein bodies in rice endosperm. J Exp Bot 2015, 66, 4585–4593. [CrossRef] [PubMed]
  43. Hu C, Yang J, Qi Z, Wu H, Wang B, Zou F, Mei H, Liu J, Wang W, Liu Q: Heat shock proteins: Biological functions, pathological roles, and therapeutic opportunities. MedComm (2020) 2022, 3, e161.
  44. Chaudhury S, Keegan BM, Blagg BSJ: The role and therapeutic potential of Hsp90, Hsp70, and smaller heat shock proteins in peripheral and central neuropathies. Med Res Rev 2021, 41, 202–222. [CrossRef] [PubMed]
  45. Chen S, Smith DF: Hop as an Adaptor in the Heat Shock Protein 70 (Hsp70) and Hsp90 Chaperone Machinery*. Journal of Biological Chemistry 1998, 273, 35194–35200. [CrossRef] [PubMed]
  46. Taipale M, Jarosz DF, Lindquist S: HSP90 at the hub of protein homeostasis: Emerging mechanistic insights. Nature Reviews Molecular Cell Biology 2010, 11, 515–528. [CrossRef] [PubMed]
  47. Pratt WB, Toft DO: Regulation of signaling protein function and trafficking by the hsp90/hsp70-based chaperone machinery. Exp Biol Med (Maywood) 2003, 228, 111–133. [CrossRef] [PubMed]
  48. Park CJ, Seo YS: Heat Shock Proteins: A Review of the Molecular Chaperones for Plant Immunity. Plant Pathol J 2015, 31, 323–333. [CrossRef]
  49. Pobre KFR, Poet GJ, Hendershot LM: The endoplasmic reticulum (ER) chaperone BiP is a master regulator of ER functions: Getting by with a little help from ERdj friends. J Biol Chem 2019, 294, 2098–2108. [CrossRef]
  50. Mayer MP: Hsp70 chaperone dynamics and molecular mechanism. Trends Biochem Sci 2013, 38, 507–514. [CrossRef] [PubMed]
  51. Stolz A, Wolf DH: Endoplasmic reticulum associated protein degradation: A chaperone assisted journey to hell. Biochim Biophys Acta 2010, 1803, 694–705. [CrossRef] [PubMed]
  52. Chandra D, Cho K, Pham HA, Lee J-Y, Han O: Down-Regulation of Rice Glutelin by CRISPR-Cas9 Gene Editing Decreases Carbohydrate Content and Grain Weight and Modulates Synthesis of Seed Storage Proteins during Seed Maturation. International Journal of Molecular Sciences 2023, 24, 16941. [CrossRef] [PubMed]
  53. 53. Howell SH: Endoplasmic reticulum stress responses in plants. Annu Rev Plant Biol.
  54. Cao L, Liu P, Chen J, Deng L: Prediction of Transcription Factor Binding Sites Using a Combined Deep Learning Approach. Frontiers in Oncology 2022, 12.
  55. Li C, Li Y, Zhou Z, Huang Y, Tu Z, Zhuo X, Tian D, Liu Y, Di H, Lin Z et al. : Genome-wide identification and comprehensive analysis heat shock transcription factor (Hsf) members in asparagus (Asparagus officinalis) at the seeding stage under abiotic stresses. Scientific Reports 2023, 13, 18103. [Google Scholar] [CrossRef] [PubMed]
  56. Xiang J, Ran J, Zou J, Zhou X, Liu A, Zhang X, Peng Y, Tang N, Luo G, Chen X: Heat shock factor OsHsfB2b negatively regulates drought and salt tolerance in rice. Plant Cell Reports 2013, 32, 1795–1806. [CrossRef] [PubMed]
  57. Ma L, Wang C, Hu Y, Dai W, Liang Z, Zou C, Pan G, Lübberstedt T, Shen Y: GWAS and transcriptome analysis reveal MADS26 involved in seed germination ability in maize. Theoretical and Applied Genetics 2022, 135, 1717–1730. [CrossRef]
  58. Khong GN, Pati PK, Richaud F, Parizot B, Bidzinski P, Mai CD, Bès M, Bourrié I, Meynard D, Beeckman T et al. : OsMADS26 Negatively Regulates Resistance to Pathogens and Drought Tolerance in Rice. Plant Physiol 2015, 169, 2935–2949. [Google Scholar]
  59. Liang T, Yu S, Pan Y, Wang J, Kay SA: The interplay between the circadian clock and abiotic stress responses mediated by ABF3 and CCA1/LHY. Proc Natl Acad Sci U S A 2024, 121, e2316825121. [CrossRef]
  60. Xu DQ, Huang J, Guo SQ, Yang X, Bao YM, Tang HJ, Zhang HS: Overexpression of a TFIIIA-type zinc finger protein gene ZFP252 enhances drought and salt tolerance in rice (Oryza sativa L. ). FEBS Lett 2008, 582, 1037–1043. [Google Scholar]
  61. Xie L-n, Chen M, Min D-h, Feng L, Xu Z-s, Zhou Y-b, Xu D-b, Li L-c, Ma Y-z, Zhang X-h: The NAC-like transcription factor SiNAC110 in foxtail millet (Setaria italica L. ) confers tolerance to drought and high salt stress through an ABA independent signaling pathway. Journal of Integrative Agriculture 2017, 16, 559–571. [Google Scholar] [CrossRef]
  62. 62. Huang P, Ding Z, Duan M, Xiong Y, Li X, Yuan X, Huang J: OsLUX Confers Rice Cold Tolerance as a Positive Regulatory Factor. Int J Mol Sci.
  63. 63. Schmidt R, Schippers JH, Welker A, Mieulet D, Guiderdoni E, Mueller-Roeber B: Transcription factor OsHsfC1b regulates salt tolerance and development in Oryza sativa ssp. japonica. AoB Plants.
  64. Yokotani N, Sato Y, Tanabe S, Chujo T, Shimizu T, Okada K, Yamane H, Shimono M, Sugano S, Takatsuji H et al. : WRKY76 is a rice transcriptional repressor playing opposite roles in blast disease resistance and cold stress tolerance. J Exp Bot 2013, 64, 5085–5097. [Google Scholar] [CrossRef] [PubMed]
  65. Maeda N, Matsuta F, Noguchi T, Fujii A, Ishida H, Kitagawa Y, Ishikawa A: The Homeodomain–Leucine Zipper Subfamily I Contributes to Leaf Age- and Time-Dependent Resistance to Pathogens in Arabidopsis thaliana. In: International Journal of Molecular Sciences. vol. 24; 2023.
  66. Hou Y, Wang L, Wang L, Liu L, Li L, Sun L, Rao Q, Zhang J, Huang S: JMJ704 positively regulates rice defense response against Xanthomonas oryzae pv. oryzae infection via reducing H3K4me2/3 associated with negative disease resistance regulators. BMC Plant Biology 2015, 15, 286. [Google Scholar]
  67. Wang W-C, Lin T-C, Kieber J, Tsai Y-C: Response Regulators 9 and 10 Negatively Regulate Salinity Tolerance in Rice. Plant and Cell Physiology 2019, 60, 2549–2563. [CrossRef]
  68. 68. Zhou J, Li D, Zheng C, Xu R, Zheng E, Yang Y, Chen Y, Yu C, Yan C, Chen J et al.: Targeted Transgene Expression in Rice Using a Callus Strong Promoter for Selectable Marker Gene Control. Frontiers in Plant Science.
  69. Hiei Y, Ohta S, Komari T, Kumashiro T: Efficient transformation of rice (Oryza sativa L. ) mediated by Agrobacterium and sequence analysis of the boundaries of the T-DNA. The Plant Journal 1994, 6, 271–282. [Google Scholar] [CrossRef] [PubMed]
  70. Dellaporta SL, Wood J, Hicks JB: A plant DNA minipreparation: Version II. Plant Molecular Biology Reporter 1983, 1, 19–21. [CrossRef]
  71. Li Z, Trick HN: Rapid method for high-quality RNA isolation from seed endosperm containing high levels of starch. BioTechniques 2005, 38, 872–876. [CrossRef] [PubMed]
  72. Rao X, Huang X, Zhou Z, Lin X: An improvement of the 2ˆ(-delta delta CT) method for quantitative real-time polymerase chain reaction data analysis. Biostat Bioinforma Biomath 2013, 3, 71–85.
  73. Cho K, Han Y, Woo JC, Baudisch B, Klösgen RB, Oh S, Han J, Han O: Cellular localization of dual positional specific maize lipoxygenase-1 in transgenic rice and calcium-mediated membrane association. Plant Science 2011, 181, 242–248. [CrossRef]
  74. Lee H-J, Jo Y-M, Lee J-Y, Lim S-H, Kim Y-M: Lack of Globulin Synthesis during Seed Development Alters Accumulation of Seed Storage Proteins in Rice. International Journal of Molecular Sciences 2015, 16, 14717–14736. [CrossRef]
  75. Bray NL, Pimentel H, Melsted P, Pachter L: Near-optimal probabilistic RNA-seq quantification. Nat Biotechnol 2016, 34, 525–527. [CrossRef] [PubMed]
  76. Li B, Dewey CN: RSEM: Accurate transcript quantification from RNA-Seq data with or without a reference genome. BMC Bioinformatics 2011, 12, 323.
  77. McCarthy DJ, Chen Y, Smyth GK: Differential expression analysis of multifactor RNA-Seq experiments with respect to biological variation. Nucleic Acids Res 2012, 40, 4288–4297. [CrossRef] [PubMed]
  78. Love MI, Huber W, Anders S: Moderated estimation of fold change and dispersion for RNA-seq data with DESeq2. Genome Biology 2014, 15, 550.
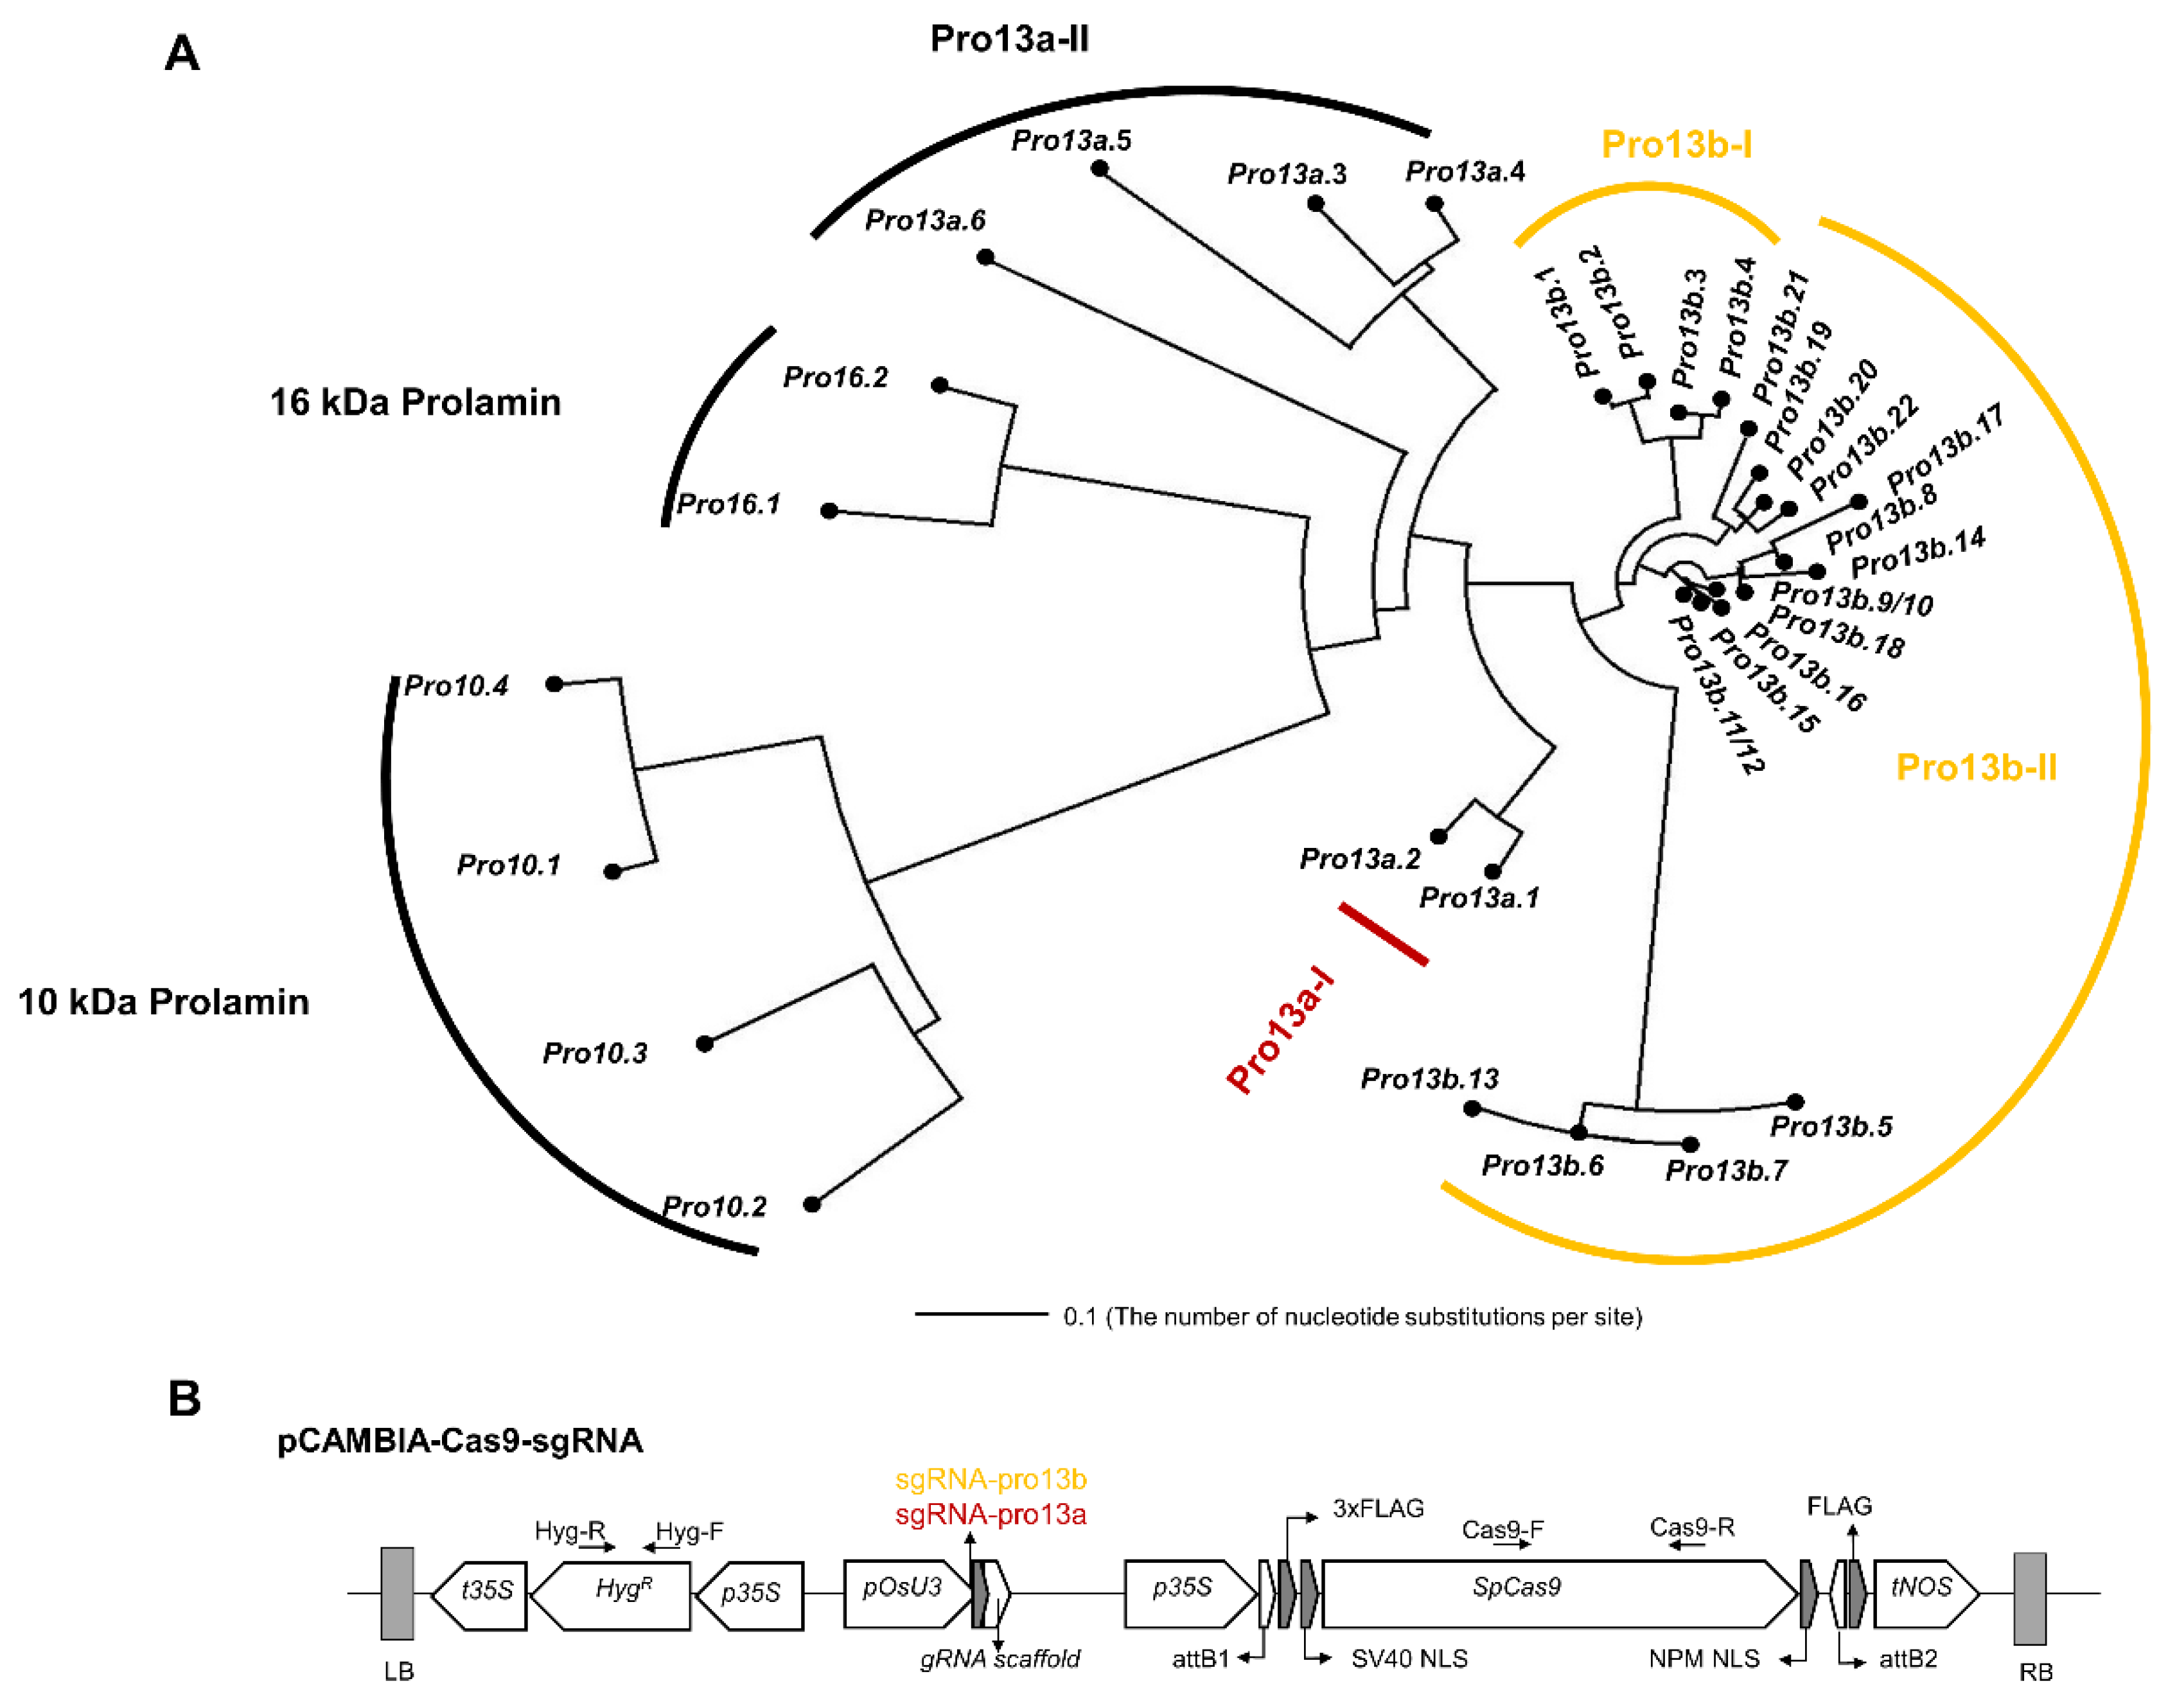
Figure 1. Strategy for simultaneous editing of multiple prolamin genes using CRISPR-Cas9. (A) Phylogenic tree of prolamin genes was constructed using Dendroscope (ver 3.5.7). Genomic sequences were from the Rice Annotation Project Database (https://rapdb.dna.affrc.go.jp/). Target genes of two sgRNAs, sgRNA-pro13a and sgRNA-pro13b, are shown in red and yellow, respectively. (B) Structure of the pCAMBIA-Cas9-sgRNA binary vector. The binary vector carries sgRNA-pro13a (AACGTAGCTGGTTGCCAGAAGGG) or sgRNA-pro13b (AAACGCAGCTGATTGCAAGAAGG) under the control of the pOsU3 promoter. Primers for PCR amplification are indicated by black arrows.
Preprints 106062 g001
Figure 2. Production of 13 kDa prolamin-knockout T2 lines with reduced prolamin content. (A) Outcomes of gene editing in T2 generation of 13 kDa prolamin-knockout lines (1a-8-1, 2a-2-1, 4b-9-7, and 8b-3-9). Shaded boxes indicate which genes in each mutant line carry frameshift mutations. Different colors represent mutations in different 13 kDa prolamin subgroups. (B) Comparison of Pro13a-I, Pro13b-I, and Pro13b-II subgroup expression in WT (Ilmi) and 13 kDa prolamin-knockout lines. qRT-PCR was performed 2 weeks after flowering to quantify transcripts of the indicated 13 kDa prolamins genes in immature seeds of WT and mutant plants. (C) Analysis of SSP levels in Ilmi and 13 kDa prolamin-knockout lines by SDS-PAGE (top) and Western blot (below). Total SSPs (5 µg) were separated on a gradient SDS-PAGE gel (10–17.5%). The resolved SSPs were transferred onto a polyvinylidene fluoride (PVDF) membrane and the membrane was incubated with anti- Pro13a-I or anti-Pro13b-I antibodies, as indicated,. S/M: Size marker.
Preprints 106062 g002
Figure 3. Morphology of seeds from 13 kDa prolamin-knockout plants. (A) Representative images of WT and knockout seeds. Left: Length; Right: Width of de-husked seeds. Scale bar = 5mm. (B) Weight of 100 grains of Ilmi and 13 kDa prolamin-knockout seeds. Values are mean ± SD (n = 3). (C) Comparison of length, width, thickness, and length-to-width ratio of grain between Ilmi and 13 kDa prolamin-knockout seeds. Values are mean ± SD (n = 30). P values were calculated by the Student’s t test (*p < 0.1, ** p < 0.01 and *** p < 0.001).
Preprints 106062 g003
Figure 4. Starch granule appearance and starch content in WT and 13 kDa prolamin-knockout seeds. (A) Representative images of seed transverse sections showing structure of starch granules. Red arrow indicates rod/filamentous granules. (B) Average weight of starch per grain. (C) Relative composition of amylose and amylopectin. (D) Transcripts of genes involved in starch metabolism were analyzed by qRT-PCR. Normalized expression of target genes was calculated using the 2−ΔΔCT method and is shown as log2 value. Error bars represent ± SD of three replicates. P values were calculated using Student’s t-test (*p < 0.1, **p < 0.01, and *** p < 0.001).
Preprints 106062 g004
Figure 5. Structure of PB-I and composition of SSPs in Ilmi WT and 13 kDa prolamin-knockout lines. (A) TEM image of PB-I in developing endosperm at 2 WAF. (B) Average weight of SSP per grain. (C) Relative composition of SSPs (Albumin/globulin, Prolamin, and Glutelin). (D) qRT-PCR analysis of SSP genes in 13 kDa prolamin-knockout lines. Transcripts encoding different SSPs were analyzed in the immature seeds of WT and mutant lines. Normalized expression of the target genes was calculated using the 2−ΔΔCT method and is represented as log2 value. Error bars denote ± SD of three replicates. P values were calculated using the Student’s t-test (* p < 0.1, ** p < 0.01 and *** p < 0.001).
Preprints 106062 g005
Figure 6. Transcriptome analysis identified DEGs in 13 kDa prolamin-knockout lines. (A) Venn diagram and functional classification of 540 genes up-regulated relative to WT control (Ilmi). (B). Venn diagram and functional classification of 403 genes down-regulated relative to WT control (Ilmi). Results for 1a-8-1, 2a-2-1, 4b-9-7 and 8b-3-9 plants are labeled with ellipses designated I, II, III and IV, respectively.
Preprints 106062 g006
Figure 7. Correlation analysis among DEGs and 13 kDa prolamin genes. Pearson correlation test was performed for DEGs and 13 kDa prolamin genes. The inclusion criteria was a correlation coefficient (r) ≥|0.7|. Transcripts were identified in nine functional groups: RNA processing, RNA transcription, Transport, Stress, Protein synthesis, Protein targeting, Protein posttranslational modification, Protein degradation, and Protein folding. The data were visualized using Cytoscape software (ver. 3.10.1). Circles indicate 13 kDa prolamin genes, squares indicate correlated genes. Blue line indicates negative correlation and red line indicates positive correlation.
Preprints 106062 g007
Figure 8. Expression of ER pathway genes in 13 kDa prolamin-knockout lines. (A) Relative expression of DEGs involved in ER-related pathways in 13 kDa prolamin-knockout lines. Normalized expression of each gene is represented by Z-score. (B) qRT-PCR analysis of chaperone genes (BIP, PDIs, CNX, HSP90, HSP20, and HSP70) in 13 kDa prolamin-knockout lines. Normalized expression of the target genes was quantified using the 2−ΔΔCT method and the relative expression of each gene is represented as log2 value. Error bars denote ± SD of three replicates. P values were calculated using the Student’s t-test (* p < 0.1, ** p < 0.01 and *** p < 0.001).
Preprints 106062 g008
Figure 9. Expression of TF genes associated with 13 kDa prolamins. (A) Heatmap displays the expression profiles of the TF genes. This map shows altered expression of genes in 13 kDa prolamin-knockout lines relative to WT. Normalized expression of each gene is represented by Z-score. (B) Confirmation of the expression patterns of a few putative TF genes by qRT-PCR. Transcripts of TF genes were analyzed in the immature seeds. Normalized expression of the target genes was calculated using the 2−ΔΔCT method and is represented as log2 value. Error bars denote ± SD of three replicates. P values were calculated by the Student’s t-test (* p < 0.1 and ** p < 0.01).
Preprints 106062 g009
Disclaimer/Publisher’s Note: The statements, opinions and data contained in all publications are solely those of the individual author(s) and contributor(s) and not of MDPI and/or the editor(s). MDPI and/or the editor(s) disclaim responsibility for any injury to people or property resulting from any ideas, methods, instructions or products referred to in the content.
Copyright: This open access article is published under a Creative Commons CC BY 4.0 license, which permit the free download, distribution, and reuse, provided that the author and preprint are cited in any reuse.
Prerpints.org logo

Preprints.org is a free preprint server supported by MDPI in Basel, Switzerland.

Subscribe

© 2024 MDPI (Basel, Switzerland) unless otherwise stated