1. Introduction
Additive Manufacturing (AM), particularly laser-based powder bed fusion of metals (PBF-LB/M), has emerged as a transformative technology with profound implications across various industries. PBF-LB/M offers unparalleled capabilities in producing complex geometries with high precision and reduced material waste, disrupting traditional manufacturing processes. Its ability to fabricate components with intricate designs, previously unattainable through conventional methods, has positioned PBF-LB/M as a cornerstone technology in the era of Industry 4.0.
However, despite its remarkable advantages, the widespread adoption of PBF-LB/M still faces challenges, particularly concerning the associated costs. The high cost of metal powders, a critical trait in PBF-LB/M, remains a significant barrier hindering its broader application. To address this issue, exploring strategies to reduce manufacturing costs without compromising quality has become imperative. [
1,
2]
One promising approach to cost reduction lies in the utilization of coarser particle size distributions (PSDs) of up to 100 µm in PBF-LB/M. [
3,
4] To achieve optimal printing outcomes, PBF-LB/M has predominantly relied on 20-53 or 20-63 µm PSDs matching typically used layer thicknesses around 30-60 µm. [
5,
6] However, recent investigations have shown that incorporating larger powders, such as those used in electron beam-based powder bed fusion of metals (PBF-EB/M) with 45-106 µm, into PBF-LB/M could offer substantial cost-saving opportunities. [
7,
8] By leveraging the decreased costs associated with PBF-EB/M powders, it becomes possible to achieve comparable printing outcomes at a decreased expense.
This study aims to explore the feasibility and potential benefits of integrating coarser PSDs of 45-106 µm into PBF-LB/M. Additionally a wider PSD of 20-100 µm is investigated with a one-on-one blend of the PBF-LB/M_20-53 and PBF-EB/M_45-106 powder.
Influences on the powder characteristics of the increased PBF_EB/M_45-106 and blended Ti64_20-100 powders are investigated with a determination of the morphology and the flowability and compared to the reference PBF-LB/M powder. For each powder a process parameter study is performed to identify the process window for density samples with relative densities higher than 99.9 %. The actual particle sizes applied are determined to ensure that the coarser particles are applied and not just shoved in the overflow. Mechanical specimens are printed with the final process parameter combination of each powder variation to assess the manufacturability into defect-free parts with mechanical properties meeting industry standards for relative density, microstructure, hardness and tensile properties. Through a comprehensive market survey and analysis of cost reduction potentials, it is investigated how the adoption of PBF-EB/M powders can contribute to lowering manufacturing costs while maintaining quality standards.
By shedding light on the economic and technical viability of printing with PBF-EB/M PSDs, this study aims to provide valuable insights for industry stakeholders and researchers alike. Ultimately, the findings aim to facilitate the advancement and widespread adoption of PBF-LB/M technology by addressing critical cost-related challenges and enhancing its competitiveness in the manufacturing landscape.
2. Materials and Methods
2.1 Powder Characterization
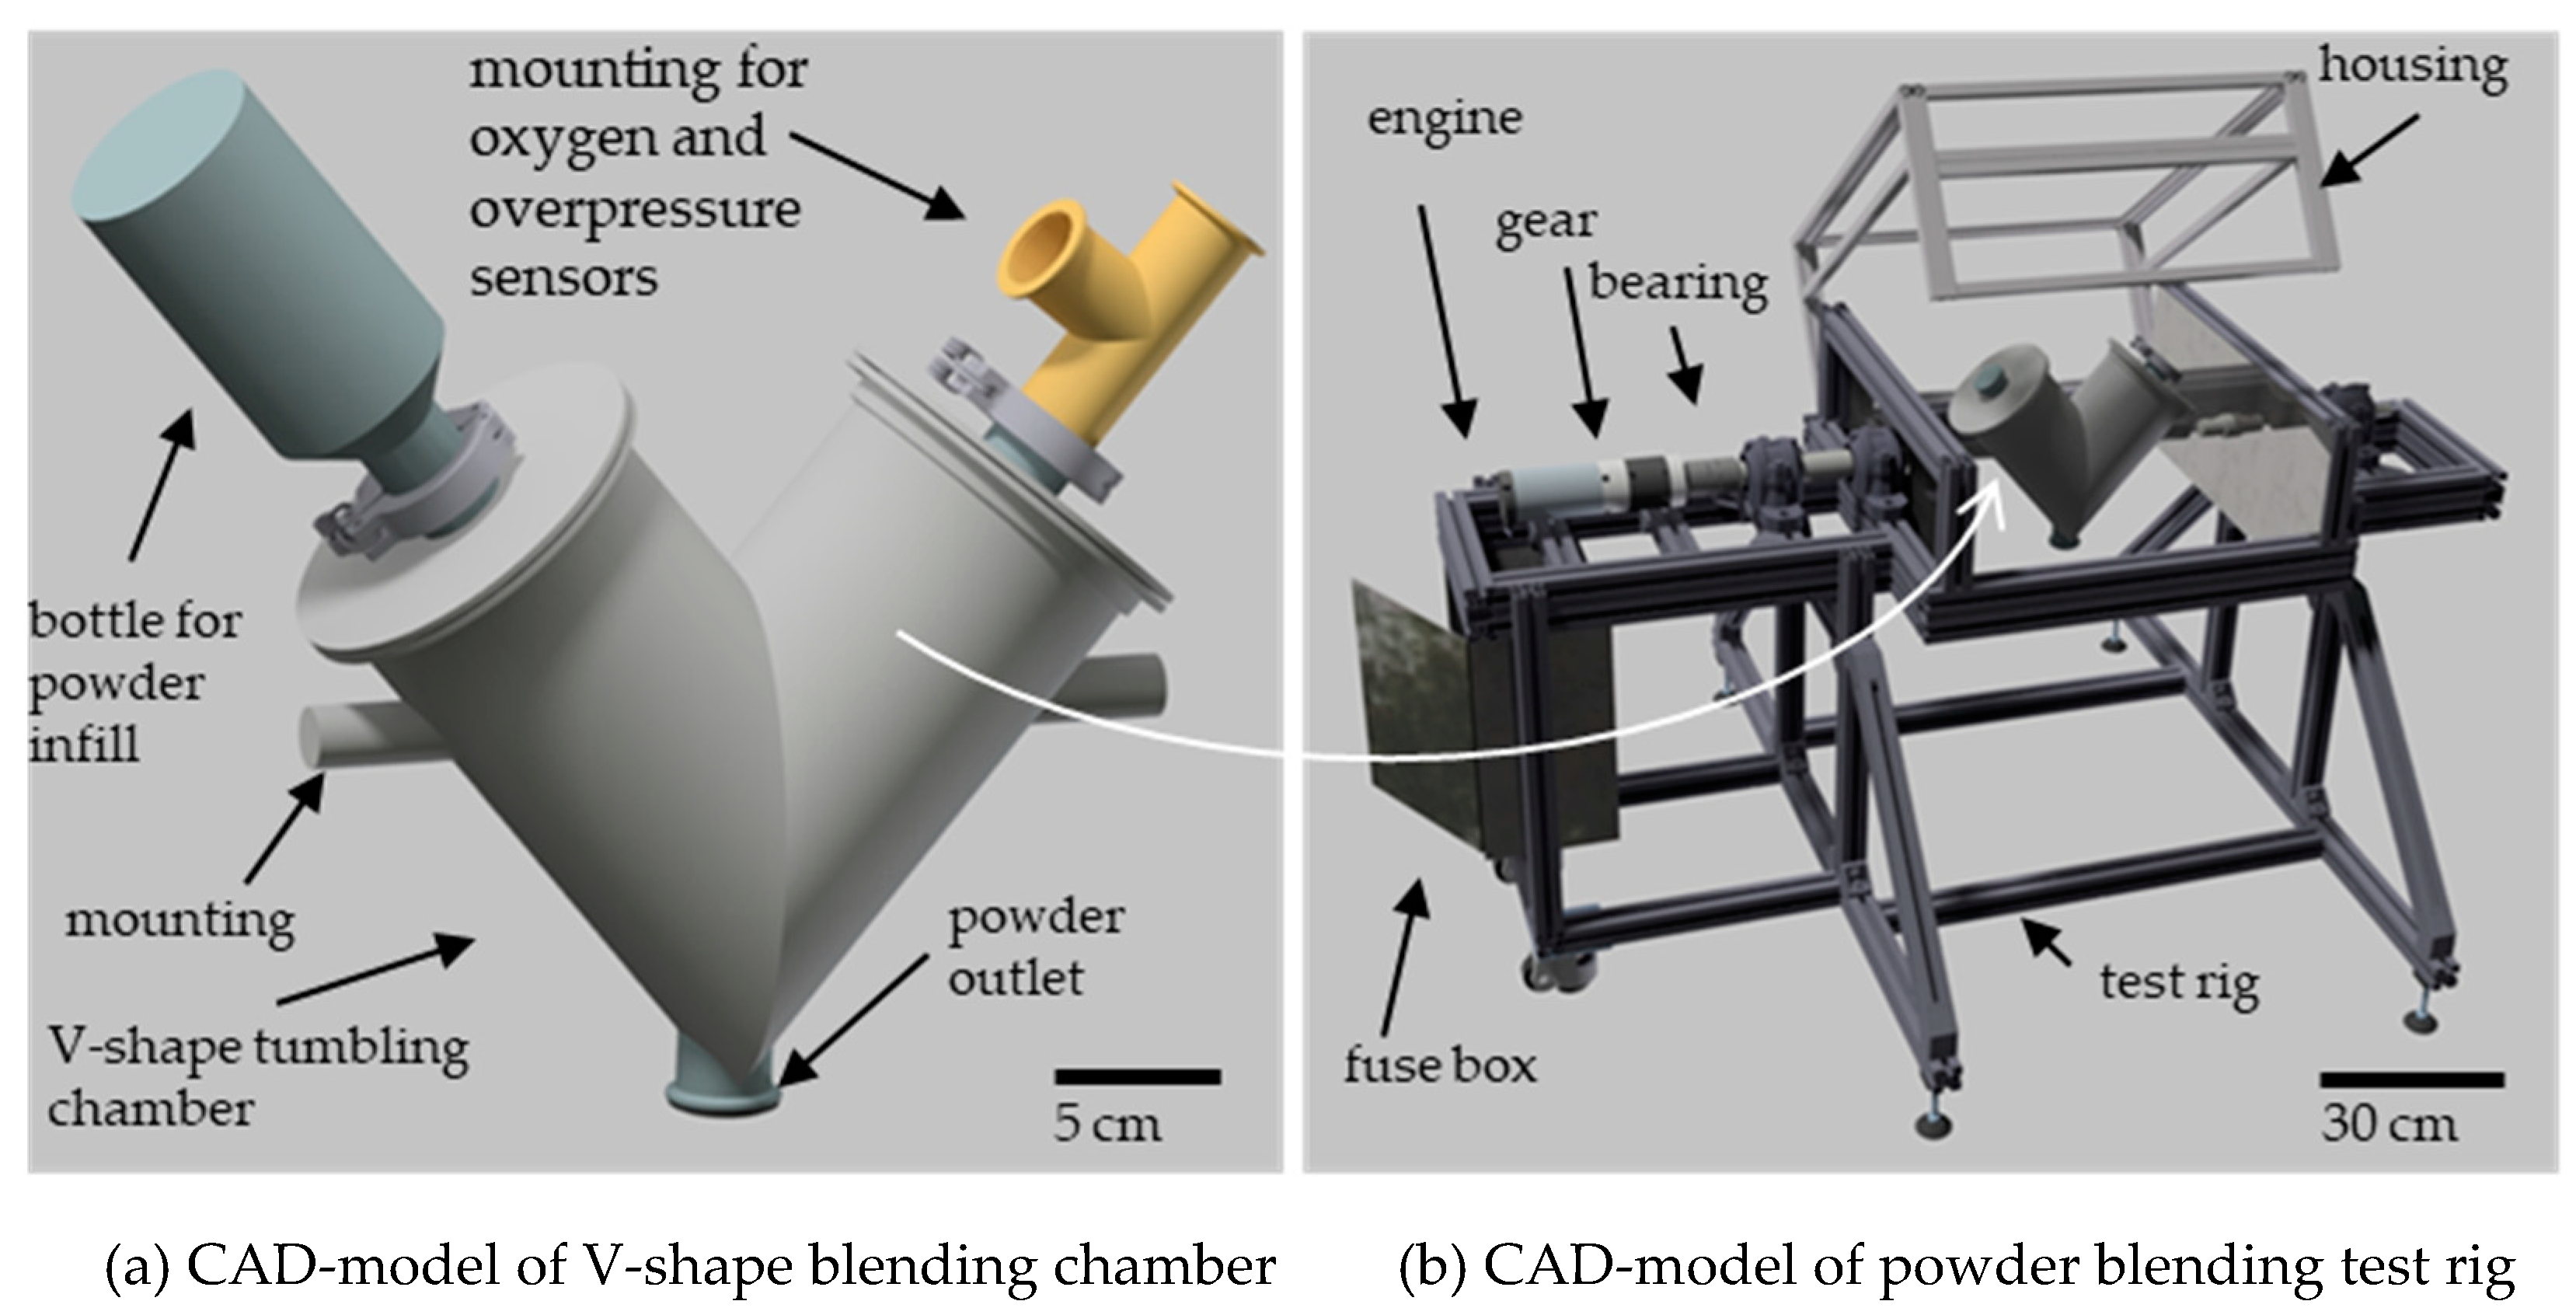
As commercial powder, two plasma atomized Ti-6Al-4V powders in ELI-quality are purchased in an PBF-LB/M typical PSD of 20-53 µm (PBF-LB/M_20-53) and an PBF-EB/M typical PSD of 45-106 µm (PBF-EB/M_45-106). Both powders are blended in a custom 3l-volume V-shape laboratory size tumbling blender, presented in
Figure 1. The powder ratio is a one on one ratio with a 70 % filling level inside the V-tumbler. The blending is performed for 15 min at 40 rpm (rounds per minute). Afterwards the blended powder is sieved at 100 µm to set a defined PSD of 20-100 µm (Ti64_20-100).
All three powders are characterized for their particle shape, size, chemistry composition and flowability. The PBF-LB/M powder functions as a reference to compare the flowability relatively within the three powders. A characterization comprises the particle shape via sphericity (SPHT), symmetry (Symm) and aspect ratio (w/l – width to length ratio) and the particle size displayed via the deciles for 10, 50 and 90 % (D10; D50 and D90) and a frequency distribution curve. These morphology related characteristics are measured using the dynamic image analysis with the X2 Camsizer, according to ISO 13322-1 [
9]. The morphology values are determined based on the x
area diameter, that describes the measured area of the particle in an equivalent circle.
The chemical composition of the base powders PBF-LB/M and PBF-EB/M are taken from the data-sheet of the suppliers. Ti, Al, Vanadium and Fe are measured using Inductively Coupled Plasma Optical Emission Spectroscopy (ICP-OES) according to ASTM E2371 [
10], O and N are determined by Inert Gas Fusion according to ASTM E1409 [
11]; hydrogen is measured with Inert Gas Fusion with detection by thermal conductivity (IGF-TC) according to ASTM E1447 and carbon is determined by combustion analysis (CA) according to ASTM E1941. [
12,
13]
The flowability is characterized with Hall-funnel and GranuDrum tests. According to DIN EN ISO 3923-1 and DIN EN ISO 3953 the apparent and tapped densities and according to DIN EN ISO 4490 the Hall-flowability are measured. [
14,
15,
16] The Hausner-Ratio is determined as described by Hausner in 1981 as a ratio of apparent to tapped density. [
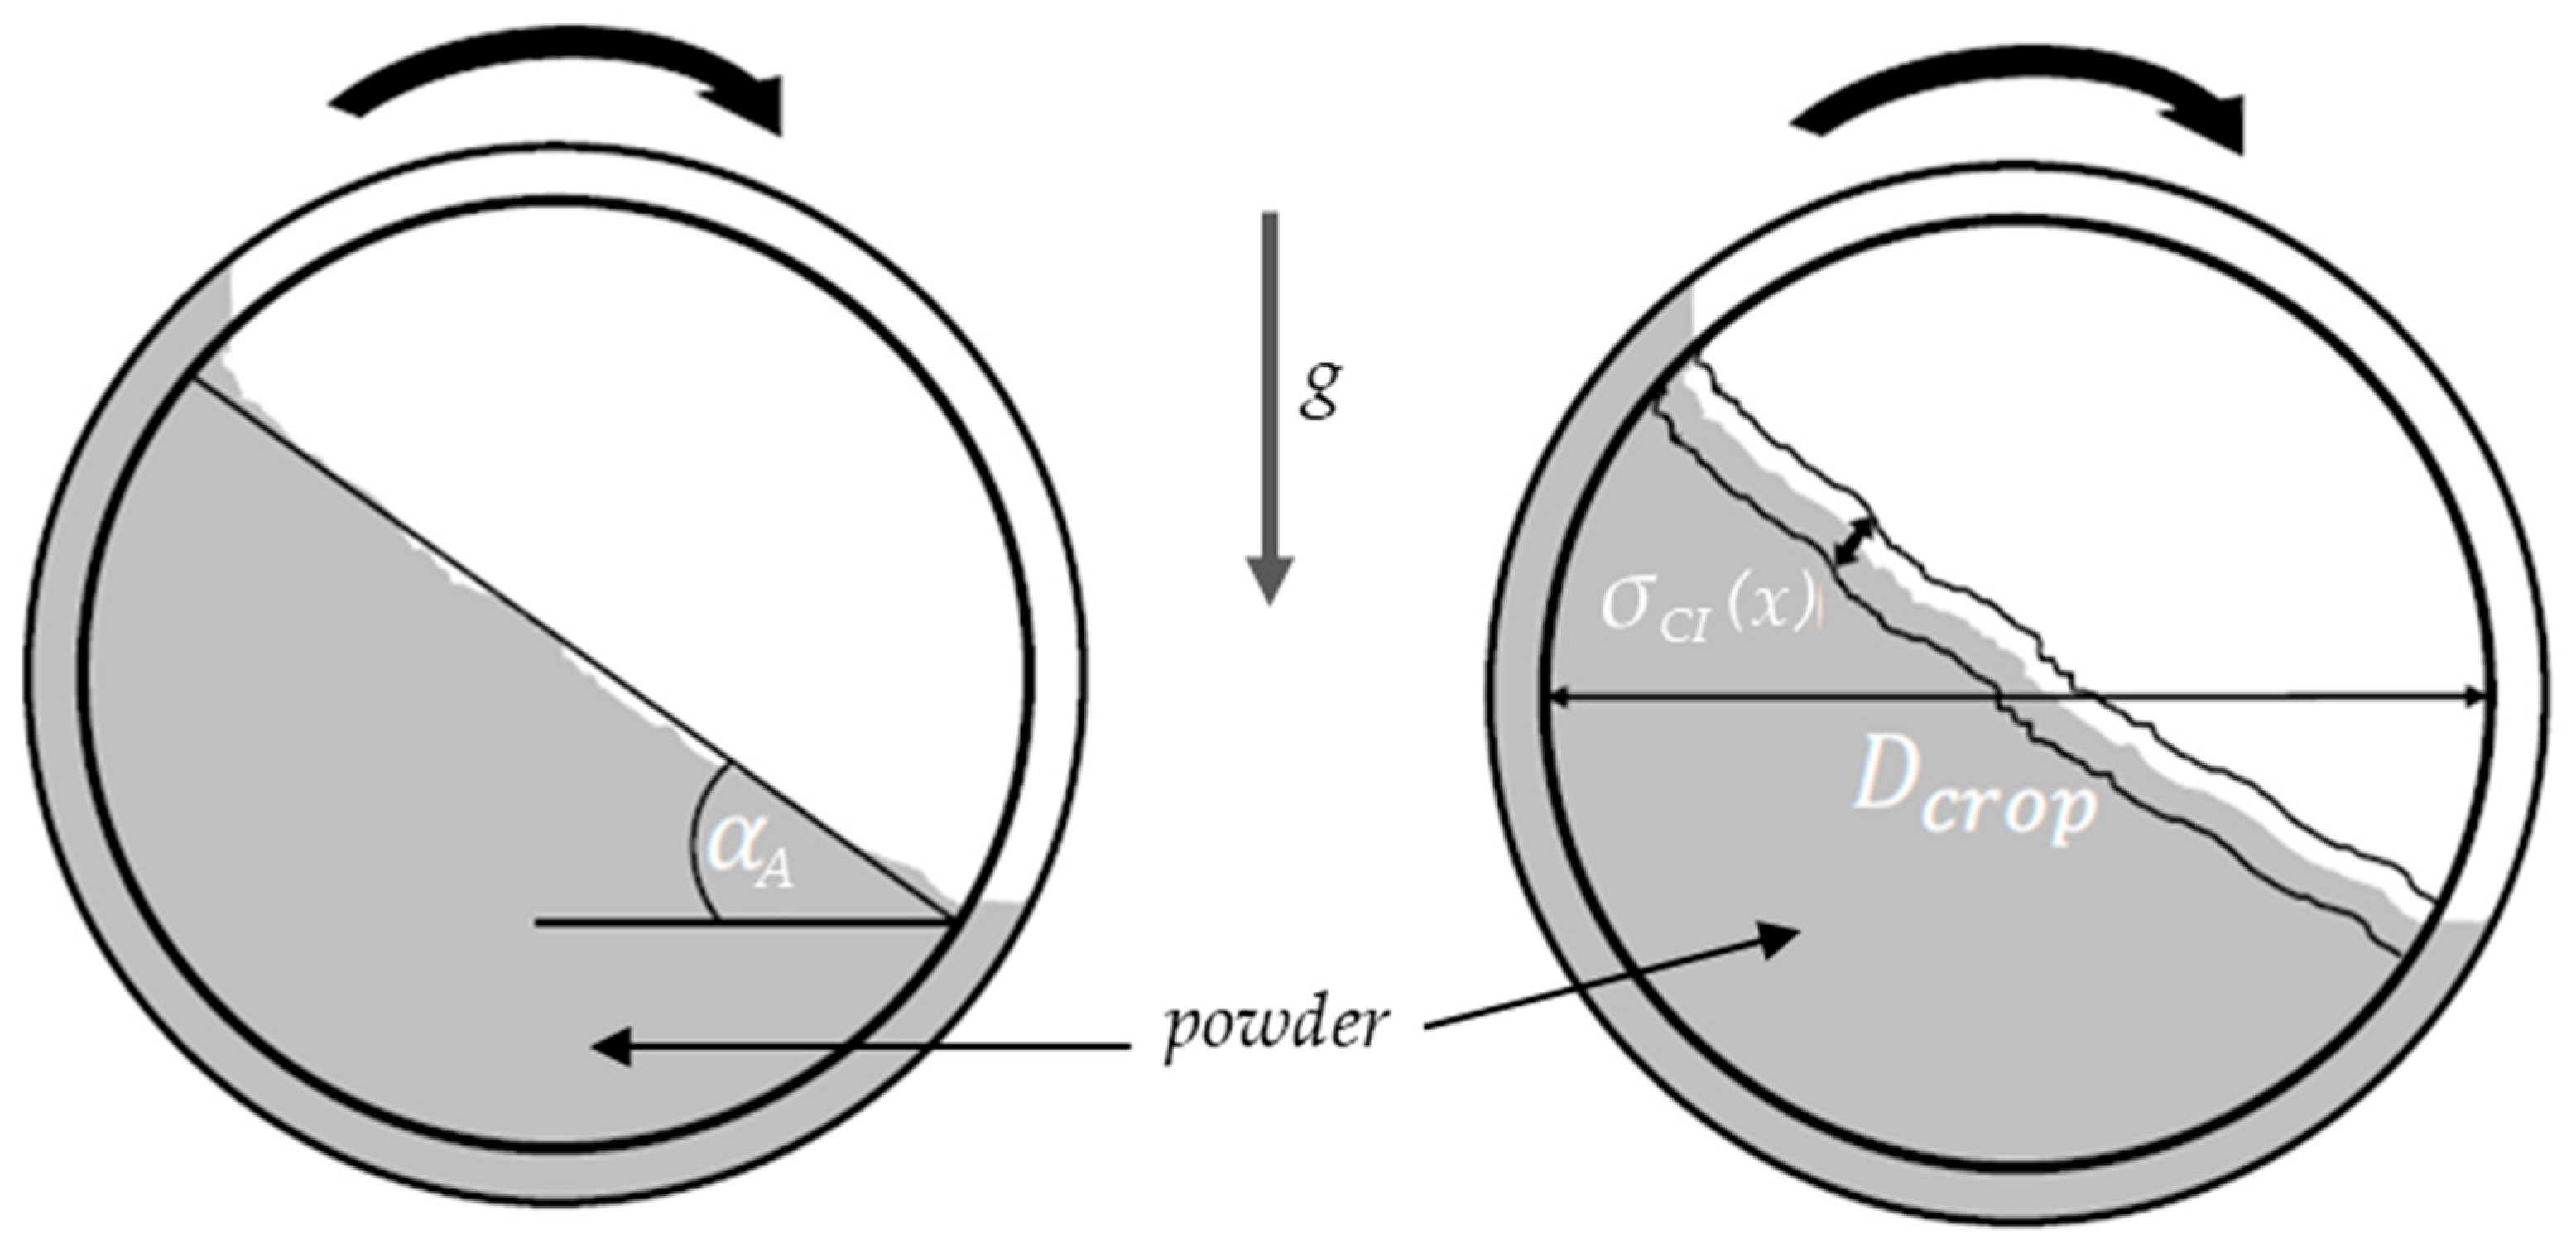
17] The relative humidity is measured with a hygrometer (± 2 %) and the temperature with a thermometer (±0.2 °C) from SwitchBot to determine the absolute humidity during the tests with the Hall-funnel. With the GranuDrum, the avalanche angle and cohesion index can be determined for in- and decreasing rotational speeds. Therefore, 50 g of powder is filled in a glass-sided drum as demonstrated in
Figure 2. The drum rotates at the set speeds of 2, 4, 6, 8, 10, 15, 25, 35, 45, and 55 rpm to cover multiple stress cases. A light from the back allows a front-camera to detect the powder surface and the powder movement inside the drum.
The diameter is cropped to D
crop to reduce the influence of attached particles on the outer edge. The powder builds up on the wall till it starts slipping. The highest gradient of the buildup describes the avalanche angle
αA. The cohesion index
C is calculated based on the temporal fluctuations of the powder interface. The calculation is displayed in the equations (1) and (2).
The results are similar for in- and decreasing rotational speed, which is why for better clarity only the value for increasing speed will be exhibited. [
19,
20]
2.2. PBF-LB/M Process
The powders are processed at a M2 Cusing system from Concept Laser with one 400 W fibre laser with a beam diameter of 100 µm. A double rubber recoater blade is used. The chamber is flooded with Ar as an inert gas atmosphere. The layer thickness is fixed at 60 µm without any platform heating. On a 250 mm x 250 mm build plate, 36 pyramid cone density cubes are placed. The process parameters laser power, scanning speed and hatch distance are varied. The parameter combination leading to the highest relative density, min. 99.9 % is chosen to print further mechanical specimens.
Powder samples are taken from the supply, the build plate (after build job completion) and the overflow to analyze the particle sizes. The samples are measured with dynamic image analysis as described in 2.1 Powder Characterization.
2.3. Mechanical Properties
All specimens used for the mechanical property analysis, are still attached to the build plate while heat treated for 2 h at 800°C in vacuum for annealing to decomposite α'→α+β and are separated afterwards via wire eroding. [
21]
For warm embedding the density cubes with the CitroPress, the polymer matrix ClaroFast is used. First the samples are grinded in increasingly finer steps and afterwards polished with OP-U (0.04 µm grain size). Images are taken with the VHX-5000 reflected light microscope in 50x magnification in dark-field exposure. An image analysis software is used to determine the relative density similar to a grey scale analysis to detect the pores. The average relative density is calculated for the accompanying density cubes of the tensile specimens.
The microstructure is analyzed using the scanning electron microscope (SEM) JOEL 7200 F. The specimens are connected with a copper band to the socket to ensure sufficient conductivity. The images are taken in backscattered electron (BSE) mode.
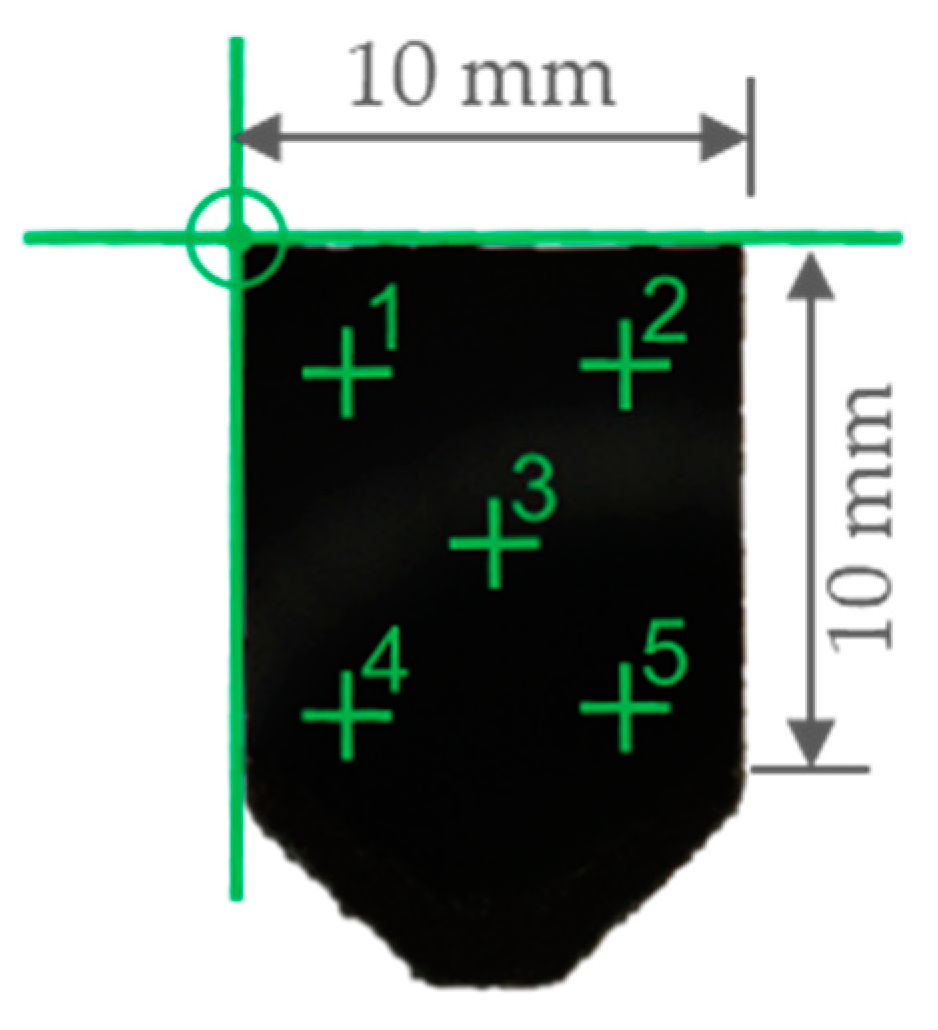
The hardness is measured at the polished surfaces of the density cubes. According to DIN 6507-1, the Vickers hardness HV10 is determined using a DuraScan from Struers. [
22] At five points per density cube, imprints are made as shown in
Figure 3. The mean values will be displayed in a bar chart, including the standard deviation. The results are compared to industry standards, which is highlighted with a green bar.
The tensile properties are characterized with horizontal and vertical oriented tensile specimens in the Form B according to DIN 50125 in with a 5 mm diameter. [
23] An offset of 1 mm is machined to eliminate any influence of the as-build surface roughness. At 20°C the tensile test is performed according to DIN EN ISO 6892-1 with a Galdabini-Quasar 600kN/50kN. [
24]
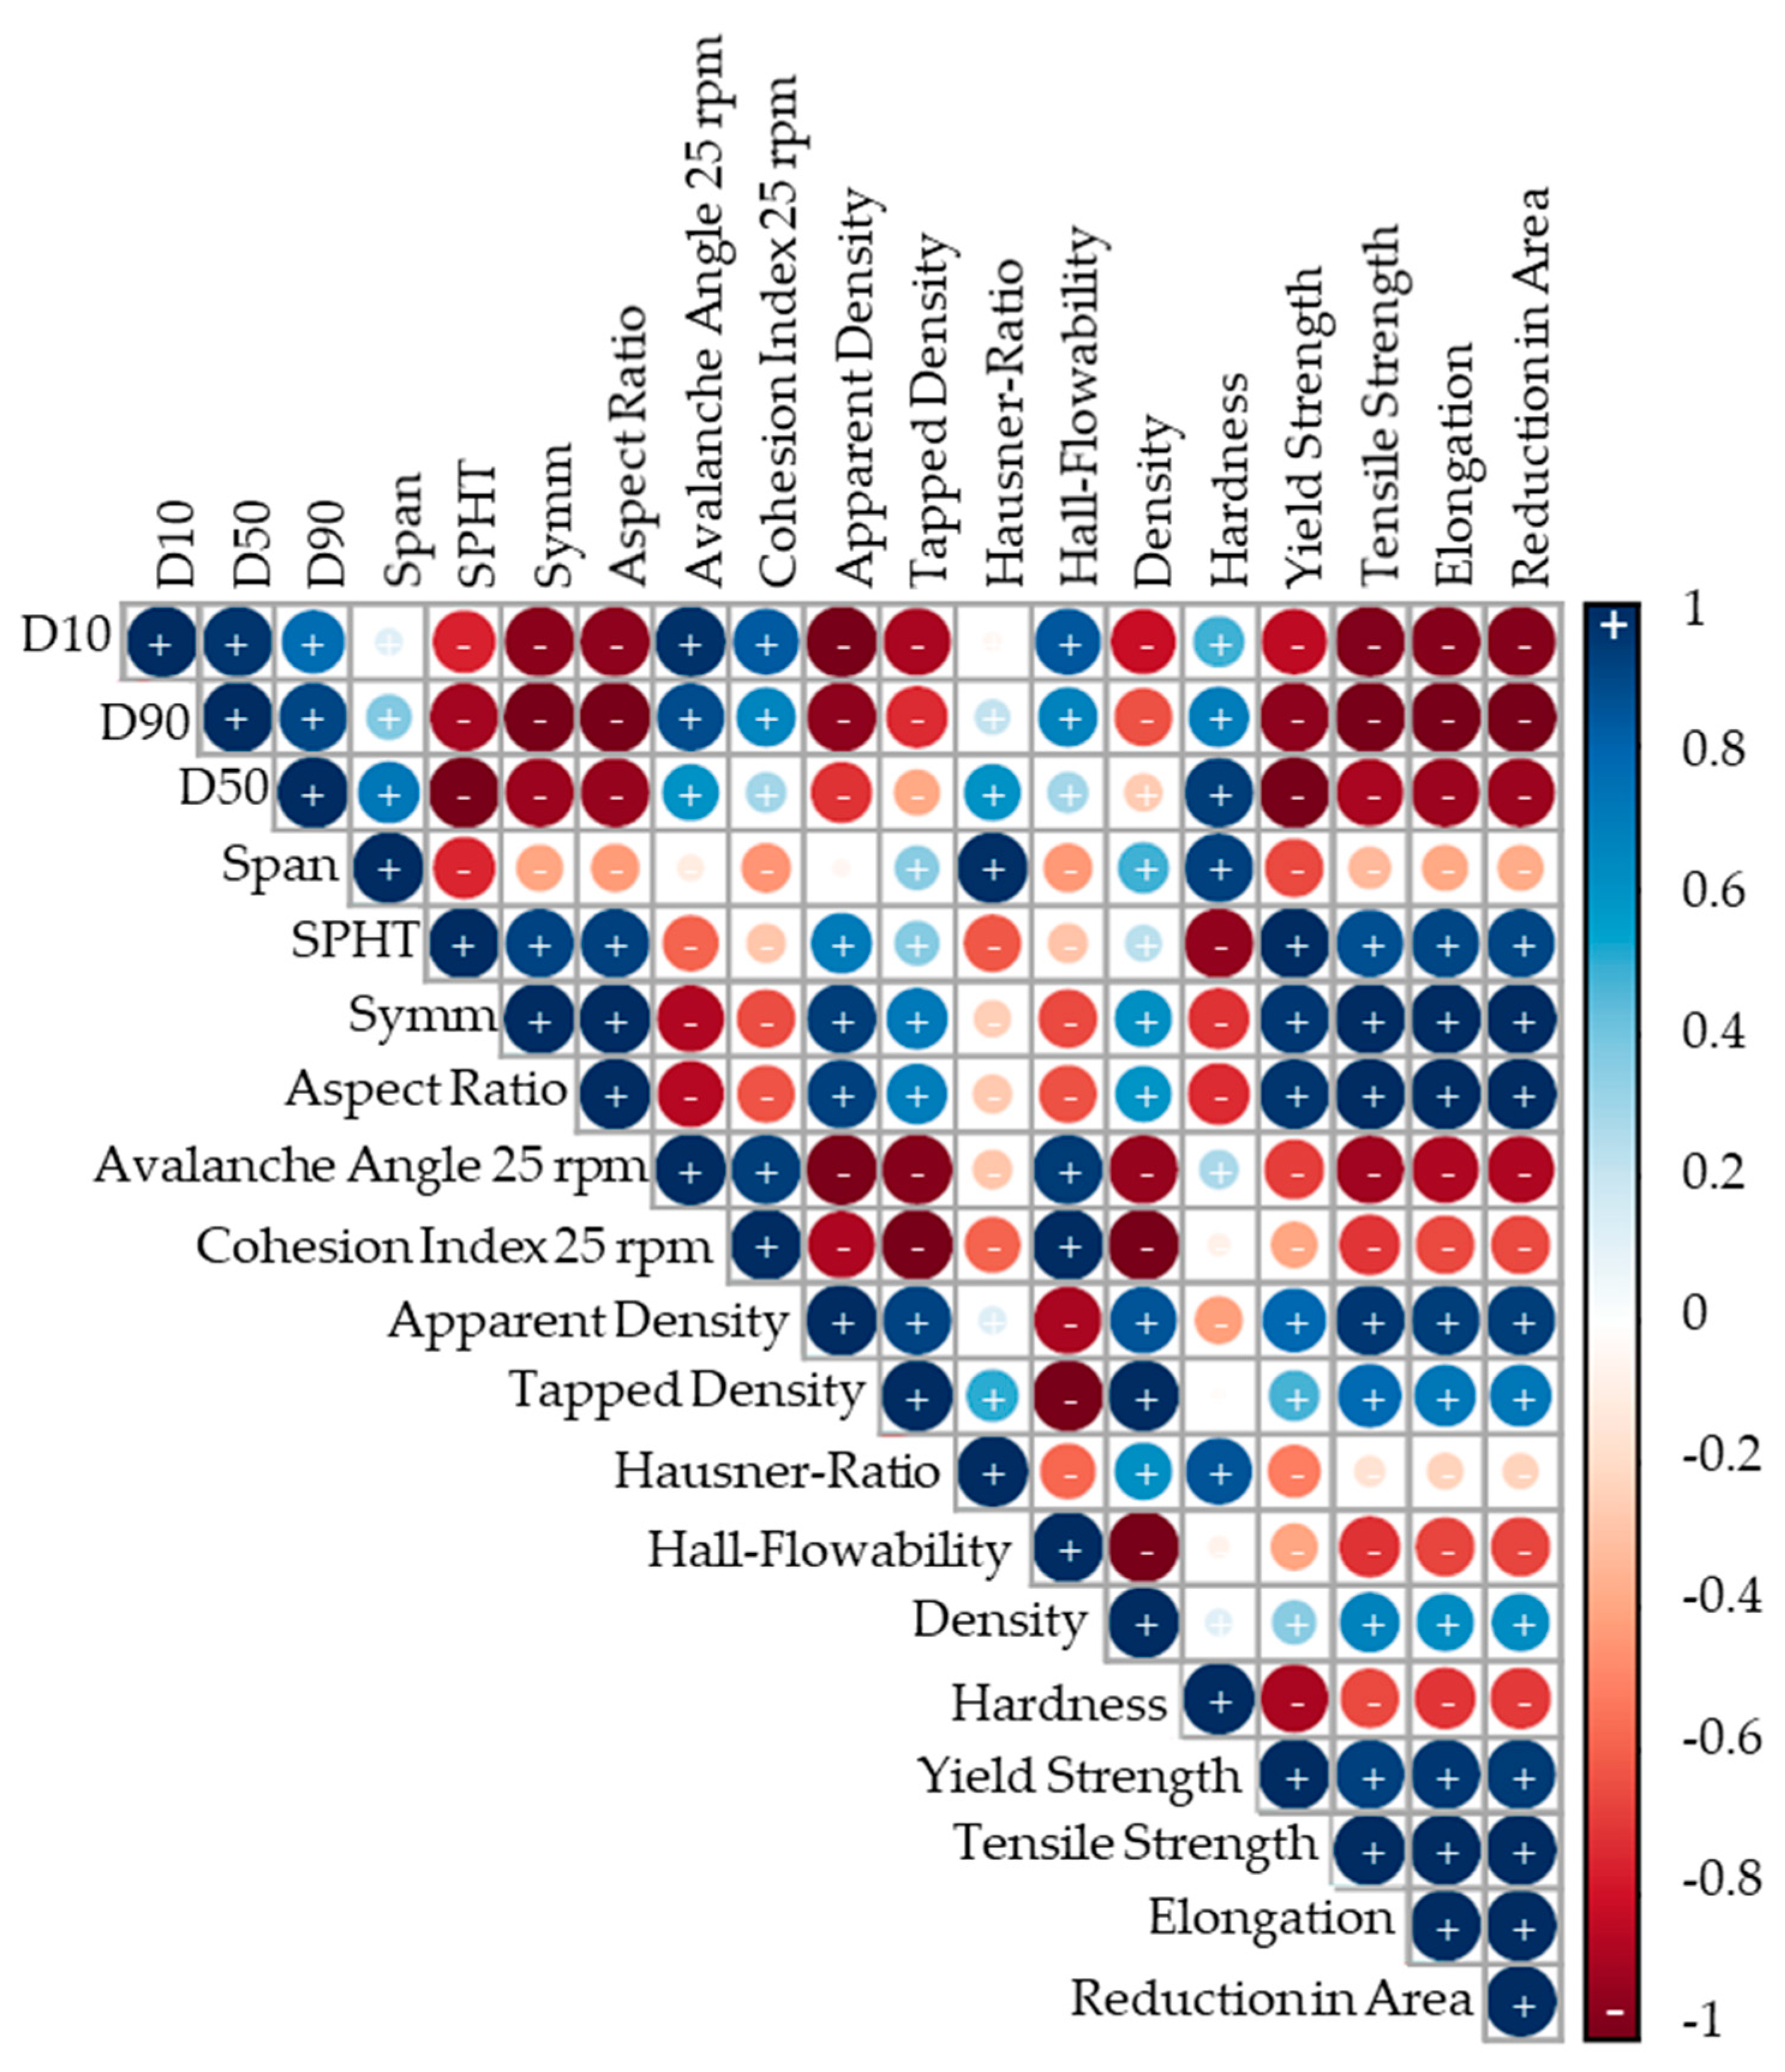
The correlation analysis is conducted using the statistical software R based on Pearson correlation tests. Pearson correlation tests assess linear correlations between two variables. A correlation is considered statistically significant if the Pearson correlation coefficient (r
C) is ≥ 0.7 with a significance level (α
C) of ≥ 5 %. Such correlations are classified as high in literature, ensuring robust statistical relevance. The causal relationship is examined for each validated correlation. The results are visualized in a correlation matrix, where blue indicates a positive correlation and red indicates a negative correlation. The size of the circle corresponds to the significance level, with larger circles representing higher significance. [
25]
The mechanical properties of the investigated powders are compared to industry standards, presented in
Table 1:
2.4. Economics
A market survey was undertaken to assess potential cost savings achievable through the utilization of increased PSDs of 20-100 µm with a blend of PBF-LB/M and PBF-EB/M powders. Offers were solicited from 22 powder suppliers, including both traders and atomizers, for Ti-6Al-4V ELI grade 23 in quantities of 100 kg and 1,000 kg, specifically in PBF-EB/M and PBF-LB/M PSDs. Machine suppliers were not included in this survey. The prices were not negotiated, and all offers were collected between June 1st and August 31st, 2021. Currency conversions were performed on September 2nd, 2021, to standardize the prices. After identifying four outliers, the analysis was based on a database of 11 suppliers. The offers for PBF-LB/M powders were summarized to cover typical PSDs ranging between 20-53 µm and 20-63 µm. Similarly, for PBF-EB/M powders, the PSDs considered were summarized to include 44-106 µm, 45-100 µm, and 45-125 µm. It is worth noting that suppliers may have different standards for PSDs they can offer, making it difficult to compare exactly the same PSDs across suppliers.
3. Results
3.1. Powder Characterization
In
Table 2 are the results of the powder morphology presented. The particle shape is similar with deviations between the three powders of 0.008 for the sphericity, 0.028 for the symmetry and 0.037 for the aspect ratio. The decile values of PBF-LB/M_20-53 and PBF-EB/M_45-106 are within an around 10 % deviation from the PSDs stated in the supplier’s powder certificates. The Ti64_20-100 has with 80.7 µm a deviation of around 20 % of the D90 value.
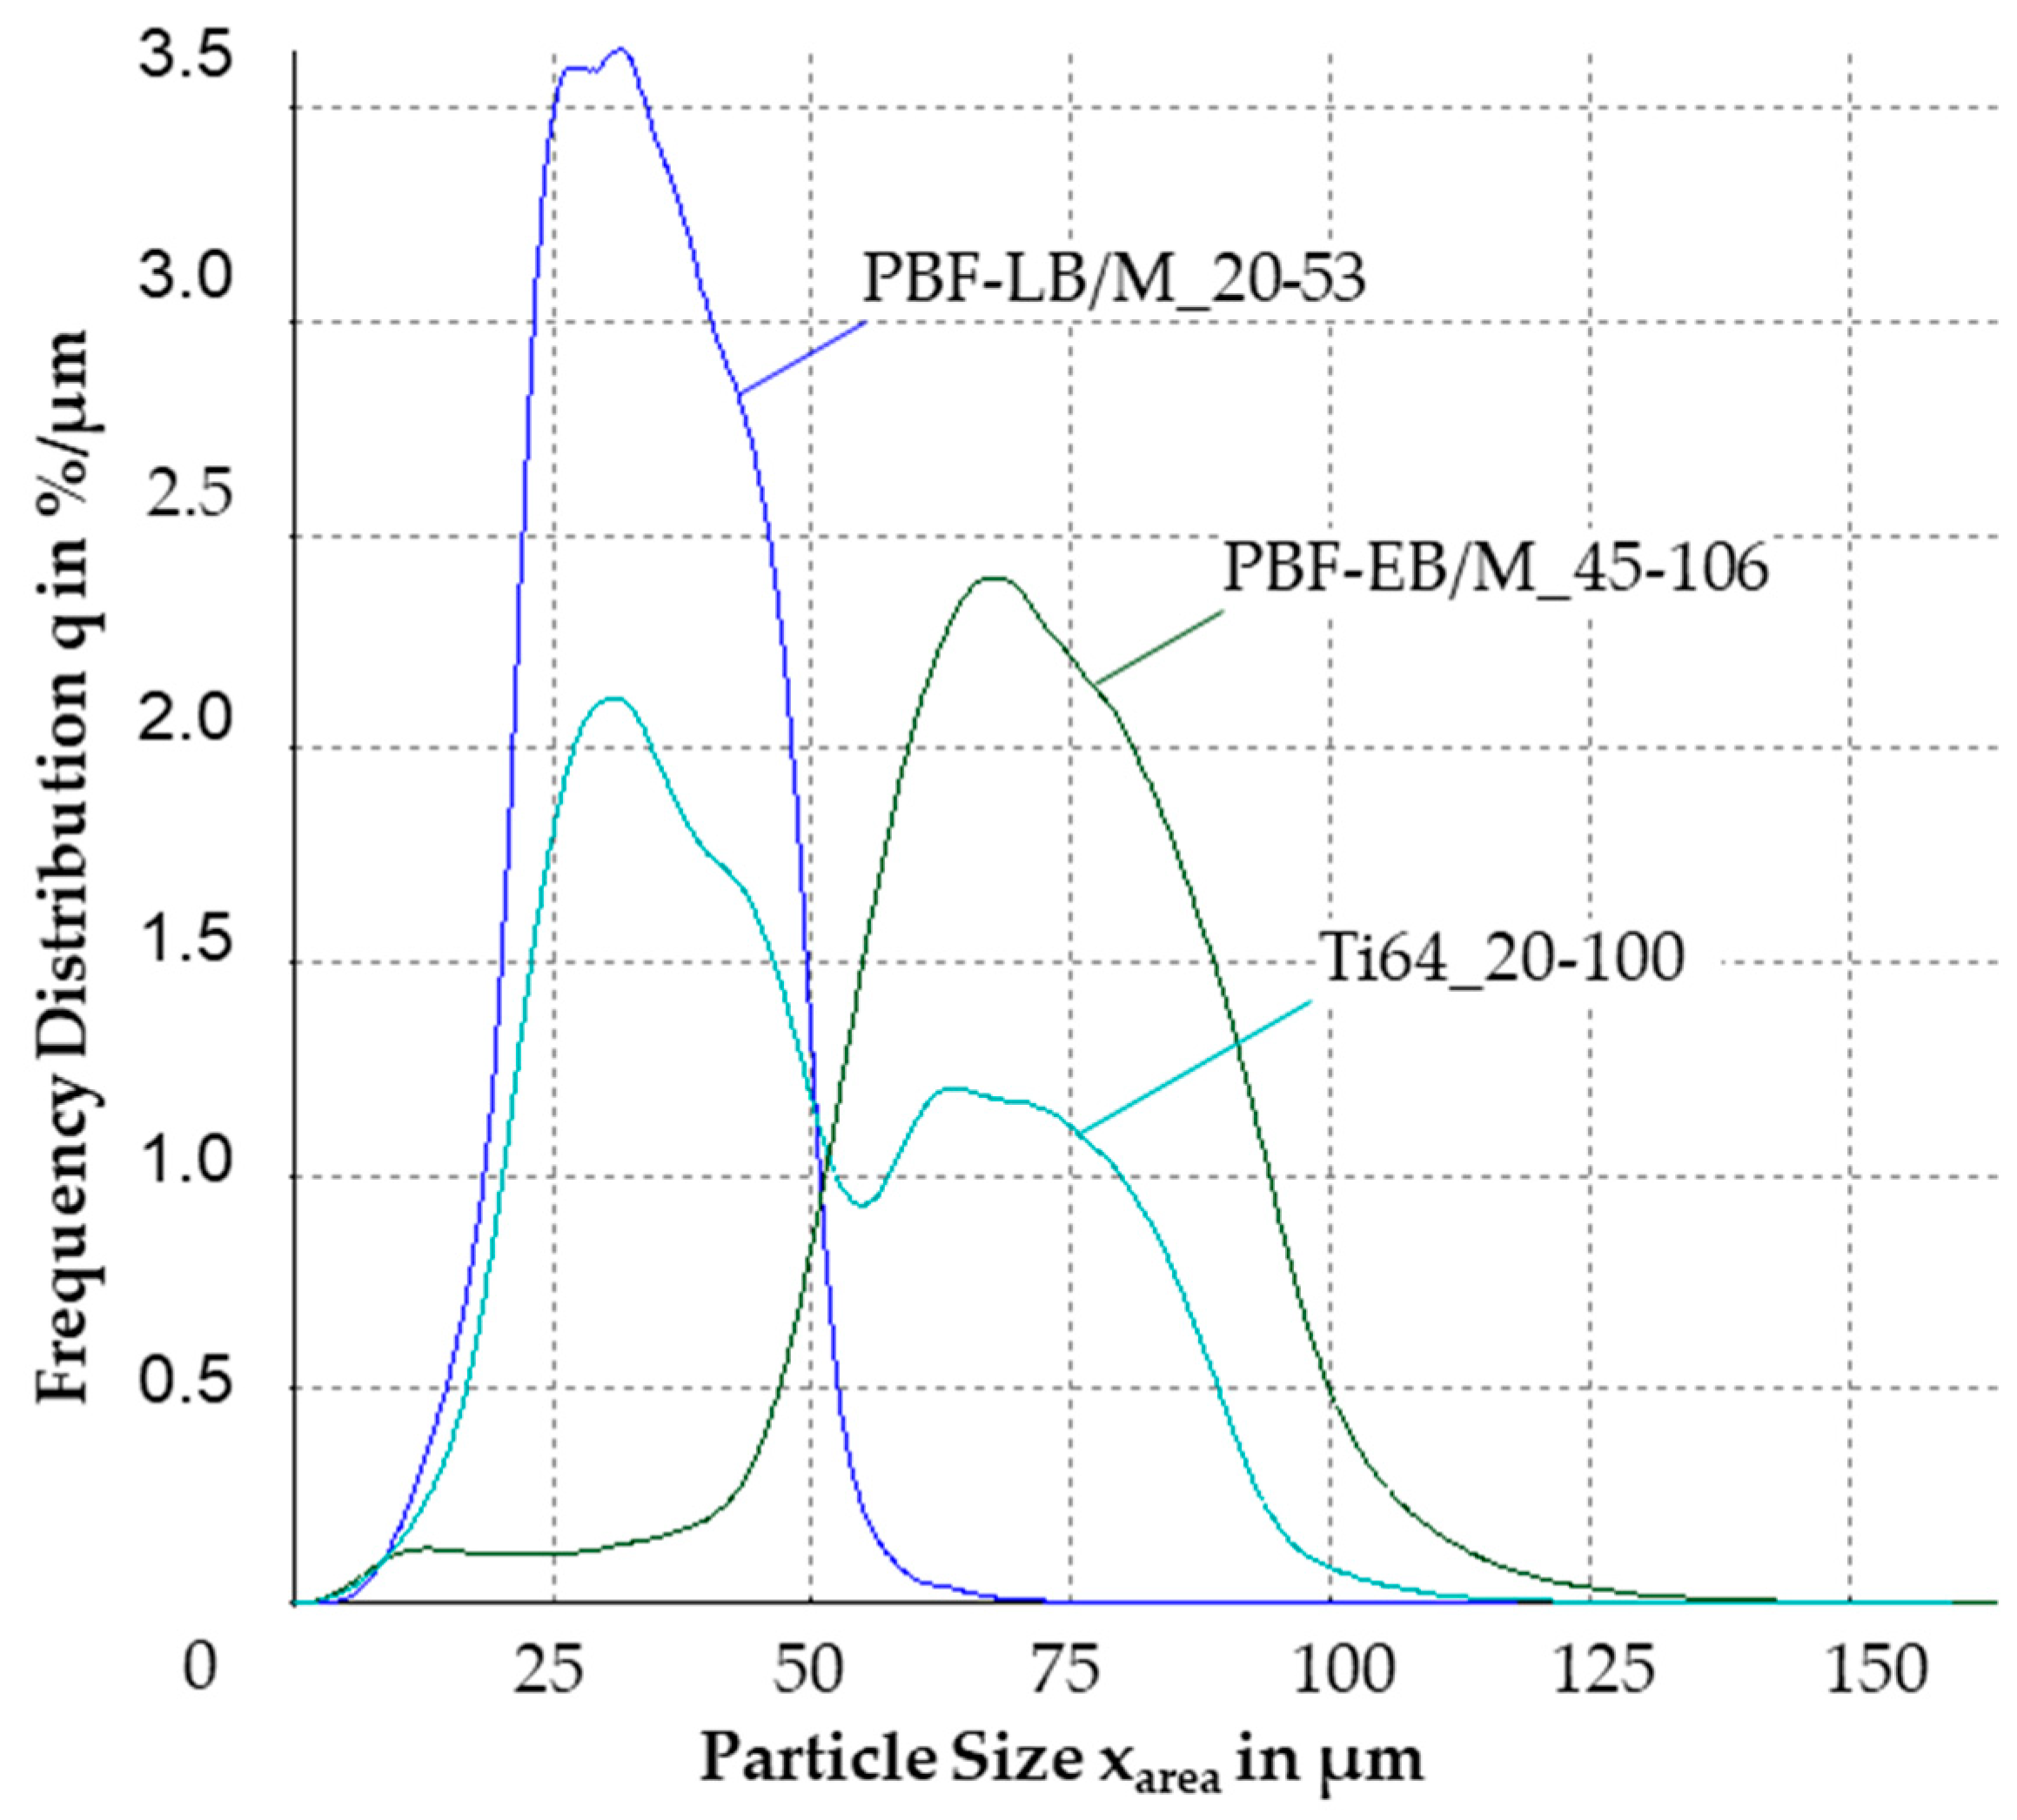
The frequency distribution is exhibited in
Figure 4. Both, PBF-LB/M_20-53 and PBF-EB/M_45-106 show a gaussian-shape distribution. Ti64_20-100 has a bimodular distribution, with two peaks around the modal values of the other two powders.
In
Table 3, the chemical composition of the PBF-LB/M and PBF-EB/M powders is compared to the ELI-standard. No relevant influence of the blending procedure on the chemical composition is expected, therefore the Ti64_20-100 is not analyzed.
The flowability measured with the Hall-funnel is exhibited for all three powders in
Table 4 with highest flowability highlighted in green and lowest in red. PBF-EB/M demonstrates a lower apparent and tapped density as the other two powders. There is a small deviation in the Hausner ratios of max. 0.04 from PBF-LB/M_20-53 to Ti64_20-100. The Hall-Flowability of PBF-EB/M_45-106 is higher than the other two powders at 25.2 s/50g, although PBF-LB/M_20-53 was not free-flowing and additional tapping was required. The relative humidity is measured at each test-day and converted into the absolute humidity.
In
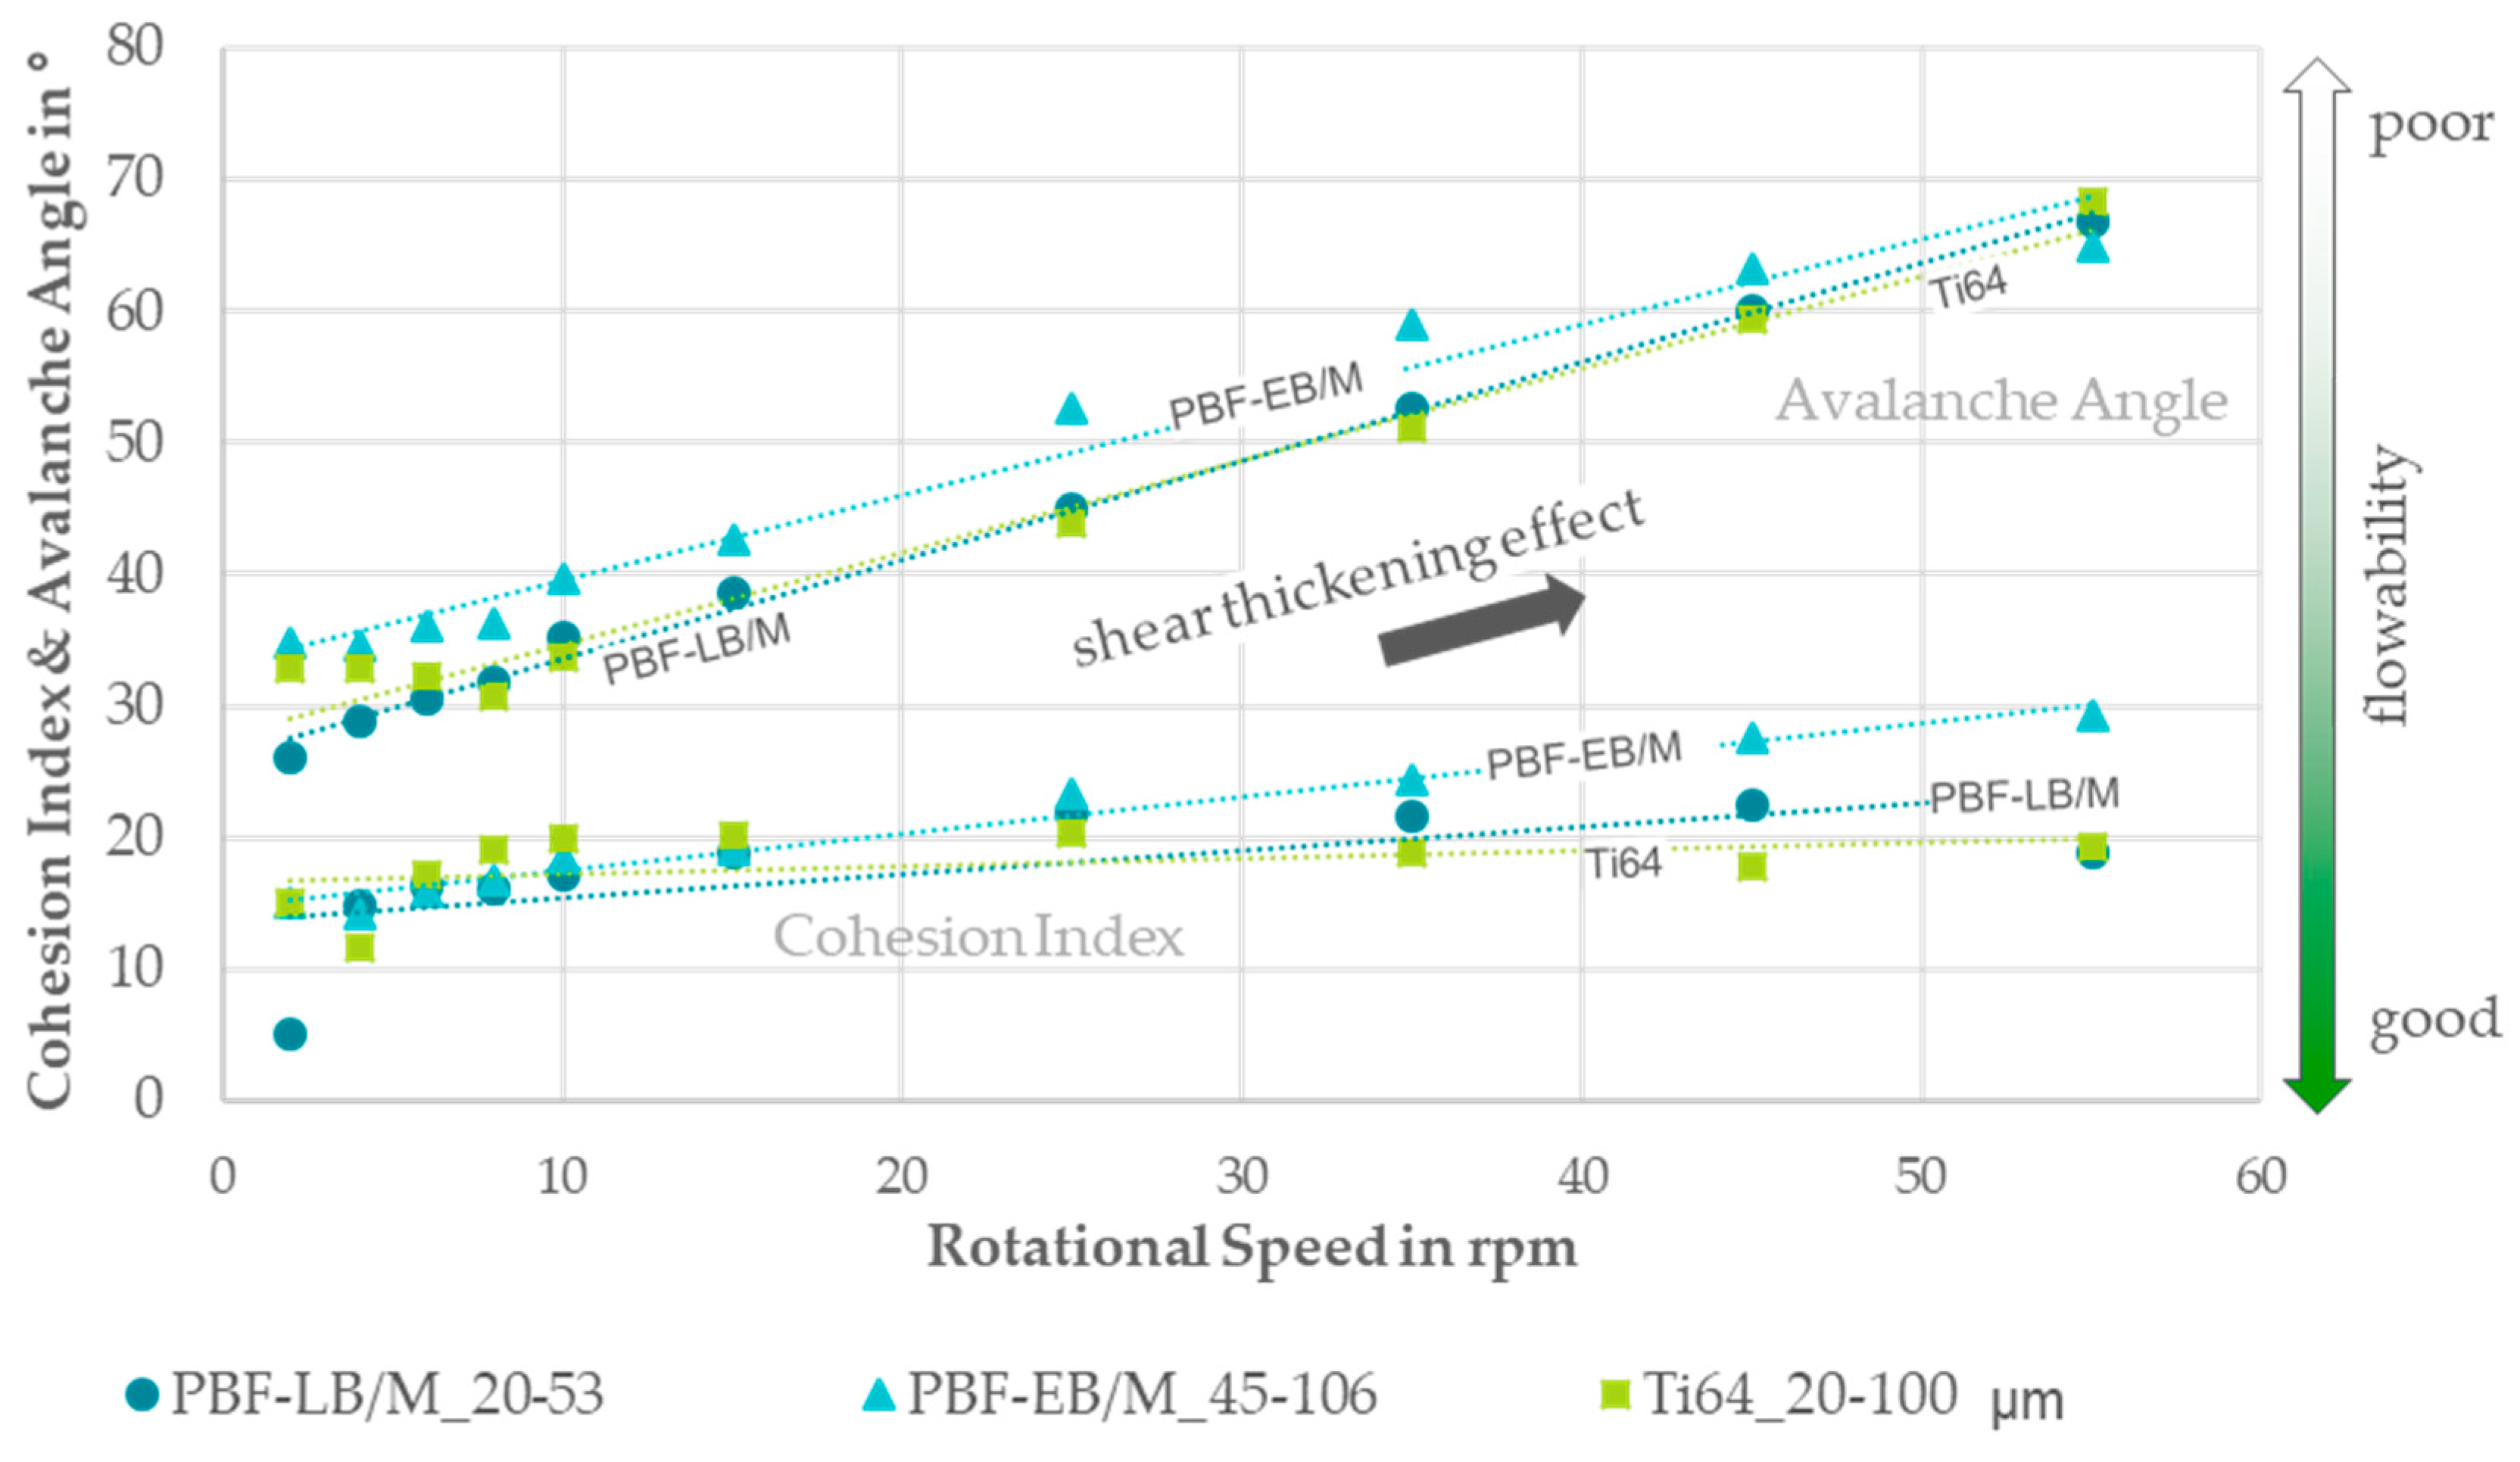
Figure 5, the avalanche angles and cohesion indices are posed for the increasing rotational speed for all three powders. The curve progression is similar increasing for all powders. The PBF-EB/M_45-106 powder has higher values compared to the other two almost identical powders.
3.2. PBF-LB/M Process
Table 5 provides an overview of the variation range per parameter and how many cycles are needed to reach the desired 99.9 % of relative density.
In the two bottom lines, the volume energy and build rate are presented from the final parameter combination used for the mechanical specimens build job. The final parameter combination for PBF-EB/M_45-106 and Ti64_20-100 is the same, which is why the volume energy and build rate are similar too. They differ from the PBF-LB/M_20-53 parameter combination with a 0.05 mm smaller hatch distance, 10 W higher laser powder and 300 mm/s slower scanning speed.
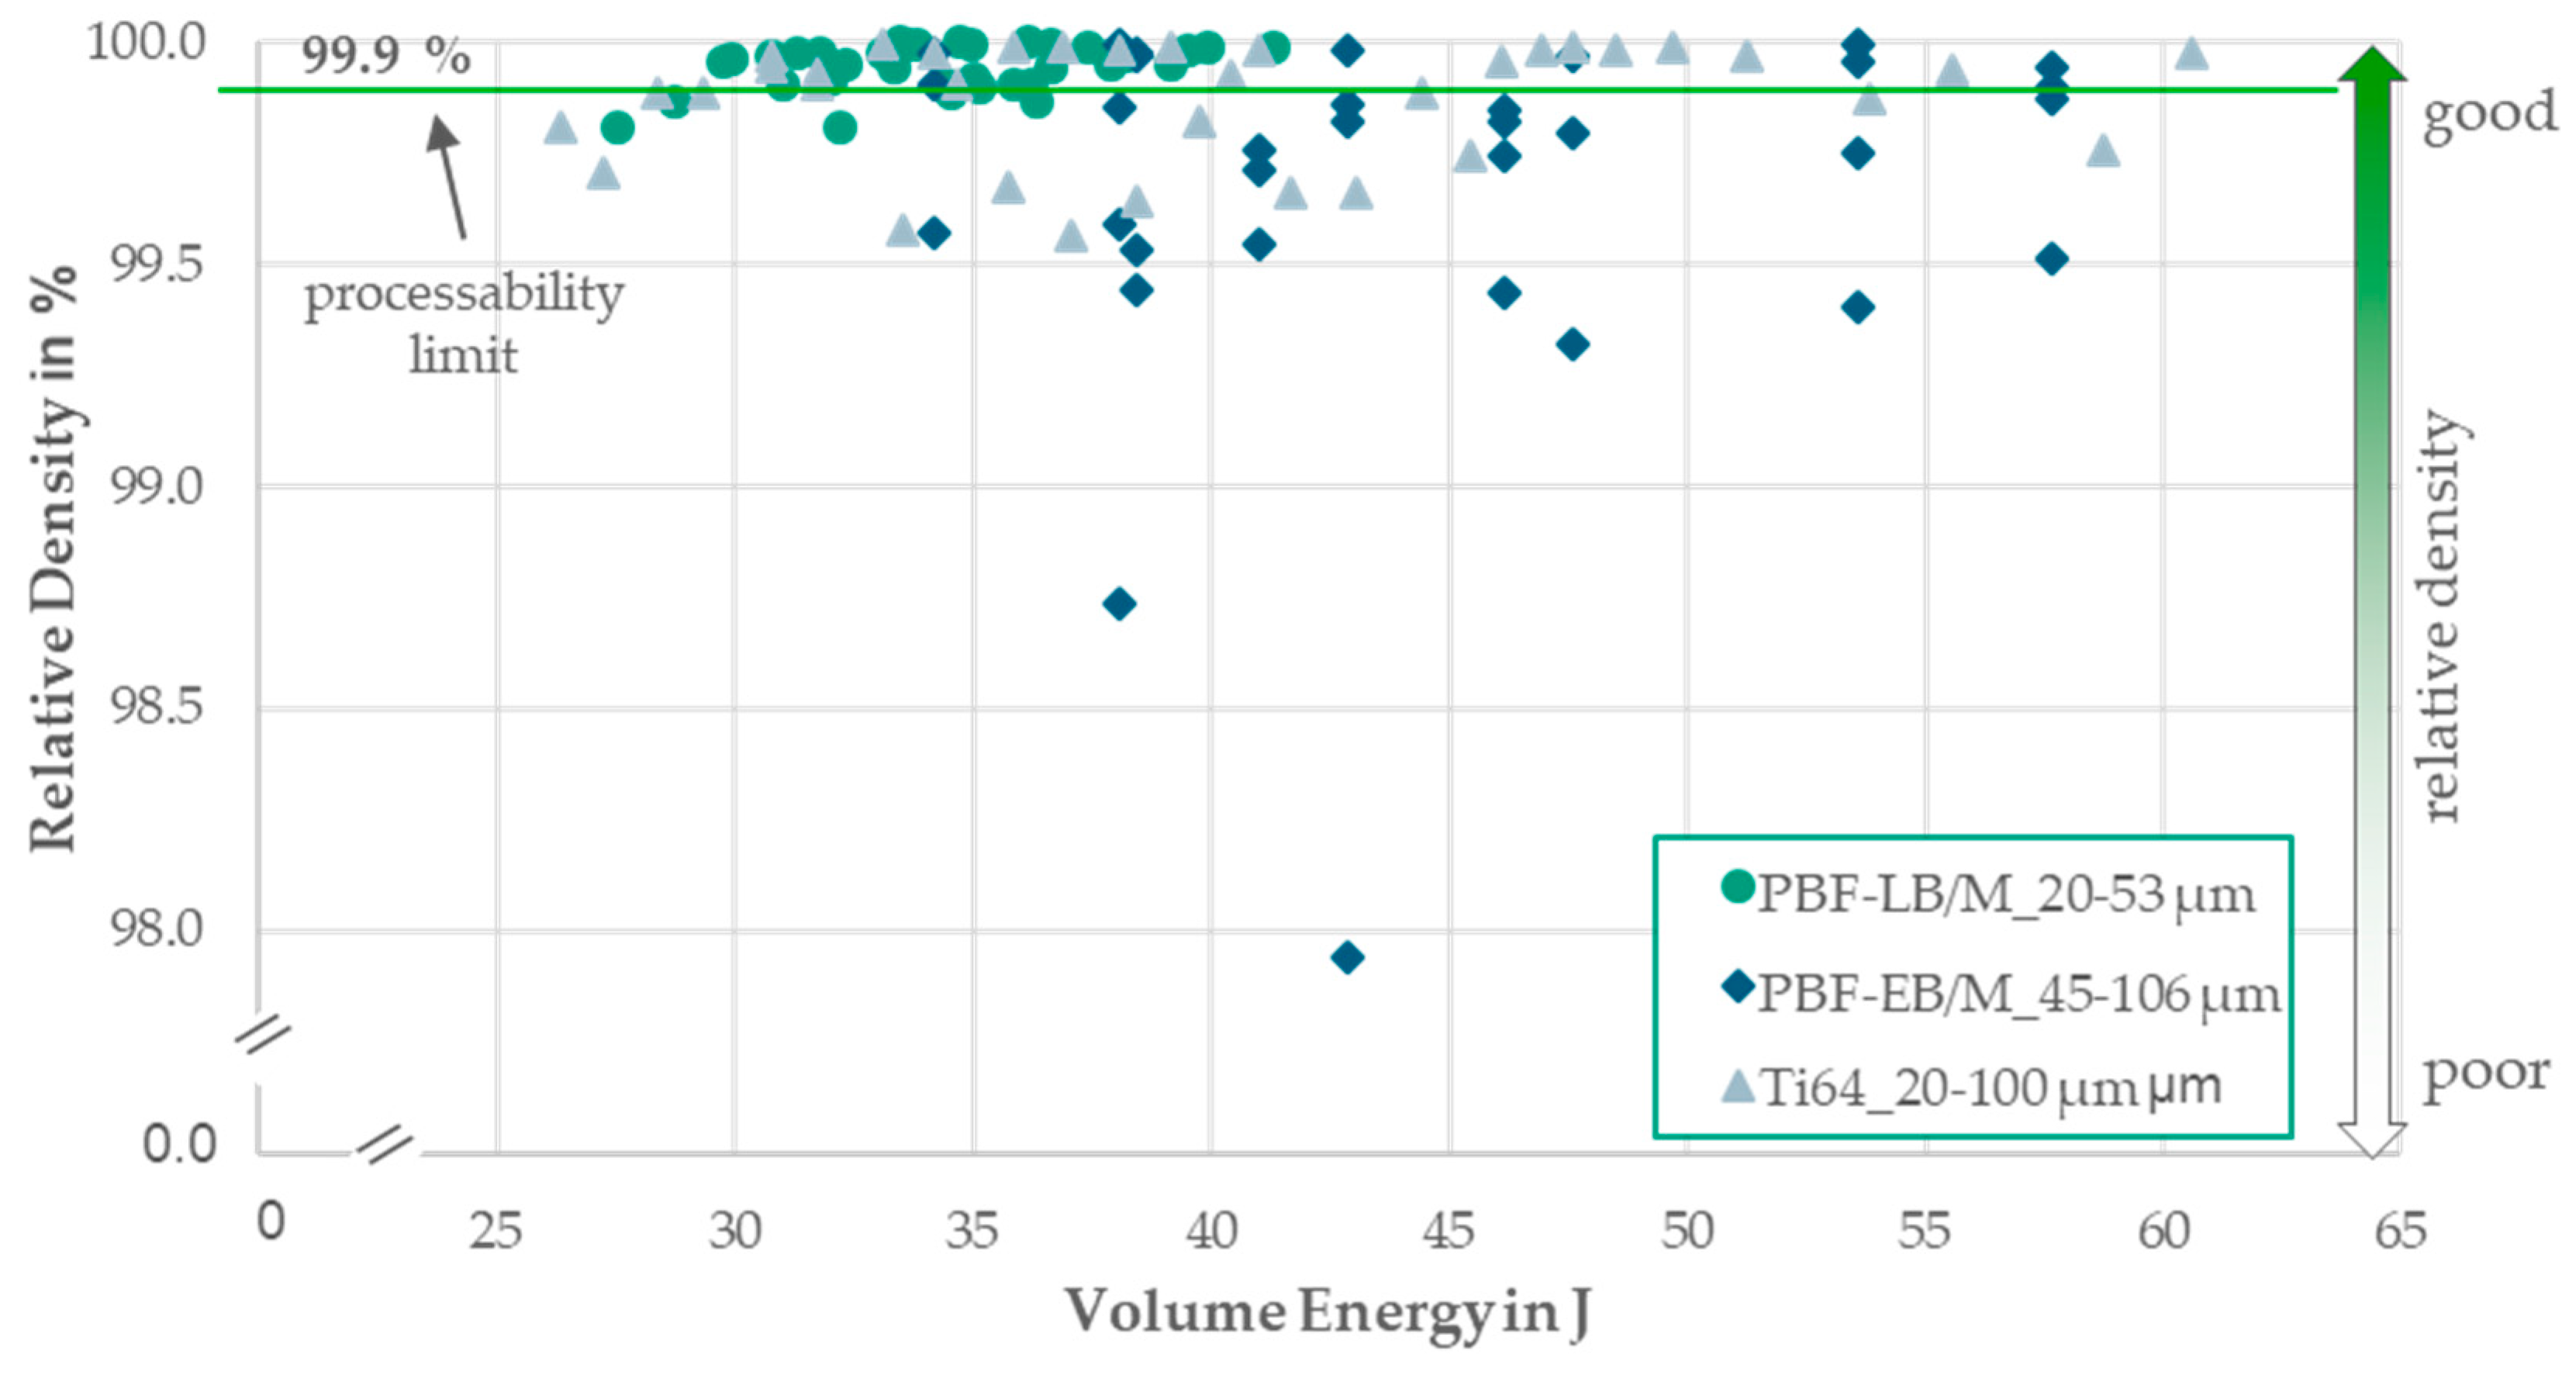
The reached densities per parameter combination are displayed in
Figure 6, for the relative density per volume energy. All powders could be processed to a cube with densities above 99.9 %. The PBF-LB/M_20-53 powder has the most specimens with a relative density >99.9 %. The blended Ti64_20-100 powder shows high densities over a wide volume energy range from 30-60 J, albeit some values drop. Although some values of the PBF-EB/M_46-106 powder achieve high densities, no clear process window can be recognized. Processability is evident for all three powders.
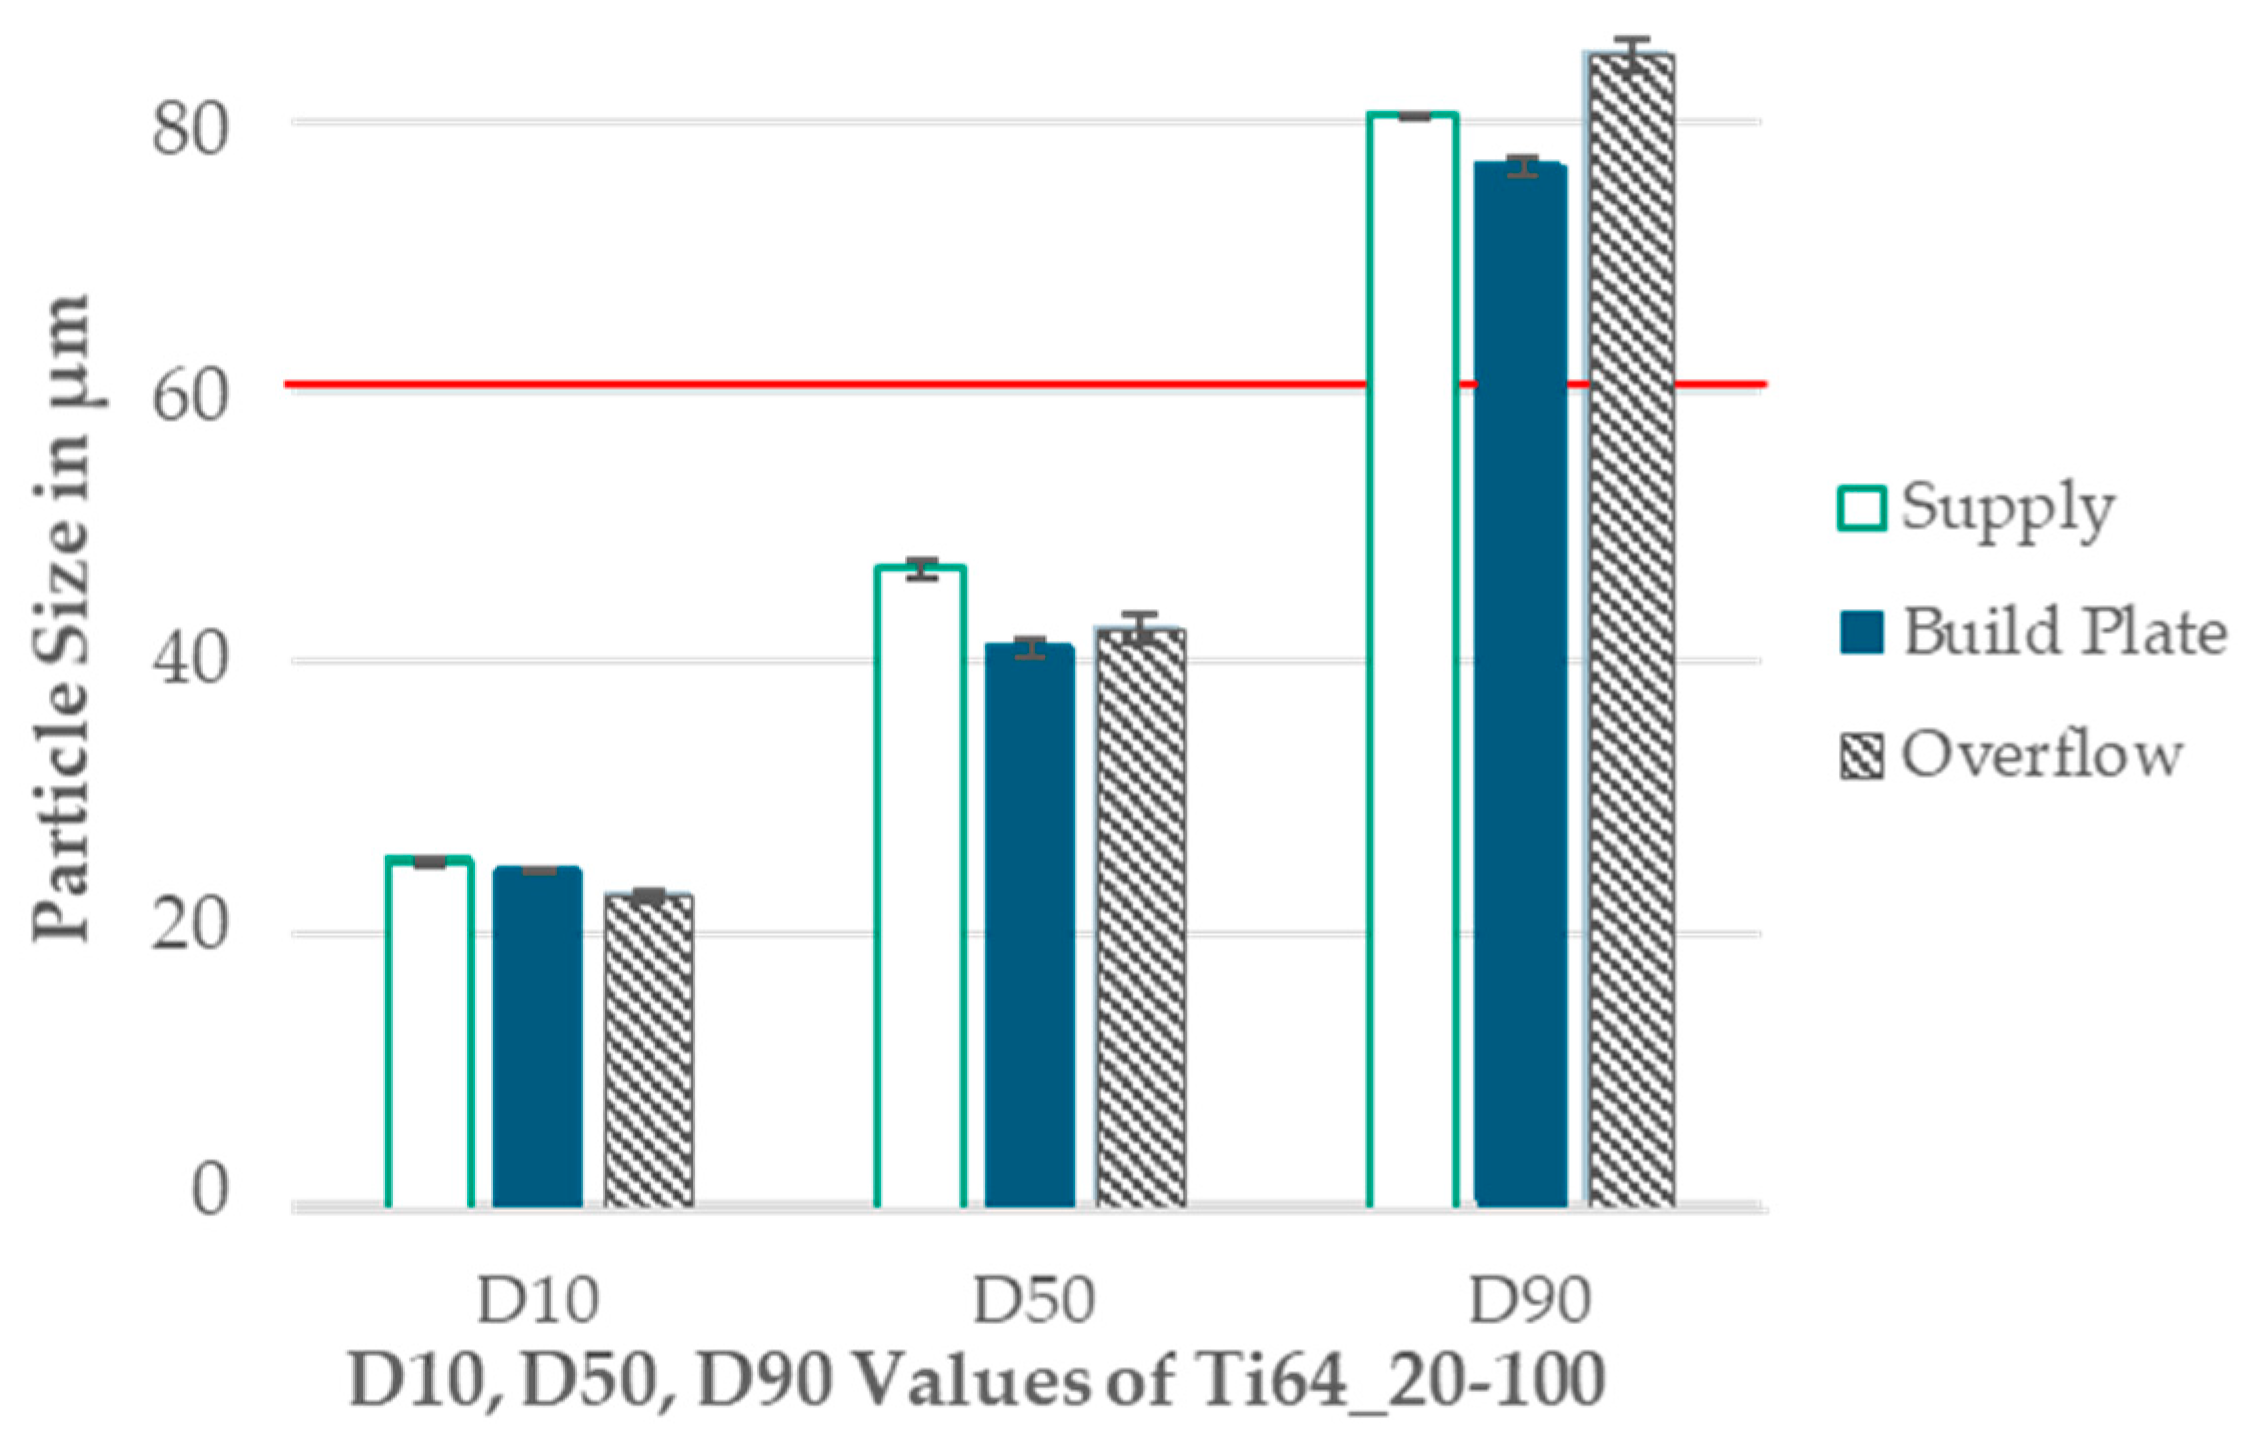
The powder application is tested for the wide PSD of 20-100 µm to cover the full investigated PSD range. The results are presented in a column diagram in
Figure 7. A slight decrease of around 1-5 µm from the supply to the build plate is recognizable for D10, D50 and D90. The overflow shows a coarsening for D50 compared to the build plate of 1 µm. For D90, there is a coarsening of 5 µm compared to the supply and of 8 µm to the build plate. Though D10 further declines in the overflow.
3.3. Mechanical Properties
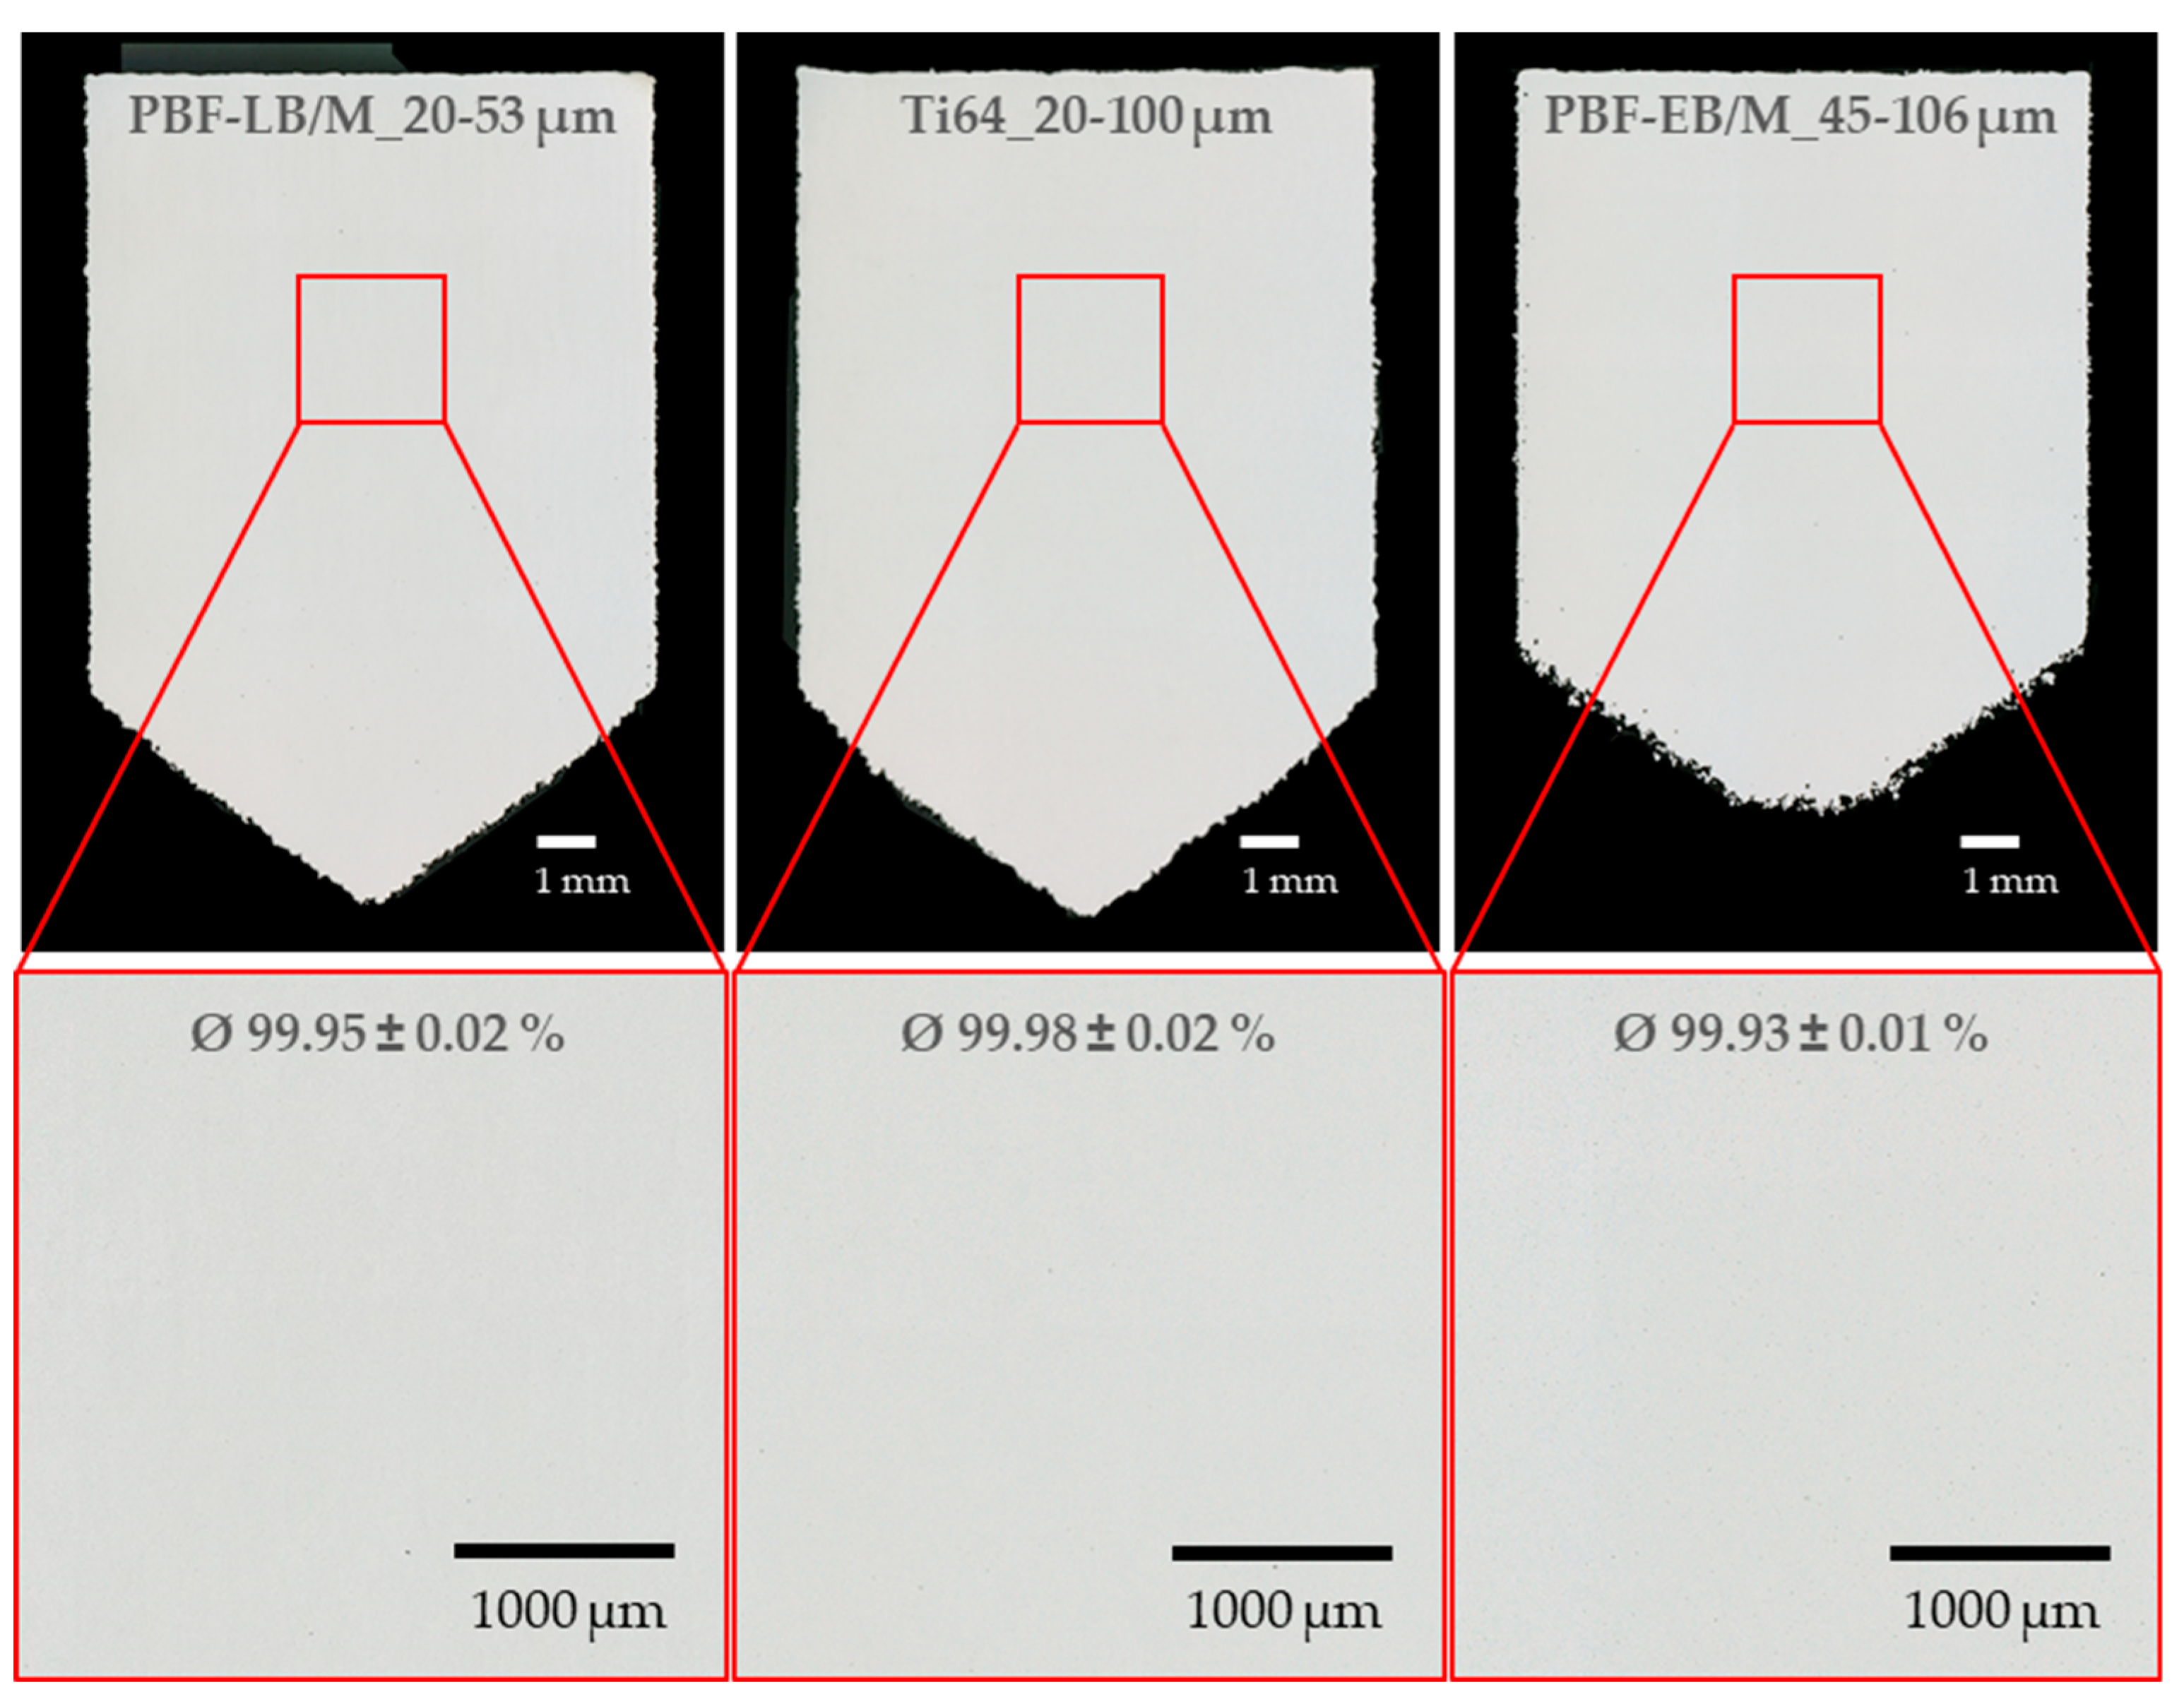
All three powders could be processed to cubes with densities above 99.9 % with low standard deviation of max. 0.02 %. Almost no pores can be detected, which is shown on exemplary specimens for each powder in
Figure 8.
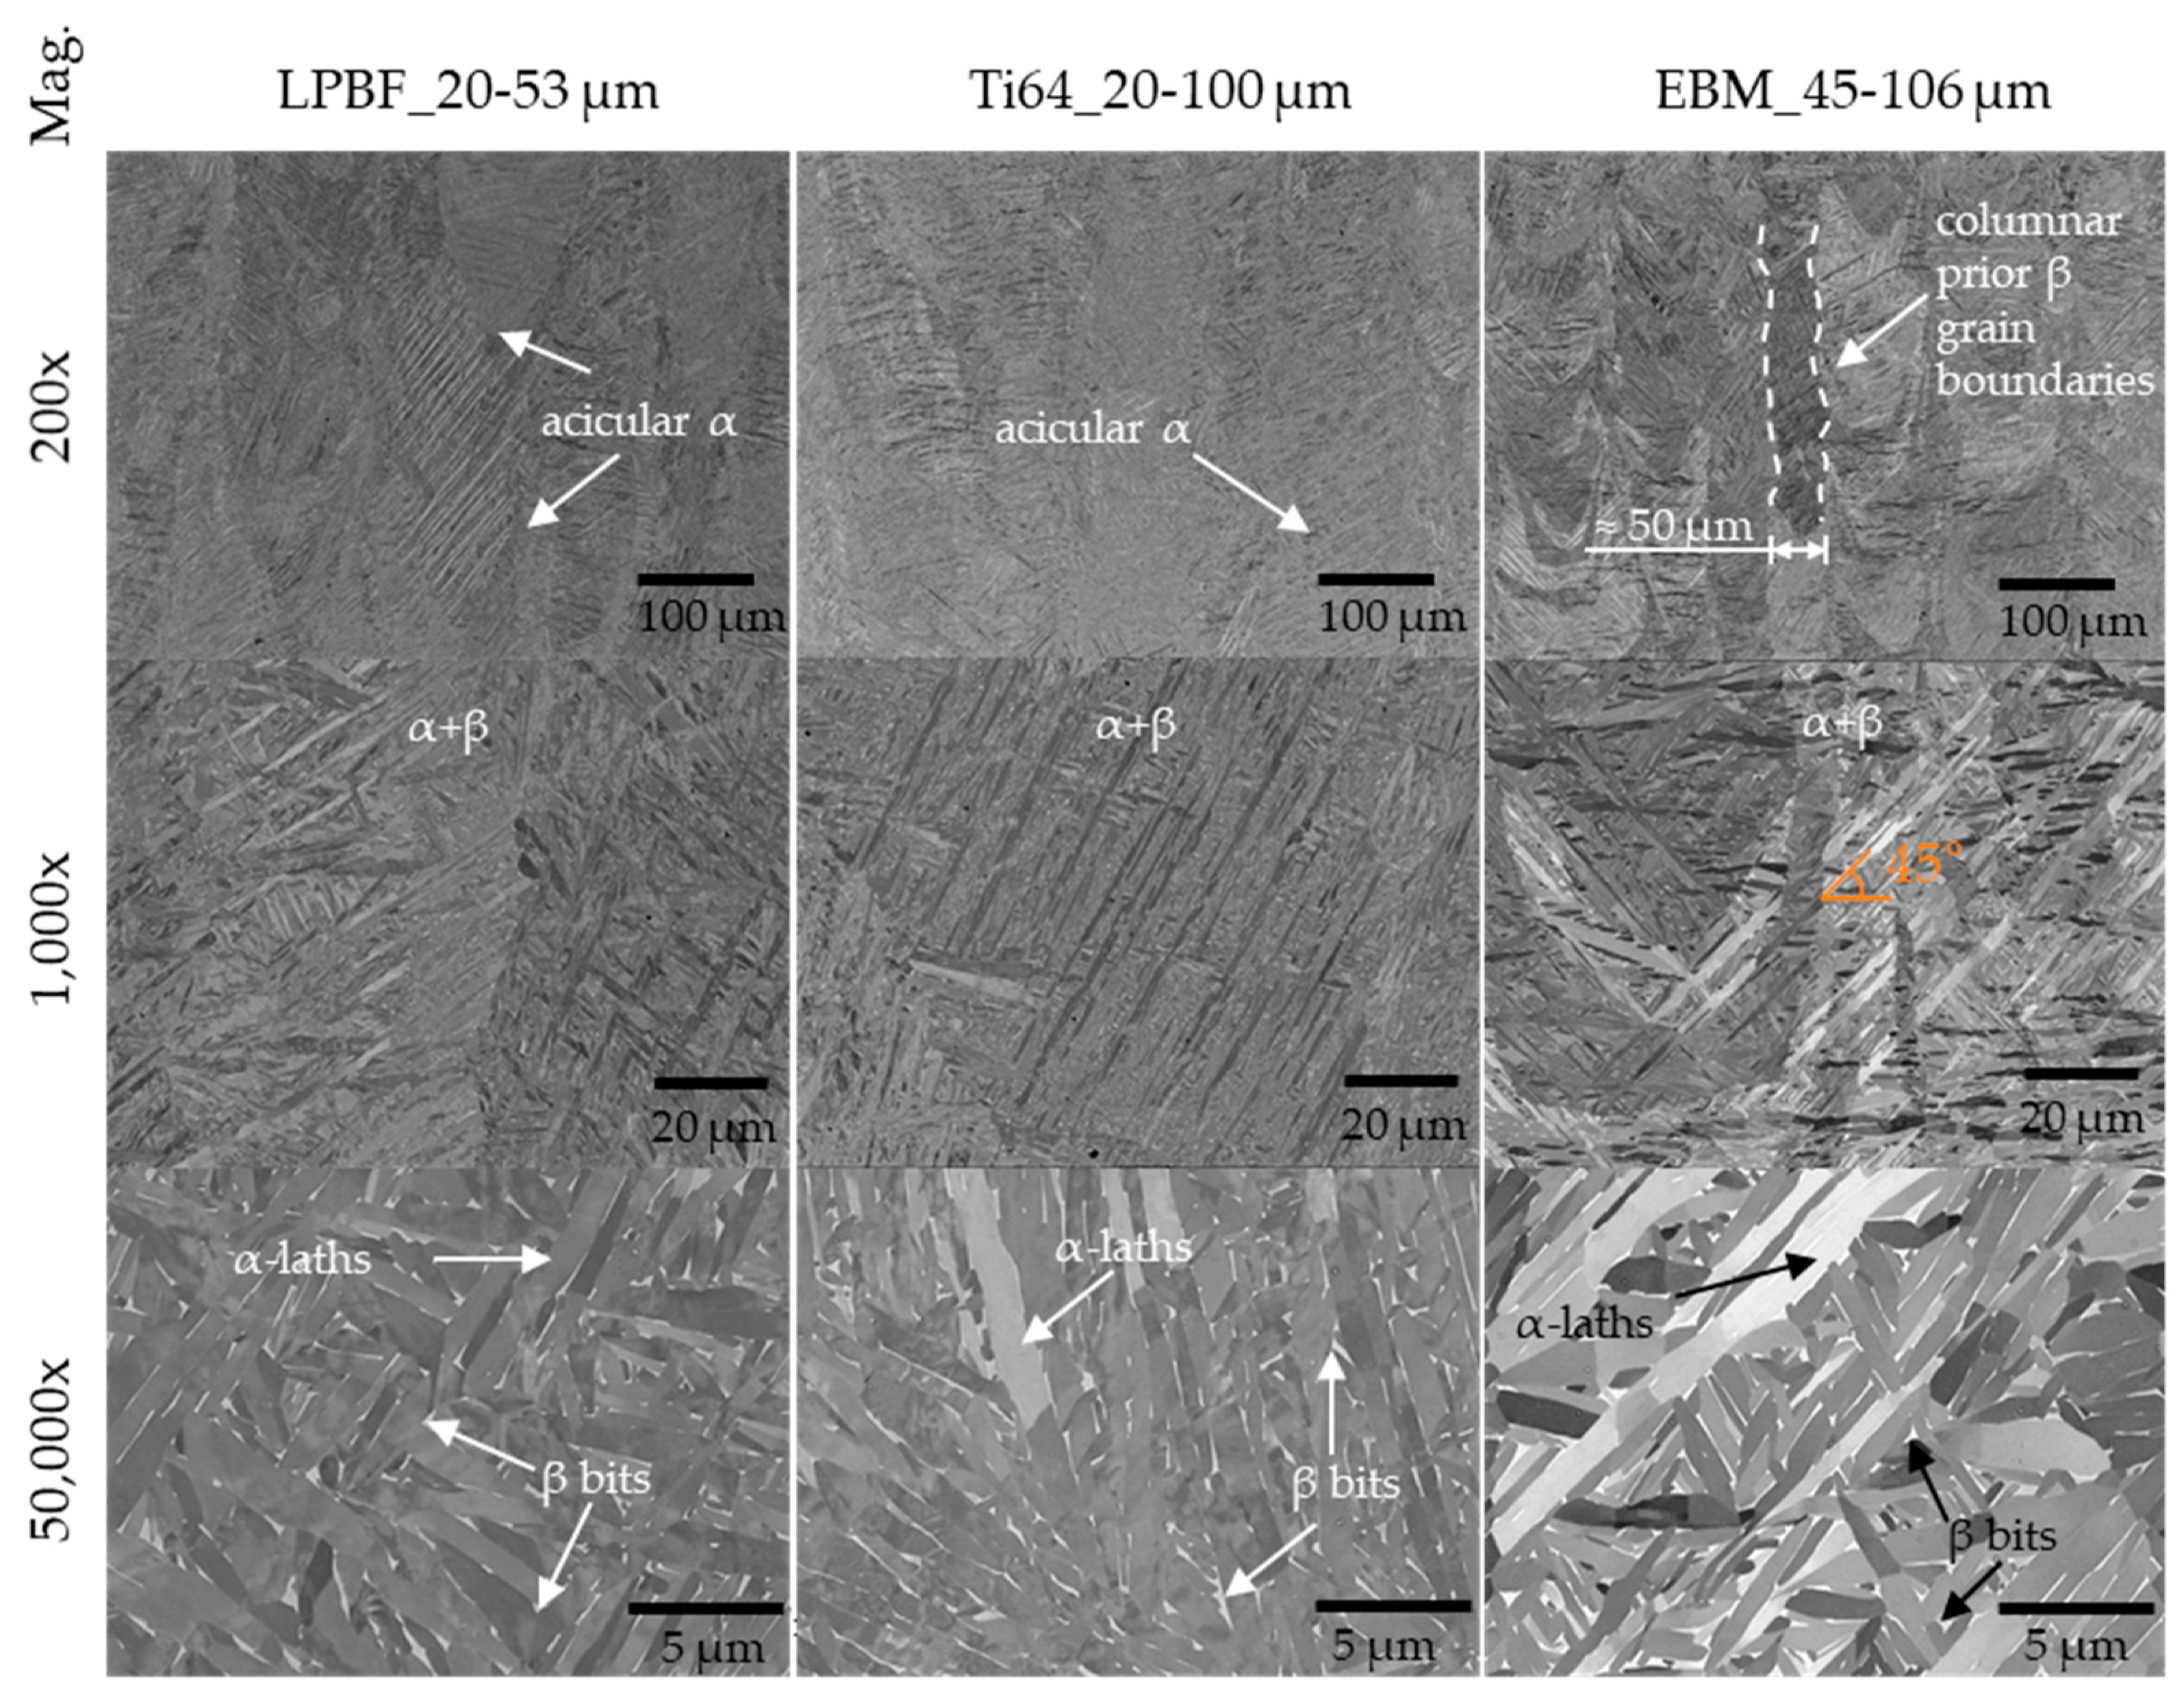
The microstructure of the specimens is exemplary analyzed, which is shown in
Figure 9. The microstructure exhibits similar columnar prior β-grain boundaries partially filled with acicular α-structures. At 50.000x magnification, white β-bits are visible.
With all three powder, Vickers hardness in the range of industry-standards 305-345 HV10 could be reached. The industry standard is highlighted with a green bar in
Figure 10. The PBF-LB/M_20-53 µm has the lowest hardness with 322.4 HV10 and the wide distribution of Ti64_20-100 the highest standard deviation of 9.7.
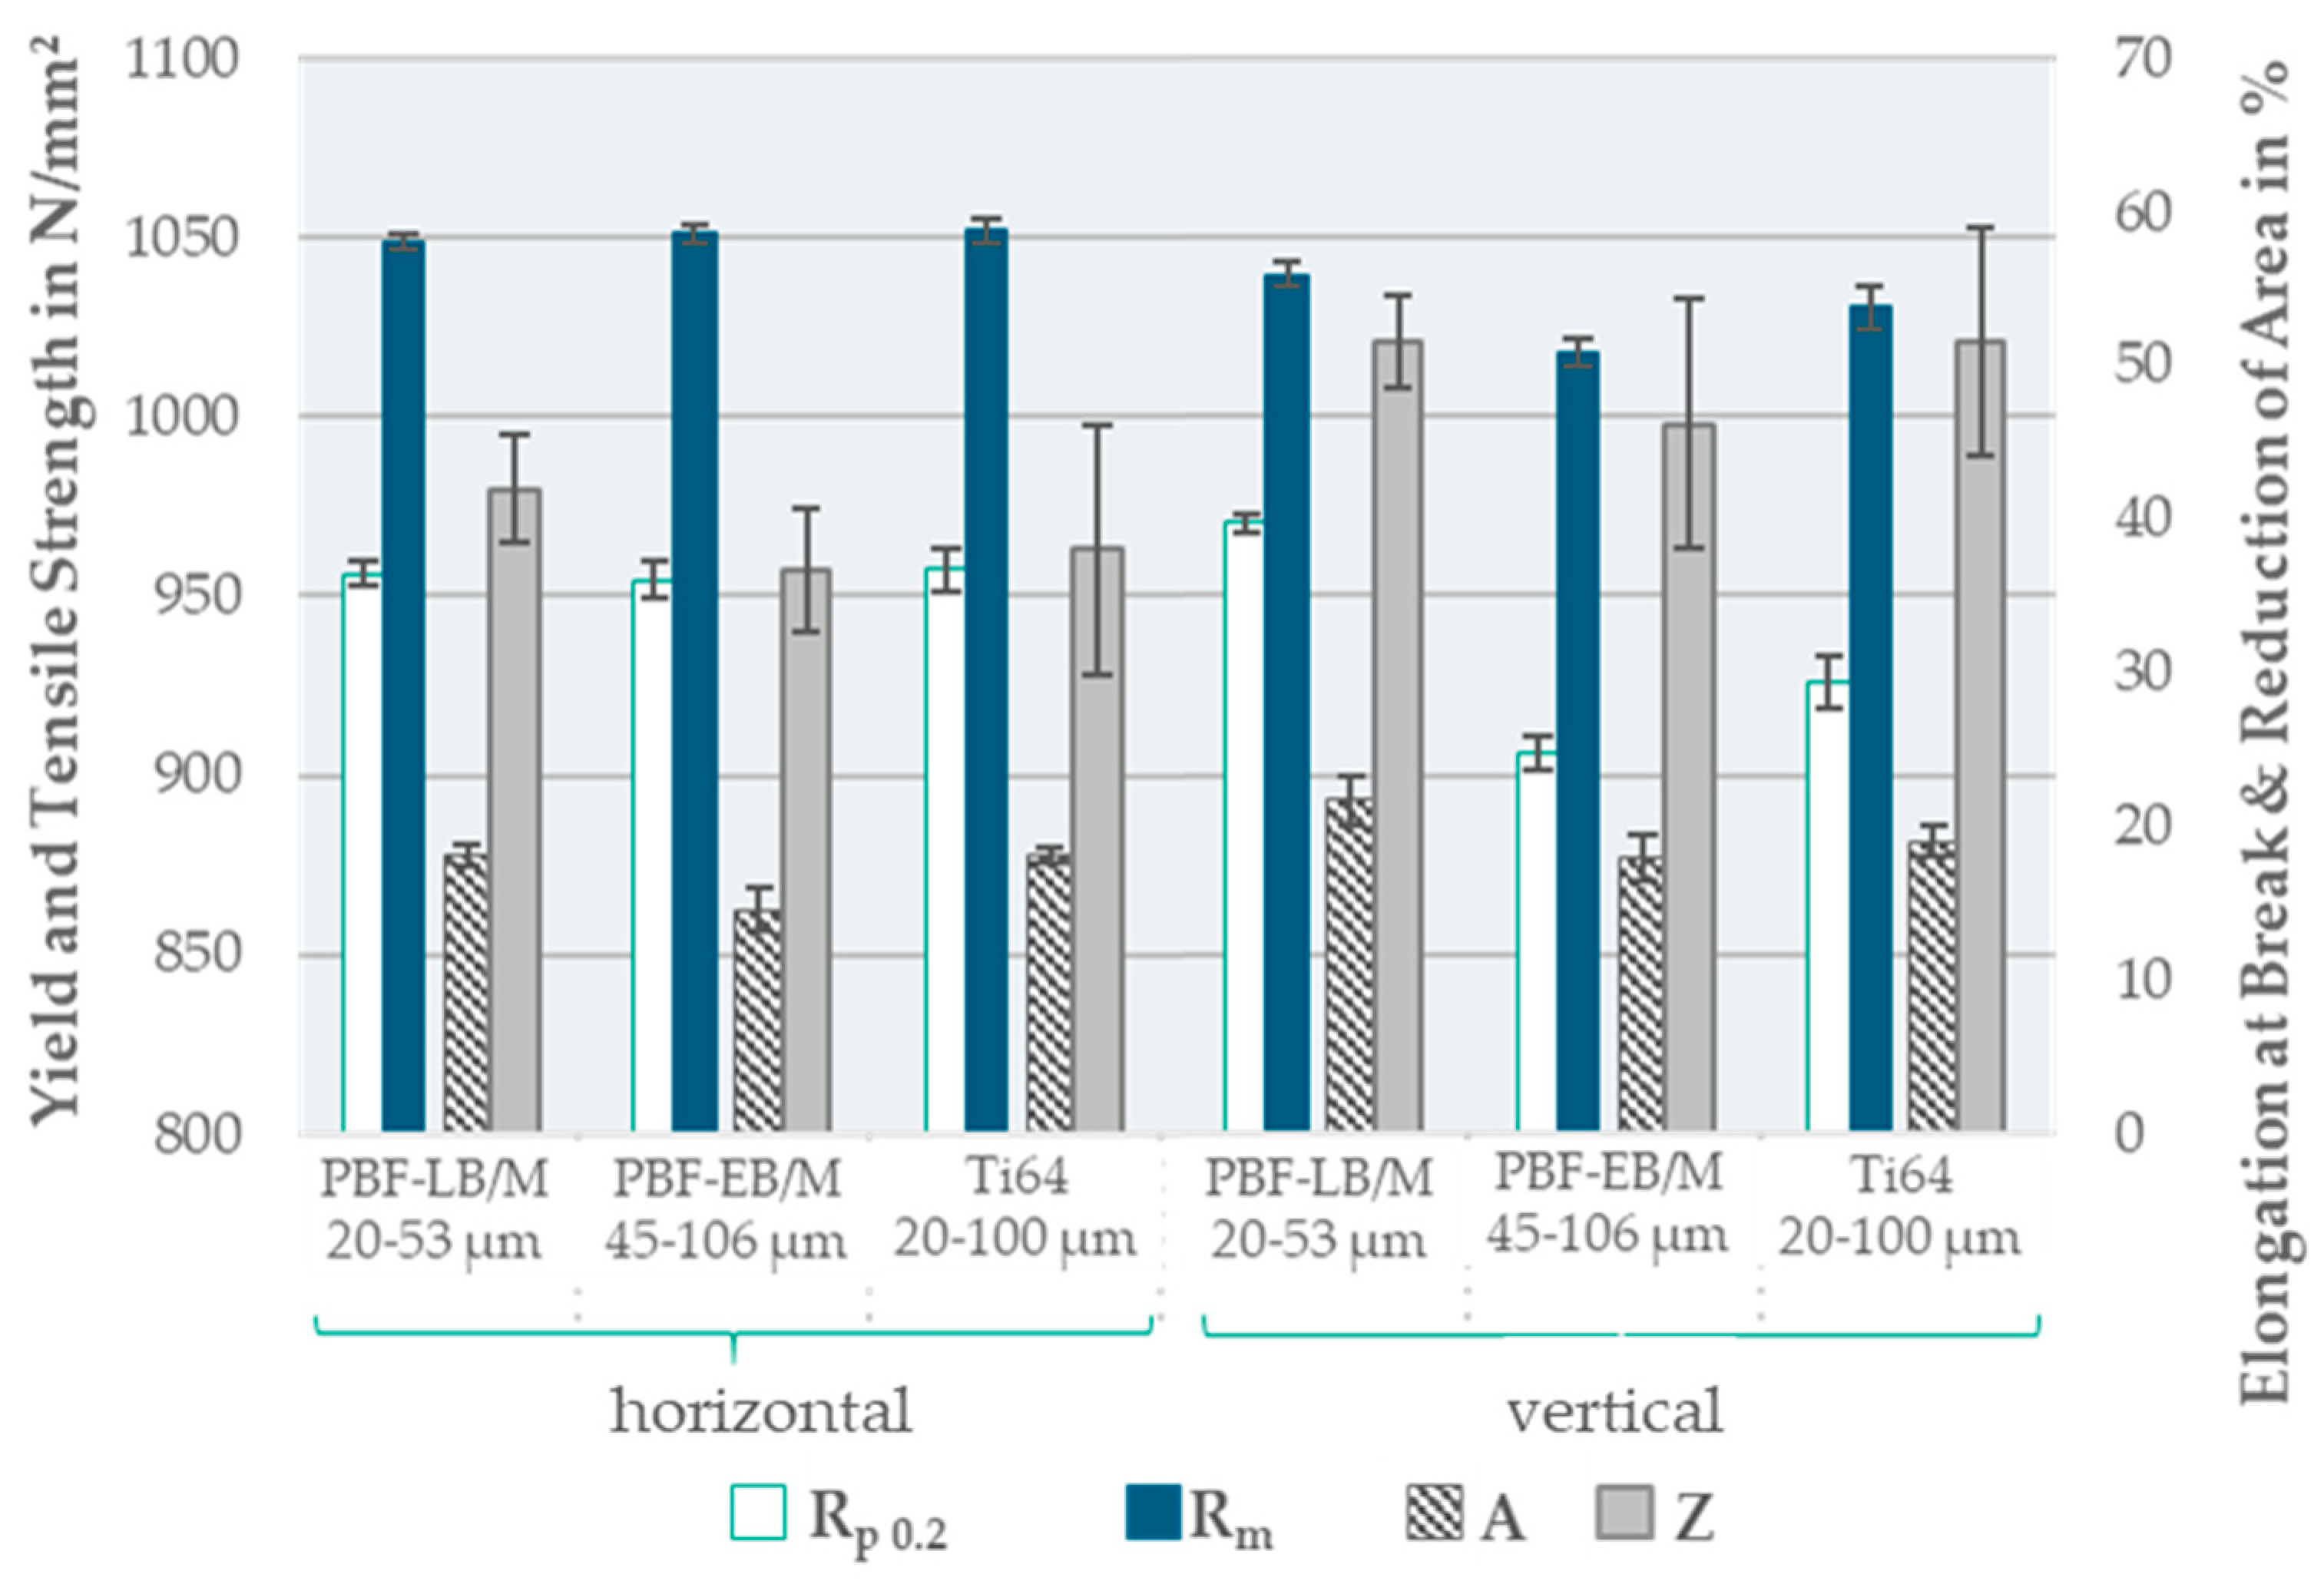
The results of the tensile tests are demonstrated in
Figure 11 and are in the limits of the industry values presented in
Table 1. In horizontal orientation, the results for tensile strength and yield strength are similar for all three powders. PBF-LB/M_20-53 and Ti64_20-100 have a similar elongation, which is 4 percentage points higher than the PBF-EB/M_45-106 powder. The reduction of area of PBF-EB/M_45-106 is close to the results of Ti64_20-100 and both reach around 4-6 % lower reduction in area compared to PBF-LB/M_20-53.
The vertical orientation leads to a decrease in strength for PBF-EB/M_45-106 and for Ti64_20-100 by 31 and 48 N/mm². For PBF-LB/M, only the tensile strength is reduced by 10 N/mm², the yield strength is increased by 14 N/mm². The elongation as well as the reduction of area is enhanced for all three powders by around 10 %, reaching values over 20 % for PBF-LB/M_20-53. In both orientations, the standard deviation of all reduction of area-results is the highest with up to 8 % (PBF-EB/M-vertical and Ti64_20-100-both orientations).
The correlation analysis is visualized in an upper-half correlation matrix in
Figure 12. Positive correlations are observed between the D10, D50, and D90 deciles and avalanche angles and cohesion indices, while negative correlations are noted with apparent and tapped density as well as with the tensile properties. A more regular particle shape appears to reduce the avalanche angle and cohesion index while increasing apparent and tapped density and the tensile properties. Higher avalanche angles and cohesion indices correspond to decreasing relative density and tend to reduce the tensile properties. An increased density correlates positive with the tensile properties in contrast to the hardness, that has a negative correlation with the tensile properties.
3.4. Economics
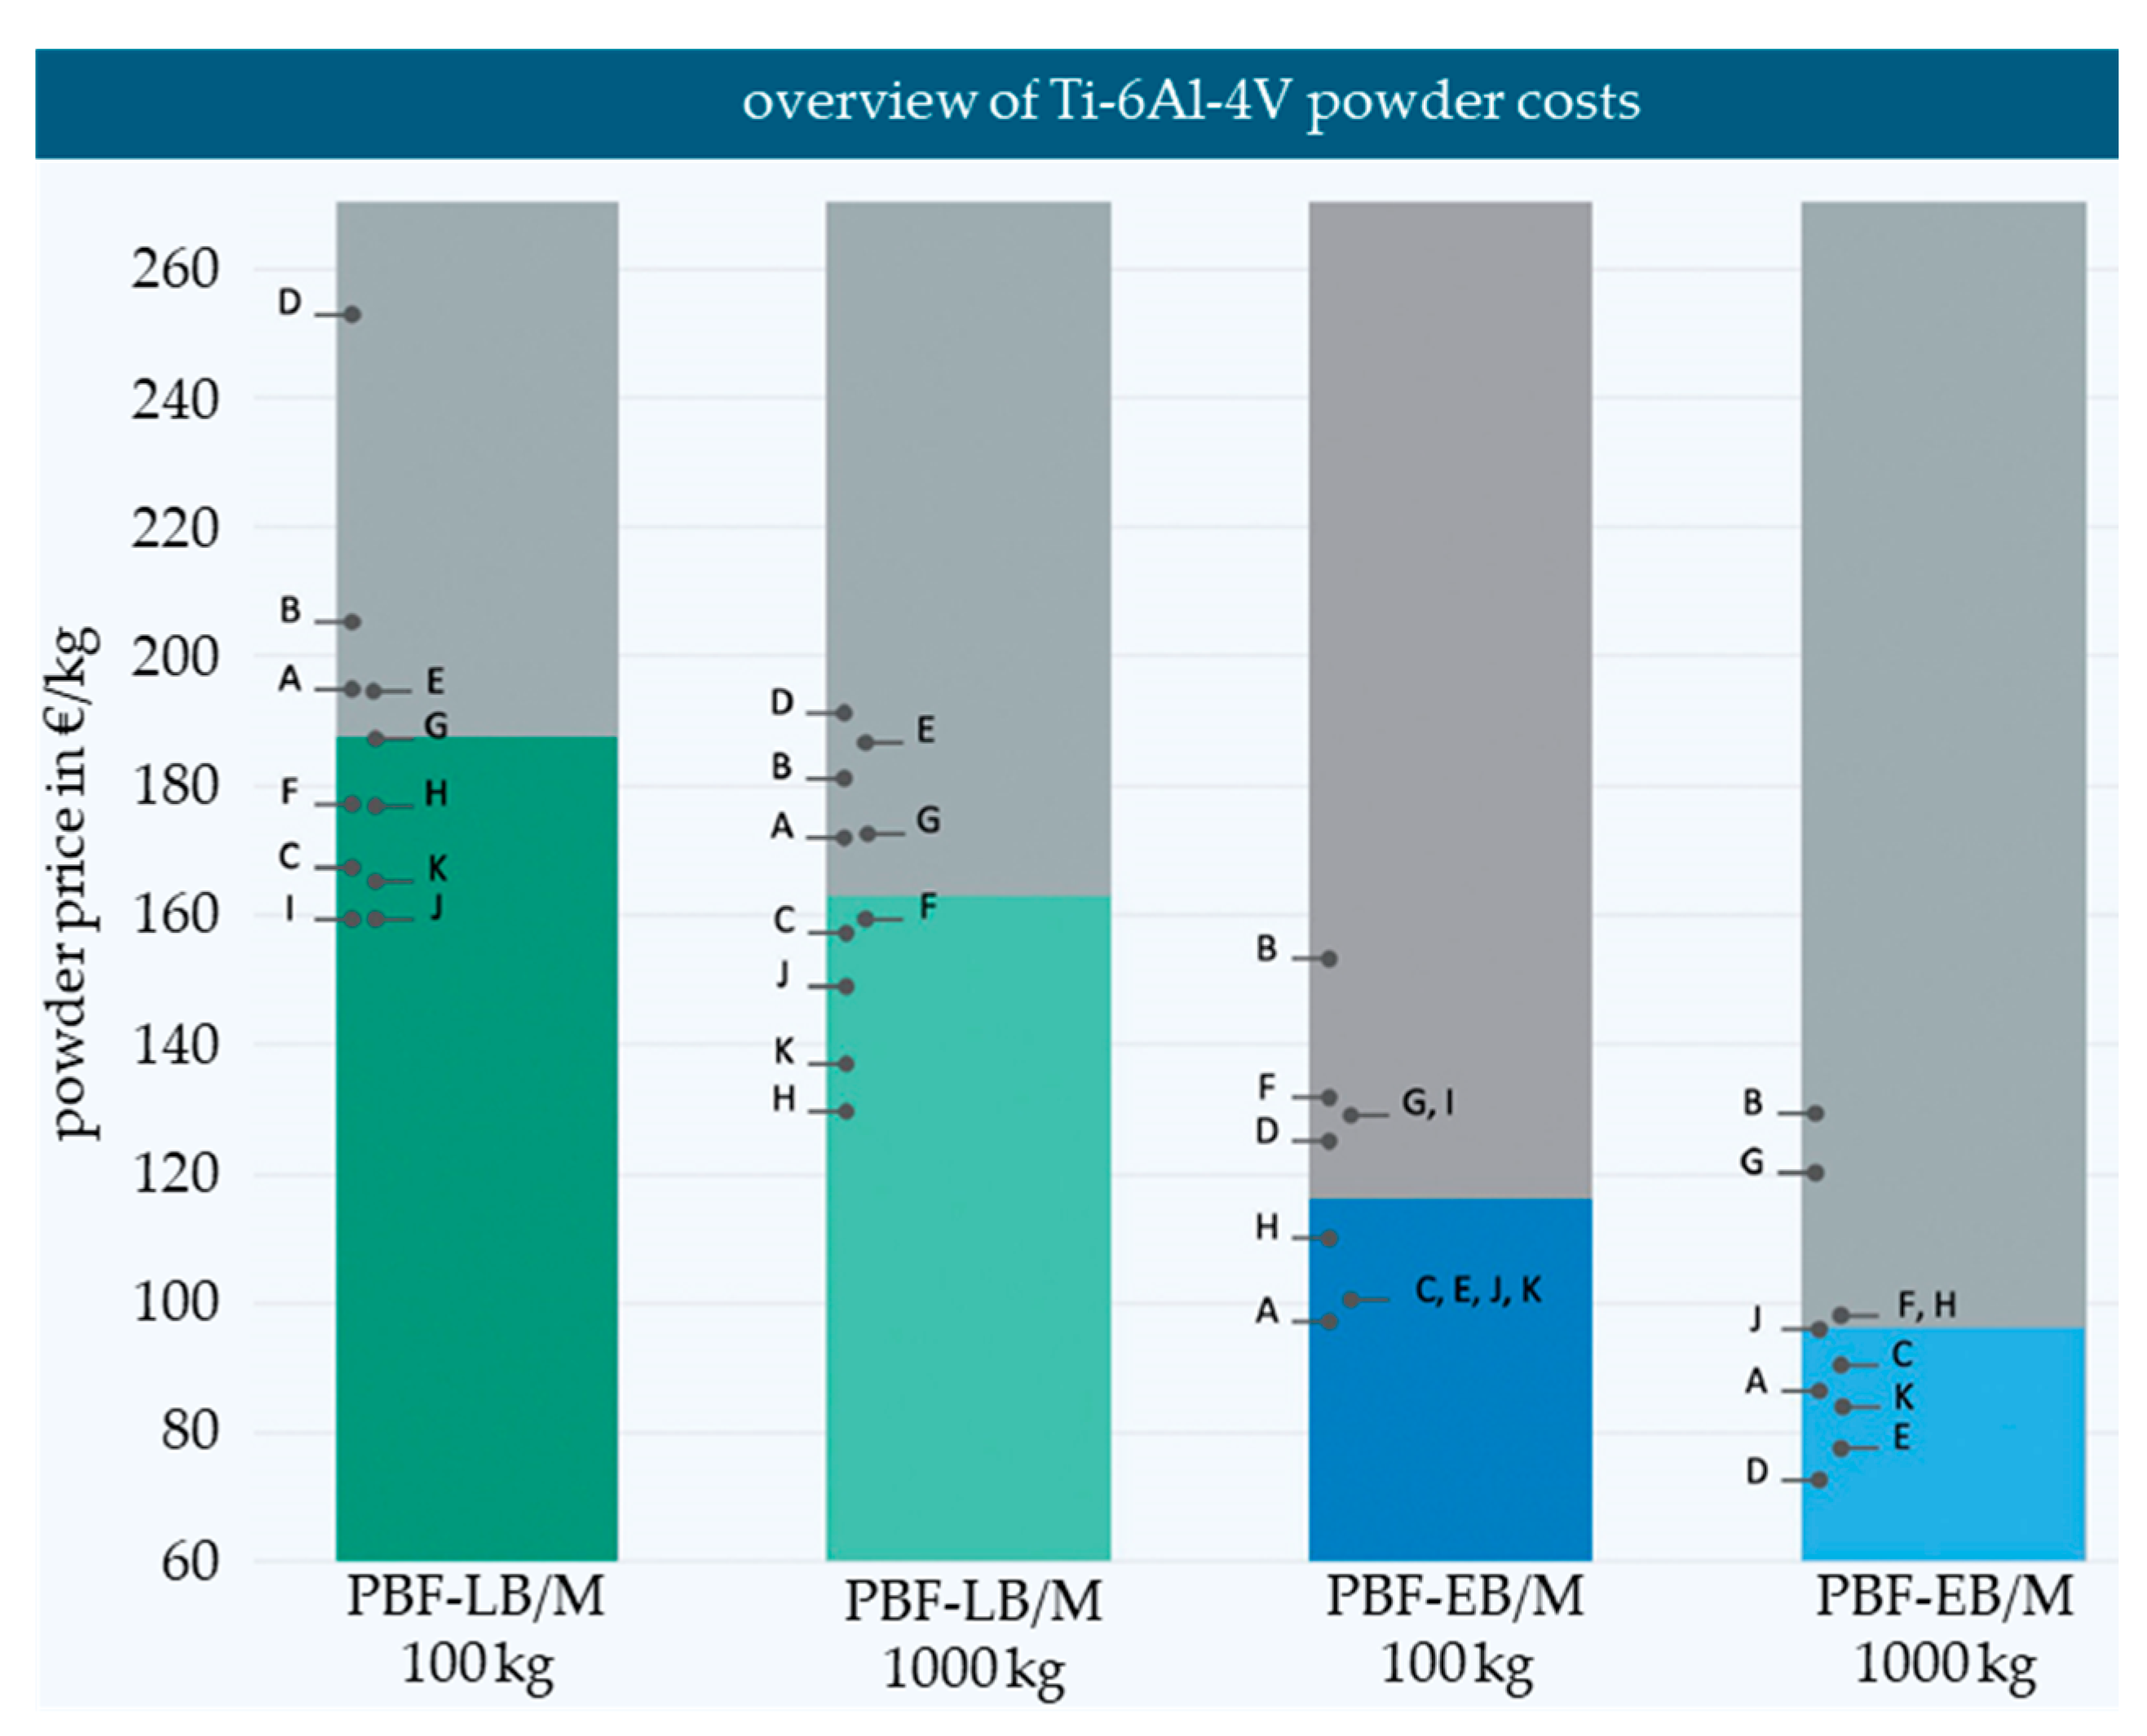
To assess potential cost savings for PBF-LB/M with the additional utilization of coarser powders such as 45-106 µm PBF-EB/M powder, a market survey is conducted. The results are shown in
Figure 13; the individual results are anonymized.
It reveals that PBF-EB/M powder is, on average, 38 % cheaper for a purchase quantity of 100 kg compared to PBF-LB/M powder. For a larger purchase quantity of 1000 kg, the cost difference increases to an average of 44 %.
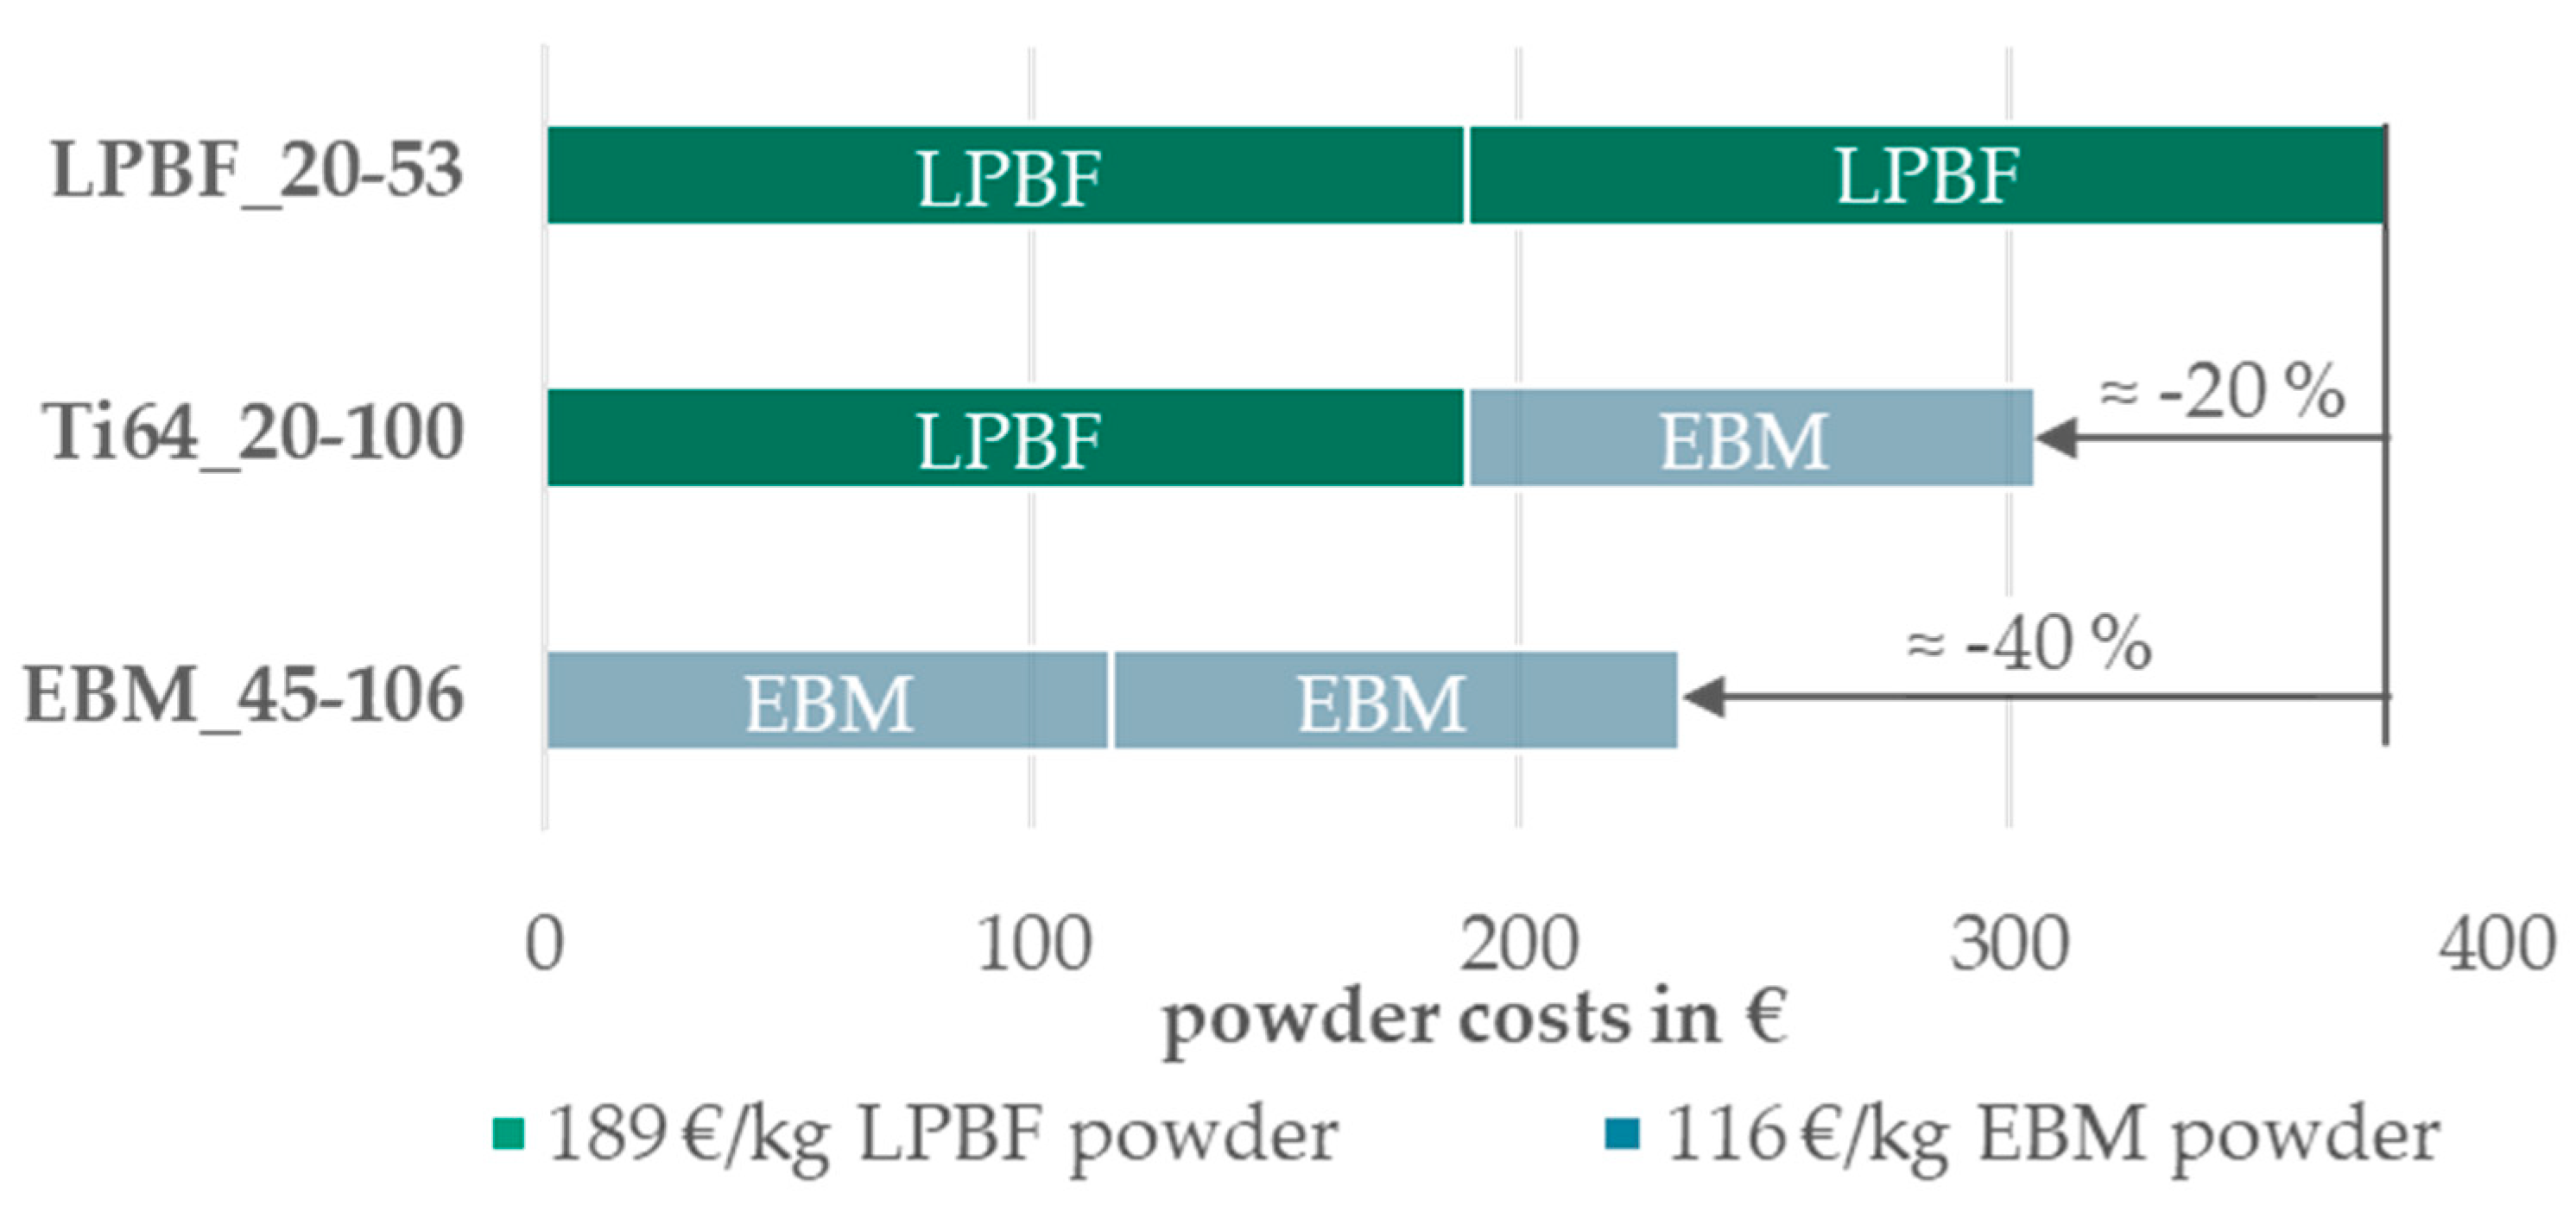
The costs for the investigated powders in a one-to-one blend are illustrated in
Figure 14, based on the prices for 100 kg and without additional costs calculated for the blending procedure itself. When incorporating a blend consisting of 50 % PBF-LB/M powder and 50 % PBF-EB/M powder to achieve a PSD of 20-100 µm, this results in an average cost reduction of around 20 %.
Studies from Anderson and Terpstra, Qi et al., Kohlwes et al. and Li et al. demonstrate a possible atomization yield increase of 10-30 % by increasing the PSD up to 100 µm. [
29,
30,
31]
4. Discussion
4.1. Powder Characterization
The difference of the particle shapes of PBF-LB/M and PBF-EB/M is neglectable. Both can be considered as spherical with a sphericity of almost 0.9 mean SPHT, which is typical for plasma atomized powders. [
32,
33] The blended powder represents a morphology, that is in between the two base powders. That is why an influence of the blending procedure can be excluded. The D90-value of the 20-100 µm blend is with 80.7 µm smaller than the expected 92.1 µm from the PBF-EB/M powder. A degradation of the PBF-EB/M powder could have taken place beforehand. The sieving with a 100 µm mesh-size is likely to decrease the D90 value smaller than 100 µm due to irregular-shaped particles that do not pass through the mesh. A loss of the particles between 80-90 µm is unlikely due to the powder handling. That is rather known for particles smaller than 20 µm, because of higher inter particle forces such as Van-der-Waals or hydrogen bonds. The bimodular-curve from the frequency distribution is almost the exact half of the combined curves from the two base powders. It shows, that a middle part around 50 µm is missing to create a gaussian shape distribution based on two separately purchased powders. For PBF-LB/M_20-53 the particles larger than 50 µm are removed and for PBF-EB/M the particles smaller 50 µm are removed for sale.
Since both base powders are within the ELI limits and do not differ significantly from each other, the influence of the chemical elements on the PBF-LB/M parameter adaptations and the mechanical properties can be discounted. Contamination (abrasive wear or oxygen pick-up) from powder handling such as blending and sieving can be reduced for all powders by careful handling, but cannot be completely eliminated.
Flowability is assessed using the Hall-Funnel method. Smaller particles appear to fill voids, resulting in higher apparent and tapped densities for PBF-LB/M_20-53 and Ti64_20-100, while PBF-EB/M_45-106 exhibits lower apparent and tapped densities. Contrary to expectations, PBF-EB/M_45-106 demonstrates with 25.2 s/50 g lower Hall-flowability. The absence of fine particles should have reduced the bonding inter-particle forces to reduce the flow-time. For PBF-LB/M_20-53 additional tapping is needed, which is why it is not free flowing in the Hall-funnel. Despite the 24.67 s/50 g for Hall-Flowability, the PBF-LB/M powder shows the poorest flowability characteristics. Ti64_20-100 stands out with slightly better flowability compared to PBF-EB/M_45-106.
External factors like humidity may affect flowability, with higher humidity potentially increasing particle cohesion. The correlation between humidity and flowability suggests that PBF-EB/M_45-106 could have exhibit similar flowability to Ti64_20-100 under similar humidity levels. However, the coarser particles in Ti64_20-100 seem to improve flowability despite lower humidity levels.
The flowability measurement using the rotating drum method reveals shear thickening behavior for all three powders, with Ti64_20-100 showing improved flowability compared to the base powders PBF-LB/M_20-53 and PBF-EB/M_45-106. Correlation analysis confirms lower flowability with increasing particle sizes. A clear trend for the correlation of particle shape and flowability is difficult to discern due to minor differences in particle shape.
4.2. PBF-LB/M
To explore the processability of larger PSDs up to 106 µm for Ti-6Al-4V, parameters are adjusted accordingly. The parameters of PBF-LB/M_20-53 µm powder serve as a reference for developing parameters for the PBF-EB/M_45-106 and Ti64_20-100 powders. The adaptation for PBF-EB/M_45-106 is grounded on the premise that melting the coarser particles necessitates higher energy input, as observed in findings from Spurek et al. and Kohlwes et al. [
31,
34] For both PBF-EB/M_45-106 and Ti64_20-100 powders, a higher volume energy input is required to achieve densities comparable to those of PBF-LB/M_20-53. The reduced hatch distance for PSDs up to 106 µm results in greater overlap of scan vectors. This adjustment is effectively balanced with a lower scanning speed, known to stabilize melt pool dynamics and reduce spattering. However, maintaining the same scanning speed as PBF-LB/M_20-53 powder leads to excessive energy input for coarser PSDs, resulting in increased porosity. Despite a slight increase in laser power compared to PBF-LB/M_20-53, vaporization of small particles is unlikely. Instead, the increased energy input, combined with re-melting of scan vectors due to overlap, can be seen as a in-situ heat treatment for the parts. This necessitates a combination of higher scanning speed, lower hatch distance, and slightly higher laser power for increased particle sizes to achieve densities comparable to PBF-LB/M_20-53. Further investigations are warranted to refine this approach by adapting parameters to the PSD, potentially extending powder re-use by mitigating proven coarsening effects during re-use. A processability is given for all three powders with three different PSDs.
The application test (
Figure 7) reveals a slight decrease in particle size on the build plate, indicating potential removal of smaller particles (≤ 20 µm) by the gas stream during printing. Segregation of larger particles (≥ 75 µm) in front of the re-coating blade could lead to refinement of the particle size distribution as simulated by Lee et al. [
35]. The segregation could have resulted in the coarser particles not being completely deposited on the building platform and being pushed into the overflow.
4.3. Mechanical Properties
The evaluation of the manufacturability of larger PSDs up to 106 µm of Ti-6Al-4V is primarily based on mechanical properties, including relative density, microstructure, hardness, and tensile properties. General literature values and material data sheets are used for comparison to assess manufacturability, considering varying target values based on specific applications.
All three powders achieve reproducible densities above 99.93 % and meet the 99.9 % target. While closer comparison is not meaningful due to potential nanometer-level deviations from measurement and process fluctuations, successful process parameter adaptations yield high densities for all PSDs.
The microstructure exhibits similarities among all samples, featuring a α-structure with β-bits resulting from heat treatment at 800°C for 2 h. β-columnar growth is enforced by a scanning pattern of 90°. [
36] No significant influence of PSD or other powder characteristics on microstructure is identified, indicating that adapted process parameters can lead to comparable microstructure characteristics across different PSDs from 20-53 µm to 20-100 µm.
Vickers hardness for all three PSDs falls within typical ranges for Ti-6Al-4V hardness achieved with PBF-LB/M. Standard deviations for Ti-6Al-4V hardness are below 3 %. Variations in hardness among PSDs are attributed to differences in cooling rates, with slower cooling rates associated with lower hardness. Adapted process parameters allow for achieving typical PBF-LB/M hardness levels across all three PSDs.
Tensile specimens exhibit values comparable to industry standards (
Table 1). A slight anisotropy is detected with decreased tensile strength and increased ductility in vertical orientation for all PSDs. Several factors affect the mechanical properties amongst others build height, PSD and process parameters. A lower build height is less prone to irregularities and defects (6 mm in horizontal orientation compared to 51 mm in vertical orientation) as stated by Singh et al. and Xue et al. [
8,
37]. Findings from Yadroitsev et al. stated no influence of heat-treatment below the β-transus temperature on anisotropy. [
38] Slight anisotropy persists despite annealing at 800°C for 2 h, suggesting further process or heat treatment parameter adaptation is needed. An increase in tensile properties is observed in vertical orientation for PBF-LB/M_20-53, possibly due to dissipated heat resulting in higher strength and ductility. The lower specific surface area of larger particles up to 106 µm varies the melting behavior compared to smaller particles 20-53 µm, which should be compensated for with the adapted process parameters. Further adjustment of the process parameters offers room for enhanced mechanical performance. The microstructure is analyzed using density cubes with 15 mm build height, showing no significant influence of the increased PSDs. An investigation of specimens in 50 mm could provide more details about deviations in microstructure influencing the mechanical properties and leading to anisotropy.
The elongation at break achieved is noteworthy for all three PSDs. PBF-EB/M_45-106 with the lowest average elongation at break of 16.3 % is above the industry standard values of 14.6 % on average (averages value based on
Table 1). The values of PBF-LB/M and Ti64_20-100 clearly exceed these at 18.6 and 20 %. This shows, that the used process parameters are rather targeting ductility than strength.
The correlation matrix reflects the received results. Increased PSD and a more spherical particle shape improve flowability and reduce density & tensile properties. For the Vickers hardness it is the opposite with higher hardness for increased PSD and higher irregularity. The cooling rate of the different process parameters could be dominant for the hardness result. Better flowability leads to better mechanical properties, which highlights the importance of flowability measurements. A homogeneous and dense powder application reduces the likelihood for voids and irregularities in the powder bed influencing the melt pool, which can lead to decreased mechanical properties.
Hidden effects of lower specific oxygen content of coarser particles due to the lower specific surface are not considered ant warrant further investigation.
Further quality criteria such as dimensional accuracy or surface roughness are not considered in this investigation. It is likely that agglomerated or partially melted particles with 100 µm increase the surface roughness compared to 53 µm particles limiting utilization for filigree structures. A study of the process parameters, which deals with the contour parameters, can address this aspect.
4.4. Economics
This investigation offers the opportunity for industries already utilizing metal powders in various PSDs, such as Ti-6Al-4V, to consider purchasing additional coarser powders or switching to an overall broader PSD. Examining the purchase costs for powders up to 106 µm particle size and larger powder quantities such as 1,000 kg for Ti-6Al-4V, reveals a significant cost reduction potential of 40 % for PBF-EB/M powders, translating to a 20 % cost reduction if blended to a wider PSD of 20-100 µm. This cost reduction aligns with the estimated resource savings stemming from a 10-30% higher atomization yield. [
29,
30,
31] However, precise calculations of the potential yield increase are challenging due to the proprietary nature of powder atomizers' exact yield information.
5. Conclusions
In conclusion, this study has provided valuable insights into the potential benefits of incorporating coarser particle size distributions up to 106 µm into laser-based powder bed fusion of metals. Through a comprehensive investigation encompassing market surveys, cost analyses, and technical evaluations, the feasibility and implications of printing with coarser powders, such as those utilized in electron beam powder bed fusion of metals were explored.
The findings underscore the following key points:
Cost Reduction Potential: The utilization of PSDs up to 106 µm in PBF-LB/M offers significant cost reduction opportunities, particularly when compared to the use of finer powders traditionally associated with the process such as 20-53 µm. Market survey revealed notable cost differentials between PBF-LB/M and PBF-EB/M powders, with the latter proving to be considerably more cost-effective.
Maintained Quality Standards: Despite the up to 40 % lower cost associated with coarser powders, the study demonstrates that printing with these PSDs does not necessitate a compromise in quality. Through analysis of mechanical properties, microstructure, and processability, it was demonstrated that specimens manufactured using PSDs of 45-106 µm and 20-100 µm exhibit comparable mechanical performance to industry standards. Deviations in elongation to those produced with finer powders in this study 20-53 µm and for yield strength in vertical orientation are present printed with different process parameters.
Process Adaptability: Moreover, the research highlights the adaptability of PBF-LB/M parameters to accommodate coarser powders. Process parameter adjustments and strategies enable the effective utilization of coarser powders while maintaining mechanical properties.
Industry Implications: The insights gleaned from this study have significant implications for industries utilizing PBF-LB/M technology. By leveraging the cost advantages of coarser powders, manufacturers can achieve substantial cost savings without sacrificing product quality or performance. This not only enhances the economic viability of PBF-LB/M but also promotes its broader adoption across various sectors.
Moving forward, further research is warranted to explore additional parameters such as layer thicknesses higher than 60 µm influencing the utilization of PSDs up to 106 µm and coarser in PBF-LB/M. Additionally, investigations into the long-term effects of printing with coarser powders, including considerations of part durability, dimensional accuracy, surface roughness and post-processing requirements, will be crucial for advancing the understanding and maximizing the potential benefits of this approach.
In summary, the findings presented in this study underscore the potential of printing with coarser PSDs as a viable strategy for reducing manufacturing costs and enhancing the competitiveness of PBF-LB/M technology in the additive manufacturing landscape. By bridging the gap between cost-effectiveness and quality, this approach holds promise for unlocking new opportunities and driving innovation in the field of additive manufacturing.
Author Contributions
Conceptualization, I.L.; methodology, I.L.; validation, I.L. and M.K.; investigation, I.L.; writing—original draft preparation, I.L.; writing—review and editing, M.K. and I.L.; visualization, I.L. and M.K.; supervision, M.K.; project administration, I.L. and M.K.; funding acquisition, I.L. and M.K.. All authors have read and agreed to the published version of the manuscript.
Funding
This research was partially funded by the Federal Ministry of Economic Affairs and Climate Action, grant number 20W1707D.
Data Availability Statement
The data presented in this study are available on request from the corresponding author.
Conflicts of Interest
The authors declare no conflicts of interest.
References
- F. Bosio, A. Aversa, M. Lorusso, S. Marola, D. Gianoglio, L. Battezzati, P. Fino, D. Manfredi, M. Lombardi, A time-saving and cost-effective method to process alloys by Laser Powder Bed Fusion, Materials & Design 181 (2019) 107949. [CrossRef]
- W.E. Frazier, Metal Additive Manufacturing: A Review, J. of Materi Eng and Perform 23 (2014) 1917–1928. [CrossRef]
- S. Vock, B. Klöden, A. Kirchner, T. Weißgärber, B. Kieback, Powders for powder bed fusion: a review, Prog Addit Manuf 4 (2019) 383–397. [CrossRef]
- P. Muthuswamy, Influence of powder characteristics on properties of parts manufactured by metal additive manufacturing, Lasers Manuf. Mater. Process. (2022). [CrossRef]
- I.M. Kusoglu, B. Gökce, S. Barcikowski, Research trends in laser powder bed fusion of Al alloys within the last decade, Additive Manufacturing 36 (2020) 101489. [CrossRef]
- I. Ludwig, M. Kluge, D. Jutjuhn, M. Grube, P. Imgrund, C. Emmelmann, Investigations of air atomized and coarser gas-atomized AlSi12 powders to evaluate cost reduction potentials for additive manufacturing processes, EuroPM2021 Proceedings (2021).
- A.Y.M. Alfaify, The Effect of Changing Particle Size Distribution and Layer Thickness on the Density of Parts Manufactured UsingtheLaser Powder Bed Fusion Process (2019).
- M. Xue, Xinyue Chen, Xia Ji, Xinliang Xie, Qi Chao and Guohua Fan, Effect of Particle Size Distribution on the Printing Quality and Tensile Properties of Ti-6Al-4V Alloy Produced by LPBF Process, Metals 13 (2023). [CrossRef]
- International Organisation for Standardisation, Particle size analysis - image analysis methods: Part 2: Dynamic image analysis methods, Beuth Verlag GmbH ICS 19.120, 2006.
- ASTM, Standard Test Method for Analysis of Titanium and Titanium Alloys by Direct Current Plasma and Inductively Coupled Plasma Atomic Emission Spectrometry (Performance-Based Test Methodology) 71.040.50; 77.120.50, 2022.
- E01 Committee, Test Method for Determination of Oxygen and Nitrogen in Titanium and Titanium Alloys by Inert Gas Fusion, ASTM International, West Conshohocken, PA.
- ASTM, E1447 Standard Test Method for Determination of Hydrogen in Reactive Metals and Reactive Metal Alloys by Inert Gas Fusion with Detection by Thermal Conductivity or Infrared Spectrometry 77.120.50.
- ASTM, ASTM E1941 Standard Test Method for Determination of Carbon in Refractory and Reactive Metals and Their Alloys by Combustion Analysis 71.040.50.
- DIN-Normenausschuss Werkstofftechnologie, Metallpulver – Ermittlung der Durchflussdauer mit Hilfe eines kalibrierten Trichters, Beuth Verlag GmbH, 10772 Berlin ICS 77.160, 2009.
- International Organisation for Standardisation, Metallpulver_- Ermittlung der Fülldichte: Teil_1: Trichterverfahren, Beuth Verlag GmbH, Berlin ICS 77.160, 2018.
- DIN EN ISO, Metallpulver - Bestimmung der Klopfdichte, 2011.
- H.H. Hausner, Powder Characteristics and their Effect on Powder Processing, Powder Technology 30 (1981) 3–8.
- K. Janzen, K.J. Kallies, L. Waalkes, P. Imgrund, C. Emmelmann, Influence of Different Powder Conditioning Strategies on Metal Binder Jetting with Ti-6Al-4V, Materials (Basel) 17 (2024) 750. [CrossRef]
- Filip Francqui, GranuDrum Measurements, NN, 2022.
- Granutools, GranuDrum Operators Guide, 2016.
- S.A. Etesami, B. Fotovvati, E. Asadi, Heat treatment of Ti-6Al-4V alloy manufactured by laser-based powder-bed fusion: Process, microstructures, and mechanical properties correlations, Journal of Alloys and Compounds 895 (2022) 162618. [CrossRef]
- DIN EN ISO 6507-1:2018-07, Metallische Werkstoffe_- Härteprüfung nach Vickers_- Teil_1: Prüfverfahren (ISO_6507-1:2018); Deutsche Fassung EN_ISO_6507-1:2018, Beuth Verlag GmbH, Berlin.
- DIN 50125: Prüfung metallischer Werkstoffe – Zugproben 77.040.10, 2016.
- DIN EN ISO 6892-1: Metallische Werkstoffe - Zugversuch Teil 1-Prüfverfahren bei Raumtemperatur 77.040.10, 2020.
- P. Kiani, U.S. Bertoli, A.D. Dupuy, K. Ma, J.M. Schoenung, A Statistical Analysis of Powder Flowability in Metal Additive Manufacturing, Advanced Engineering Materials 22 (2020). [CrossRef]
- EOS, Material Data Sheet: Titanium Ti64 Grade 23 (2022).
- Danny Scheel, Material Data Sheet - Ti-Alloy Ti6Al4V ELI (Grade 23), 2020. https://www.slm-solutions.com/fileadmin/Content/Powder/MDS/MDS_Ti-Alloy_Ti6Al4V__ELI_0719_EN.pdf.
- Titanlegierungen - Chemische Zusammensetzung, Beuth Verlag GmbH, Berlin.
- I. Anderson, R.L. Terpstra, Progress toward gas atomization processing with increased uniformity and control, Materials Science and Engineering (2002) 101–109.
- H. Qi, X. Zhou, J. Li, Y. Hu, L. Xu, Performance Testing and Rapid Solidification Behavior of Stainless Steel Powders Prepared by Gas Atomization, Materials (Basel) 14 (2021). [CrossRef]
- P. Kohlwes, Influence Analysis of Individual Powder Properties on L-PBF Process Capability (2023).
- S. Wallner, Powder Production Technologies, Berg Huettenmaenn Monatsh 164 (2019) 108–111. [CrossRef]
- Y. Cui, Y. Zhao, H. Numata, H. Bian, K. Wako, K. Yamanaka, K. Aoyagi, C. Zhang, A. Chiba, Effects of plasma rotating electrode process parameters on the particle size distribution and microstructure of Ti-6Al-4 V alloy powder, Powder Technology 376 (2020) 363–372. [CrossRef]
- M.A. Spurek, L. Haferkamp, C. Weiss, A.B. Spierings, J.H. Schleifenbaum, K. Wegener, Influence of the particle size distribution of monomodal 316L powder on its flowability and processability in powder bed fusion, Prog Addit Manuf (2021). [CrossRef]
- Y. Lee, A.K. Gurnon, D. Bodner, S. Simunovic, Effect of Particle Spreading Dynamics on Powder Bed Quality in Metal Additive Manufacturing, Integr Mater Manuf Innov (2020). [CrossRef]
- Z. Zheng, X. Jin, Y. Bai, Y. Yang, C. Ni, W.F. Lu, H. Wang, Microstructure and anisotropic mechanical properties of selective laser melted Ti6Al4V alloy under different scanning strategies, Materials Science and Engineering: A 831 (2022) 142236. [CrossRef]
- P.K. Singh, S. Kumar, P.K. Jain, U.S. Dixit, Effect of Build Orientation on Metallurgical and Mechanical Properties of Additively Manufactured Ti-6Al-4V Alloy, J. of Materi Eng and Perform (2023). [CrossRef]
- I. Yadroitsev, P. Krakhmalev, I. Yadroitsava, Selective laser melting of Ti6Al4V alloy for biomedical applications: Temperature monitoring and microstructural evolution, Journal of Alloys and Compounds 583 (2014) 404–409. [CrossRef]
Figure 1.
(a) CAD-model of V-Shape Powder Blender; (b) and the surrounding test bench.
Figure 1.
(a) CAD-model of V-Shape Powder Blender; (b) and the surrounding test bench.
Figure 2.
Schematic image of the GranuDrum in the front view [18.]
Figure 2.
Schematic image of the GranuDrum in the front view [18.]
Figure 3.
Schematic image of a longitudinal section of a density cube with the used imprint pattern for HV10-measurements.
Figure 3.
Schematic image of a longitudinal section of a density cube with the used imprint pattern for HV10-measurements.
Figure 4.
Diagram of the frequency distributions of the investigated powders.
Figure 4.
Diagram of the frequency distributions of the investigated powders.
Figure 5.
Diagram of the cohesion indices and avalanche angles over the set rotational speed range for all three investigated powders.
Figure 5.
Diagram of the cohesion indices and avalanche angles over the set rotational speed range for all three investigated powders.
Figure 6.
Diagram of the relative density per volume energy for each PBF-LB/M parameter combination per PSD variation.
Figure 6.
Diagram of the relative density per volume energy for each PBF-LB/M parameter combination per PSD variation.
Figure 7.
Bar chart of the particle size from the supply, build plate and overflow measured with Ti64_20-100.
Figure 7.
Bar chart of the particle size from the supply, build plate and overflow measured with Ti64_20-100.
Figure 8.
Light microscope images of polished density cubes for relative density analysis.
Figure 8.
Light microscope images of polished density cubes for relative density analysis.
Figure 9.
Exemplary SEM images for each investigated powder for microstructural analysis.
Figure 9.
Exemplary SEM images for each investigated powder for microstructural analysis.
Figure 10.
Bar chart of the measured Vickers Hardness HV10 for each investigated powder compared to the industry references.
Figure 10.
Bar chart of the measured Vickers Hardness HV10 for each investigated powder compared to the industry references.
Figure 11.
Diagram of the measured tensile properties in horizontal and vertical orientation for each powder after heat treatment (800°C for 2h).
Figure 11.
Diagram of the measured tensile properties in horizontal and vertical orientation for each powder after heat treatment (800°C for 2h).
Figure 12.
Correlation matrix.
Figure 12.
Correlation matrix.
Figure 13.
Diagram of the Ti-6Al-4V price market survey of typical PBF-LB/M and PBF-EB/M PSDs.
Figure 13.
Diagram of the Ti-6Al-4V price market survey of typical PBF-LB/M and PBF-EB/M PSDs.
Figure 14.
Diagram of powder costs distribution for an Equal-Proportion-Blend per investigated PSD.
Figure 14.
Diagram of powder costs distribution for an Equal-Proportion-Blend per investigated PSD.
Table 1.
Ti-6Al-4V industry reference tensile properties [8,26,27.]
Table 1.
Ti-6Al-4V industry reference tensile properties [8,26,27.]
| powder |
heat treatment |
layer
thickness
in [µm] |
tensile strength
in [N/mm²] |
yield
strenght
in [N/mm²] |
elongation
at break
in [%] |
| Xue et al. (horizontal) |
800°C 2 h |
60 |
1029 |
956 |
14.3 |
| Xue et al. (vertical) |
800°C 2 h |
60 |
1041 |
978 |
16.2 |
| EOS (horizontal) |
800°C 2 h |
40 |
1050 |
940 |
14 |
| EOS (vertical) |
800°C 2 h |
40 |
1050 |
980 |
15 |
| Nikon SLM (horizontal) |
940°C 4 h |
60 |
987 |
894 |
12 |
| Nikon SLM (vertical) |
940°C 4 h |
60 |
991 |
905 |
15 |
Table 2.
powder morphology and decile values of the investigated powders.
Table 2.
powder morphology and decile values of the investigated powders.
| powder |
Ø SPHT |
Ø Symm |
Ø w/l |
Ø D10
in [µm] |
Ø D50
in [µm] |
Ø D90
in [µm] |
| PBF-LB/M_20-53 |
0.893 |
0.954 |
0.896 |
22.2 |
33.5 |
46.8 |
| PBF-EB/M_45-106 |
0.885 |
0.926 |
0.859 |
51.9 |
71.2 |
92.1 |
| Ti64_20-100 |
0.888 |
0.943 |
0.881 |
25.6 |
47.3 |
80.7 |
Table 3.
Chemical composition of PBF-LB/M_20-53 and PBF-EB/M_45-106 powders compared to ELI-standard [28.]
Table 3.
Chemical composition of PBF-LB/M_20-53 and PBF-EB/M_45-106 powders compared to ELI-standard [28.]
| powder |
Ti |
Al |
V |
Fe |
C |
N |
| Ti-6Al-4V ELI |
balance |
5.5-6.5 |
3.5-4.5 |
≤0.25 |
≤0.08 |
0.03 |
| PBF-LB/M_20-53 |
balance |
6.26 |
4.02 |
0.16 |
0.005 |
0.014 |
| PBF-EB/M_45-106 |
balance |
6.15 |
4.0 |
0.15 |
0.01 |
0.02 |
Table 4.
Results for apparent, tapped density, Hausner-ratio & hall-flowability for the investigated powders.
Table 4.
Results for apparent, tapped density, Hausner-ratio & hall-flowability for the investigated powders.
| Powder |
Apparent Density
in
[g/cm³] |
Tapped Density
in
[g/cm³] |
Hausner-Ratio |
Hall-Flowability
in
[s/50 g] |
Humidity
in
[g/cm³] |
| PBF-LB/M_20-53 |
2.46 ± 0.00 |
2.68 ± 0.01 |
1.09 |
24.67 ±3.611
|
11.49 |
| Ti64_20-100 |
2.46 ± 0.01 |
2.77 ± 0.01 |
1.13 |
24.23 ± 0.15 |
8.13 |
| PBF-EB/M_45-106 |
2.30 ± 0.01 |
2.53 ± 0.01 |
1.10 |
25.20 ± 0.20 |
10.29 |
Table 5.
PBF-LB/M parameter variation and final volume energies and build rates for all investigated powders.
Table 5.
PBF-LB/M parameter variation and final volume energies and build rates for all investigated powders.
| Parameter |
PBF-LB/M
20-53 µm |
PBF-EB/M
45-106 µm |
Ti64
20-100 µm |
| Build Jobs |
2x |
1x |
3x |
| Laser Power in [W] |
290-310 |
300-320 |
280-360 |
| Scanning Speed in [mm/s] |
1100- 1300 |
1100-1400 |
1000-1500 |
| Hatch Distance in [mm] |
0.11-0.17 |
0.08-0.14 |
0.08-0.14 |
| Final Volume Energy in [J] |
36.13 |
47.62 |
47.62 |
| Final Build Rate in [cm³/h] |
30.89 |
24.19 |
24.19 |
|
Disclaimer/Publisher’s Note: The statements, opinions and data contained in all publications are solely those of the individual author(s) and contributor(s) and not of MDPI and/or the editor(s). MDPI and/or the editor(s) disclaim responsibility for any injury to people or property resulting from any ideas, methods, instructions or products referred to in the content. |
© 2024 by the authors. Licensee MDPI, Basel, Switzerland. This article is an open access article distributed under the terms and conditions of the Creative Commons Attribution (CC BY) license (http://creativecommons.org/licenses/by/4.0/).
