Submitted:
08 May 2024
Posted:
09 May 2024
You are already at the latest version
Abstract
Keywords:
1. Introduction
2. Materials and Methods
2.1. Study Population
2.2. Echocardiography Data
2.3. Statistical Analysis
3. Results
3.1. Baseline Characteristics of the Cohort
3.2. Safety and Effectiveness of Mitral TEER in Our population.
3.3. Short-Term Impact of TEER on Left Ventricular Remodeling
3.4. Impact of TEER at Follow-Up: Heart Failure Hospitalizations and Cardiovascular Death after TEER.
4. Discussion
5. Conclusions
Supplementary Materials
Author Contributions
Funding
Institutional Review Board Statement
Informed Consent Statement
Data Availability Statement
Acknowledgments
Conflicts of Interest
Abbreviations
| EROA | effective regurgitant orifice area |
| GCW | global constructive work |
| GLS | global longitudinal strain |
| GWE | global work efficiency |
| GWI | global work index |
| LA | left atrial |
| LV | left ventricle |
| LVEDD | left ventricular end-diastolic diameter |
| LVEDV | left ventricular end-diastolic volume |
| LVEDVI | indexed left ventricular end-diastolic volume |
| LVEF | left ventricle ejection fraction |
| LVESD | left ventricular end-systolic diameter |
| LVESV | left ventricular end-systolic volume |
| MR | mitral regurgitation |
| MW | myocardial work |
| PASP | pulmonary artery systolic pressure |
| RV FWS | right ventricular free wall longitudinal strain |
| RV | right ventricle |
| RV-AP | right ventricle to pulmonary arterial |
| TAPSE | tricuspid annular plane systolic excursion |
| TEER | transcatheter edge-to-edge repair |
| TR | tricuspid regurgitation |
| TTE | transthoracic echocardiography |
References
- Vahanian, A.; Beyersdorf, F.; Praz, F.; Milojevic, M.; Baldus, S.; Bauersachs, J.; Capodanno, D.; Conradi, L.; De Bonis, M.; De Paulis, R.; Delgado, V.; Freemantle, N.; Gilard, M.; Haugaa, K. H.; Jeppsson, A.; Jüni, P.; Pierard, L.; Prendergast, B. D.; Sádaba, J. R.; Tribouilloy, C.; Wojakowski, W.; ESC/EACTS Scientific Document Group; Neumann, F.-J.; Myers, P.; Abdelhamid, M.; Achenbach, S.; Asteggiano, R.; Barili, F.; Borger, M. A.; Carrel, T.; Collet, J.-P.; Foldager, D.; Habib, G.; Hassager, C.; Irs, A.; Iung, B.; Jahangiri, M.; Katus, H. A.; Koskinas, K. C.; Massberg, S.; Mueller, C. E.; Nielsen, J. C.; Pibarot, P.; Rakisheva, A.; Roffi, M.; Rubboli, A.; Shlyakhto, E.; Siepe, M.; Sitges, M.; Sondergaard, L.; Sousa-Uva, M.; Tarantini, G.; Zamorano, J. L.; Praz, F.; Milojevic, M.; Baldus, S.; Bauersachs, J.; Capodanno, D.; Conradi, L.; De Bonis, M.; De Paulis, R.; Delgado, V.; Freemantle, N.; Gilard, M.; Haugaa, K. H.; Jeppsson, A.; Jüni, P.; Pierard, L.; Prendergast, B. D.; Sádaba, J. R.; Tribouilloy, C.; Wojakowski, W.; ESC National Cardiac Societies; Benchabi, Y.; Chilingaryan, A.; Metzler, B.; Rustamova, Y.; Shumavets, V.; Lancellotti, P.; Smajic, E.; Trendafilova-Lazarova, D.; Samardzic, J.; Karakyriou, M.; Palecek, T.; Sanchez Dahl, J.; Meshaal, M. S.; Palm, K.; Virtanen, M.; Bouleti, C.; Bakhutashvili, Z.; Achenbach, S.; Boutsikou, M.; Kertész, A. B.; Danielsen, R.; Topilsky, Y.; Golino, P.; Tuleutayev, R.; Elezi, S.; Kerimkulov, A.; Rudzitis, A.; Glaveckaite, S.; Sow, R.; Demarco, D. C.; Bulatovic, N.; Aouad, A.; Van Den Brink, R.; Antova, E.; Beitnes, J. O.; Ochala, A.; Ribeiras, R.; Vinereanu, D.; Irtyuga, O.; Ivanovic, B.; Simkova, I.; González Gómez, A.; Sarno, G.; Pedrazzini, G. B.; Bsata, W.; Zakhama, L.; Korkmaz, L.; Cherniuk, S.; Khanji, M. Y.; Sharipov, I. 2021 ESC/EACTS Guidelines for the Management of Valvular Heart Disease. European Heart Journal 2022, 43 (7), 561–632. [CrossRef]
- Pastore, M. C.; Vannuccini, F.; Mandoli, G. E.; Lisi, M.; Iuliano, M. A.; Santoro, A.; Niglio, F. P.; Diviggiano, E. E.; Lorenz, V.; Montesi, G.; Cavigli, L.; Focardi, M.; D’Ascenzi, F.; Cameli, M. Myocardial Work and Left Heart Deformation Parameters across Primary Mitral Regurgitation Severity. International Journal of Cardiology 2024, 399, 131772. [CrossRef]
- Lancellotti, P.; Pibarot, P.; Chambers, J.; La Canna, G.; Pepi, M.; Dulgheru, R.; Dweck, M.; Delgado, V.; Garbi, M.; Vannan, M. A.; Montaigne, D.; Badano, L.; Maurovich-Horvat, P.; Pontone, G.; Vahanian, A.; Donal, E.; Cosyns, B.; the Scientific Document Committee of the European Association of Cardiovascular Imaging. Multi-Modality Imaging Assessment of Native Valvular Regurgitation: An EACVI and ESC Council of Valvular Heart Disease Position Paper. European Heart Journal - Cardiovascular Imaging 2022, 23 (5), e171–e232. [CrossRef]
- Yedidya, I.; Lustosa, R. P.; Fortuni, F.; Van Der Bijl, P.; Namazi, F.; Vo, N. M.; Meucci, M. C.; Ajmone Marsan, N.; Bax, J. J.; Delgado, V. Prognostic Implications of Left Ventricular Myocardial Work Indices in Patients With Secondary Mitral Regurgitation. Circ: Cardiovascular Imaging 2021, 14 (9). [CrossRef]
- Hubert, A.; Galli, E.; Leurent, G.; Corbineau, H.; Auriane, B.; Guillaume, L.; Leclercq, C.; Donal, E. Left Ventricular Function after Correction of Mitral Regurgitation: Impact of the Clipping Approach. Echocardiography 2019, 36 (11), 2010–2018. [CrossRef]
- Cimino, S.; Maestrini, V.; Cantisani, D.; Petronilli, V.; Filomena, D.; Mancone, M.; Sardella, G.; Fedele, F.; Lancellotti, P.; Agati, L. 2D/3D Echocardiographic Determinants of Left Ventricular Reverse Remodelling after MitraClip Implantation. European Heart Journal - Cardiovascular Imaging 2019, 20 (5), 558–564. [CrossRef]
- Koschutnik, M.; Donà, C.; Nitsche, C.; Kammerlander, A. A.; Dannenberg, V.; Brunner, C.; Koschatko, S.; Mascherbauer, K.; Heitzinger, G.; Halavina, K.; Spinka, G.; Winter, M.-P.; Hülsmann, M.; Bartko, P. E.; Hengstenberg, C.; Mascherbauer, J.; Goliasch, G. Impact of Right Ventricular-to-Pulmonary Artery Coupling on Remodeling and Outcome in Patients Undergoing Transcatheter Edge-to-Edge Mitral Valve Repair. Clin Res Cardiol 2023. [CrossRef]
- Verbeke, J.; Calle, S.; Kamoen, V.; De Buyzere, M.; Timmermans, F. Prognostic Value of Myocardial Work and Global Longitudinal Strain in Patients with Heart Failure and Functional Mitral Regurgitation. Int J Cardiovasc Imaging 2022, 38 (4), 803–812. [CrossRef]
- Trejo-Velasco, B.; Estevez-Loureiro, R.; Carrasco-Chinchilla, F.; Fernández-Vázquez, F.; Arzamendi, D.; Pan, M.; Pascual, I.; Nombela-Franco, L.; Amat-Santos, I. J.; Freixa, X.; Hernández-Antolín, R. A.; Trillo-Nouche, R.; Andraka Ikazuriaga, L.; López-Mínguez, J. R.; Sanmiguel Cervera, D.; Sanchis, J.; Diez-Gil, J. L.; Ruiz-Quevedo, V.; Urbano-Carrillo, C.; Becerra-Muñoz, V. M.; Benito-González, T.; Li, C. H.; Mesa, D.; Avanzas, P.; Armijo, G.; Serrador-Frutos, A. M.; Sanchis, L.; Lobán, C. F.-G.; Cid-Álvarez, B.; Hernández-García, J. M.; Garrote-Coloma, C.; Fernández-Peregrina, E.; Romero, M.; León Arguero, V.; Cruz-González, I. Prognostic Role of TAPSE to PASP Ratio in Patients Undergoing MitraClip Procedure. JCM 2021, 10 (5), 1006. [CrossRef]
- Pascual, I.; Arzamendi, D.; Carrasco-Chinchilla, F.; Fernández-Vázquez, F.; Freixa, X.; Nombela-Franco, L.; Avanzas, P.; Serrador Frutos, A. M.; Pan, M.; Cid Álvarez, A. B.; Hernández-Antolín, R. A.; Andraka Ikazuriaga, L.; Cruz-González, I.; Díez Gil, J. L.; Alcasena Juango, M. S.; Berenguer Jofresa, A.; Alonso-Briales, J. H.; Li, C. H.; Benito González, T.; Regueiro, A.; Armijo, G.; León, V.; Amat-Santos, I. J.; Romero, M.; Trillo Nouche, R.; Fernández-Golfín, C.; Ruiz Gómez, L.; Campos-Arjona, R.; Millán, X.; Garrote Coloma, C.; Sanchis, L.; Jiménez-Quevedo, P.; Morís, C.; Hernández-García, J. M.; Serra, A.; Pérez De Prado, A.; Estévez-Loureiro, R. Transcatheter Mitral Repair According to the Cause of Mitral Regurgitation: Real-Life Data from the Spanish MitraClip Registry. Revista Española de Cardiología (English Edition) 2020, 73 (8), 643–651. [CrossRef]
- Voigt, J.-U.; Pedrizzetti, G.; Lysyansky, P.; Marwick, T. H.; Houle, H.; Baumann, R.; Pedri, S.; Ito, Y.; Abe, Y.; Metz, S.; Song, J. H.; Hamilton, J.; Sengupta, P. P.; Kolias, T. J.; d’Hooge, J.; Aurigemma, G. P.; Thomas, J. D.; Badano, L. P. Definitions for a Common Standard for 2D Speckle Tracking Echocardiography: Consensus Document of the EACVI/ASE/Industry Task Force to Standardize Deformation Imaging. European Heart Journal - Cardiovascular Imaging 2015, 16 (1), 1–11. [CrossRef]
- Badano, L. P.; Kolias, T. J.; Muraru, D.; Abraham, T. P.; Aurigemma, G.; Edvardsen, T.; D’Hooge, J.; Donal, E.; Fraser, A. G.; Marwick, T.; Mertens, L.; Popescu, B. A.; Sengupta, P. P.; Lancellotti, P.; Thomas, J. D.; Voigt, J.-U.; Industry representatives; Prater, D.; Chono, T.; Mumm, B.; Houle, H.; Healthineers, S.; Hansen, G.; Abe, Y.; Pedri, S.; Reviewers: This document was reviewed by members of the 2016–2018 EACVI Scientific Documents Committee; Delgado, V.; Gimelli, A.; Cosyns, B.; Gerber, B.; Flachskampf, F.; Haugaa, K.; Galderisi, M.; Cardim, N.; Kaufmann, P.; Masci, P. G.; Marsan, N. A.; Rosca, M.; Cameli, M.; Sade, L. E. Standardization of Left Atrial, Right Ventricular, and Right Atrial Deformation Imaging Using Two-Dimensional Speckle Tracking Echocardiography: A Consensus Document of the EACVI/ASE/Industry Task Force to Standardize Deformation Imaging. European Heart Journal - Cardiovascular Imaging 2018, 19 (6), 591–600. [CrossRef]
- Schnitzler, K.; Hell, M.; Geyer, M.; Kreidel, F.; Münzel, T.; Von Bardeleben, R. S. Complications Following MitraClip Implantation. Curr Cardiol Rep 2021, 23 (9), 131. [CrossRef]
- Papadopoulos, K.; Ikonomidis, I.; Chrissoheris, M.; Chalapas, A.; Kourkoveli, P.; Parissis, J.; Spargias, K. MitraClip and Left Ventricular Reverse Remodelling: A Strain Imaging Study. ESC Heart Failure 2020, 7 (4), 1409–1418. [CrossRef]
- Ilardi, F.; D’Andrea, A.; D’Ascenzi, F.; Bandera, F.; Benfari, G.; Esposito, R.; Malagoli, A.; Mandoli, G. E.; Santoro, C.; Russo, V.; Crisci, M.; Esposito, G.; Cameli, M.; on behalf of the Working Group of Echocardiography of the Italian Society of Cardiology (SIC). Myocardial Work by Echocardiography: Principles and Applications in Clinical Practice. JCM 2021, 10 (19), 4521. [CrossRef]
- Marzlin, N.; Hays, A. G.; Peters, M.; Kaminski, A.; Roemer, S.; O’Leary, P.; Kroboth, S.; Harland, D. R.; Khandheria, B. K.; Tajik, A. J.; Jain, R. Myocardial Work in Echocardiography. Circ: Cardiovascular Imaging 2023, 16 (2). [CrossRef]
- Manganaro, R.; Marchetta, S.; Dulgheru, R.; Ilardi, F.; Sugimoto, T.; Robinet, S.; Cimino, S.; Go, Y. Y.; Bernard, A.; Kacharava, G.; Athanassopoulos, G. D.; Barone, D.; Baroni, M.; Cardim, N.; Hagendorff, A.; Hristova, K.; López-Fernández, T.; De La Morena, G.; Popescu, B. A.; Penicka, M.; Ozyigit, T.; Rodrigo Carbonero, J. D.; Van De Veire, N.; Von Bardeleben, R. S.; Vinereanu, D.; Zamorano, J. L.; Rosca, M.; Calin, A.; Moonen, M.; Magne, J.; Cosyns, B.; Galli, E.; Donal, E.; Carerj, S.; Zito, C.; Santoro, C.; Galderisi, M.; Badano, L. P.; Lang, R. M.; Oury, C.; Lancellotti, P. Echocardiographic Reference Ranges for Normal Non-Invasive Myocardial Work Indices: Results from the EACVI NORRE Study. European Heart Journal - Cardiovascular Imaging 2019, 20 (5), 582–590. [CrossRef]
- Adamo, M.; Inciardi, R. M.; Tomasoni, D.; Dallapellegrina, L.; Estévez-Loureiro, R.; Stolfo, D.; Lupi, L.; Pancaldi, E.; Popolo Rubbio, A.; Giannini, C.; Benito-González, T.; Fernández-Vázquez, F.; Caneiro-Queija, B.; Godino, C.; Munafò, A.; Pascual, I.; Avanzas, P.; Frea, S.; Boretto, P.; Moñivas Palomero, V.; Del Trigo, M.; Biagini, E.; Berardini, A.; Nombela-Franco, L.; Jimenez-Quevedo, P.; Lipsic, E.; Saia, F.; Petronio, A. S.; Bedogni, F.; Sinagra, G.; Guazzi, M.; Voors, A.; Metra, M. Changes in Right Ventricular–to–Pulmonary Artery Coupling After Transcatheter Edge-to-Edge Repair in Secondary Mitral Regurgitation. JACC: Cardiovascular Imaging 2022, 15 (12), 2038–2047. [CrossRef]
- Humbert, M.; Kovacs, G.; Hoeper, M. M.; Badagliacca, R.; Berger, R. M. F.; Brida, M.; Carlsen, J.; Coats, A. J. S.; Escribano-Subias, P.; Ferrari, P.; Ferreira, D. S.; Ghofrani, H. A.; Giannakoulas, G.; Kiely, D. G.; Mayer, E.; Meszaros, G.; Nagavci, B.; Olsson, K. M.; Pepke-Zaba, J.; Quint, J. K.; Rådegran, G.; Simonneau, G.; Sitbon, O.; Tonia, T.; Toshner, M.; Vachiery, J. L.; Vonk Noordegraaf, A.; Delcroix, M.; Rosenkranz, S.; ESC/ERS Scientific Document Group; Schwerzmann, M.; Dinh-Xuan, A. T.; Bush, A.; Abdelhamid, M.; Aboyans, V.; Arbustini, E.; Asteggiano, R.; Barberà, J. A.; Beghetti, M.; Čelutkienė, J.; Cikes, M.; Condliffe, R.; De Man, F.; Falk, V.; Fauchier, L.; Gaine, S.; Galié, N.; Gin-Sing, W.; Granton, J.; Grünig, E.; Hassoun, P. M.; Hellemons, M.; Jaarsma, T.; Kjellström, B.; Klok, F. A.; Konradi, A.; Koskinas, K. C.; Kotecha, D.; Lang, I.; Lewis, B. S.; Linhart, A.; Lip, G. Y. H.; Løchen, M. L.; Mathioudakis, A. G.; Mindham, R.; Moledina, S.; Naeije, R.; Nielsen, J. C.; Olschewski, H.; Opitz, I.; Petersen, S. E.; Prescott, E.; Rakisheva, A.; Reis, A.; Ristić, A. D.; Roche, N.; Rodrigues, R.; Selton-Suty, C.; Souza, R.; Swift, A. J.; Touyz, R. M.; Ulrich, S.; Wilkins, M. R.; Wort, S. J. 2022 ESC/ERS Guidelines for the Diagnosis and Treatment of Pulmonary Hypertension. European Heart Journal 2022, 43 (38), 3618–3731. [CrossRef]
- Whitlow, P. L.; Feldman, T.; Pedersen, W. R.; Lim, D. S.; Kipperman, R.; Smalling, R.; Bajwa, T.; Herrmann, H. C.; Lasala, J.; Maddux, J. T.; Tuzcu, M.; Kapadia, S.; Trento, A.; Siegel, R. J.; Foster, E.; Glower, D.; Mauri, L.; Kar, S. Acute and 12-Month Results With Catheter-Based Mitral Valve Leaflet Repair. Journal of the American College of Cardiology 2012, 59 (2), 130–139. [CrossRef]
- Stone, G. W.; Lindenfeld, J.; Abraham, W. T.; Kar, S.; Lim, D. S.; Mishell, J. M.; Whisenant, B.; Grayburn, P. A.; Rinaldi, M.; Kapadia, S. R.; Rajagopal, V.; Sarembock, I. J.; Brieke, A.; Marx, S. O.; Cohen, D. J.; Weissman, N. J.; Mack, M. J. Transcatheter Mitral-Valve Repair in Patients with Heart Failure. N Engl J Med 2018, 379 (24), 2307–2318. [CrossRef]
- Stolz, L.; Doldi, P. M.; Sannino, A.; Hausleiter, J.; Grayburn, P. A. The Evolving Concept of Secondary Mitral Regurgitation Phenotypes. JACC: Cardiovascular Imaging 2024, S1936878X24000640. [CrossRef]
- Gucuk Ipek, E.; Singh, S.; Viloria, E.; Feldman, T.; Grayburn, P.; Foster, E.; Qasim, A. Impact of the MitraClip Procedure on Left Atrial Strain and Strain Rate. Circ: Cardiovascular Imaging 2018, 11 (3), e006553. [CrossRef]
- Shafii, A. E.; Gillinov, A. M.; Mihaljevic, T.; Stewart, W.; Batizy, L. H.; Blackstone, E. H. Changes in Left Ventricular Morphology and Function After Mitral Valve Surgery. The American Journal of Cardiology 2012, 110 (3), 403-408.e3. [CrossRef]
- Galli, E.; Hubert, P.; Leurent, G.; Auffret, V.; Panis, V.; L’Official, G.; Donal, E. Acute and Chronic Changes in Myocardial Work Parameters in Patients with Severe Primary Mitral Regurgitation Undergoing Transcatheter Edge-to-Edge Repair. JCDD 2023, 10 (3), 100. [CrossRef]
- Yedidya, I.; Stassen, J.; Butcher, S. C.; Pio, S. M.; Lustosa, R. P.; Van Der Bijl, P.; Vo, N. M.; Namazi, F.; Marsan, N. A.; Delgado, V.; Bax, J. J. Relation of Myocardial Work Indexes and Forward Flow Reserve in Patients With Significant Secondary Mitral Regurgitation Undergoing Transcatheter Mitral Valve Repair. The American Journal of Cardiology 2022, 178, 106–111. [CrossRef]
- Constant Dit Beaufils, A.-L.; Huttin, O.; Jobbe-Duval, A.; Senage, T.; Filippetti, L.; Piriou, N.; Cueff, C.; Venner, C.; Mandry, D.; Sellal, J.-M.; Le Scouarnec, S.; Capoulade, R.; Marrec, M.; Thollet, A.; Beaumont, M.; Hossu, G.; Toquet, C.; Gourraud, J.-B.; Trochu, J.-N.; Warin-Fresse, K.; Marie, P.-Y.; Schott, J.-J.; Roussel, J.-C.; Serfaty, J.-M.; Selton-Suty, C.; Le Tourneau, T. Replacement Myocardial Fibrosis in Patients With Mitral Valve Prolapse: Relation to Mitral Regurgitation, Ventricular Remodeling, and Arrhythmia. Circulation 2021, 143 (18), 1763–1774. [CrossRef]
- Kitkungvan, D.; Yang, E. Y.; El Tallawi, K. C.; Nagueh, S. F.; Nabi, F.; Khan, M. A.; Nguyen, D. T.; Graviss, E. A.; Lawrie, G. M.; Zoghbi, W. A.; Bonow, R. O.; Quinones, M. A.; Shah, D. J. Extracellular Volume in Primary Mitral Regurgitation. JACC: Cardiovascular Imaging 2021, 14 (6), 1146–1160. [CrossRef]
- Stassen, J.; Namazi, F.; Van Der Bijl, P.; Van Wijngaarden, S. E.; Kamperidis, V.; Marsan, N. A.; Delgado, V.; Bax, J. J. Left Atrial Reservoir Function and Outcomes in Secondary Mitral Regurgitation. Journal of the American Society of Echocardiography 2022, 35 (5), 477-485.e3. [CrossRef]
- Toprak, C.; Kahveci, G.; Kilicgedik, A.; Pala, S.; Kirma, C.; Tabakci, M. M.; Inanir, M.; Esen, A. M. Left Atrial Remodeling in Patients Undergoing Percutaneous Mitral Valve Repair with the MitraClip System: An Advanced Echocardiography Study. Echocardiography 2016, 33 (10), 1504–1511. [CrossRef]
- Lavall, D.; Stöbe, S. Myocardial Function in Secondary Mitral Regurgitation: A Challenging Relationship. Circ: Cardiovascular Imaging 2021, 14 (9). [CrossRef]
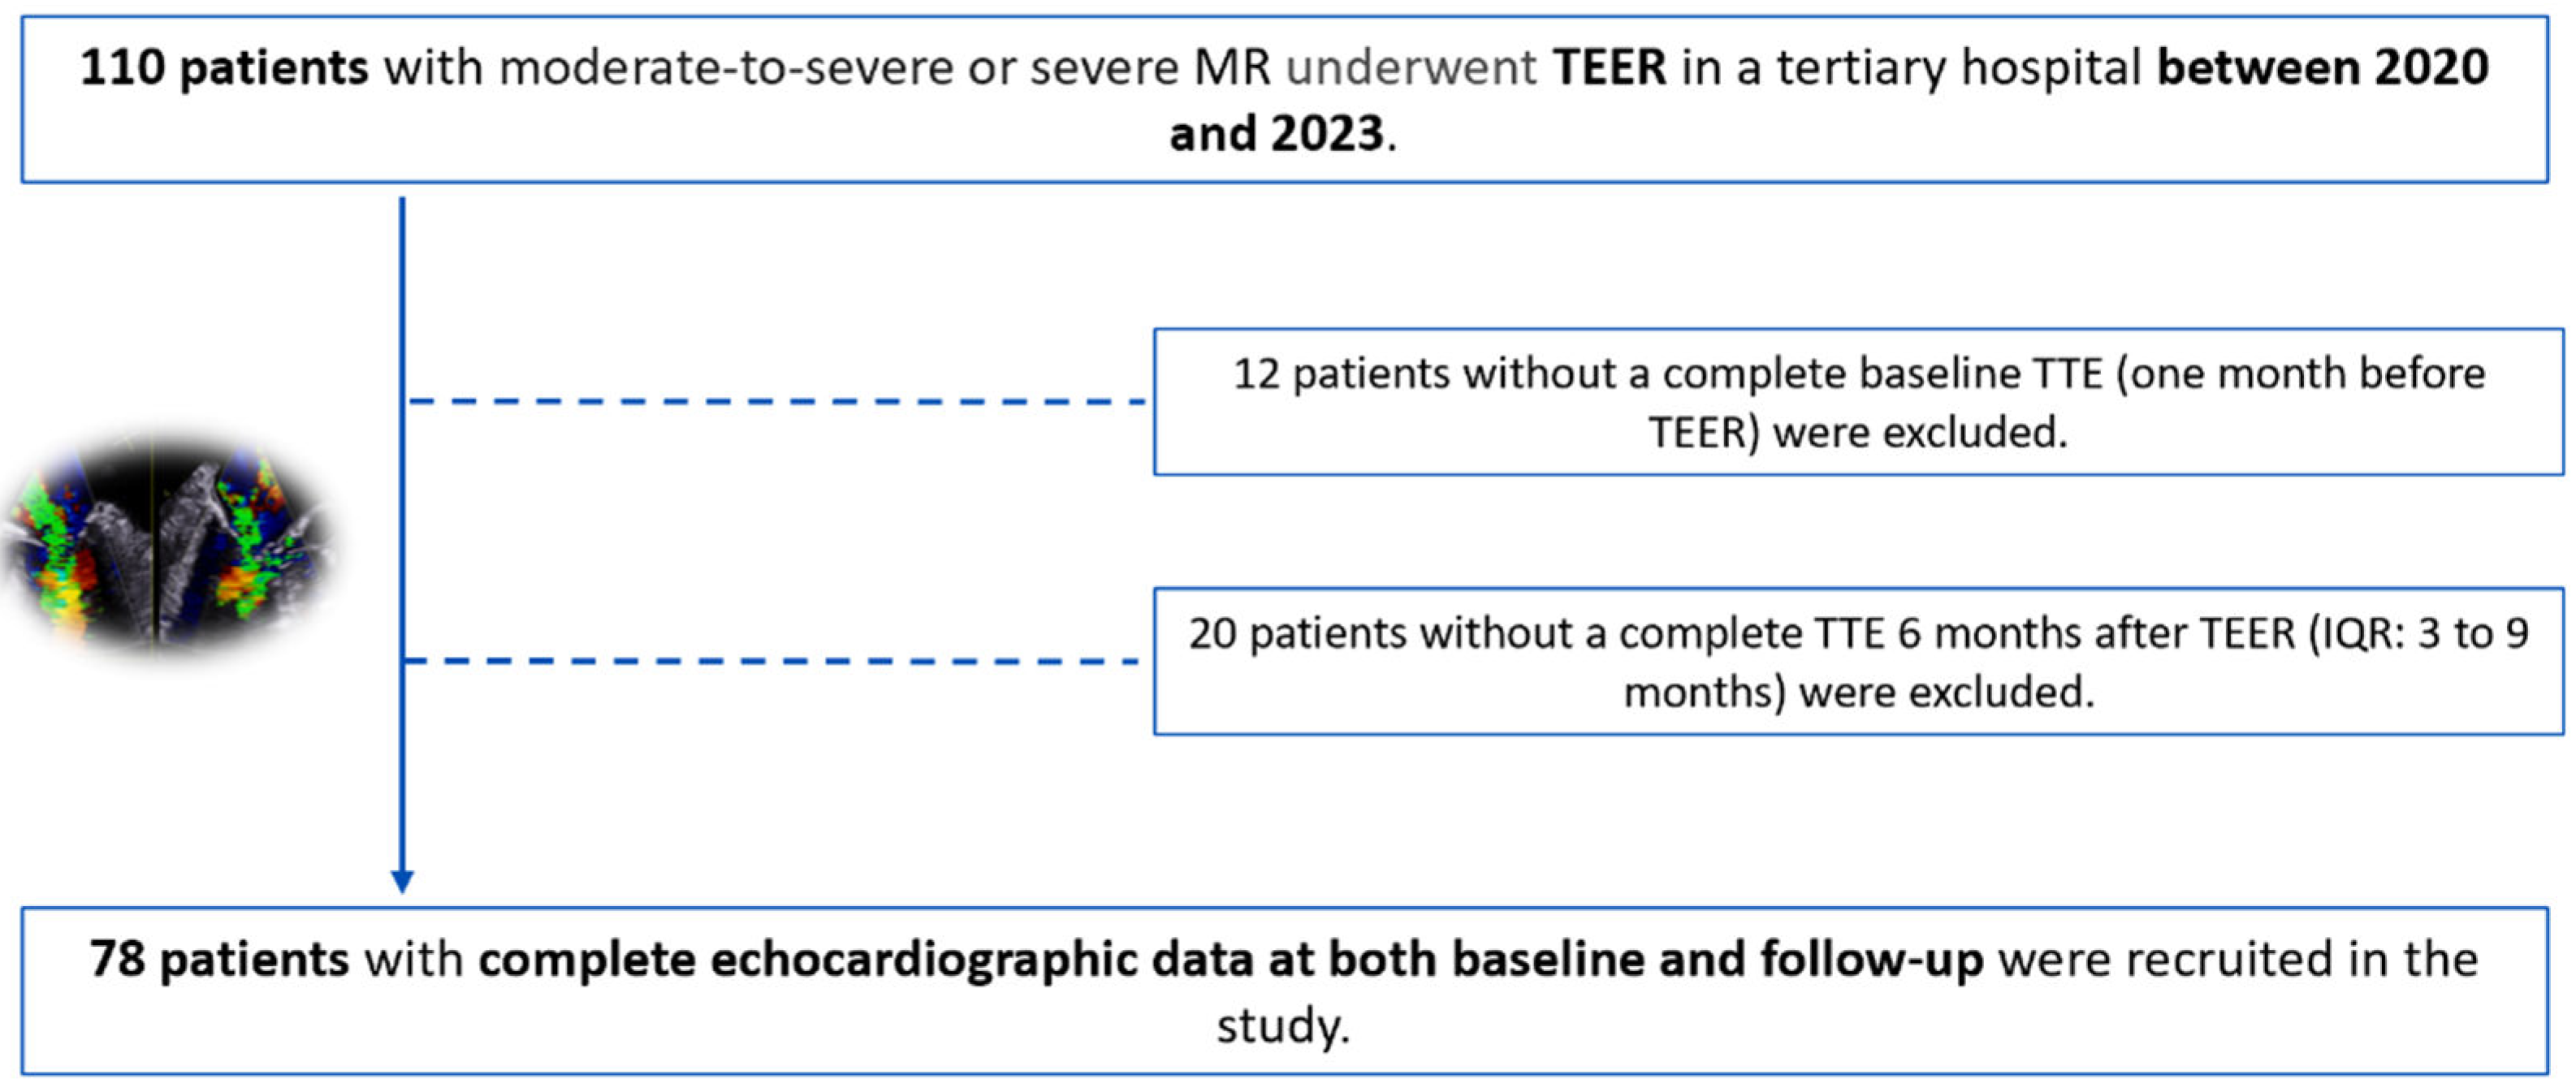
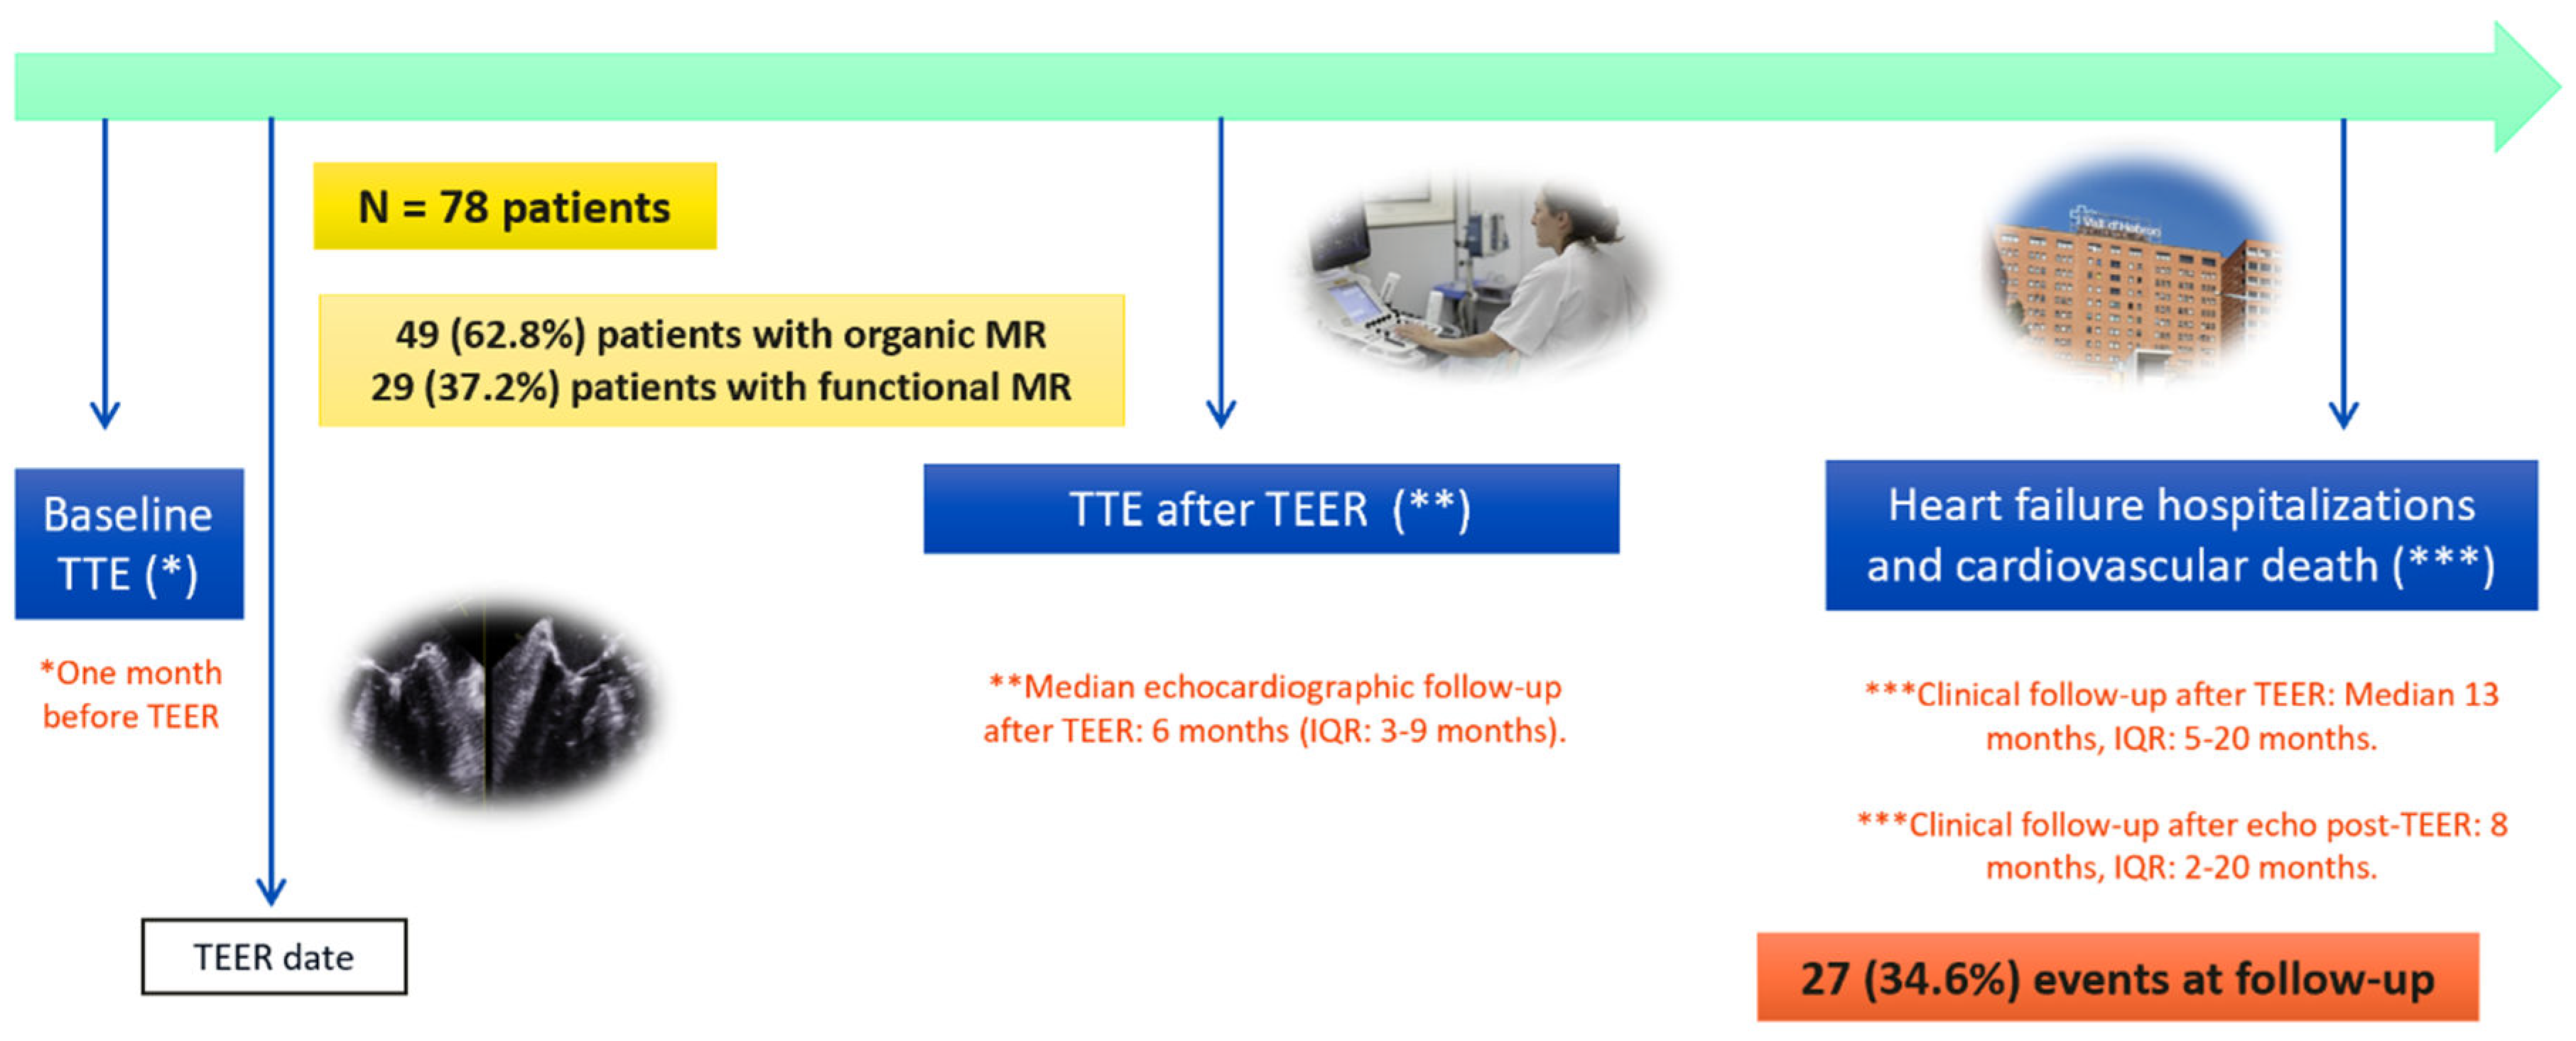
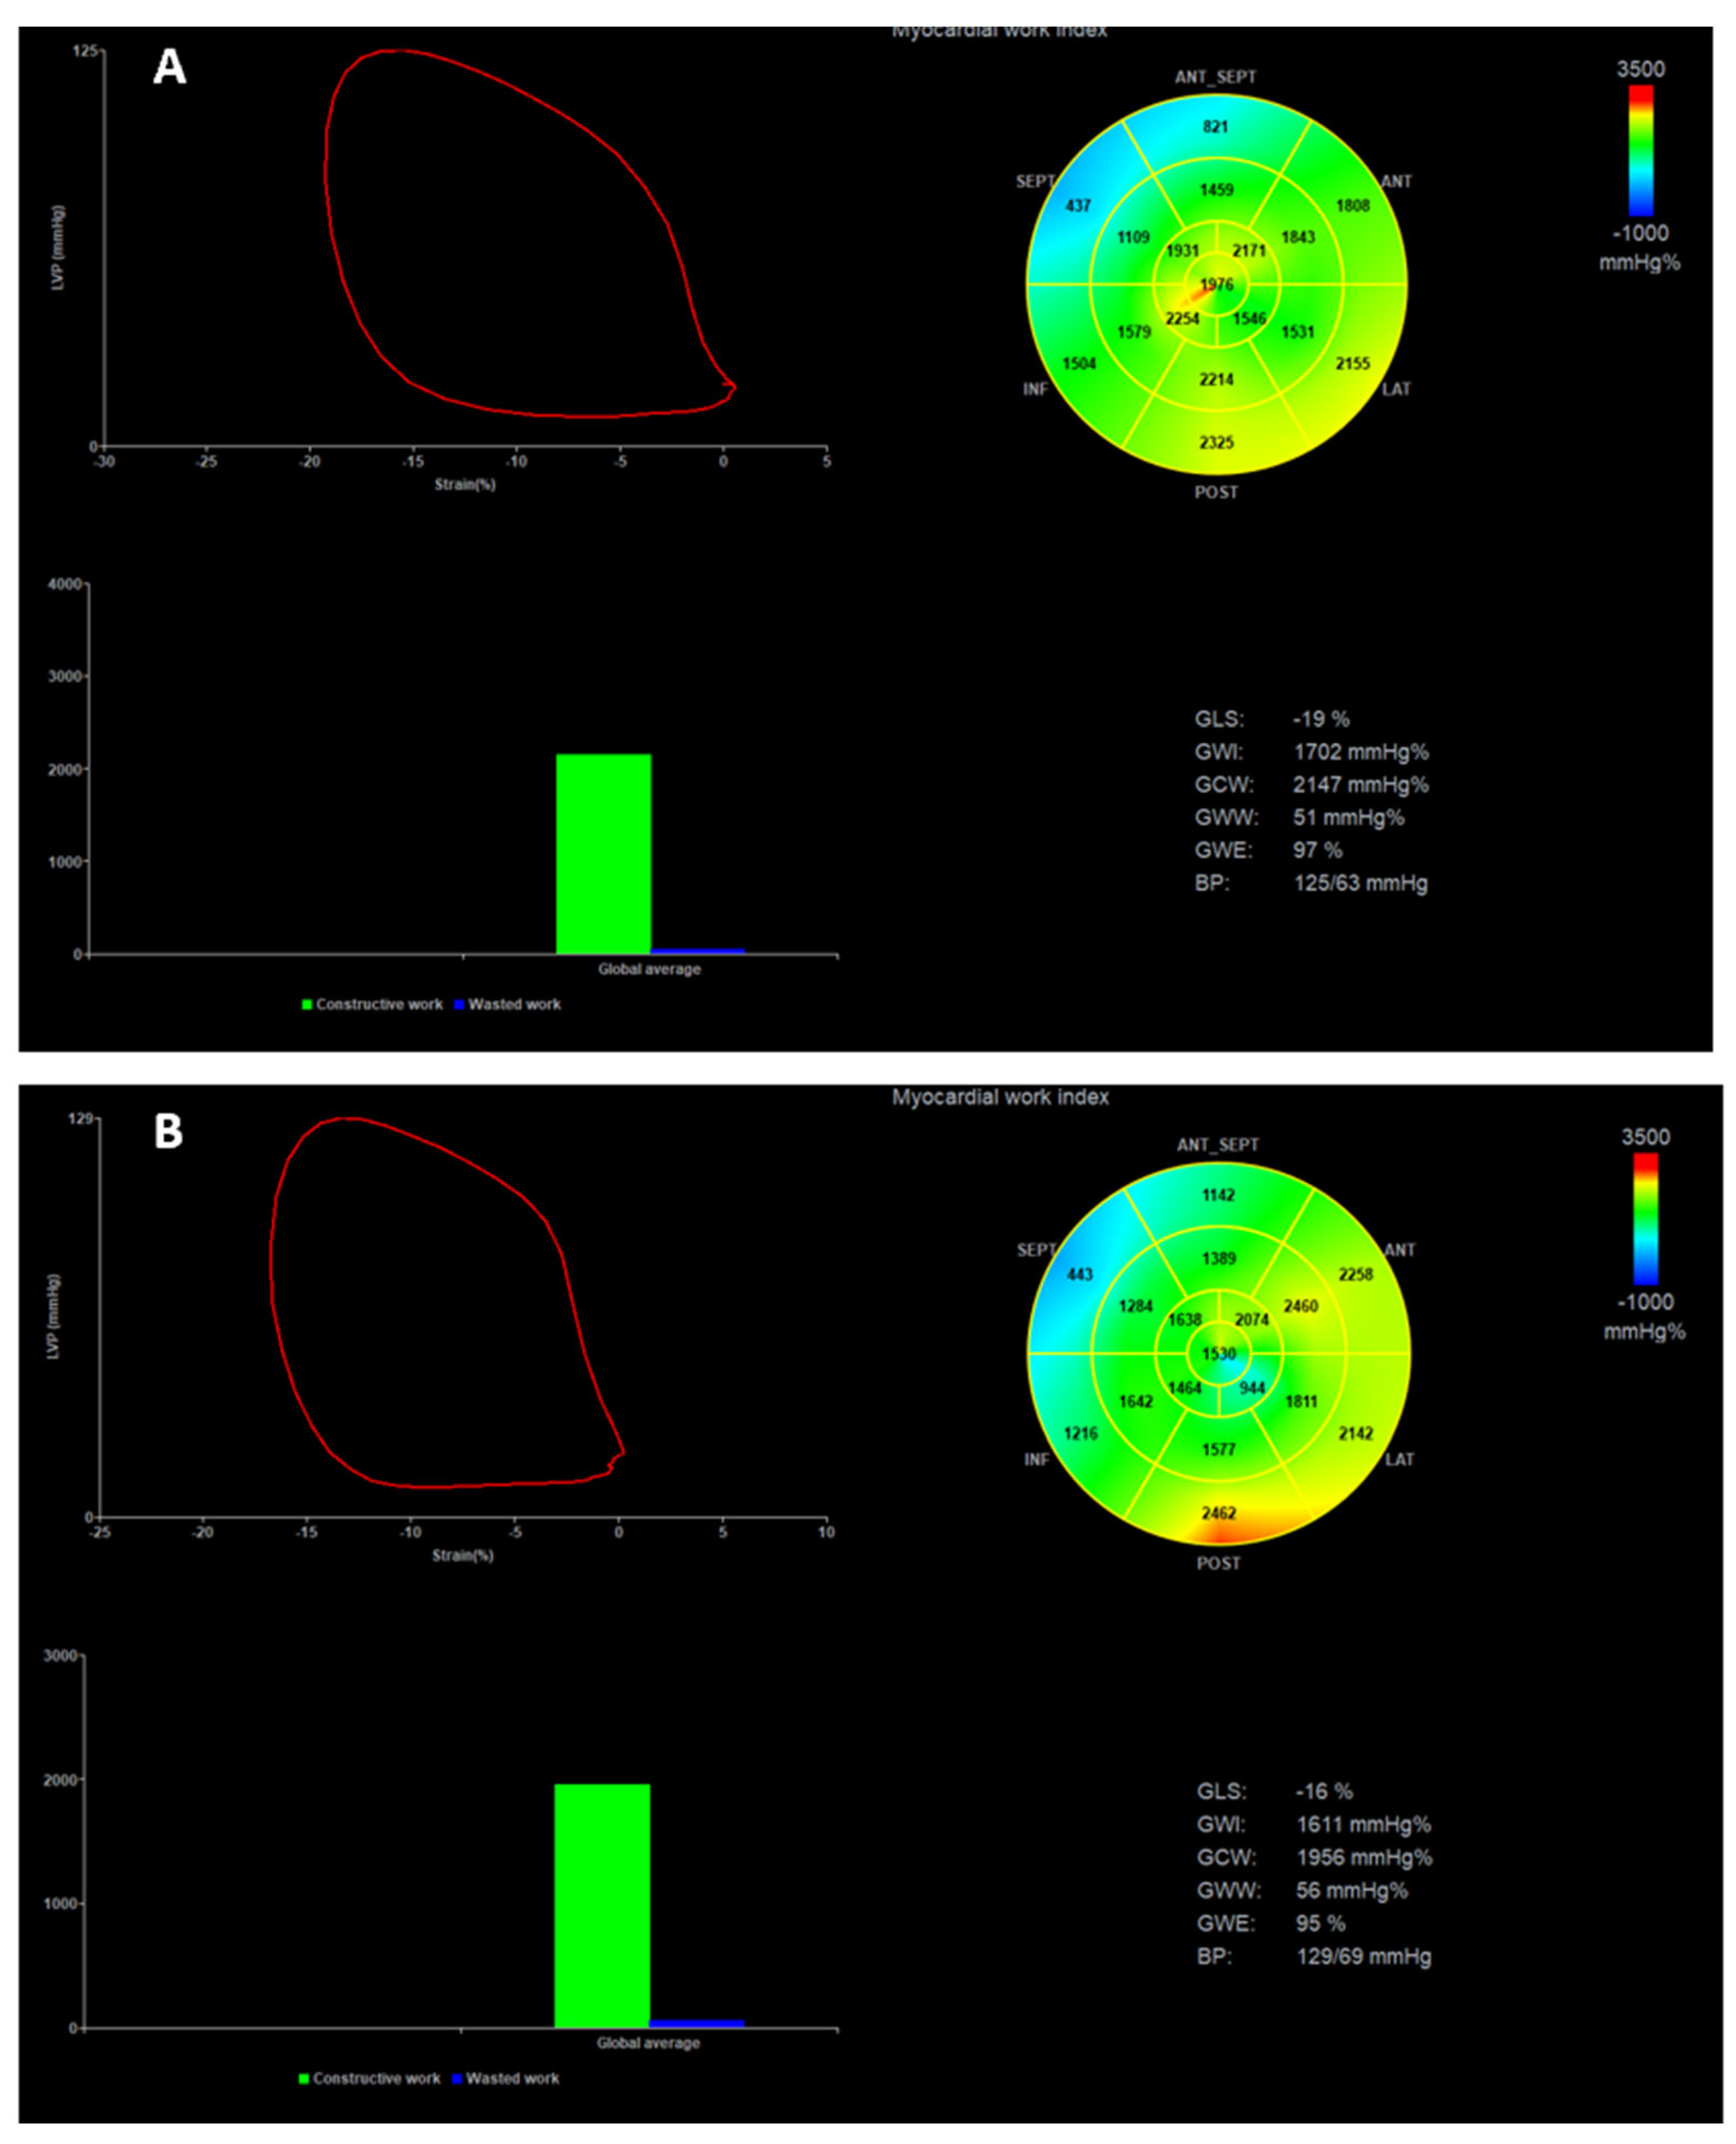
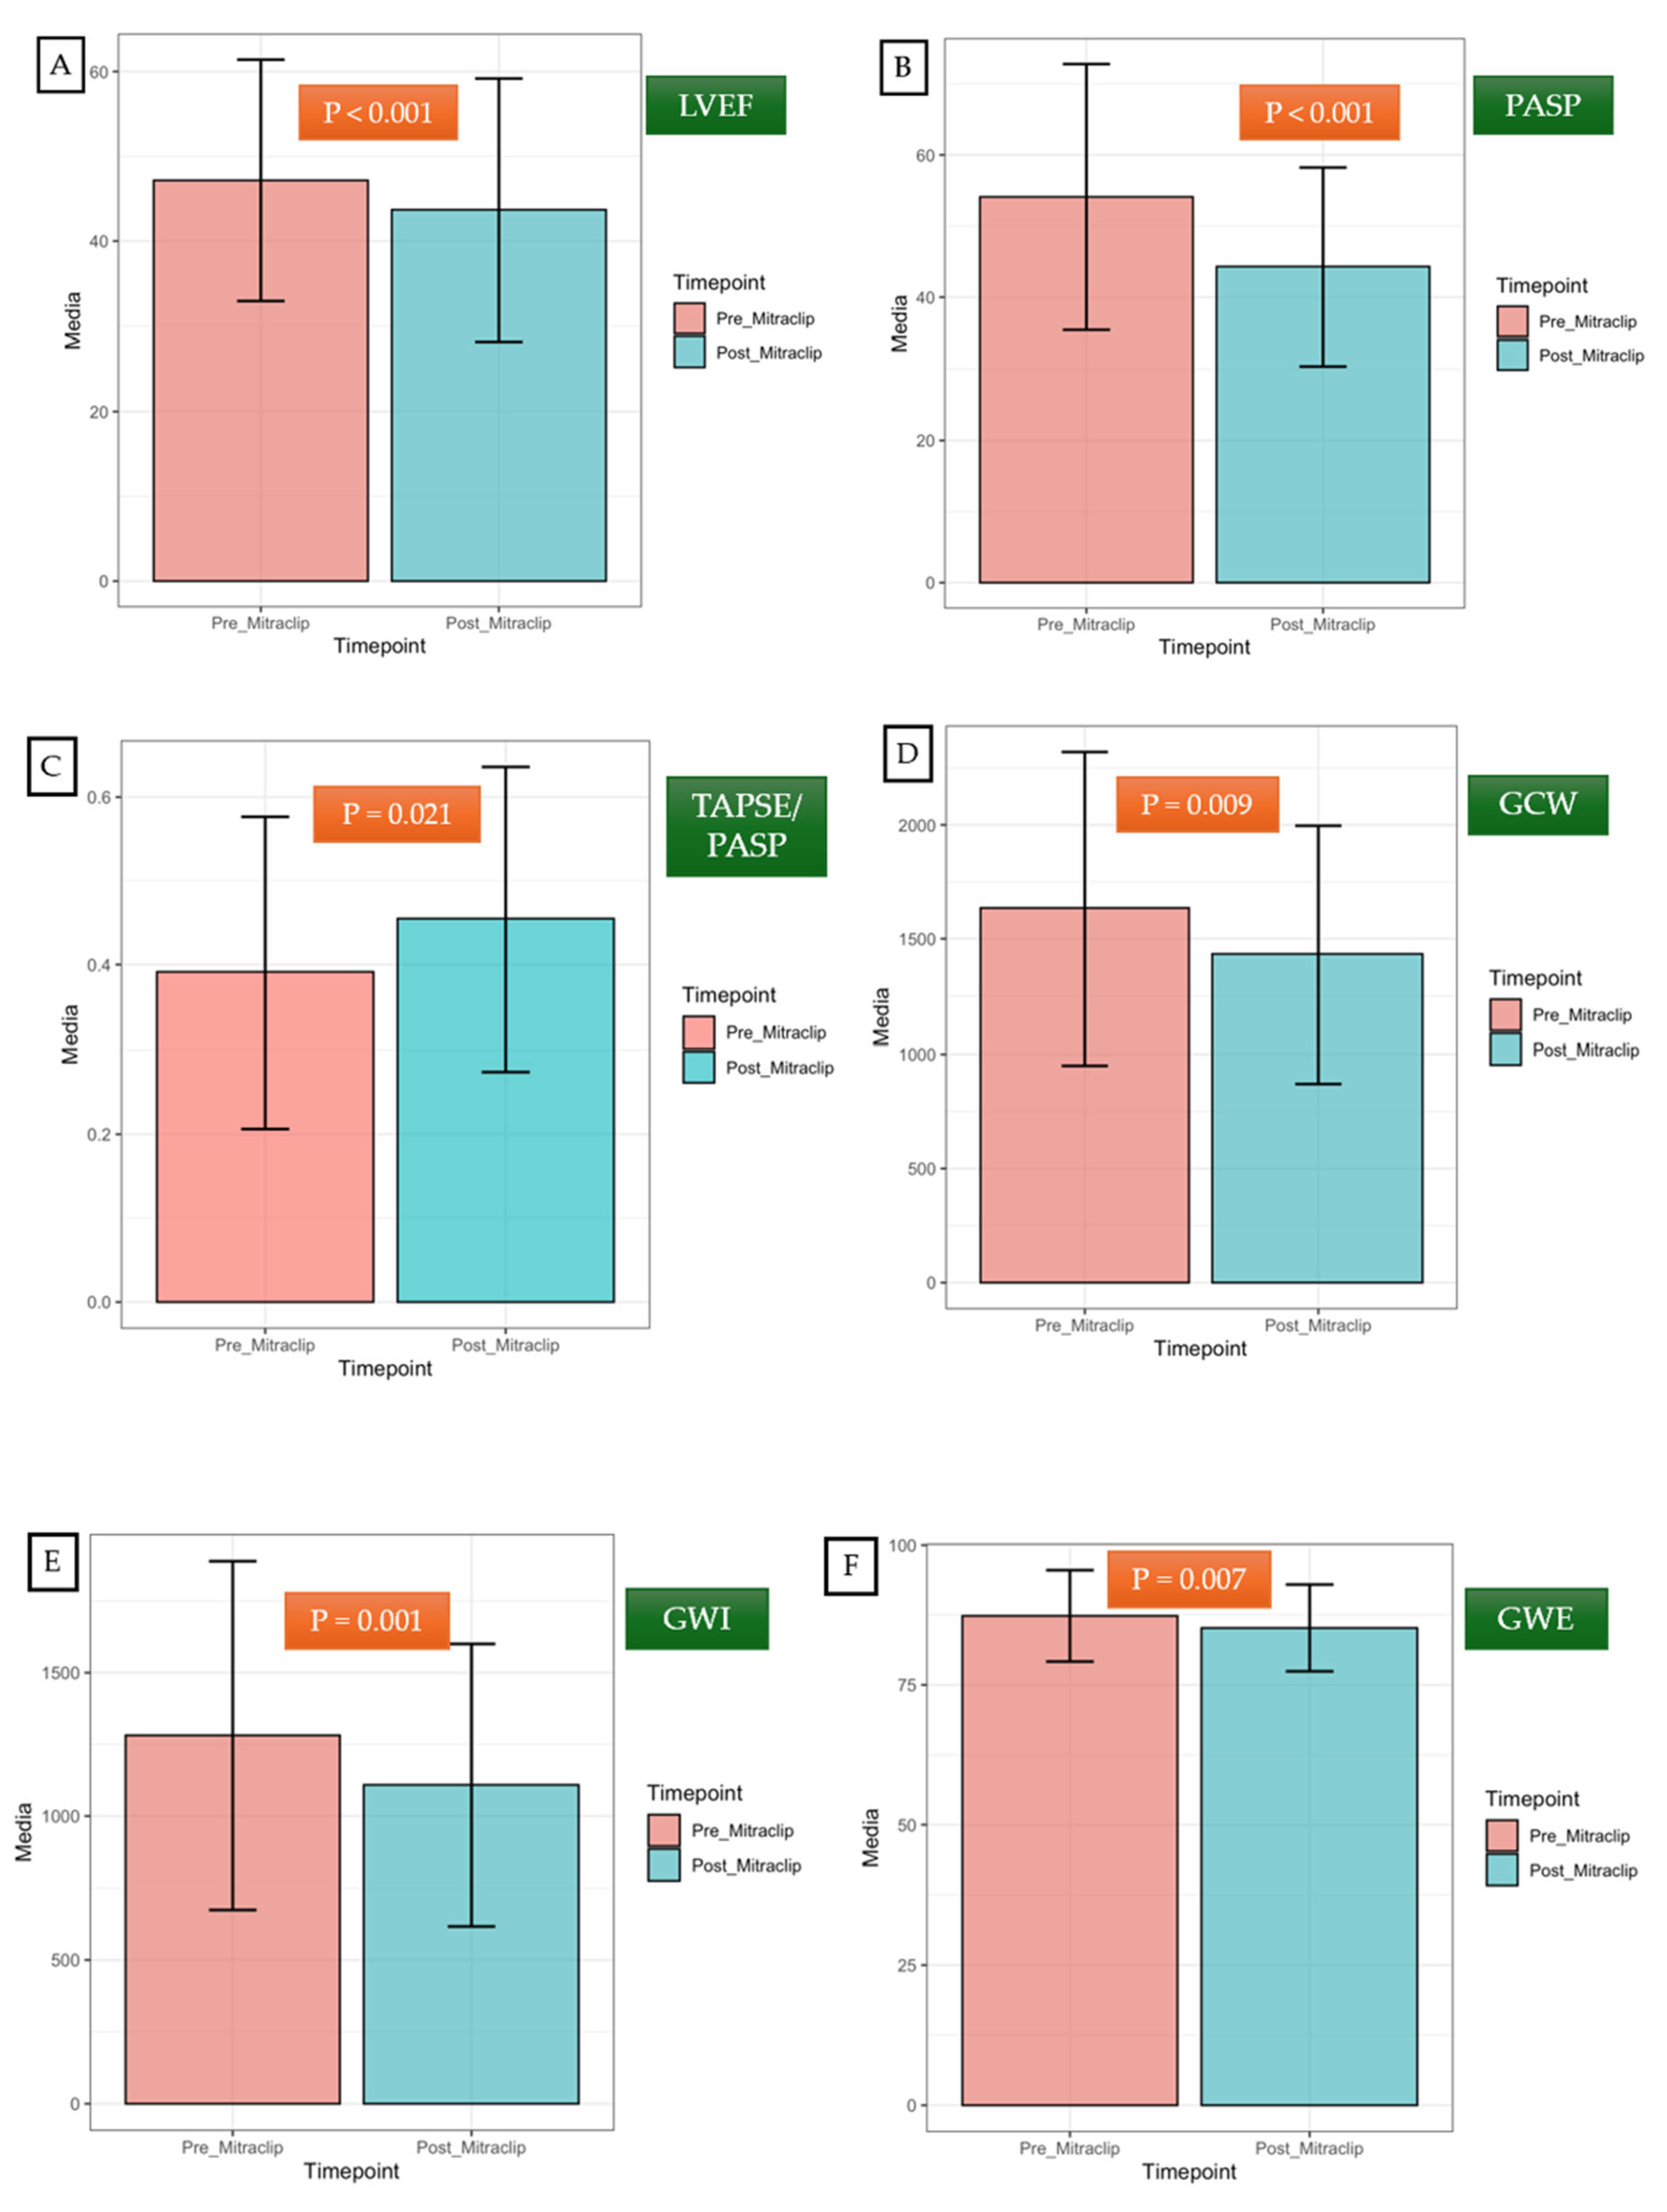

| All patients (N=78) | Functional MR (N=29) | Organic MR (N=49) | P-value | |
|---|---|---|---|---|
| Age (year) | 74±9 | 75±9 | 74±9 | 0.898 |
| Sex female | 36 (46.2%) | 16 (55.2%) | 20 (40.8%) | 0.320 |
| Dyslipidemia | 46 (58.9%) | 19 (65.5%) | 33 (67.3%) | 1.000 |
| Diabetes | 34 (43.5%) | 10 (34.4%) | 23 (46.9%) | 0.440 |
| Hypertension | 66 (84.6%) | 25 (86.2%) | 41 (83.6%) | 1.000 |
| Known atrial fibrillation | 49 (62.8%) | 24 (82.7%) | 27 (55.1%) | 0.052 |
| Ischemic heart disease | 36 (46.1%) | 9 (31.0%) | 26 (53.0%) | 0.124 |
| Prior heart failure hospitalization | 54 (69.2%) | 19 (65.5%) | 35 (71.4%) | 0.826 |
| Pacemaker or defibrillation therapy | 6 (7.6%) | 2 (6.8%) | 4 (8.1%) | 1.000 |
| Prior Cardiac Surgery | 18 (26.5%) | 7 (30.4%) | 11 (24.4%) | 0.811 |
| NYHA class: | 0.353 | |||
| NYHA 1 | 1 (1.3%) | 0 (0.0%) | 1 (2.0%) | |
| NYHA 2 | 26 (33.3%) | 13 (44.8%) | 13 (26.6%) | |
| NYHA 3 | 43 (55.1%) | 14 (48.3%) | 29 (59.2%) | |
| NYHA 4 | 8 (10.3%) | 2 (6.90%) | 6 (12.2%) | |
| Chronic renal impairment | 33 (42.3%) | 10 (34.4%) | 22 (44.8%) | 0.644 |
| Chronic obstructive pulmonary disease | 12 (15.3%) | 5 (17.2%) | 7 (14.2%) | 0.738 |
| Furosemide | 71 (91.0%) | 26 (89.6%) | 44 (89.7%) | 1.000 |
| Beta-blockers | 58 (74.3%) | 24 (82.7%) | 35 (71.4%) | 0.583 |
| ACE-I, ARA-2, or sacubitril/valsartan | 38 (48.7%) | 15 (51.7%) | 23 (46.9%) | 0.866 |
| MRA | 33 (42.3%) | 10 (34.4%) | 23 (46.9%) | 0.451 |
| SGLT2-inhibitors | 19 (24.3%) | 11 (37.9%) | 9 (18.3%) | 0.137 |
| All patients (N=78) | Functional MR (N=29) | Organic MR (N=49) | P-value | |
|---|---|---|---|---|
| LVEF (%) | 50.0 [36.0;60.0] | 54.0 [40.0;60.0] | 45.0 [35.0;61.0] | 0.427 |
| LVEDV (ml) | 120 [90.8;151] | 102 [84.0;129] | 127 [96.0;153] | 0.048 |
| LVEDVI (ml/m2) | 74.5±29.1 | 60.1 [45.1;72.9] | 74.1 [62.6;84.6] | 0.016 |
| LVESV (ml) | 61.0 [38.0;91.0] | 48.0 [34.2;72.8] | 66.0 [47.0;96.5] | 0.065 |
| LVEDD (mm) | 54.9±8.87 | 54.0±7.46 | 55.4±9.54 | 0.484 |
| LVESD (mm) | 38.0 [31.0;49.0] | 36.0 [32.0;44.0] | 40.5 [31.0;49.8] | 0.361 |
| LV GLS (%) | -13.76±3.88 | -13.68±3.28 | -13.80±4.17 | 0.914 |
| GWI (mmHg%) | 1277±600 | 1281±476 | 1275±654 | 0.966 |
| GCW (mmHg%) | 1628±680 | 1615±489 | 1635±756 | 0.898 |
| GWW (mmHg%) | 149 [96.5;218] | 119 [59.0;184] | 157 [105;225] | 0.094 |
| GWE (%) | 90.0 [84.0;93.5] | 90.0 [87.0;95.0] | 89.0 [81.8;93.0] | 0.124 |
| Left atrial volume index (ml/m2) | 40.6±19.3 | 40.4 [30.8;45.8] | 34.7 [26.4;46.8] | 0.675 |
| Left atrial strain reservoir (%) | 10.0 [7.00;16.0] | 8.00 [7.00;11.0] | 11.0 [7.25;16.8] | 0.118 |
| MR grade: | 0.691 | |||
| MR grade 3 | 20 (25.6%) | 10 (34.5%) | 9 (18.4%) | |
| MR grade 4 | 58 (74.4%) | 19 (65.5%) | 40 (81.6%) | |
| EROA (mm2) | 37.0 [30.0;40.0] | 30.0 [29.2;40.0] | 40.0 [30.0;40.0] | 0.038 |
| Transmitral mean pressure gradient (mmHg) | 2.05 [1.60;2.68] | 1.90 [1.35;2.50] | 2.20 [1.65;2.75] | 0.269 |
| TAPSE (mm) | 17.9±3.79 | 16.9±3.02 | 18.3±4.06 | 0.113 |
| RV FWS (%) | -19.20 [-21.95;-14.20] | -19.10 [-20.25;-14.80] | -19.40 [-25.00;-14.50] | 0.381 |
| Tricuspid regurgitation grade: | 0.083 | |||
| TR ≤ 2 | 51 (65.3%) | 15 (51.7%) | 35 (71.4%) | |
| TR ≥ 3 | 27 (34.7%) | 14 (48.3%) | 14 (28.6%) | |
| PASP (mmHg) | 48.5 [38.8;66.0] | 46.0 [38.5;58.5] | 49.0 [40.0;73.0] | 0.190 |
| TAPSE/PASP | 0.40±0.19 | 0.40±0.15 | 0.40±0.20 | 0.949 |
| All patients one month before TEER | All patients six months after TEER | P-Value | |
|---|---|---|---|
| LVEF (%) | 47.37 ± 14.26 | 43.74 ± 15.38 | < 0.001 |
| LVEDV (ml) | 130.59 ± 56.11 | 123.00 ± 53.24 | 0.049 |
| LVESV (ml) | 72.60 ± 47.17 | 71.33 ± 44.69 | 0.584 |
| LVEDD (mm) | 54.81 ± 8.96 | 53.30 ± 9.30 | 0.013 |
| LVESD (mm) | 40.09 ± 11.34 | 39.83 ± 11.57 | 0.742 |
| GLS (%) | -13.28 ± 3.82 | -12.28 ± 3.97 | 0.085 |
| GWI (mmHg%) | 1292.52 ± 608.54 | 1113.89 ± 489.49 | 0.001 |
| GCW (mmHg%) | 1647.15 ± 686.32 | 1438.56 ± 559.95 | 0.009 |
| GWW (mmHg%) | 173.50 ± 126.75 | 202.84 ± 104.63 | 0.062 |
| GWE (mmHg%) | 87.48 ± 8.18 | 85.11 ± 7.73 | 0.007 |
| LA volume (ml) | 70.52 ± 34.10 | 70.04 ± 36.62 | 0.841 |
| LA strain reservoir (%) | 12.03 ± 6.38 | 10.00 ± 4.56 | 0.002 |
| TAPSE (mm) | 17.80 ± 3.90 | 17.97 ± 3.96 | 0.687 |
| RV FWS (%) | -19.36 ± 5.84 | -20.01 ± 5.66 | 0.477 |
| PASP (mmHg) | 53.64 ± 18.64 | 43.86 ± 14.92 | < 0.001 |
| TAPSE/PASP | 0.39 ± 0.19 | 0.45 ± 0.18 | 0.021 |
| TAPSE/PASP < 0.32 (*) | 30 (38.46%) | 13 (16.66%) | 0.006 |
| PASP > 56 mmHg | 33 (42.30%) | 16 (20.51%) | 0.006 |
| PASP > 40 mmHg | 57 (73.07%) | 46 (58.97%) | 0.052 |
| Univariable analysis | P-value | Hazard ratio |
|---|---|---|
| Baseline clinical variable | ||
| MR type | 0.280 | 1.67 (0.66-4.22) |
| Age | 0.747 | 1.01 (0.97-1.05) |
| Sex | 0.752 | 1.14 (0.51-2.56) |
| Diabetes | 0.045 | 2.25 (1.02-4.98) |
| Known atrial fibrillation | 0.194 | 1.84 (0.73-4.64) |
| Ischemic heart disease | 0.057 | 2.19 (0.98-4.90) |
| Prior heart failure hospitalization | 0.017 | 3.69 (1.26-10.83) |
| Prior Cardiac Surgery | 0.404 | 0.68 (0.27-1.70) |
| Chronic Kidney disease | 0.187 | 1.70 (0.77-3.73) |
| Chronic obstructive pulmonary disease | 0.523 | 1.42 (0.48-4.17) |
| Baseline TTE variables (one month before TEER) | ||
| LVEF (%) | 0.307 | 0.99 (0.96-1.01) |
| LV GLS (%) | 0.353 | 1.05 (0.94-1.18) |
| GWI (mmHg%) | 0.530 | 1.00 (1.00-1.00) |
| GCW (mmHg%) | 0.474 | 1.00 (1.00-1.00) |
| GWW (mmHg%) | 0.467 | 1.00 (0.99-1.00) |
| GWE (mmHg%) | 0.925 | 1.00 (0.96-1.05) |
| LA volume (ml/m2) | 0.837 | 1.00 (0.98-1.02) |
| LA strain reservoir (%) | 0.122 | 0.94 (0.87-1.02) |
| TAPSE (mm) | 0.545 | 0.97 (0.87-1.08) |
| RV FWS (%) | 0.853 | 0.99 (0.88-1.11) |
| PASP (mmHg) | 0.438 | 1.01 (0.99-1.03) |
| TAPSE/PASP | 0.259 | 0.25 (0.02-2.79) |
| TTE variables six months after TEER (IQR: 3 to 9 months) | ||
| LVEF (%) | 0.377 | 0.99 (0.95-1.02) |
| LV GLS (%) | 0.217 | 1.09 (0.95-1.24) |
| GWI (mmHg%) | 0.230 | 1.00 (1.00-1.00) |
| GCW (mmHg%) | 0.101 | 1.00 (1.00-1.00) |
| GWW (mmHg%) | 0.267 | 1.00 (0.99-1.00) |
| GWE (mmHg%) | 0.932 | 1.00 (0.94-1.06) |
| LA volume (ml) | 0.818 | 1.00 (0.98-1.02) |
| LA strain reservoir (%) | 0.024 | 0.86 (0.76-0.98) |
| TAPSE (mm) | 0.305 | 0.94 (0.84-1.06 |
| RV FWS (%) | 0.552 | 1.06 (0.88-1.26) |
| PASP (mmHg) | 0.247 | 1.02 (0.99-1.06) |
| TAPSE/PASP | 0.038 | 0.02 (0.00-0.80) |
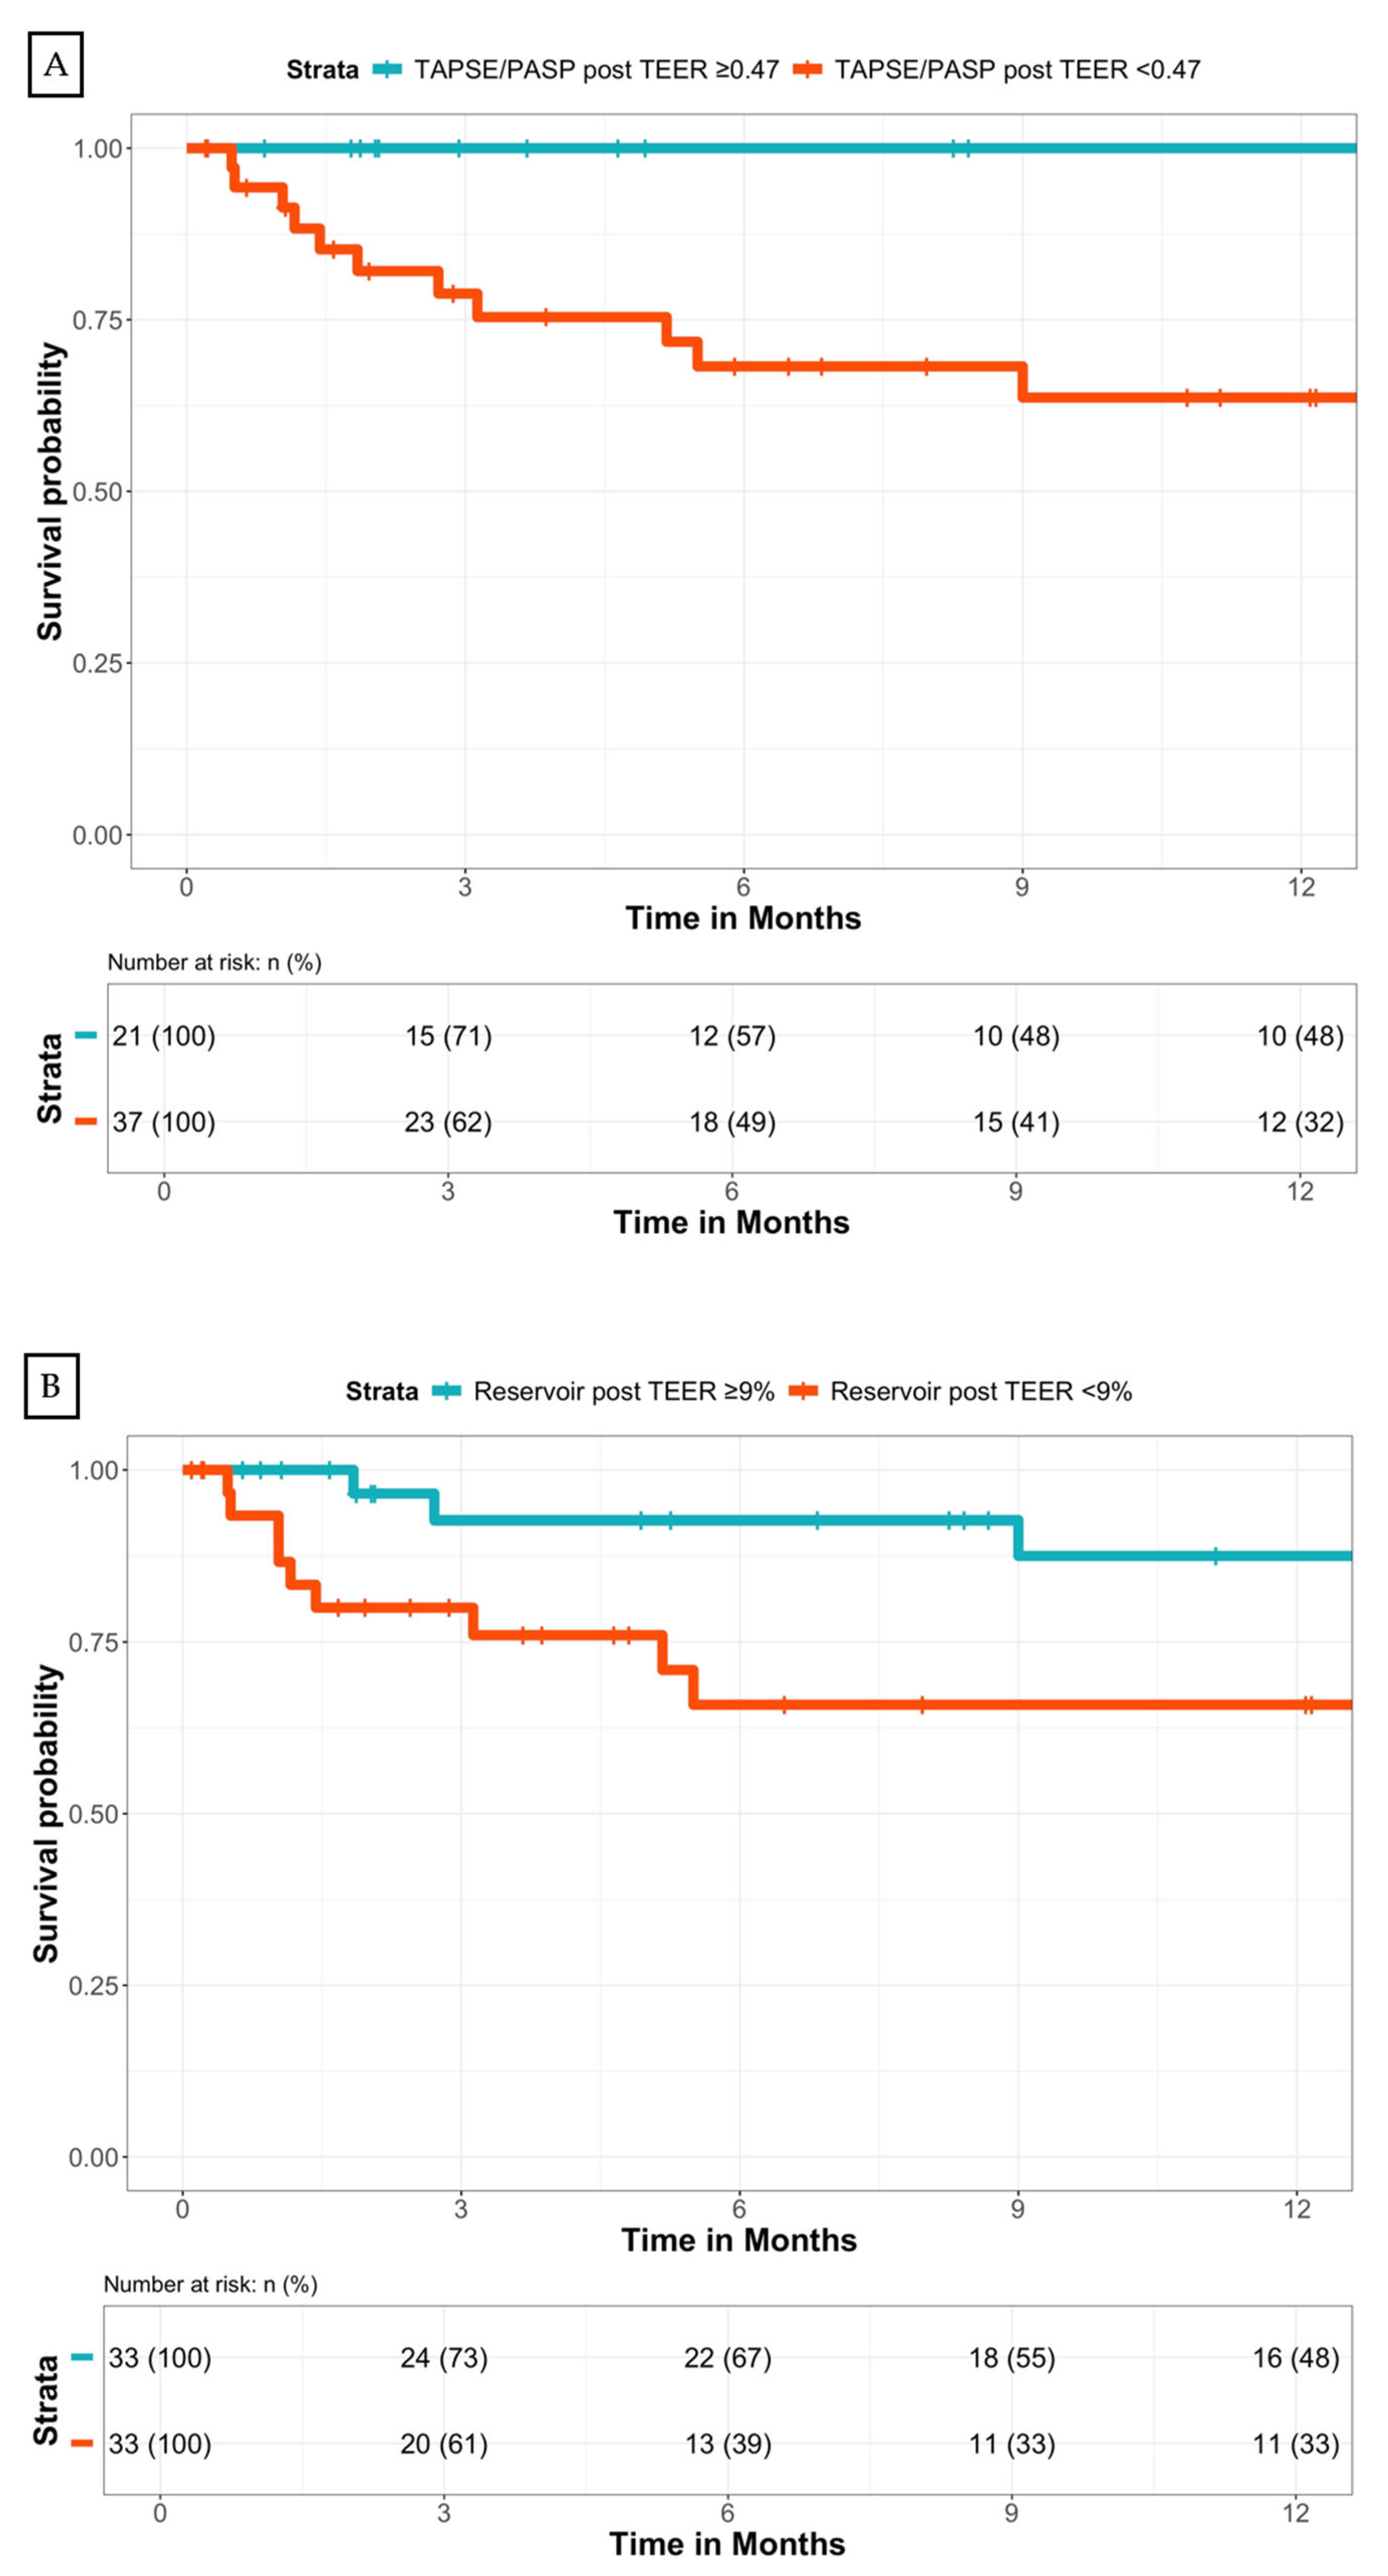
| TAPSE/PASP < 0.47 | 0.039 | 4.76 (1.08-21.02) |
| LA strain reservoir < 9% | 0.047 | 2.77 (1.01-7.59) |
Disclaimer/Publisher’s Note: The statements, opinions and data contained in all publications are solely those of the individual author(s) and contributor(s) and not of MDPI and/or the editor(s). MDPI and/or the editor(s) disclaim responsibility for any injury to people or property resulting from any ideas, methods, instructions or products referred to in the content. |
© 2024 by the authors. Licensee MDPI, Basel, Switzerland. This article is an open access article distributed under the terms and conditions of the Creative Commons Attribution (CC BY) license (http://creativecommons.org/licenses/by/4.0/).


