Introduction
In physiologic studies and clinical situations, it is of critical importance to measure fluids flow. Nowadays, most physiological parameters of the patient in the intensive care units, are electronically monitored with highly sophisticated devices [
1]. Usually, these devices also supervise whether the values remain within the pre-established normal values by the clinicians. This range represents the values considered as normal or acceptable for each parameter. Warning can be programmed to alert the medical staff if the values are not within an acceptable range. Automatic determination of these parameters reduces workload and human error. Urine output is one of the most relevant physiological parameters but is still mainly manually measured. Recently several electronic devices measuring urine output have shown accuracy and precision in clinic [
2,
3,
4,
5,
6]. With these devices precision improved and avoid interobserver variations. These trials strongly suggest that ICU patients had more meaningful medical management, and better outcomes, with electronic urine output monitoring versus conventional manual monitoring. Errors and omissions can be avoided with these devices in addition to a saving in the working time of the nursing staff. Several different devices are available and use different measurement methods like gravimetry [
7], or a custom-designed sensor using a proprietary algorithm centered on the principles of thermal transfer [
2], or low-cost device especially designed for that purpose [
8]. These devices are rather precise and can be used in clinics with however some disadvantages which can complicate their use. We have designed a new device trying to make it resemble as much as possible the urinary bags that exist on the market and trying to make it as simple as possible. We report our methodology using a combination of gravimetry and capacitive analysis to measure total volume of liquid and hourly rate of liquid excretion in prototype dedicated to the urine output measurement.
Methods
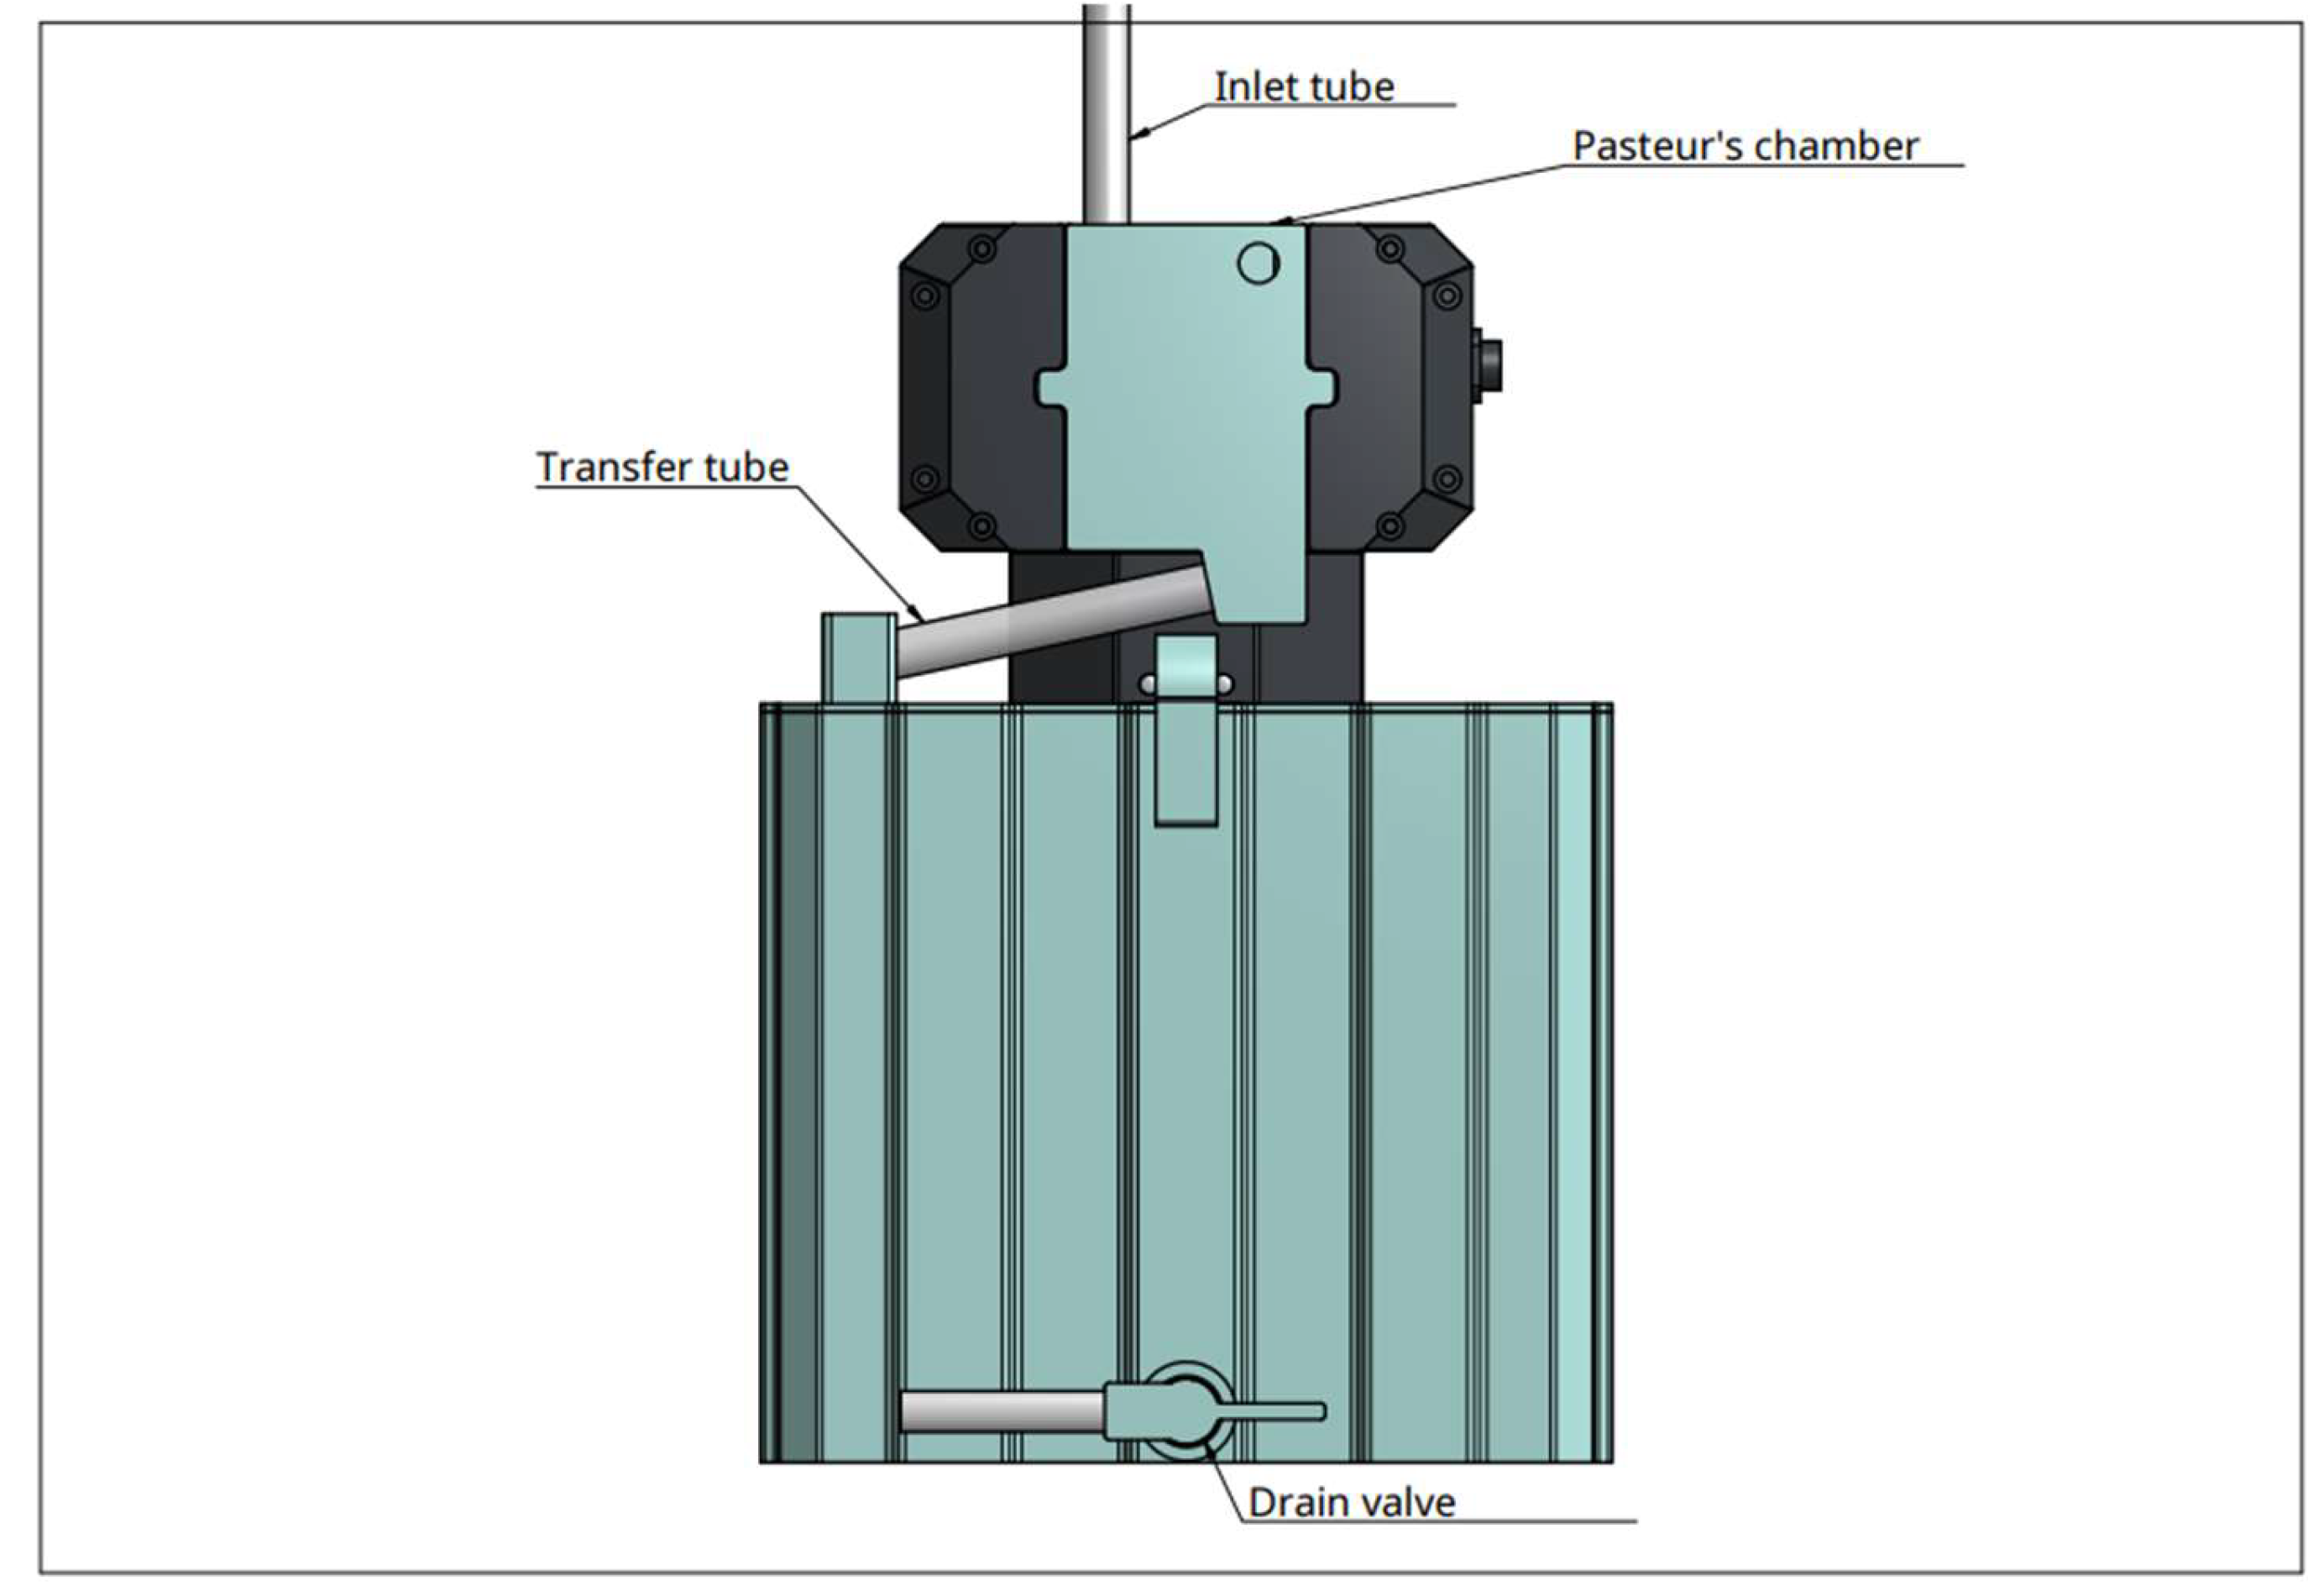
Device: the experimental device the Diuriflux 2023 (Diuriflux system, Montreux, Switzerland) is designed to measure total volume and hourly flow in other words urine output (
Figure 1 and
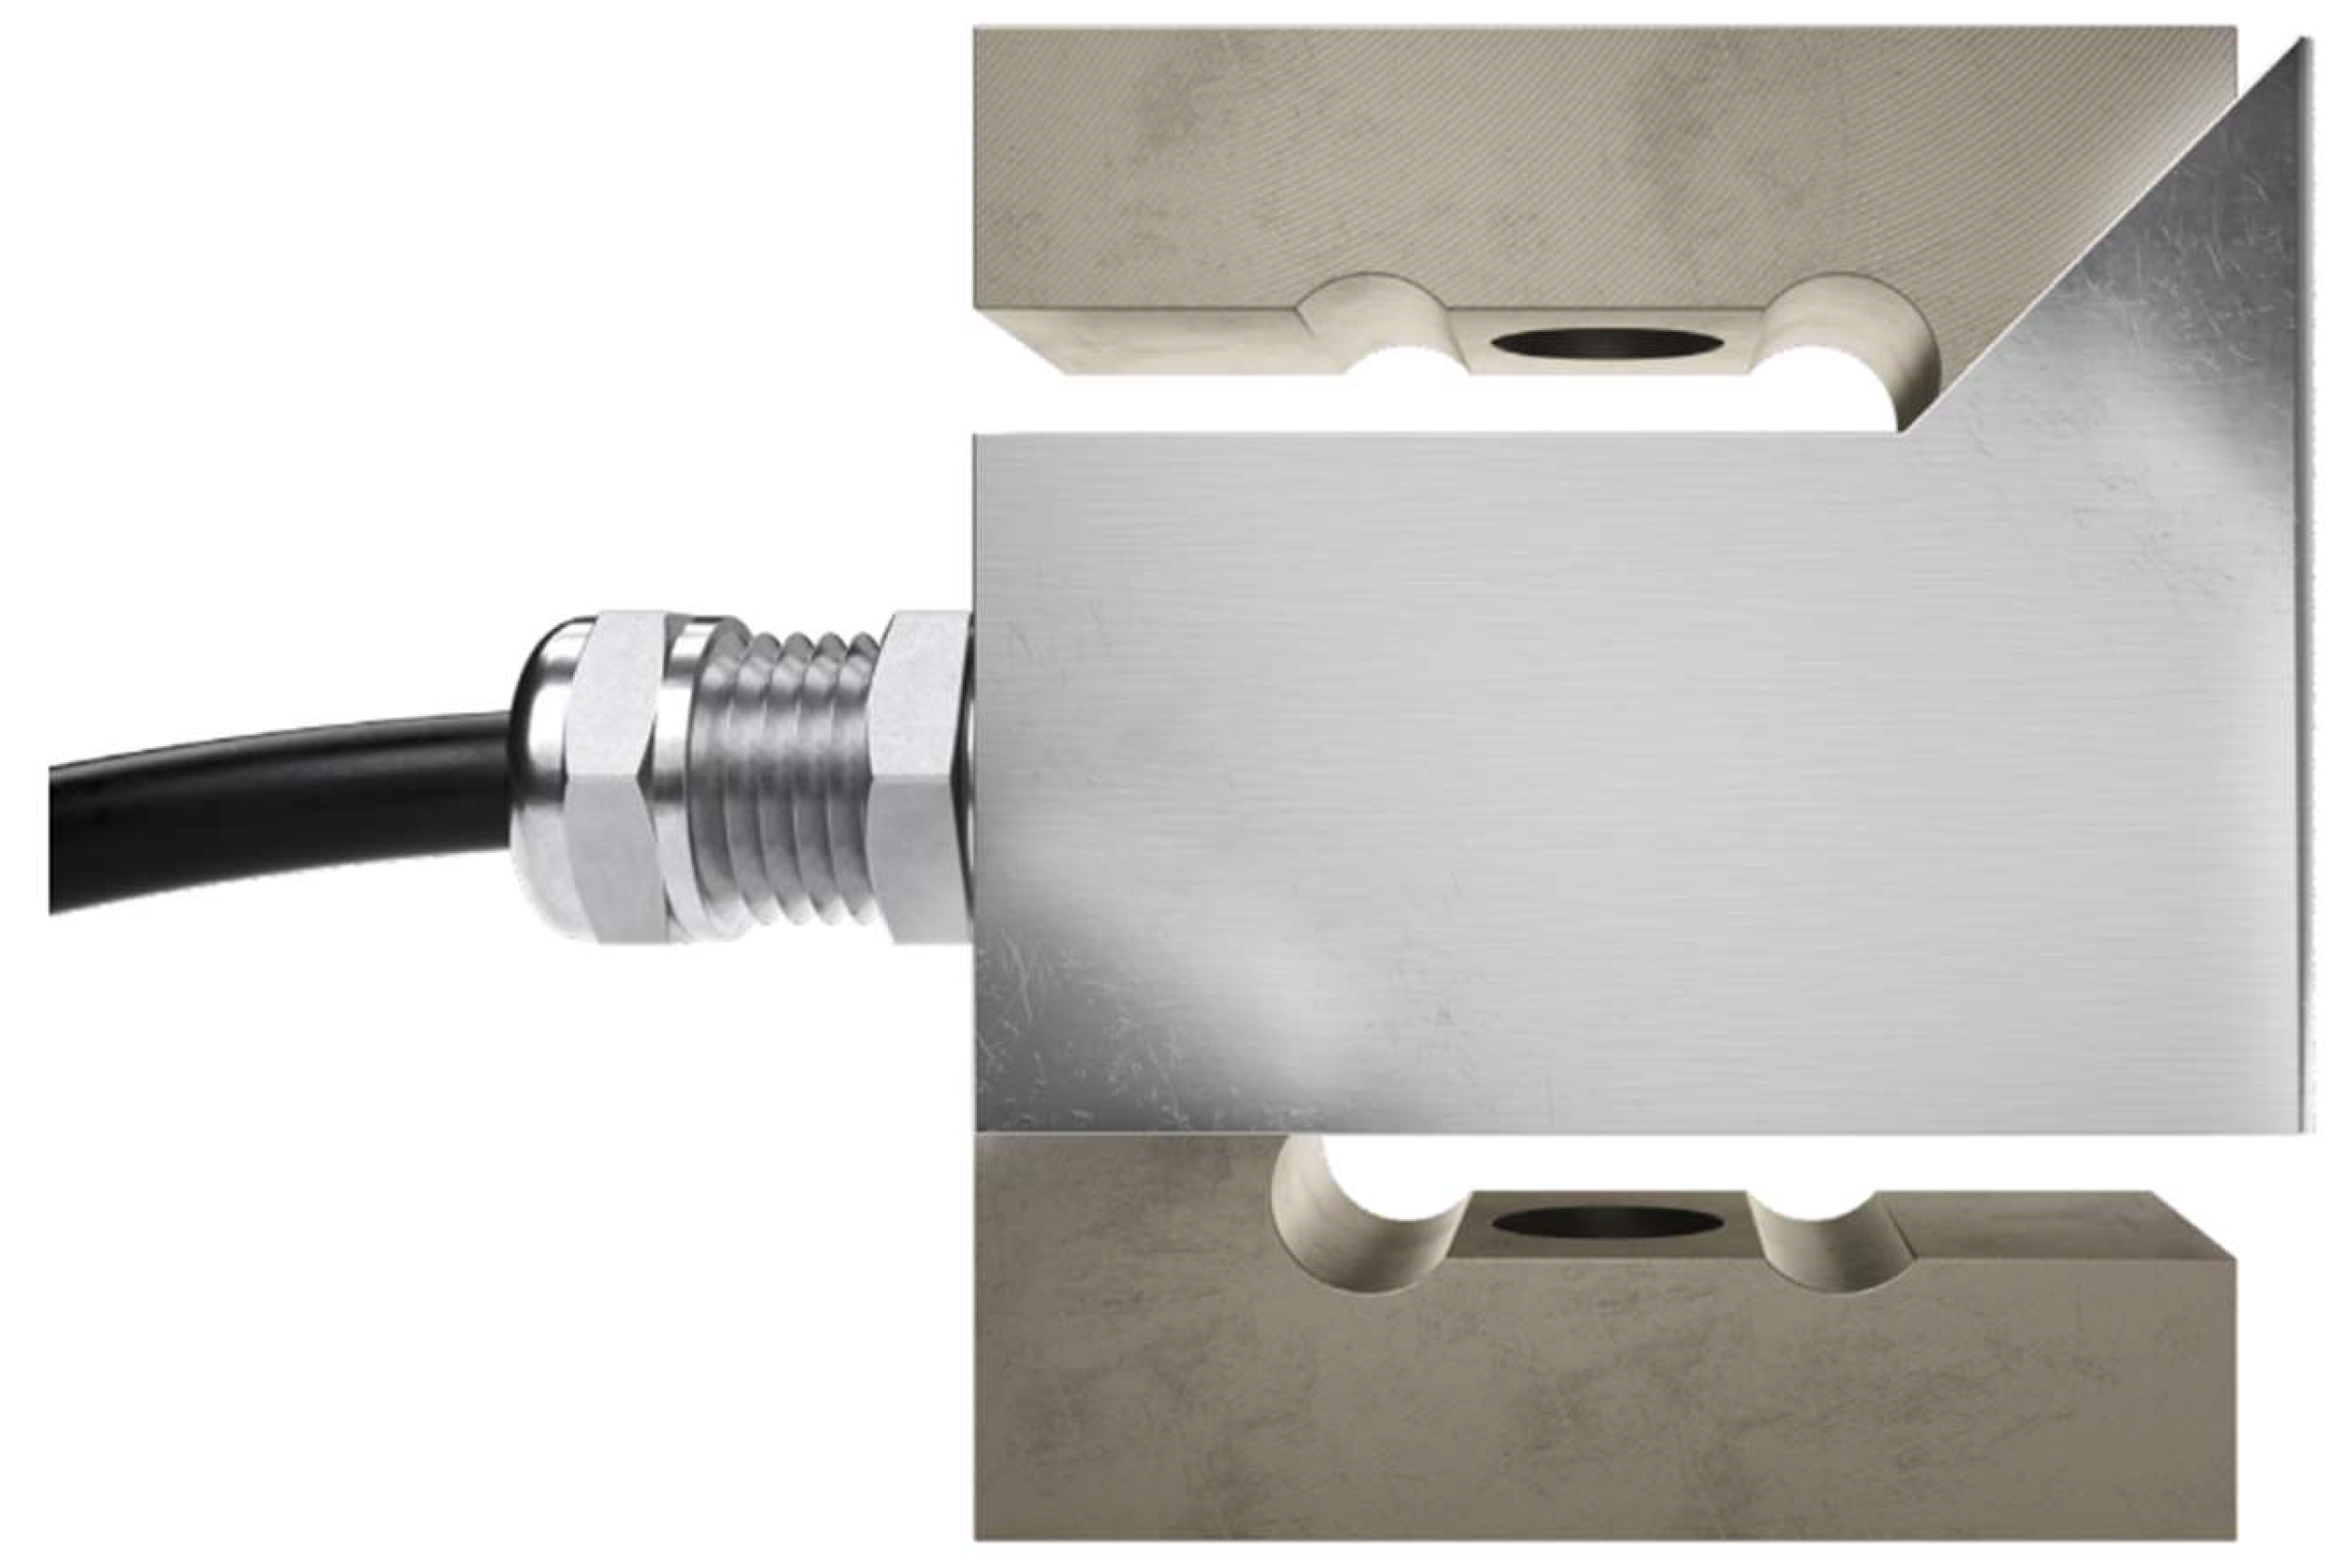
Figure 2). The urimeter weight the urinary bag at regular time interval. To achieve high quality of products at lesser cost, accurate measurement we use a dynamometer. The principle is based on a strain gauge load cell which convert force in an electrical output signal. As the strength force applied to the sensor increases, the electrical signal changes proportionally. This technique has been extensively described previously [
9]. The model used (Flintec Tension Load Cell Type UXT-50kg-C3, Flintec Inc., Hudson, MA, USA) is based on the principle of the modified Wheatstone bridge [
10] known as highly accurate (
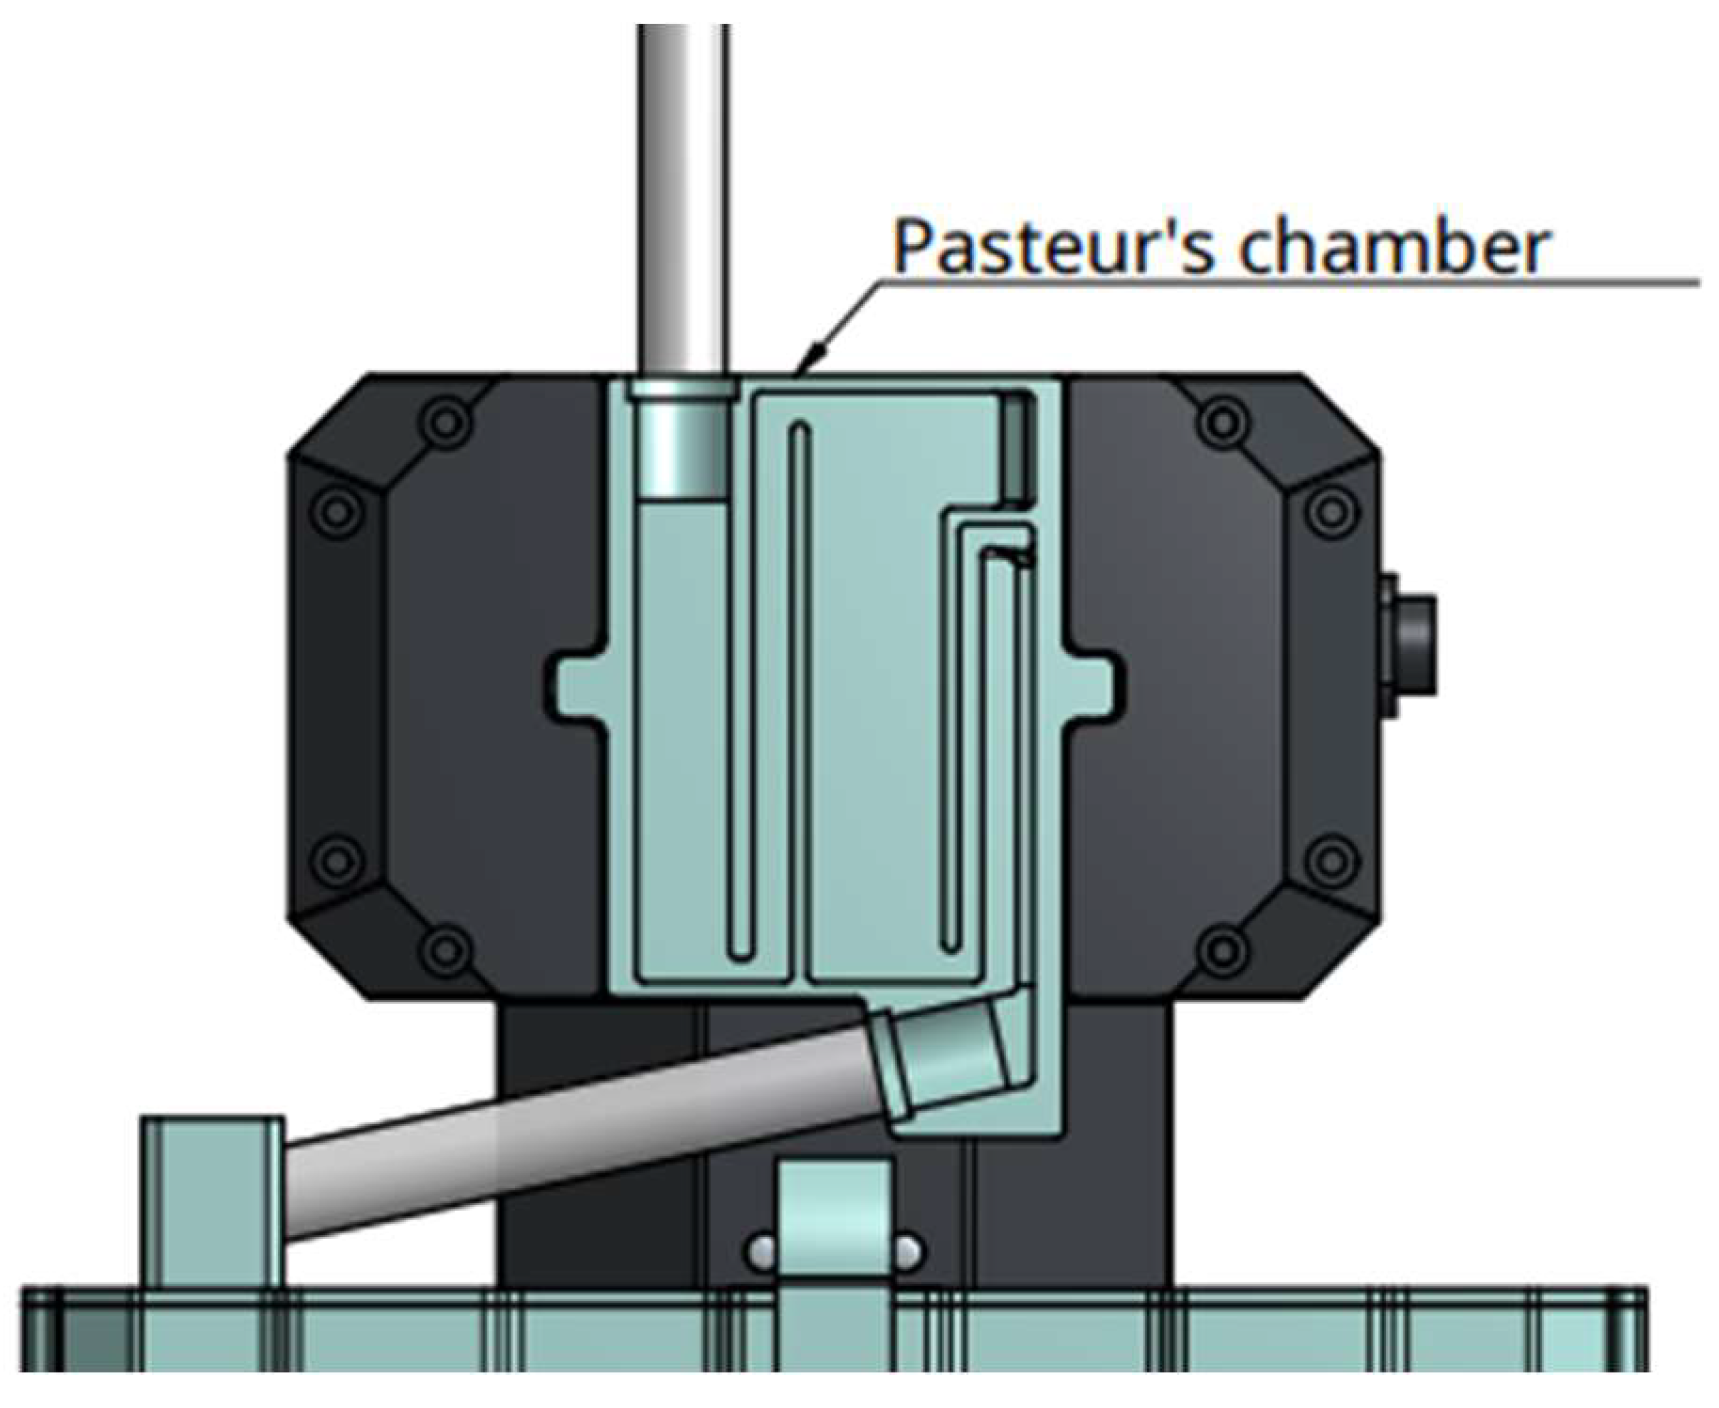
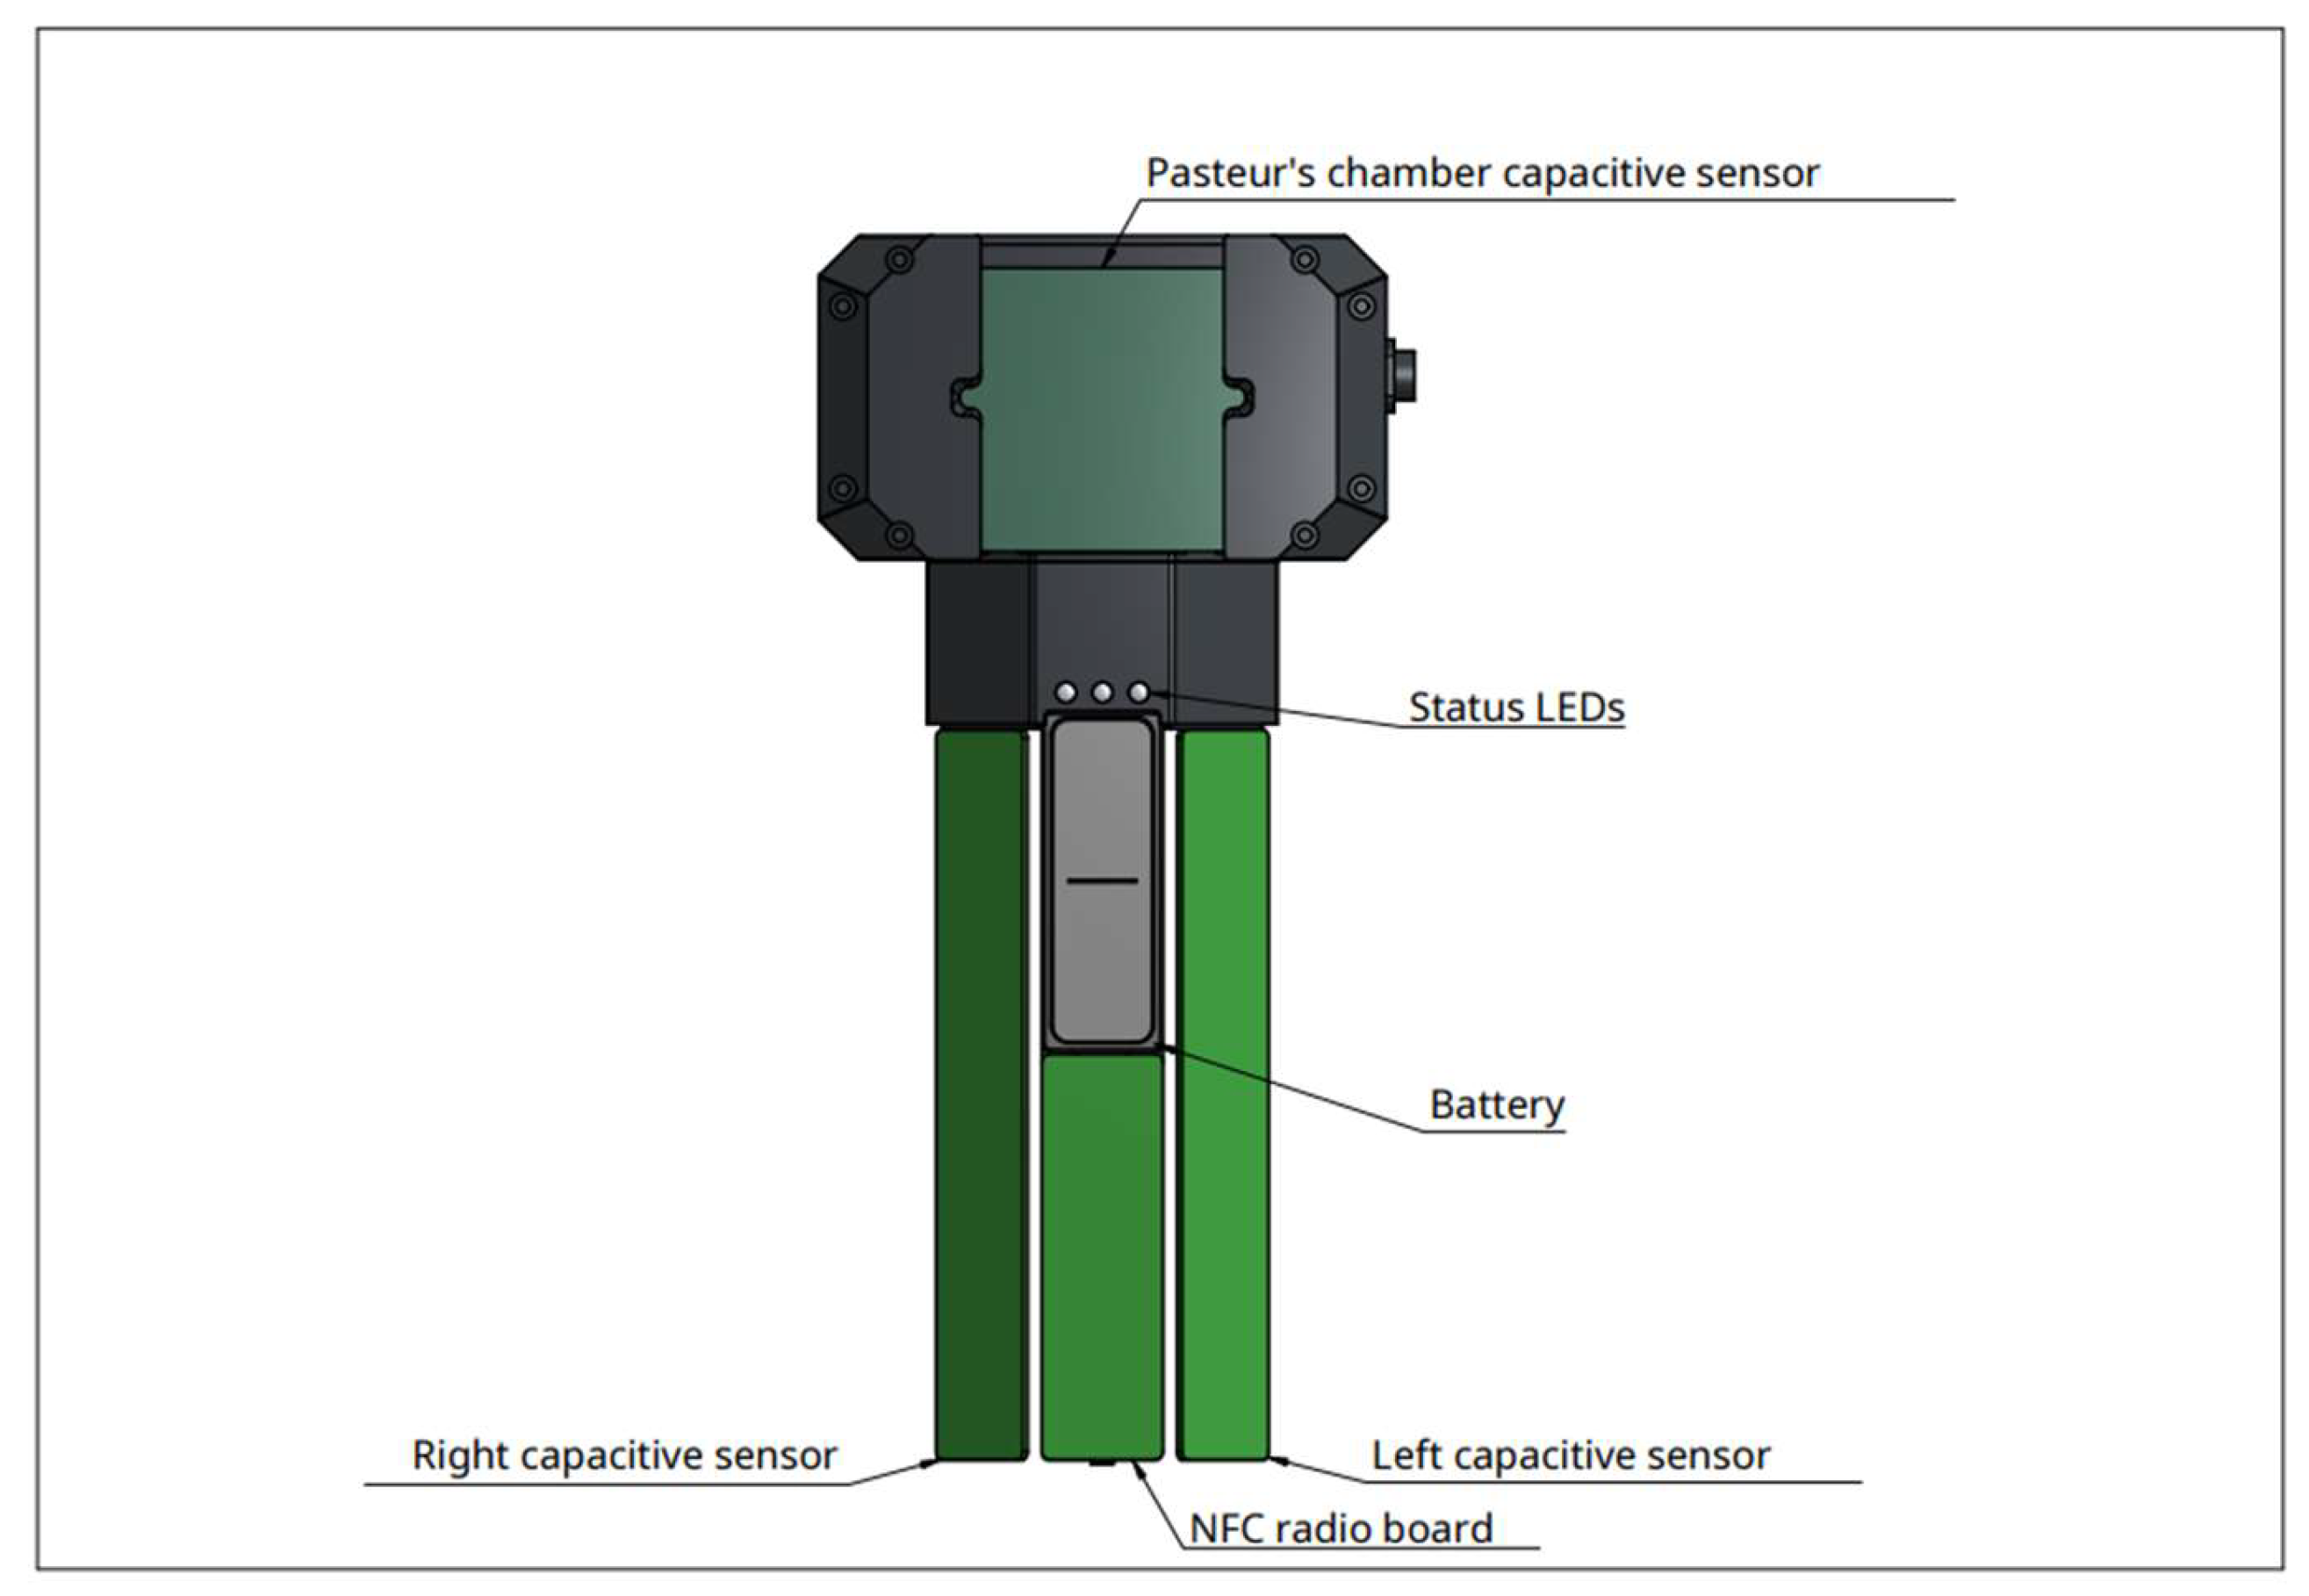
Figure 3). To ensure a correct measurement, accelerometers are mounted on the two side of the dynamometer, allowing vibration detection and immediate compensation. As external factors can alter weight measurement, for example a chair leaning on the bag, a second measure system is integrated in the urimeter. The system uses capacitive sensors to detect height of liquid in the bag. If weight and liquid height don't match, an alarm goes off. A sensor array is also mounted behind the Pasteur’s chamber. It detects early liquid intake before arrival in the urinary bag (
Figure 4). Dry Pasteur drip chamber is equipped with an anti-reflux valve. It prevents retrograde migration of bacteria and venting air inlet filters for pressure balance. The pastor drip is also composed of multiple sub chambers which fill up depending on the liquid pressure. This pressure is proportional to flow. This allows very early detection of flow variations, for example in case of catheter disconnection.
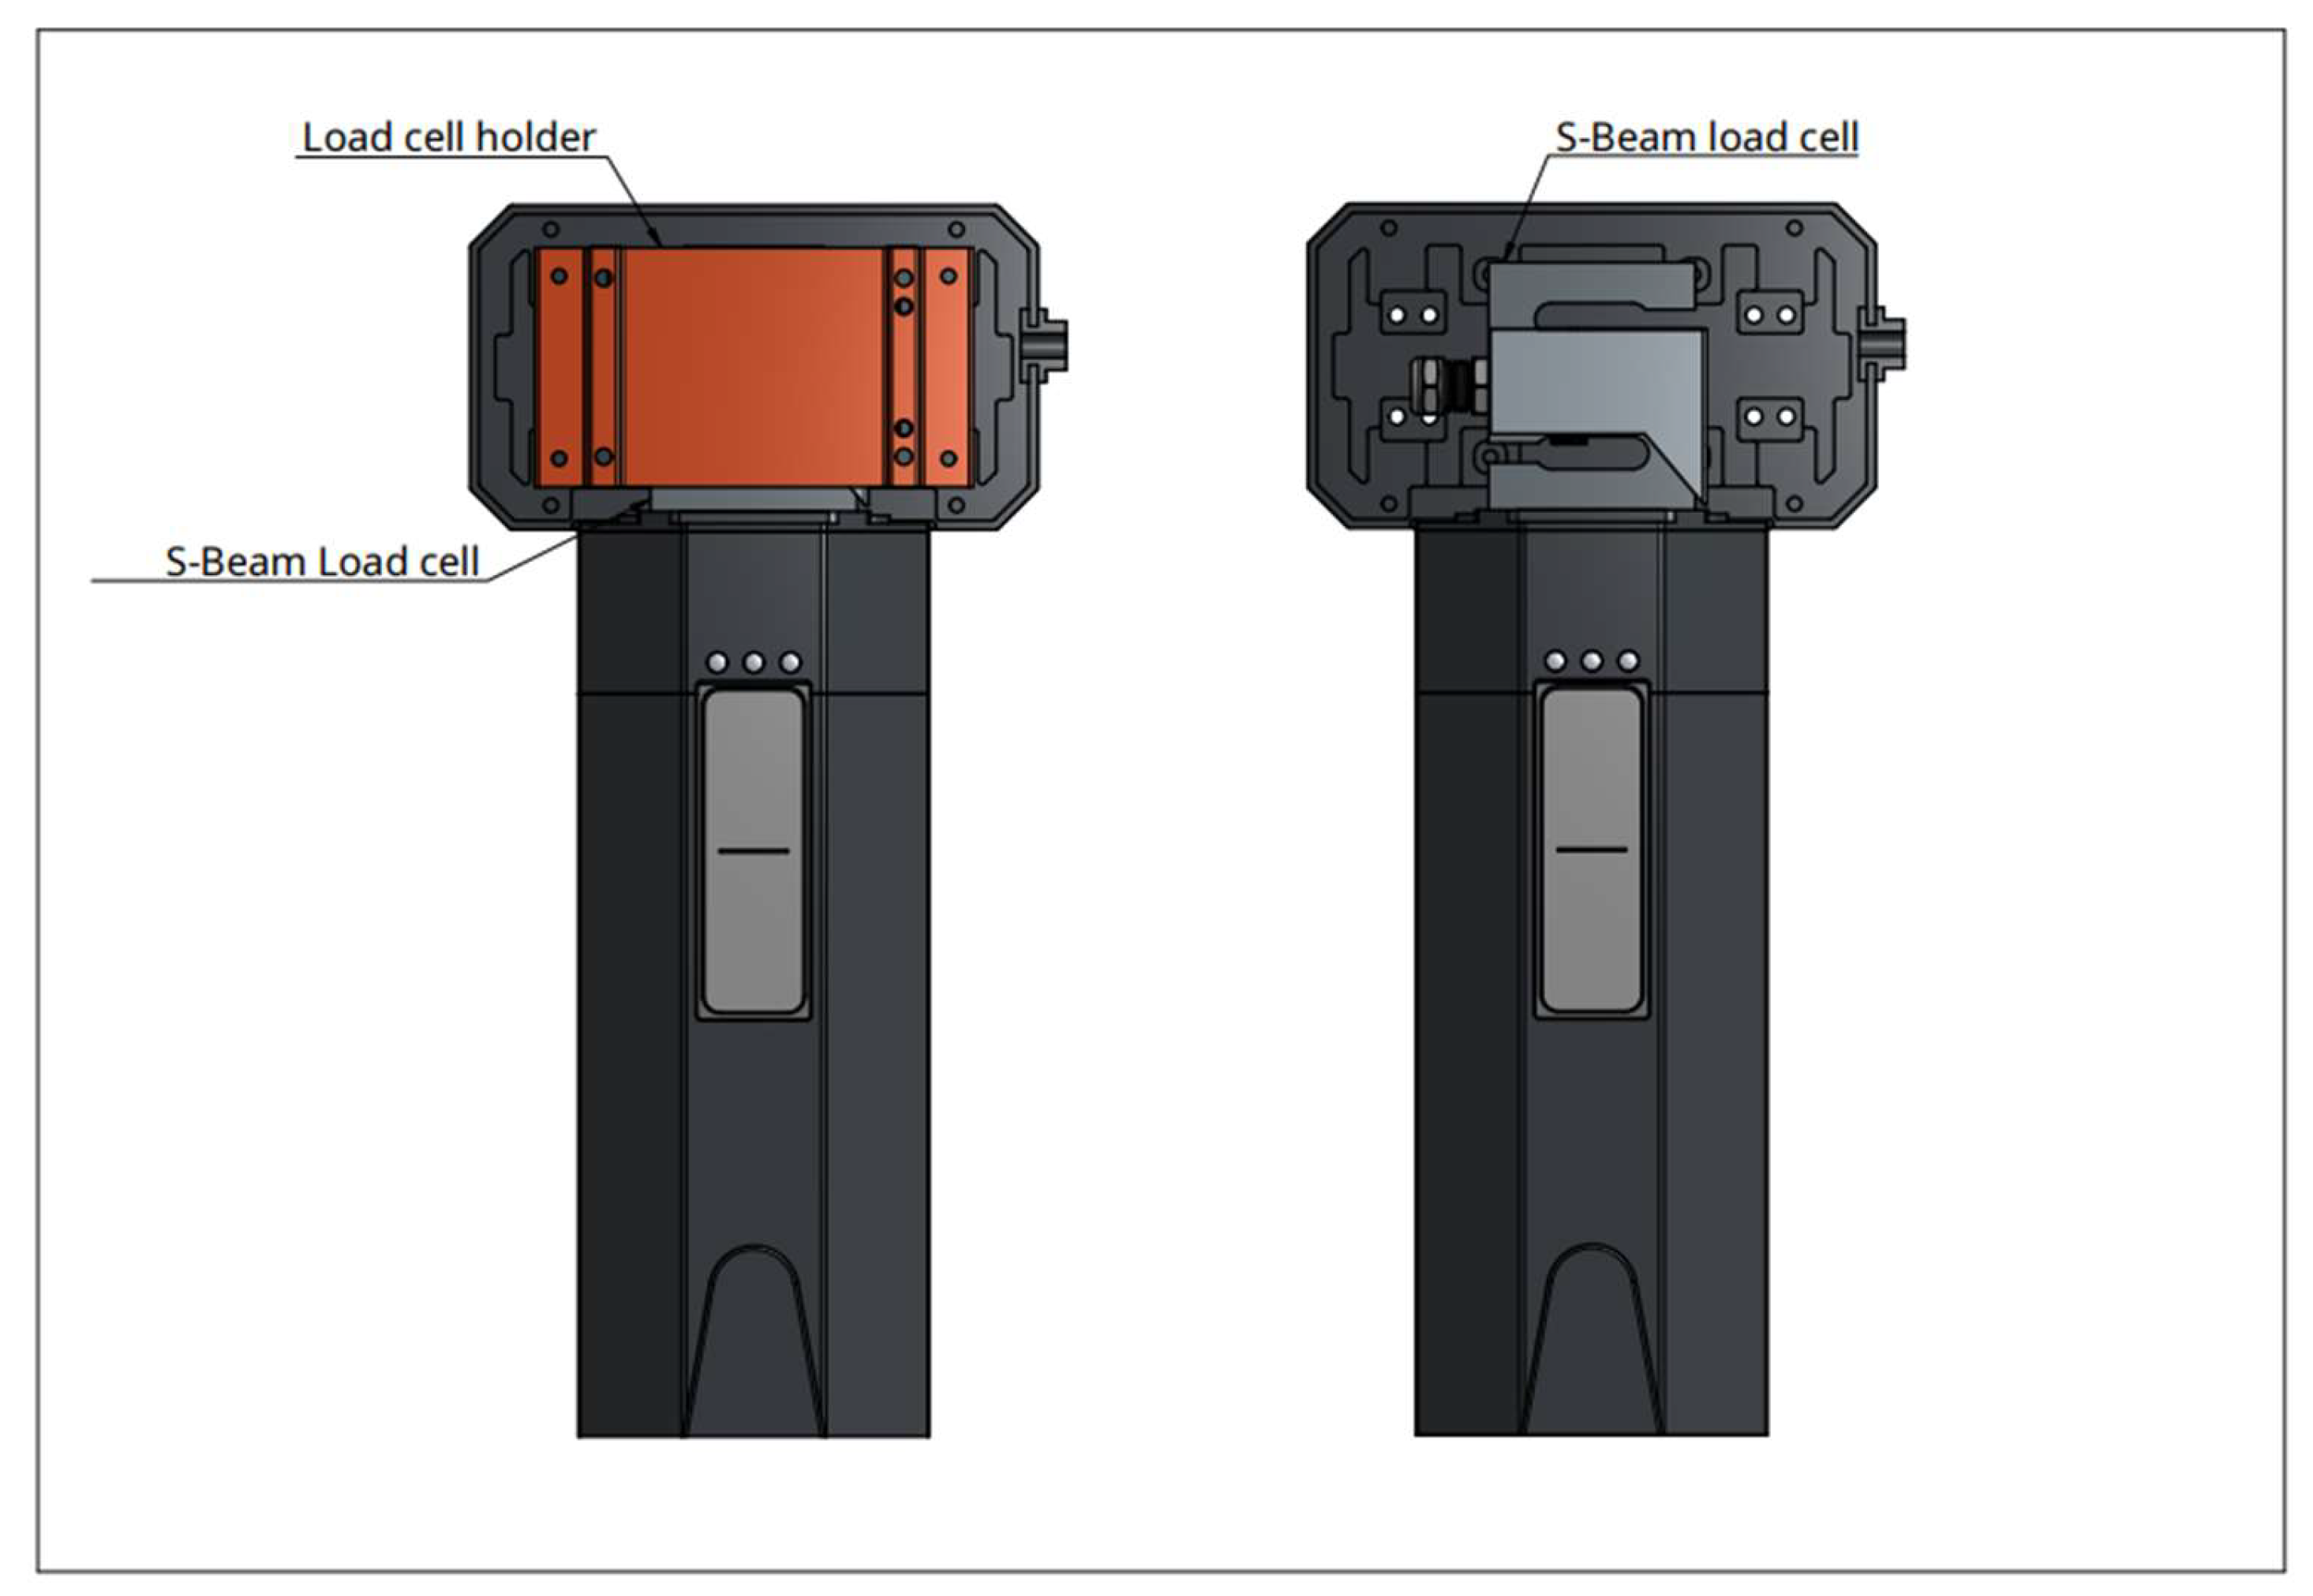
As mentioned, the technology of capacitive sensing was used as a method to control the values provided by the dynamometer (
Figure 5). It is based on coupling, that detects and measures anything that is conductive or has a dielectric constant different from air. Our device uses a 24-bit capacitive-to-digital converters and level-sensing techniques. It has been shown to enable high-performance capacitive sensing of liquid levels [
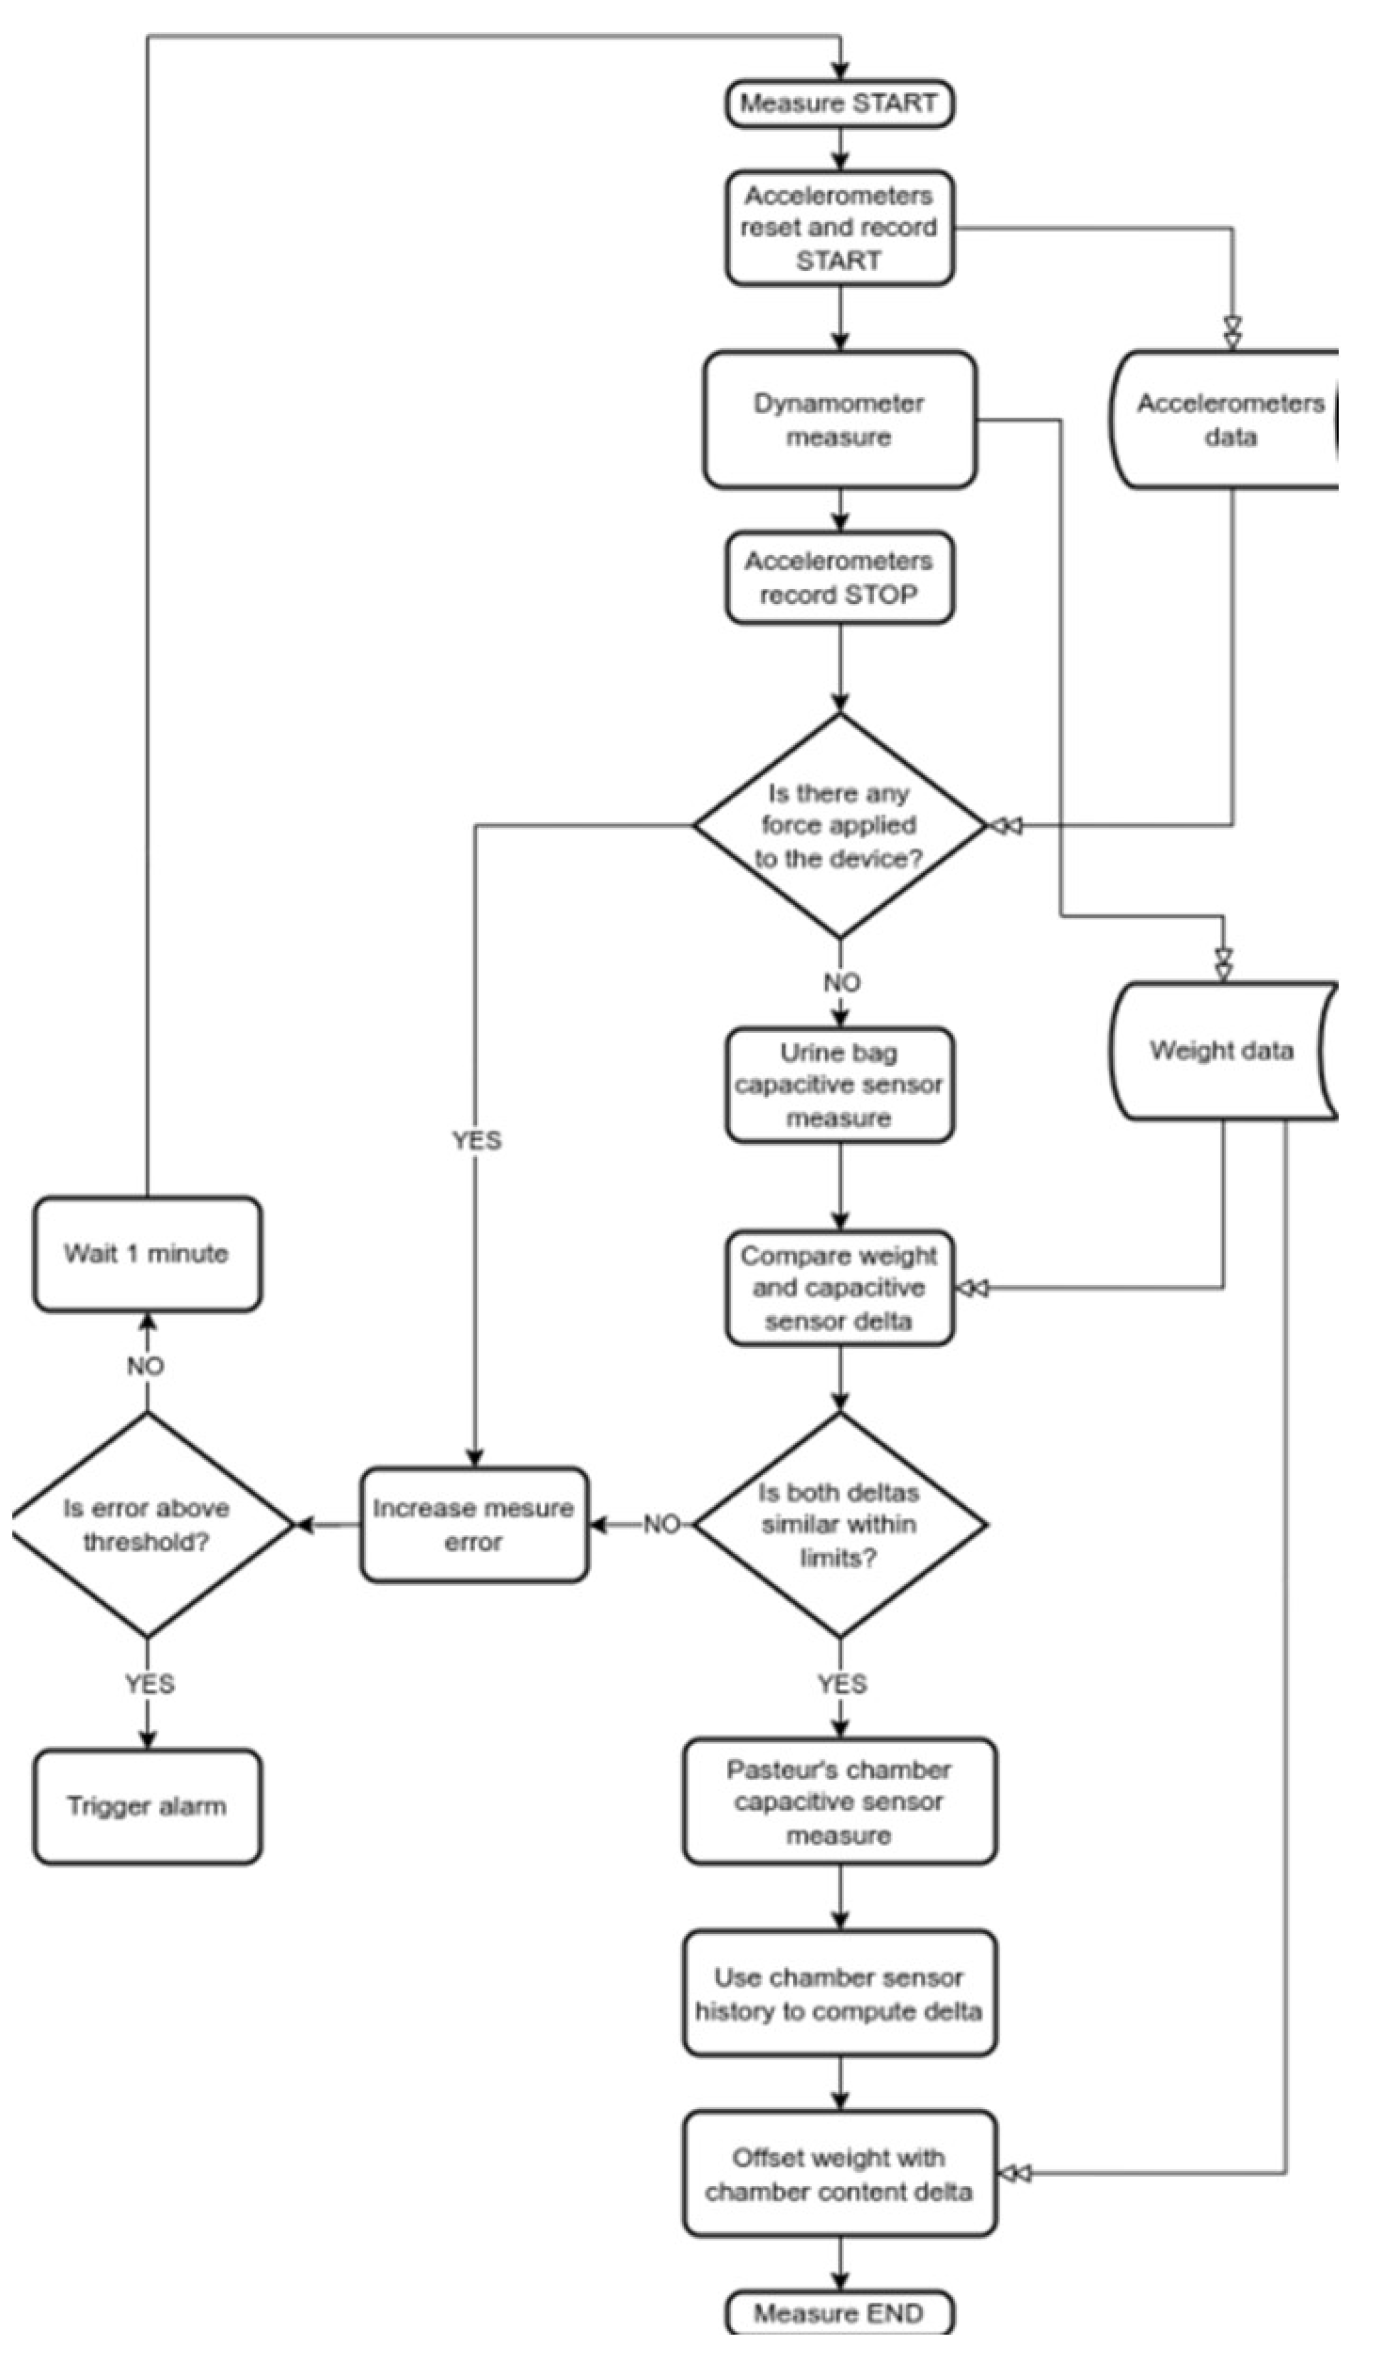
11]. Capacitive sensing provides only a control of the dynamometric values. The curves issue from the capacitives must follow the curves of the dynamometric measures. In case of flow interruption for any unexpected reason it will be detected by the capacitive sensors and reported on the screen. This combined approach of capacitive sensing and dynamometer measures has a great and major advantage, in that it allows a double check of the values provided by the dynamometer>. >Moreover, we use a wireless connection between a screen and the device. The operating flow chart of the system is shown in
Figure 6>.
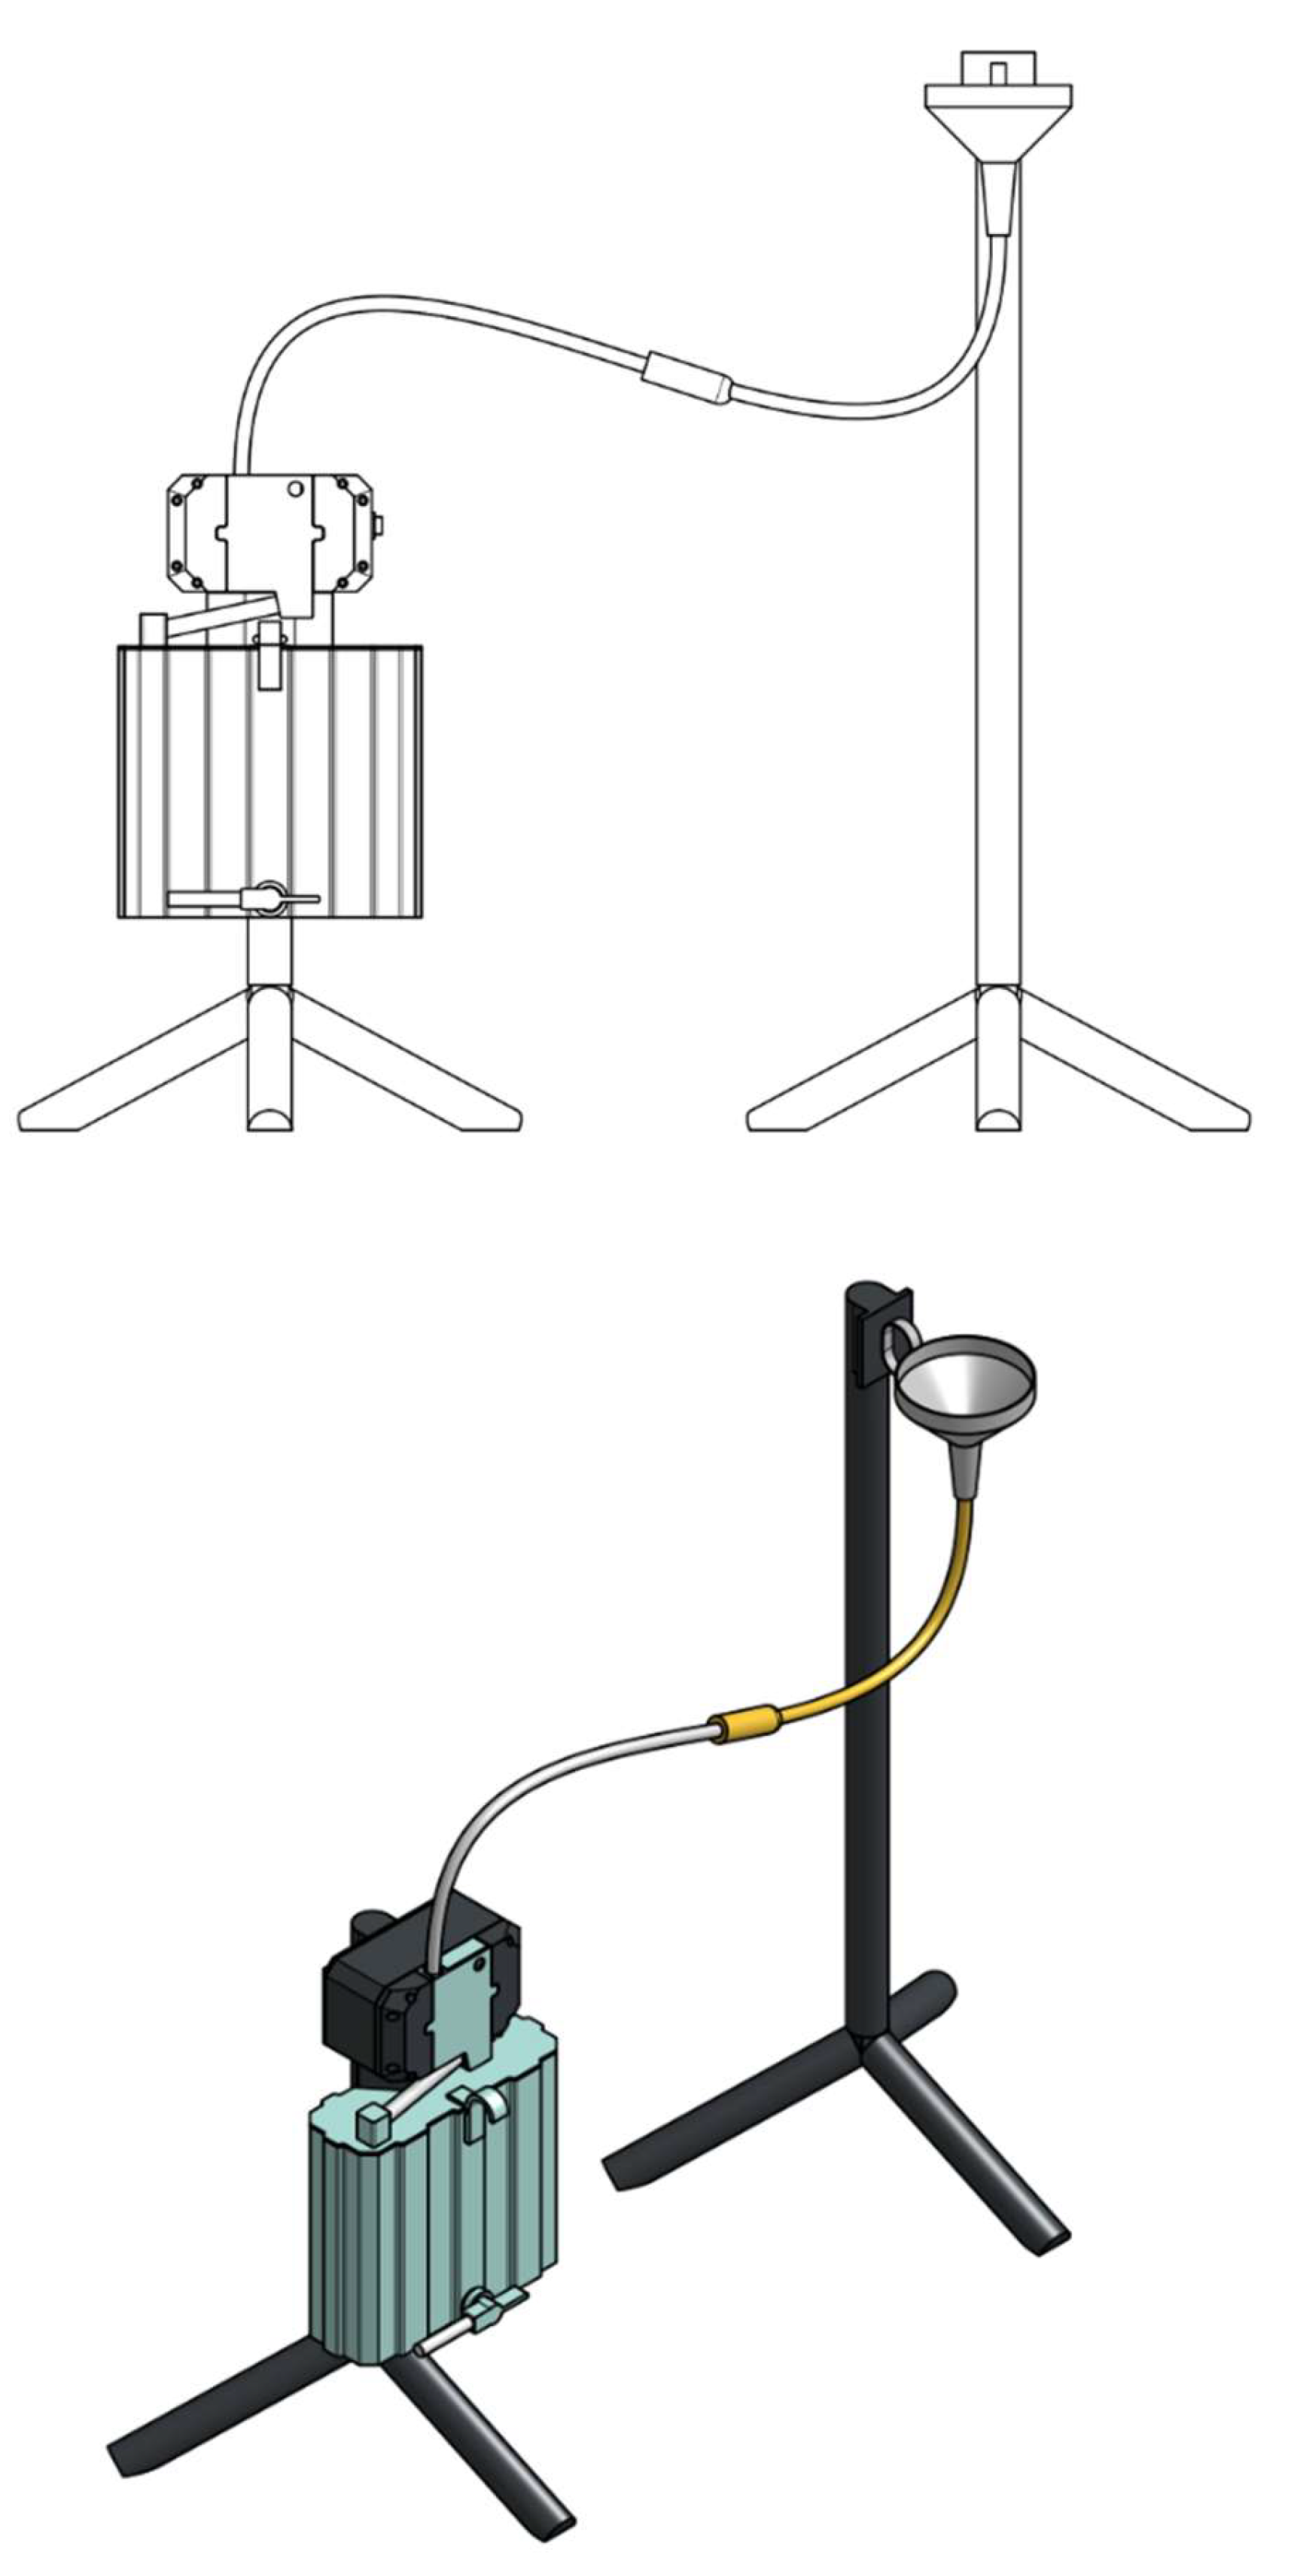
Experimental set-up: the experimental set-up is illustrated in
Figure 6. A funnel is placed above the measuring device. The distal tip of the urinary catheter with the inflated balloon is placed in the funnel. This mimics a bladder. The catheter is connected to a drainage tubing, like the one use in clinic. This drainage tubing goes through the measuring system and connects to the rigid urinary bag. There is a Pasteur’s chamber at the entrance of the rigid bag. Thus, a continuous column of fluid is established between the urine in the funnel functioning like a bladder and the collection reservoir, the urine solid bag below the Pasteur’s chamber.
Data acquisition: the weight of saline is detected in the urinary bag. This represents the volume of saline injected in the system minus the volume remaining in the tubbing, called dead space and that of the Pasteur’s room. It should be noted that the curves of capacitive sensors do not give the volume of liquid. They indicate the kinetics of the flow and ensure that there have been no external events disturbing the measurement. These curves should parallel to the curve of flow and weight.
In-vitro testing: the system was tested during three different flow situations, low flow design as less than 20 ml/hour, medium 20 to 150 ml/hour and high flow defined as over 150 ml/hour. As a dead space exists representing the volume of liquid in the tubbing and the volume in the Pasteur’s chamber, we tested 2 different situations. One with emptying of the dead space and Pasteur’s chamber and one without any emptying.
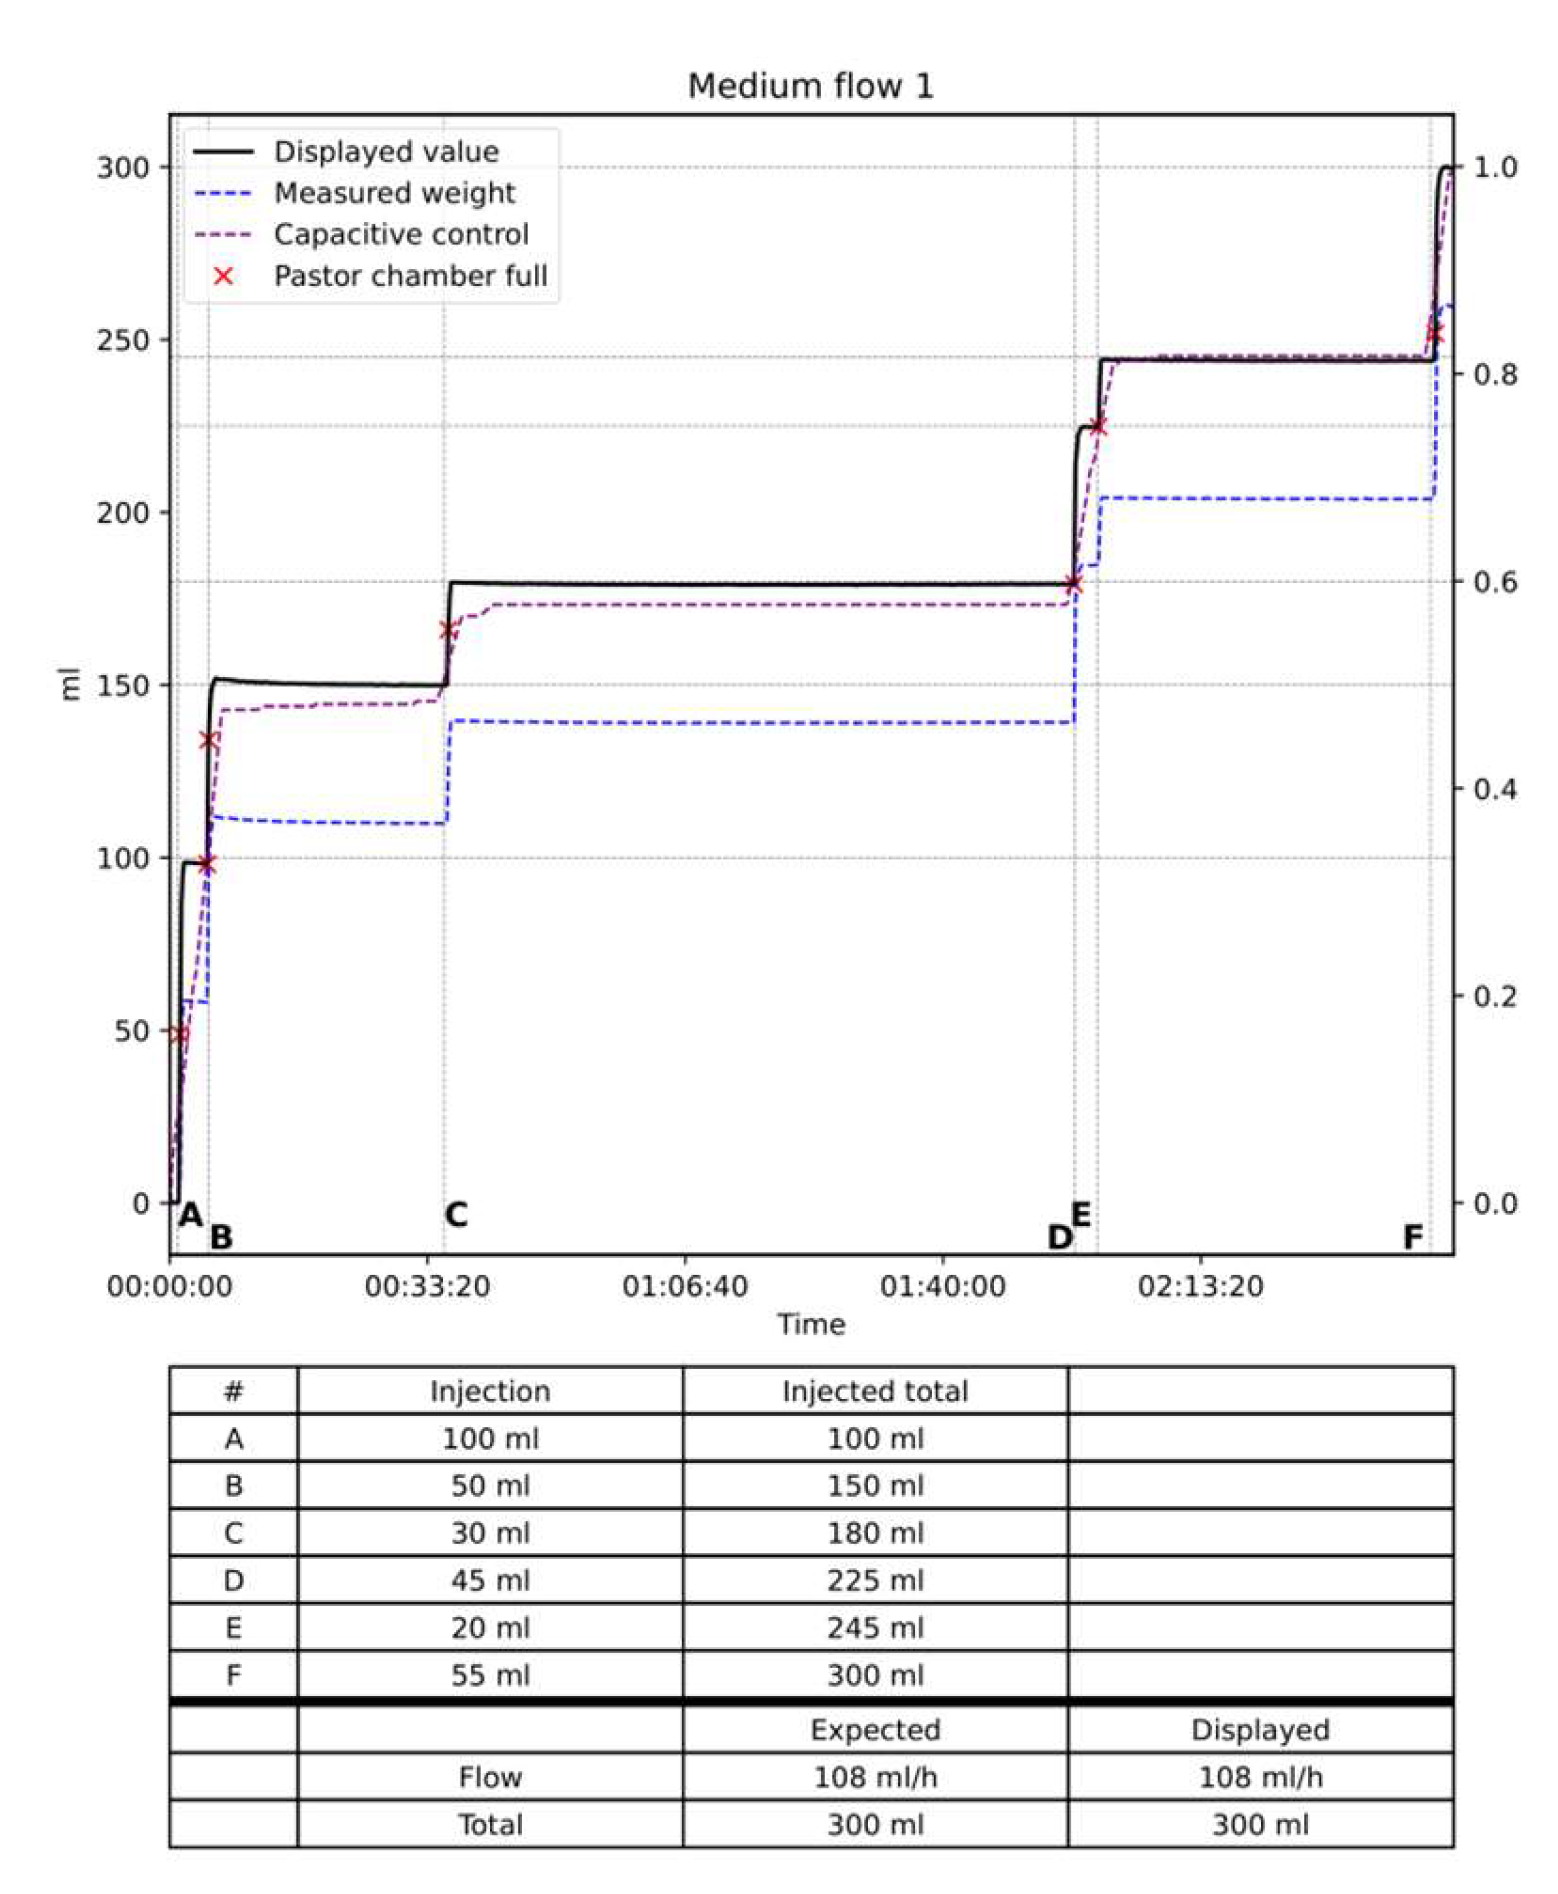
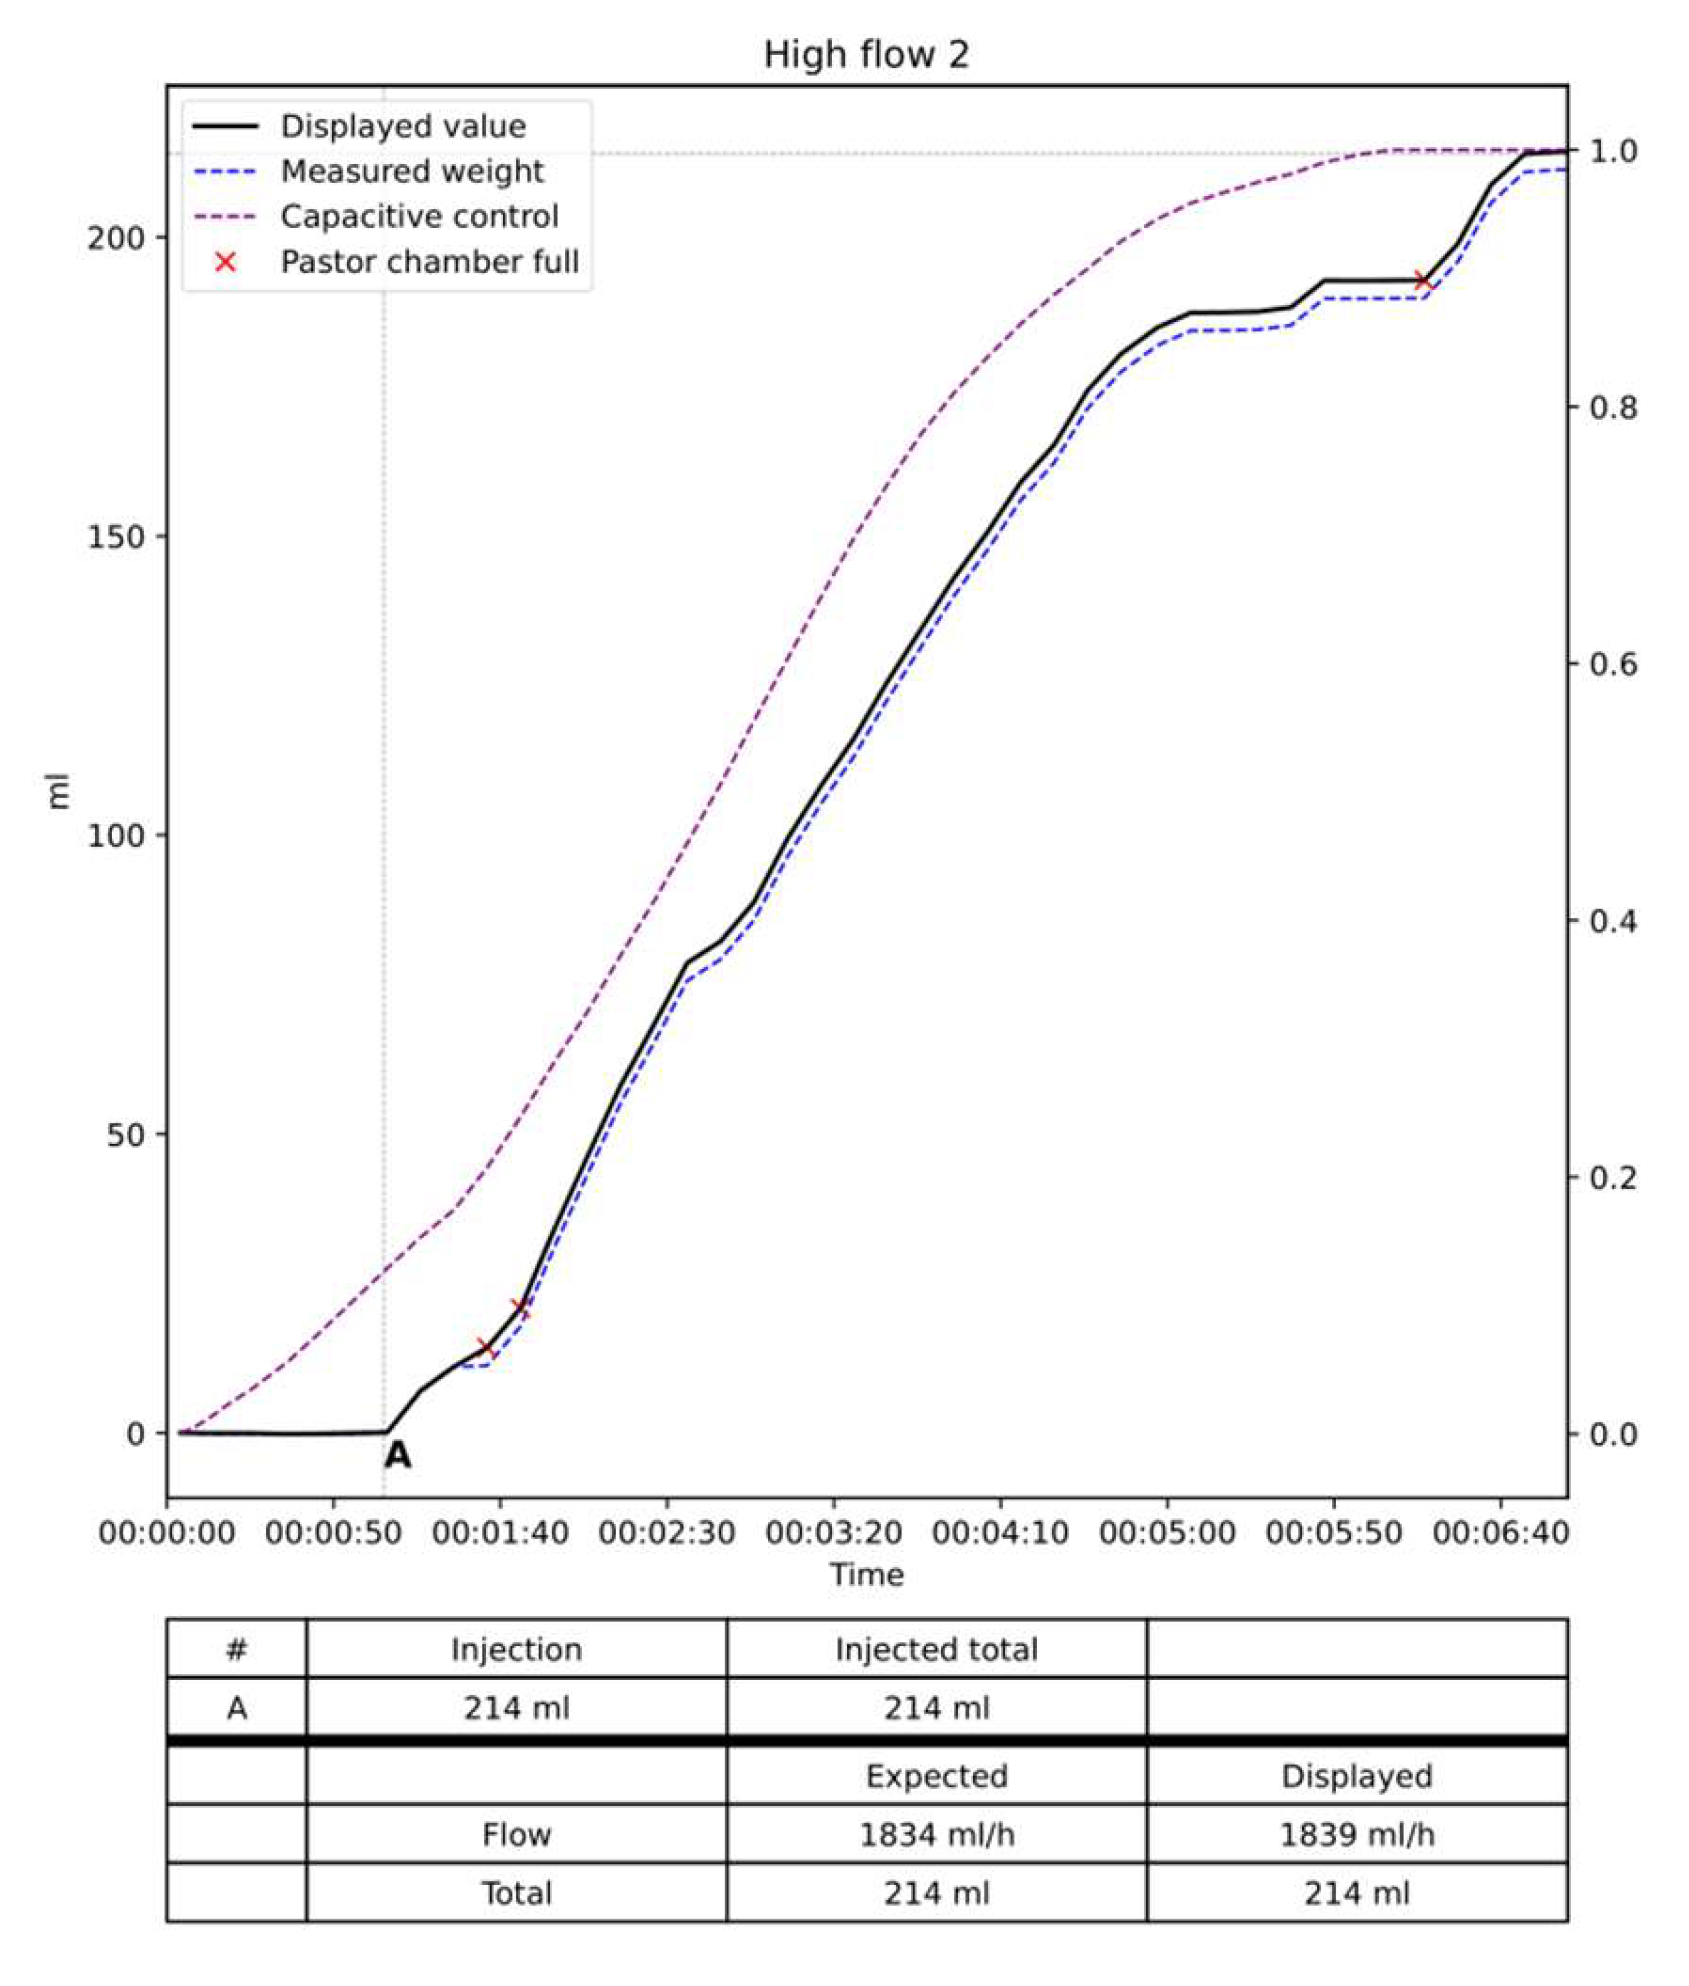
Results: The data are summarized in
Table 1 and
Figure 8,
Figure 9 and
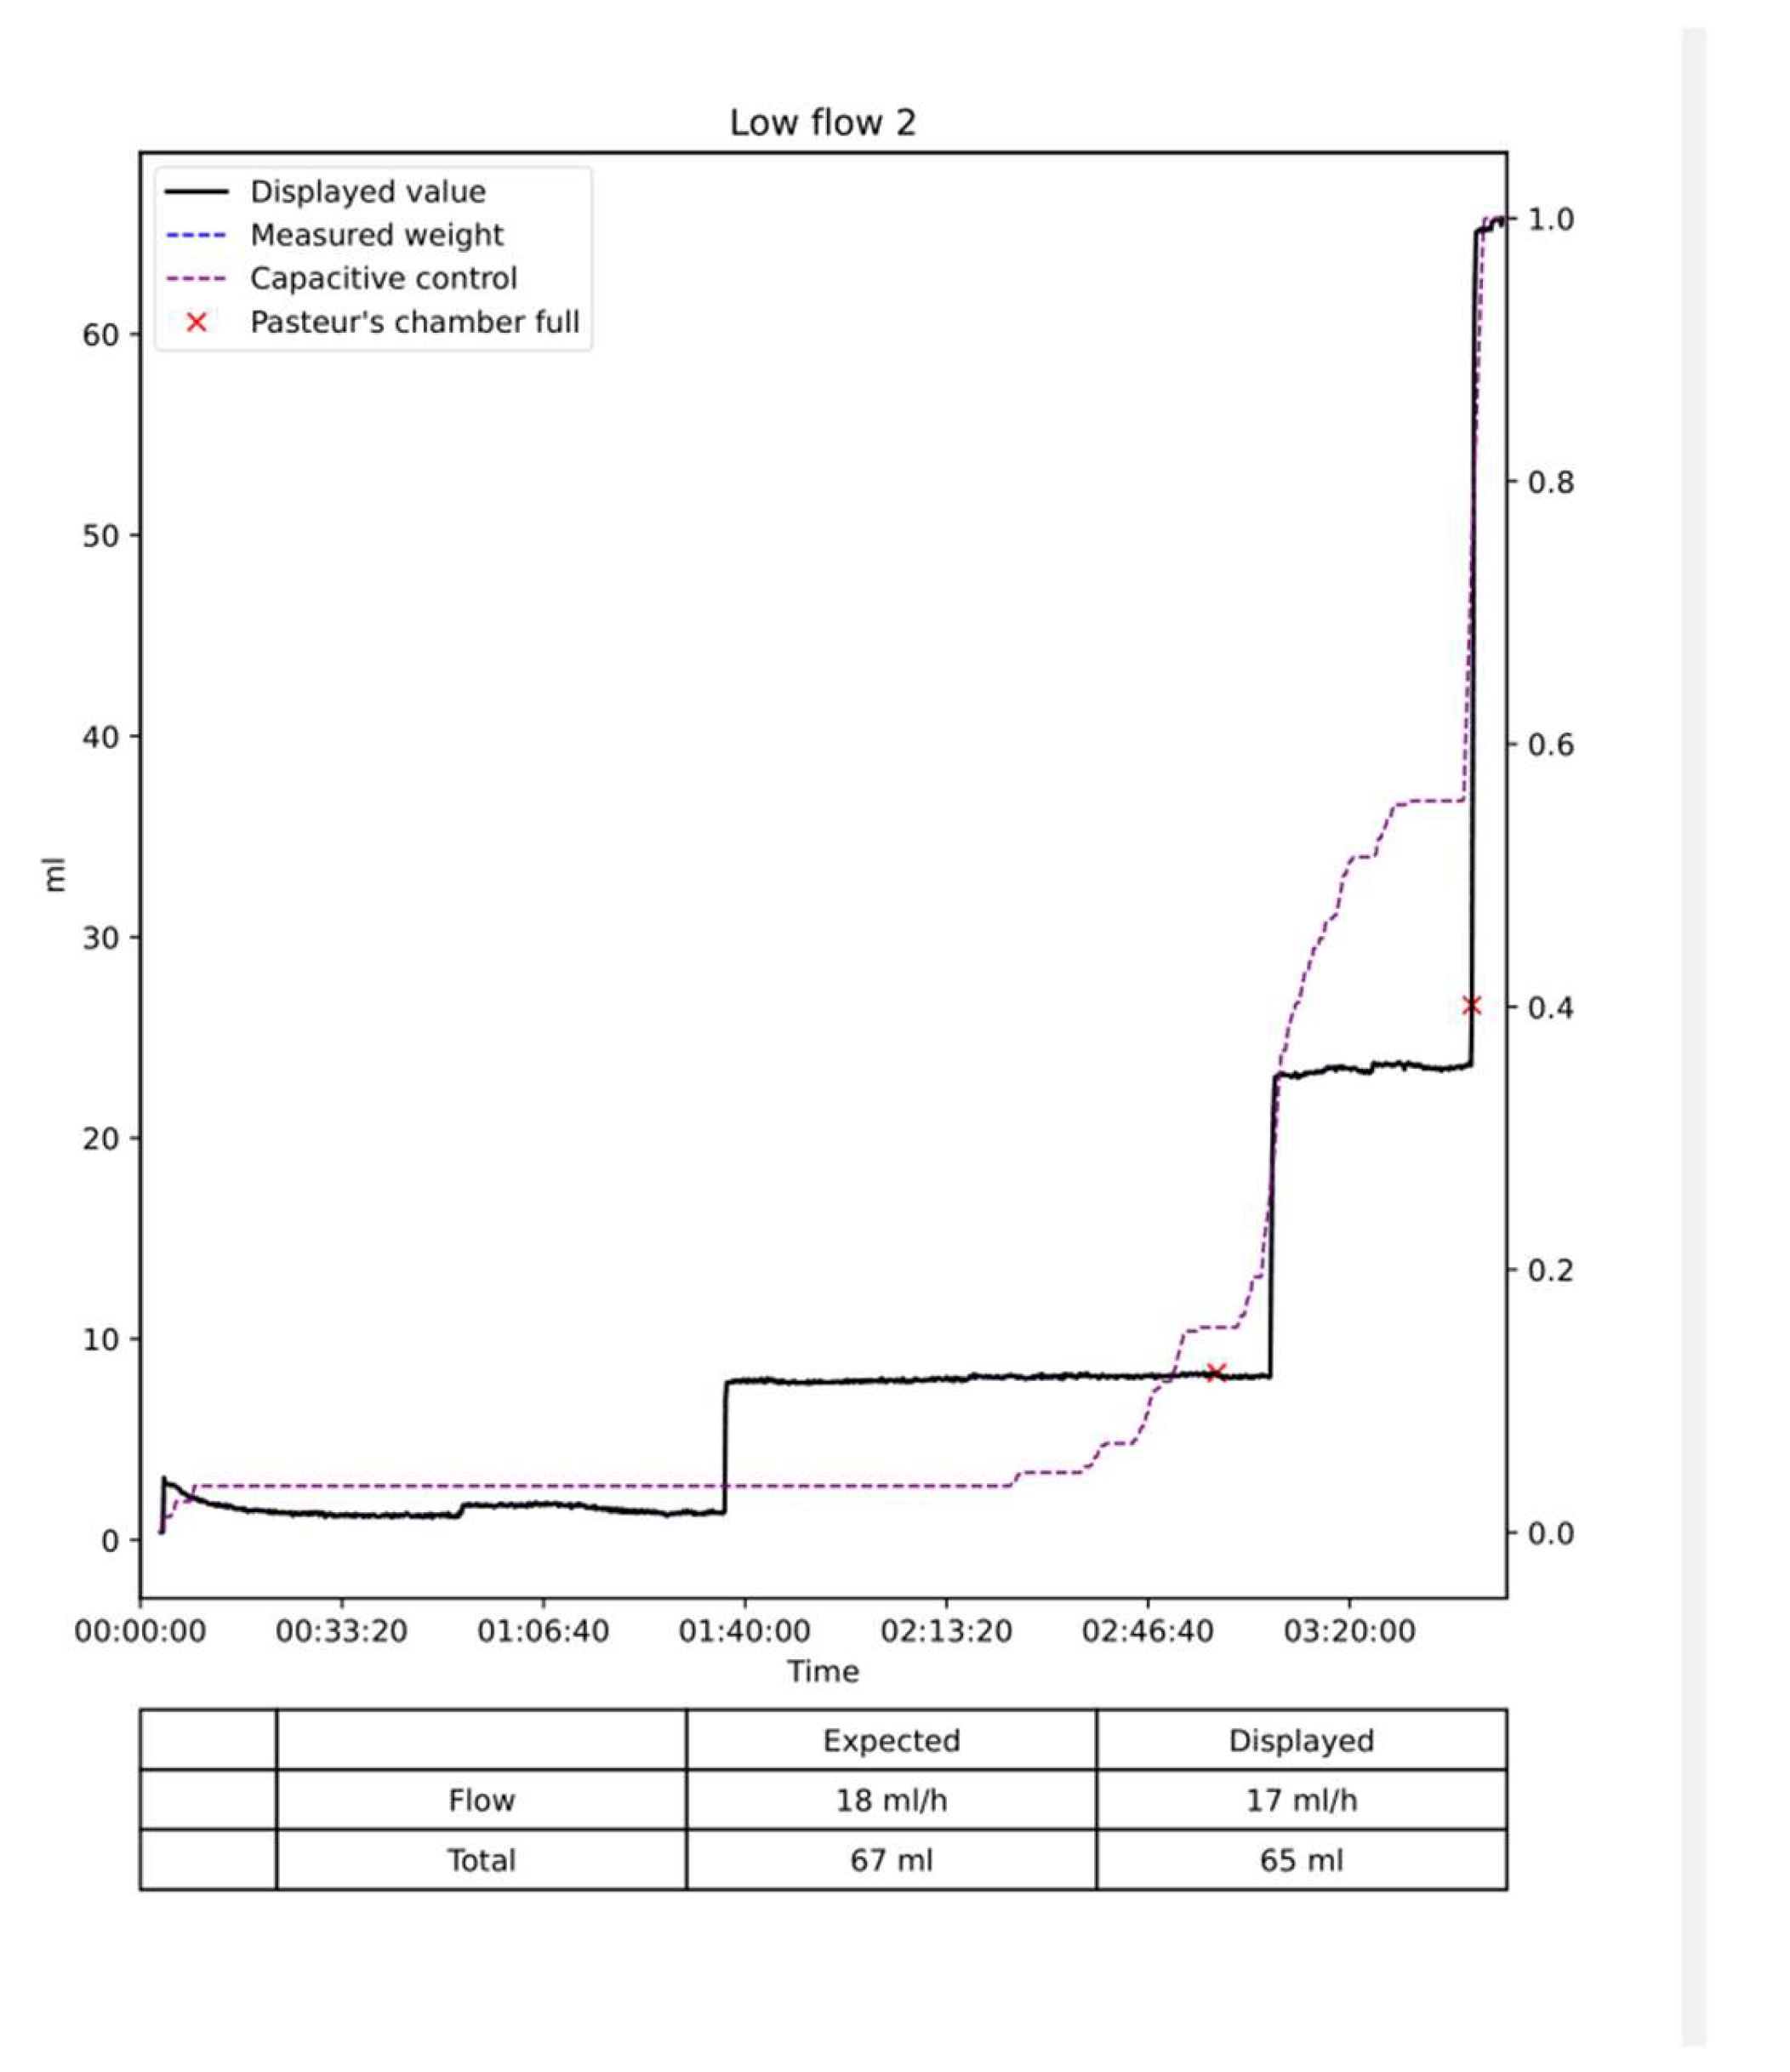
Figure 10. In the low flow situation, the differences between the injected and measured volumes were low between 1 and 3 percent of the injected volume. In the medium flow situation, the measured differences were also low between 0 and 1 %. Slightly higher differences between 1 and 2 percent were noted in the high flow situation with differences between 2 to 3 %. The flow, in other words, the volume per time unit did not influence the results as the total volume of saline injected. Moreover, the two situations with empty of full dead space and Pasteur’s chamber did not influence the measures. The volume of saline in the Pasteur’s chamber and dead space varies from 0 to 90 ml. When the test was started with a full dead space and Pasteur’s chamber the expected and displayed curves are almost superimposed with low differences < 5 ml (
Figure 8,
Figure 9 and
Figure 10). When the test started with a empty dead space and Pasteur’s chamber these spaces have to be filled before the measures started. Once they are full the 2 curves are perfectly parallel as shown on
Figure 9.
The curves of the capacitive sensors followed the curves obtained from the dynamometer. For very low flow it remains flat until the Pasteur’s chamber filled up. As shown on the figures these curves remained parallel to the expected and displayed curve.
Discussion
Most physiological parameters measured in patients in intensive care unit are electronically monitored and several studies have shown that hourly urine output are superior and have a better correlation than manual measurements obtained by the medical staff [
2,
8]. When using manual measurement oliguria can be missed with significant consequences for the patient and even increased mortality due to acute kidney injury [
13]. Automated measurements seem to be significantly better than manual [
19,
20].
Several devices using various monitoring system are already available. For example, the RenalSense Clarity RMS Sensor Kit [
2] uses sensors to measure the flow. The technology is based on thermal transfer. Its cost is relatively high, and this probably explains the low use of the system in clinic. The Accuryn Monitoring System [
14] is another commercially available system, but its accuracy and technology are unknown. The Sensica Urine Output System [
15] is another commercially available continuous urine monitoring device. It was recalled in 2022 due to inaccuracies [
16]. Some of these devices are approved but only in some countries, such as Israel for example, but not in the USA. The urine output measurement systems proposed, by Otero et al was not commercially developed. This device used capacitive sensors for measuring the amount of urine within a rigid container and uses read switches activated by a magnetic float to measure the amount of urine collected in two containers which are arranged in cascade [
8]. When one of the containers fills, it is emptied automatically using a siphon mechanism and urine begins to collect again. An electronic unit sends via Bluetooth the information to a PC that calculates the urine output. This system seems not to be user friendly and requires a large amount of space. It seems that it has not been further developed. Many years ago, the gravimetric method to measure urine output have been presented as a simple, inexpensive, dynamic measurement of urine flow [
7]. However, due to technical problems it has not been further developed and proposed in clinic. Gravimetry has several advantages: it allows to measure flow over short time intervals (< 1sec to 5 sec), it can detect minor changes in flow as small as 2-3 ml and finally is a very simple method. The Sippi device is another new digital, automated urine meter with biofilm control and wireless connectivity. It also has the advantage of actively combat urinary tract infections. There are no clinical data reported with this device at present.
More recently a new low-cost system has been proposed, the IoT Urine Scale. It uses gravimetry to calculate urine output and transmits the data via the Bluetooth technology to a cellular phone. The device is utilizing a strain gauge load cell, an integrated circuit that contains an amplifier, analog-to-digital converter, and a WiFi-enabled microcontroller [
17]. The system seems to work properly and has a very low cost. However, the authors do not comment on potential bad measurements due to shocks against the measurement system.
The developed Uriflux 2023 system was shown successful in capturing simulated urine output. There was only 1 to 5 mL mean difference between the actual volume and Uriflux 2023 measurements in a range between 0 and 5 ml (1-3%). In clinical medicine, this percentage error is negligible and has almost no importance in patient management. However, careful, and frequent urine output monitoring is very important especially in patients with heart failure or shock. Urine output is essential to manage fluid intake and removal. Sometimes minute-to-minute changes in urine output are of critical importance [
18].
Moreover, the rate of urine output (mL/min) was difficult to measure for the nurses for practical reasons and the bag graduations makes precise evaluation difficult. Thus, any rapid changes in urinary flow are difficult to detect and is inaccurate.
Our device has several advantages. It uses gravimetry as measurement system combined with capacity sensors. That means that we have a double check, which works perfectly as shown by our in-vitro results. The measurements problems due to the gravimetry sensor are immediately detected by the capacitors and signaled to the staff. We also have integrated accelerometers which spontaneously correct the excess of movements when detected. It has also, the capability to analyze changes in urinary output on a minute basis and thus indicates immediate changes of the urine output. Moreover, it resembles the devices used today at the patient’s bed. It will make it easy to use because there will be almost no learning curve. Future experimentation on our device must include testing in the real life and over a 24 h period and in different hospital settings and rooms. Some devices must be tested for accuracy at different room temperatures. This has not to be done with ours since temperature is not a parameter which influence measurements.
Conclusions
In summary, the developed Diuriflux system using gravimetry and capacitive sensors is, in-vitro, a very accurate and user-friendly system to measure flow and especially urine output. It showed high accuracy and high adaptability. It is an affordable system compatible with most of the current standard urine collection bags. We believe that it has a real clinical potential and could be adopted and used in the daily practice hospital practice around the world.
Limitations
The overall results obtained with this device, cannot, of course, be extrapolated to the in-vivo situation. Even promising they must be confirmed by in-vivo measurements in clinical practice The next tests will be to test the device in the intensive care unit.
Conflicts of Interest
N. Goy is the engineer who developed the system. A. Desponds et P. Beuret are member of the Diuriflux board.
References
- Kipnis E, Ramsingh D, Bhargava M, Dincer E, Cannesson M, Broccard A, Vallet B, Bendjelid K, Thibault R. Monitoring in the Intensive Care. Crit Care Res Pract. 2012; 473507.
- Goldman A, Azran H, Stern T, Grinstein M, Wilner D. A Novel Electronic Device for Measuring Urine Flow. Clinical Medical Insight 2017; 8:1-6. [CrossRef]
- Murad O, Orjuela Cruz DF, Goldman A, Stern T, van Heerden PV. Improving awareness of kidney function through electronic urine output monitoring: a comparative study..BMC Nephrol. 2022; 27; 23:412. [CrossRef]
- Hersch M, Einav S, Izbicki G. Accuracy, and ease of use of a novel electronic urine output monitoring device compared with standard manual urinometer in the intensive care unit. J Crit Care. 2009; 24:629. e13–629.e17. [CrossRef]
- Hande, A.; Polk, T.; Walker, W.; Bhatia, D. Self-powered wireless sensor networks for remote patient monitoring in hospitals. Sensors 2006, 6, 1102–1117. Sensors 2010, 1010731. [CrossRef]
- Jungk, A.; Thull, B.; Rau, G. Intelligent alarms for anaesthesia monitoring based on fuzzy logic approach. In Fuzzy Logic in Medicine; Physica-Verlag: Heidelberg, Germany, 2002; pp. 219–238.
- Steele J, Skarlatos, Brand P, Metting P, Britton SL. Gravimetric Method for the Dynamic Measurement of Urine Flow.S.E.B.M. 1993,204:70-74.
- Otero A, Palacios F, Akinfiev T, Apalkov A. A low-cost device for monitoring the urine output of critical care patients. Sensors. 2010; 10:10714–10732. [CrossRef]
- Keil S. Technology and Practical Use of Strain Gages with Particular Consideration of Stress Analysis Using Strain Gages. John Wiley & Sons, Ltd. ISBN 978-3-433-60666-7.
- Chattopadhyay S, Banerjee M, Pal S. Modified AC Wheatstone Bridge Network for Accurate Measurement of Pressure Using Strain Gauge Type Pressure Sensor. Sensors and Transducers. 2012 ; 136:25-34.
- Wang J. Liquid Level Sensing Using Capacitive-to-Digital Converters. Analog dialogues. 2015.
- Minor J, Smith A, Deutsch F, Kellum J. Automated versus manual urine output monitoring in the intensive care unit. Sci Rep. 2021 :31 ;11 :97026-8. [CrossRef]
- Macedo, E., Malhotra, R., Bouchard, J., Wynn, S. K. & Mehta, R. L. Oliguria is an early predictor of higher mortality in critically ill patients. Kidney Int. 2011: 80; 760–767. [CrossRef]
- Accuryn Monitoring System. Available online: https://potreromed.com/why-accuryn/ (accessed on 2 May 2023).
- Sensica Urine Output System. Available online: https://www.bd.com/en-us/products-and-solutions/products/product-243page.SCCS1002specifications (accessed on 1 May 2023).
- Class 2 Device Recall Sensica Available online: https://www.accessdata.fda.gov/scripts/cdrh/cfdocs/cfres/res.cfm?id 193881 (accessed on 1 May 2023).
- Lee A, Lee M, Yeh HJJ. An IoT-Based Automatic and Continuous Urine Measurement System.BioMedInformatics 2023, 3(2),446-454; https://doi.org/10.3390/biomedinformatics3020030. [CrossRef]
- Otero, A.; Cardinal-Fernández, P.; Rojas, Y.; Nin, N.; Martínez-Caro, L.; Esteban, A.; Lorente, J.A. On the minute-by-minute variations of urine output: A study in a Porcine Model. J. Nephrol. 2014, 27, 45–50. [CrossRef]
- Hersch M. Kanter L. A new electronic urine meter (UREXACT) is more accurate in meausuring urine output than the standard Urinometer: a comparison study. Critical Care: 2005; 409.
- Bouwhuijsen E, Oude Lansink A, Nijsten MW, Dieperink W. Accuracy of conventional urinary output monitoring in the ICU. Critical Care: 2012;16. [CrossRef]
|
Disclaimer/Publisher’s Note: The statements, opinions and data contained in all publications are solely those of the individual author(s) and contributor(s) and not of MDPI and/or the editor(s). MDPI and/or the editor(s) disclaim responsibility for any injury to people or property resulting from any ideas, methods, instructions or products referred to in the content. |
© 2024 by the authors. Licensee MDPI, Basel, Switzerland. This article is an open access article distributed under the terms and conditions of the Creative Commons Attribution (CC BY) license (http://creativecommons.org/licenses/by/4.0/).
