
Submitted:
07 May 2024
Posted:
10 May 2024
You are already at the latest version
Abstract
Magnetomotive ultrasound (MMUS) is a promising imaging modality for detecting magnetic nanoparticles. In MMUS, an external oscillating magnetic field induces motion of the injected magnetic nanoparticles within tissue, and phase-based tracking algorithms are used to detect the motion. However, the subwavelength scale of theses displacements (often a few micrometers) makes direct visualization on conventional ultrasound B-mode images impossible. In this work, we adapt the Eulerian motion magnification technique to create a novel ultrasound display mode for identifying the nanoparticle locations, eliminating the need for displacement tracking algorithms. Phantom and in-vivo experiments demonstrate that our technique successfully magnifies magnetomotion and the associated shear wave propagation in ultrasound B-mode imaging and pinpoints the nanoparticle vibration source, even in low-concentration scenarios. Additionally, motion magnification magnified the displacement of nanoparticles, having the potential to improve the localization accuracy of displacement tracking algorithms in MMUS.
Keywords:
motion magnification
; ultrasound imaging
; magnetomotive ultrasound
; shear wave propagation
1. Introduction
In ultrasound imaging, backscattered acoustic signals provide structural information for clinical diagnosis. Visualization methods like B-mode imaging offer an intuitive view of the imaged tissue. Recent advancement in ultrasound imaging have focused on ultrafast imaging techniques, enabling the observation of functional signals and smaller displacements [1,2]. However, displacements smaller than the wavelength of the transmitted acoustic pulse (i.e., subwavelength displacements) cannot be resolved in conventional B-mode imaging after envelope detection, leading to potential information loss.
Magnetomotive ultrasound imaging (MMUS) is an ultrasound molecular imaging modality used to detect the presence of magnetic nanoparticles within tissue [3,4]. MMUS systems apply an external oscillating magnetic field to induce motion of the injected magnetic nanoparticles. This induced motion is detected using various tracking algorithms, revealing the location of the nanoparticles [5,6,7,8]. Compared to other molecular imaging modalities such as magnetic resonance imaging (MRI) and nuclear imaging, MMUS is non-invasive, cost-effective, and free from ionizing radiation. It has demonstrated success in ultrasound molecular imaging, monitoring nano-drug delivery, and sentinel lymph node identification [9,10,11]. Moreover, recent research has established the real-time imaging capabilities of MMUS [12,13,14].
MMUS is typically visualized through a localization map that shows the location of the detected nanoparticles within the imaged tissue. The induced magnetomotion of nanoparticles occurs typically on the order of a few microns, which is smaller than the imaging wavelength of clinical ultrasound, making it imperceptable in B-mode images. Therefore, direct visualization of nanoparticle displacement and motion is not possible using B-mode imaging.
Motion magnification is a technique for amplifying subtle movements in natural videos [15]. Previous research introduced an Eulerian motion magnification technique, which magnifies spatial motion through temporal frequency filtering [16]. Other methods utilize phase-based processing for robust motion magnification [17,18]. These techniques have shown great results in revealing previously imperceptible motion in natural videos.
Inspired by the success of motion magnification in natural videos, we believe that similar techniques can be used to amplify imperceptible sub-wavelength displacements in ultrasound imaging, specifically, amplifying the induced subwavelength motion of magnetic nanoparticles in MMUS, offering potential diagnostic benefits for clinicians [19].
In this work, we modify the Eulerian motion magnification technique for MMUS imaging. Our goal extends beyond increasing the magnitude of nanoparticle magnetomotion. We aim to introduce a novel display mode that directly distinguishes the vibration source within B-mode image sequences. This visualization would allow for immediate determination of vibration source and nanoparticle locations, eliminating the need for displacement calculations and tracking. Moreover, this new display mode would simultaneously present both structural information and magnetomotion within the B-mode image sequences.
2. Materials and Methods
2.1. Eulerian Motion Magnification
Eulerian motion magnification is a technique used to extract and amplify subtle spatial motions within natural videos [16]. It implicitly maps temporal changes into spatial changes through the derivation of the first-order Taylor expansion. This allows for spatial motion magnification using simple temporal processing. Temporal filters and a Laplacian pyramid are used to extract the desired motion signal, which is then amplified by an amplification factor to create the magnification effect.
We consider a one dimensional motion signal and let to denote the signal intensity at position x and time t. We assume at , the initial intensity is described by a function f, such that . The intensity change caused by the the signal motion can be expressed by a displacement function , such that
The goal of motion magnification is to enlarge such motion. For some amplification factor , the ideal motion magnified signal is
Assume the displacement is small enough, so that the signal can be approximated by first-order Taylor series expansion.
Then, we apply a temporal bandpass filter to at every position x, and remove the static intensity (i.e., ). The signal after filtering is
In Eulerian motion magnification, the bandpass signal is amplified by and added back to , which creates
Combining the above equations, we can derive that
Assume that the first-order Taylor expansion holds for the amplified displacement , we can see that is approximately the ideal motion magnified signal ,
This shows that spatial motion magnification can be performed by temporal processing. The above derivation demonstrates a case of a one dimensional signal, and can be generalized directly to a two dimensional signal.
2.2. Motion Magnification on MMUS
A key assumption of Eulerian motion magnification is that the target signal should be narrowband. If the motion is broadband, the magnification effect will vary based on the signal’s spatial wavelength, with shorter wavelengths having greater magnification. In Eulerian motion magnification, a Laplacian pyramid decomposition is used to handle this issue to process with different amplification factors for each scale [20]. However, in ultrasound imaging signals, determined by the transducer’s center frequency, are relatively narrowband. Therefore, a single temporal filter is sufficient for extracting and amplifying the motion signal and the Laplacian pyramid decomposition becomes unnecessary.
Additionally, with large amplification factors, motion magnification can lead to different intensity changes for different spatial frequencies. This intensity artifact is undesirable in natural videos as it creates visually unpleasant patterns [19]. However, in ultrasound imaging, due to the presence of speckle patterns, the intensity artifact serves as an intensity enhancement, enabling better visualization and observation of the motion signal.
Ultrasound beamformed baseband data is the input for our motion magnification technique. This is because the sub-wavelength magnetomotion inherent to MMUS (on the order of a few microns) would be obscured after envelope detection. We perform motion magnification separately on the real and imaginary components of the complex baseband data, and reconstruct the motion magnified baseband data afterward. A temporal bandpass Butterworth filter is designed according to the magnetic pulse frequency of the MMUS system and employed to extract the MMUS motion signal. Figure 1 illustrates the pipeline of our motion magnification method.
The motion magnification in MMUS can be expressed mathematically as follows:
where is the motion magnified MMUS data with x being the lateral axis, z being the axial axis, and t being the slow-time axis (i.e., frame by frame); is the original beamformed baseband MMUS data; is the amplification factor; is the original data after bandpass filtering along the slow-time axis (i.e., frame by frame direction).
2.3. Pulsed Magneto-Motive Ultrasound (pMMUS)
In this work, we employ an ultrafast plane wave pulsed MMUS system (pMMUS) to acquire MMUS imaging data [21,22]. B-mode imaging is captured by ultrafast plane wave imaging with frame rate of 2500 Hz. The high frame rate enables us to observe the temporal change of the induced displacement of the nanoparticles. The imaging is performed on an ultrasound research platform (Prodigy, S-Sharp, Taiwan) equipped with a 7.5 MHz linear array transducer (L7.5-12840C).An external electromagnet solenoid, positioned beneath the imaged tissue and driven by a magnetic pulser, generates the magnetic field for MMUS. We utilize custom-made superparamagnetic iron oxide nanoparticles (SPIONs) as the MMUS contrast agent [23]. Figure 2 illustrates the configuration of our pMMUS system.
Each MMUS imaging sequence involves the magnetic pulser generating five 100 Hz magnetic pulse cycles (10 ms per cycle, 5 ms active field generation, 5 ms cooldown). The pulser produces a maximum field strength of 0.3 Tesla above the solenoid. Figure 3 depicts the magnetic pulser’s firing sequence and the corresponding measured magnetic field profile.
3. Results and Discussions
3.1. Phantom Experiment
In this section, we verify the proposed motion magnification technique with a tissue-mimicking phantom. This phantom consists of a 3 g/L gelatin base with embedded 0.5% cellulose particles to provide ultrasound scattering. Additionally, superparamagnetic iron oxide nanoparticle (SPION) with concentration of 5 mg/ml is embedded at the center of the phantom [24]. We position this phantom directly above the electromagnet and utilize our ultrafast pMMUS system to acquire MMUS data.
We employ a temporal Butterworth bandpass filter to extract the MMUS-induced magnetomotion. For motion magnification, we apply amplification factors () of 10 and 100. The motion magnified results of the SPION inclusion phantom are shown in Figure 4. After motion magnification, the propagation of shear wave associated with magneto motion is magnified with the intensity enhancement effect. We can see that higher amplification factor leads to stronger intensity enhancement effect. Therefore, the shear wave and the location of the vibration source (i.e., SPION inclusion) can be easily observed in the B-mode image sequences. In addition to the intensity enhancement effect, we can also observe the magnified motion of the speckle patterns which is previously invisible in the original B-mode data, as shown in Figure 5.
3.2. Phantom Experiment with Different SPION Concentrations
The intensity of the MMUS displacement signal is directly proportional to the concentration of injected magnetic nanoparticles. Therefore, we evaluate the effectiveness of our motion magnification technique in visualizing the motion induced by varying nanoparticle concentrations, particularly for low-concentration phantoms. We made three gelatin phantoms embedded with different nanoparticle concentrations: 2 mg/ml, 3 mg/ml, and 5 mg/ml.
Figure 6 demonstrates the impact of varying nanoparticle concentrations on motion magnification with an amplification factor of 10. Compared to the 5 mg/ml phantom, the magnification effect is less obvious in the 2 mg/ml phantom, making the shear wave propagation less distinct. This suggests potential limitations in visualizing very subtle magnetomotion induced by lower nanoparticle concentrations.
One potential solution for visualizing low-concentration phantoms is to increase the amplification factor for stronger motion magnification. Figure 7 illustrates this with an amplification factor of 100. While the shear wave propagation in the 2 mg/ml phantom is amplified due to the enhanced intensity effect, precisely localizing the SPION remains challenging. This suggests that even with higher amplification, there may be limitations in accurately pinpointing the vibration source within very low-concentration scenarios.
Since the magnification is indistinguishable in B-mode image sequences in low-concentration phantom, We track the displacement with phase-based correlation method to localize the location of SPION [25,26], as shown in Figure 8. The results demonstrates that motion mganification amplifies displacement, making it easier to track both the shear wave and the SPION motion.
The results suggest that the proposed motion magnification technique not only enables B-mode visualization for MMUS imaging, but also has the potential to enhance the localization accuracy of displacement tracking algorithms. This opens up possibilities for improving localization and tracking performance within the field of MMUS imaging.
3.3. In Vivo Experiment
To further validate our motion magnification technique, we conducted an in vivo study focusing on sentinel lymph node (SLN) identification, which is a clinical application of MMUS imaging. SLN biopsy serves as a key indicator for cancer monitoring, and accurate SLN identification is essential for the procedure [26].
In our in vivo experiment, SPION is intradermally injected at the left hind paw of a Sprague-Dawley rat. After 1.5 hours of in vivo MMUS monitoring, methylene blue dye is injected to confirm the location of the lymph node, where the nanoparticles accumulate. MMUS data is acquired using our pMMUS system.
Compared with the phantom experiments, the induced SPIO displacements in in vivo experiments are typically smaller. Furthermore, physiological noise sources like breathing and muscle tremors can interfere with motion magnification. Therefore, we employ larger amplification factor to increase the degree of motion magnification for better visualization.
Figure 9 shows the motion magnification results of the in vivo experiment. While shear wave propagation is less pronounced than in phantom experiments (likely due to the inhomogeneity of living tissue), we successfully observe motion and brightness changes at the vibration source. This allows us to pinpoint the injected SPION and identify the sentinel lymph node.
We also calculated the displacement map using phase-based correlation tracking method, as shown in Figure 10. As expected, motion magnification amplifies displacement, aiding in the identification of SPION and SLN. However, this technique also undesirably amplifies the displacement in surrounding tissues due to background motion noise. The noise is extracted by the temporal bandpass filter, and adds complexity to the displacement map.
4. Conclusions
In this work, we introduce a motion magnification technique for ultrasound MMUS imaging. Our technique utilizes a bandpass temporal filter to extract the target magnetomotion, and subsequently amplifying it with a designated amplification factor. Results show the ability to directly visualize previously imperceptible SPION magnetomotion with the B-mode image sequences. In addition, this technique also enhances the performance of displacement tracking methods employed in MMUS imaging, leading to improved tracking and localization performance.
Author Contributions
Conceptualization, W.-H.S., T.-M.Y. and M.-L.L.; Methodology, W.-H.S., T.-M.Y. and M.-L.L.; Software, W.-H.S. and T.-M.Y.; Resources, M.-Y.L.; Writing – Original Draft Preparation, W.-H.S.; Writing – Review & Editing, M.-L.L.; Funding Acquisition, M.-L.L. All authors have read and agreed to the published version of the manuscript.
Funding
This research was funded by National Science and Technology Council, Taiwan, grant number MOST 106-2221-E-007-033-MY3 and MOST 110-2221-E-007-011-MY3.
Data Availability Statement
The raw data supporting the conclusions of this article will be made available by the authors on request.
Acknowledgments
We thank Professor Chang-Ming Liaw (Department of Electrical Engineering, National Tsing Hua University, Hsinchu, Taiwan) for the design and implementation of the magnetic pulser used in our ultrafast MMUS system.
Conflicts of Interest
The authors declare no conflicts of interest.
References
- Tanter, M.; Fink, M. Ultrafast imaging in biomedical ultrasound. IEEE Transactions on Ultrasonics, Ferroelectrics, and Frequency Control 2014, 61, 102–119. [Google Scholar] [CrossRef] [PubMed]
- Ng, A.; Swanevelder, J. Resolution in ultrasound imaging. Continuing Education in Anaesthesia, Critical Care & Pain 2011, 11, 186–192. [Google Scholar]
- Oh, J.; Feldman, M.D.; Kim, J.; Condit, C.; Emelianov, S.; Milner, T.E. Detection of magnetic nanoparticles in tissue using magneto-motive ultrasound. Nanotechnology 2006, 17, 4183. [Google Scholar] [CrossRef] [PubMed]
- Sjöstrand, S.; Evertsson, M.; Jansson, T. Magnetomotive Ultrasound Imaging Systems: Basic Principles and First Applications. Ultrasound in Medicine & Biology 2020, 46, 2636–2650. [Google Scholar] [CrossRef]
- Evertsson, M.; Cinthio, M.; Fredriksson, S.; Olsson, F.; Persson, H.W.; Jansson, T. Frequency-and phase-sensitive magnetomotive ultrasound imaging of superparamagnetic iron oxide nanoparticles. IEEE transactions on ultrasonics, ferroelectrics, and frequency control 2013, 60, 481–491. [Google Scholar] [CrossRef] [PubMed]
- Hossain, M.M.; Levy, B.E.; Thapa, D.; Oldenburg, A.L.; Gallippi, C.M. Blind source separation-based motion detector for imaging super-paramagnetic iron oxide (SPIO) particles in magnetomotive ultrasound imaging. IEEE transactions on medical imaging 2018, 37, 2356–2366. [Google Scholar] [CrossRef]
- Pope, A.G.; Wu, G.; McWhorter, F.Y.; Merricks, E.P.; Nichols, T.C.; Czernuszewicz, T.J.; Gallippi, C.M.; Oldenburg, A.L. Contrast-enhanced imaging of SPIO-labeled platelets using magnetomotive ultrasound. Physics in Medicine & Biology 2013, 58, 7277. [Google Scholar]
- Holst, M.; Cinthio, M.; Fredriksson, S.; Olsson, F.; Persson, H.W.; Jansson, T. Phase-locked magnetomotive ultrasound imaging of superparamagnetic iron-oxide nanoparticles. 2010 IEEE International Ultrasonics Symposium. IEEE, 2010, pp. 1007–1010.
- Evertsson, M.; Kjellman, P.; Cinthio, M.; Andersson, R.; Tran, T.A.; in’t Zandt, R.; Grafström, G.; Toftevall, H.; Fredriksson, S.; Ingvar, C.; others. Combined Magnetomotive ultrasound, PET/CT, and MR imaging of 68Ga-labelled superparamagnetic iron oxide nanoparticles in rat sentinel lymph nodes in vivo. Scientific reports 2017, 7, 4824. [Google Scholar] [CrossRef] [PubMed]
- Fink, M.; Rupitsch, S.J.; Ermert, H.; Lyer, S. In Vivo study on magnetomotive ultrasound imaging in the framework of nanoparticle based magnetic drug targeting. Current Directions in Biomedical Engineering 2020, 6, 543–546. [Google Scholar] [CrossRef]
- Mehrmohammadi, M.; Qu, M.; Ma, L.L.; Romanovicz, D.K.; Johnston, K.P.; Sokolov, K.V.; Emelianov, S.Y. Pulsed magneto-motive ultrasound imaging to detect intracellular accumulation of magnetic nanoparticles. Nanotechnology 2011, 22, 415105. [Google Scholar] [CrossRef] [PubMed]
- Kranemann, T.C.; Ersepke, T.; Schmitz, G. Real-time magnetomotive ultrasound imaging using a recursive estimator. 2018 IEEE International Ultrasonics Symposium (IUS). IEEE, 2018, pp. 1–4.
- Evertsson, M.; Ramalli, A.; Pavan, T.Z.; Cabrelli, L.C.; Andersson, R.; Cinthio, M.; Tortoli, P.; Jansson, T. Towards real-time magnetomotive ultrasound imaging. 2017 IEEE International Ultrasonics Symposium (IUS). IEEE, 2017, pp. 1–4.
- Shen, W.H.; Li, M.L. Toward Real Time Backward-Mode Pulsed Magnetomotive Ultrasound. 2019 IEEE International Ultrasonics Symposium (IUS). IEEE, 2019, pp. 396–398.
- Liu, C.; Torralba, A.; Freeman, W.T.; Durand, F.; Adelson, E.H. Motion magnification. ACM transactions on graphics (TOG) 2005, 24, 519–526. [Google Scholar] [CrossRef]
- Wu, H.Y.; Rubinstein, M.; Shih, E.; Guttag, J.; Durand, F.; Freeman, W. Eulerian video magnification for revealing subtle changes in the world. ACM transactions on graphics (TOG) 2012, 31, 1–8. [Google Scholar] [CrossRef]
- Wadhwa, N.; Rubinstein, M.; Durand, F.; Freeman, W.T. Phase-based video motion processing. ACM Transactions on Graphics (ToG) 2013, 32, 1–10. [Google Scholar] [CrossRef]
- Wu, X.; Yang, X.; Jin, J.; Yang, Z. PCA-based magnification method for revealing small signals in video. Signal, Image and Video Processing 2018, 12, 1293–1299. [Google Scholar] [CrossRef]
- Yeh, T.M.; Li, M.L. B-mode subwavelength vibration imaging. 2017 IEEE International Ultrasonics Symposium (IUS). IEEE, 2017, pp. 1–4.
- Burt, P.J.; Adelson, E.H. The Laplacian pyramid as a compact image code. In Readings in computer vision; Elsevier, 1987; pp. 671–679.
- Ting, P.H.; Kang, Y.D.; Chen, S.Y.; Li, M.L. Ultrafast plane wave imaging based pulsed magnetomotive ultrasound. 2014 IEEE International Ultrasonics Symposium. IEEE, 2014, pp. 456–458.
- Huang, Y.C.; Houng, J.Y.; Kang, Y.D.; Chen, S.Y.; Li, M.L. Ultrafast pulsed magnetomotive ultrasound imaging of sentinel lymph nodes: Small animal study. 2015 IEEE International Ultrasonics Symposium (IUS). IEEE, 2015, pp. 1–3.
- Huang, C.C.; Chang, P.Y.; Liu, C.L.; Xu, J.P.; Wu, S.P.; Kuo, W.C. New insight on optical and magnetic Fe 3 O 4 nanoclusters promising for near infrared theranostic applications. Nanoscale 2015, 7, 12689–12697. [Google Scholar] [CrossRef] [PubMed]
- Wang, H.W.; Huang, C.C.; Li, M.L. Improved backward mode pulsed magnetomotive ultrasound via pre-magnetization of superparamagnetic iron oxide nanoparticles. 2019 IEEE International Ultrasonics Symposium (IUS). IEEE, 2019, pp. 2387–2389.
- Lu, M.C.; Houng, J.Y.; Li, M.L. Backward-mode ultrafast pulsed magnetomotive ultrasound. 2017 IEEE International Ultrasonics Symposium (IUS), 2017, pp. 1–4. [CrossRef]
- Huang, Y.C.; Houng, J.Y.; Kang, Y.D.; Chen, S.Y.; Li, M.L. Ultrafast pulsed magnetomotive ultrasound imaging of sentinel lymph nodes: Small animal study. 2015 IEEE International Ultrasonics Symposium (IUS), 2015, pp. 1–3. [CrossRef]
Figure 1.
Motion magnification technique on MMUS data. The technique begins with beamformed baseband MMUS 3D data. We process the real and imaginary parts separately. A temporal filter along the slow-time extracts the target magnetomotion, which is then amplified by an amplification factor. Finally, the amplified motion signal is added back to the original signal, yielding the motion-magnified result.
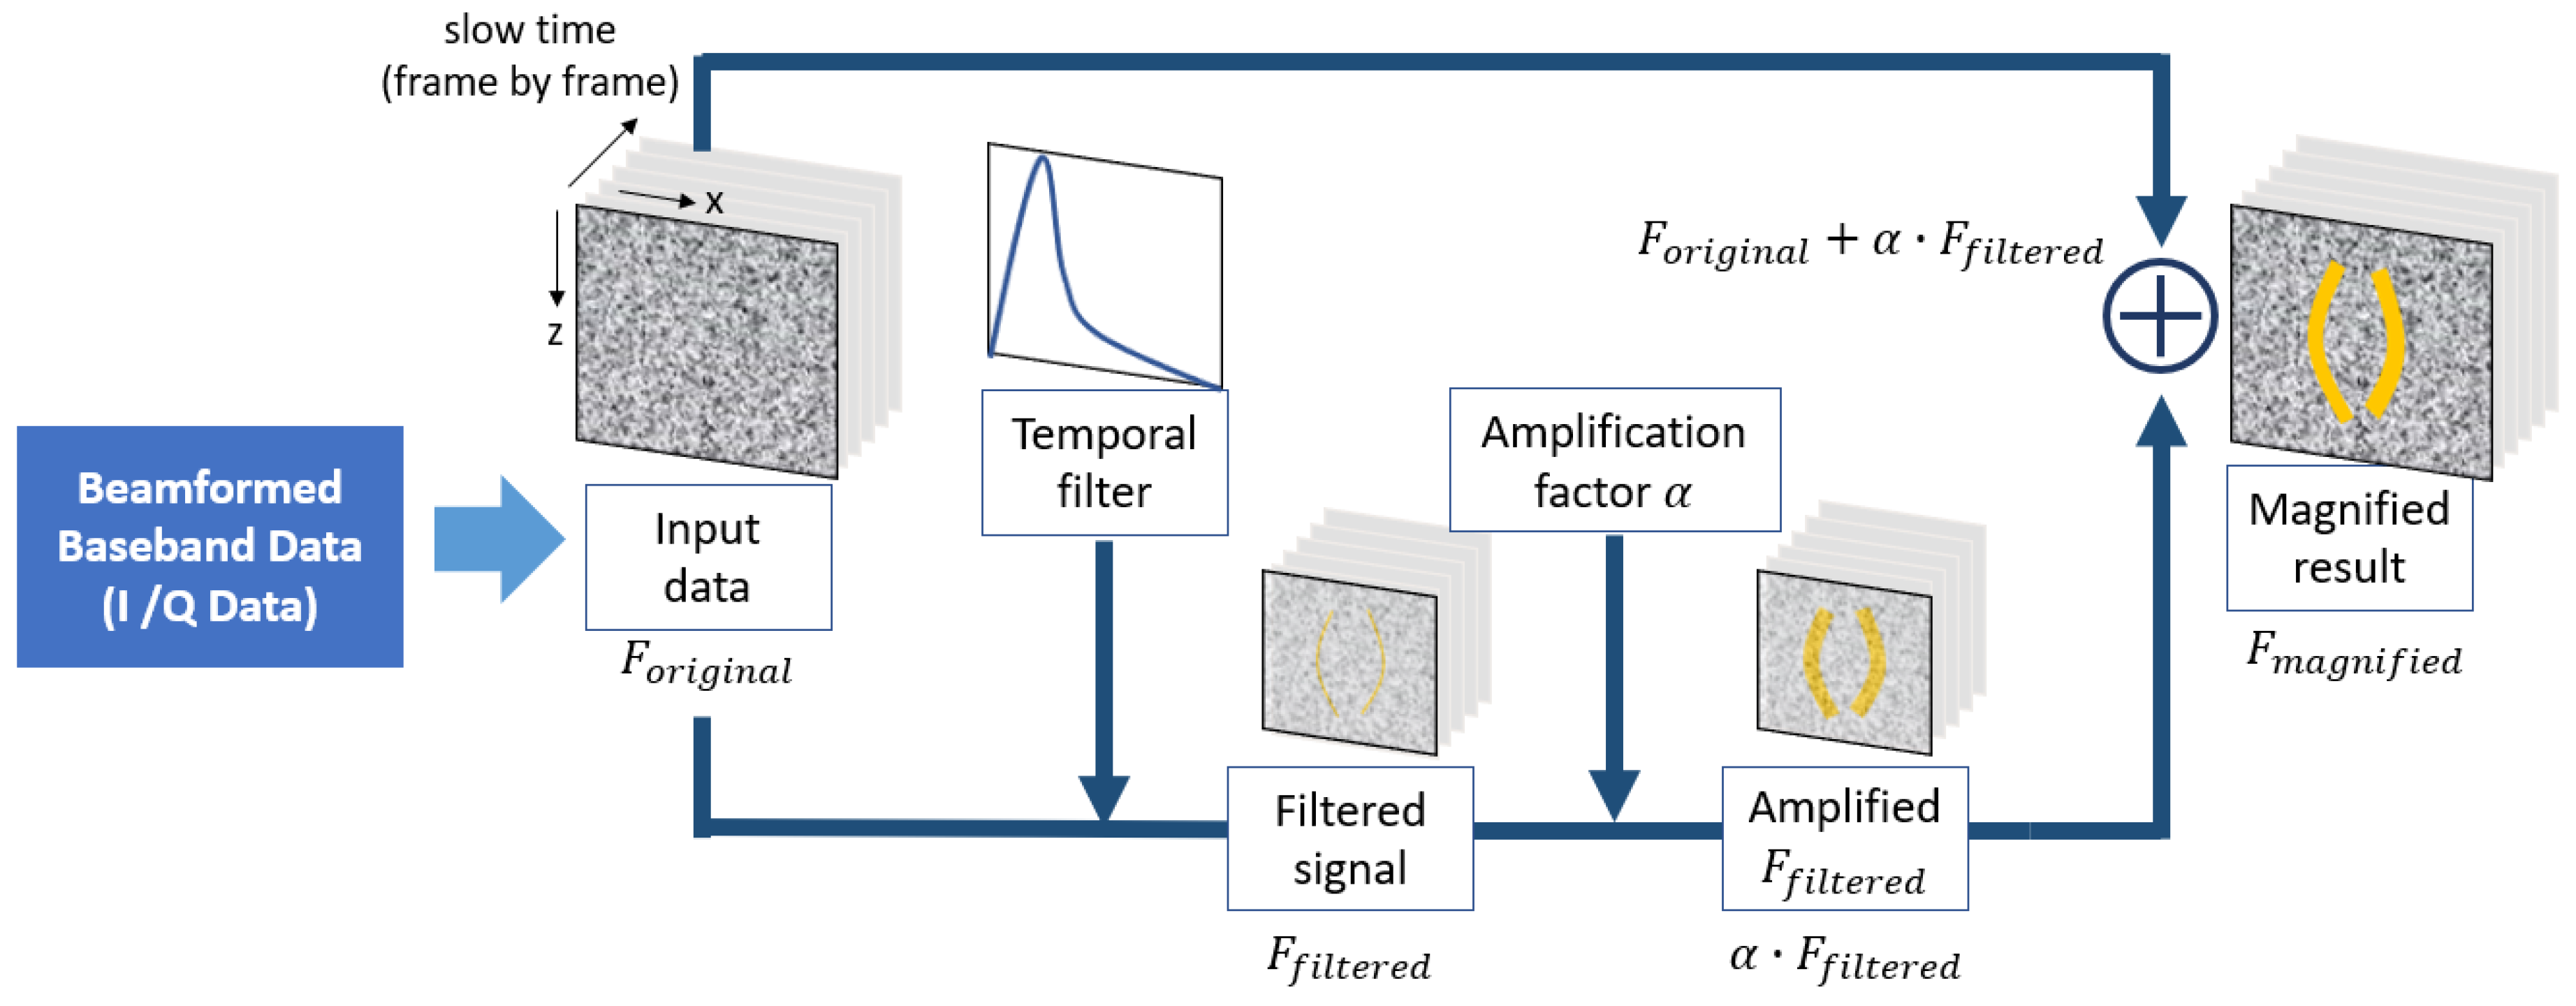
Figure 2.
Setup of our ultrafast plane wave pulsed magneto-motive ultrasound (pMMUS) system. An electromagnet, controlled by a magnetic pulser, generates the magnetic field. Ultrafast plane wave B-mode imaging at 2500 Hz is used for data acquisition. A PC with a DAQ card synchronizes and triggers the ultrasound engine and magnetic pulser.
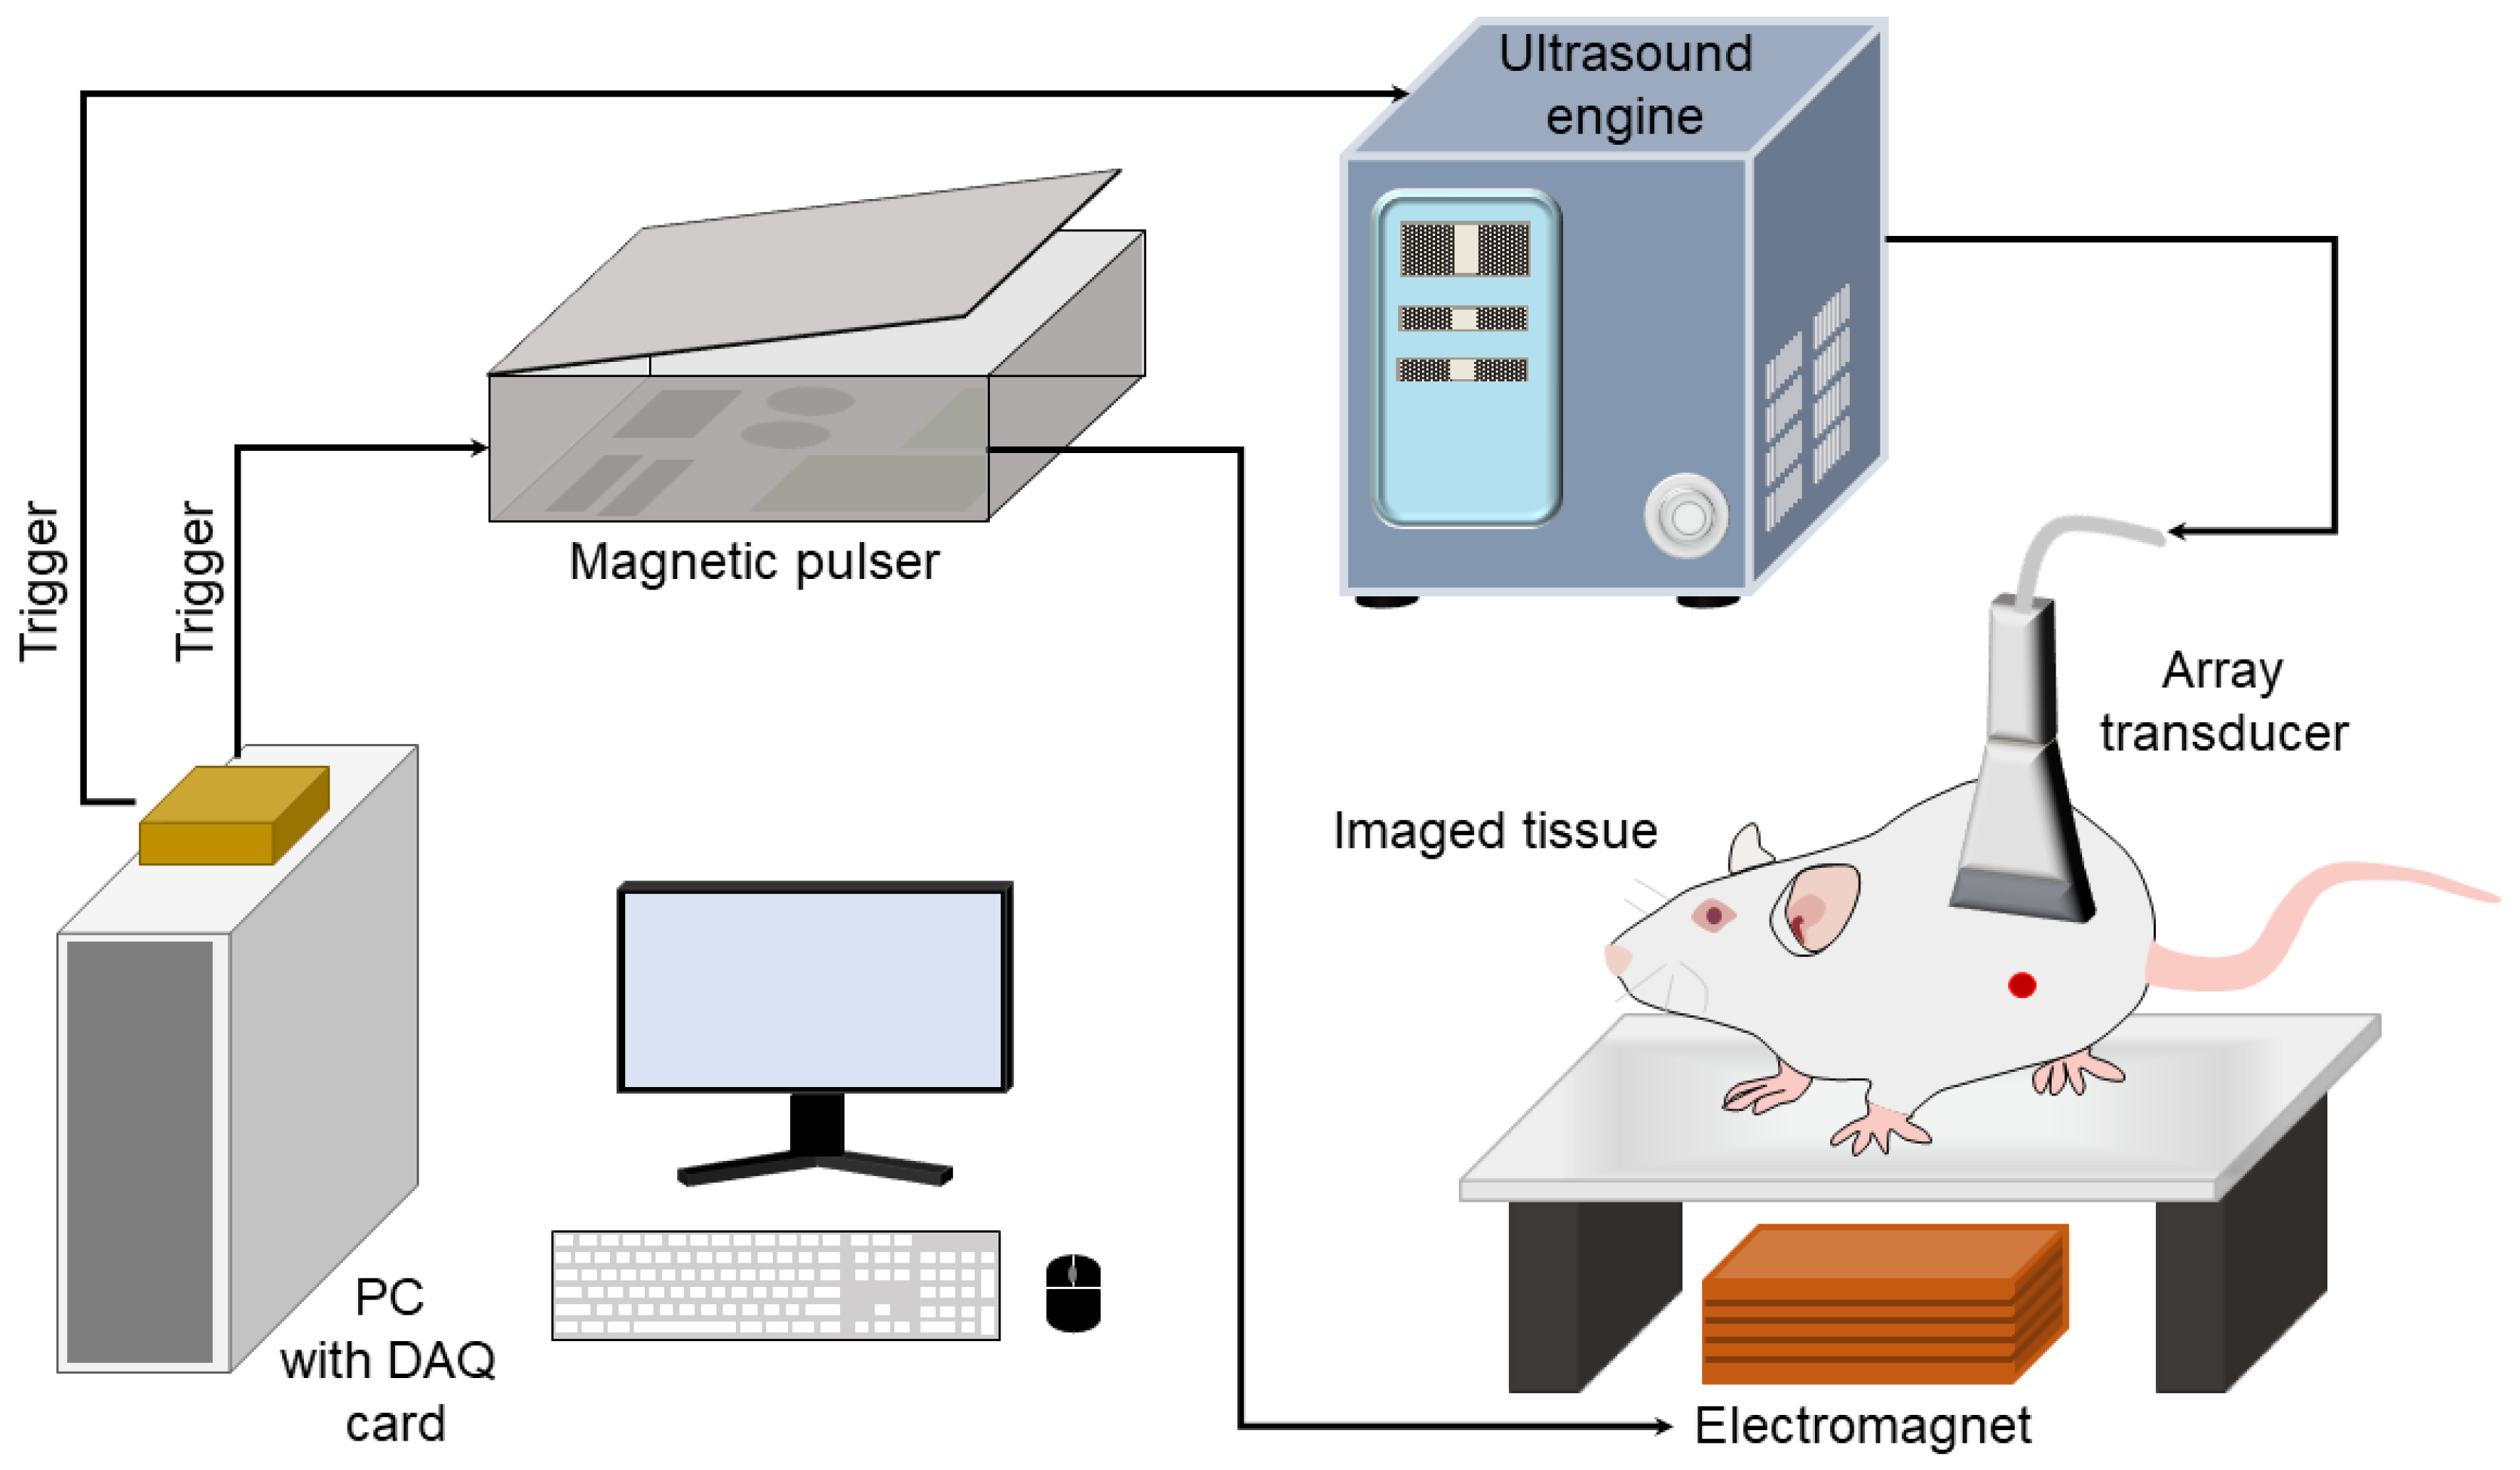
Figure 3.
Magnetic pulse sequence of the magnetic puler and the measured magnetic field. In each MMUS firing, the magnetic pulser delivers five cycles of 100 Hz magnetic pulses. Each cycle has a duration of 10 ms, consisting of a 5 ms active field generation phase (“ON”) followed by a 5 ms cooldown phase (“OFF”). The pulser generates a maximum magnetic field strength of 0.3 Tesla above the solenoid.
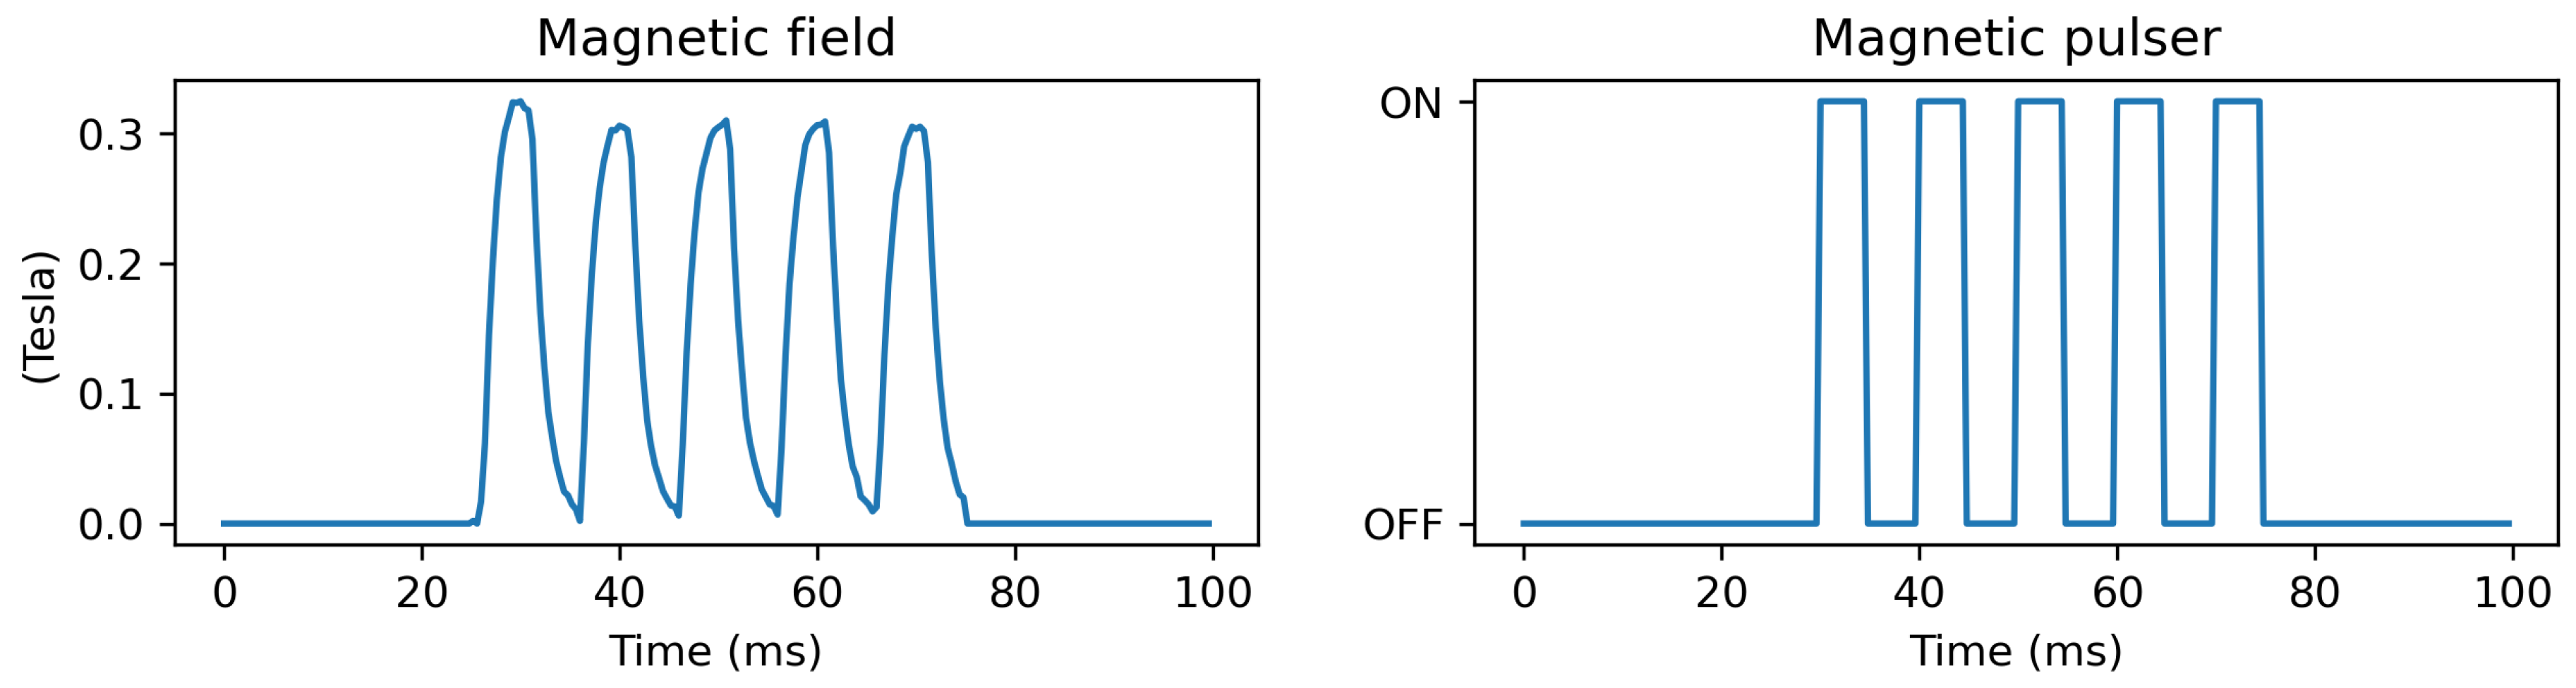
Figure 4.
The motion magnified results of the gelatin phantom. The first row is the original B-mode sequence, the second row is the motion magnified B-mode sequence with amplification factor =10, and the third row is the motion magnified B-mode sequence with amplification factor =100. After motion magnification, the propagation of shear wave and the location of the SPION inclusion can be easily observed and identified. With higher amplification factor , the intensity enhancement of the shear wave propagation is stronger. (Mag. denotes motion magnified). Video results can be viewed at https://youtu.be/TYiCaRtzWkI.
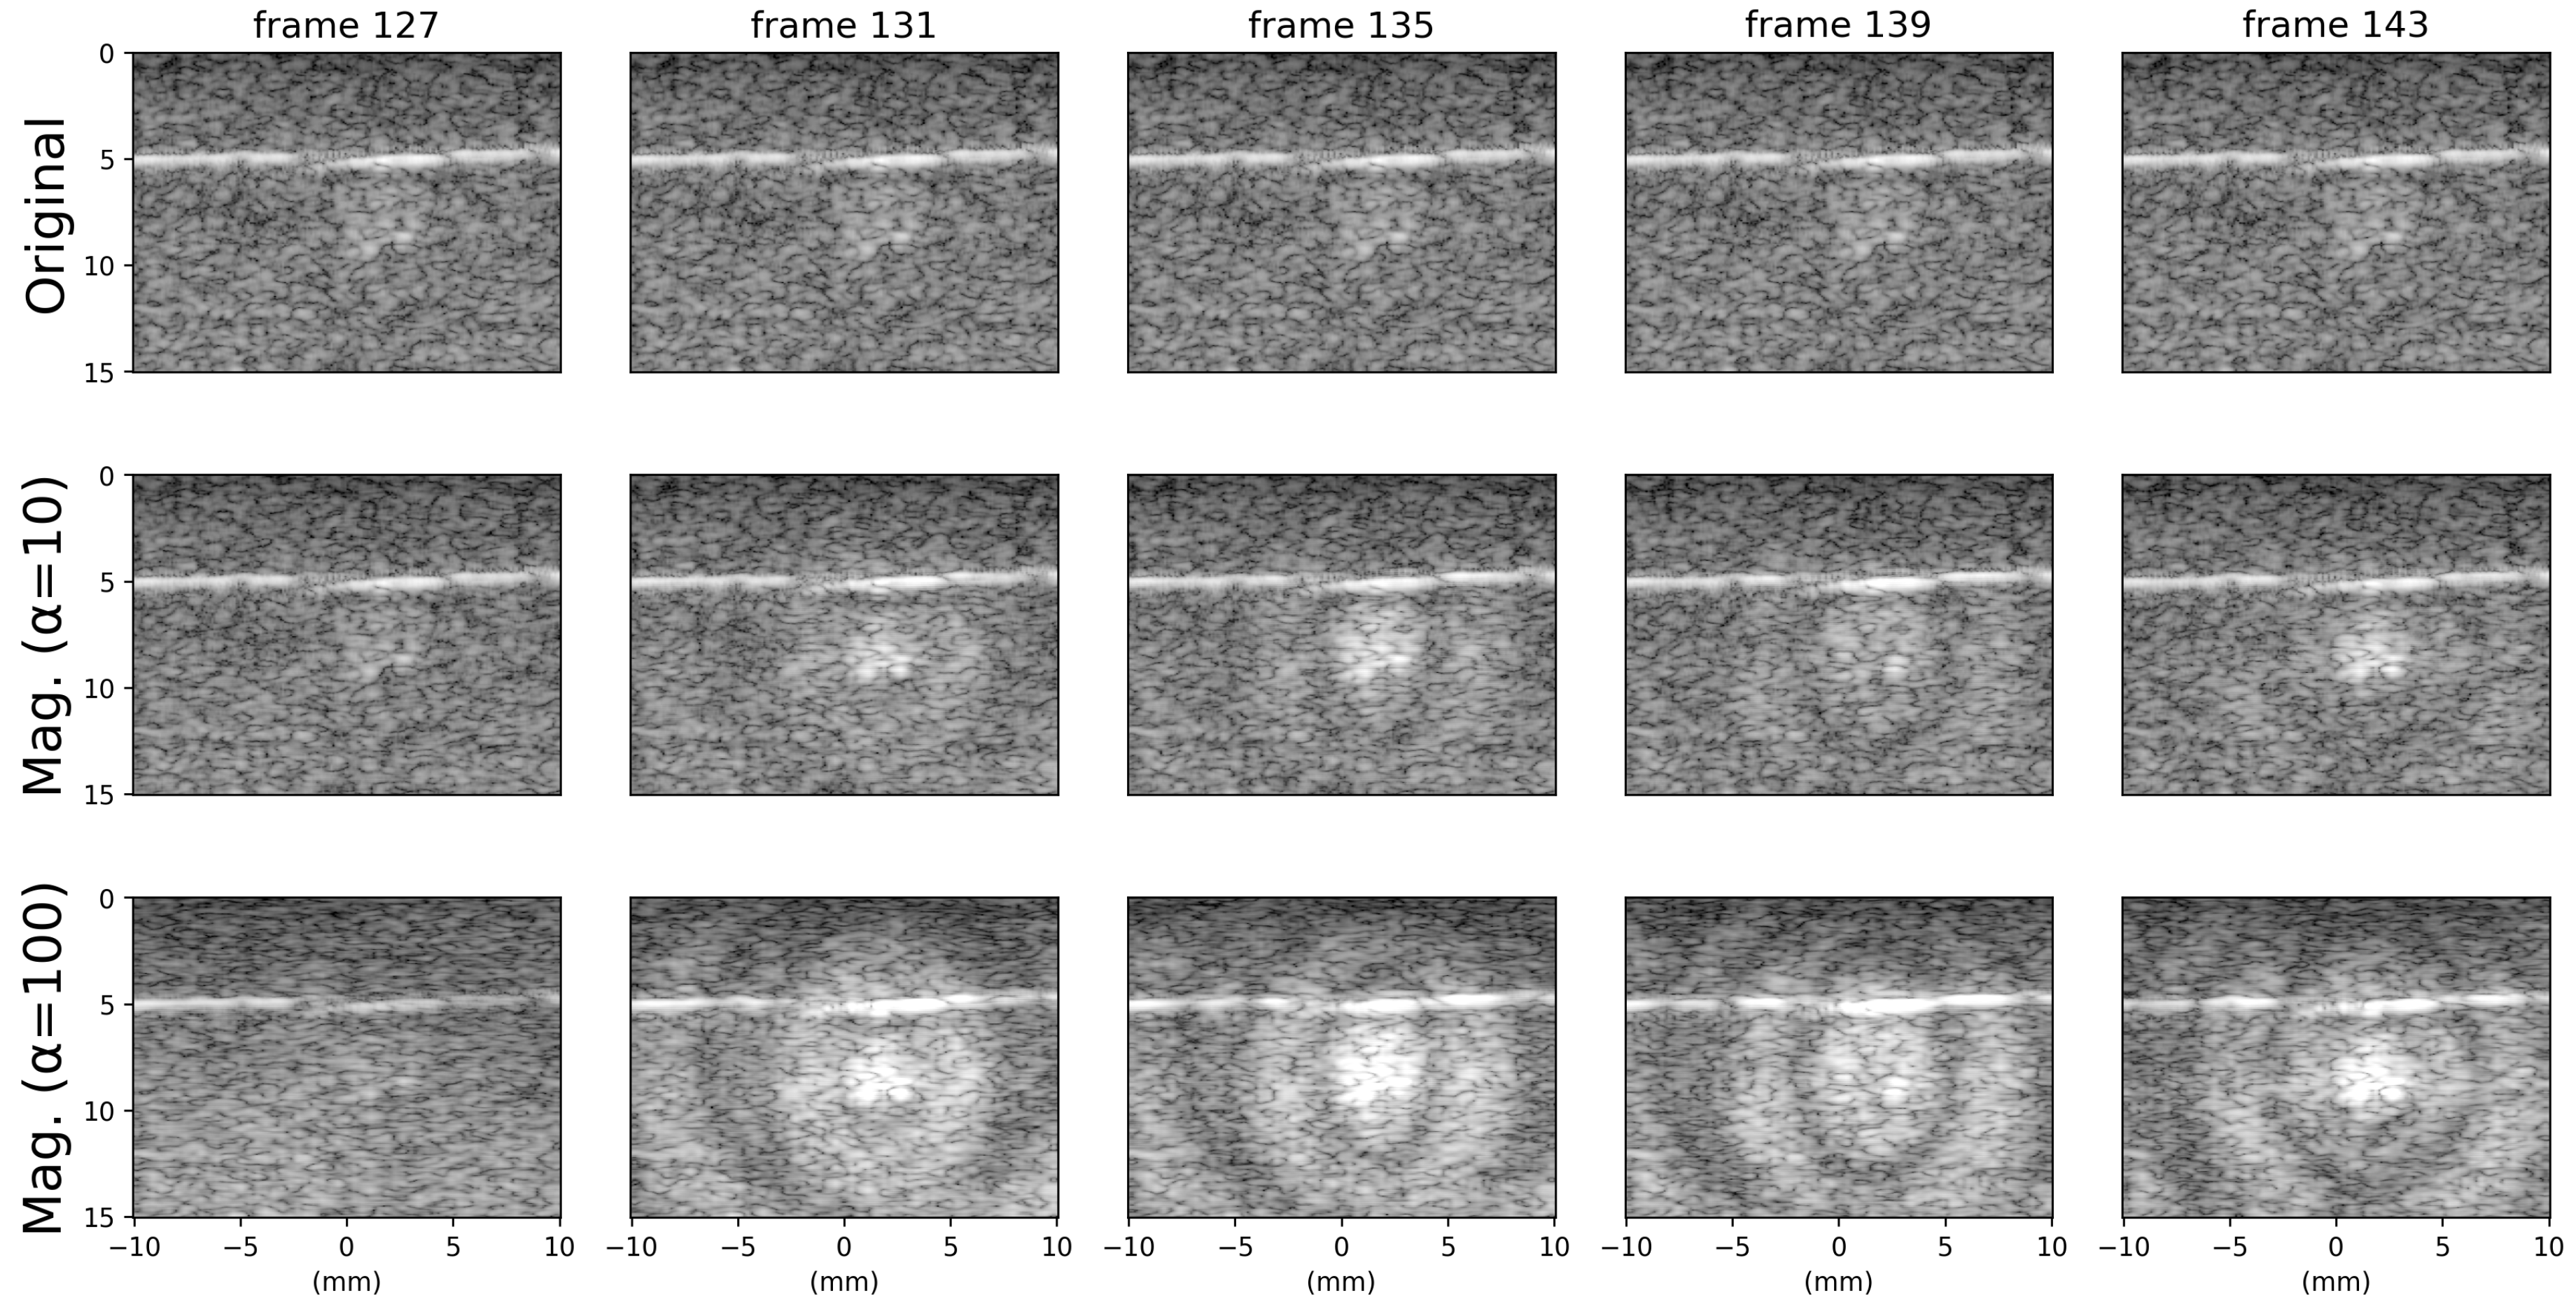
Figure 5.
Zoomed-in visualization of the phantom experiment. In addition to the intensity enhancement effect that shows the shear wave propagation, we can also observed the magnified motion of the speckle patterns. (Mag. denotes motion magnified).
Figure 5.
Zoomed-in visualization of the phantom experiment. In addition to the intensity enhancement effect that shows the shear wave propagation, we can also observed the magnified motion of the speckle patterns. (Mag. denotes motion magnified).
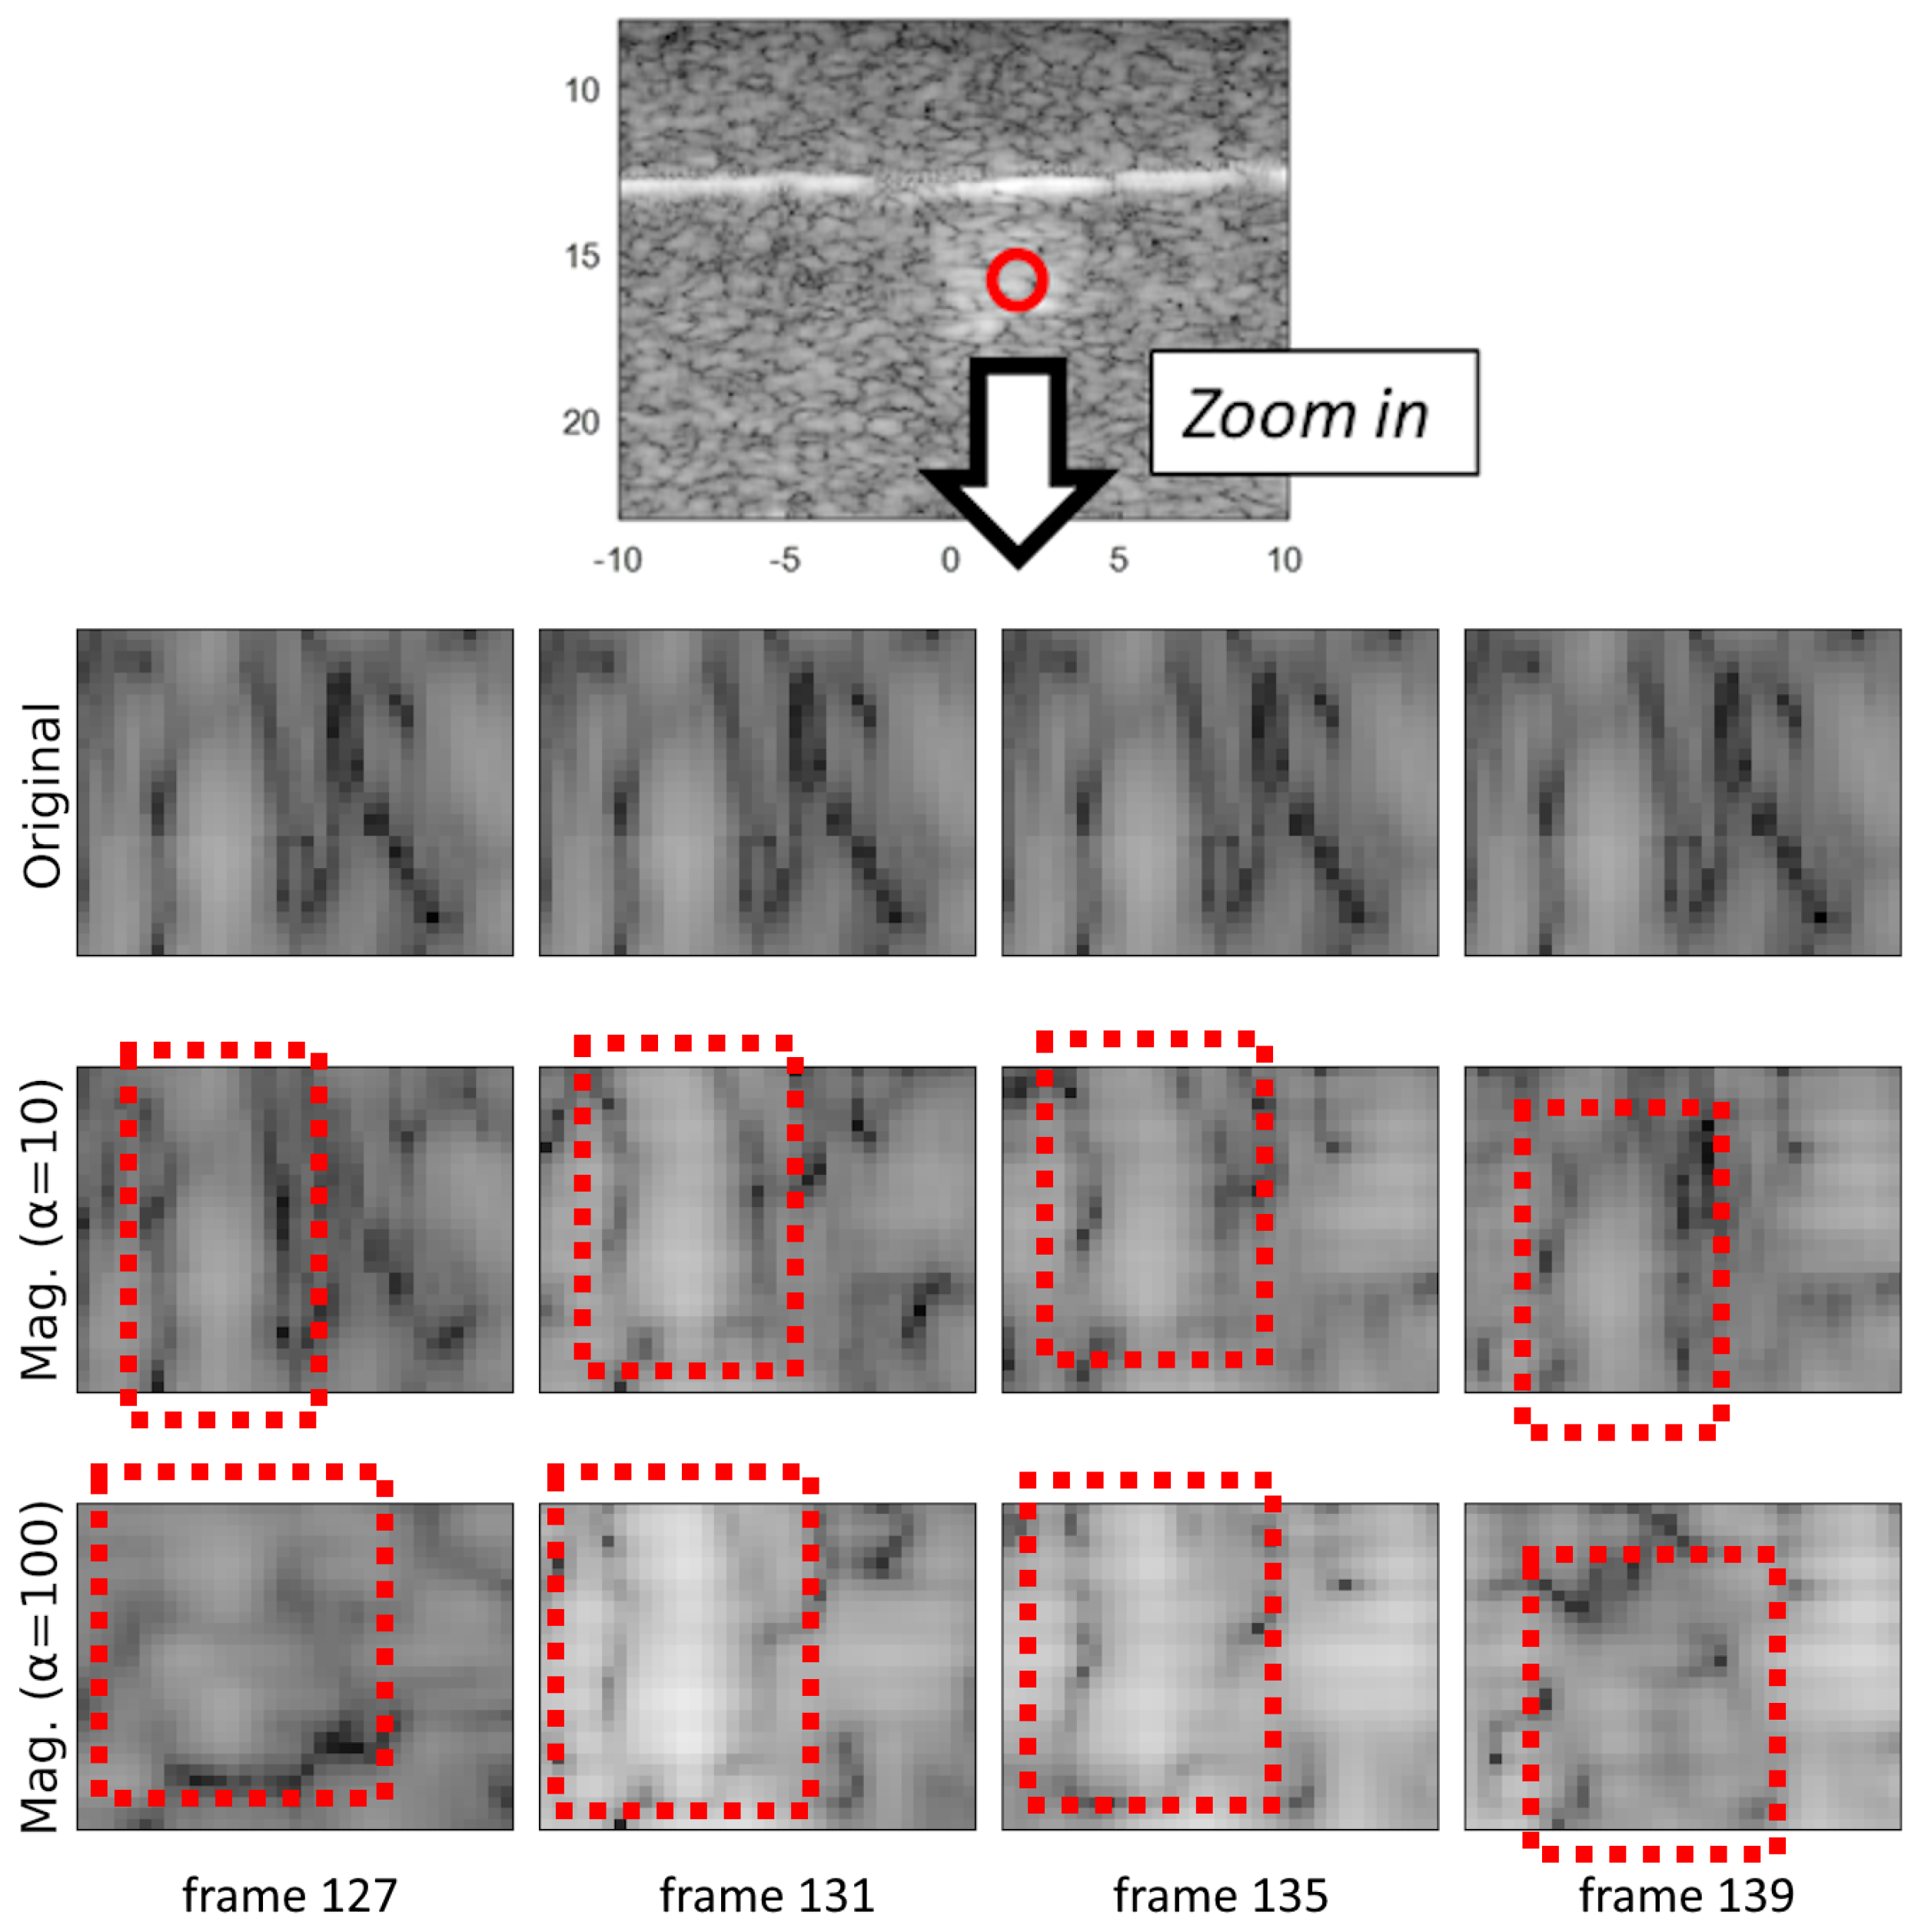
Figure 6.
Motion magnified results of phantom with different concentrations of SPION, under amplification factor of 10. The first row is the phantom with 2 mg/ml of SPION, the second row is the phantom with 3 mg/ml of SPION, and the third row is the phantom with 5 mg/ml of SPION. At very low concentrations (i.e., 2 mg/ml), the magnification is less effective, and the shear wave propagation cannot be observed. (Mag. denotes motion magnified).
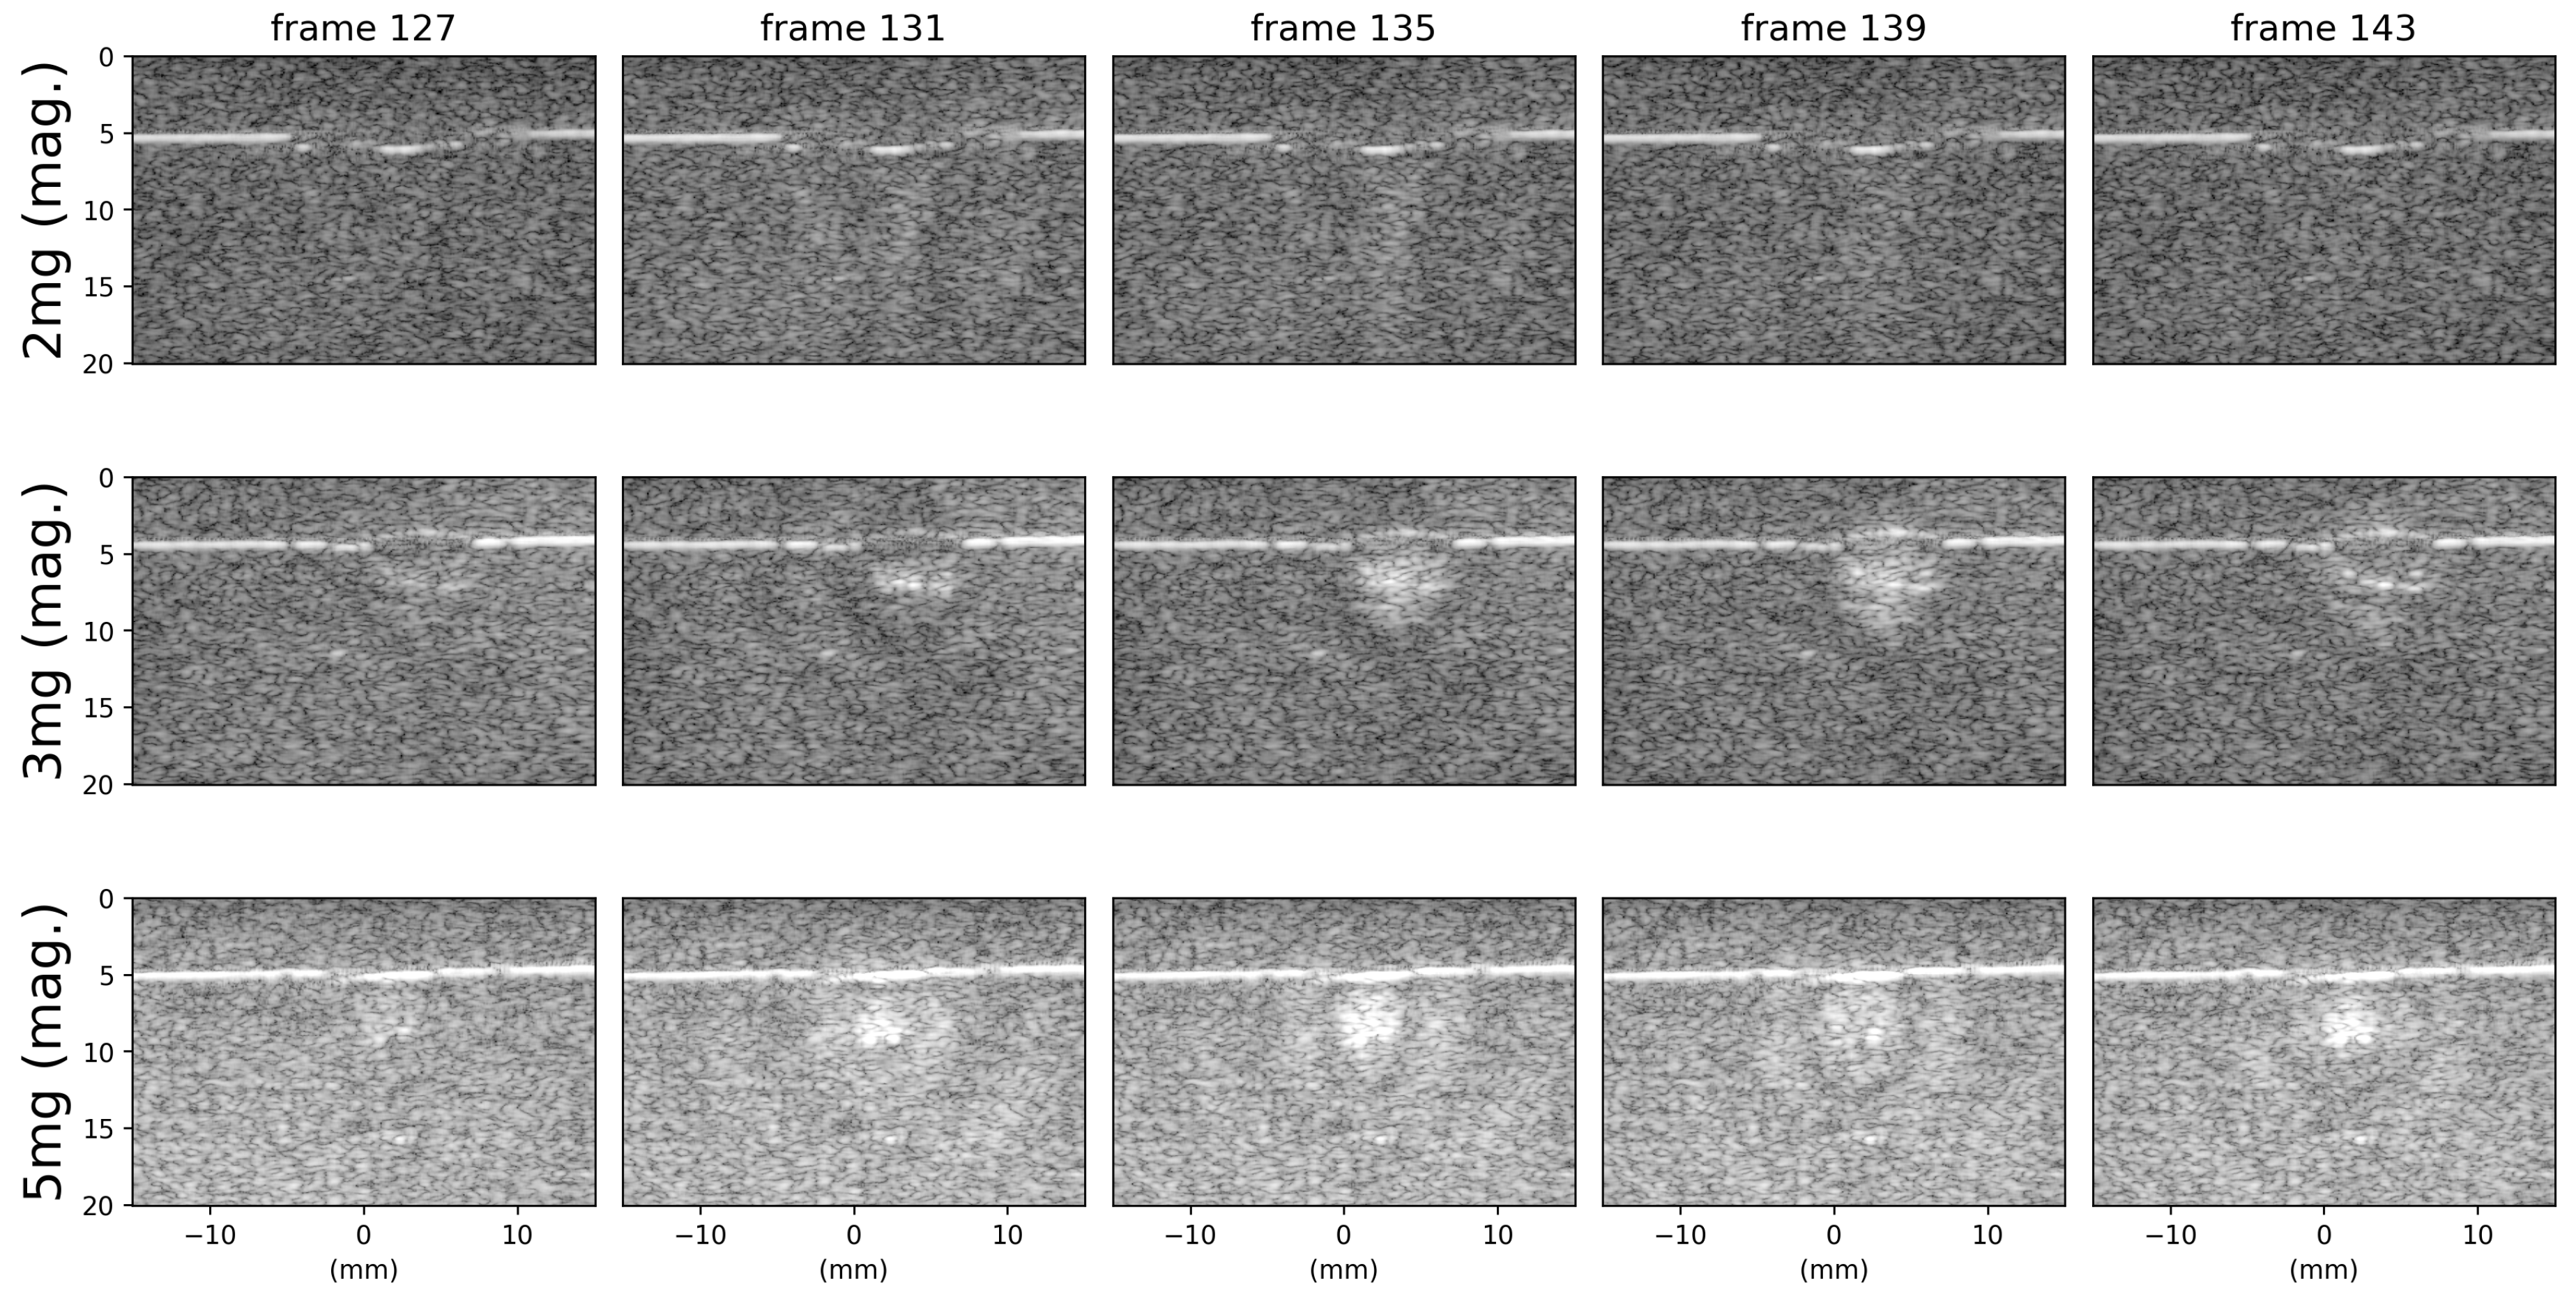
Figure 7.
Motion magnified results of phantom with different concentrations of SPION, but with higher amplification factor =100. Although higher amplification factor leads to strong intensity enhancement of the shear wave propagation, pinpointing the vibration source may be difficult in scenarios with extremely low nanoparticle concentrations (i.e., 2 mg/ml). (Mag. denotes motion magnified).
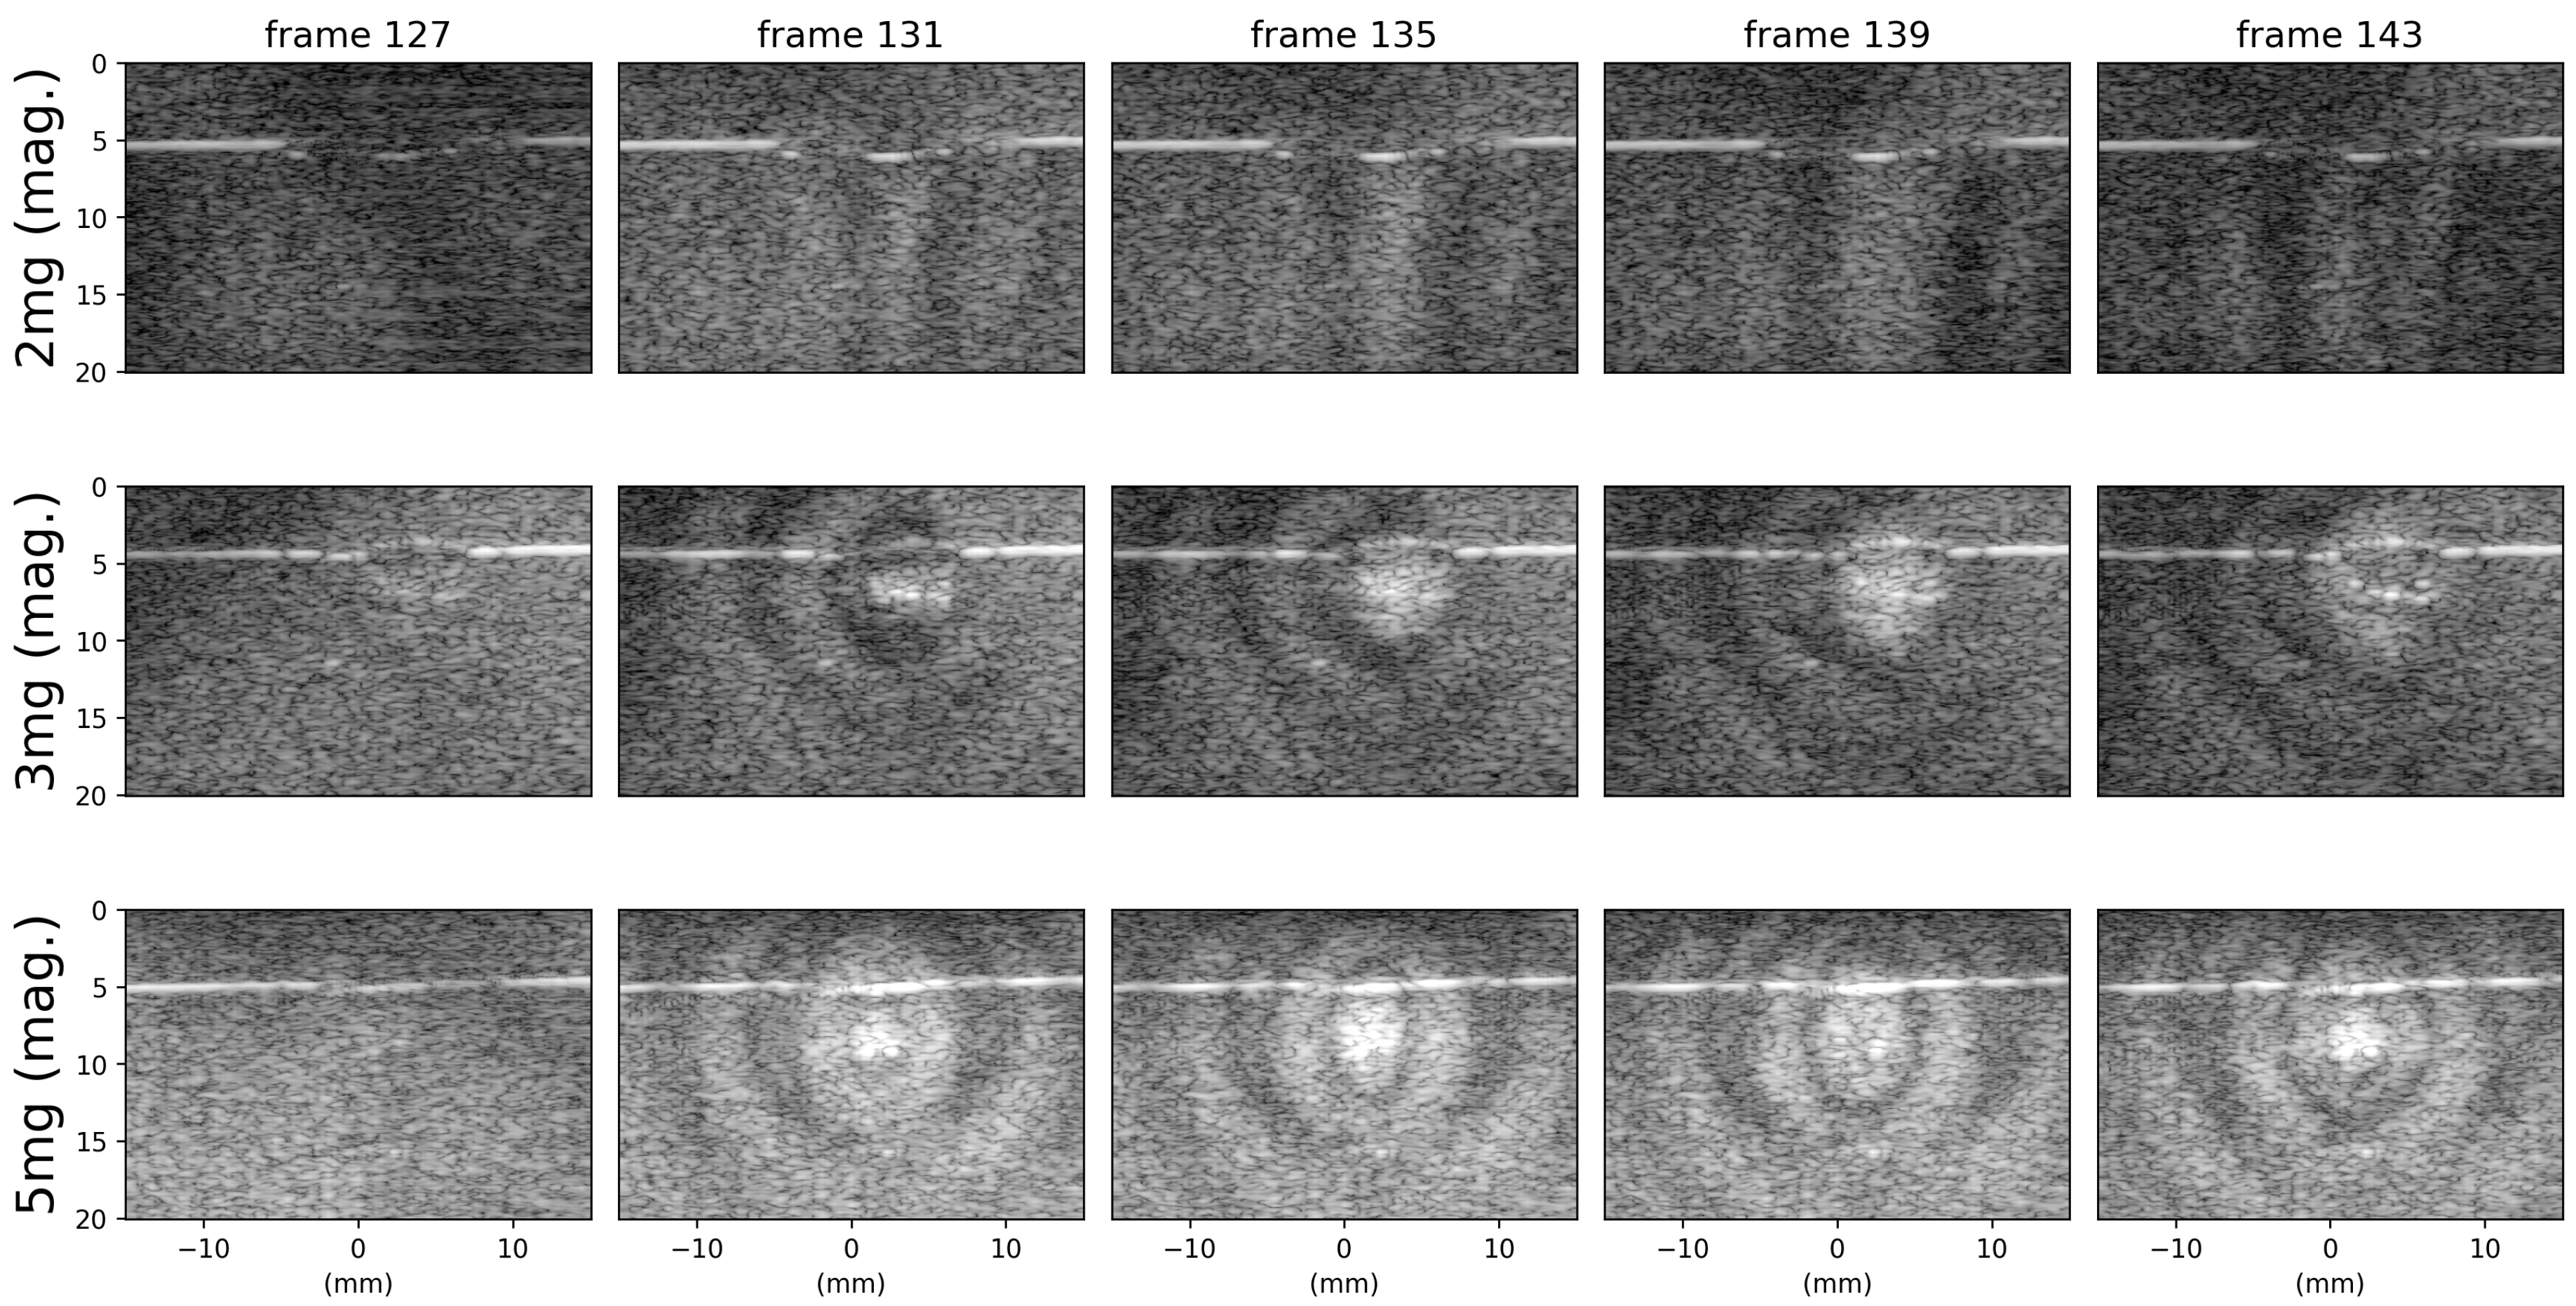
Figure 8.
The displacement map tracked by phased-based correlation method. After motion magnification with amplification factor of 10, the displacement is also amplified, and this can potentially increase the performance for displacement tracking algorithms used in MMUS imaging. (Mag. denotes motion magnified).
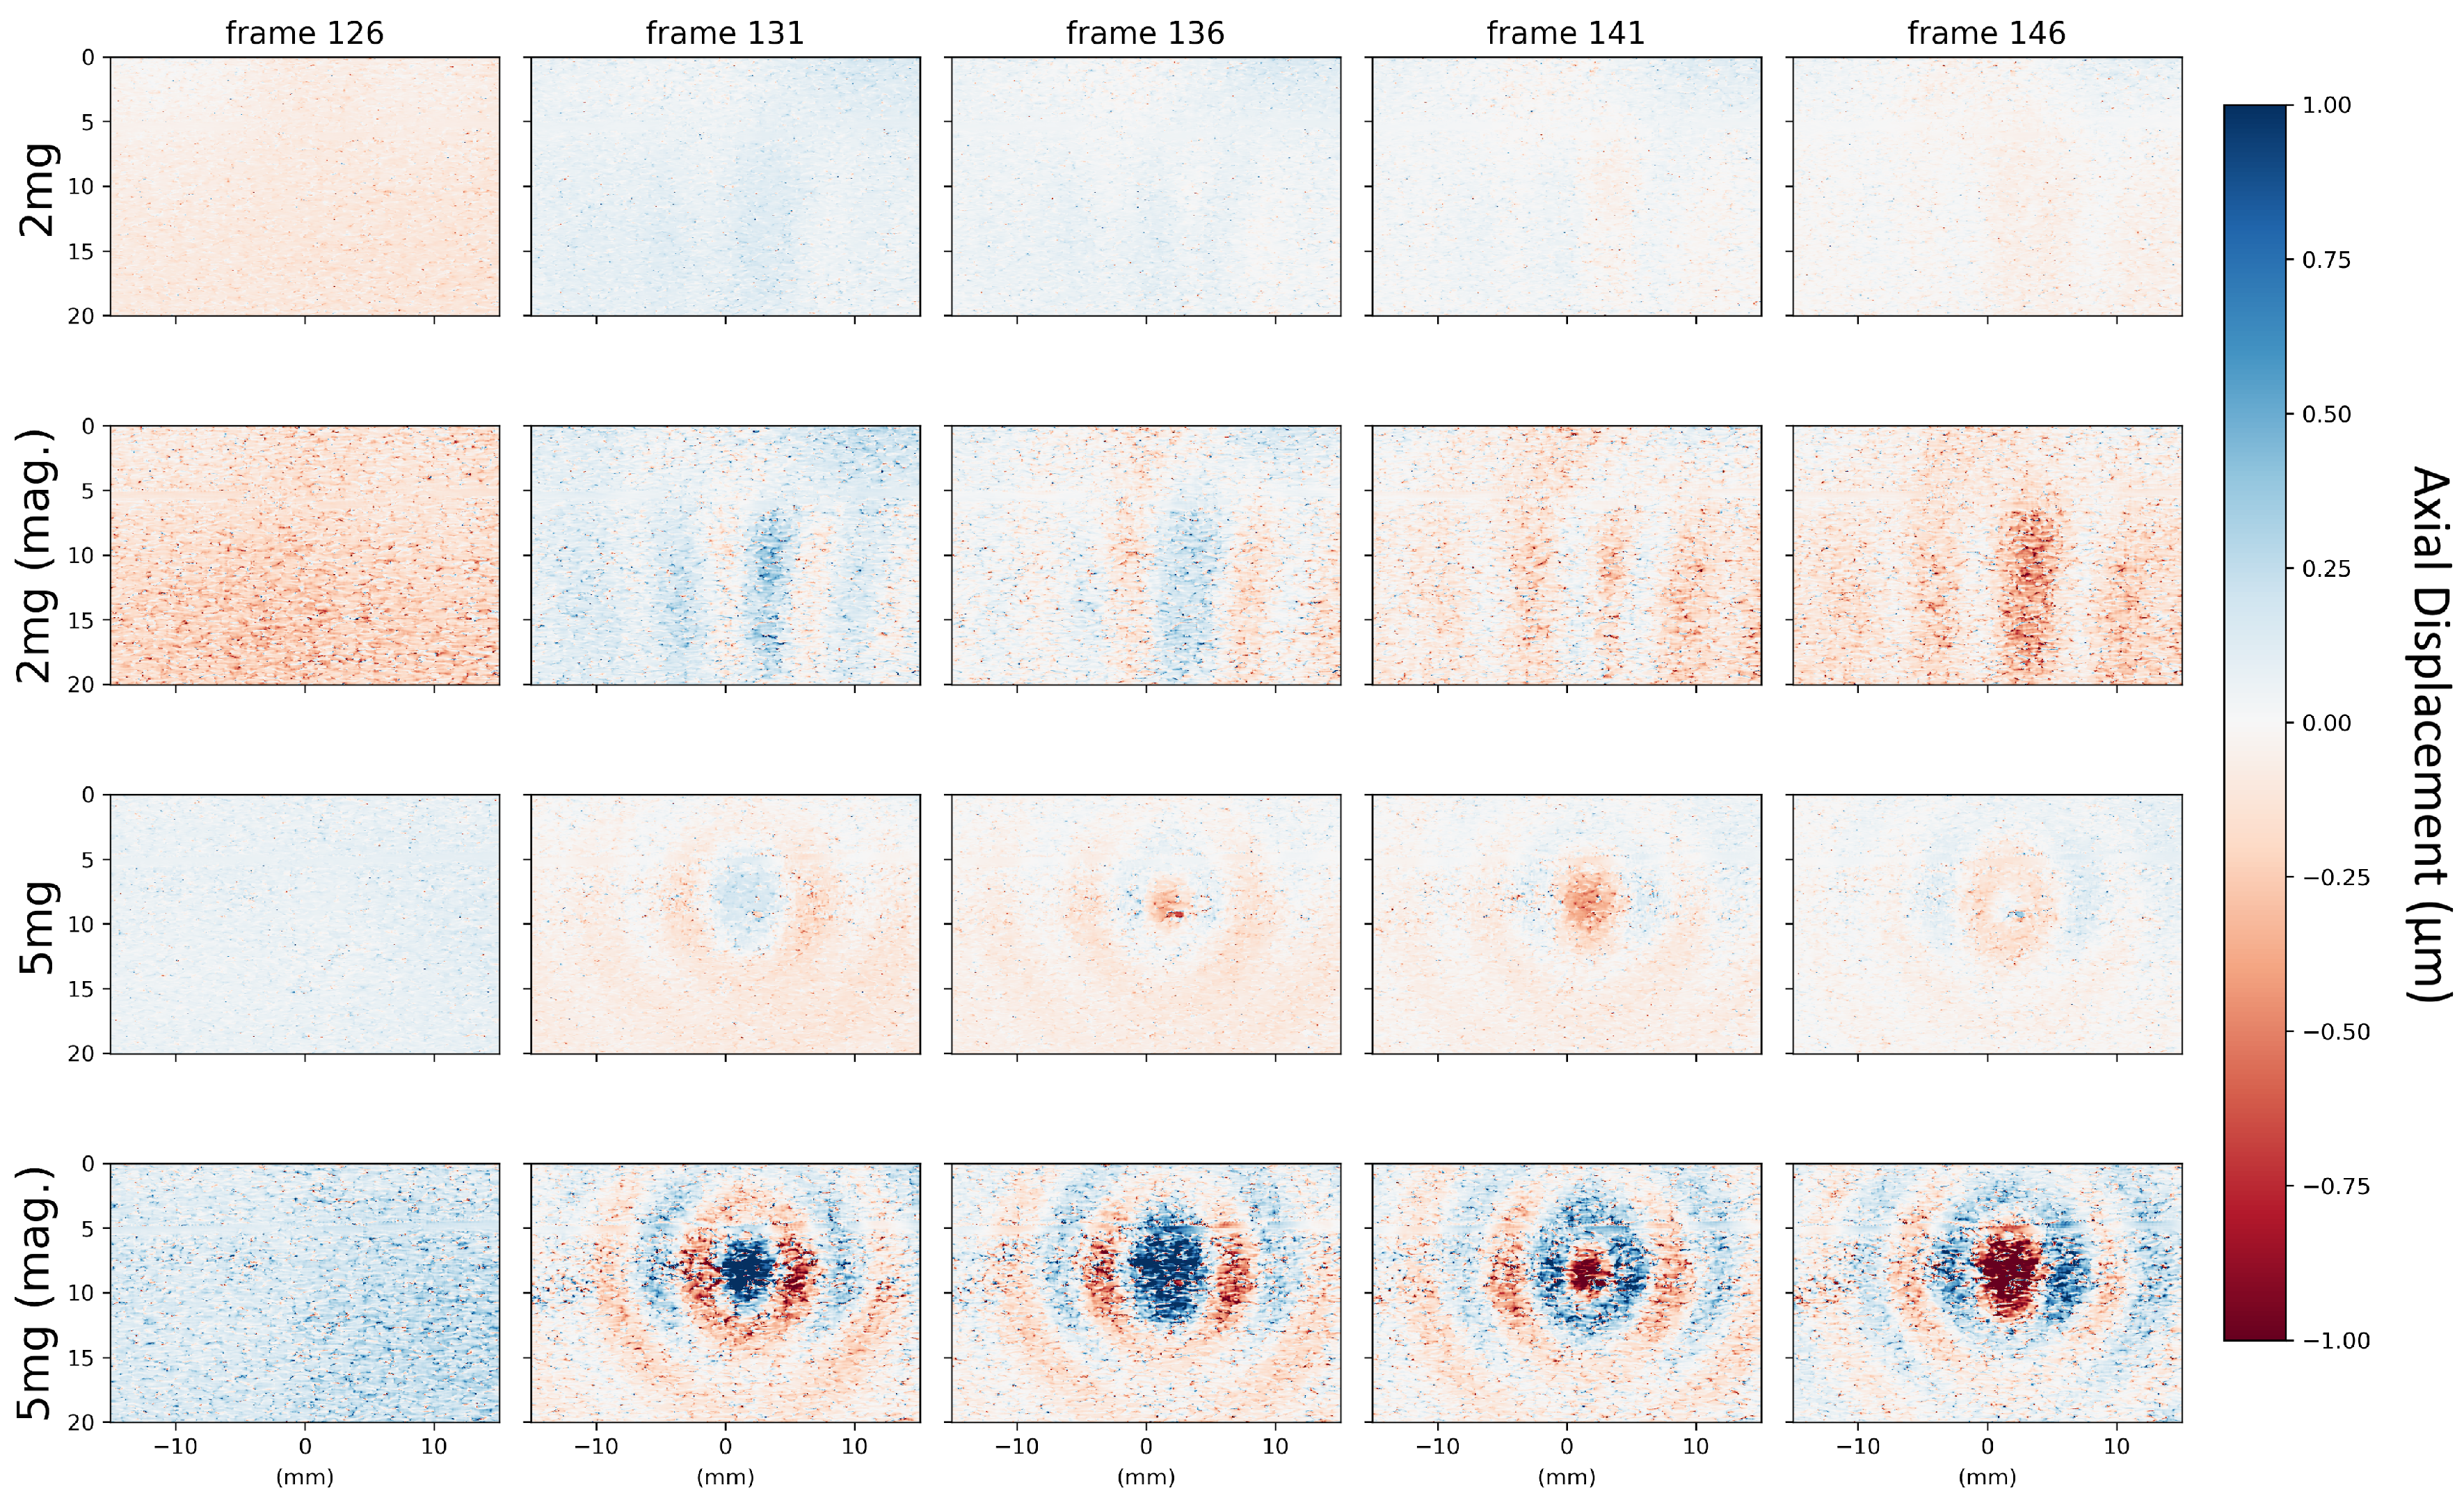
Figure 9.
Motion magnified results of the in vivo data of a Sprague-Dawley rat. The shear wave propagation is less visible due to the inhomogeneity of in vivo tissue. Nevertheless, we can still localize the SPION from observing the motion and the brightness change at the vibration source. The red box highlights the location of the injected SPION. (Mag. denotes motion magnified). Video results can be viewed at https://youtu.be/qBlJkl-XBVs.
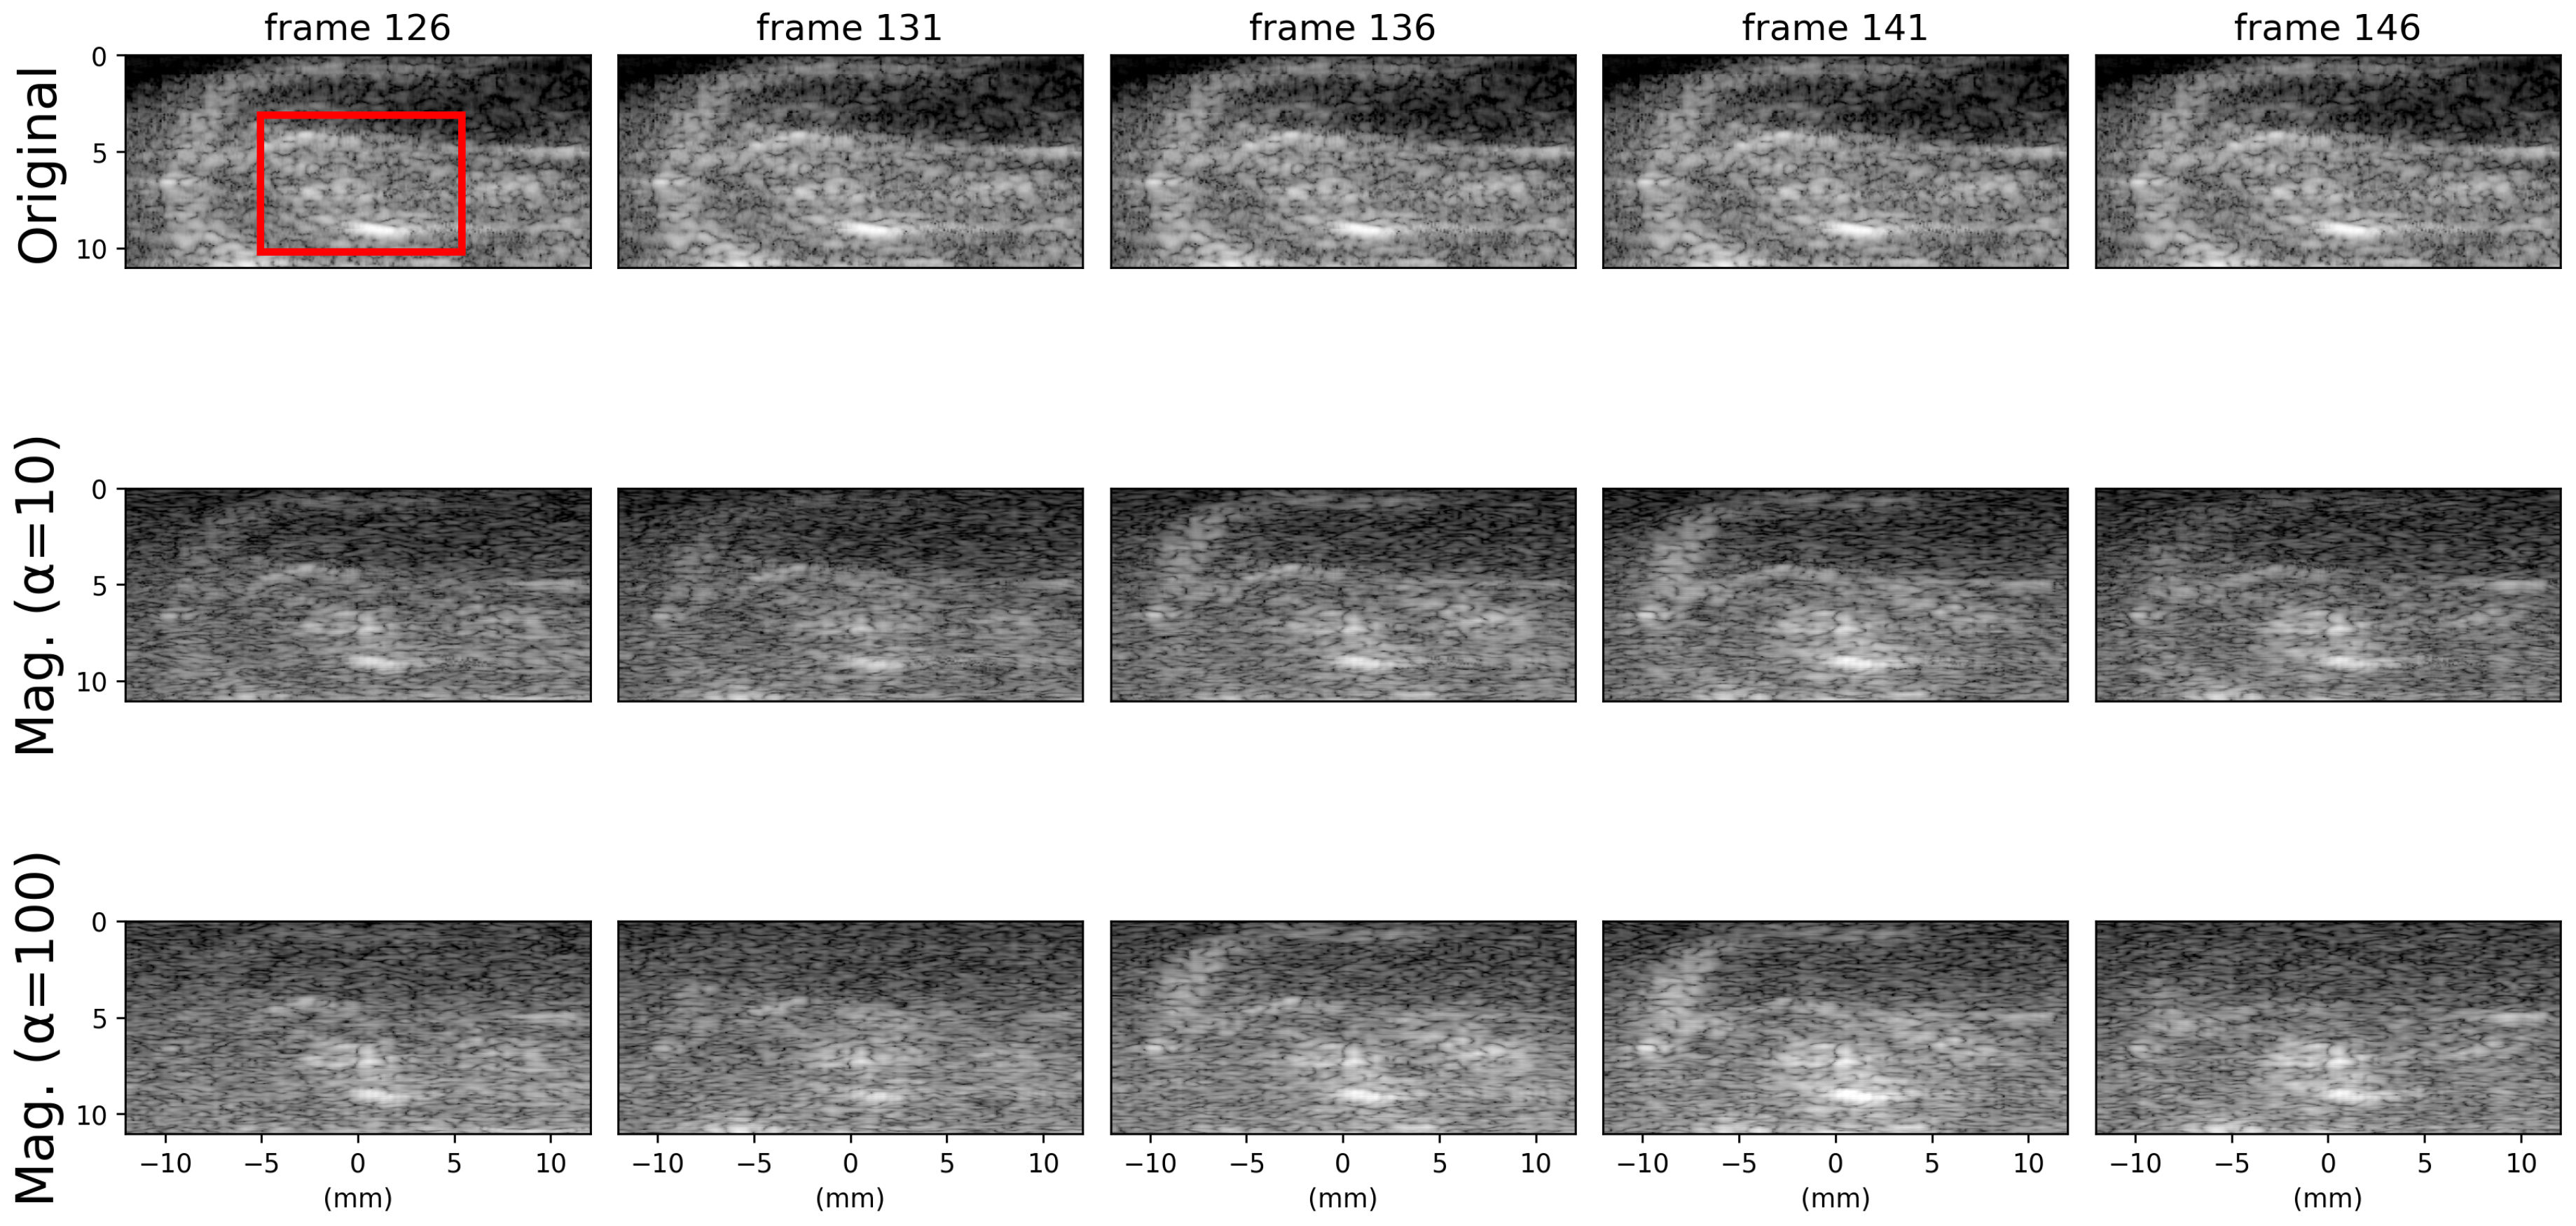
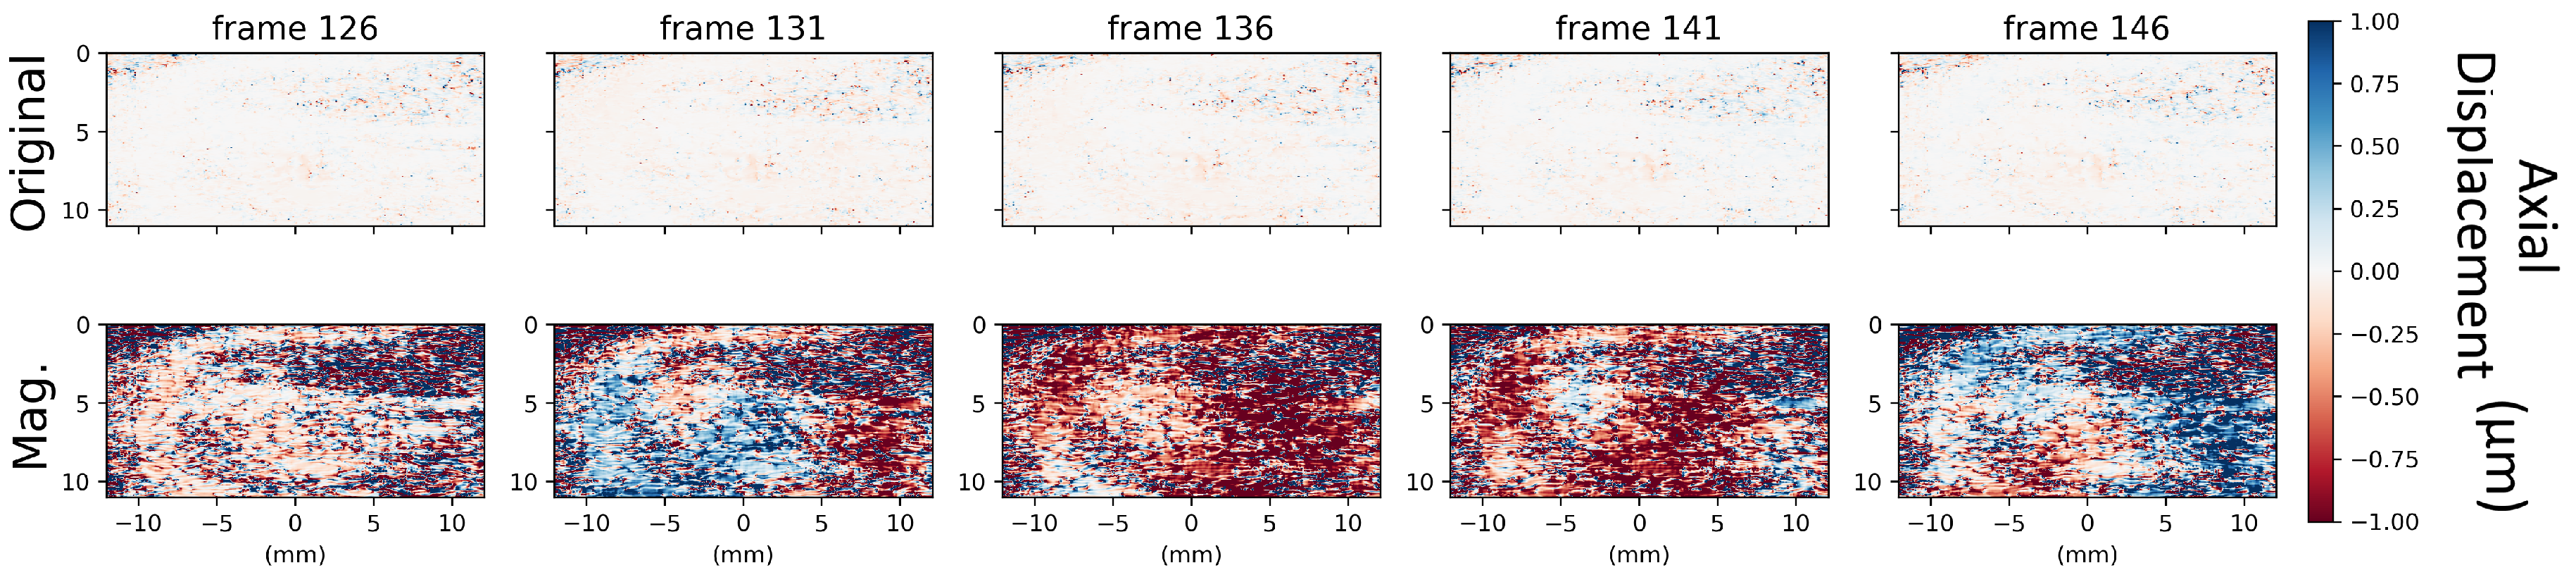
Figure 10.
Displacement map calculated by phase-based correlation tracking method for in vivo experiment. The first row is the displacement map of the original B-mode data, and the second row is the corresponding motion magnified displacement map. In addition to the location of the SPION, the displacement of the background motion noise is also amplified undesirably. (Mag. denotes motion magnified).
Disclaimer/Publisher’s Note: The statements, opinions and data contained in all publications are solely those of the individual author(s) and contributor(s) and not of MDPI and/or the editor(s). MDPI and/or the editor(s) disclaim responsibility for any injury to people or property resulting from any ideas, methods, instructions or products referred to in the content. |
© 2024 by the authors. Licensee MDPI, Basel, Switzerland. This article is an open access article distributed under the terms and conditions of the Creative Commons Attribution (CC BY) license (https://creativecommons.org/licenses/by/4.0/).
Copyright: This open access article is published under a Creative Commons CC BY 4.0 license, which permit the free download, distribution, and reuse, provided that the author and preprint are cited in any reuse.


