Introduction
The closure of a potash mine represents the conclusive phase of its life cycle, which can occur either as a planned or emergency process. Planned mine closure is executed following the exhaustive extraction of balance reserves of minerals, the inability to recover off-balance reserves, or when the imminent threat of mine workings flooding exists, prevention of which is either technically unfeasible or economically impractical. During the planned closure of salt or potash mines, two methods are commonly employed: dry closure method and wet controlled closure method [
1].
In the dry method, plugging the mine shafts is exclusively performed to thwart water inflows into the worked-out area of the mine. However, when faced with the risk of an emergency groundwater influx into a salt or potash mine, the wet controlled closure method is deemed more reliable to diminish the degree of pillar dissolution and the potential for failures [
2]. The essence of this method involves pre-filling the worked-out area of the mine, followed by the introduction of saturated brine through specialized pipelines. The brine occupies the entire remaining volume of the mine voids without inducing complete pillar degradation. The higher density of the brine serves to impede the ingress of groundwater into the worked-out area.
Emergency closure of potash and salt mines arises from abrupt breakthroughs of fresh groundwater into mine workings through the water-protective layer [
2]. The primary cause of such breakthroughs is the insufficient thickness of the water-protective layer considering the adopted mining parameters [
3]. Uncontrolled flooding of a salt or potash mine typically results in the depletion of mineral reserves and various environmental issues [
4,
5,
6].
Many researchers have analyzed real cases of flooding in potash mines, often involving emergency situations. For instance, Gendzwill and Martin [
7] provided a practical example of emergency flooding in a potash mine near Saskatoon, Saskatchewan. The authors detailed various measures taken to slow down the flooding, such as grouting and the installation of bulkheads. Wittrup [
8] conducted a hydrochemical analysis of groundwater involved in the flooding of Saskatchewan potash mines, categorizing three types of floodwaters based on the mine level.
Malovichko et al. [
9] described a serious accident that occurred in the Berezniki-1 mine of the Verkhnekamskoye potassium-magnesium salt deposit (VPMSD). The waterproof stratum's integrity was compromised, leading to uncontrolled flooding. The authors employed a complex of geophysical methods to localize the inflow zone, estimate the expected sinkhole size, and monitor its development over time. Baryakh et al. [
10] applied geomechanical methods to investigate ways to minimize the aftereffects of the large-scale accident connected with the flooding of Berezniki-1 potash mine. The authors constructed a synthesized geomechanical model of the flooded mine, illustrating mining conditions, salt rock dissolution processes, and the elastoplastic behavior of deformation and failure of the undermined rock mass over time. Kulikova and Ovchinnikova [
11] mention a geochemical control method that allows one to determine the average concentrations of 40Ar isotope using laser spectroscopy. Argon isotopes can penetrate into the worked-out void atmosphere only if the integrity of the water-protective layer is damaged.
The most comprehensive overview of planned and emergency closures of potash mines is provided by Baryakh and Evseev [
1]. The authors considered global experiences in mine commissioning, highlighting that most closures result from emergency breakthroughs of fresh water into the worked-out area. They analyzed the causes and consequences of accidents related to the entry of fresh water and brines into mine workings. Prugger and Prugger [
6] described the history of water problems in the Saskatchewan potash industry. This study also summarizes the measures that are now commonly used to avoid these problems. The authors indicated the need to minimize the build-up of stress concentrations in the vicinity of mine rooms by adjusting room width, pillar size, extraction rate, mining sequence, the location of barrier pillars, and by utilizing stress-relief mining systems. Baryakh and Evseev [
1] showed that an integral element of mine liquidation should be long-term comprehensive monitoring of the processes accompanying the flooding of mine workings. Zubov and Smychnik [
12] proposed creation of backfill masses in worked-out areas to eliminate the possibility of dangerous water-conducting cracks between aquifers and productive formations.
Another important aspect related to the environmental impact of construction and closure of potash mines is given in review [
13]. The authors concluded that the most effective measure to reduce the adverse environmental impact of potash mining at the VPMSD is hydraulic backfilling of worked-out area. This method protects underground mines from flooding, minimizes ground subsidence, and reduces the area of potash waste.
Some examples describing the impact of closed potash mines on the environment are also considered in [
14,
15]. Besnard and Pokryszka [
14] noted that flammable and/or toxic gases or deoxygenated air can be transmitted to the surface through existing aerodynamic connections like abandoned shafts or galleries and fissures in rock mass. The authors provided an example of gas monitoring data on the surface near mine sites, where there is a risk of negative effects of gases released from a closed mine on humans. Vysotskaya and Piskun [
15] considered the adverse impact of underground mining on the terrain and landscape of the Soligorsk mining district. The negative impact on the flora and fauna in the district consists of a complex effect from factors such as land acquisition for industrial sites, salt tailings piles, flooding, and waterlogging of lands due to subsidence of the earth's surface above the worked-out areas, salinization of territories adjacent to the enterprise by excess brines, and the impact of industrial dust and gas emissions.
Ponomarenko [
16] considered the economic and social consequences of emergency flooding of potash mines using the example of the VPMSD. Katta et al. [
17] investigated greenhouse gas mitigation pathways for the iron, gold, and potash mining sectors in Canada. Considering the potential to reduce greenhouse gas emissions for these subjects, the authors conducted cost-benefit analyses of implementable greenhouse gas reduction strategies.
A separate important area of research is the determination of the content of free and bound gases in salt rock masses. Zimmer et al. [
18] studied the processes of fixation and migration of gases in evaporites of the Seam Hessen potash layer from the Werra-Fulda basin. Andreyko et al. [
19] studied the gas content in the productive salt layers of the potash mines of the Starobinsk potassium-magnesium salt deposit. The authors analyzed the content of free and bound gas in various rocks, as well as the chemical composition of the free gas. Papulov et al.'s [
20] study aimed to examine the relationship between the nature of the distribution of heavy hydrocarbon gases and geological disturbances and the subsequent prediction of the gas-dynamic situation during the development of potash reservoirs.
Baryakh et al. [
21] studied factors that characterize the possibility of gas-dynamic roof fall in the stoping rooms. The authors established that natural gases in the working-out layers, host rocks, and non-working silvinite and carnallite layers located in between the layers, roof, and soil are distributed extremely unevenly. In practice, there are areas of potash layers that contain almost no gas, but there may also be local accumulations of free gases up to several thousand cubic meters in volume associated with areas of geological anomalies. The component content of gases from potash salt deposits is a complex mixture of combustible and inert gases, including nitrogen, methane, hydrogen, and methane-series hydrocarbons [
14,
22].
In general, the geographical distribution of the presented research is such that the main results were obtained by scientists from Canada, Russia and Belarus - countries where the largest modern deposits of potassium salts are being developed today. At the same time, contemporary literature extensively covers the emergency flooding of potash mines, yet there is a notable absence of studies on the planned and controlled flooding of these mines, particularly on the flooding of specific sections within potash mine fields.
This analytical gap becomes evident in the practical context of an operational mine within the VPMSD. This study delves into this gap, resulting in the development of design documentation for the controlled flooding of a potash mine field. The distinctive feature of the scenario under consideration is the existence of an unflooded section of the mine field, where regular mining operations continue.
The closed section of the mine is fortified with impermeable bulkheads, and saturated brine is introduced into the worked-out area through a dedicated pipeline. Ensuring gas safety during mining operations is crucial in this scenario. If aerodynamic connections between the mine upcast shaft and the flooded area are obstructed, gases released from the dissolved mass of salt rocks gradually accumulate. This process leads to the formation of closed cavities in the unflooded mined-out space (dome parts), where both brines and released gases persistently flow [
11,
22].
Without a mechanism to remove the gas-air mixture from these dome parts, the flow of brines continues until reaching an equilibrium state with the gas-air mixture. At this point, the pressure of the gas-air mixture equals the hydrostatic pressure of the rising brines. Under specific conditions, the total content of flammable gases, including methane and hydrogen, in these dome parts may exceed the maximum permissible limit (0.5% by volume).
Therefore, it is necessary to develop an effective system for diluting gas-air mixture in a flooded worked-out area. This measure is crucial to prevent the transition of the mixture into an explosive methane-air composition when enriched with flammable gases released during the dissolution of the adjacent salt rock mass. To address this need, we have developed and parameterized a mathematical model to elucidate the processes involved in filling the closed section of the mine with brine and the subsequent release of the gas-air mixture through a degassing pipeline. Subsequently, we explore two scenarios for the wet closure of the worked-out section of a potash mine: 1) controlled flooding with saturated brines and 2) emergency flooding due to a hypothetical breakthrough of the supra-salt strata and the ingress of groundwater into the worked-out area. In both scenarios, free and bound gases are released into the atmosphere of the closed section of the mine field, stemming from the partial dissolution of pillars and containing hydrogen and heavy hydrocarbon gases. These substances play a critical role in altering the lower concentration limit of the explosion of the methane-air mixture [
20,
22].
Methods
The object of study is the worked-out area in the southeastern section of the mine of the VPMSD. The mine field has total dimensions of 7700 m in the longitudinal direction and 7950 m in the latitudinal direction. The surface area of the mine field within the boundaries of the existing mining allotment is 66.15 km2. Two industrial seams, AB and KrII, are being mined. The average depth of the AB seam in the mining area ranges from 250 m in the northwestern section of the mine field to 370 m in the southeastern section. Similarly, the depth of the KrII seam ranges from 260 m to 415 m.
Industrial seams are situated within the regional aquitard and are separated from the overlying aquifer and brine levels by a waterproof rock layer several tens of meters thick (waterproof layer), which naturally ensures their hydrogeological isolation.
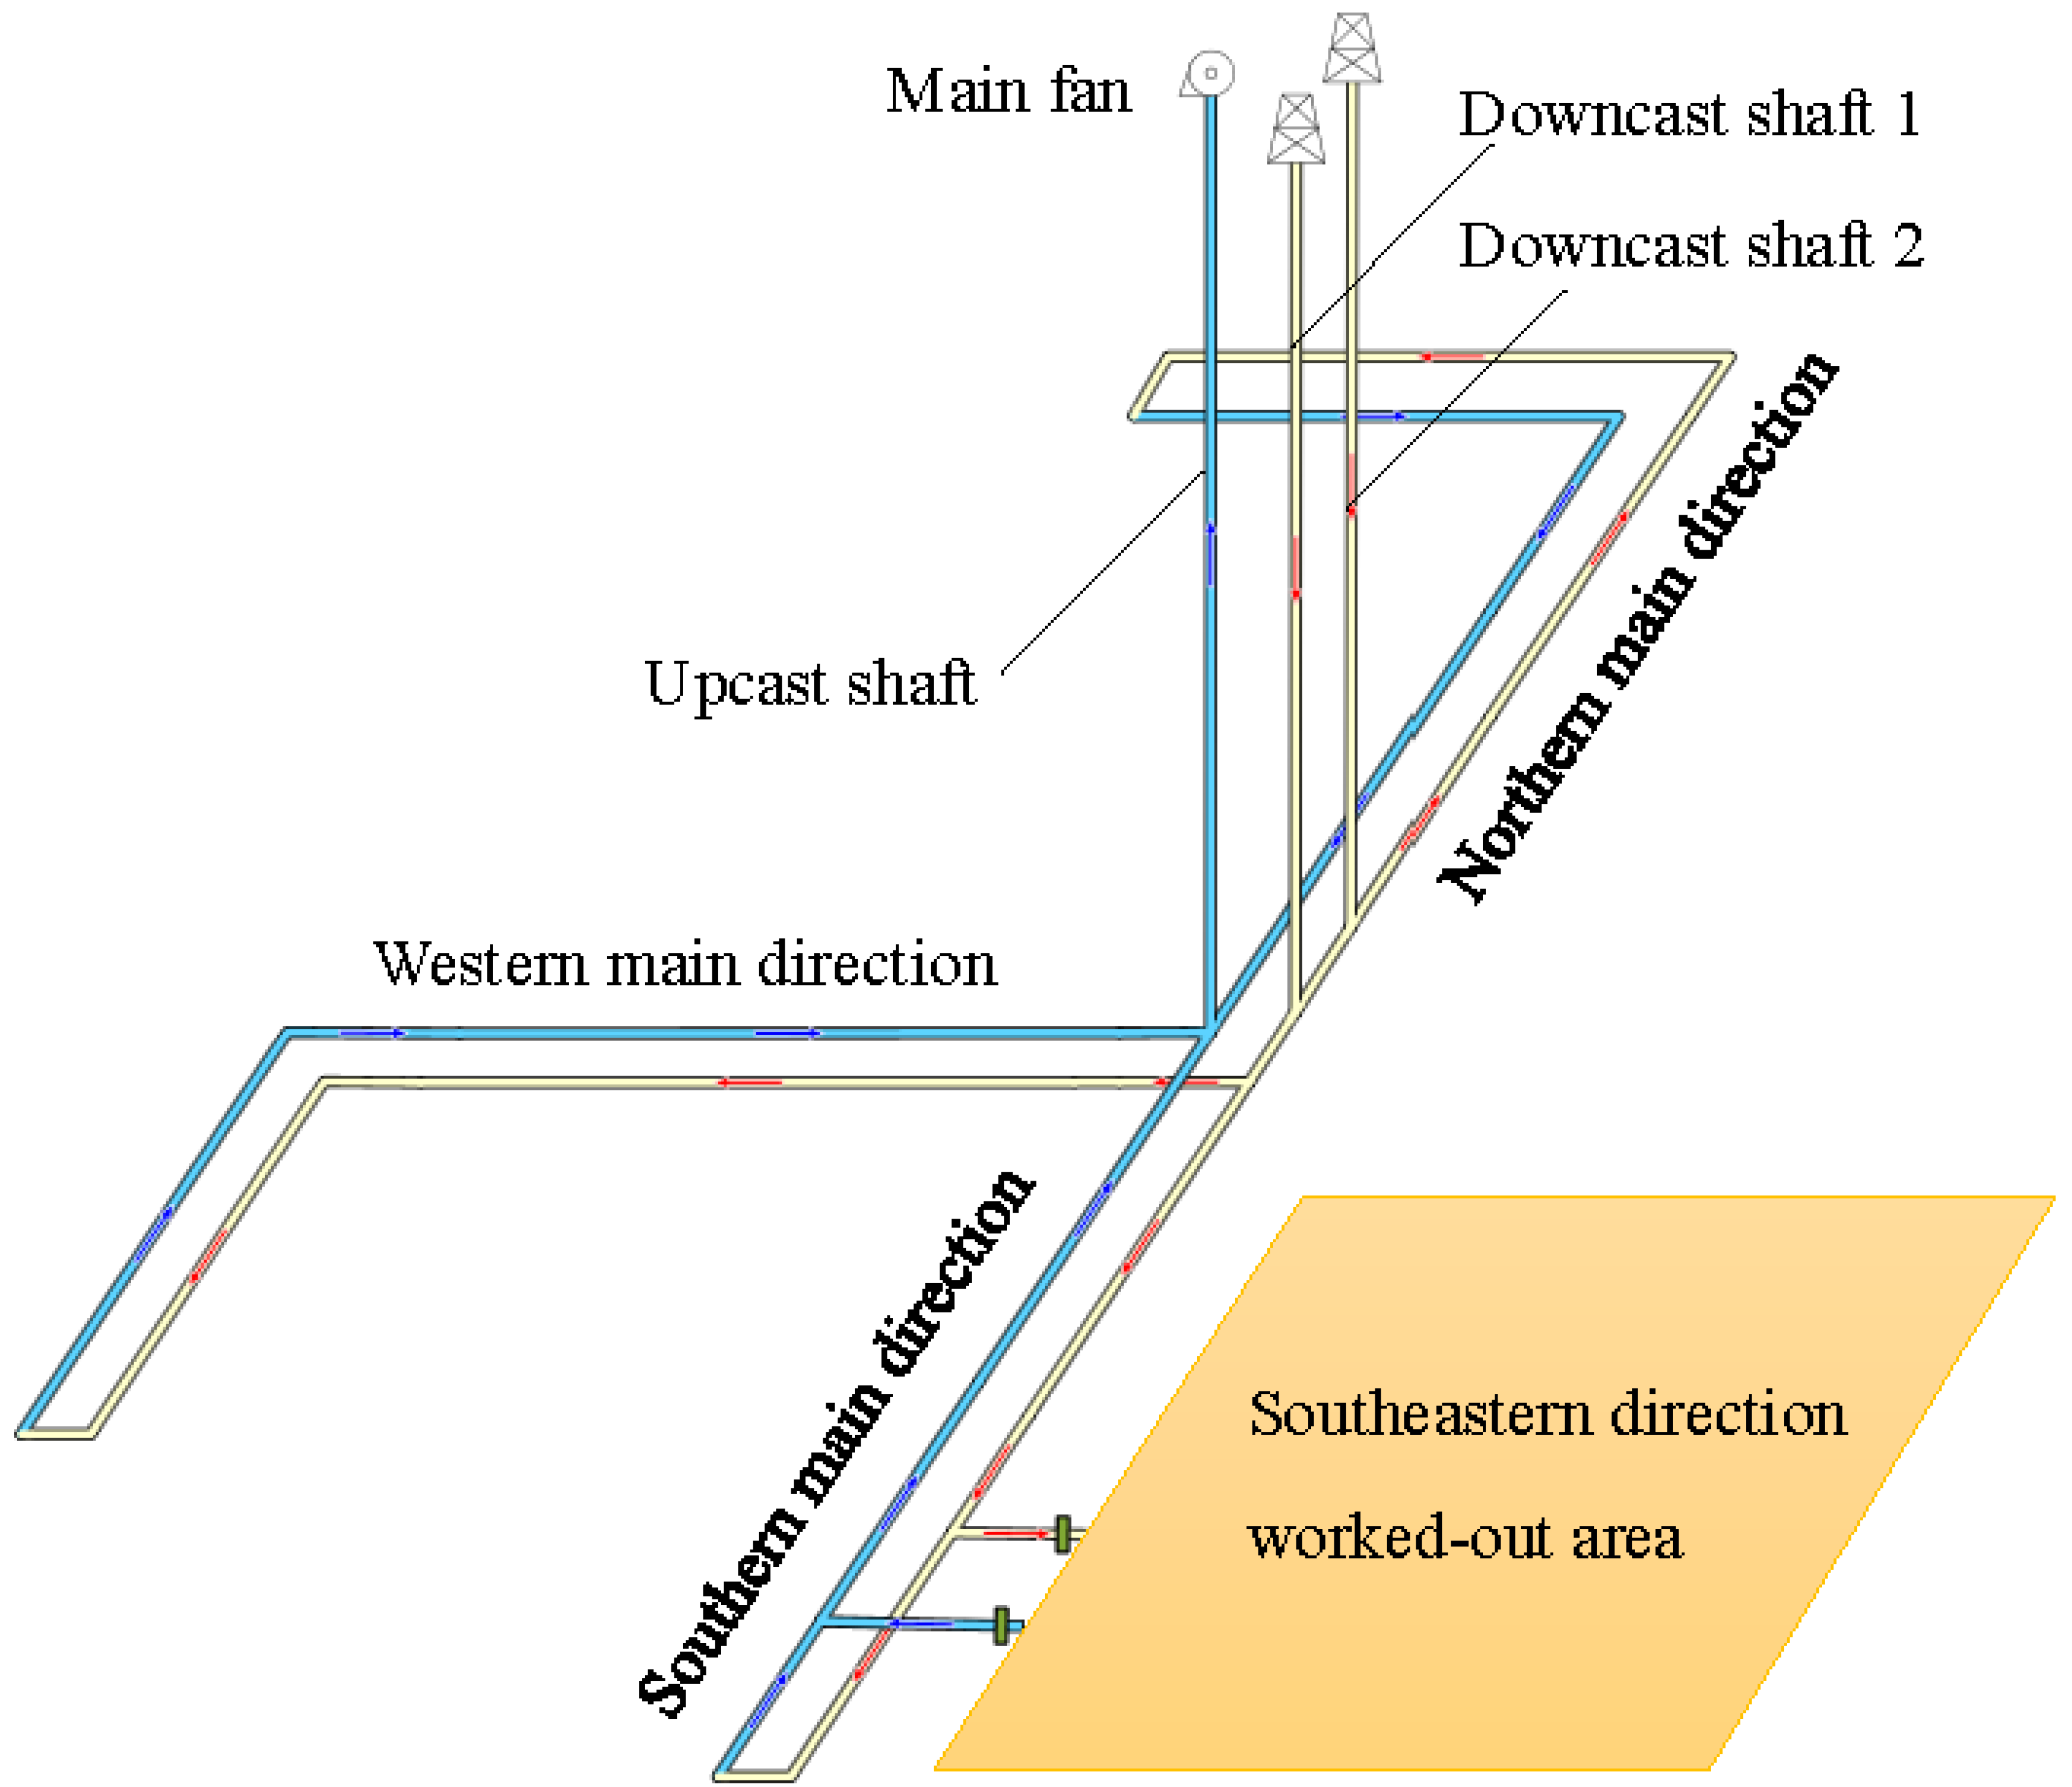
Currently, the worked-out area in the southeastern section of the mine is conventionally divided into several mining panels, forming a complex interconnected network of mine airways (see
Figure 1). Ventilation within the panels, as well as throughout the entire mine, follows a U-tube layout. Fresh air enters the mine through two shafts and is then divided into three streams along the northern, western and southern main directions. The air flow in the southern main direction, moving through the transport and conveyor airways, enters the panel airways in the southeastern section of the mine, providing ventilation to the working areas. Polluted air from the panel airways then enters the main return airways of the southern main direction and eventually reaches the upcast shaft. Air movement in the mine is ensured by the main fan, which is installed in a horizontal drift at the mouth of the upcast shaft.
The distance between the shaft inset and the panel airways in the southeastern section is considerable, approximately 2 km. The aerodynamic connection between the southeastern section and the rest of the mine is established through a limited number of airways, ranging from 2 to 5 at varying distances from the shaft inset. This aspect of the mine ventilation network presents the opportunity to close off the designated section of the mine by blocking the aerodynamic connections with solid, impenetrable bulkheads. This solution was outlined in the technical project for decommissioning mine airways at a hazardous production facility (considered mine section). According to the design, saturated brine is supplied to the closed section of the mine via a dedicated brine pipeline laid through the airway system and bulkheads.
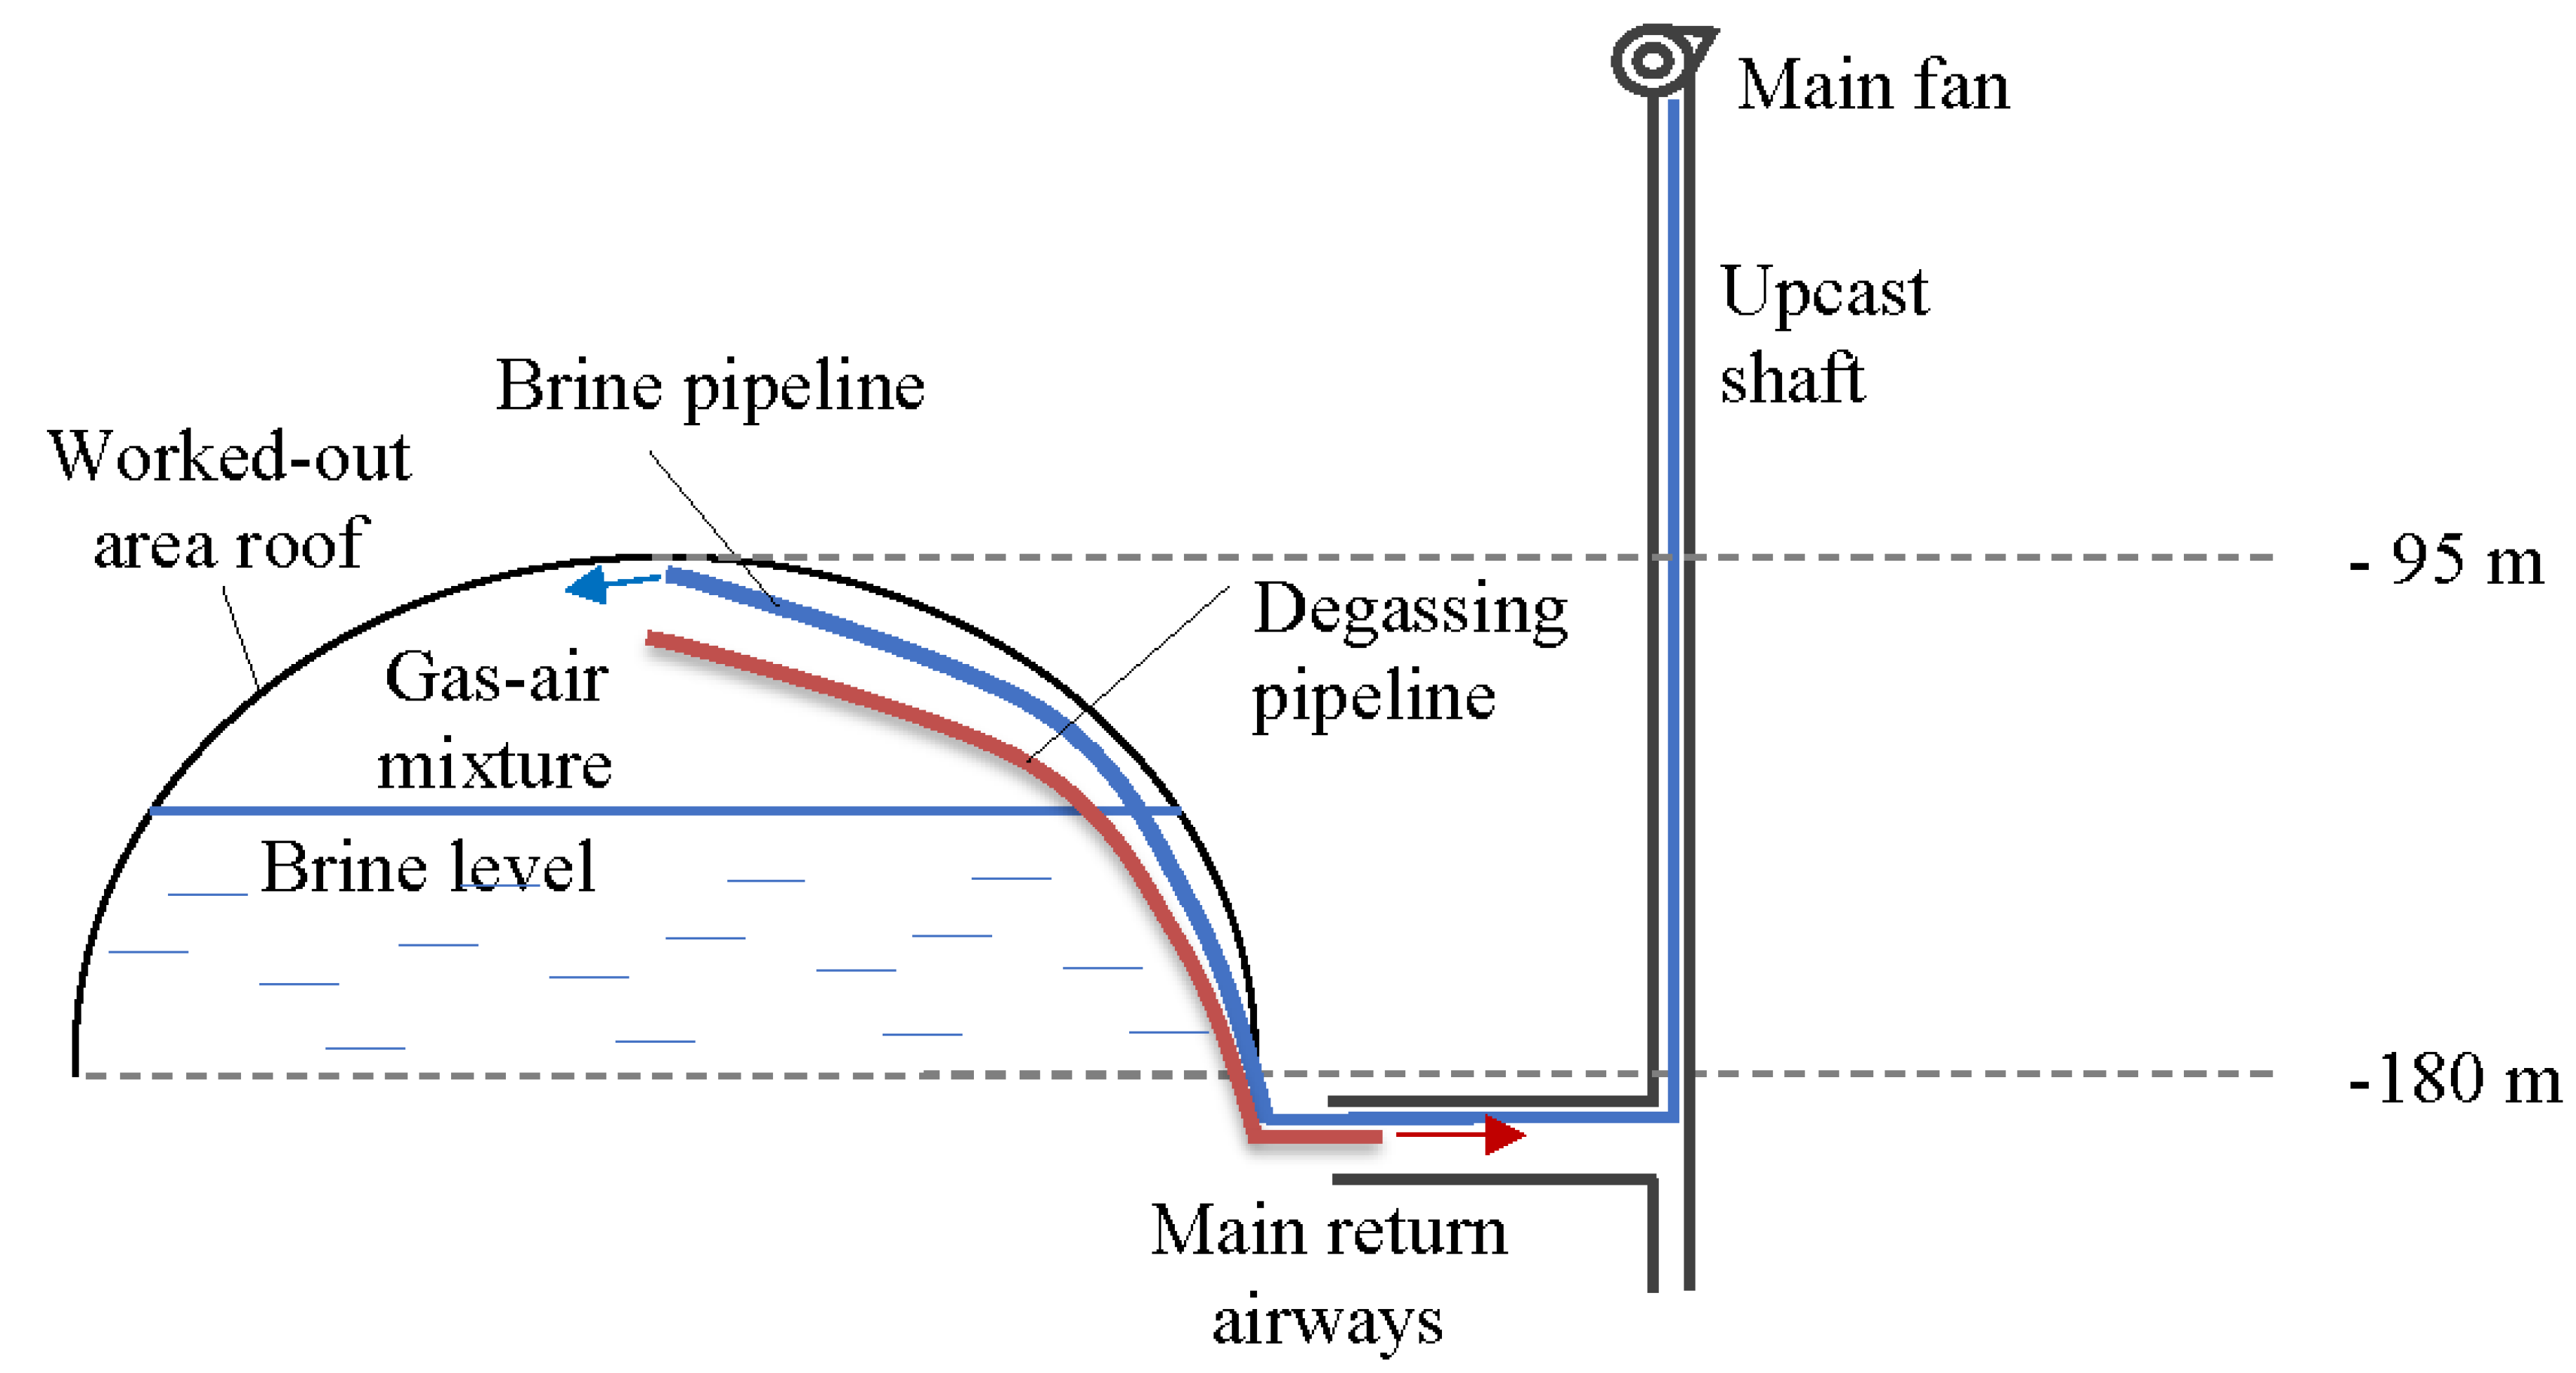
To evacuate the gas-air mixture from the depleted space of the decommissioned section of the mine, a polyethylene pipeline is utilized. This pipeline facilitates the release of the gas-air mixture under pressure generated by the incoming brine, directing it into the existing main return airways, ventilated by the main fan. Subsequently, it travels through the upcast shaft to the surface.
Figure 2 illustrates a schematic diagram of the connection between the closed section of the mine and the operational section. A dome-shaped area, partially filled with brine, represents the entire worked-out area of the southeastern section of the mine. Considering the topologically complex structure of this area, a more detailed spatial resolution seems unnecessary.
To estimate the duration of the process of removing the gas-air mixture from the worked-out area, as well as to calculate the change in the content of explosive gases in the outgoing stream, a new mathematical model of the degassing process was developed. The basis of this model is the degassing model proposed in [
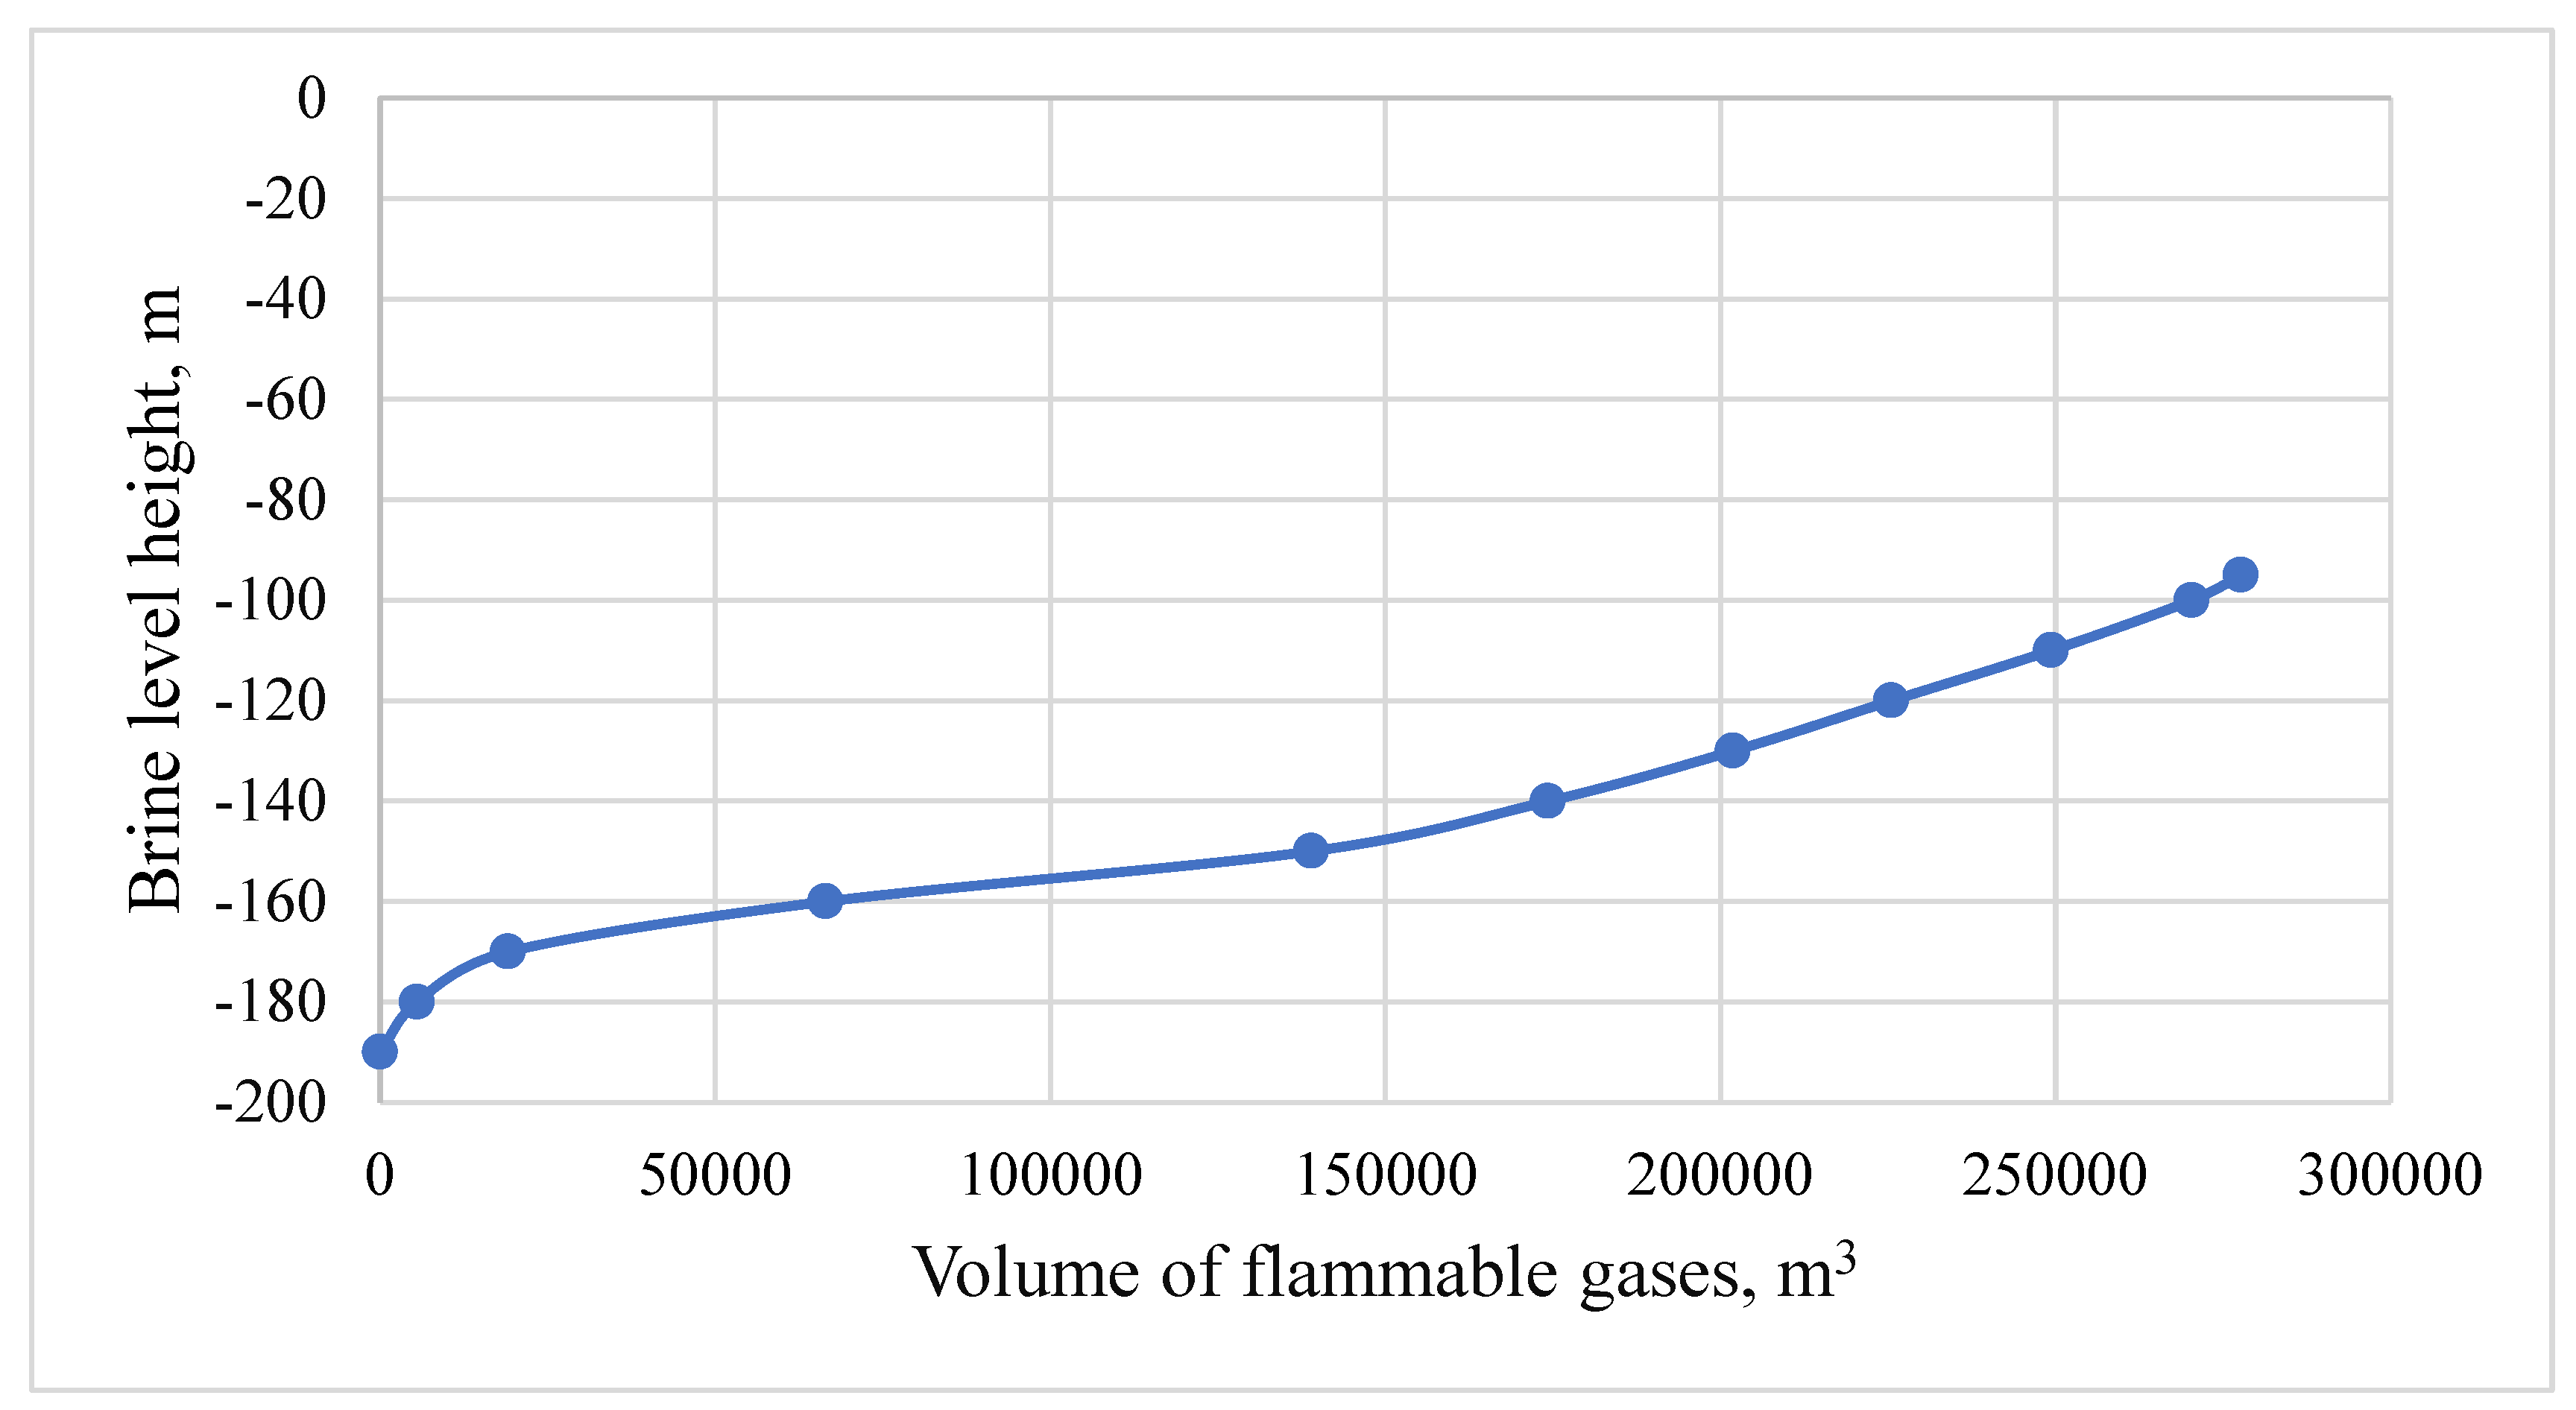
23]. However, we have supplemented it with an empirical time dependence of the volume of flammable gases released, taking into account the altitude of the incoming brine level. Previously, the rate of release of flammable gases was assumed to be constant. Now, the volume of release of flammable gases
is determined based on actual geological data, considering both free and bound gases released during the dissolution of pillars located between absolute elevations of –180 m and –95 m (
Figure 3). The perimeter part of the pillars was considered degassed by free gases to a depth of 0.5 m due to the development of technological fracturing [
25,
26].
To parameterize the model, the amount of free and bound gases contained in a unit volume of rocks under natural conditions was experimentally measured. According to experimental measurements [
26], the amount of free and bound gases in the considered section of the mine field varies in the range from 0.64 m
3/m
3 to 0.06 m
3/m
3, with an average value of 0.25 m
3/m
3. The analysis was carried out in terms of equivalent methane, where the concentration is equal to the sum of the concentrations of methane and hydrogen in accordance with the regulatory rules adopted in Russia.
We describe the process of methane accumulation and removal in an isolated worked-out space using the following system of equations:
with the initial conditions:
atm,
m
3,
,
kg and
m
3/s. Here,
and
represent the current and initial (atmospheric) air pressures in the unflooded section of the worked-out space, respectively, Pa;
is the current volume of the unflooded section, m
3;
and
are the current and initial masses of the air in the unflooded section, respectively, kg;
is the current mass of gas in the unflooded section, kg;
is the volumetric flow rate of the gas-air mixture entering the pipeline, m
3/s;
is the volumetric flow rate of the gas-air mixture leaving the pipeline in the main return airways, m
3/s;
is the methane density, kg/m
3;
is the intensity of flammable gas release in terms of equivalent methane, m
3/s.
Equation (1) describes the decrease in the volume of the unflooded section resulting from the influx of brine. Equations (2) and (3) describe the reduction in the mass of air and gas, respectively, in the unflooded section of the worked-out space due to their removal through the pipeline. Equation (4) establishes a connection between the thermodynamic characteristics of the gas-air mixture using the ideal gas law and assumes that the compression process in the unflooded section is isothermal. This assumption is logical given that the processes considered in the problem progress relatively slowly (with characteristic times on the order of tens of days). Equation (5) describes the movement of the gas-air mixture through a pipeline with air resistance under the influence of excess pressure of the gas-air mixture in the unflooded section. Equation (6) relates the volumetric flow rate of the gas-air mixture at the inlet and outlet of the pipeline, assuming the isothermal nature of the processes under consideration.
The air resistance of the pipeline was calculated using the following formula:
where
kg/m
3 is the aerodynamic drag coefficient of the degassing pipeline, the value of which is calculated using the method described in [
24];
m is the length of the degassing pipeline;
is the cross-sectional area of the degassing pipeline, m
2;
is the cross-section perimeter of the degassing pipeline, m.
In [
23], it was demonstrated that the air resistance of the degassing pipeline and the 'back pressure' of the gas-air mixture in the closed section of the mine do not significantly affect the time it takes to fill the worked-out space with brine. Therefore, the current volume of the unfilled section is linearly dependent on time
:
The system of equations (2) – (8) with initial conditions can be reduced to a system of first-order nonlinear differential equations for the variables
,
:
with initial conditions
,
kg. Here
kg/m
3 is the initial air density in the worked-out space.
Two different scenarios for flooding the closed section of the mine field were considered: scenario 1 involves controlled design flooding with brine supplied through a brine pipeline at a flow rate of
m
3/hour; scenario 2 entails a hypothetical breakthrough of fresh groundwater in the supra-salt strata with a flow rate of
m
3/hour, corresponding to the predicted value obtained from the regional numerical geofiltration model of the supra-salt strata [
27].
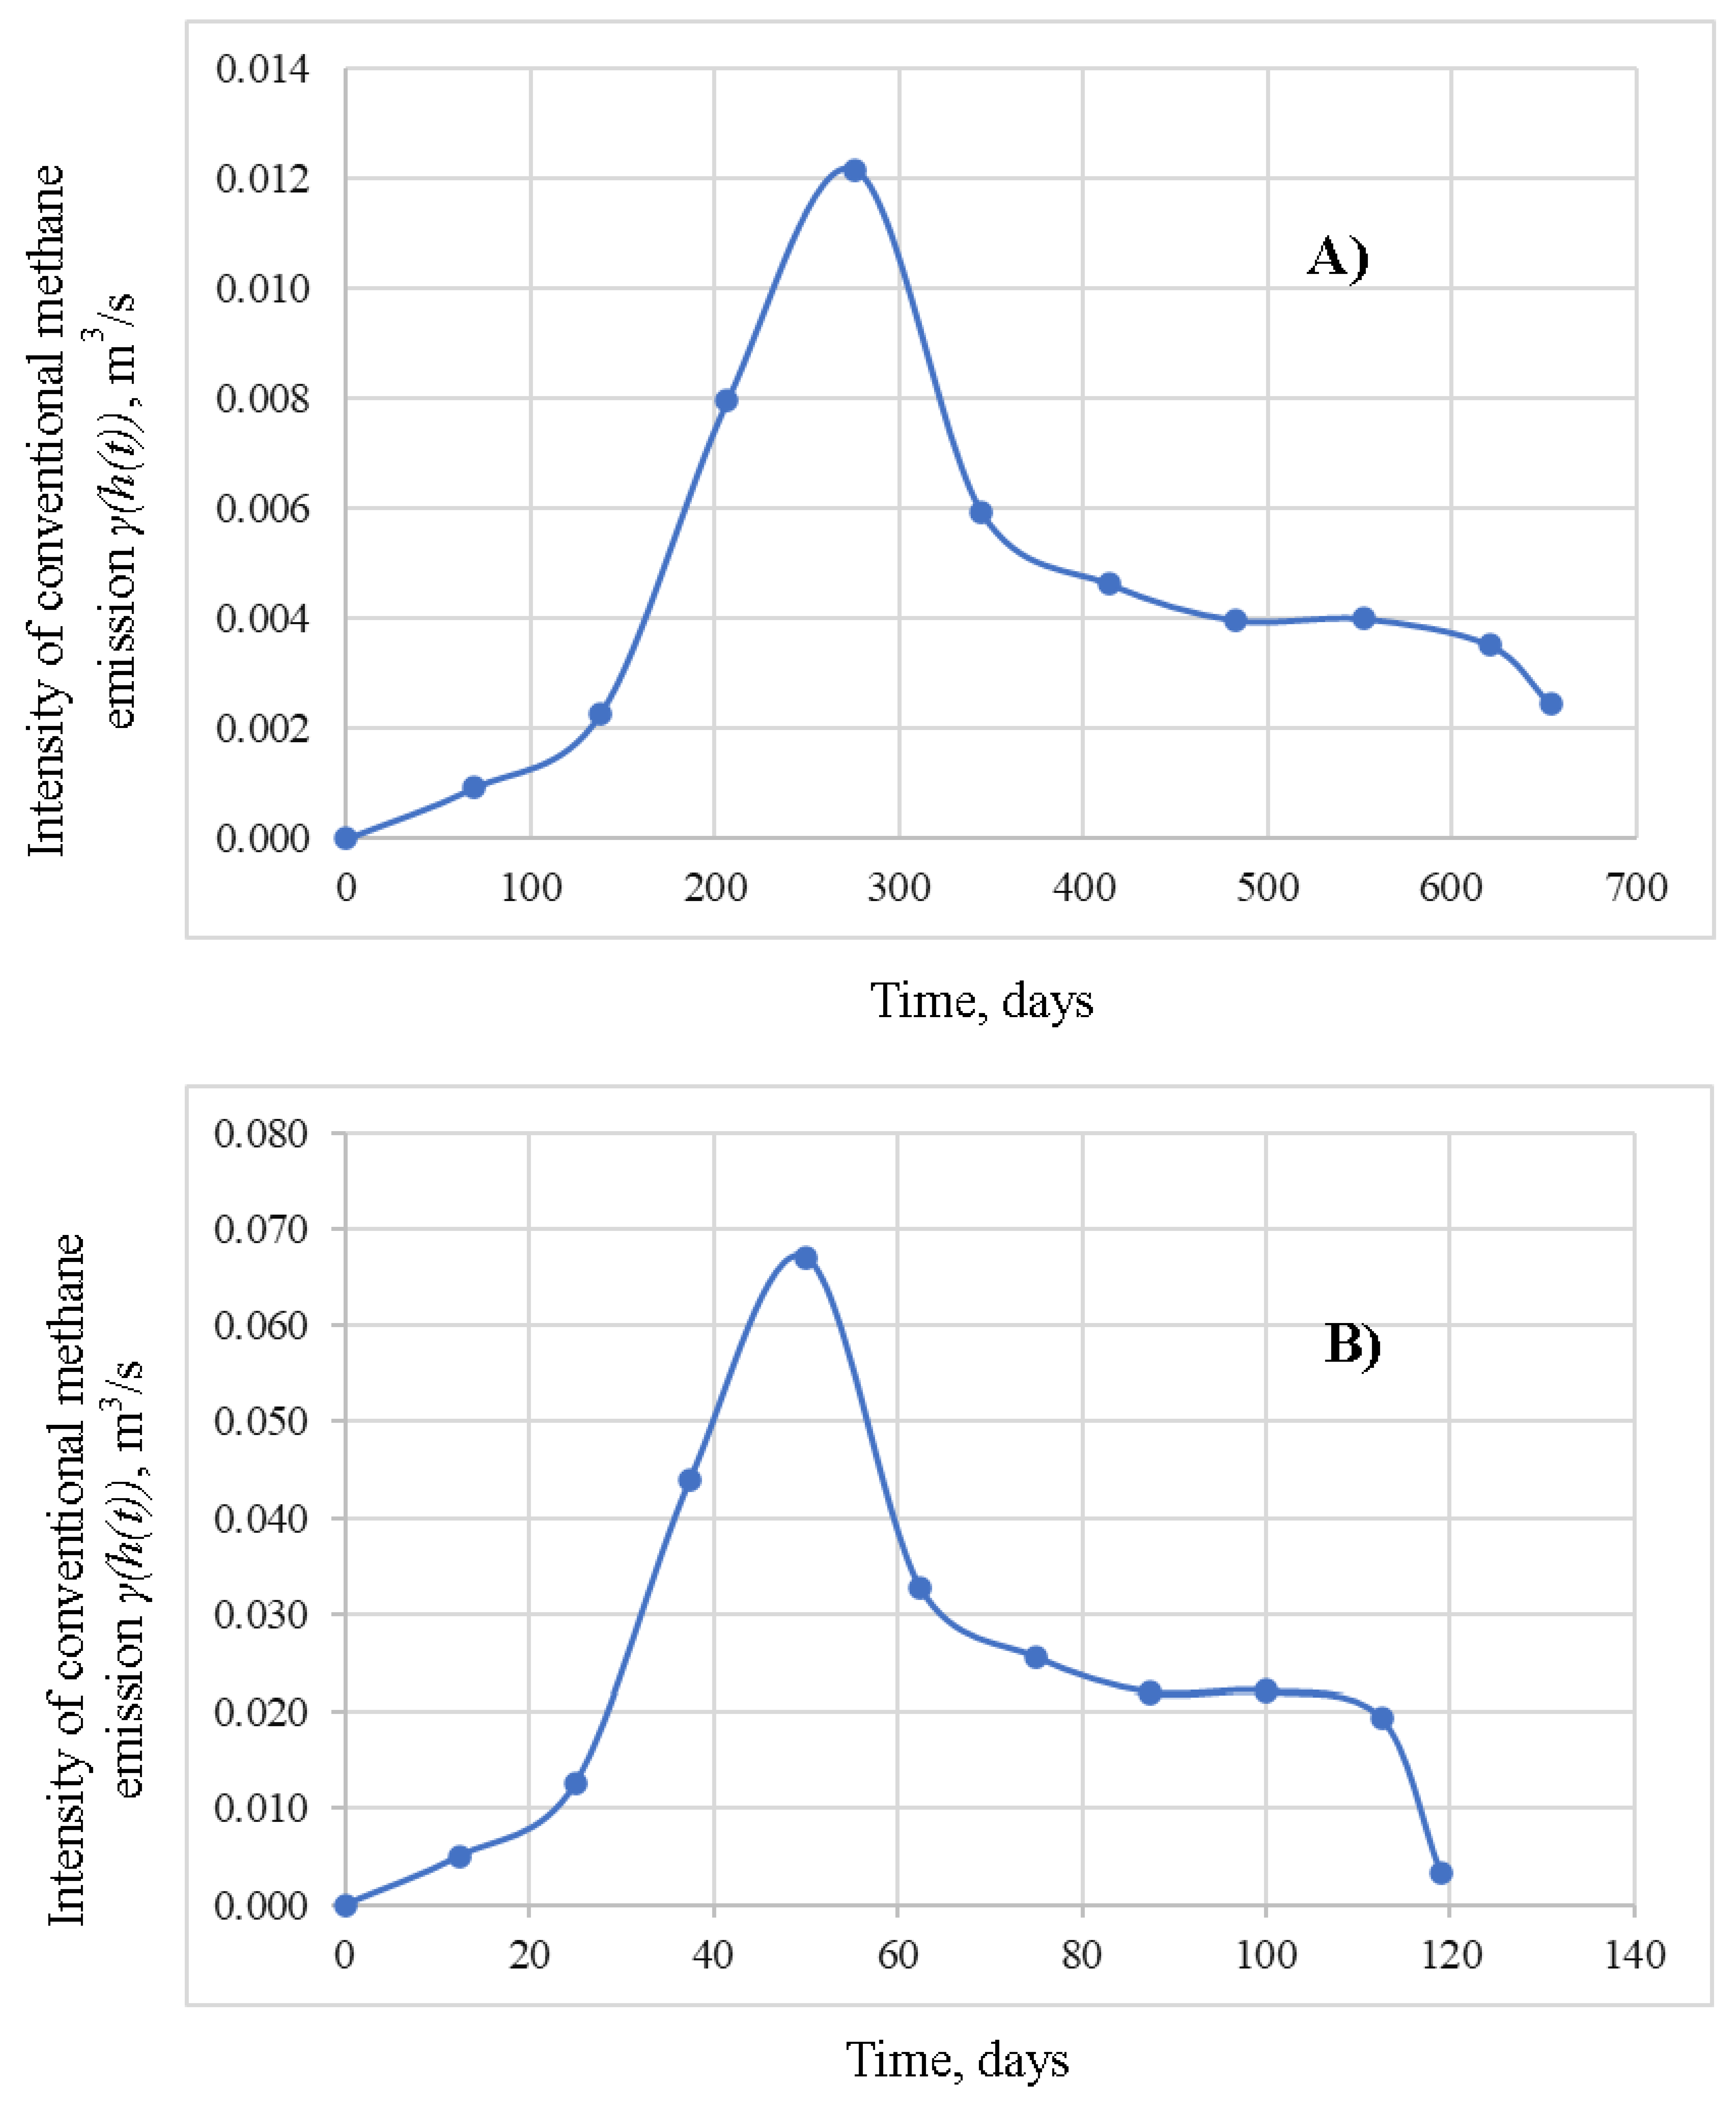
According to equation (8), the flooding time of the closed part of the mine under the planned scenario 1 is 654 days, while under scenario 2, it is 115 days. Additionally, considering equation (8) and the dependence of the volume of released flammable gases on the brine level height, as shown in
Figure 3, the time dependencies of the intensity of the release of flammable gases, denoted as
, are plotted for both flooding scenarios in
Figure 4. Thus, the intensity of gas release during flooding exhibits a strong nonlinear relationship, reaching a maximum of 0.0121 m
3/s on day 276 for scenario 1 and 0.067 m
3/s on day 50 for scenario 2.
The system (9) – (10) with initial conditions was numerically solved using the finite difference method in the computer algebra package Wolfram Mathematica. Based on the calculated values of and , the remaining characteristics of the degassing system were determined. To assess the effectiveness of the degassing system concerning the diameter and number of degassing pipelines, we further investigate the following three proposed options in this study:
One pipeline with a diameter of d = 0.153 m.
One pipeline with a diameter of d = 0.315 m.
Two pipelines with a diameter of d = 0.153 m.
Results and Discussion
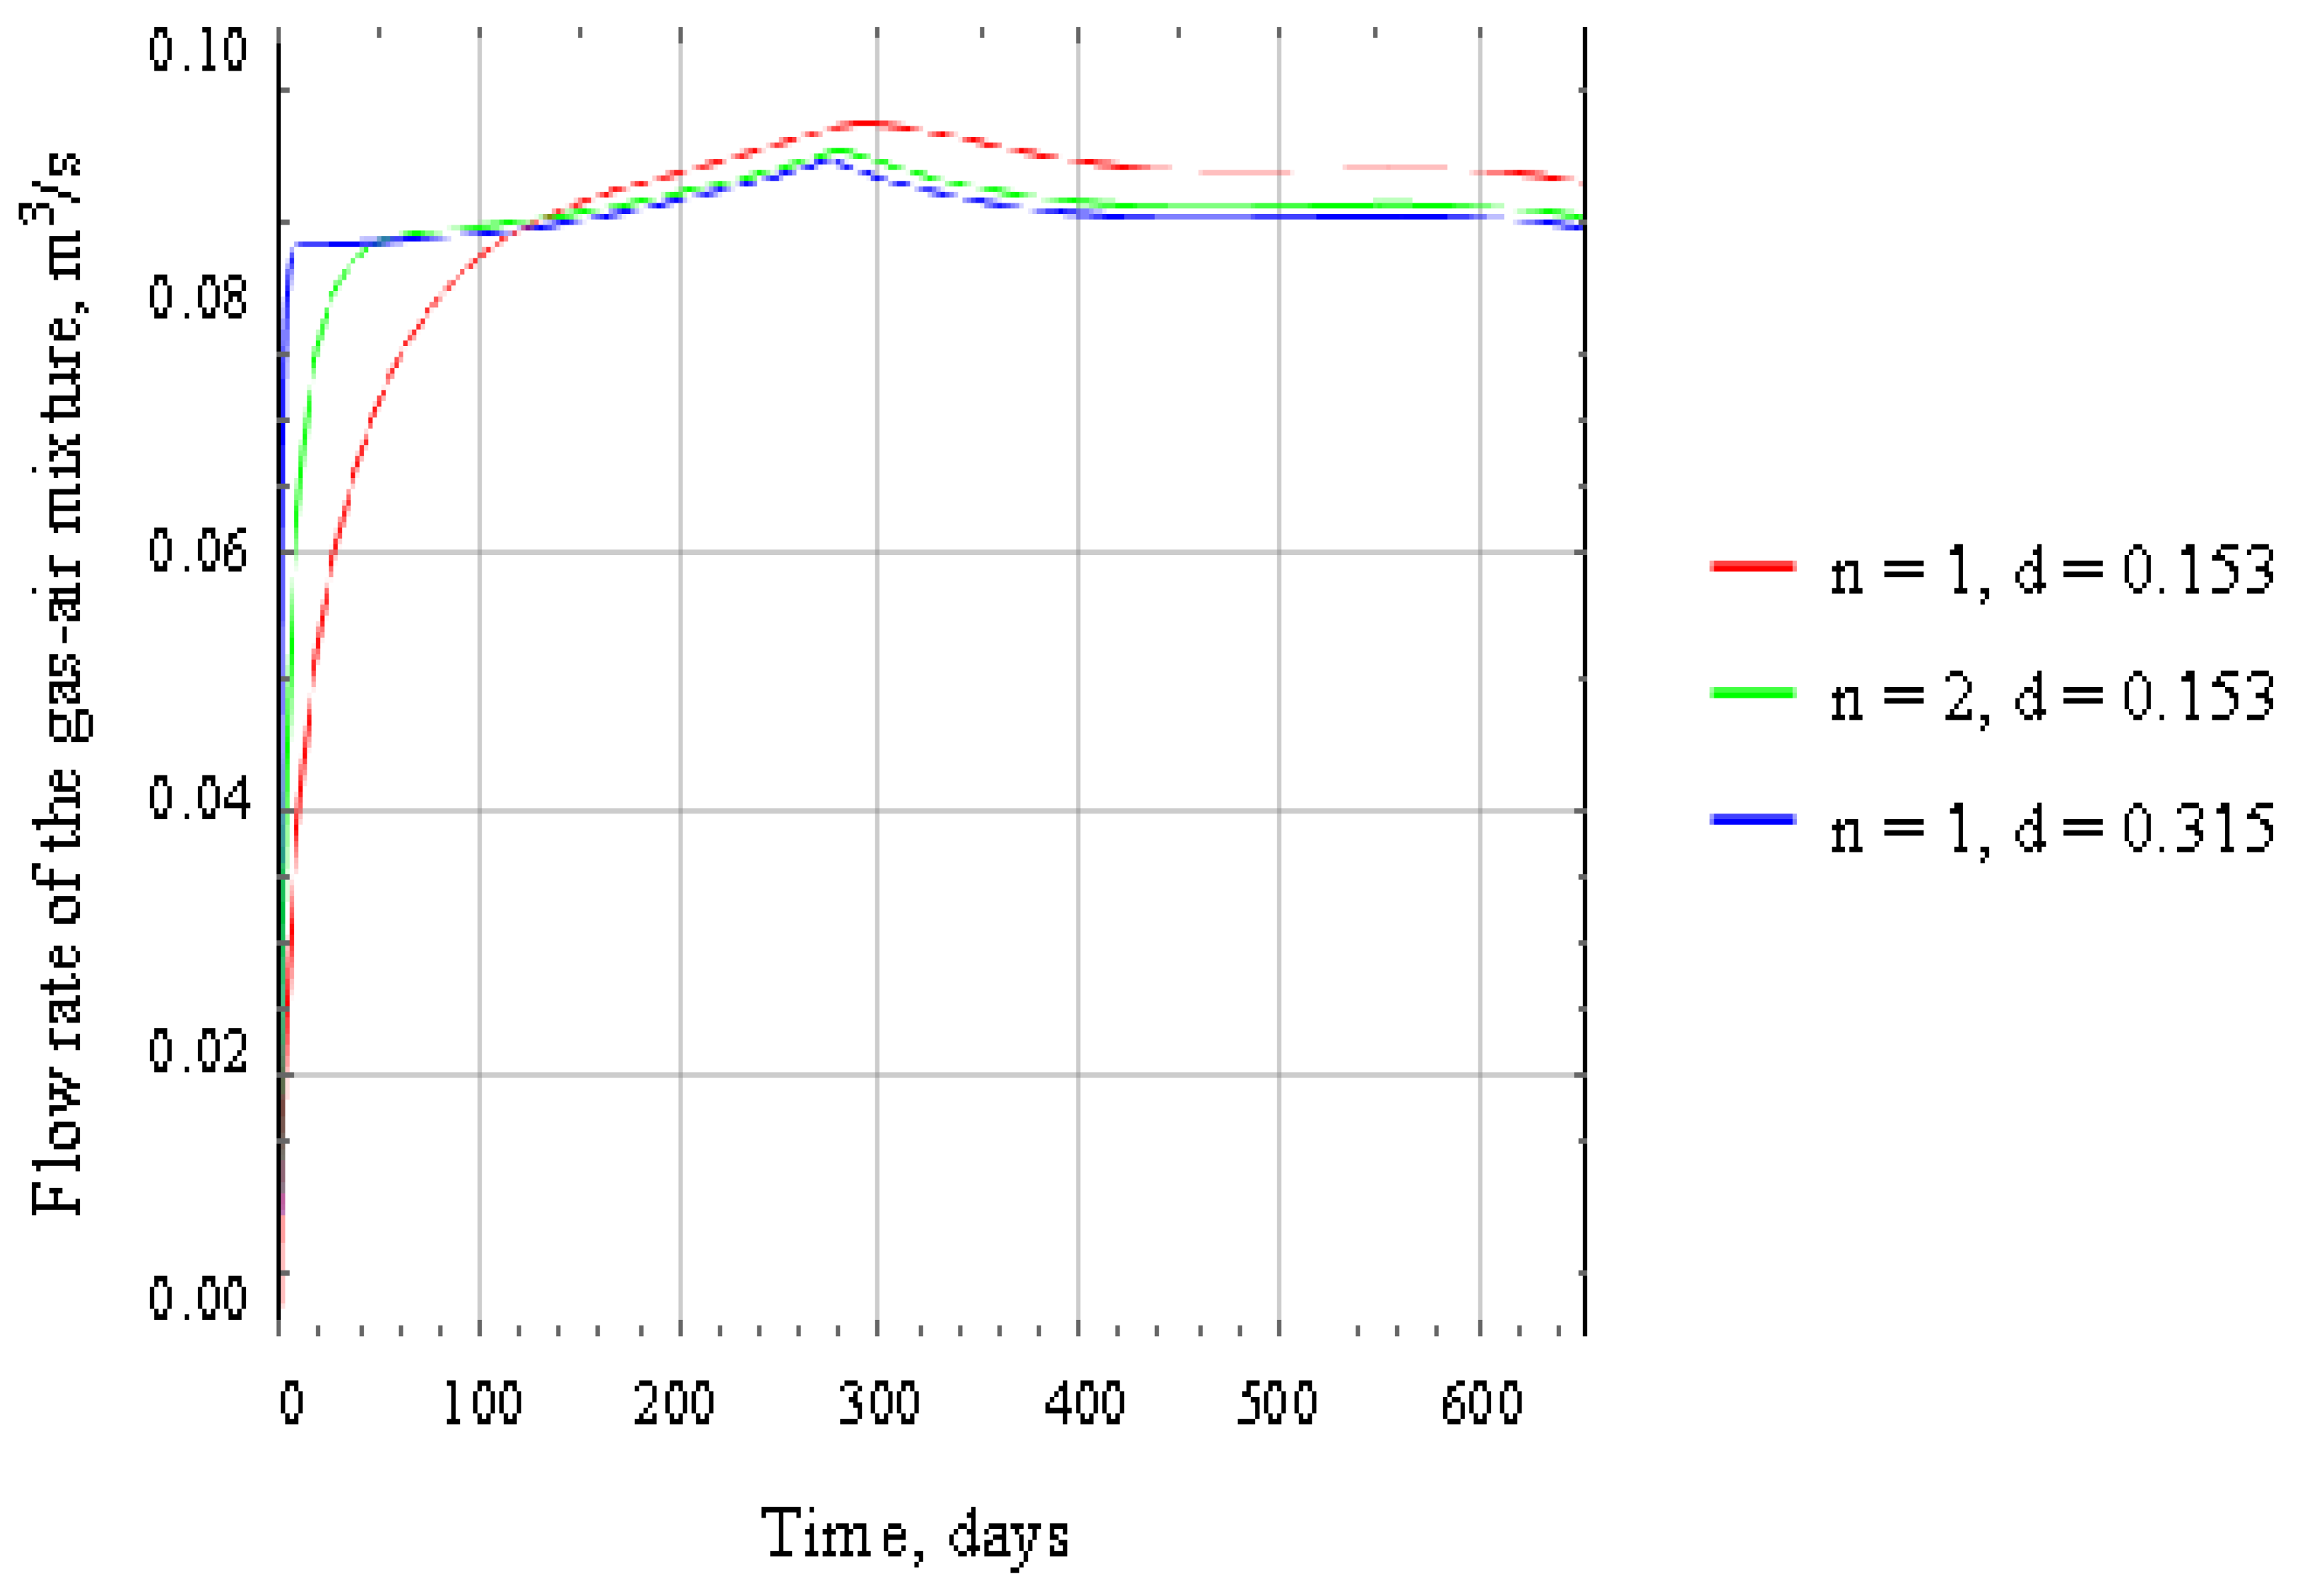
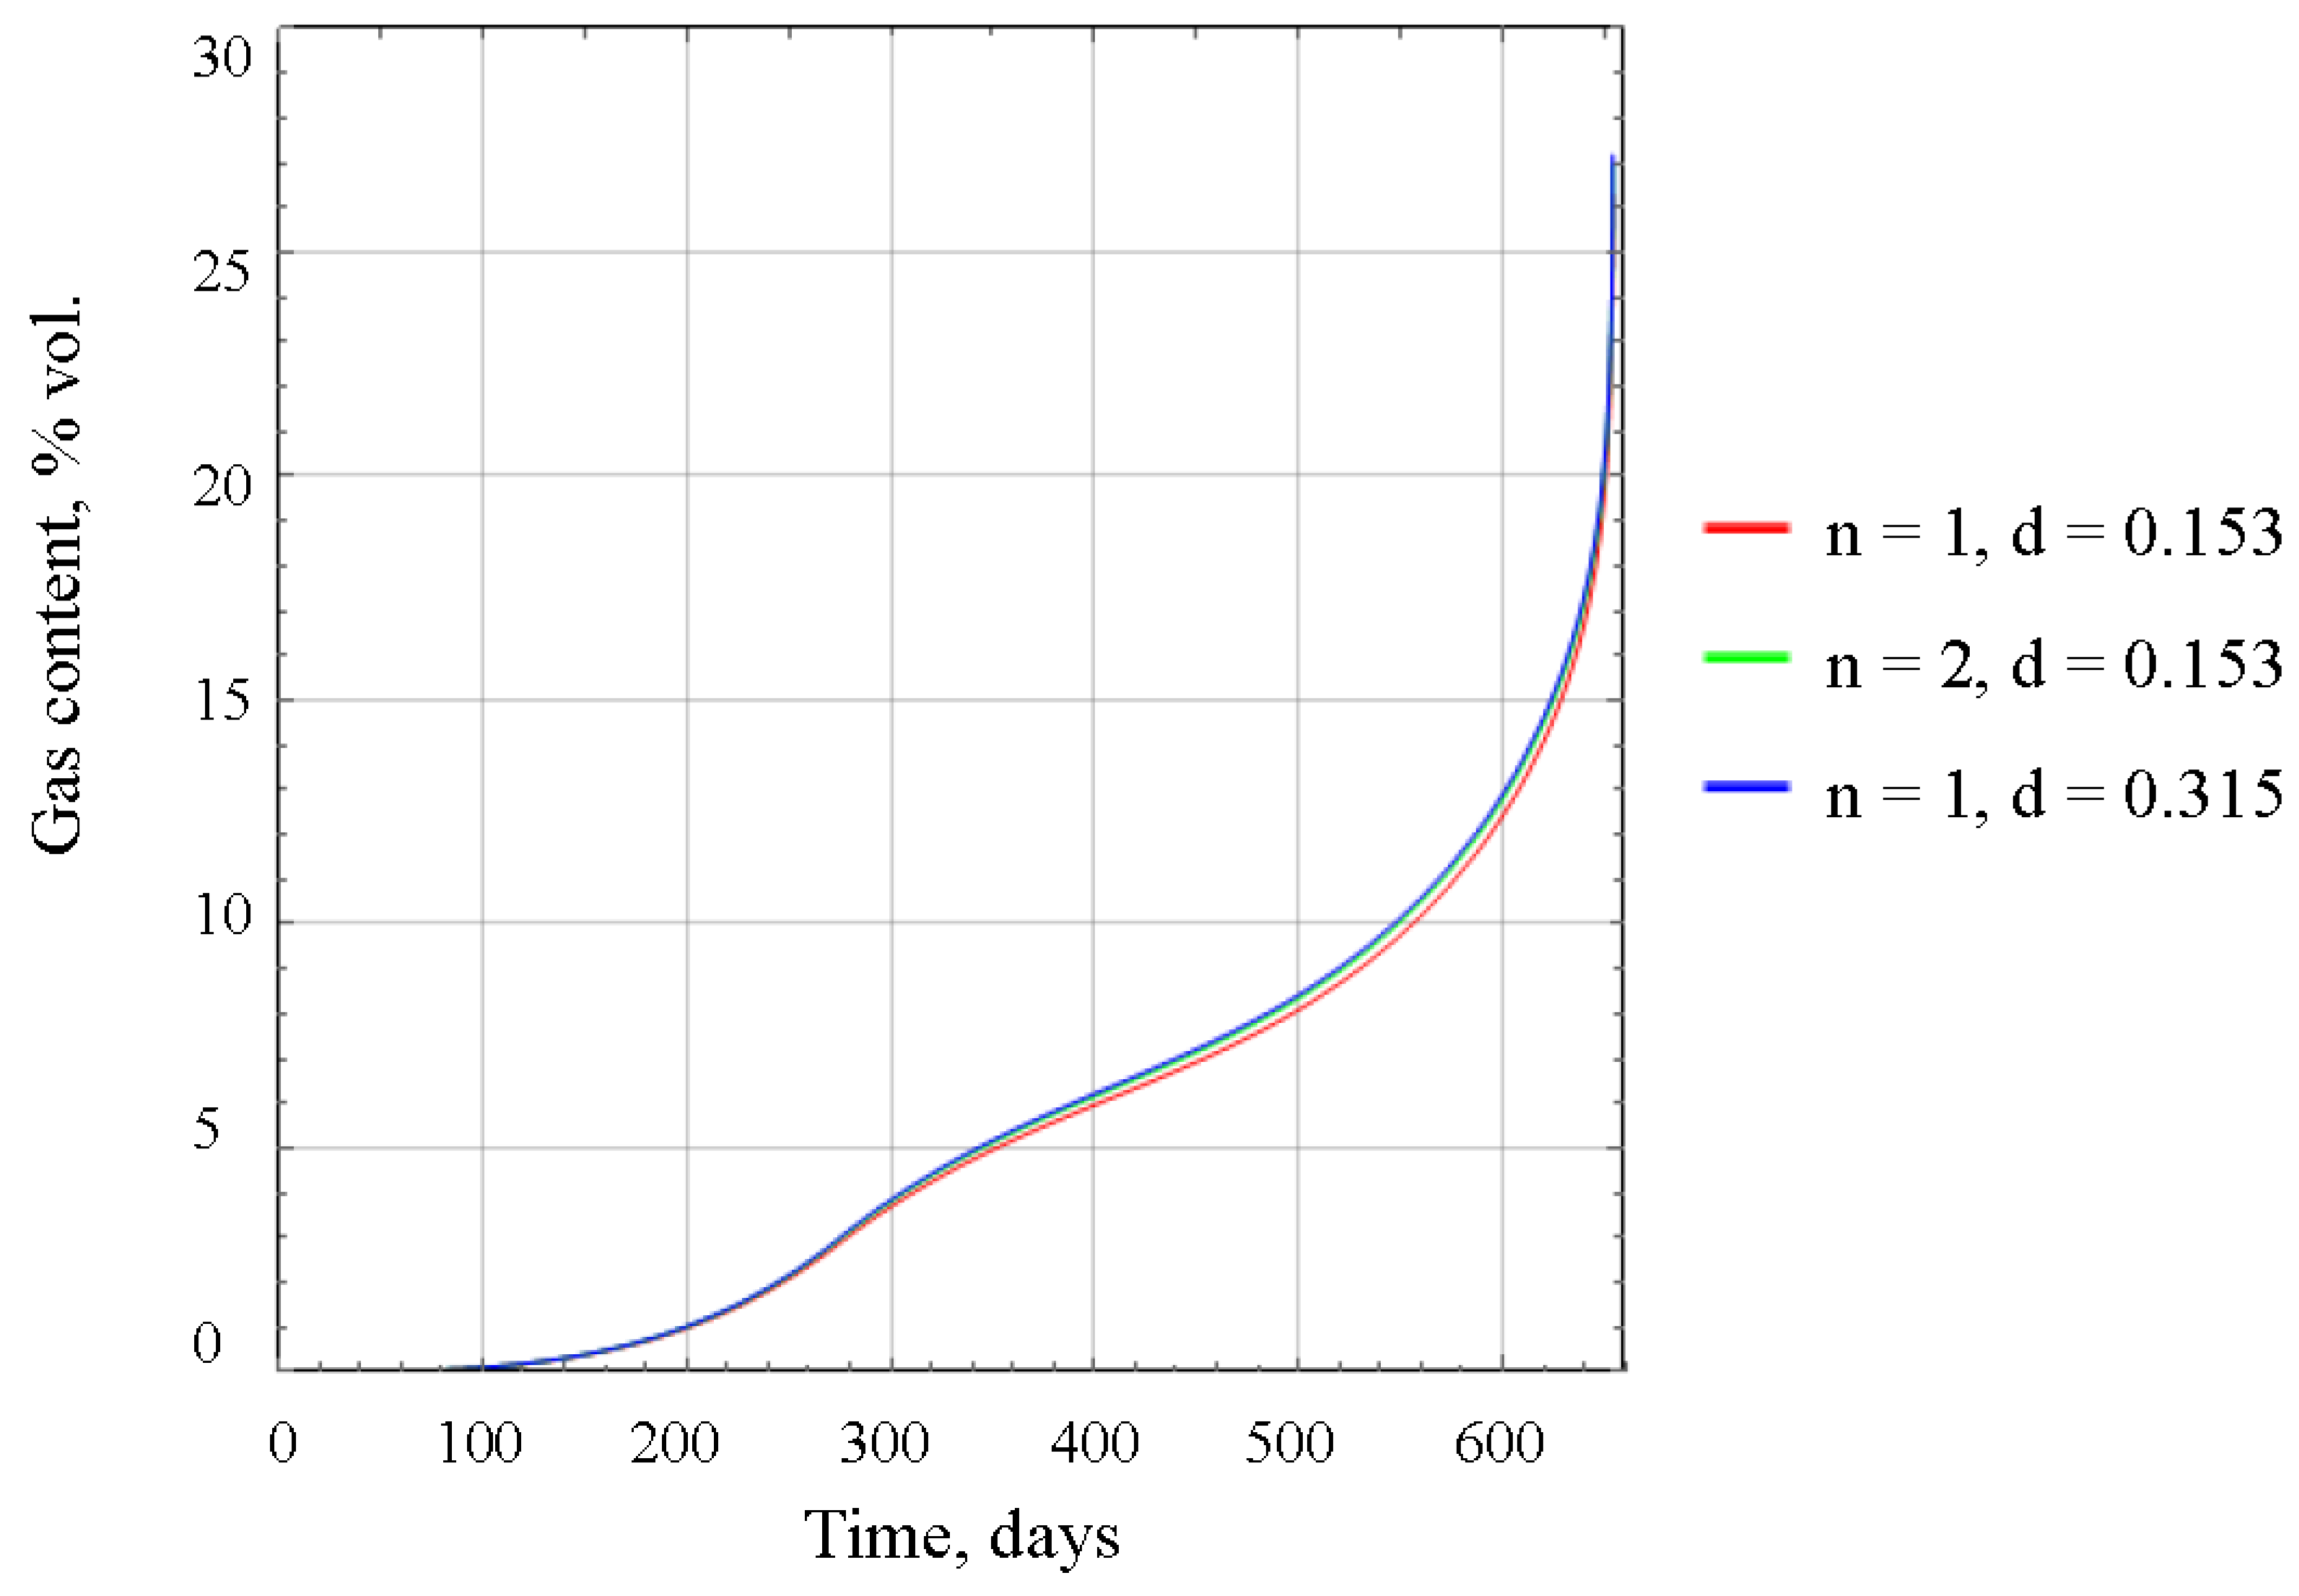
The calculation results of the current values of the gas-air mixture flow rate emanating from the pipeline into the main return airways and the volume fraction of combustible gases in the process of flooding the closed section of the mine with brine according to scenario 1 are presented in
Figure 5 and
Figure 6, respectively. The flow rate of the gas-air mixture passing through the pipeline depends on the version of the degassing system. The greater the air resistance to the movement of the gas-air mixture the pipeline takes, the longer it takes for the mixture flow to reach a value close to the brine flow rate, denoted as
= 300 m
3/hour = 0.083 m
3/s, supplied to the closed section of the mine. The nonlinear behavior of the dependence in
Figure 5 is associated with a similar nonlinear nature of the time dependence of the gas emission intensity (see
Figure 4), while the peak values in
Figure 5 correspond to the maximum gas emission intensity.
Figure 6 shows that the content of flammable gases in the gas-air mixture emanating from the pipeline gradually increases due to gas release from dissolved rocks, reaching a value of 24% by volume, which is almost five times higher than the lower explosive limit of methane. In this case, the time dynamics of the concentration of flammable gases practically do not depend on the version of the degassing system. At the same time, all three curves demonstrate a highly nonlinear increase in the average methane concentration in the unflooded section. This characteristic of the solution in our proposed model is logical, as there is a constant outflow of air through the degassing pipeline, while air replenishment does not occur in the unflooded section. Consequently, the methane concentration, determined by the ratio
increases nonlinearly with a decrease in the value of
.
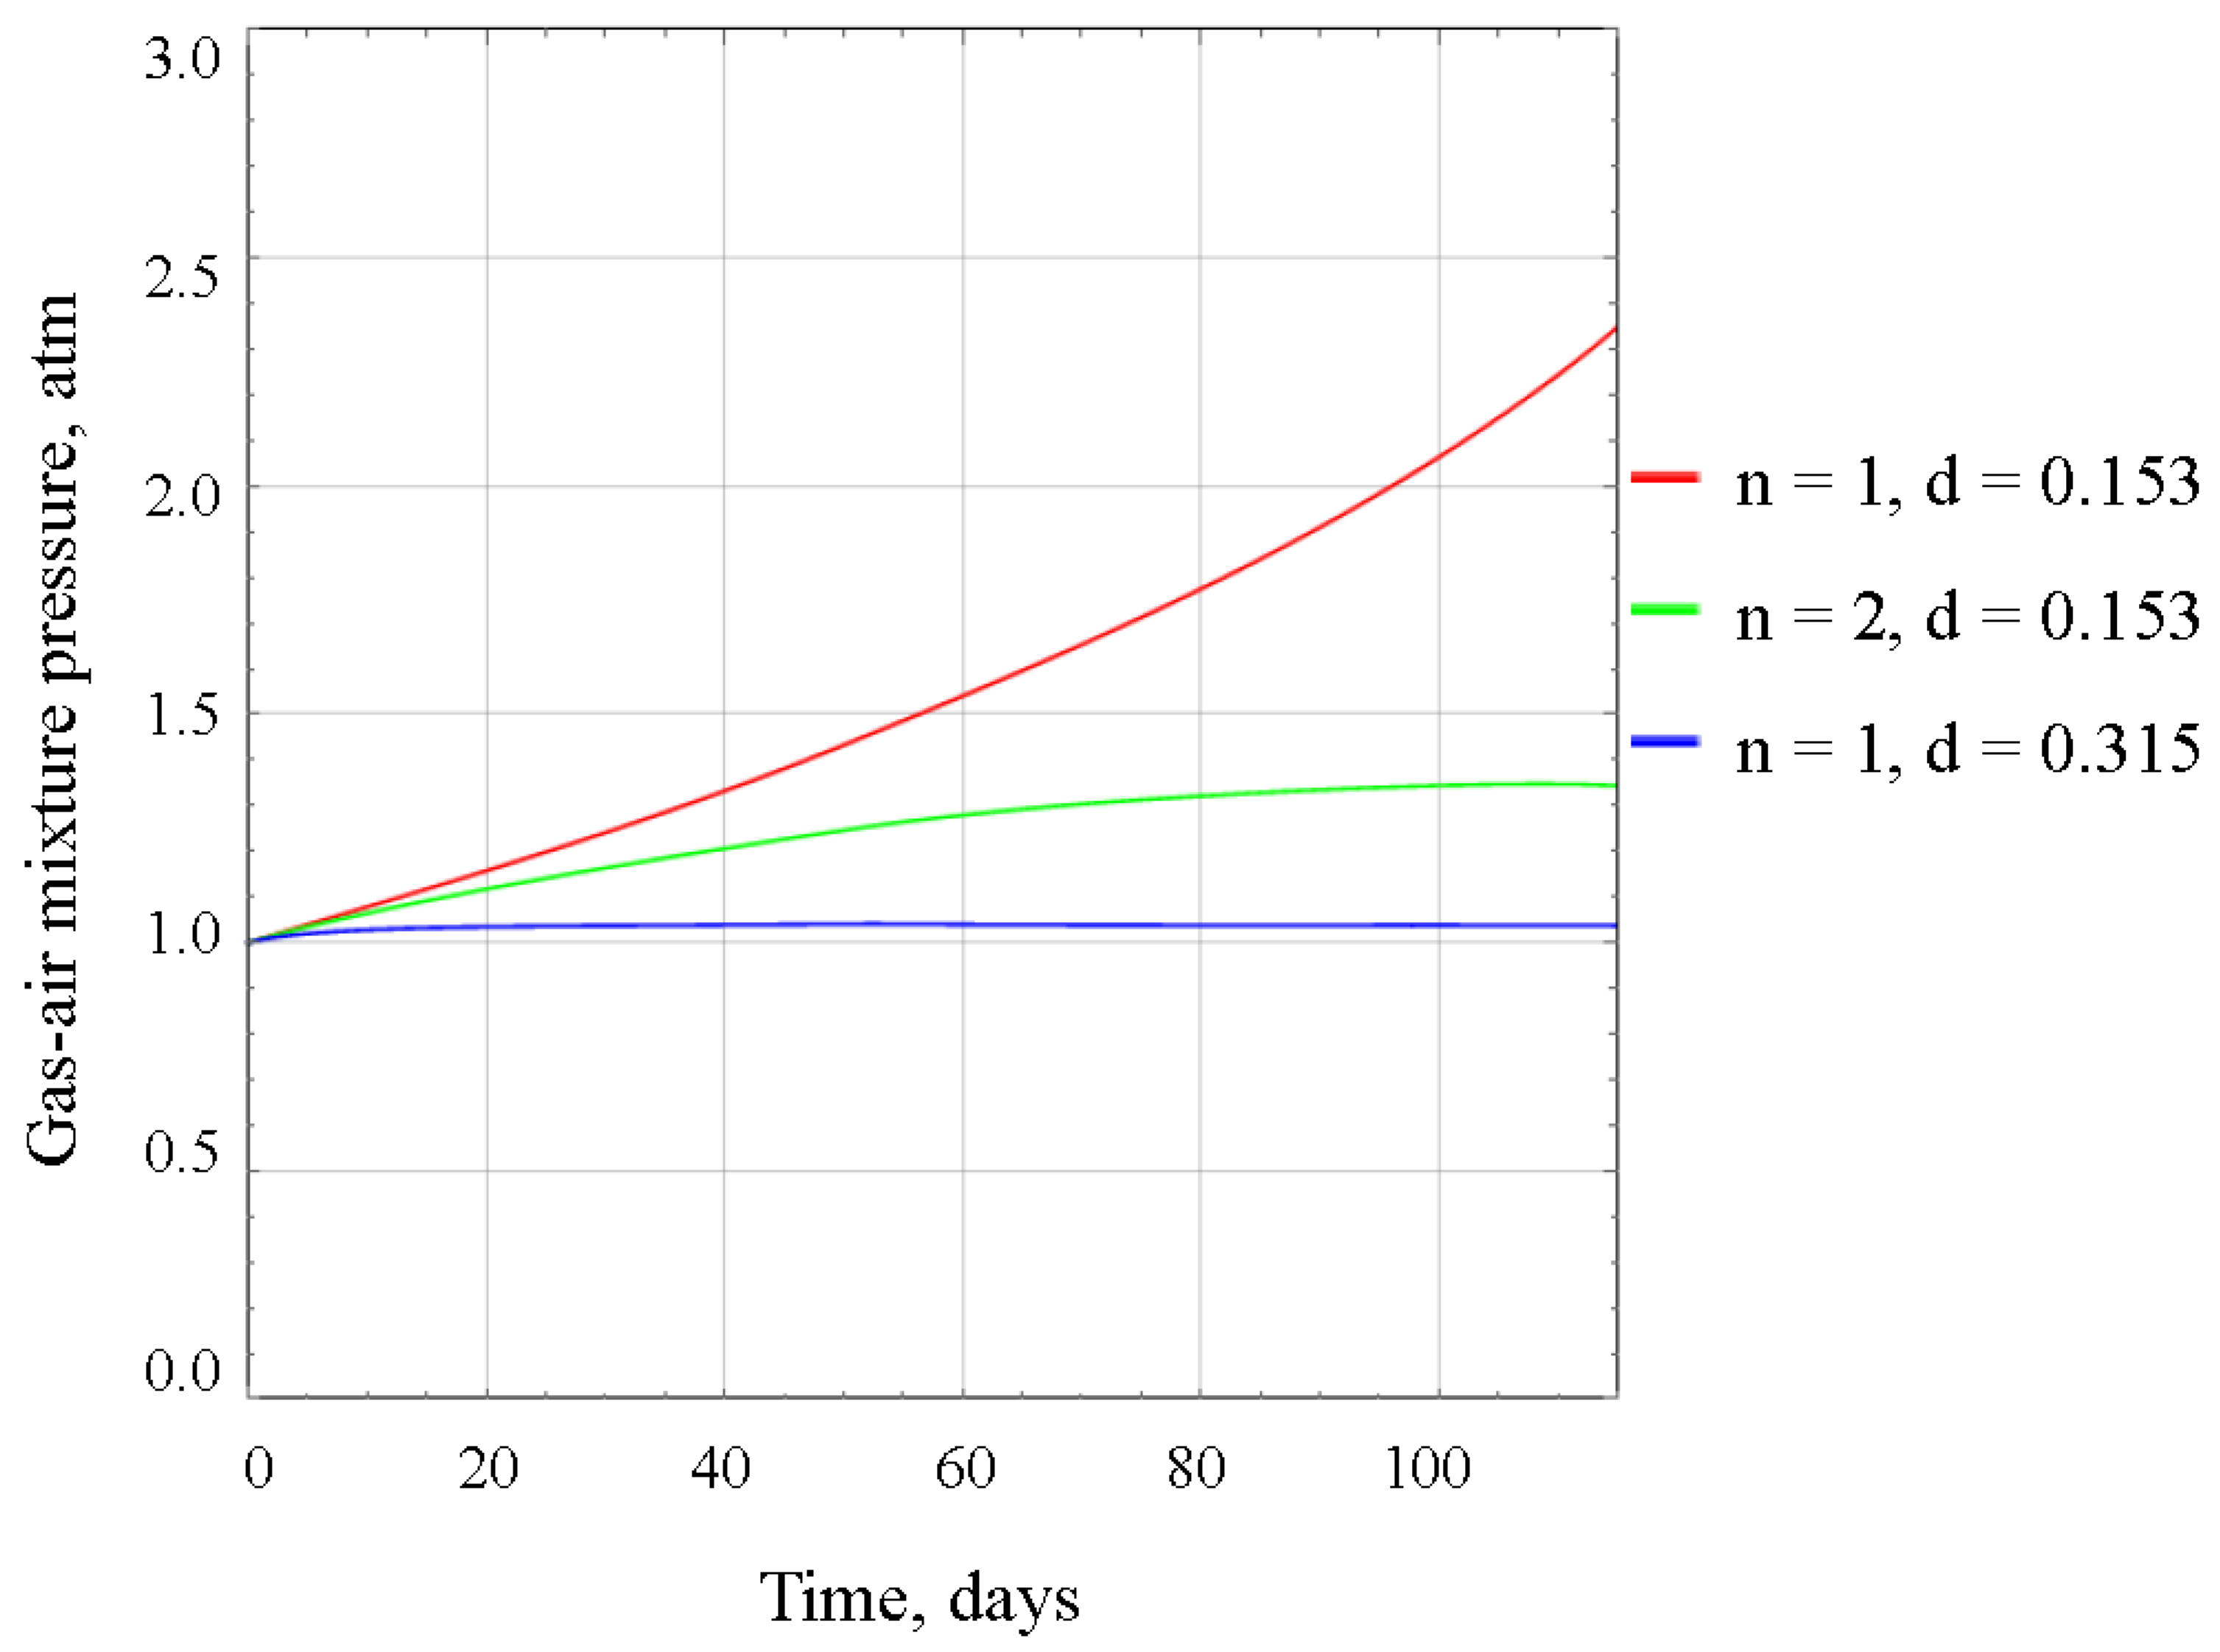
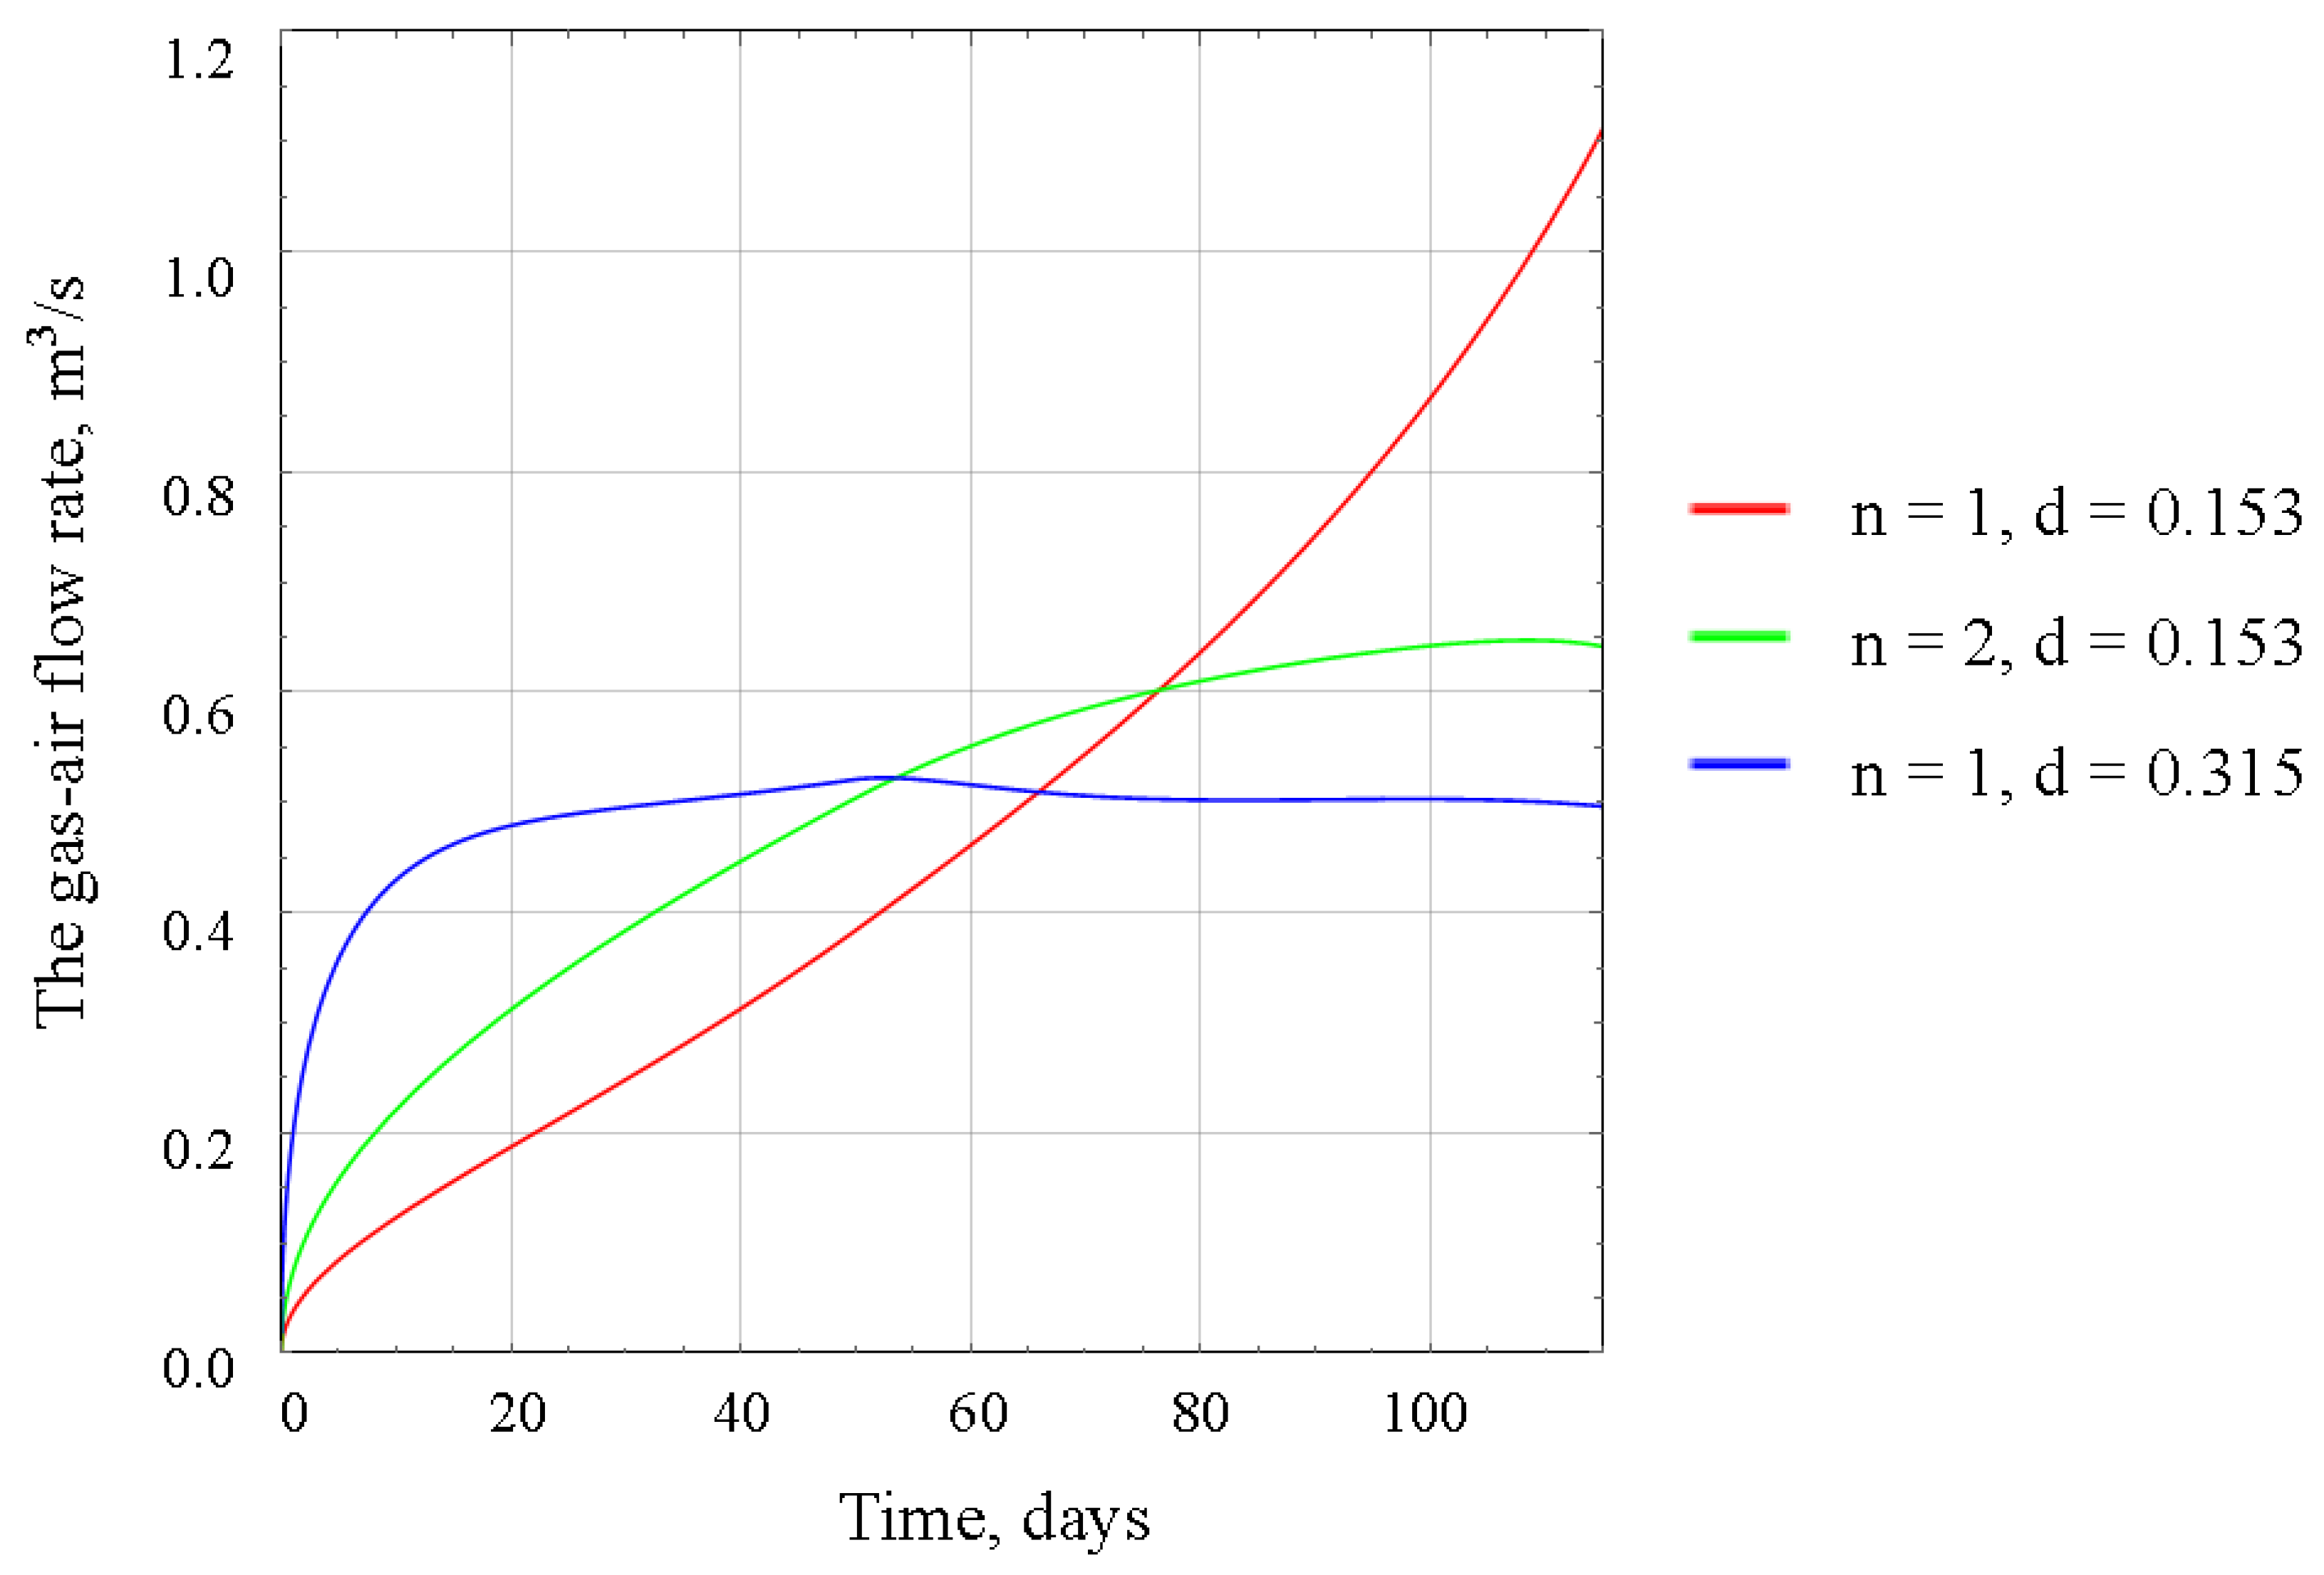
The results of calculations of the pressure of the gas-air mixture in the unflooded section of the worked-out area, the flow rate of the gas-air mixture flow from the pipeline and the average volume fraction of combustible gases in the unflooded section according to scenario 2 are presented in
Figure 7,
Figure 8 and
Figure 9 respectively.
The pressure of the gas-air mixture in the unflooded section of the worked-out area depends on the parameters of the degassing system.
Figure 7 shows that over time, the pressure of the gas-air mixture increases significantly and, under certain parameters of the degassing system (such as a small number of pipelines and small diameter of pipelines), can lead to pressures of more than 2 atm. This is due to the insufficient rate of gas removal from the unflooded section. It also follows that when choosing the final layout of degassing pipelines, the material and thickness of the pipeline wall should be selected based on the maximum predicted pressures of the gas-air mixture in the unflooded section.
The flow rate of the gas-air mixture passing through the pipeline also depends significantly on the parameters of the degassing system (see
Figure 8). The option with one degassing pipeline with a diameter of 0.315 m experiences the least air resistance, and within approximately 20 days after the start of closure, the gas-air mixture flow rate reaches a value close to the flow rate of brines, (
= 1700 m
3/hour = 0.47 m
3/s), supplied to the closed section of the mine. For the degassing system with two pipelines, each with a diameter of 0.153 m, the gas-air mixture flow rate grows more slowly. However, by the time the closed section of the mine is completely filled with brines, the maximum flow rate of the gas-air mixture reaches 0.65 m³/s. An even slower increase in the flow rate of the gas-air mixture is observed in the first days with a single pipeline of small diameter (0.153 m). However, an excess of gas-air mixture in the unflooded section of the worked-out space leads to the situation where, after 70 days, the consumption of the mixture begins to exceed the two previous options and grows rapidly until the end of flooding of the closed section. At the moment of complete flooding of the shaft section, the pipeline flow in this option is 1.1 m³/s.
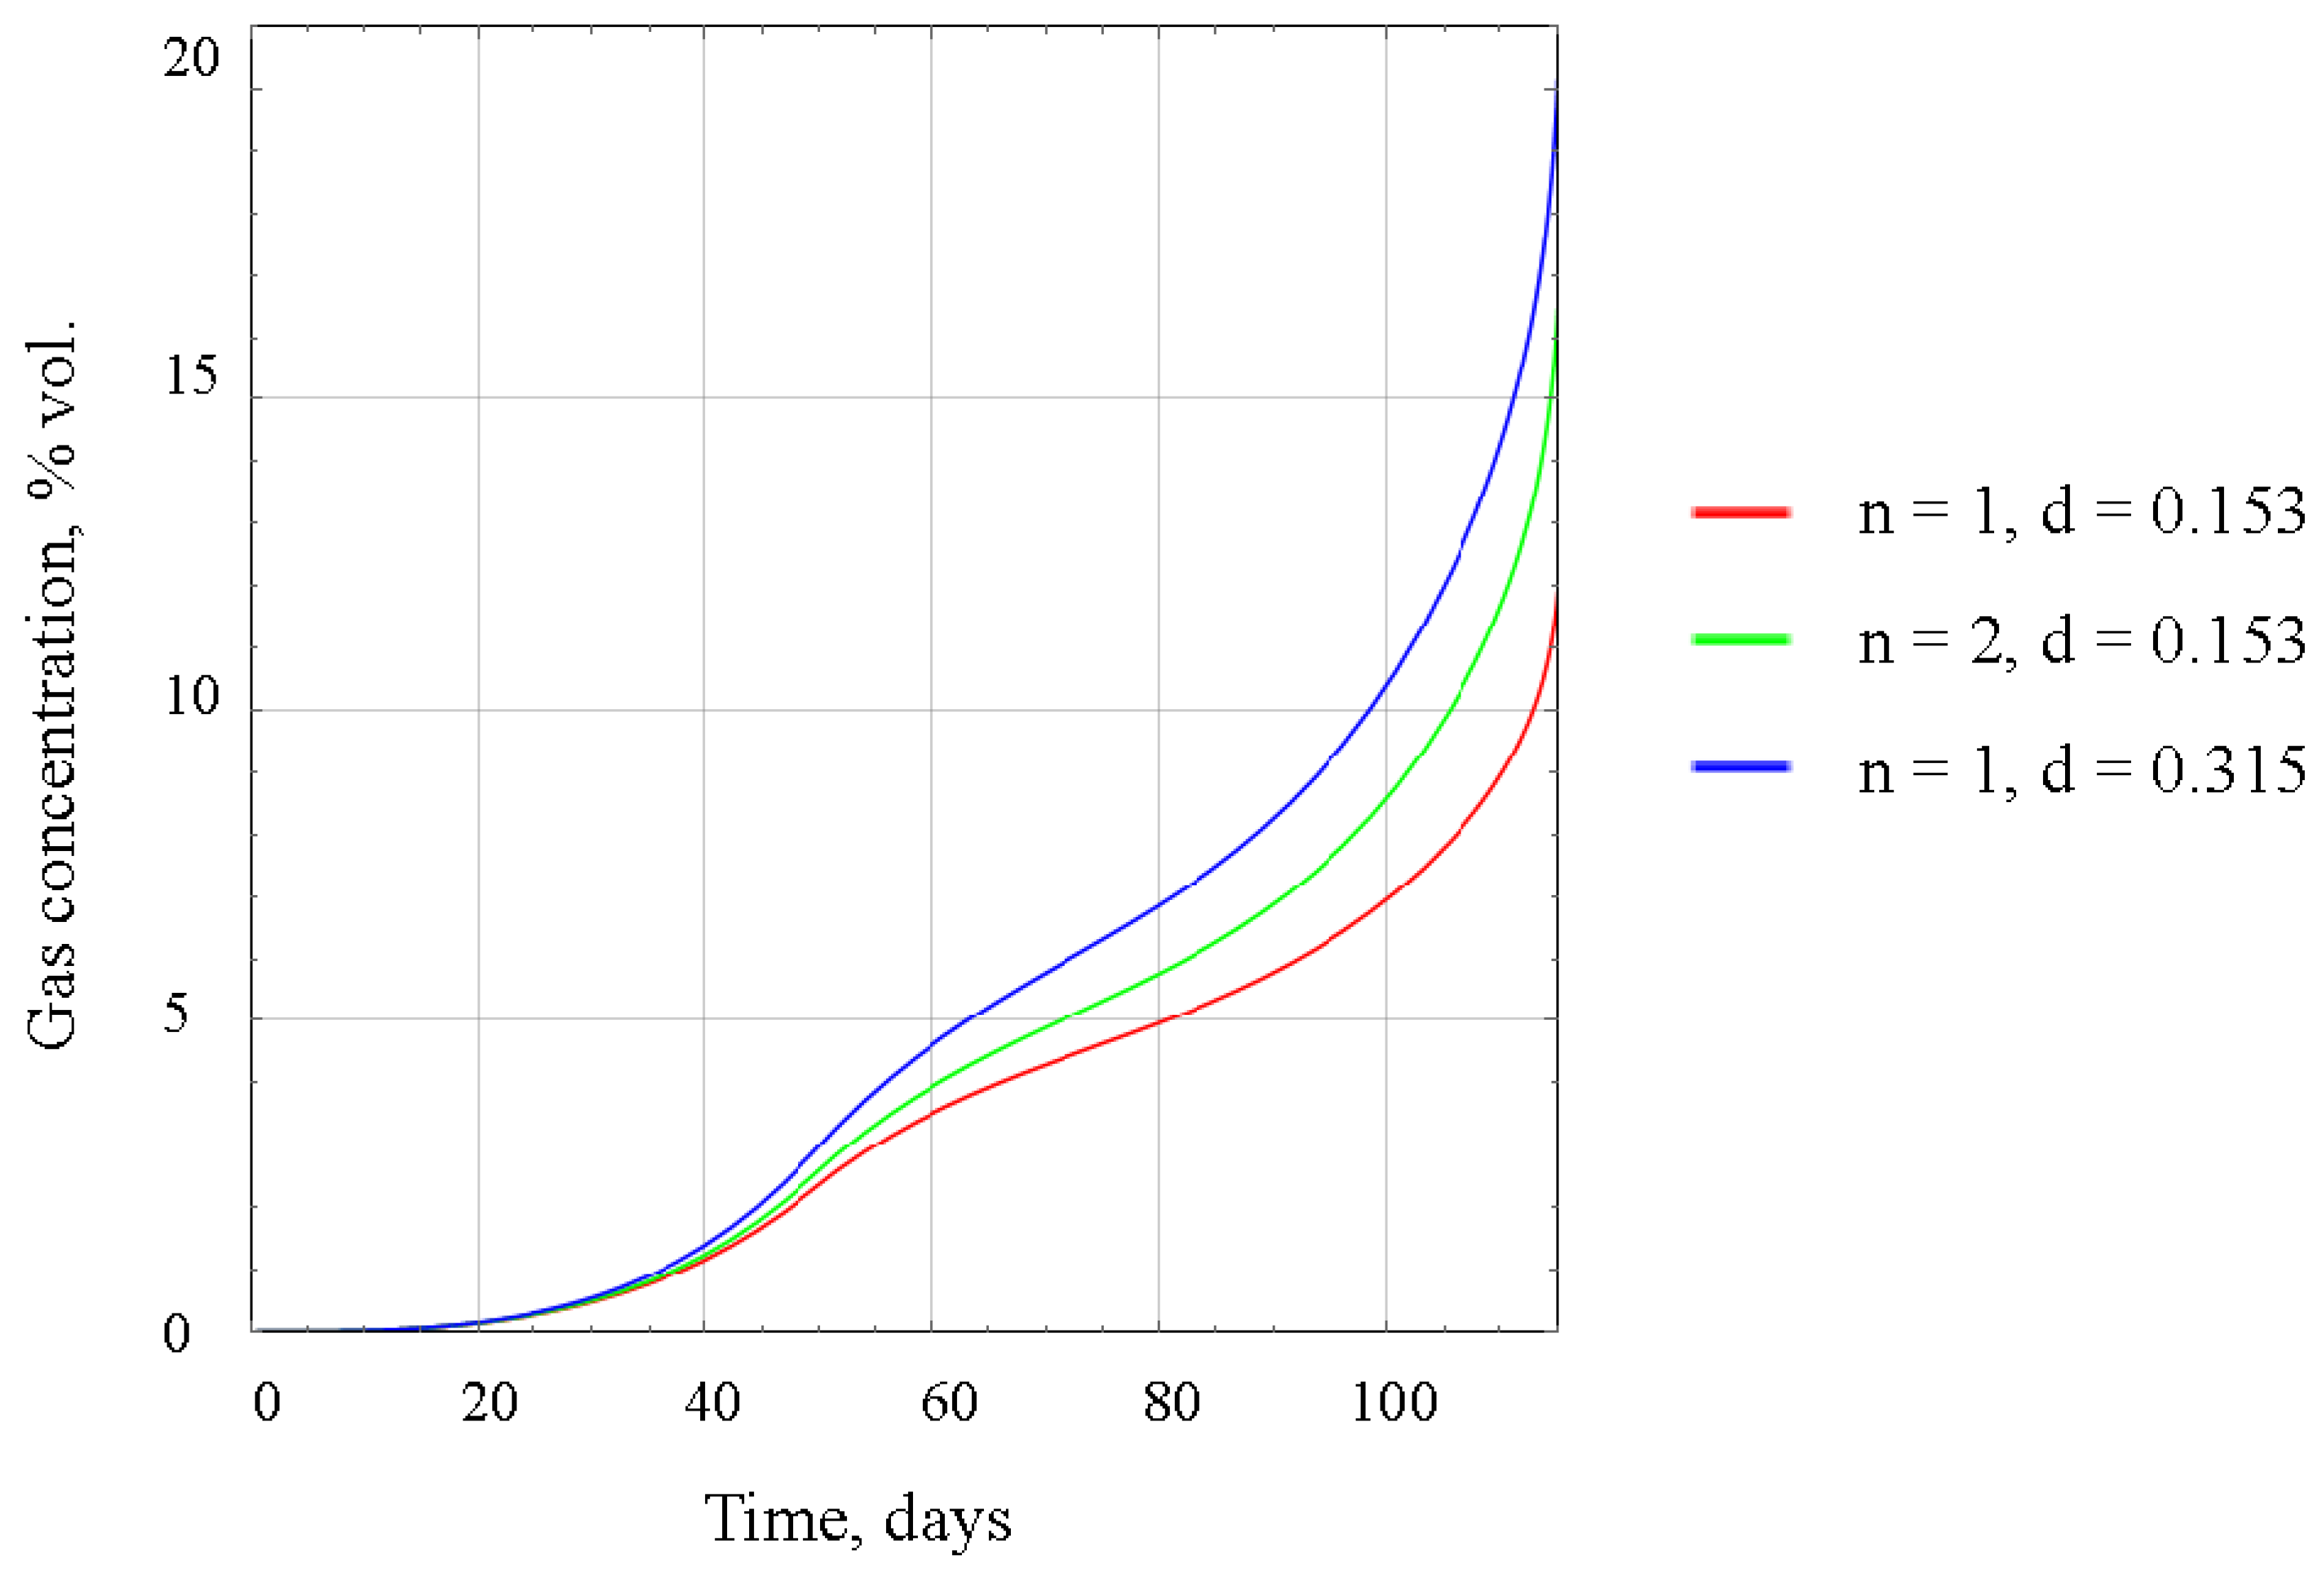
The concentration of combustible gases in the gas-air flow originating from the pipeline, akin to scenario 1, steadily rises due to gas release from dissolved rocks. However, in the case of section closure under scenario 2, across different configurations of the degassing system, the peak concentrations of flammable gases range from 11.5 to 19% by volume, exceeding the lower explosion limit of methane by 2–4 times (
Figure 9).
In both scenarios of section closure flooding, the concentration of gas in the outgoing stream will eventually surpass the lower explosive limit of methane, posing a hazard to mining operations. To reduce the gas concentration to a safe level, adequate fresh air must be supplied along the main return airways, where the gas-air mixture exits the degassing pipelines. The required amount of air can be calculated using the formula:
where
is the gas volume fraction, % vol;
is the gas concentration threshold limit value, which is 0.5 % vol. [
17];
is the gas-air mixture flow rate emanating through the pipeline from the worked-out space into the main return airways.
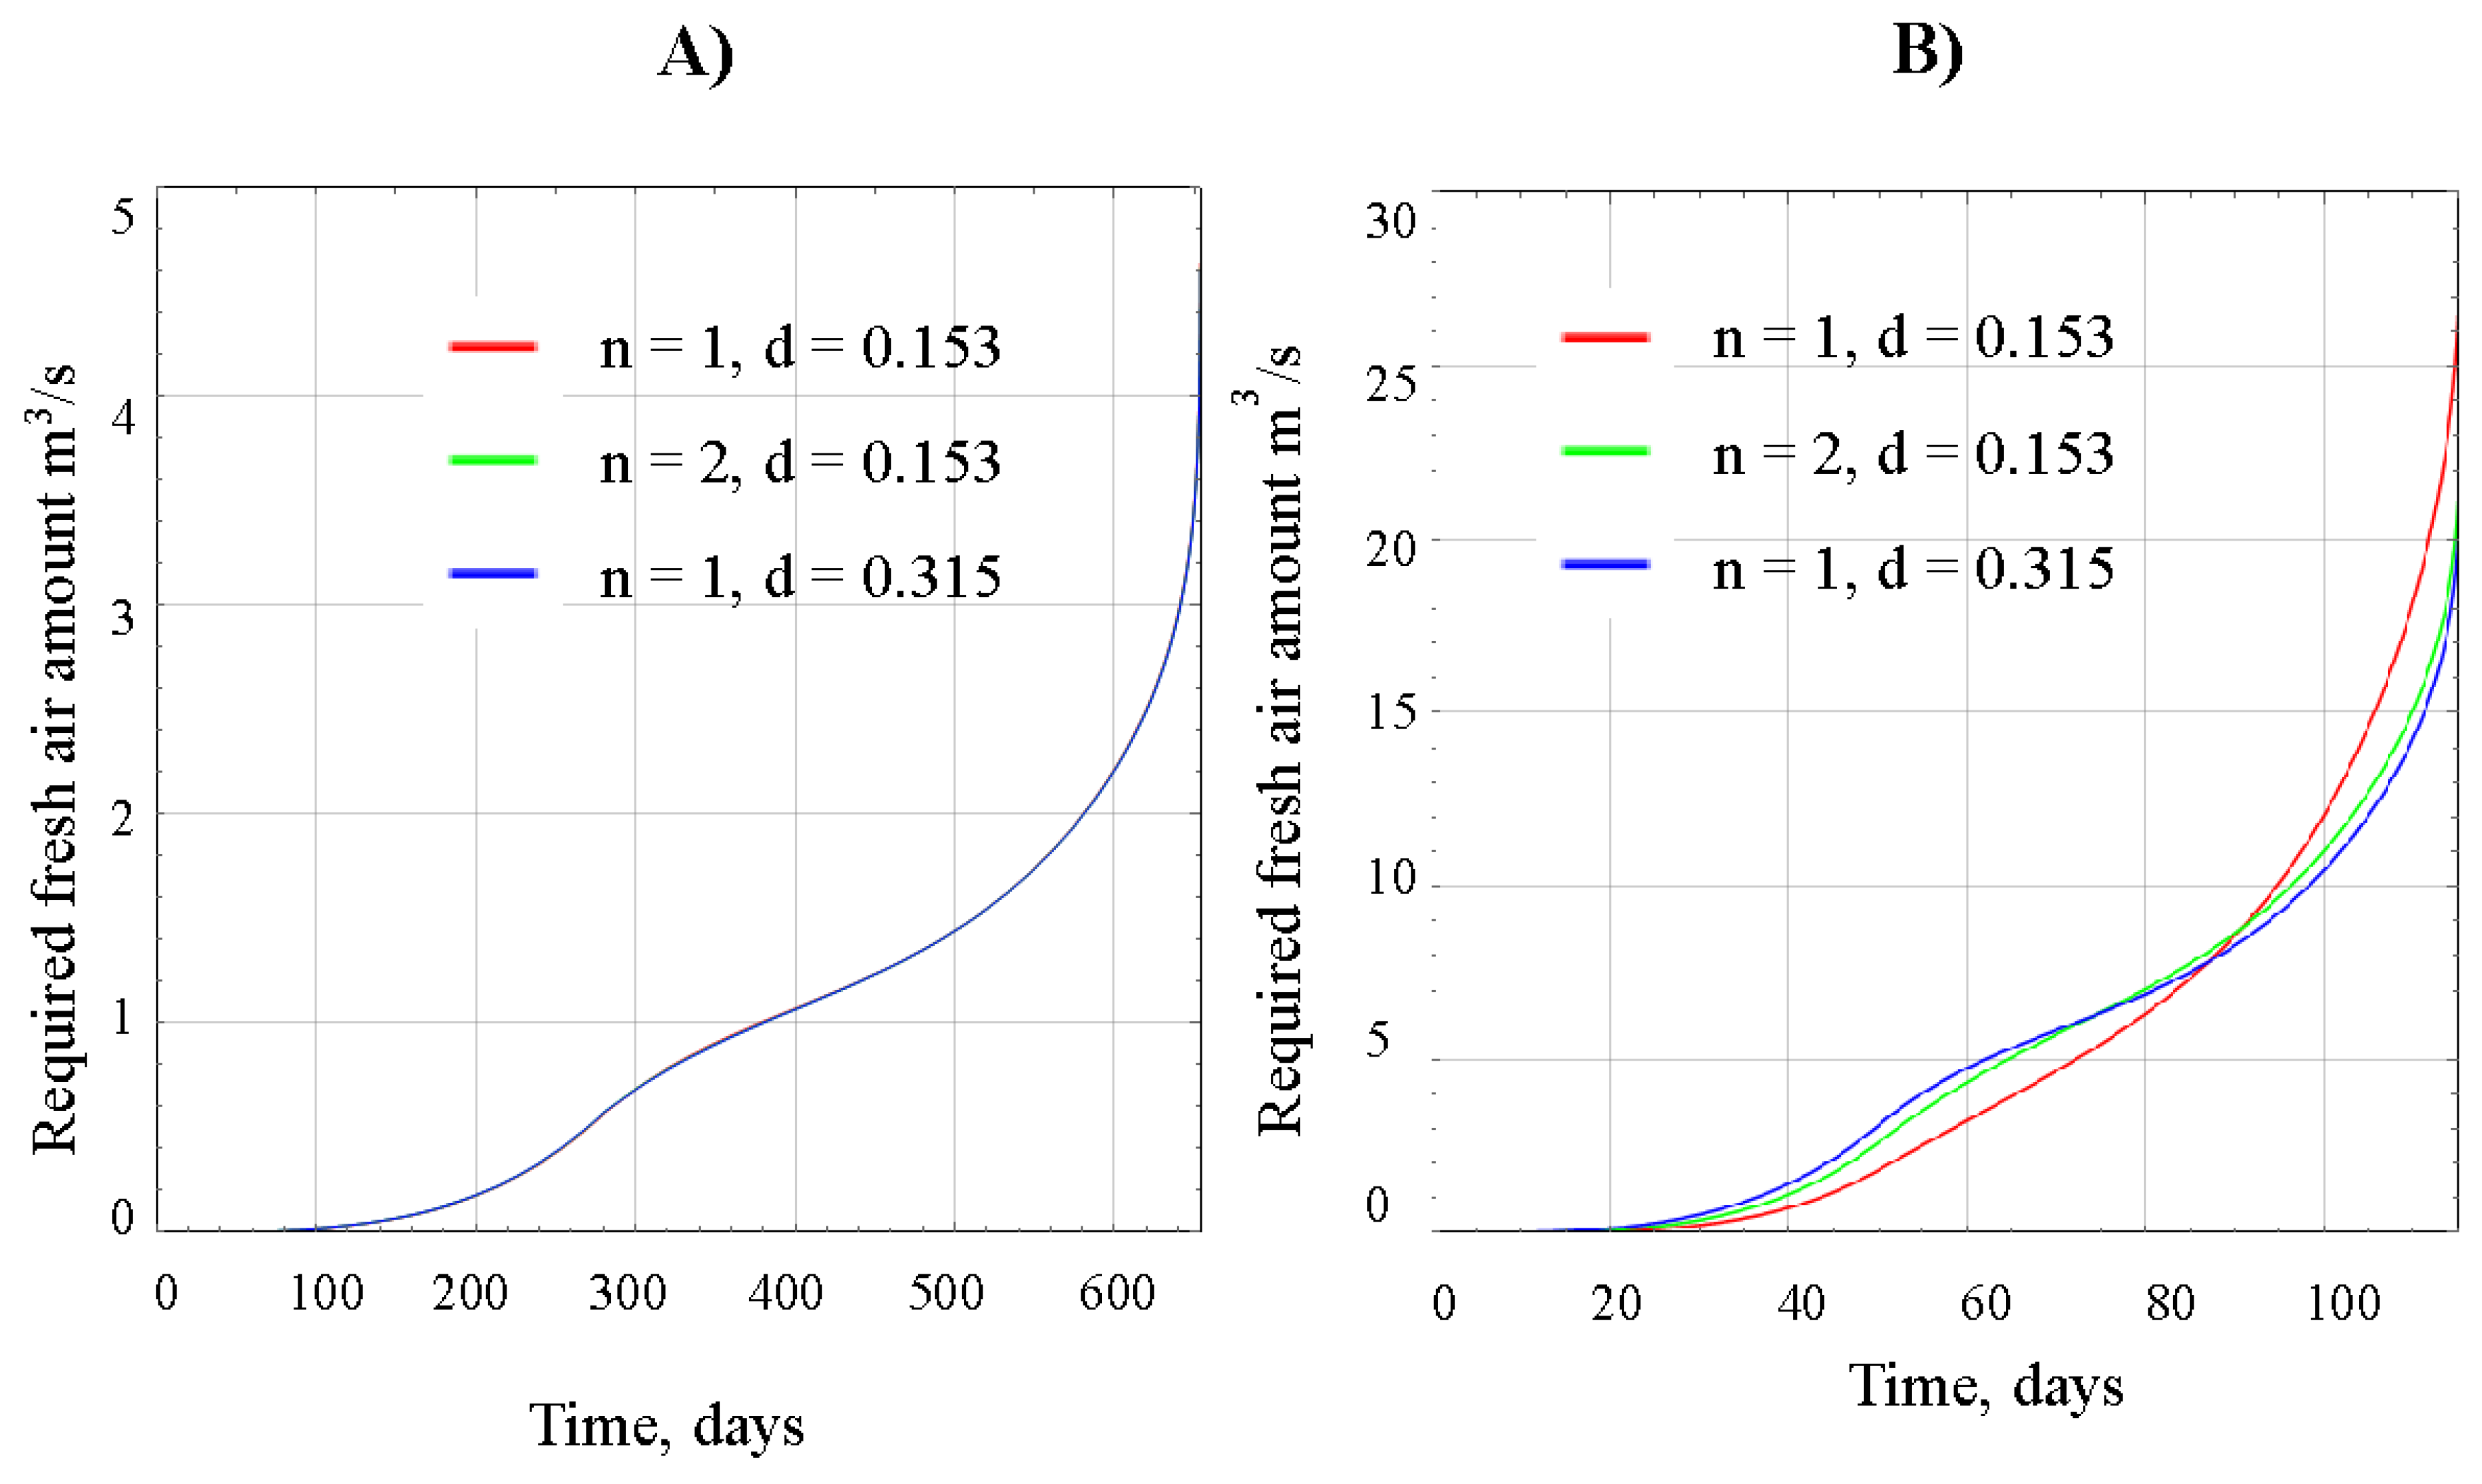
Figure 10 illustrates the results of calculating the required amount of fresh air to dilute combustible gases below the threshold limit value for both scenario 1 and scenario 2. In scenario 1, the required flow rate curve remains consistent regardless of the method of releasing the gas-air mixture and the layout of degassing pipelines outlined in the technical design for section closure. Therefore,
Figure 10A depicts a single curve of the required flow rate versus time. However, in scenario 2, the intersection of the time dependence curves of the required amount of air in
Figure 10B reflects different dynamics in the increase of the gas-air mixture flow rate at the pipeline outlet for various pipeline layout versions (refer to
Figure 8 for details).
The calculations result for both scenarios of the mine section closure are summarized in the
Table 1.
According to the obtained modeling results, in any scenario of flooding the decommissioned section of the mine, there is a possibility that a potentially explosive mixture of combustible gases will eventually escape from the worked-out area through the degassing pipeline and mix with fresh air flowing along the main return airways. Therefore, it is recommended to monitor the parameters of the gas-air mixture, such as flair velocity and concentration of combustible gases, both at the outlet of the degassing pipeline and in the main return airways, both before and after the uncontaminated air is mixed with the gas-air mixture.
Monitoring the parameters of the gas-air mixture can be achieved by employing an automated monitoring system. This system incorporates sensors for measuring air velocity and methane concentration. The collected data from these sensors is then transmitted to a control room computer located on the surface. If the system detects an exceeding of the maximum permissible concentration, an appropriate warning will be issued.
To prevent the accumulation of combustible gases in the existing mine airways, where their concentrations exceed the maximum permissible level, a separate measured should be implemented for the mine ventilation system. The return airways, into which the gas-air mixture will be released from the worked-out space of the flooded section, should receive a supply of fresh air with zero concentrations of combustible gases. Additionally, it is crucial to ensure that the gas-air mixture moving along the main return airways is effectively removed from the outgoing flow, eliminating the possibility of its recirculation and re-entry into the working areas of the mine.
