
Submitted:
01 May 2024
Posted:
10 May 2024
You are already at the latest version
Abstract
Background: Galectins are innate immune system regulators, associated with disease progression in cancer. This paper aims to investigate the correlation between mutated cancer-critical genes and galectin levels in breast cancer patients to determine whether galectins and genetic profiles can be used as biomarkers for disease and potential therapy targets. Materials and Methodology: Prisma Health Cancer Institute’s Biorepository provided seventy-one breast cancer patient samples, including all four stages as well as major molecular subtypes and histologies of breast cancer. Hotspot mutation statuses of cancer-critical genes were determined using multiplex PCR in tumor samples from the same patients by Precision Genetics and the University of South Carolina Functional Genomics Core Facility. The galectin levels of patients’ sera were analyzed using enzyme-linked immunosorbent assay (ELISA) to measure the concentrations of galectins-1, -3, and -9. Analysis was performed using JMP software to compare mean and median serum galectin levels between samples with and without specific cancer-critical genes including pooled t-test, Wilcoxon test, ANOVA, Tukey’s range test, and Steel Dwass Method (α=0.05). Results: Our analysis indicates that KIT mutations correlate with elevated serum levels of galectin-1 and -9 in patients with breast cancer. In patients with Luminal A subtype, FLT3 mutation correlates with lower serum galectin-1 and -9 levels and TP53 mutations correlate with higher serum galectin-3 levels. Patients with invasive ductal carcinoma had significantly higher serum galectin-3 levels than patients with ductal carcinoma in situ. Patients with both TP53 and PIK3CA mutations exhibit elevated serum galectin-3 levels, while patients with one or neither mutation show no significant difference in serum galectin-3 levels. In addition, metastatic breast cancer samples were more likely to have KIT or PIK3CA mutation compared to primary breast cancer samples. Conclusion: The relationship between genetic mutations and galectin levels has the potential to identify appropriate candidates for combined therapy, targeting genetic mutations and galectins. Further understanding of the effect of genetic mutations and galectin levels on cancer progression and metastasis could aid in the search for biomarkers for breast cancer diagnosis, disease progression, and prognosis.
Keywords:
Breast Cancer
; Genomics
; Genetic Mutation
; Biomarker
; Galectins
; Metastasis
1. Introduction
Breast cancer is one of the most prevalent cancers worldwide. In 2020, it was estimated that 2.3 million women were diagnosed with breast cancer and caused 685,000 deaths worldwide [1]. While certain factors including biological sex, age, and family history of breast cancer increase the risk of breast cancer, there are also numerous genetic mutations associated with breast cancer. Mutations in BRCA1 and BRCA2 are observed in approximately 25% of breast cancer cases [2]. Other high-penetrance genes that are predisposing to breast cancer include PTEN, TP53, CDH1, and STK11, though mutations in these genes are more rare compared to BRCA1 and BRCA2. There are also multiple DNA repair genes that interact with the BRCA genes such as ATM, CHEK2, and BRIP1 that further increase the risk of breast cancer when mutated. For instance, CHEK2 is a protein kinase and G2 cell cycle regulator, that stabilizes p53 when DNA damage occurs and interacts with BRCA1. The 1100delC mutation in CHEK2 has been found to increase the risk of breast cancer two-fold in women and ten-fold in men. Many of the mutated genes analyzed in this study including KIT, MET, and FLT3 play a role in the receptor tyrosine kinase (RTK) and RAS pathway. Most RTKs possess a heavily glycosylated extracellular N-terminal binding site and an intracellular tyrosine kinase domain [3]. These kinases can activate upon interactions with multiple different types of ligands, including galectins. Often in cancer, mutations of genes encoding RTKs result in a gain of function, thereby facilitating cell proliferation, differentiation, and migration [4].
The most common treatment options for breast cancer include surgery, radiation, and chemotherapy drugs such as anthracyclines, taxanes, and alkylating agents [5]. Current strategies for personalized treatments are based on the molecular subtype of breast cancer, Luminal A, B, HER2, and Triple Negative (TNBC), and its expression of Hormone Receptor (HR). For instance, trastuzumab is an antibody that targets HER2 receptors, however, this drug would not be effective against TNBC. Therapies against TNBC must target other tumor markers such as VEGF with bevacizumab or EGFR with cetuximab. Since many of these drugs are broad-acting, damaging healthy cells in the process and causing various adverse effects, it is desired to develop therapies that are capable of targeting cancer cells. One such target that has gained attention in research is galectins.
Galectins are a family of soluble proteins that are expressed across various cell types and participate in numerous cellular processes including regulation of cell growth, apoptosis, cell migration, and immune evasion for tumors [6]. For instance, galectin-1 has been shown to increase the frequency of Foxp3+ Treg cells in the microenvironment of breast cancer cells, contributing to tumor evasion of the immune system [7]. Similarly, another study found Gal-1 to interact strongly with N-glycosylated neuropilin-1 on PDGFR and TGF-R. This induced TGF- and PDGF signaling, promoting migration and activation of hepatic stellate cells [8]. Looking at other galectins, galectin-3 has demonstrated the ability to prevent nitric oxide-induced apoptosis in human breast carcinoma cells [9]. Zhang et al. found that galectin-3 knockdown breast cancer cells treated with the apoptotic inducer arsenic trioxide increased its apoptotic effects compared to galectin-3 positive breast cancer cells; demonstrating the role of galectin-3 in inhibiting apoptosis [10]. Additionally, galectin-3 can disrupt N-cadherin cell-cell junctions, demonstrating a mechanism for galectin-3 to promote tumor cell motility and metastasis [11]. Galectin-9 is peculiar in that studies demonstrate its ability to act as a tumor-promoting and anti-tumor protein. Morishita et al. demonstrated the ability of galectin-9 to promote apoptosis in colon cancer, which they suspected is through increased phosphorylation of the RTKs ALK, DDR1, and EphA10 [12]. Meanwhile, galectin-9 has also been shown to bind to Tim-3, a cell surface molecule on Th1 cells that suppresses their immune functions and induces apoptosis [13]. Considering the variety of galectins and their numerous processes in promoting cancer development, the concept of galectin inhibitors sparks interest as a potential therapy.
The development of galectin inhibitors began decades ago when the role of galectins in cancer progression and tumor development was discovered. There are currently two main types of galectin inhibitors in trials: carbohydrate-based and non-carbohydrate-based [14]. Thiodigalactoside, a carbohydrate-based galectin-1 inhibitor, has been shown to prevent angiogenesis and tumor growth while preventing metastasis and inducing apoptosis of tumor cells in breast cancer samples in tumor mouse models [15]. Anginex is a peptide-based galectin-1 inhibitor that shows promising evidence for inhibiting tumor growth, proliferation, and angiogenesis [16]. Modified citrus pectin is a carbohydrate-based galectin-3 inhibitor that has also shown antimetastatic properties as well as promise in inhibiting tumor growth and restoring T-cell surveillance [17]. Many studies and early-phase clinical trials are investigating the efficacy of galectin inhibitors with and without other chemotherapies or monoclonal antibodies. These include gene-specific targeted therapies, which have been in practice since the development of imatinib to target BCR-ABL in 2001. FDA-approved therapies specific to breast cancer include Olaparib, which targets ATM, BRCA1/2, and CHEK2 mutations, as well as alpelisib, which targets PIK3CA mutations [18]. In a phase I trial, GM-CT-01, a galectin-1 and -3 inhibitor, is being tested with and without 5-fluorouracil in patients with advanced-stage solid tumor cancers, including breast cancer to study the effects of galectin inhibitors on disease progression and their ability to improve chemotherapy response in patients who have not responded well to previous treatments [19]. Another study found that combining a galectin-9 inhibitor with AZD1930, an ATM inhibitor, led to decreased tumor growth and significantly longer survival for mouse models [20]. In addition, genetic profiles of cancer patients are commonly used to guide chemotherapy decisions based on inherent risk and prognosis associated with specific mutations.
With the increasing interest in galectins as a target in cancer therapy, this paper seeks to explore the relationship between cancer-driving mutations in breast cancer patients and serum galectin levels. Additionally, tumor characteristics including stage and metastasis were analyzed in relation to galectin levels and mutations. The results of our research could provide new insights into the correlations between specific breast cancer mutations and certain galectins. As galectin inhibitors are employed in conjunction with existing therapies, understanding the relationships between certain mutations and galectins could help produce more personalized therapeutic regimens that improve responsiveness and patient outcomes. Additionally, the correlation between specific genetic mutations and galectin levels will provide crucial insights into ideal candidates for galectin-modulated therapies.
2. Materials and Methods
2.1. PRISMA Biorepository
Seventy-one Breast Cancer Patient Samples were obtained from PRISMA Health Cancer Institute’s Biorepository (PHCI) based on specimen and gene panel availability. All patient samples are serum samples and patients signed a consent form when the tissue was procured. Patient sample data is included in the Supplementary Materials section.
Thirty-six of the samples were obtained from patients with the Luminal A subtype (50.7%), nine were from patients with the Luminal B subtype (12.7%), six were from patients with the Luminal A HER2 Hybrid subtype (8.5%), two were from patients with the Luminal B HER2 Hybrid subtype (2.8%), two were from the HER2 Positive subtype (2.8%), twelve were from patients with the Triple Negative subtype (16.9%), and the molecular subtypes of four patients were unknown (5.6%).
Twenty-four of the samples were from patients with breast cancer classified as stage I (33.8%), twenty-eight of the samples were from patients with breast cancer classified as stage II (39.4%), thirteen of the samples were from patients with breast cancer classified as stage III (18.3%), and six of the samples were from patients with breast cancer classified as stage IV (8.45%). Fifty-nine of the samples were from patients with primary breast cancer (83.1%), eight of the samples were from patients with metastatic breast cancer (11.3%), and four of the samples were from patients with recurrent breast cancer (5.6%).
2.2. ELISA for Galectin Profiling
The galectin levels of patients’ sera were analyzed using enzyme-linked immunoabsorbent assay (ELISA). ELISA kits from R&D systems (Minneapolis, MN, USA) were used to measure the concentrations of galectins-1, -3, and -9. The serum concentrations of galectins-1 and -3 were effectively obtained in all seventy-one samples and the serum concentration of galectin-9 was obtained in fifty samples.
2.3. HotSpot Panel for Cancer-Critical Genetic Mutations
Genetic Mutation Data for 65 samples was obtained by Precision Genetics as described in "KIT Mutations Correlate with Higher Galectin Levels and Metastasis in Breast and Non-Small Cell Lung Cancer" [21].
Data for an additional six samples was obtained by University of South Carolina College of Pharmacy Functional Genomics Core Facility. Genomics DNA had been purified from frozen tumor samples with QIAGEN DNA Blood & Tissue Kit (#69506, QIAGEN, Carlsbad, CA), Genomics DNA from FFPE tumor samples had been purified with Quick-DNA FFPE MiniPrep Kit (D3067, Zymo Research, Irvine, CA). Cancer hot-spot mutation regions were amplified with CleanPlex OncoZoom Cancer Hot-spot Panel (SKU:916001 Paragon Genomics, Hayward, CA). The panel includes 601 amplicons, covering 65 genes.
The amplicons were sequenced with Illumina Novoseq 6000 in a partial lane of the S4 flow cell, PE150, with a sequencing depth of 2 million reads per sample. The sequences had been aligned to Paragon Genomics amplicons reference sequences and the variants were called with GATK pipeline (PMID: 25431634). The biologically and clinically relevant tumor-specific alternation had been determined with the Cancer Genome Interpreter (PMID: 29592813) and NCBI ClinVar database (PMID: 29165669)).
2.4. Data Analysis
JMP was used to generate statistical analyses. JMP is a software by the SAS Institute (Cary, NC, USA). Prism was used to generate the figures included in this paper. Prism is a part of GraphPad Software (Boston, MA, USA). The distributions of serum galectin levels of samples with specific genetic mutations were compared using a t-test for the difference of means. A Levene’s test for equality of variances was used to determine whether a pooled two-sample t-test, which assumes equal variances between the populations, or Welch’s test, which assumes unequal variances between populations, is more appropriate. For tests with small sample sizes (n<10), a Wilcoxon Rank Sum Test was performed to compare medians was performed because normality of residuals could not be assumed. For tests comparing more than two samples, ANOVA, Tukey’s Range Test, and Steel Dwass test were used for parametric and nonparametric comparisons. A p-value less than 0.05 was considered to be statistically significant.
3. Results
3.1. Data Statistic Summary
Table 1 demonstrates the baseline distribution of galectins-1, -3, and -9 for breast cancer patients in our sample.
3.2. Mutation Distribution
Table 2 shows the frequencies of mutations. Ten of the patient samples (14.1%) had zero cancer-critical mutations of the cancer-critical genes in our panel. Twenty-five of the patient samples (35.2%) had one mutated cancer-critical gene. Nineteen of the patient samples (26.8%) had two mutated cancer-critical genes. Twelve of the patient samples (16.9%) had three mutated cancer-critical genes. Three of the patient samples had four mutated cancer-critical genes (7.0%).
Some samples have multiple Hotspot mutations on the same cancer-critical gene. Because of this, the mutation count is higher than the sample count. Paired t-test results found no statistically significant difference between the different amino acid changes of a specific gene on the galectin-1, -3, and -9 levels. Because of this, only whether the gene was mutated or not in the patient sample was used for further statistical analyses.
3.3. Correlation between Galectins and Genetic Mutations
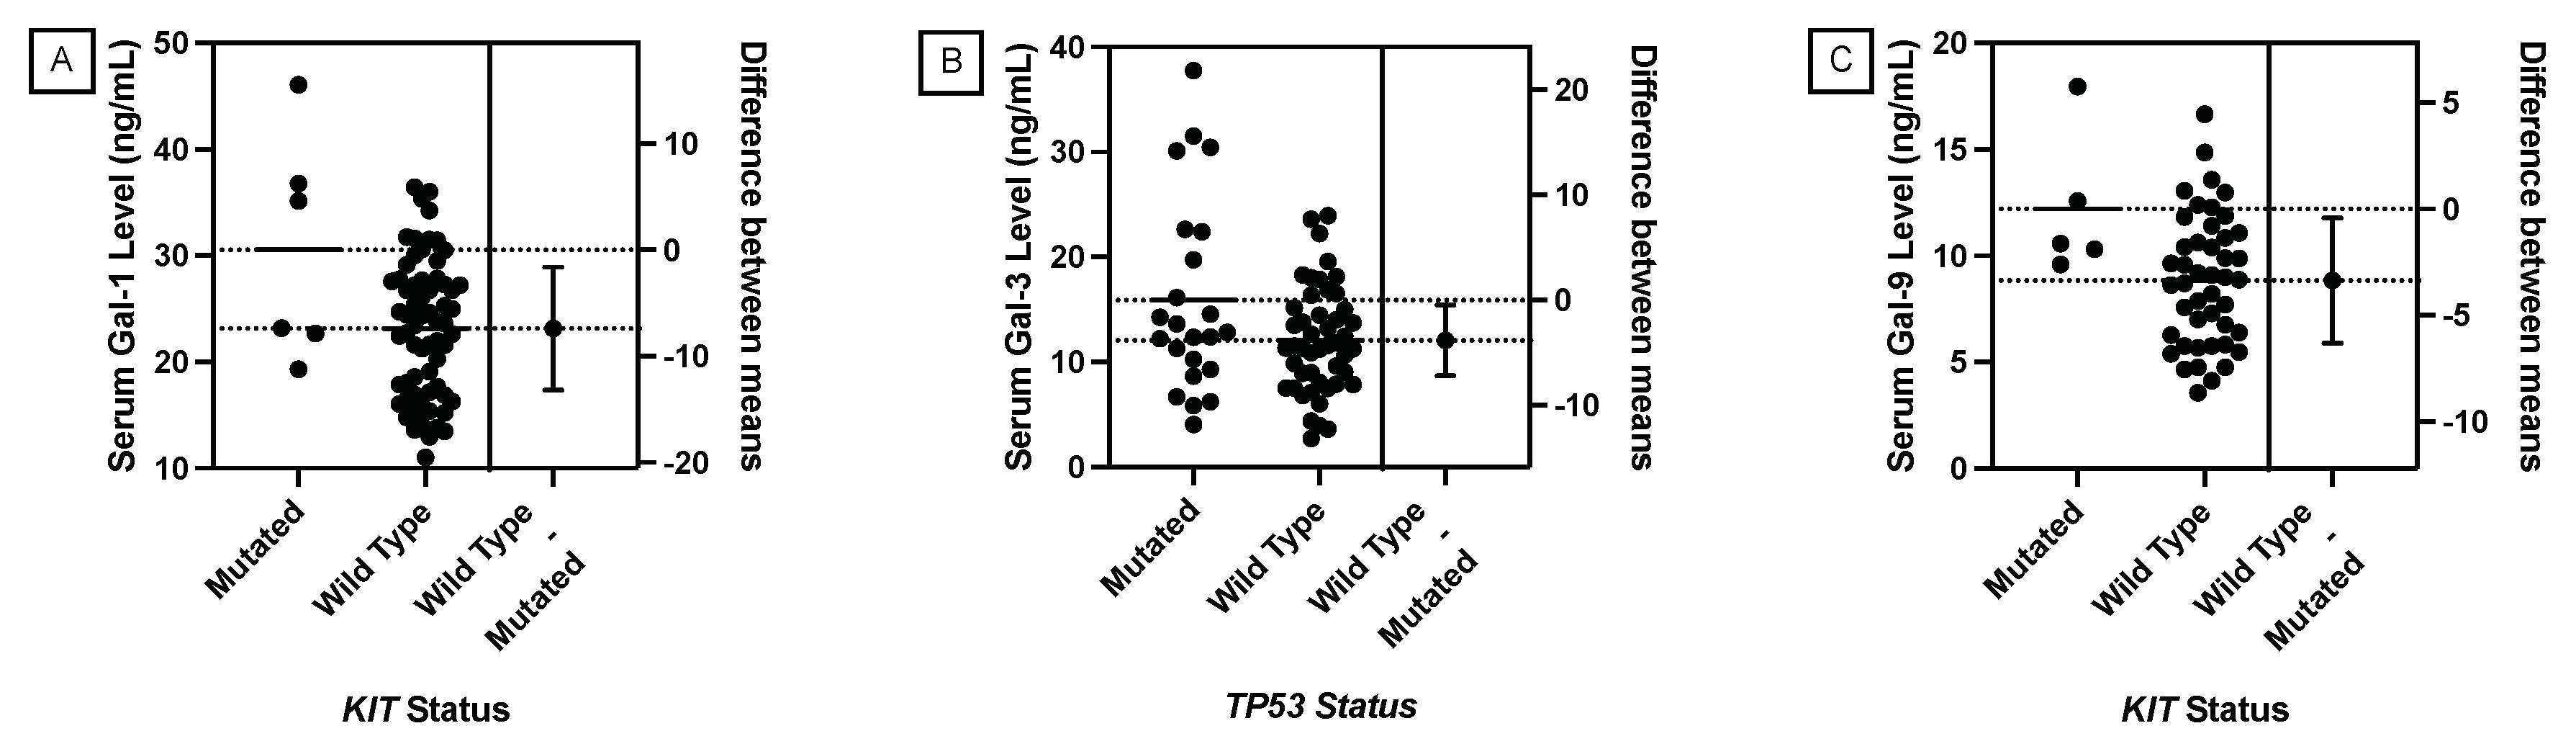
A pooled t-test was used to analyze the correlation between the presence of a mutation in specific cancer critical genes and serum galectin levels. Table 3 shows that the pooled t-tests performed supported a statistically significant correlation between a KIT Hotspot mutation and elevated galectin-1 and galectin-9 levels and a correlation between a TP53 Hotspot mutation and elevated galectin-3 levels.
Figure 1.
Comparison of means serum galectin levels of breast cancer patients. (A) Mean serum galectin-1 levels were significantly elevated in patients with a KIT mutation (p-value = 0.0131). (B) Mean serum galectin-3 levels were significantly elevated in patients with a TP53 mutation (p-value = 0.0267). (C) Mean serum galectin-9 levels were significantly elevated in patients with a KIT mutation (p-value = 0.0254).
3.3.1. KIT vs. Galectin-1 and Galectin-9
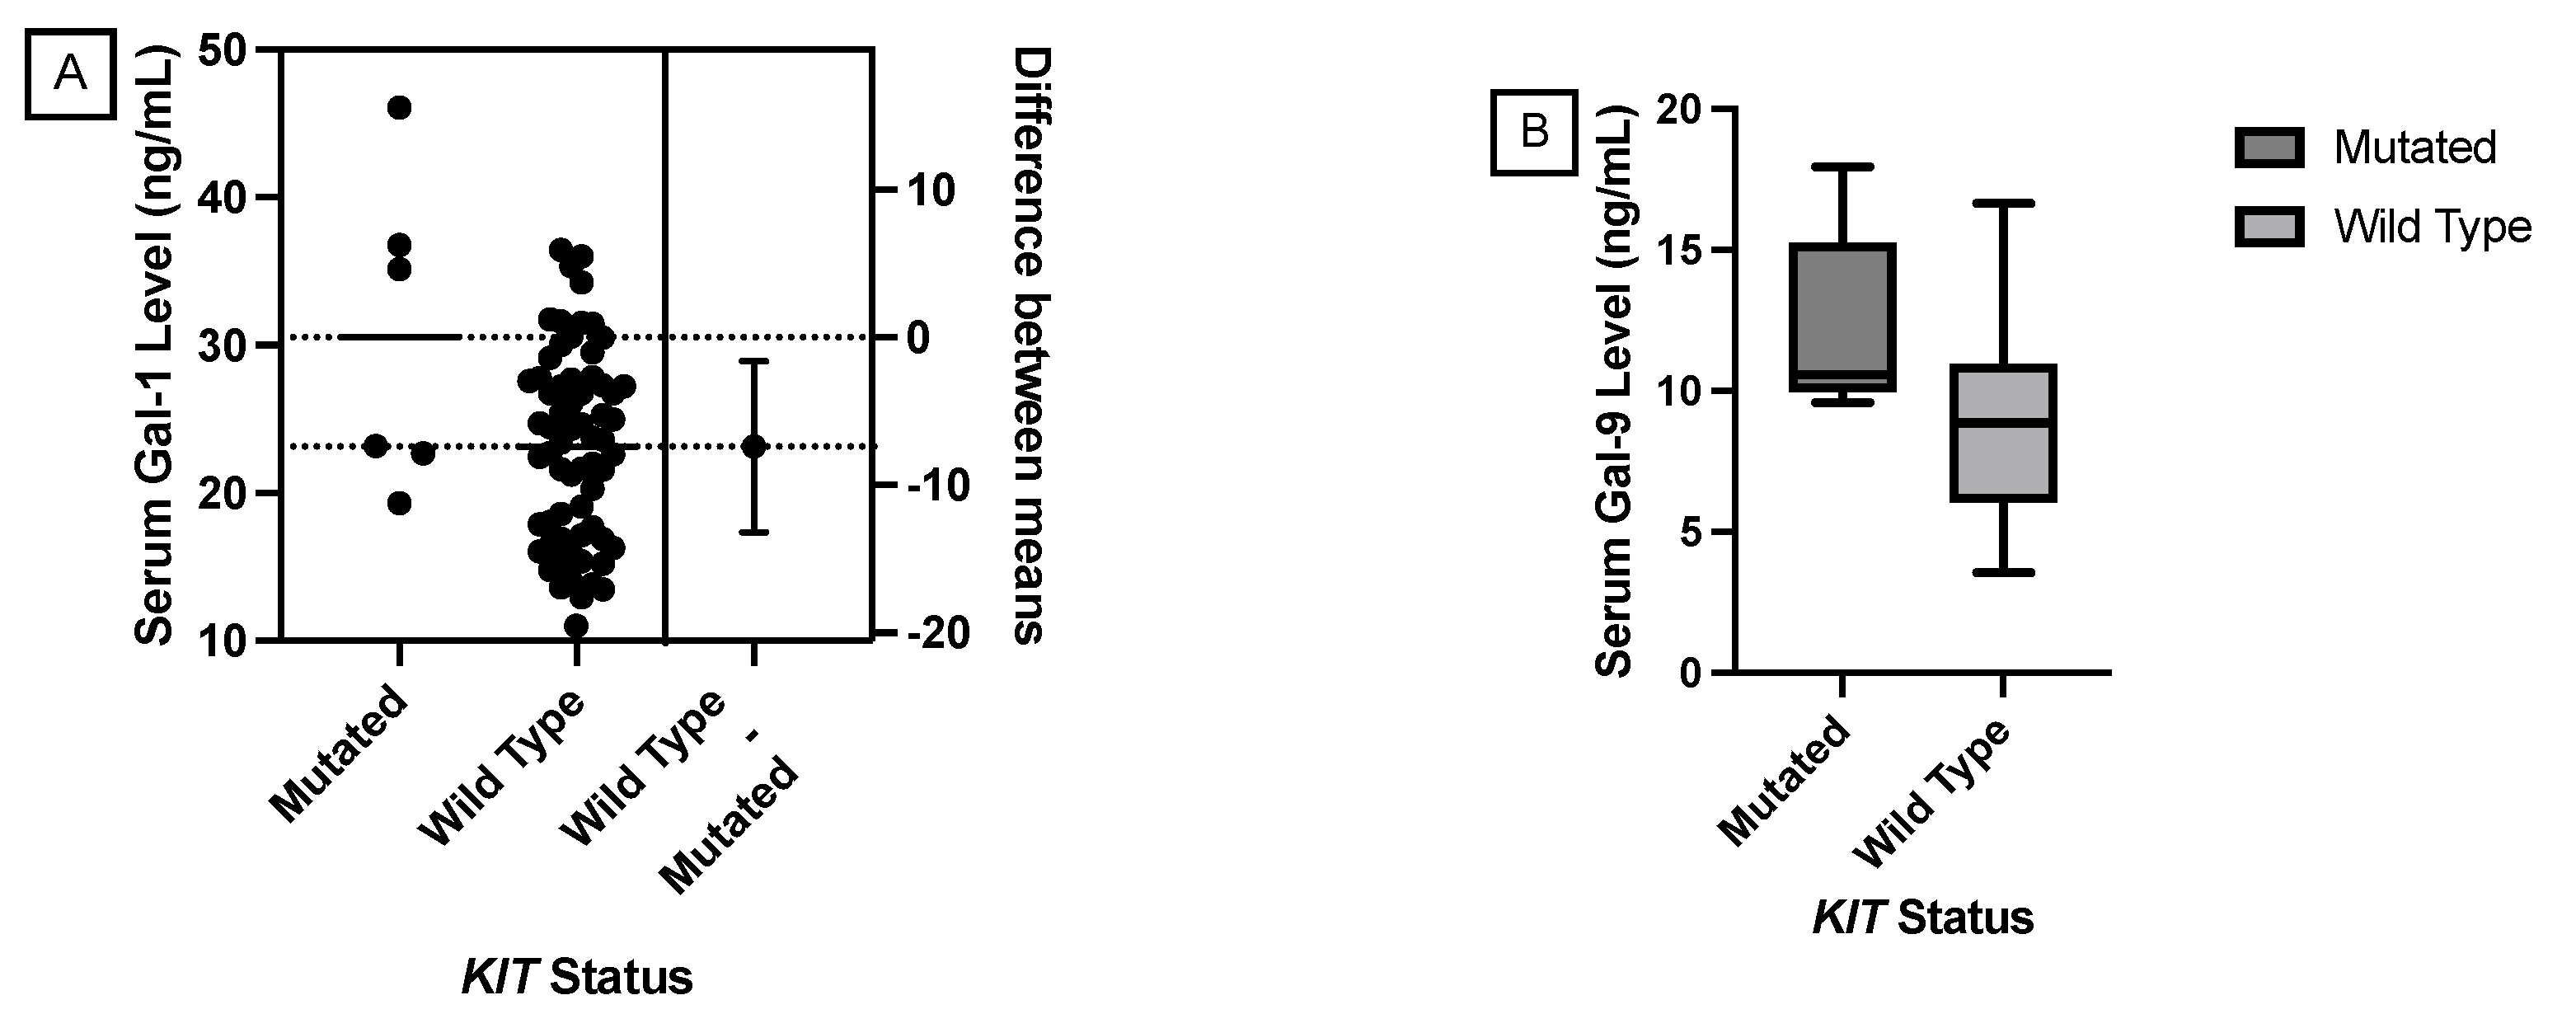
Statistically significant correlations were found between a mutated KIT gene and elevated galectin-1 and -9 levels using a pooled t-test. However, with a mutated sample size of six patients, a Wilcoxon Rank Sum Test to compare medians is more appropriate. The p-values between a mutated KIT gene and galectin-1 and -9 levels were 0.1003 and 0.0485 respectively. This nonparametric test supports the significance found in the pooled t-test between a mutated KIT gene and elevated galectin-9 levels.
Figure 3.
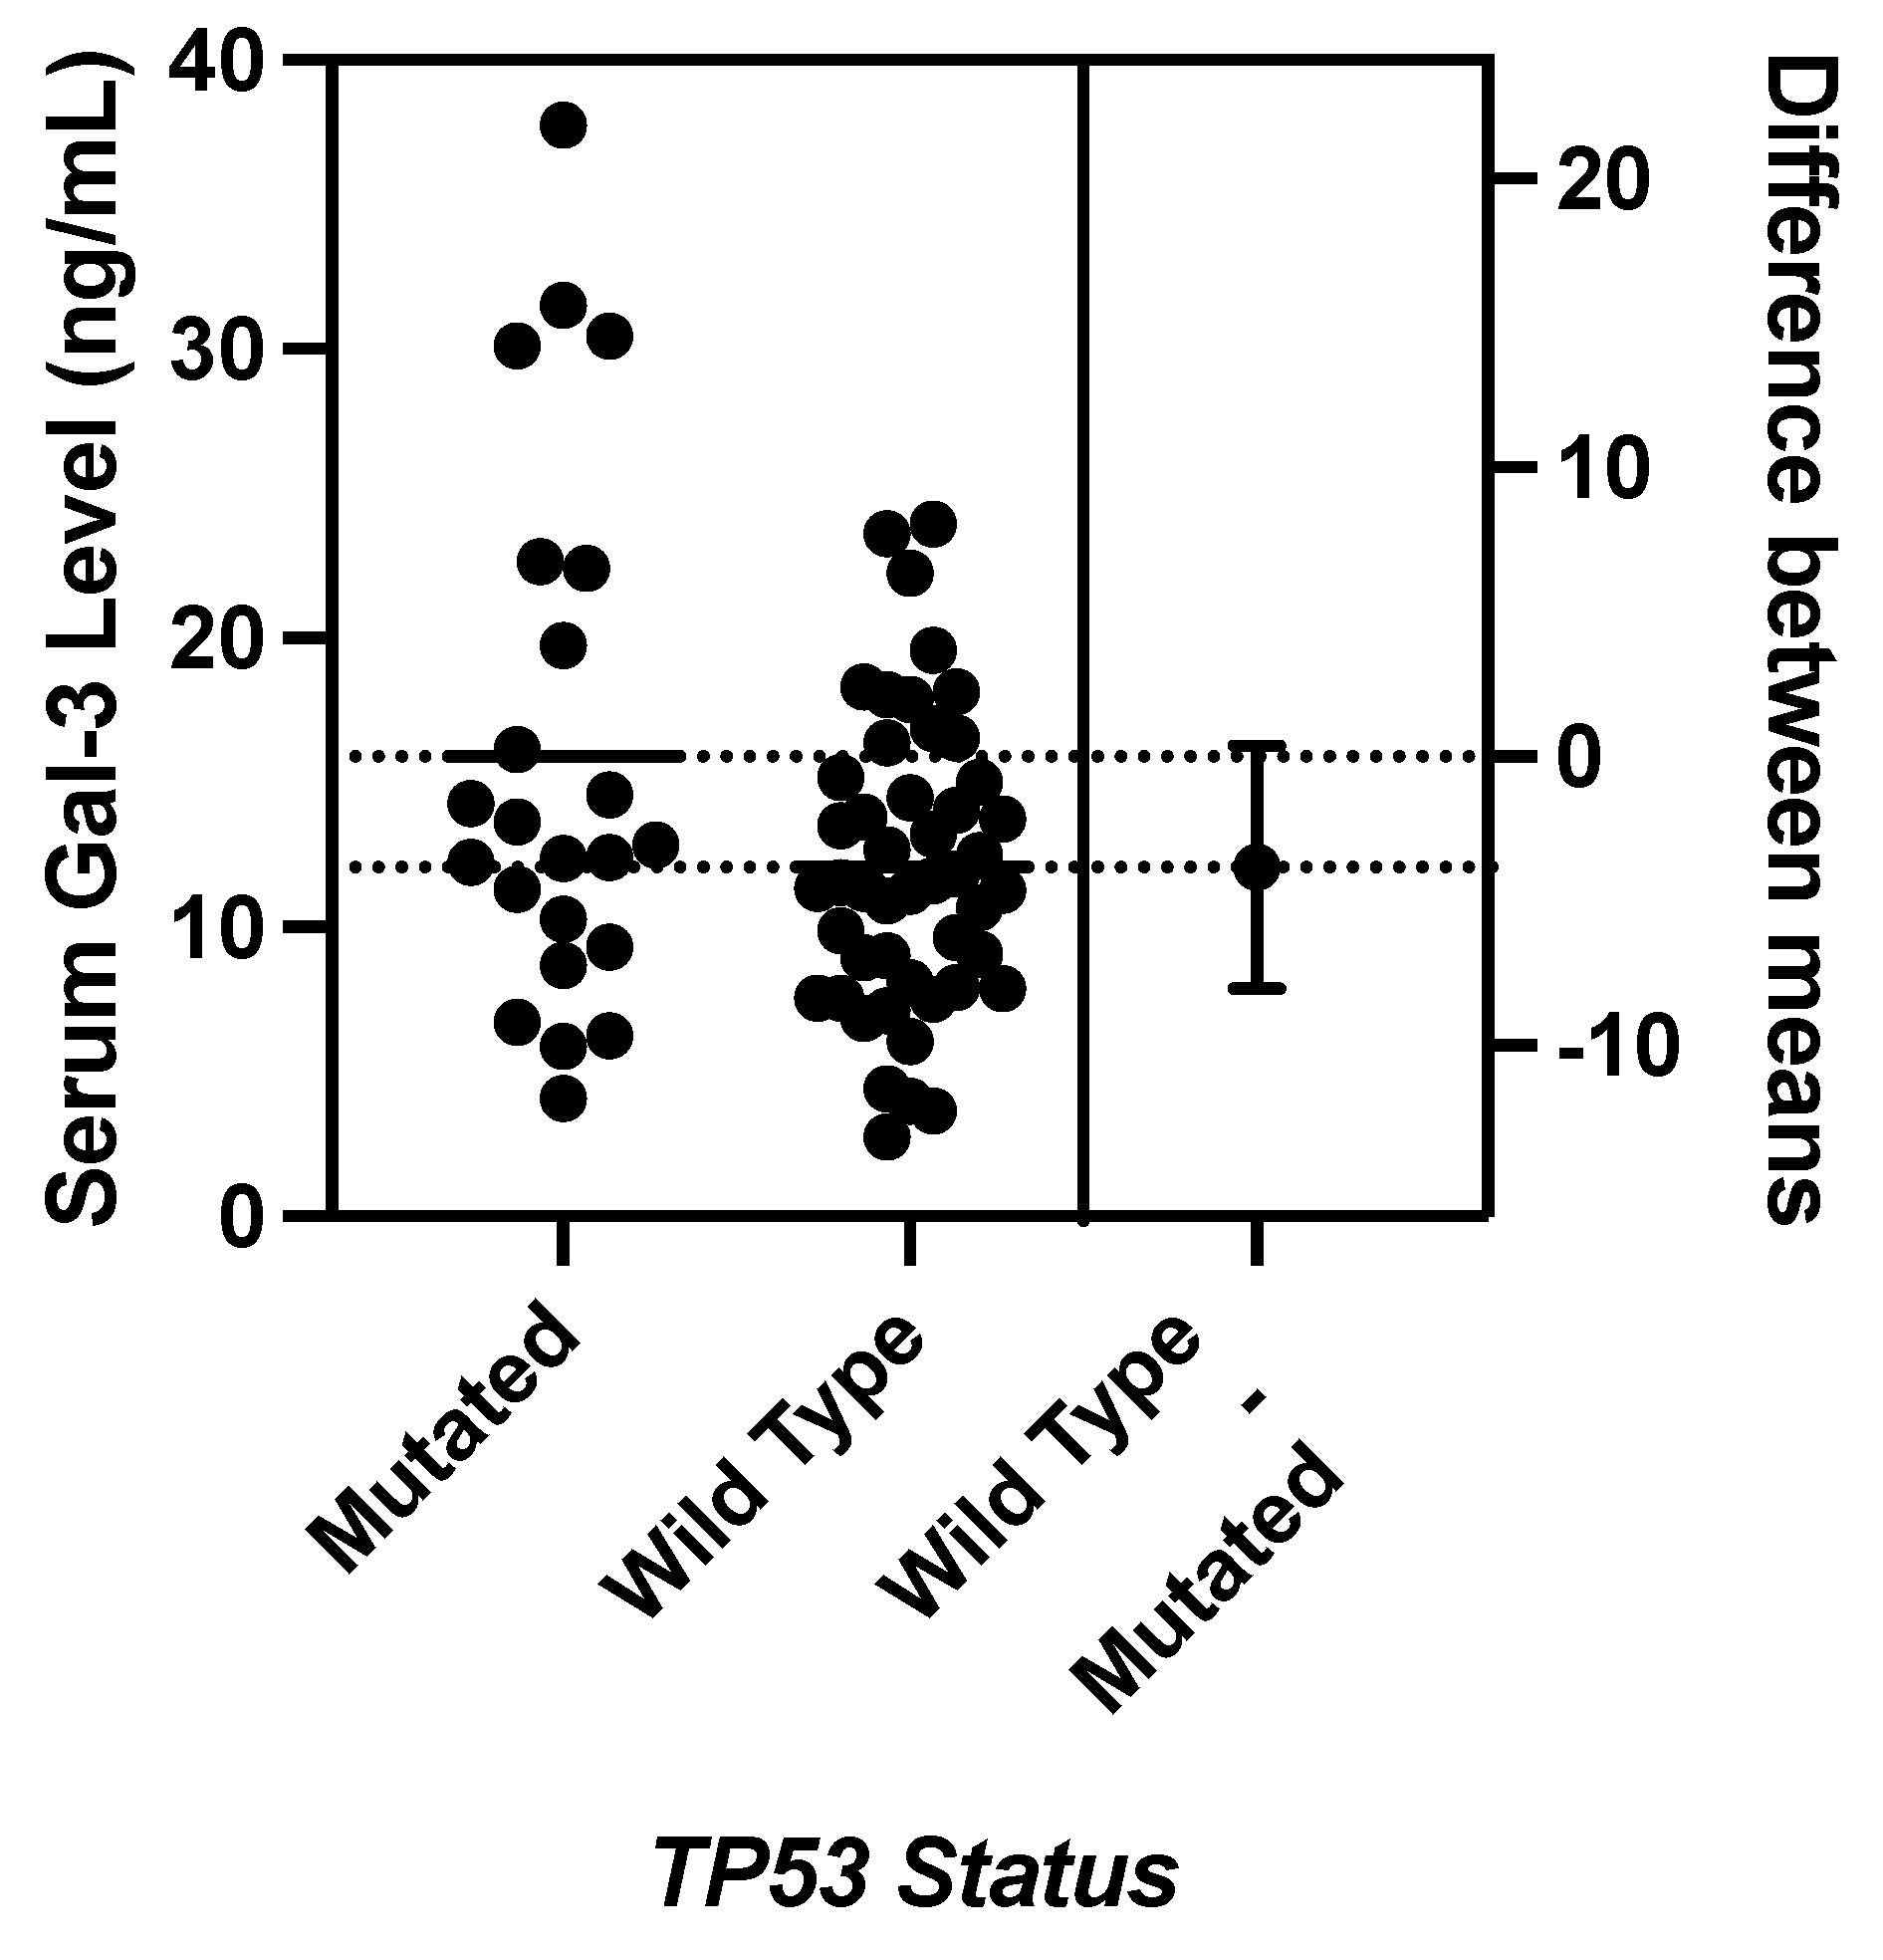
A Welch’s Test found no significant difference in mean serum galectin-3 levels between patients with and without a TP53 mutation (p-value = 0.0724)
Figure 3.
A Welch’s Test found no significant difference in mean serum galectin-3 levels between patients with and without a TP53 mutation (p-value = 0.0724)
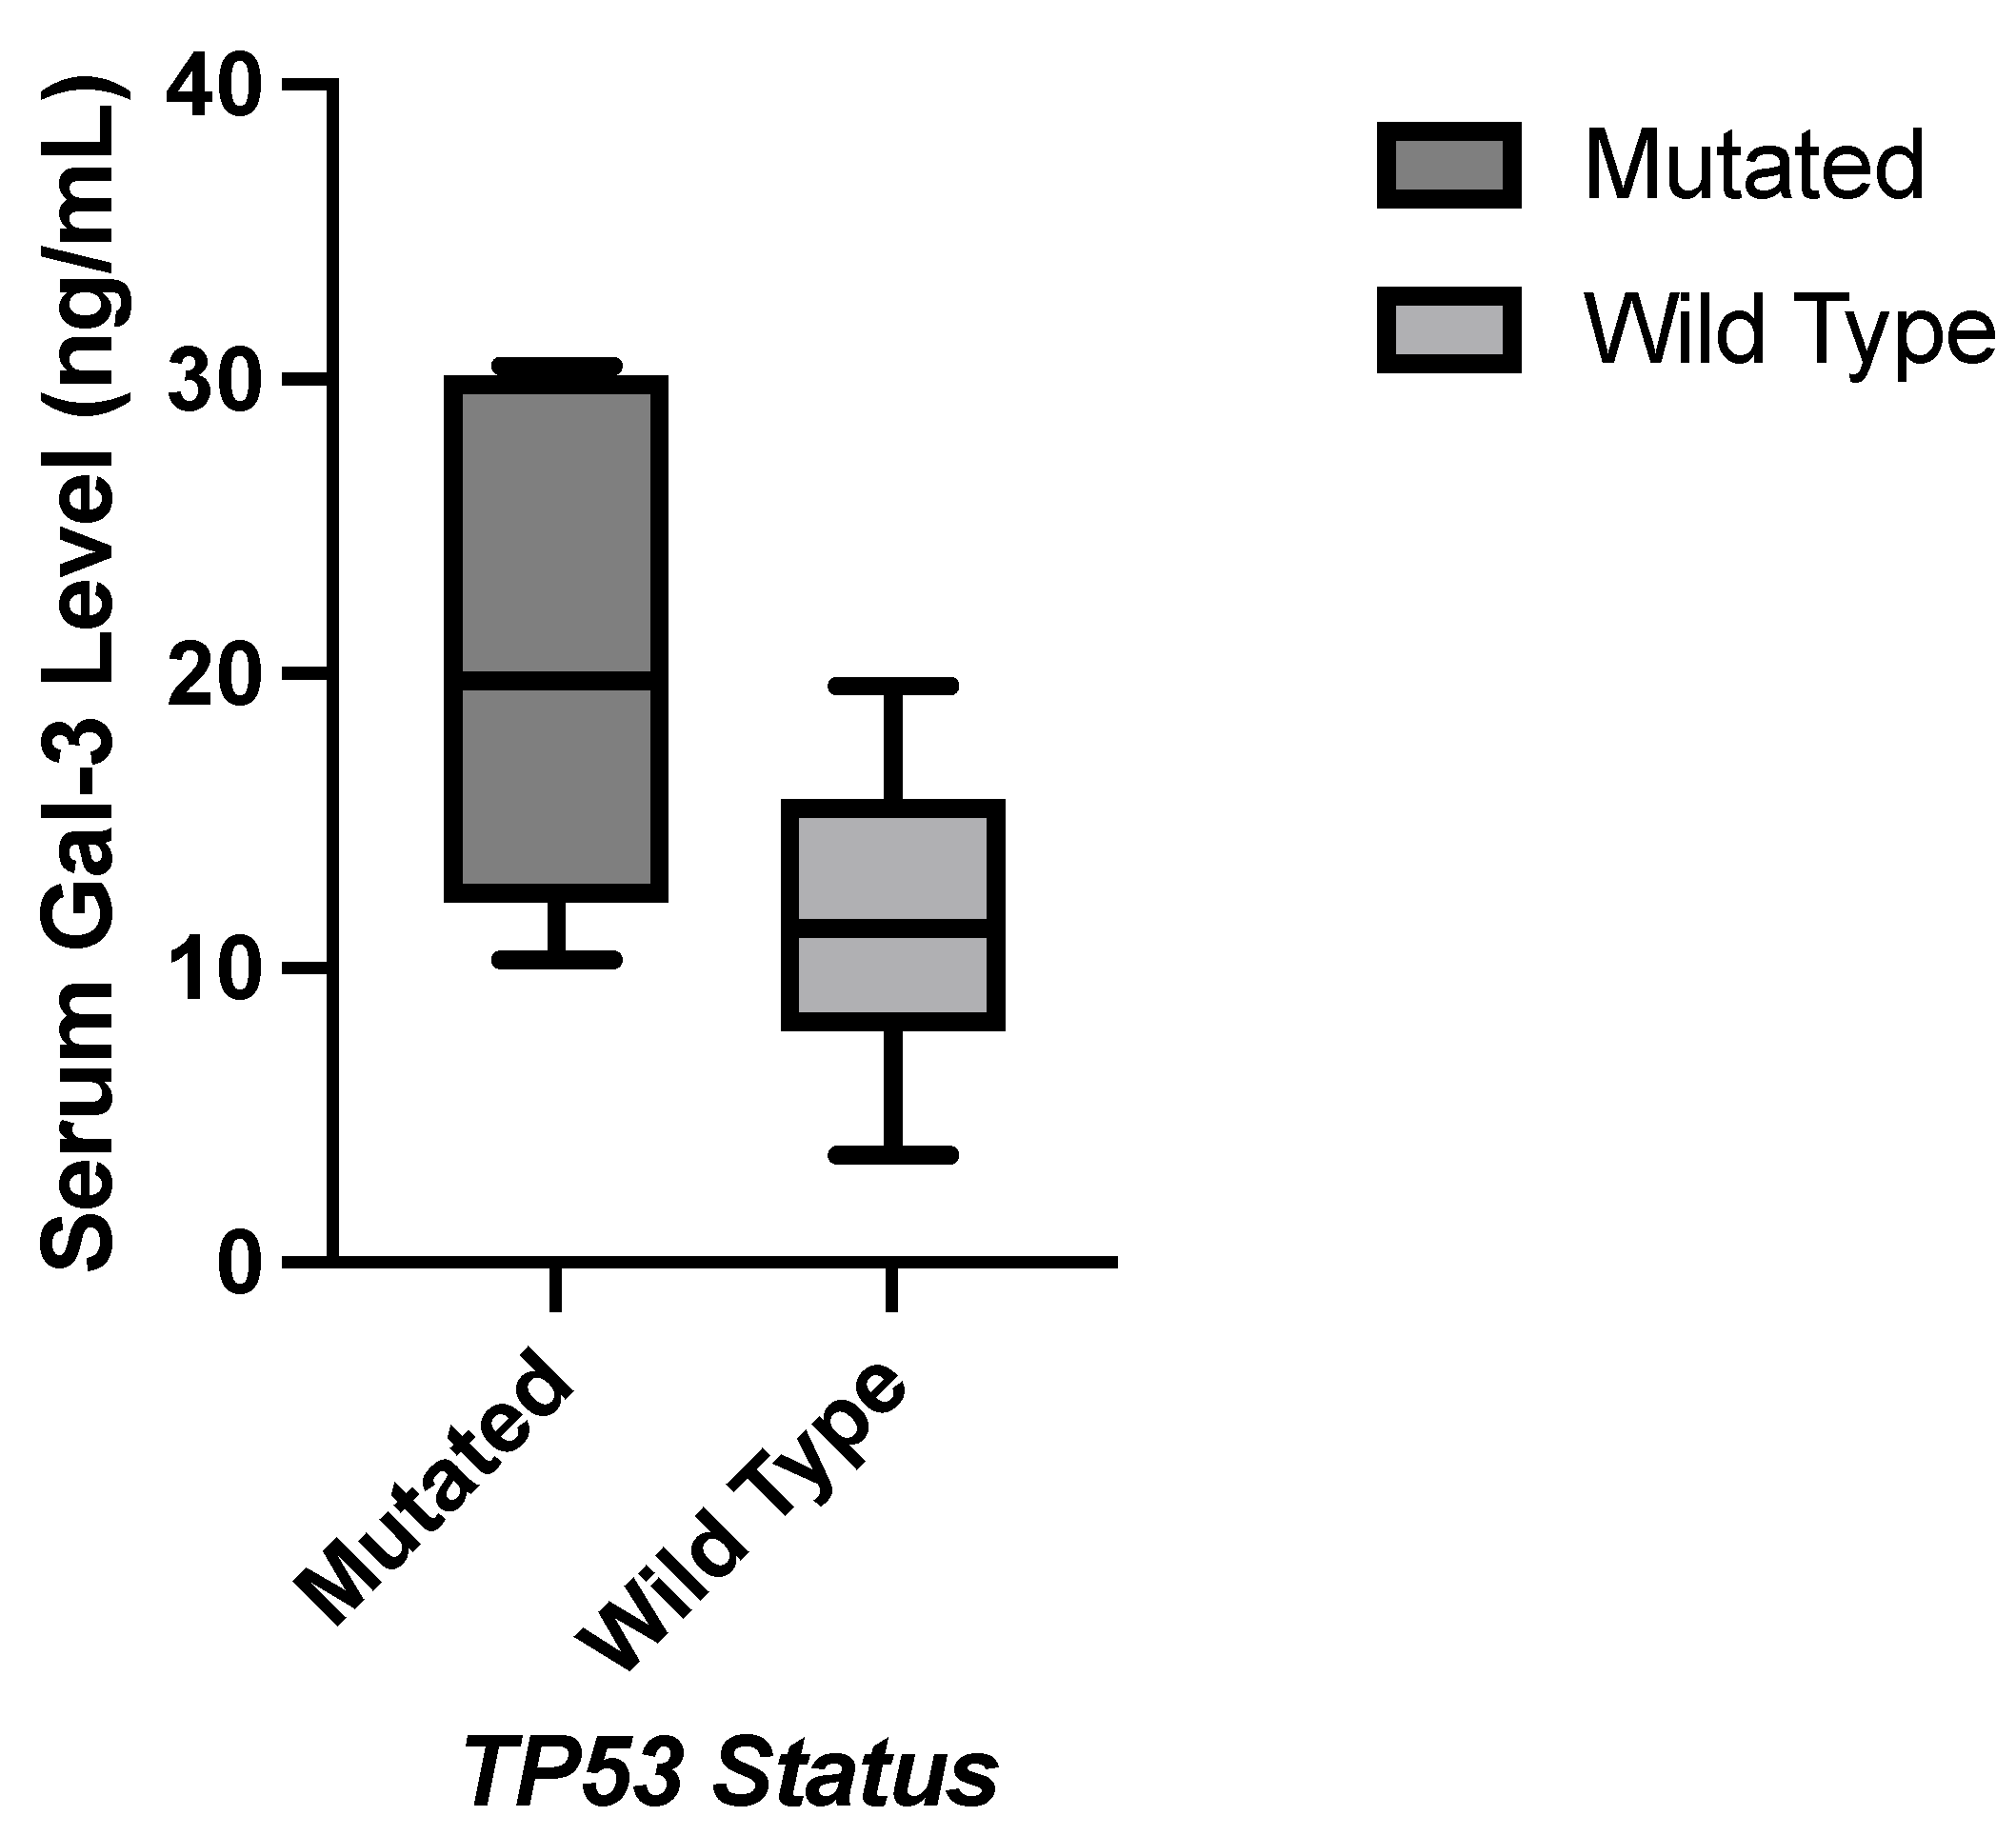
3.3.2. TP53 vs. Galectin-3
Statistically significant correlations were found between a mutated TP53 gene and elevated serum galectin-3 levels pooled t-test. A Levene’s Test for equality of variances was performed yielding a p-value of 0.0018, indicating significantly different variances between the samples with a mutated TP53 gene and the samples with a wild-type TP53 gene. Therefore, a Welch’s Test was performed yielding a p-value of 0.0724.
Figure 2.
Nonparametric comparison of serum galectin levels of breast cancer patients. (A) Serum galectin-1 levels were not significantly different between patients with and without a KIT mutation (p-value = 0.1003). (B) Serum galectin-9 levels were significantly elevated in patients with a KIT mutation (p-value = 0.0485).
3.4. Molecular Subtypes
Breast cancer molecular subtypes are based on the expression of hormone receptors such as estrogen and progesterone receptors, the presence of additional copies of the gene for human epidermal growth factor receptor 2 (HER2), and Ki-67 levels, which serves as a measurement of cellular proliferation [22]. The genes expressed by cancer cells determine the cancer’s molecular subtype, and how the cells behave during the course of the disease. Luminal A breast cancer is the most common subtype and is characterized as hormone receptor-positive and HER2-negative with low levels of Ki-67.
3.4.1. Luminal A
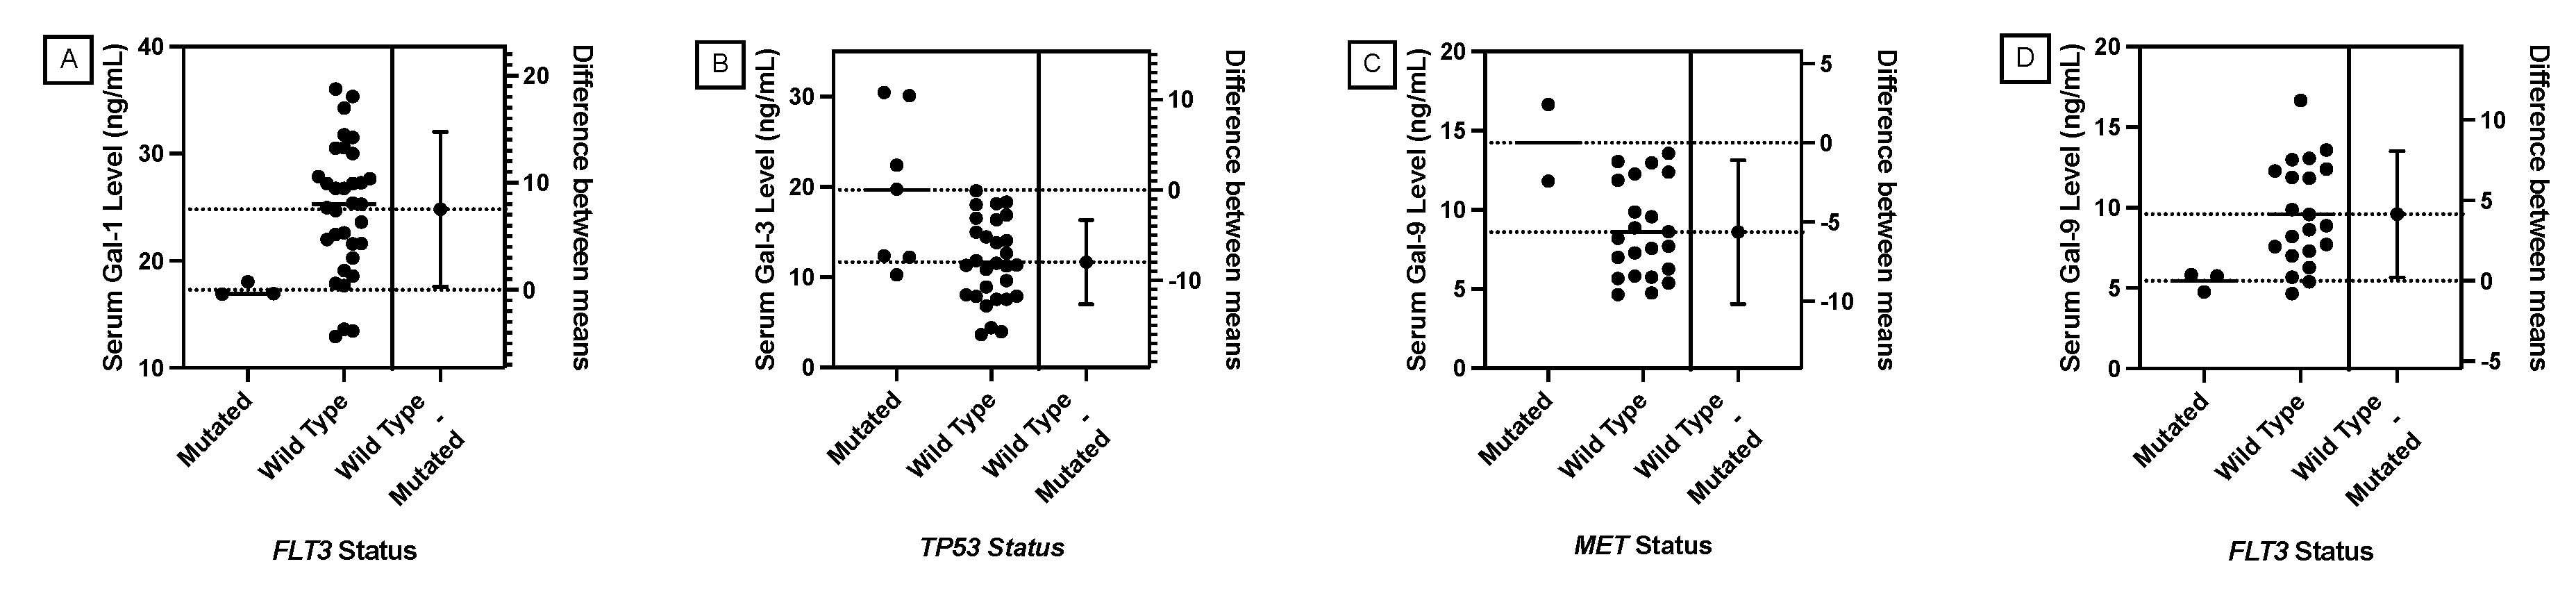
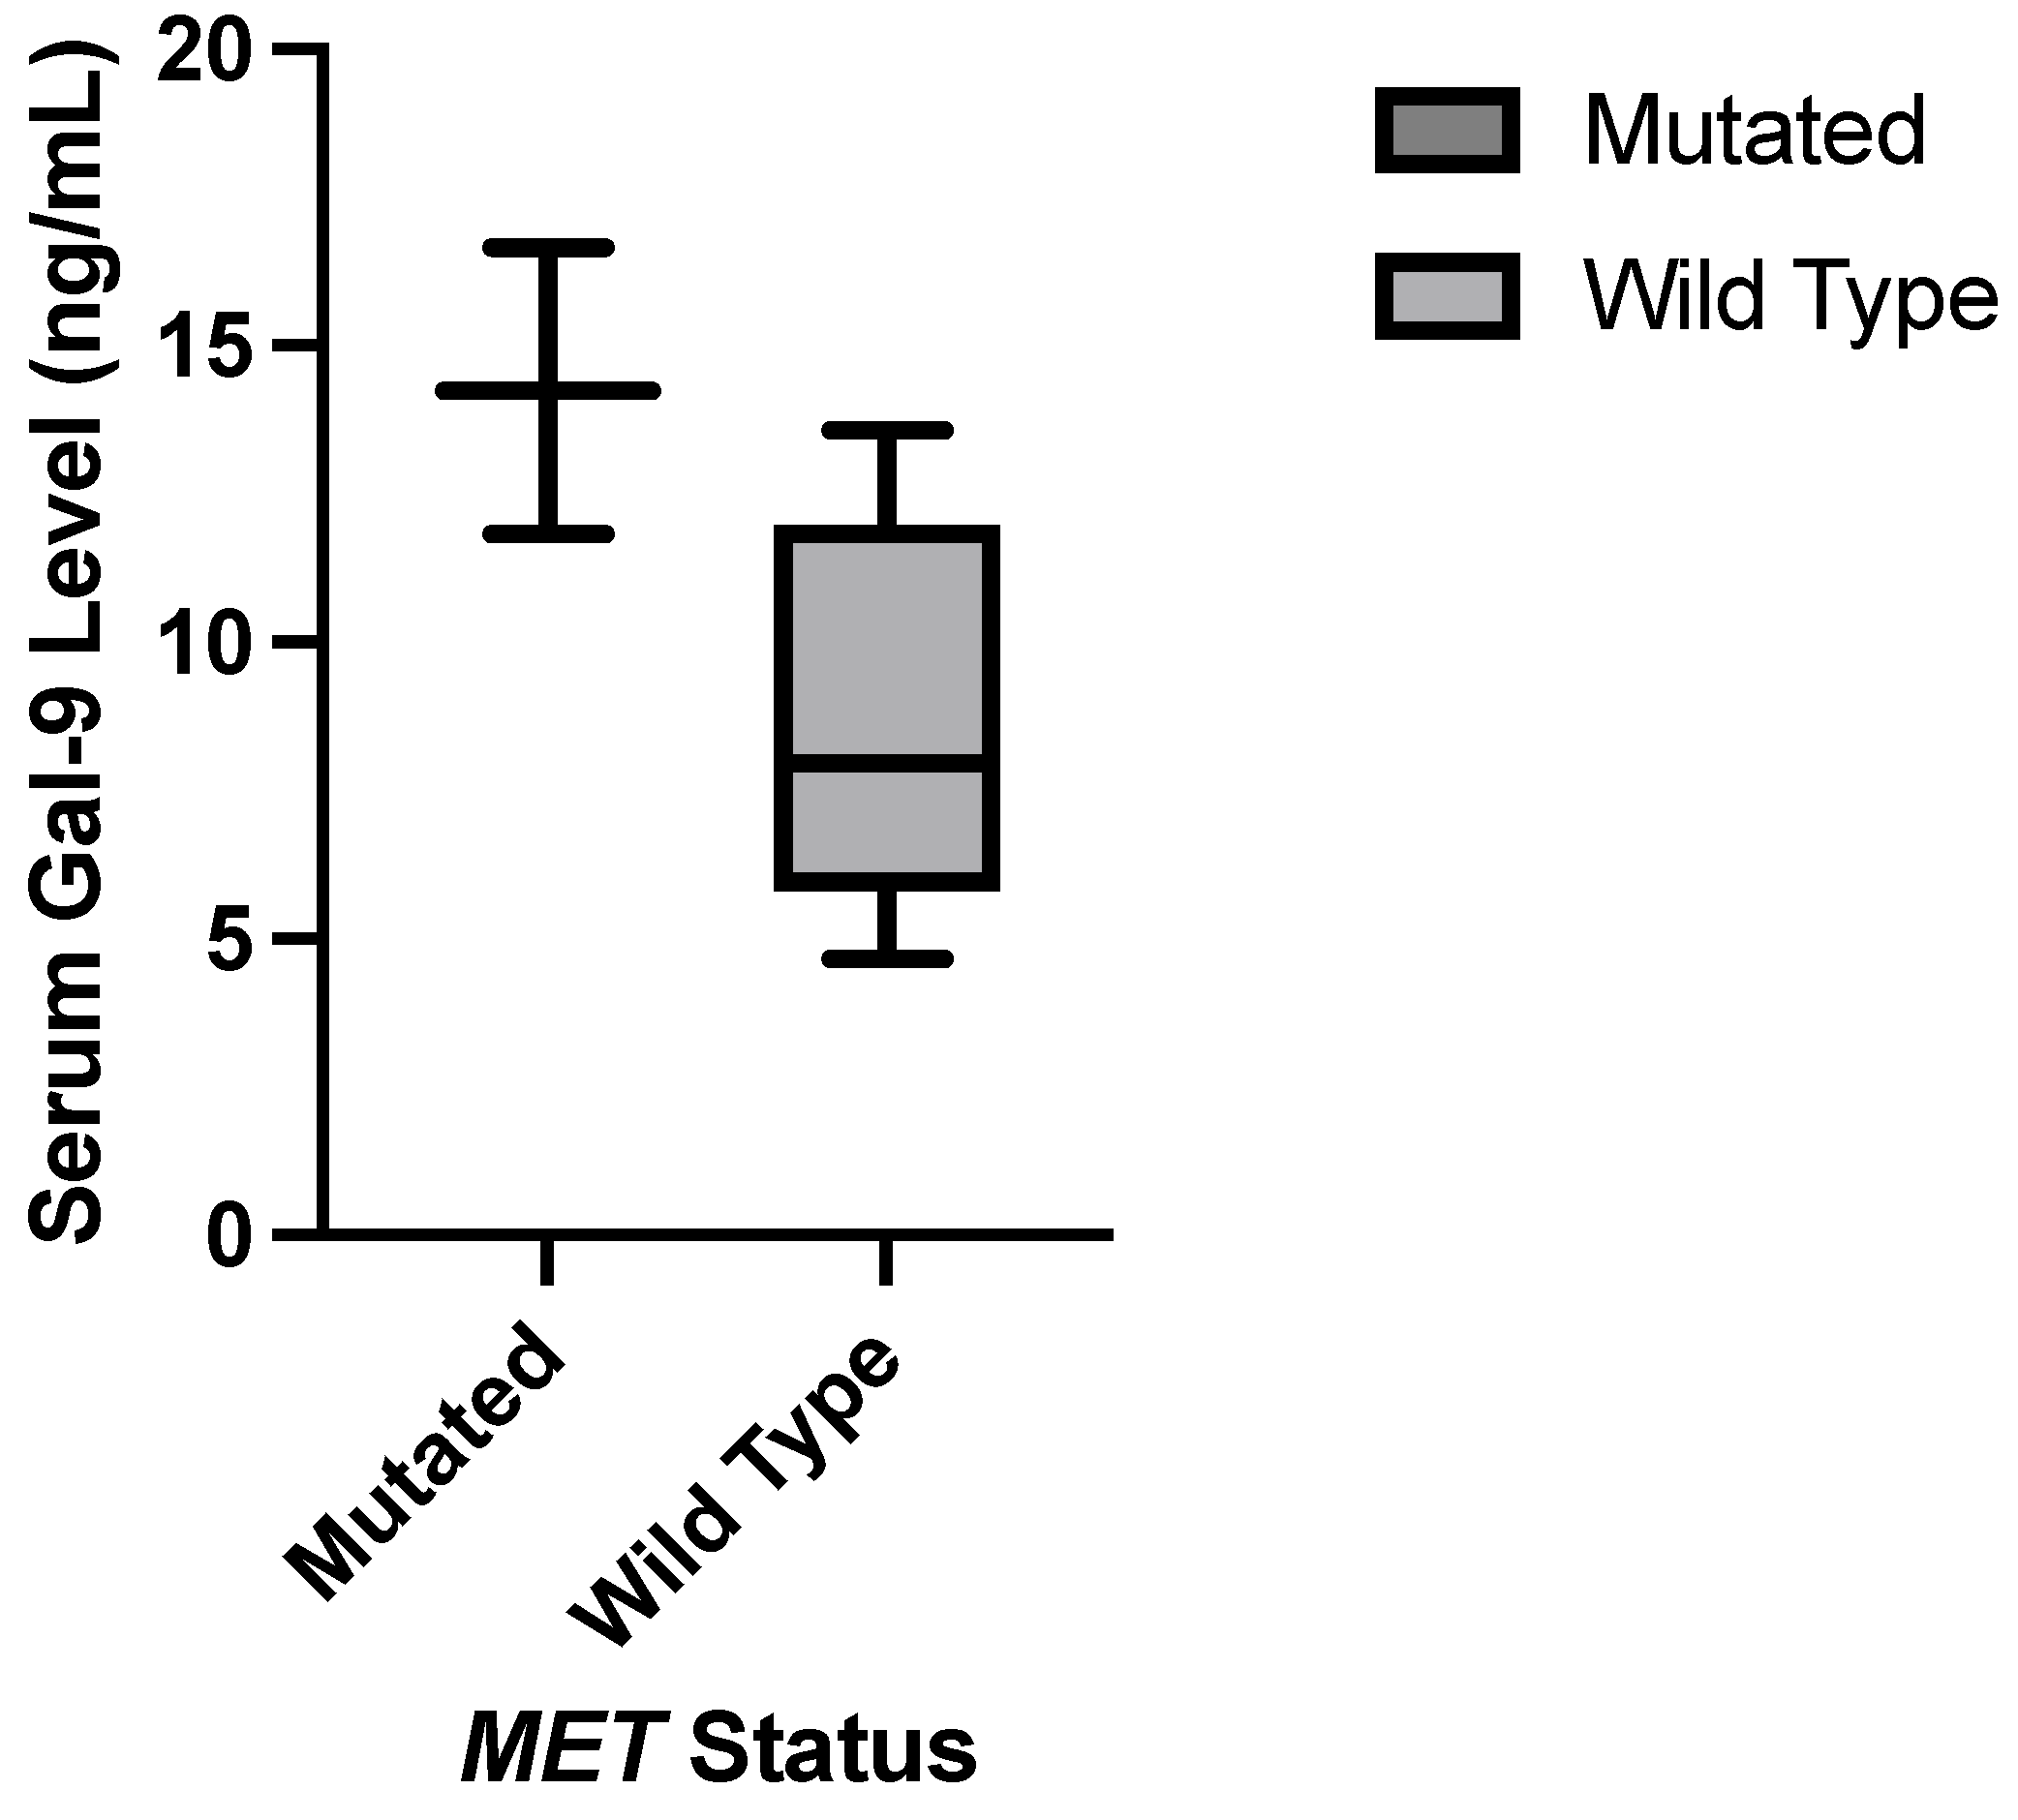
The serum galectin levels of the Luminal A subtype samples (N=36) were analyzed against the presence of specific cancer-critical gene mutations. Similar to the t-test results presented in the previous section, samples with a TP53 mutation had statistically significant elevation in mean serum galectin-3 levels with a more significant p-value than the t-test of the entire breast cancer sample set. The presence of a MET mutation correlated with elevated serum galectin-9 level levels, a new finding from the broader breast cancer sample set. Samples with an FLT3 mutation had lower mean serum galectin-1 and -9 levels, which was also a new finding. None of the Luminal A samples had a KIT mutation, so this correlation could not be compared with the significant findings from the larger breast cancer subset.
Table 4 shows the p-values for pooled t-test comparisons of mean serum galectin levels and the presence of a Hotspot mutation in specific cancer-critical genes. Statistically significant p-values are highlighted in red. The number of mutated samples is out of thirty-six samples that were classified as Luminal A.
Figure 4.
Comparison of means serum galectin levels in patients with the Luminal A molecular subtype. (A) Mean serum galectin-1 levels were significantly lower in patients with a FLT3 mutation (p-value = 0.0418). (B) Mean serum galectin-3 levels were significantly elevated in patients with a TP53 mutation (p-value = 0.0014). (C) Mean serum galectin-9 levels were significantly elevated in patients with a MET mutation (p-value = 0.0173).(D) Mean serum galectin-9 levels were significantly lower in patients with a FLT3 mutation (p-value = 0.0395).
3.4.2. Luminal A: TP53 vs. Galectin-3
A statistically significant correlation was found between a mutated TP53 gene and elevated galectin-3 in a pooled t-test. With a mutated sample size of seven patients, a Wilcoxon Rank Sum Test to compare medians is more appropriate. The p-value between a mutated TP53 gene and galectin-3 is 0.0184. This nonparametric test supports the significance found in the pooled t-test between a mutated TP53 gene and elevated galectin-3 levels.
Figure 5.
Nonparametric testing found statistically significant elevation in galectin-3 levels in Luminal A subtype patients with a TP53 mutation (p-value = 0.0184)
Figure 5.
Nonparametric testing found statistically significant elevation in galectin-3 levels in Luminal A subtype patients with a TP53 mutation (p-value = 0.0184)
3.4.3. Luminal A: MET vs. Galectin-9
A statistically significant correlation was found between a mutated MET gene and elevated galectin-3 in a pooled t-test. With a mutated sample size of five patients, a Wilcoxon Rank Sum Test to compare medians is more appropriate. The p-value between a mutated MET gene and galectin-9 is 0.1055. This nonparametric test does not confirm the significance found in the pooled t-test between a mutated MET gene and elevated galectin-9 levels.
Figure 6.
Nonparametric testing found no statistically significant difference in galectin-3 levels between Luminal A subtype patients with and without a MET mutation (p-value = 0.1055)
Figure 6.
Nonparametric testing found no statistically significant difference in galectin-3 levels between Luminal A subtype patients with and without a MET mutation (p-value = 0.1055)
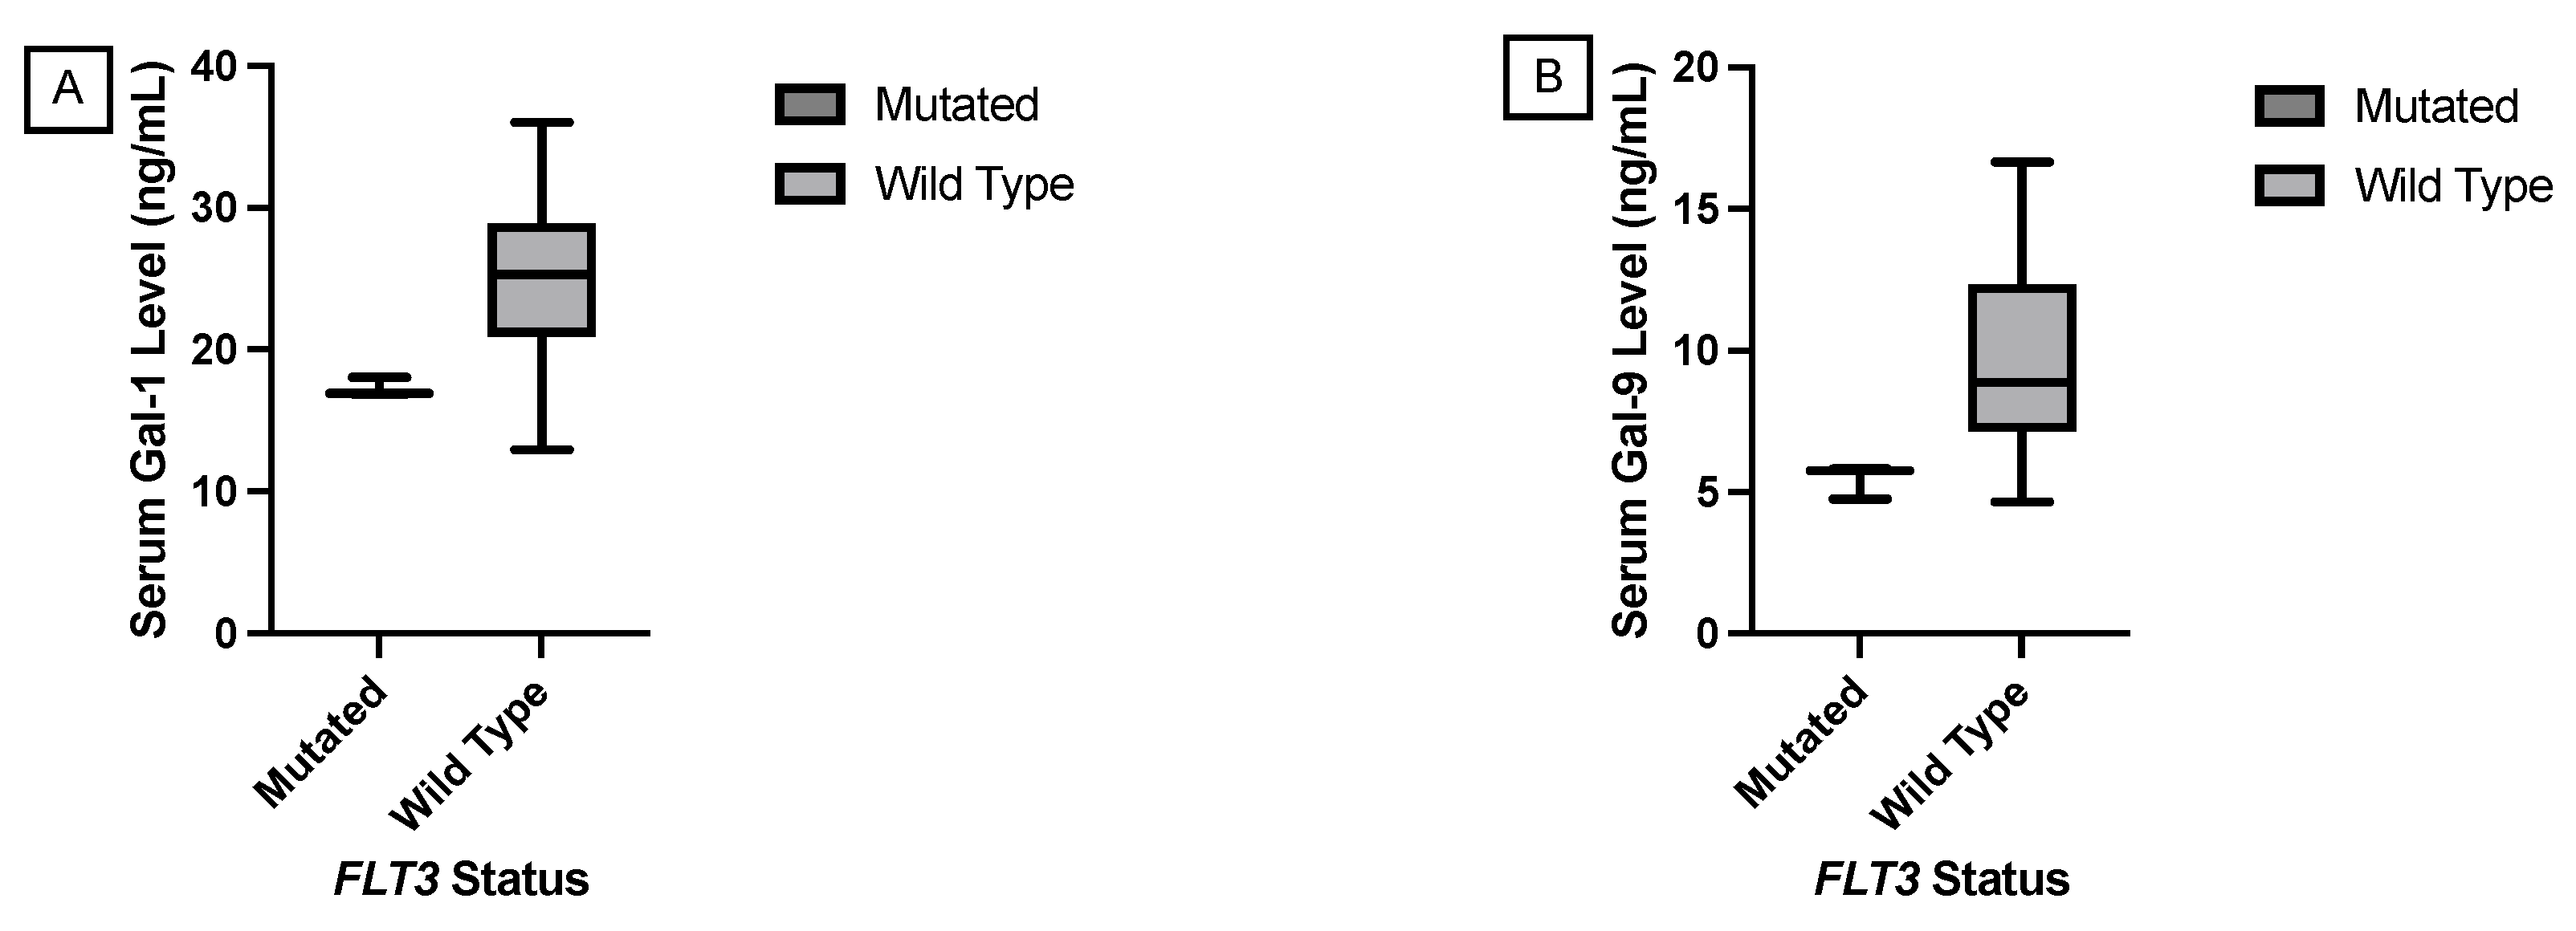
3.4.4. Luminal A: FLT3 vs. Galectin-1 and Galectin-9
Statistically significant correlations were found between a mutated FLT3 gene and lower galectin-1 and -9 levels using a pooled t-test. However, with a mutated sample size of three patients, a Wilcoxon Rank Sum Test to compare medians is more appropriate. The p-values between a mutated FLT3 gene and galectin-1 and -9 levels were 0.0296 and 0.0362 respectively. This nonparametric test supports the significance found in the pooled t-test between a mutated FLT3 gene and elevated galectin-1 and -9 levels. This was the only significant correlation found in this study where the genetic mutation correlated with a lower galectin level. Additionally, the genetic mutation in the FLT3 gene for these patients was found in the non-coding region compared to most of the other genetic mutations in this Hot Spot panel which were amino acid changes in the protein-coding regions of the genome.
Figure 7.
Nonparametric comparison of serum galectin levels of breast cancer patients with the Luminal A molecular subtype. (A) Serum galectin-1 levels were significantly lower in patients with a FLT3 mutation (p-value = 0.0296). (B) Serum galectin-9 levels were significantly lower in patients with a FLT3 mutation (p-value = 0.0362).
3.4.5. Other Molecular Subtypes
The sample sizes of patients with Luminal B, Luminal A HER2 Hybrid, Luminal B HER2 Hybrid, and HER2 Positive subtypes were too small to perform a t-test that would provide reliable results. A Wilcoxon Rank Sum Test was also performed for samples with the Triple Negative subtype, but no statistical difference in galectin-1, -3, and -9 levels was found.
Table 5 shows the p-values for Wilcoxon Rank Sum Test comparisons of serum galectin levels and the presence of a Hotspot mutation in specific cancer-critical genes. None of the p-values were statistically significant. The number of mutated samples is out of twelve samples that were classified as Triple Negative.
3.5. Histologies
Breast cancer molecular histologies are determined based on the location of tumor origin and the presence or absence spread to the stroma of the breast [23]. Invasive ductal carcinoma is the most common breast cancer histology and accounts for twenty-five samples in this study (35.2%). Ductal carcinoma in situ is the second most common breast cancer histology accounting for twenty patients in this study (28.2%). Ductal carcinoma in situ is confined to the mammary ducts while invasive ductal carcinoma signifies that the cancer has spread to the stroma as well. Patients’ ductal carcinoma in situ can become invasive over time as the disease progresses, representing the diagnosis at the time of sample retrieval [24].
No significant differences in mean serum galectin levels were found in the presence of specific cancer critical gene mutations in either the ductal carcinoma in situ or invasive ductal carcinoma sample cohorts when a Wilcoxon Rank Sum Test was performed.
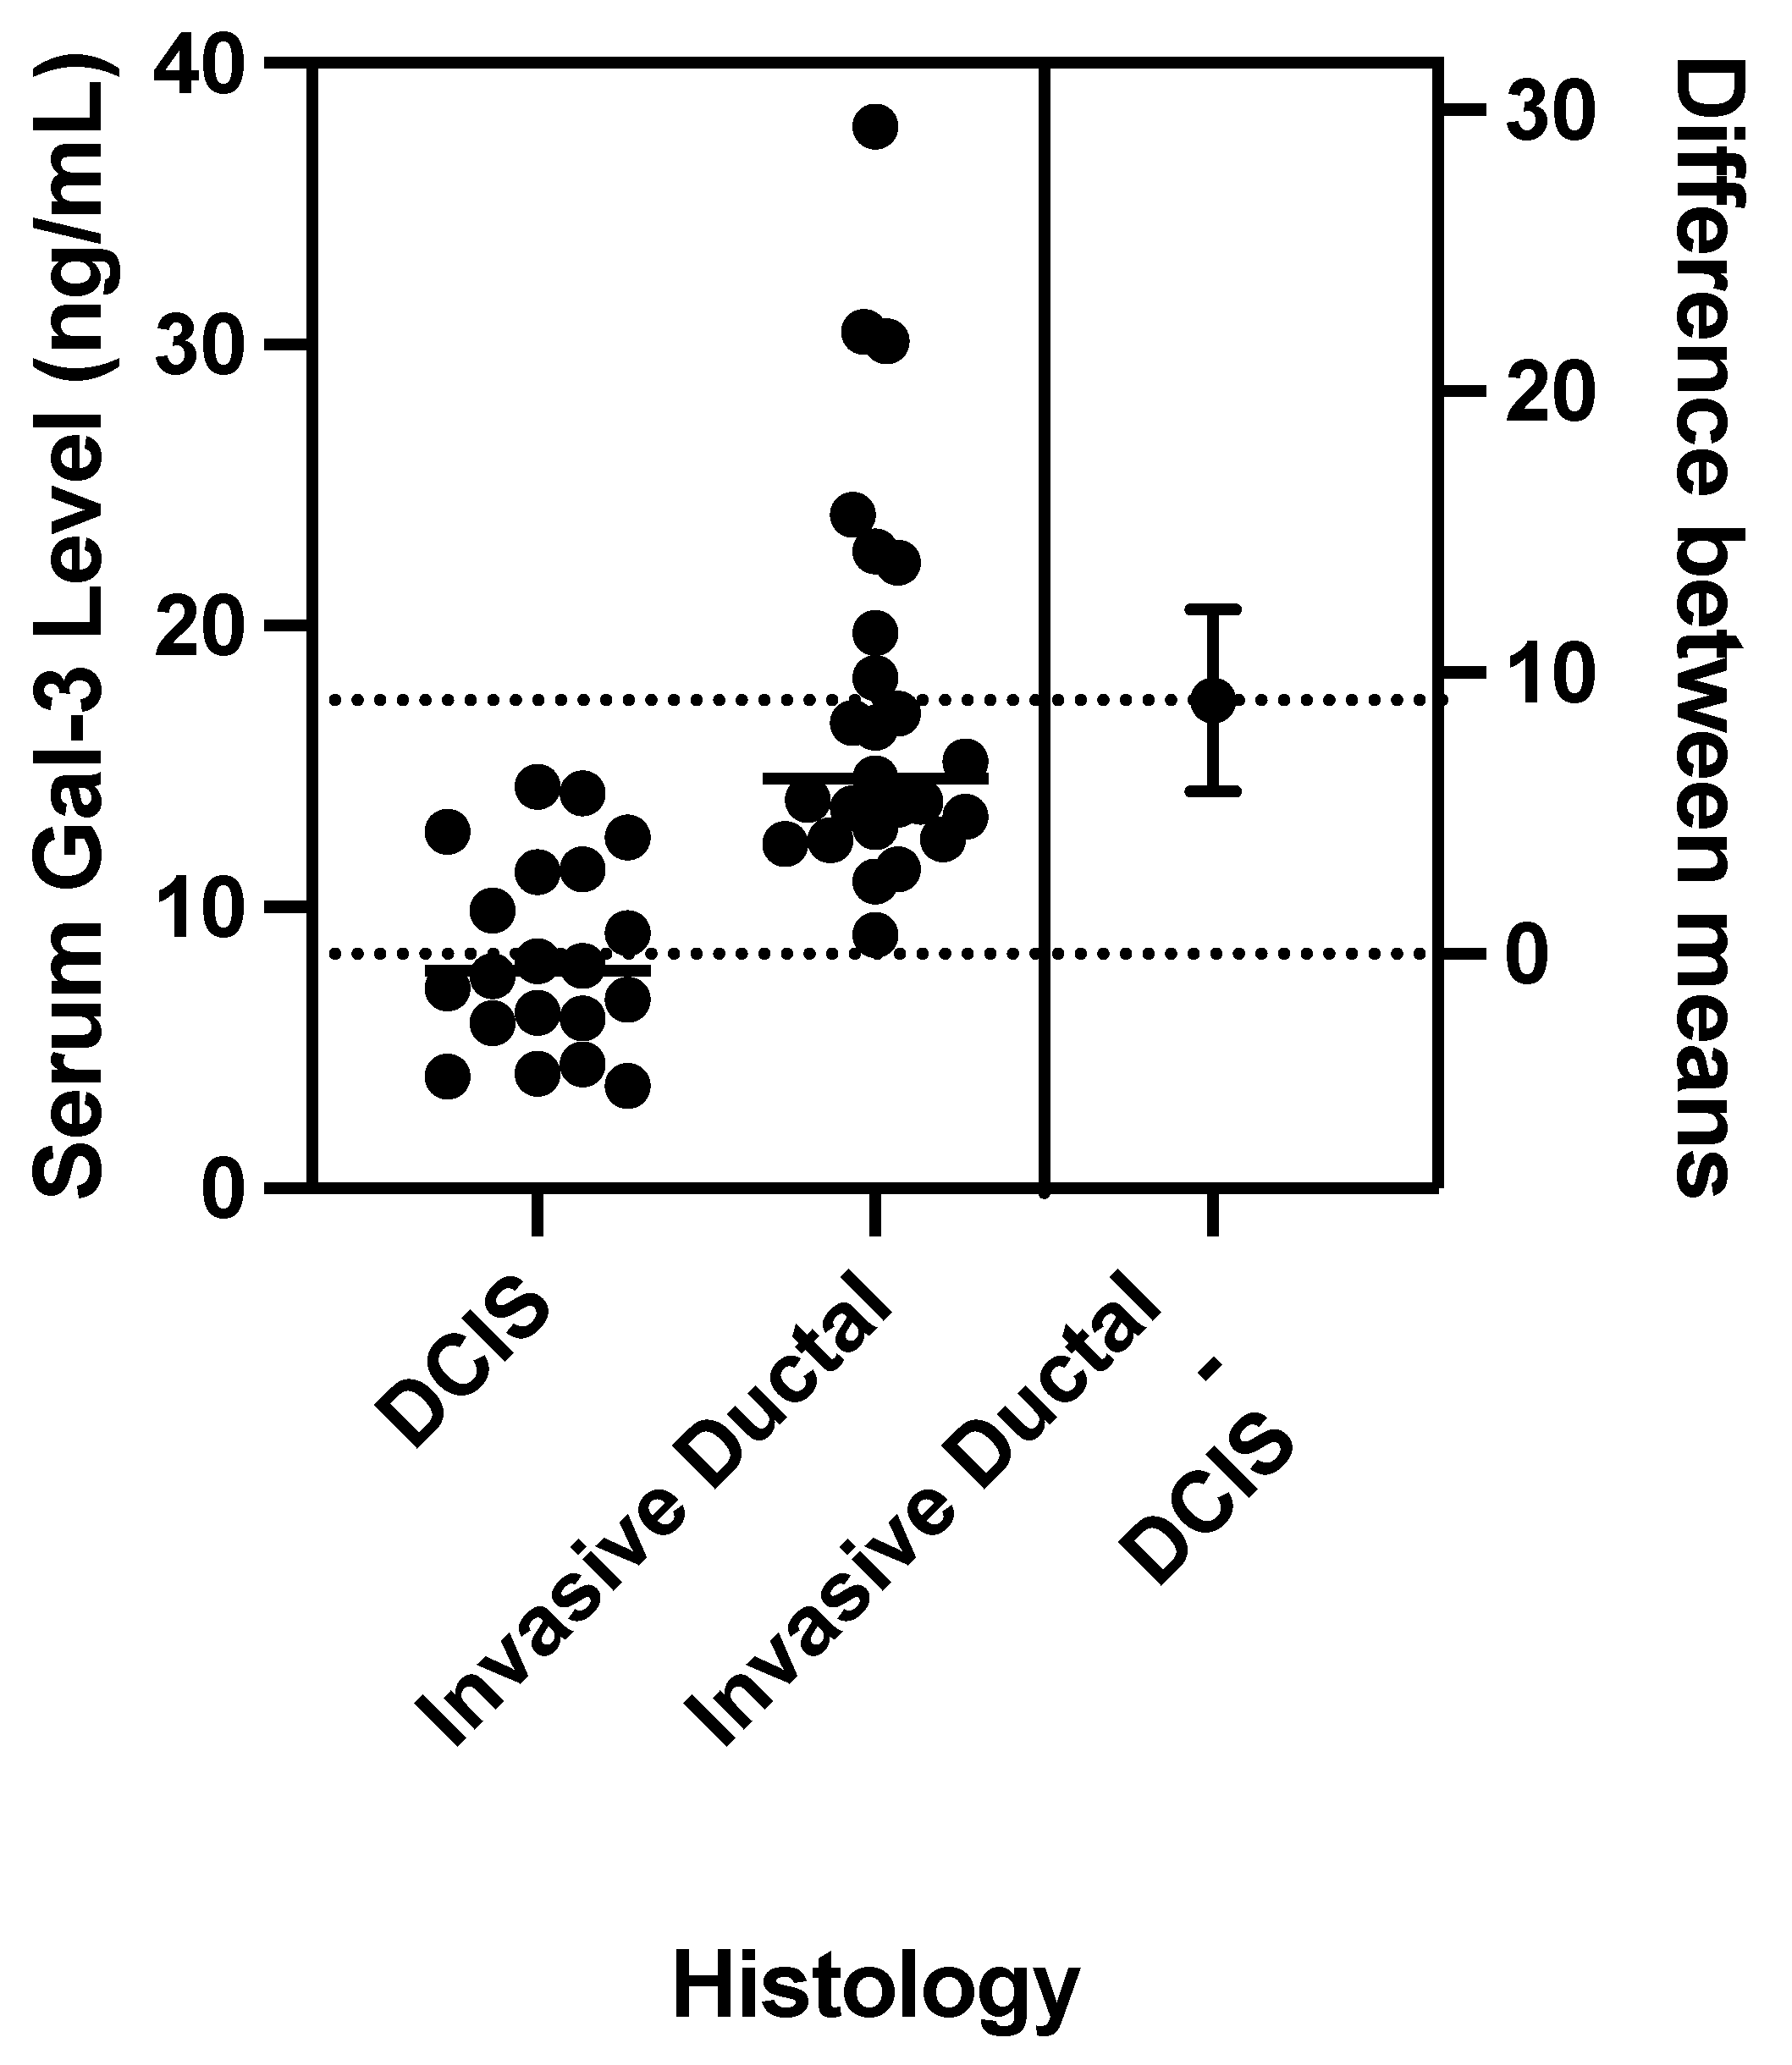
A pooled t-test for differences in means was performed to compare mean serum galectin levels between invasive ductal carcinoma and ductal carcinoma in situ. Figure 8 shows that serum galectin-3 levels were significantly elevated in patients with invasive ductal carcinoma with a p-value<0.0001. There was no significant correlation found between histology and mean serum galectin -1 or -9 levels with p-values of 0.6799 and 0.8798, respectively.
Figure 8.
Comparison of means serum galectin levels in patients with Ductal Carcinoma. (A) Mean serum galectin-1 levels were not significantly different between patients with invasive ductal carcinoma and DCIS (p-value = 0.6799). (B) Mean serum galectin-3 levels were significantly elevated in patients with invasive ductal carcinoma (p-value < 0.0001). (C) Mean serum galectin-9 levels were not significantly different between patients with invasive ductal carcinoma and DCIS (p-value = 0.8798).
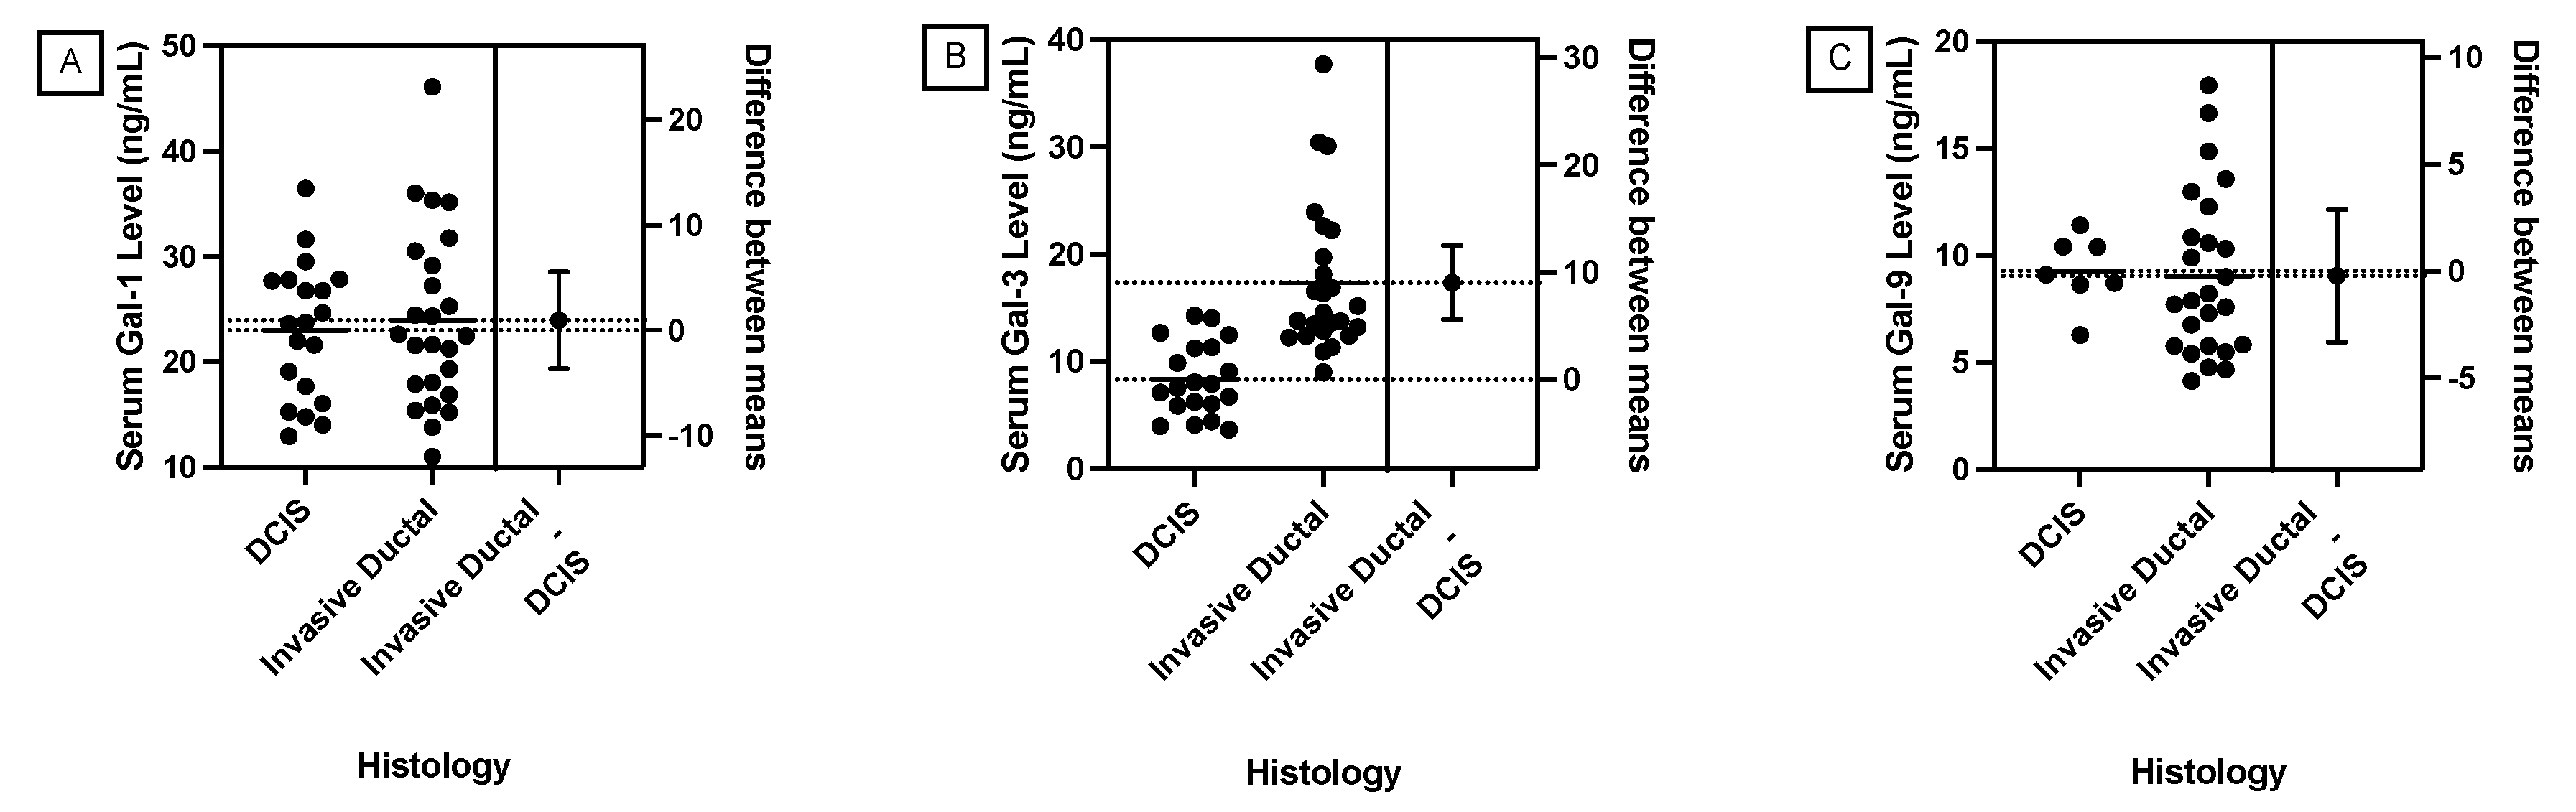
3.5.1. Histology vs. Galectin-3
According to a pooled t-test, a statistically significant correlation was found between invasive ductal carcinoma histology and elevated mean galectin-3 levels compared to ductal carcinoma in situ. A Levene’s Test for equality of variances was performed yielding a p-value = 0.0248, indicating a statistically significant difference in variances between the samples from patients with invasive ductal carcinoma and the samples from patients with ductal carcinoma in situ. Therefore, a Welch’s Test was performed yielding a p-value < 0.0001. This supports the significant correlation between ductal histology and elevated galectin-3 levels found with a pooled t-test.
Figure 9.
A Welch’s Test found that mean serum galectin-3 levels were significantly elevated in patients with invasive ductal carcinoma (p-value < 0.0001)
Figure 9.
A Welch’s Test found that mean serum galectin-3 levels were significantly elevated in patients with invasive ductal carcinoma (p-value < 0.0001)
3.6. Gene Combinations
3.6.1. ANOVA
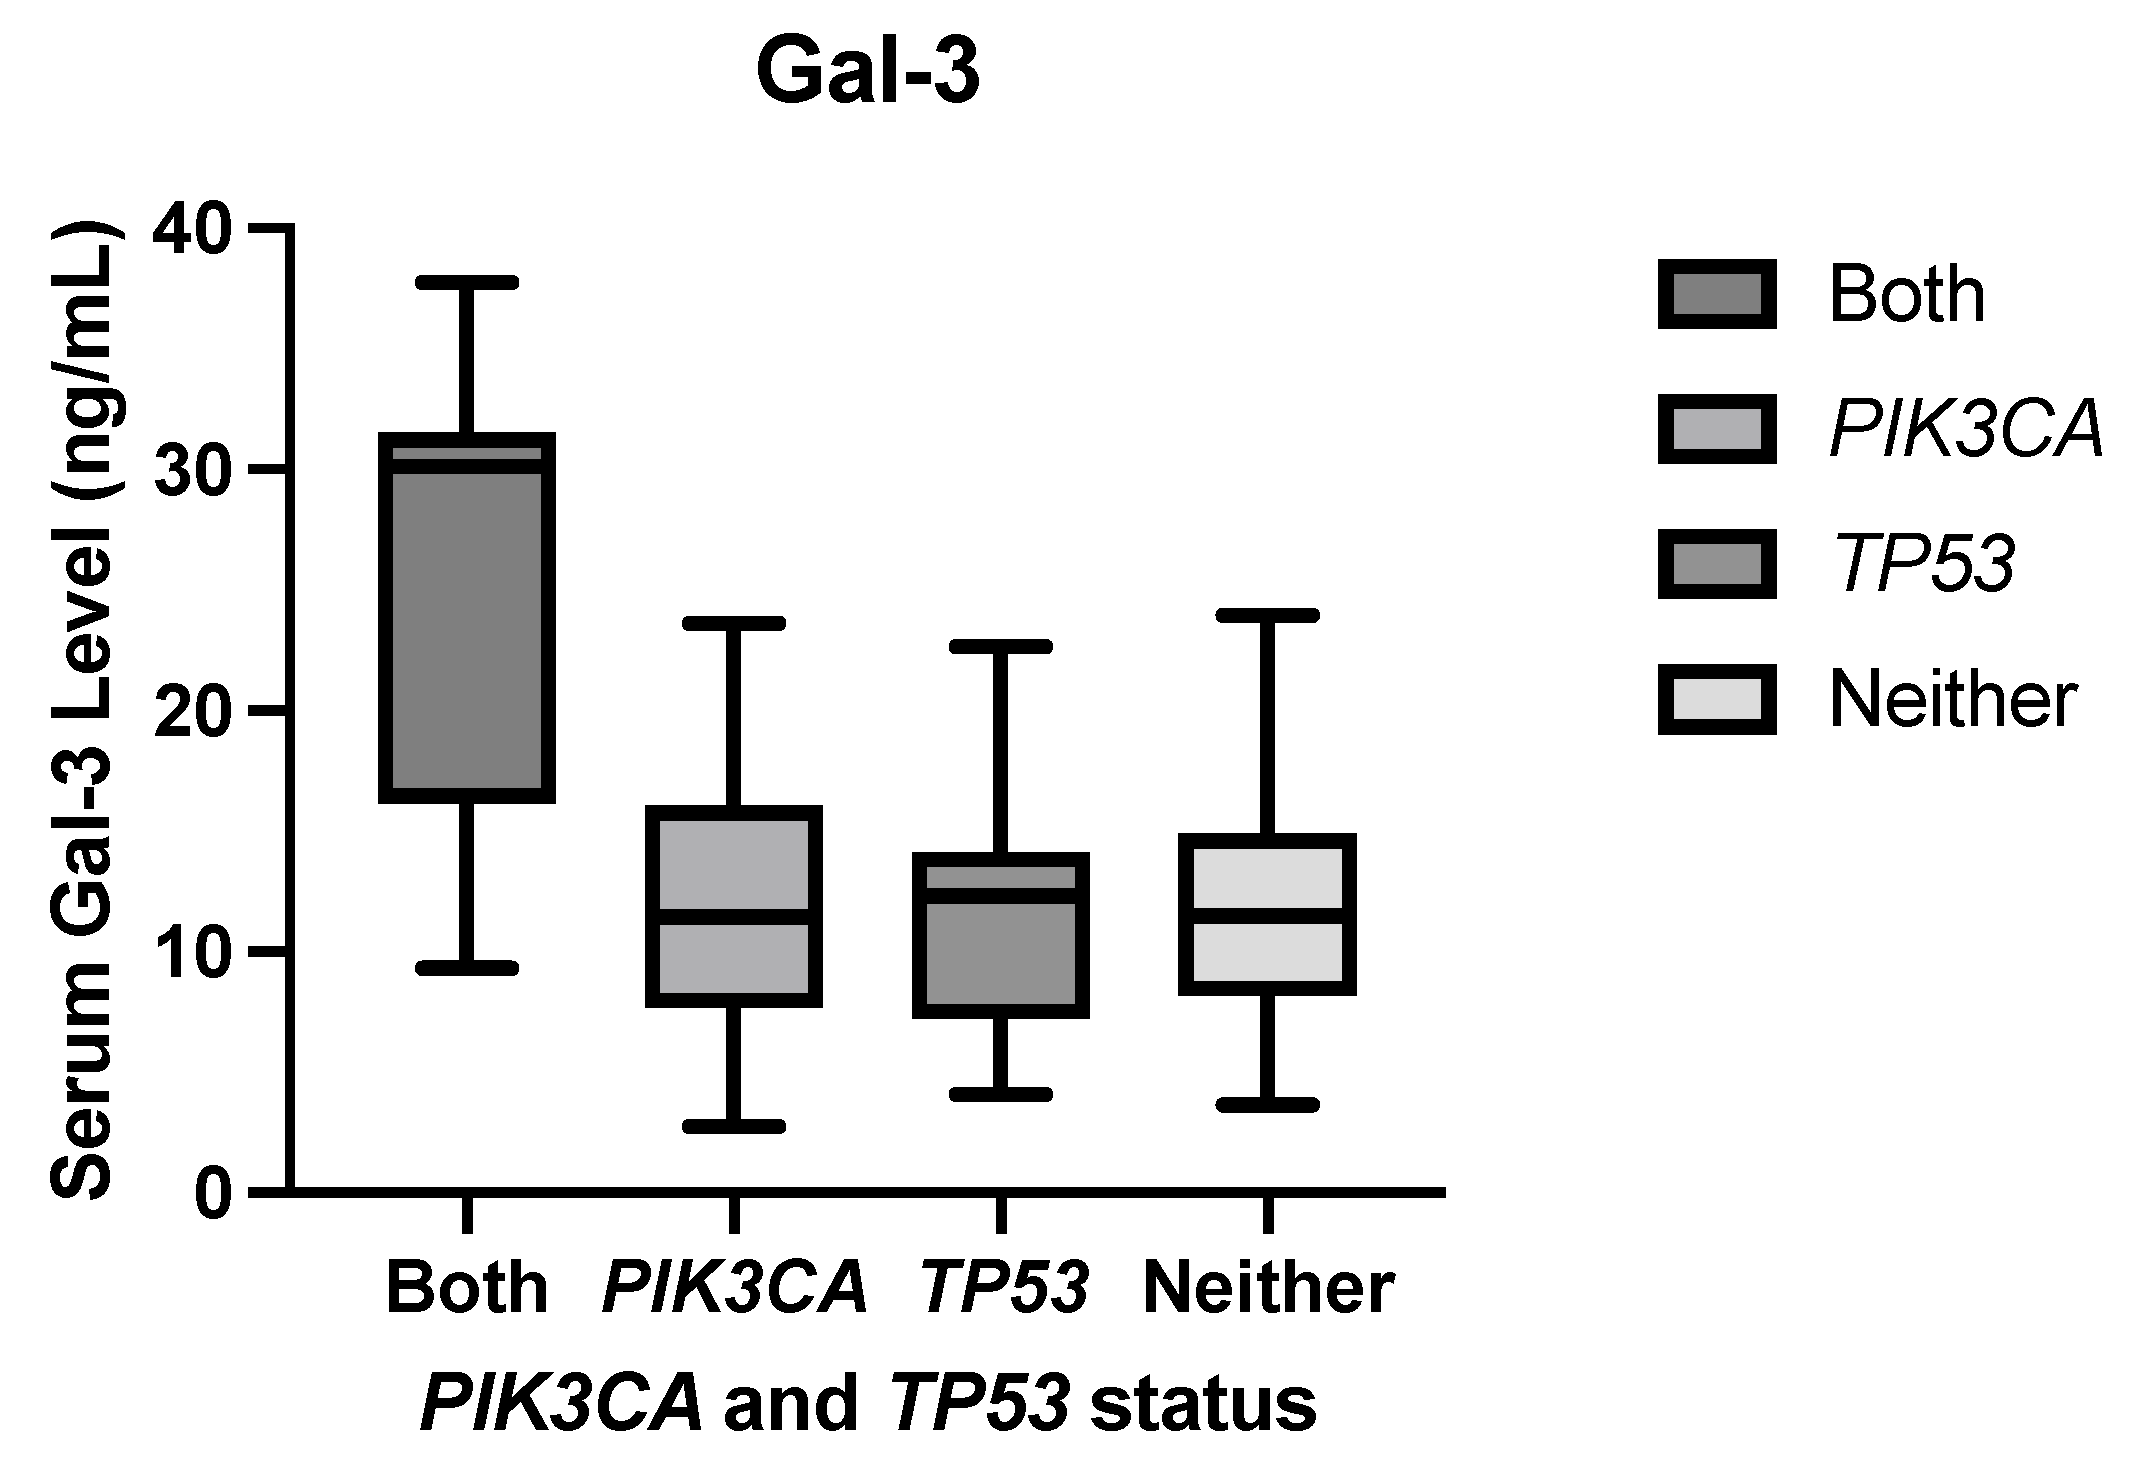
The following analyses showed that specific combinations of genetic mutations modulated galectin levels even when the constituent gene mutations alone did not result in any significant difference in mean serum galectin levels. ANOVA performed between samples with both a PIK3CA and a TP53 mutation (N=7), a PIK3CA mutation but no TP53 mutation (N=24), a TP53 mutation but no PIK3CA mutation (N=16), and neither mutation (N=24) found a F-statistic = 10.64 and a p-value<0.0001. This significant F-statistic indicates a significant difference in at least one of the mean serum galectin-3 levels. Additionally, the adjusted =0.292, so approximately 29.2% of the variance in serum galectin-3 levels can be attributed to this combination of mutations while adjusting for multiple testing error.
Figure 10 shows apparent elevation in mean serum galectin-3 level for samples with both a PIK3CA HotSpot mutation and a TP53 HotSpot mutation compared to samples with a PIK3CA mutation but no TP53 mutation, a TP53 mutation but no PIK3CA mutation, and samples with neither mutation.
Figure 10.
Mean serum galectin-3 levels were significantly elevated in samples with both a PIK3CA HotSpot mutation and a TP53 HotSpot mutation compared to samples with a PIK3CA mutation but no TP53 mutation, a TP53 mutation but no PIK3CA mutation, and samples with neither mutation.
Figure 10.
Mean serum galectin-3 levels were significantly elevated in samples with both a PIK3CA HotSpot mutation and a TP53 HotSpot mutation compared to samples with a PIK3CA mutation but no TP53 mutation, a TP53 mutation but no PIK3CA mutation, and samples with neither mutation.
3.6.2. Tukey-Kramer Honest Significant Difference Test
Tukey’s Range Test was performed to analyze differences between sample means while accounting for Type I error from multiple tests. Patient samples with both PIK3CA and TP53 HotSpot mutations correlated with significantly elevated mean serum galectin-3 levels compared to patients with a PIK3CA mutation but no TP53 mutation, a TP53 mutation but no PIK3CA mutation, and samples with neither mutation with a p-value<0.0001 for all three pairs.
3.6.3. Steel Dwass Method
Because of the small sample sizes, a Steel-Dwass test was performed comparing medians between samples as a nonparametric test while accounting for Type I error from multiple tests. Patients with both a PIK3CA and a TP53 mutation had significantly elevated median serum galectin levels compared to patients with a PIK3CA mutation and the wild-type TP53 gene with a p-value = 0.0192. Patients with both a PIK3CA and a TP53 mutation had significantly elevated median serum galectin levels compared to patients with a TP53 mutation and the wild-type PIK3CA gene with a p-value = 0.0344. Patients with both a PIK3CA mutation and a TP53 mutation had significantly elevated median serum galectin levels compared to patients with wild type PIK3CA and TP53 genes with a p-value = 0.0254. This supports a significant correlation between the presence of both a PIK3CA and a TP53 mutation and elevated serum galectin-3 levels.
3.7. Metastasis
Table 6 shows that the odds of metastasis in a patient with a KIT mutation is 11.20 times the odds of metastasis in patients without a KIT mutation.
Table 7 shows that the odds of metastasis in a patient with a PIK3CA mutation is 2.43 times the odds of metastasis in patients without a PIK3CA mutation.
4. Discussion
4.1. Study Findings
This study found a significant correlation between a cancer-critical KIT mutation and higher serum galectin-1 and -9 levels in breast cancer patients which joins other studies with these findings [21]. While the mechanisms behind galectin elevations with KIT mutations are still under exploration, one possible reason is that increased RTK/RAS signaling through gain-of-function mutations promotes the transcription of these galectins downstream in the signaling pathway. This has been demonstrated by galectin-3 and the transcription factor FOXD1 forming a positive feedback loop through the ERK intracellular signaling pathway which promotes lung cancer aggressiveness [25]. Our study also found that samples with a TP53 mutation correlate with significantly elevated serum galectin-3 levels. This result aligns with other studies that indicate the upregulation of galectin-3 is associated with a loss in p53-induced apoptosis [26]. Specifically, one study found that the loss of the p53 activator HIPK2 resulted in galectin-3 upregulation [27]. This loss of function in the p53 signaling pathway that leads to a loss in regulation over galectin-3 expression provides a possible explanation for the elevated galectin-3 levels that was observed with TP53 mutations.
This study analyzed specific molecular subtypes and found that patients within the Luminal A subtype and with a TP53 mutation also had significantly elevated mean serum galectin-3 levels compared to Luminal A samples without a TP53 mutation. Unlike the other results found in this study where genetic mutations correlate with elevated galectin levels, the FLT3 mutation correlated with significantly lower galectin-1 and galectin-9 levels in patients with the Luminal A subtype. Considering the role of FLT3 in the RTK/RAS pathway, it would be expected that a gain-of-function mutation would result in upregulation of galectin-1 and -9 similar to the observations with KIT and MET mutations. Perhaps this downregulation is part of a broader reprogramming of the tumor microenvironment that is not fully understood, which is why we recommend the relationship between galectins and FLT3 be further explored. No significant correlations between genetic mutations and galectin levels were found in patients with the Triple Negative subtype. While other molecular subtypes were represented in this study, there was not a large enough sample size within these subtypes to accurately analyze them. These findings suggest that the specific molecular subtype is important when considering therapy choices as different genes are implicated in galectin modulation depending on the subtype. A combination of disease subtype and genetic screening may also foreshadow the resulting galectin levels and subsequently disease progression.
Patients with a diagnosis of invasive ductal carcinoma at the time of sample retrieval had significantly elevated mean galectin-3 levels compared to patients with ductal carcinoma in situ histology. However, no significant correlations between genetic mutations and galectin levels were found within each ductal histology.
Mutations in the PIK3CA gene and the KIT gene are heavily implicated in regulating metastasis based on the respective odds ratios of 11.20 and 2.43 found in this study. This association between a cancer-critical mutation in the KIT and odds of metastatic disease is supported by previous findings [21]. However, no significant correlations between genetic mutations and galectin levels were found within the primary and metastatic breast cancer subsets.
4.2. Limitations
While this study revealed very promising and clinically relevant findings, it is not without limitations. The major limitation is the sample size. The sample set was determined based on the availability of the PHCI’s biorepository of cancer patients who had also received a complete Hotspot panel of cancer-critical genes. While a sample size of seventy-one is over double other recent studies that compare genetic mutations and galectin levels, analysis of a larger sample would solidify the findings of this study and potentially identify more correlations between genetic mutations and galectin levels that were labeled as borderline in this study. Additionally, a larger sample size would provide the opportunity to analyze molecular subtypes and histologies that were omitted in this study due to a lack of samples.
4.3. Next steps
When more samples become available, this analysis should be repeated to improve the power of these findings. Analyzing the effect of genetic mutations on cancer-critical genes on the regulation of galectin levels sets the framework for examining the specific mechanisms by which galectin levels are altered and how this impacts cancer outcomes. These pathways are important for developing effective galectin-targeted therapies. To examine the manner in which galectins are altered during the course of disease progression, it would be helpful to measure serum galectin levels over the disease course in the same patients. Patients with and without specific genetic mutations should be compared. Furthermore, the interaction between different genetic mutations in regulating galectin levels is a new finding in this study, and a mechanistic analysis should be performed to understand these interactions and their implications for novel therapies.
Supplementary Materials
The data analyzed in this article can be found at: Preprints.org.
Author Contributions
Conceptualization, A.V.B; methodology, A.V.B., E.G.M., A.T.F. and M.S.; validation, E.G.M., A.T.F., and D.H.A.; formal analysis, E.G.M., A.T.F., and D.H.A.; investigation, E.G.M., A.T.F., D.H.A., M.S., W.J.E. and A.V.B.; resources, A.V.B., M.S., J.C.M. and W.J.E.; data curation, E.G.M., A.T.F., D.H.A. and J.C.M.; writing—original draft preparation, E.G.M. and D.H.A.; writing—review and editing, E.G.M., D.H.A., A.T.F., M.S. and A.V.B.; visualization, E.G.M., D.H.A. and A.T.F.; supervision, A.V.B.; project administration, A.V.B.; funding acquisition, A.V.B., M.S., J.C.M. and W.J.E. All authors have read and agreed to the published version of the manuscript.
Funding
This research was funded by the Prisma Health transformative seed grant, the 2022 ASPIREinG seed grant from the USC School of Medicine Greenville, and a Brown SPRINT LINK Award from Brown University.
Institutional Review Board Statement
Ethical review and approval were waived for this study, which is nonhuman subject research and therefore does not require IRB approval. The study was approved by the Tissue Utilization Committee per the IRB-approved biorepository protocol and SOPs (IRB #Pro00069834)
Informed Consent Statement
Informed consent was obtained from all subjects involved in the study
Data Availability Statement
The data presented in this study is available in this article.
Acknowledgments
Amplicon sequencing and bioinformatics analysis had been performed by Functional Genomics Core of COBRE Center by Targeted Therapeutics (funded by P20GM109091). The authors thank the Prisma Health Cancer Institute’s biorepository staff for the patient samples. We thank Dr. Anarina Murillo for her biostatistical help.
Conflicts of Interest
The authors declare no conflicts of interest. The funders had no role in the design of the study; in the collection, analyses, or interpretation of data; in the writing of the manuscript; or in the decision to publish the results.
Abbreviations
The following abbreviations are used in this manuscript:
| TNBC | Triple Negative Breast Cancer |
| RTK | Receptor Tyrosine Kinase |
| ELISA | Enzyme-linked Immunosorbent Assay |
| PCR | Polymerase Chain Reaction |
| PHCI | PRISMA Health Cancer Institute’s Biorepository |
| HER2 | Human Epidermal Growth Factor Receptor 2 |
| EGFR | Epidermal Growth Factor Receptor |
| ALK | Anaplastic Lymphoma Kinase |
| PDGFR | Platelet-Derived Growth Factor Receptor |
| TGF-R | Transforming Growth Factor Beta |
| KIT | Mast/Stem Cell Growth Factor Receptor KIT |
| TP53 | EKC/KEOPS Complex Subunit TP53RK |
| FLT3 | Fibroblast Growth Factor Receptor |
| PIK3CA | Phosphatidylinositol 4;5-Bisphosphate 3-Kinase Catalytic Subunit Alpha Isoform |
| PTEN | Phosphatase and Tensin Homolog |
| CDH1 | Cadherin 1 |
| STK11 | Serine/Threonine Kinase |
| BRCA1 | Breast Cancer Gene 1 |
| BRCA 2 | Breast Cancer Gene 2 |
| ATM | Ataxia Telangiectasia Mutated |
| CHEK2 | Checkpoint kinase 2 |
| BRIP1 | BRCA1 Interacting Protein |
| MET | Hepatocyte Growth Factor Receptor |
| VEGF | Vascular Endothelial Growth Factor |
| DDR1 | Discoidin Domain Receptor 1 |
| EphA10 | Ephrin Receptor A10 |
| BCR-ABL | Breakpoint Cluster Region-Abelson Murine Leukemia Viral Oncogene Homolog 1 |
| KDR | Vascular Endothelial Growth Factor Receptor 2 |
| ANOVA | Analysis of Variance |
| RAS | Rat Sarcoma |
| FOXD1 | Forkhead Box D1 |
| ERK | Extracellular Signal-Regulated Kinases |
| Gal-1 | Galectin-1 |
| Gal-3 | Galectin-3 |
| Gal-9 | Galectin-9 |
| ABL1 | Tyrosine-protein kinase ABL1 |
| AKT | AKT Serine-Threonine Kinase 1 |
| APC | Adenomatous Polyposis Coli |
| BRAF | Serine/Threonine-Protein Kinase B-Raf |
| CDKN2A | Cyclin-Dependent Kinase Inhibitor 2A |
| CSF1R | Colony Stimulating Factor 1 Receptor |
| CTNNB1 | Catenin Beta 1 |
| ERBB2 | Erb-B2 Receptor Tyrosine Kinase 2 |
| ERBB4 | Erb-B4 Receptor Tyrosine Kinase 2 |
| EZH2 | Enhancer of Zeste 2 Polycomb Repressive Complex 2 Subunit |
| FBXW7 | F-box/WD repeat-containing protein 7 |
| FGFR1 | Fibroblast Growth Factor Receptor 1 |
| FGFR2 | Fibroblast Growth Factor Receptor 2 |
| FGFR3 | Fibroblast Growth Factor Receptor 3 |
| FLT3 | FMS-like Tyrosine Kinase 3 |
| GNA11 | G Protein Subunit Alpha 11 |
| GNAQ | G Protein Subunit Alpha Q |
| GNAS | GNAS Complex Locus |
| HNF1A | Hepatocyte Nuclear Factor 1 Homeobox |
| HRAS | HRas Proto-Oncogene, GTPase |
| IDH1 | Isocitrate Dehydrogenase 1 |
| IDH2 | Isocitrate Dehydrogenase 2 |
| JAK2 | Janus Kinase 2 |
| JAK3 | Janus Kinase 3 |
| KRAS | Kirsten Rat Sarcoma Viral Oncogene Homolog |
| MLH1 | MutL Homolog 1 |
| MPL | MPL Proto-oncogene, thrombopoieten receptor |
| NOTCH1 | NOTCH Receptor 1 |
| NPM1 | Nucleophosmin 1 |
| NRAS | NRAS Proto-Oncogene |
| PDFGRA | Platelet Derived Growth Factor Receptor Alpha |
| PTPN11 | Tyrosine-Protein Phosphatase Non-Receptor Type 11 |
| RB1 | RB Transcriptional Corepressor 1 |
| RET | Ret Proto-Oncogene |
| SMAD4 | Mothers Against Decapentaplegic Homolog 4 |
| SMARCB1 | SWI/SNF related, matrix associated, actin dependent regulator of chromatin, subfamily b, member 1 |
| SMO | Smoothened, Frizzled Class Receptor |
| SRC | SRC Proto-Oncogene, Non-Receptor Tyrosine Kinase |
| VHL | Von Hippel-Lindau Tumor Suppressor |
References
- Sung, H.; Ferlay, J.; Siegel, R.L.; Laversanne, M.; Soerjomataram, I.; Jemal, A.; Bray, F. Global cancer statistics 2020: GLOBOCAN estimates of incidence and mortality worldwide for 36 cancers in 185 countries. CA Cancer J. Clin. 2021, 71, 209–249. [CrossRef]
- Shiovitz, S.; Korde, L.A. Genetics of breast cancer: a topic in evolution. Ann. Oncol. 2015, 26, 1291–1299. [CrossRef]
- Porębska, N.; Poźniak, M.; Matynia, A.; Żukowska, D.; Zakrzewska, M.; Otlewski, J.; Łukasz Opaliński. Galectins as modulators of receptor tyrosine kinases signaling in health and disease. Cytokine & Growth Factor Reviews 2021, 60, 89–106. [CrossRef]
- Du, Z.; Lovly, C.M. Mechanisms of receptor tyrosine kinase activation in cancer. Mol. Cancer 2018, 17, 58. [CrossRef]
- Burguin, A.; Diorio, C.; Durocher, F. Breast cancer treatments: Updates and new challenges. J. Pers. Med. 2021, 11, 808. [CrossRef]
- Chou, F.C.; Chen, H.Y.; Kuo, C.C.; Sytwu, H.K. Role of galectins in tumors and in clinical immunotherapy. Int. J. Mol. Sci. 2018, 19. [CrossRef]
- Dalotto-Moreno, T.; Croci, D.O.; Cerliani, J.P.; Martinez-Allo, V.C.; Dergan-Dylon, S.; Méndez-Huergo, S.P.; Stupirski, J.C.; Mazal, D.; Osinaga, E.; Toscano, M.A.; Sundblad, V.; Rabinovich, G.A.; Salatino, M. Targeting galectin-1 overcomes breast cancer-associated immunosuppression and prevents metastatic disease. Cancer Res. 2013, 73, 1107–1117. [CrossRef]
- Wu, M.H.; Chen, Y.L.; Lee, K.H.; Chang, C.C.; Cheng, T.M.; Wu, S.Y.; Tu, C.C.; Tsui, W.L. Glycosylation-dependent galectin-1/neuropilin-1 interactions promote liver fibrosis through activation of TGF-β- and PDGF-like signals in hepatic stellate cells. Sci. Rep. 2017, 7, 11006.
- Moon, B.K.; Lee, Y.J.; Battle, P.; Jessup, J.M.; Raz, A.; Kim, H.R. Galectin-3 protects human breast carcinoma cells against nitric oxide-induced apoptosis: implication of galectin-3 function during metastasis. Am. J. Pathol. 2001, 159, 1055–1060.
- Zhang, H.; Luo, M.; Liang, X.; Wang, D.; Gu, X.; Duan, C.; Gu, H.; Chen, G.; Zhao, X.; Zhao, Z.; Liu, C. Galectin-3 as a marker and potential therapeutic target in breast cancer. PLoS One 2014, 9, e103482. [CrossRef]
- Boscher, C.; Zheng, Y.Z.; Lakshminarayan, R.; Johannes, L.; Dennis, J.W.; Foster, L.J.; Nabi, I.R. Galectin-3 protein regulates mobility of N-cadherin and GM1 ganglioside at cell-cell junctions of mammary carcinoma cells. J. Biol. Chem. 2012, 287, 32940–32952. [CrossRef]
- Morishita, A.; Nomura, K.; Tani, J.; Fujita, K.; Iwama, H.; Takuma, K.; Nakahara, M.; Tadokoro, T.; Oura, K.; Chiyo, T.; Fujihara, S.; Niki, T.; Hirashima, M.; Nishiyama, A.; Himoto, T.; Masaki, T. Galectin-9 suppresses the tumor growth of colon cancer in vitro and in vivo. Oncol. Rep. 2021, 45.
- Zhu, C.; Anderson, A.C.; Schubart, A.; Xiong, H.; Imitola, J.; Khoury, S.J.; Zheng, X.X.; Strom, T.B.; Kuchroo, V.K. The Tim-3 ligand galectin-9 negatively regulates T helper type 1 immunity. Nat. Immunol. 2005, 6, 1245–1252. [CrossRef]
- Liu, D.; Zhu, H.; Li, C. Galectins and galectin-mediated autophagy regulation: new insights into targeted cancer therapy. Biomark. Res. 2023, 11, 22. [CrossRef]
- Ito, K.; Scott, S.A.; Cutler, S.; Dong, L.F.; Neuzil, J.; Blanchard, H.; Ralph, S.J. Thiodigalactoside inhibits murine cancers by concurrently blocking effects of galectin-1 on immune dysregulation, angiogenesis and protection against oxidative stress. Angiogenesis 2011, 14, 293–307. [CrossRef]
- Sethi, A.; Sanam, S.; Alvala, R.; Alvala, M. An updated patent review of galectin-1 and galectin-3 inhibitors and their potential therapeutic applications (2016-present). Expert Opin. Ther. Pat. 2021, 31, 709–721. [CrossRef]
- Zhu, L.; Chvatal, S.A.; Hayes, H.B.; Millard, D.C.; Gomillion, C.T. Abstract 4918: Modified citrus pectin slows migration of triple negative breast cancer cells in an impedance-based scratch assay. Tumor Biology. American Association for Cancer Research, 2020. [CrossRef]
- Waarts, M.R.; Stonestrom, A.J.; Park, Y.C.; Levine, R.L. Targeting mutations in cancer. J. Clin. Invest. 2022, 132. [CrossRef]
- Safety of GM-CT-01 With and Without 5-Fluorouracil in Patients With Solid Tumors, Identifier NCT00054977. U.S. National Library of Medicine. 2003. https://classic.clinicaltrials.gov/ct2/show/study/NCT00054977 (accessed 06-04-2024).
- Zheng, S.; Song, J.; Linghu, D.; Yang, R.; Liu, B.; Xue, Z.; Chen, Q.; Liu, C.; Zhong, D.; Hung, M.C.; Sun, L. Galectin-9 blockade synergizes with ATM inhibition to induce potent anti-tumor immunity. Int. J. Biol. Sci. 2023, 19, 981–993. [CrossRef]
- Funkhouser, A.T.; Strigenz, A.M.; Blair, B.B.; Miller, A.P.; Shealy, J.C.; Ewing, J.A.; Martin, J.C.; Funk, C.R.; Edenfield, W.J.; Blenda, A.V. KIT mutations correlate with higher galectin levels and brain metastasis in breast and non-small cell lung cancer. Cancers (Basel) 2022, 14, 2781. [CrossRef]
- Orrantia-Borunda, E.; Anchondo-Nuñez, P.; Acuña-Aguilar, L.E.; Gómez-Valles, F.O.; Ramírez-Valdespino, C.A. Subtypes of Breast Cancer. In Breast Cancer; Exon Publications, 2022; pp. 31–42.
- Makki, J. Diversity of breast carcinoma: Histological subtypes and clinical relevance. Clin. Med. Insights Pathol. 2015, 8, 23–31. [CrossRef]
- Jones, C. Ductal carcinoma in situ: The weight of the word “cancer”. American Association for Cancer Research, 2022. https://www.aacr.org/blog/2022/10/12/ductal-carcinoma-in-situ-the-weight-of-the-word-cancer/ (accessed 06-04-2024).
- Li, C.H.; Chang, Y.C.; Hsiao, M.; Liang, S.M. FOXD1 and Gal-3 form a positive regulatory loop to regulate lung cancer aggressiveness. Cancers (Basel) 2019, 11, 1897. [CrossRef]
- Cecchinelli, B.; Lavra, L.; Rinaldo, C.; Iacovelli, S.; Gurtner, A.; Gasbarri, A.; Ulivieri, A.; Del Prete, F.; Trovato, M.; Piaggio, G.; Bartolazzi, A.; Soddu, S.; Sciacchitano, S. Repression of the antiapoptotic molecule galectin-3 by homeodomain-interacting protein kinase 2-activated p53 is required for p53-induced apoptosis. Mol. Cell. Biol. 2006, 26, 4746–4757. [CrossRef]
- Lavra, L.; Rinaldo, C.; Ulivieri, A.; Luciani, E.; Fidanza, P.; Giacomelli, L.; Bellotti, C.; Ricci, A.; Trovato, M.; Soddu, S.; Bartolazzi, A.; Sciacchitano, S. The loss of the p53 activator HIPK2 is responsible for galectin-3 overexpression in well differentiated thyroid carcinomas. PLoS One 2011, 6, e20665. [CrossRef]

Table 1.
Galectin Level Summary
| Galectin | n | Mean (ng/mL) | SD (ng/mL) | Median (ng/mL) | IQR (ng/mL) | Min-Max (ng/mL) |
|---|---|---|---|---|---|---|
| Gal-1 | 71 | 23.77 | 7.06 | 23.61 | 17.70-27.78 | 11.02-46.09 |
| Gal-3 | 71 | 13.31 | 6.86 | 12.24 | 8.68-16.39 | 2.76-37.75 |
| Gal-9 | 50 | 9.17 | 3.23 | 9.14 | 6.37-11.16 | 3.56-17.96 |
Table 2.
Mutation Count With Specific Amino Acid Substitutions
| Gene | Mutation | Mutation Count | Percent of Mutations | Sample Count | Percent of Samples |
|---|---|---|---|---|---|
| PIK3CA | p.Ile391Met | 10 | 7.87% | ||
| p.His1047Arg | 10 | 7.87% | |||
| p.Glu545Lys | 7 | 5.51% | |||
| p.Glu542Lys | 2 | 1.57% | |||
| Other | 5 | 3.94% | |||
| Total | 34 | 26.77% | 31 | 43.66% | |
| TP53 | p.Pro72Arg | 5 | 3.94% | ||
| p.Arg273His | 2 | 1.57% | |||
| Other | 20 | 15.75% | |||
| Total | 27 | 21.26% | 31 | 43.66% | |
| KDR | p.Gln472His | 19 | 14.96% | ||
| Total | 19 | 14.96% | 19 | 26.76% | |
| MET | p.Asn375Ser | 6 | 4.72% | ||
| p.Met362Thr | 2 | 1.57% | |||
| Total | 8 | 6.30% | 8 | 11.27% | |
| KIT | p.Met541Leu | 5 | 3.94% | ||
| p.Val530Ile | 1 | 0.79% | |||
| Total | 6 | 4.72% | 6 | 8.45% | |
| ]1*Other | Other | 33 | 25.98% | 27 | 38.03% |
| ]1*Total | 127 | 114 |
Table 3.
Genetic Mutation Status vs. Galectin Levels Pooled T-test Results
| Gal-1 | Gal-3 | Gal-9 | Gene | Mutated Sample Count |
|---|---|---|---|---|
| 0.8976 | 0.0824 | 0.6305 | PIK3CA | 31 |
| 0.8114 | 0.0267 | 0.9855 | TP53 | 23 |
| 0.5651 | 0.2049 | 0.5275 | KDR | 19 |
| 0.4896 | 0.6764 | 0.2506 | MET | 8 |
| 0.0131 | 0.0607 | 0.0254 | KIT | 6 |
Table 4.
Luminal A Molecular Subtype Pooled T-test Results
| Gal-1 | Gal-3 | Gal-9 | Gene | Mutated Sample Count |
|---|---|---|---|---|
| 0.4592 | 0.1084 | 0.5931 | PIK3CA | 20 |
| 0.6502 | 0.8224 | 0.0958 | KDR | 10 |
| 0.8629 | 0.0014 | 0.5964 | TP53 | 7 |
| 0.9119 | 0.6979 | 0.0173 | MET | 5 |
| 0.0418 | 0.8083 | 0.0395 | FLT3 | 3 |
Table 5.
Triple Negative Wilcoxon Rank Sum Test Results
| Gal-1 | Gal-3 | Gal-9 | Gene | Mutated Sample Count |
|---|---|---|---|---|
| 0.2980 | 0.6889 | 0.2703 | TP53 | 6 |
| 0.3502 | 0.5522 | 0.1877 | PIK3CA | 4 |
| 0.5522 | 0.3502 | 0.9025 | KDR | 4 |
| 0.9145 | 0.5912 | 1.0000 | KIT | 2 |
Table 6.
Odds ratio of KIT and metastatic disease progression
| KIT Status | Metastatic Sample Count | Primary Sample Count |
|---|---|---|
| Mutated | 3 | 3 |
| Wild Type | 5 | 36 |
Table 7.
Odds ratio of PIK3CA and metastatic disease progression
| PIK3CA Status | Metastatic Sample Count | Primary Sample Count |
|---|---|---|
| Mutated | 5 | 24 |
| Wild Type | 3 | 35 |
Disclaimer/Publisher’s Note: The statements, opinions and data contained in all publications are solely those of the individual author(s) and contributor(s) and not of MDPI and/or the editor(s). MDPI and/or the editor(s) disclaim responsibility for any injury to people or property resulting from any ideas, methods, instructions or products referred to in the content. |
© 2024 by the authors. Licensee MDPI, Basel, Switzerland. This article is an open access article distributed under the terms and conditions of the Creative Commons Attribution (CC BY) license (http://creativecommons.org/licenses/by/4.0/).
Copyright: This open access article is published under a Creative Commons CC BY 4.0 license, which permit the free download, distribution, and reuse, provided that the author and preprint are cited in any reuse.


