Submitted:
10 May 2024
Posted:
10 May 2024
You are already at the latest version
Abstract
Keywords:
1. Introduction
2. Materials and Methods
2.1 Study Area
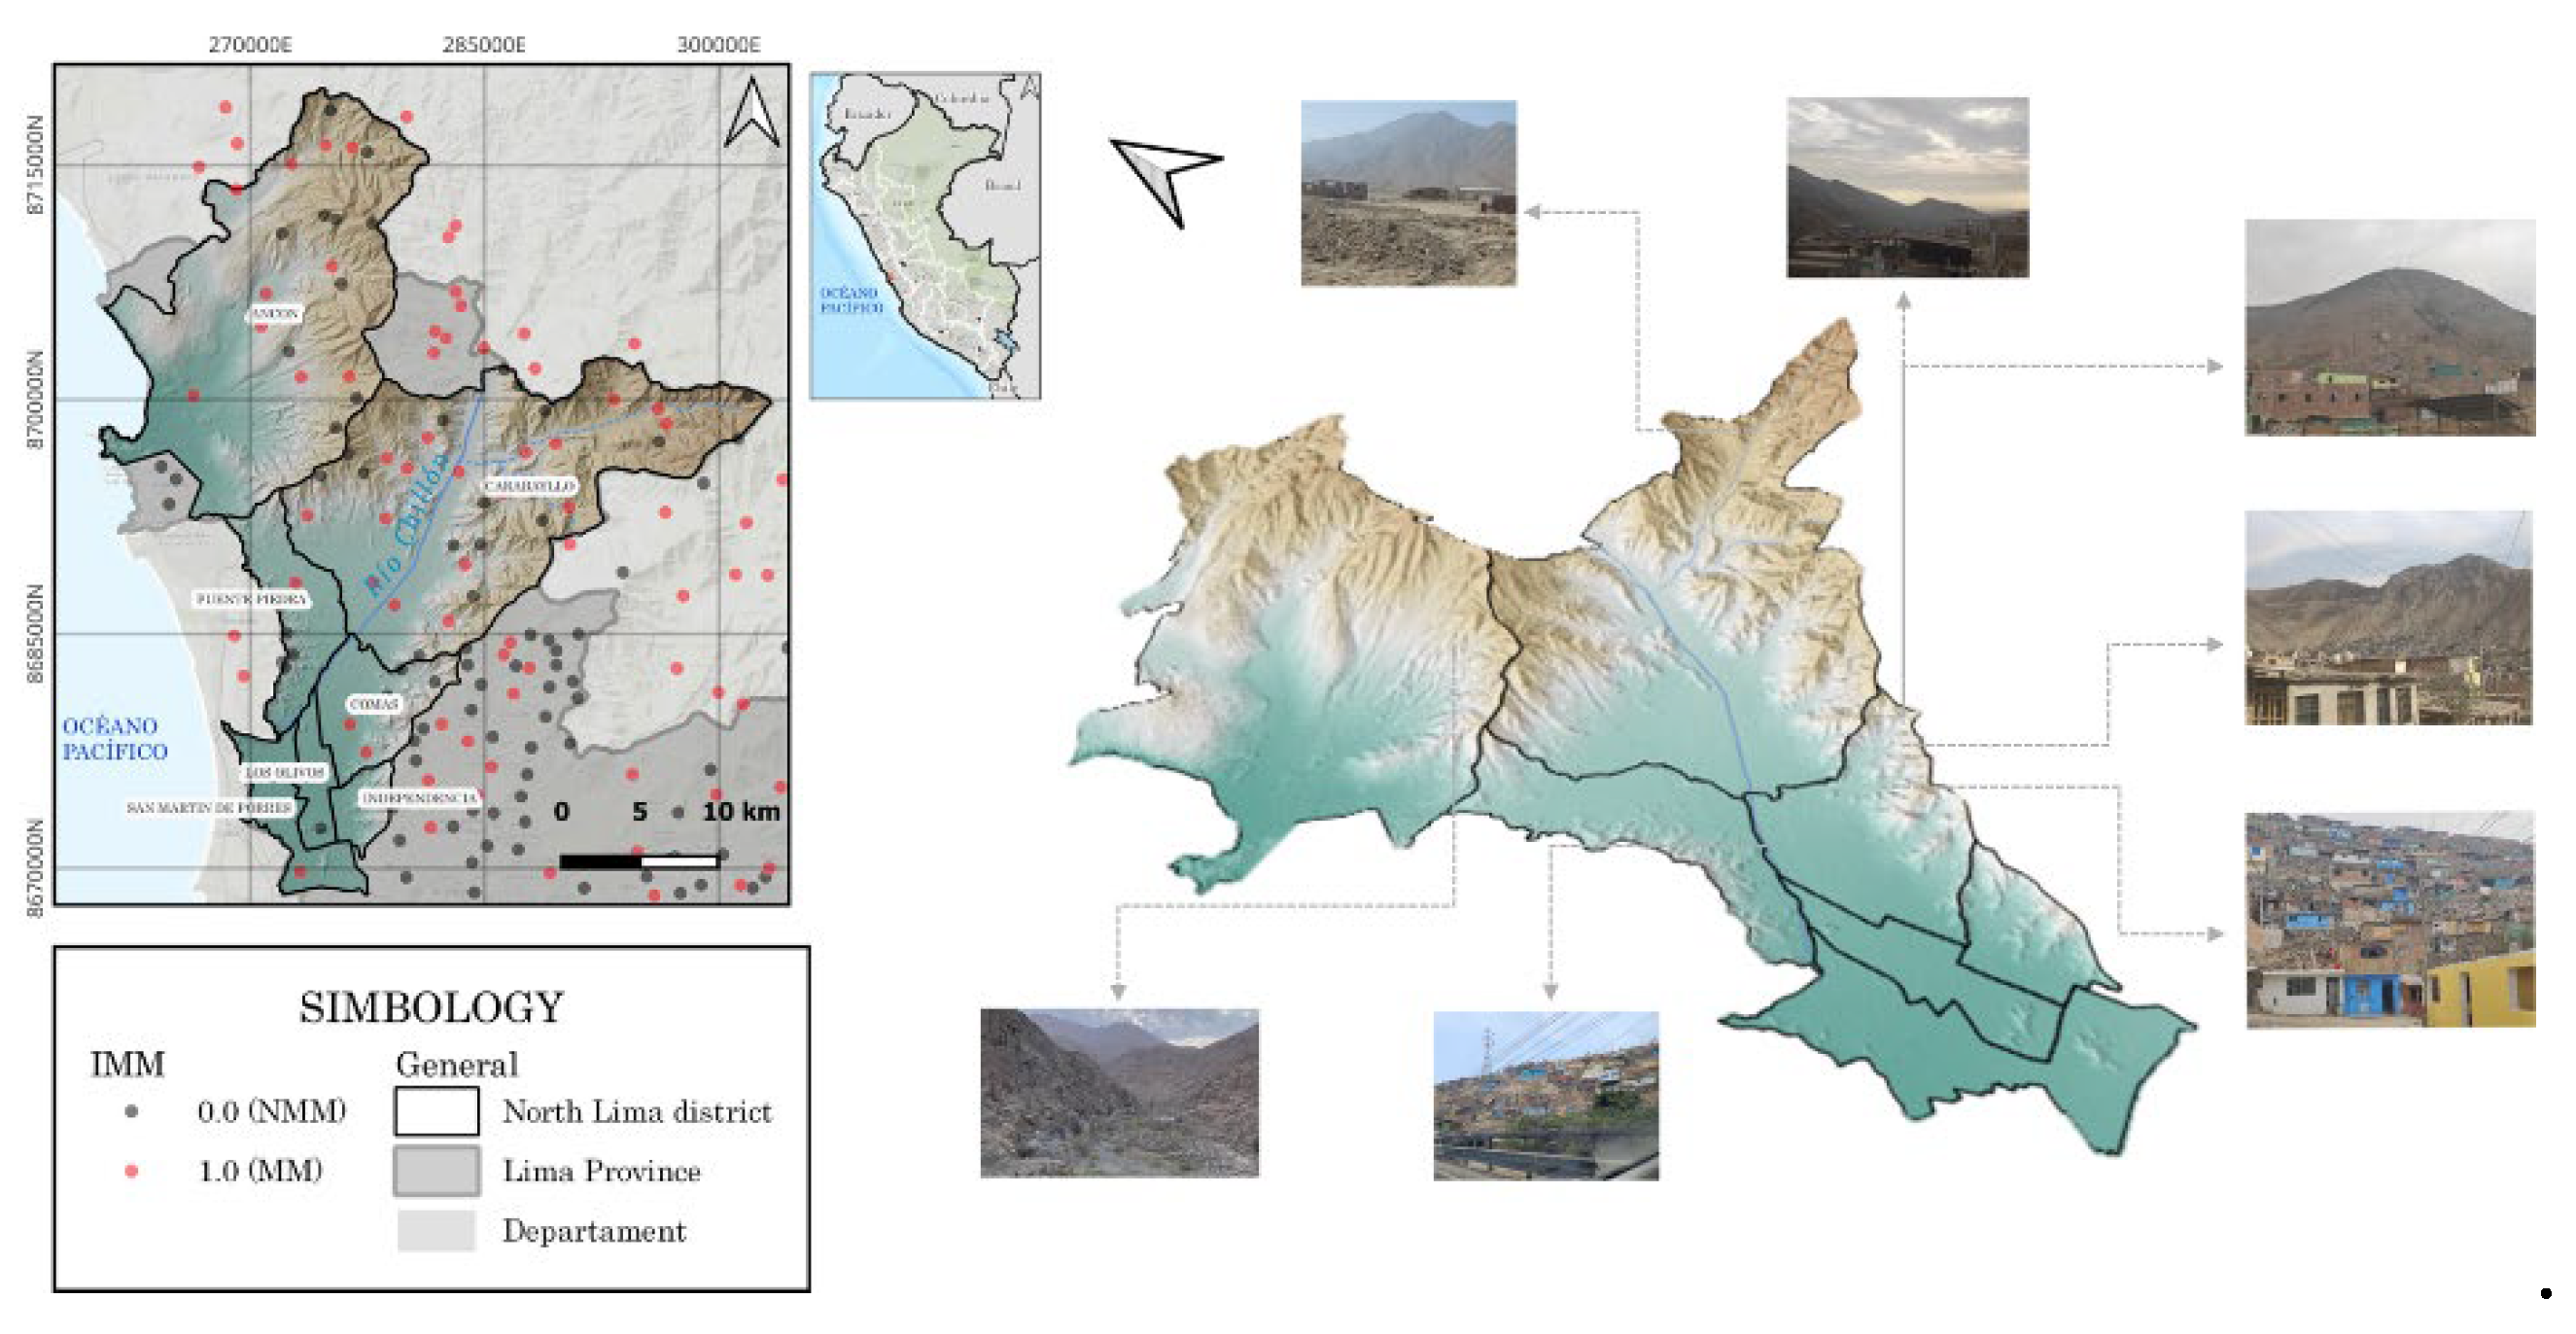
2.2 Mass Movement Inventory (MMI)
2.3 Data
| Type | Description | Type | Scale or spatial resolution | Year | Source | Link (last Access 02/02/2024) |
|---|---|---|---|---|---|---|
| Vectorial | Lithology | Discrete | 1/100,000 | - | INGEMMET | https://geocatmin.ingemmet.gob.pe/geocatmin/ |
| Geomorphology | Discrete | 1/100,000 | - | INGEMMET | https://geocatmin.ingemmet.gob.pe/geocatmin/ | |
| Hydrogeology | Discrete | 1/100,000 | INGEMMET | https://geocatmin.ingemmet.gob.pe/geocatmin/ | ||
| Mass Movements Inventory | Discrete | 1/50,000 | 2021 | INGEMMET | https://geocatmin.ingemmet.gob.pe/geocatmin/ | |
| Raster | Vegetation Cover | Discrete | 1/100,000 | INGEMMET | https://www.datosabiertos.gob.pe/dataset/cobertura-vegetal-ministerio-del-ambiente | |
| Digital Elevation Model (DEM) | Continuous | 12.5m | 2010 | USGS | https://earthexplorer.usgs.gov/ | |
| Seismic Microzonation | Continuous | - | - | IGP/CISMID | https://www.igp.gob.pe/servicios/infraestructura-de-datos-espaciales/componentes/webservice | |
| Precipitation Anomalies in El Niño phenomenon | Discrete | 100m | 2021 | SENAMHI | Information provided by the institution. |
| Class | Name | Variable | PCA | Type of variable | ||
| Conditioning factor | ||||||
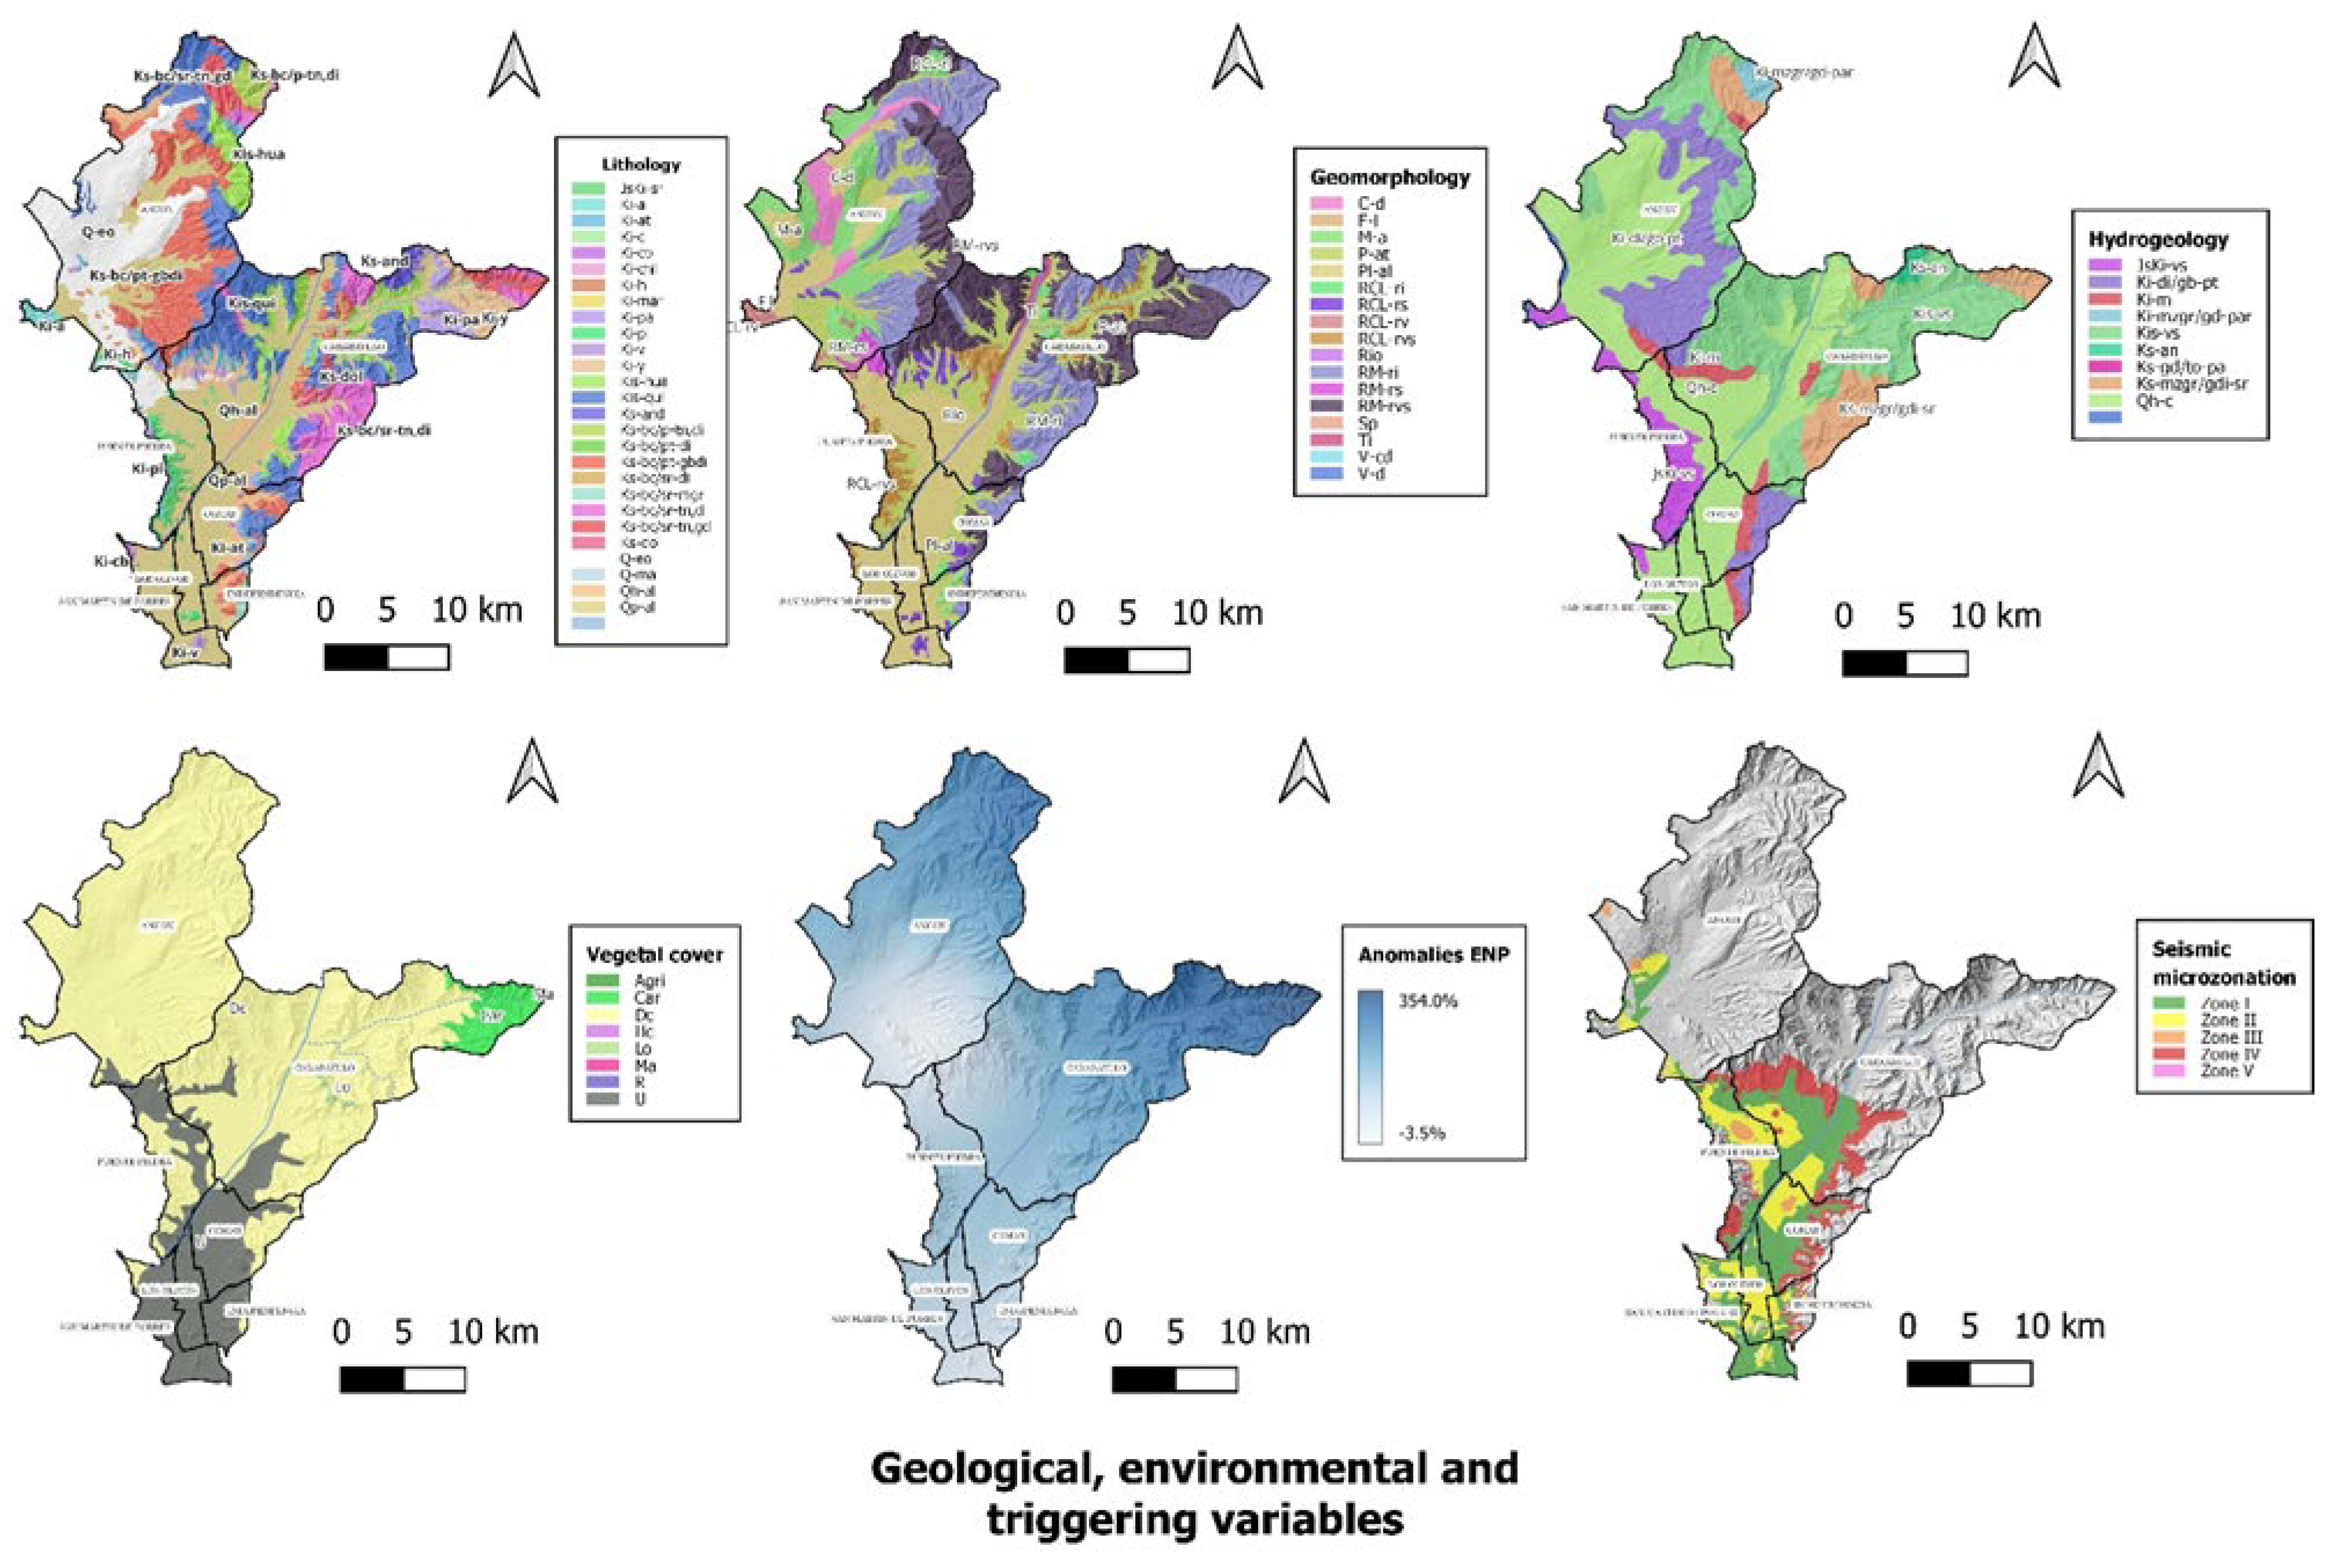
| Geological and environmental | Lithology | X1 | - | Categorical | ||
| Geomorphology | X2 | - | Categorical | |||
| Hydrology | X3 | - | Categorical | |||
| Vegetation cover | X4 | - | Categorical | |||
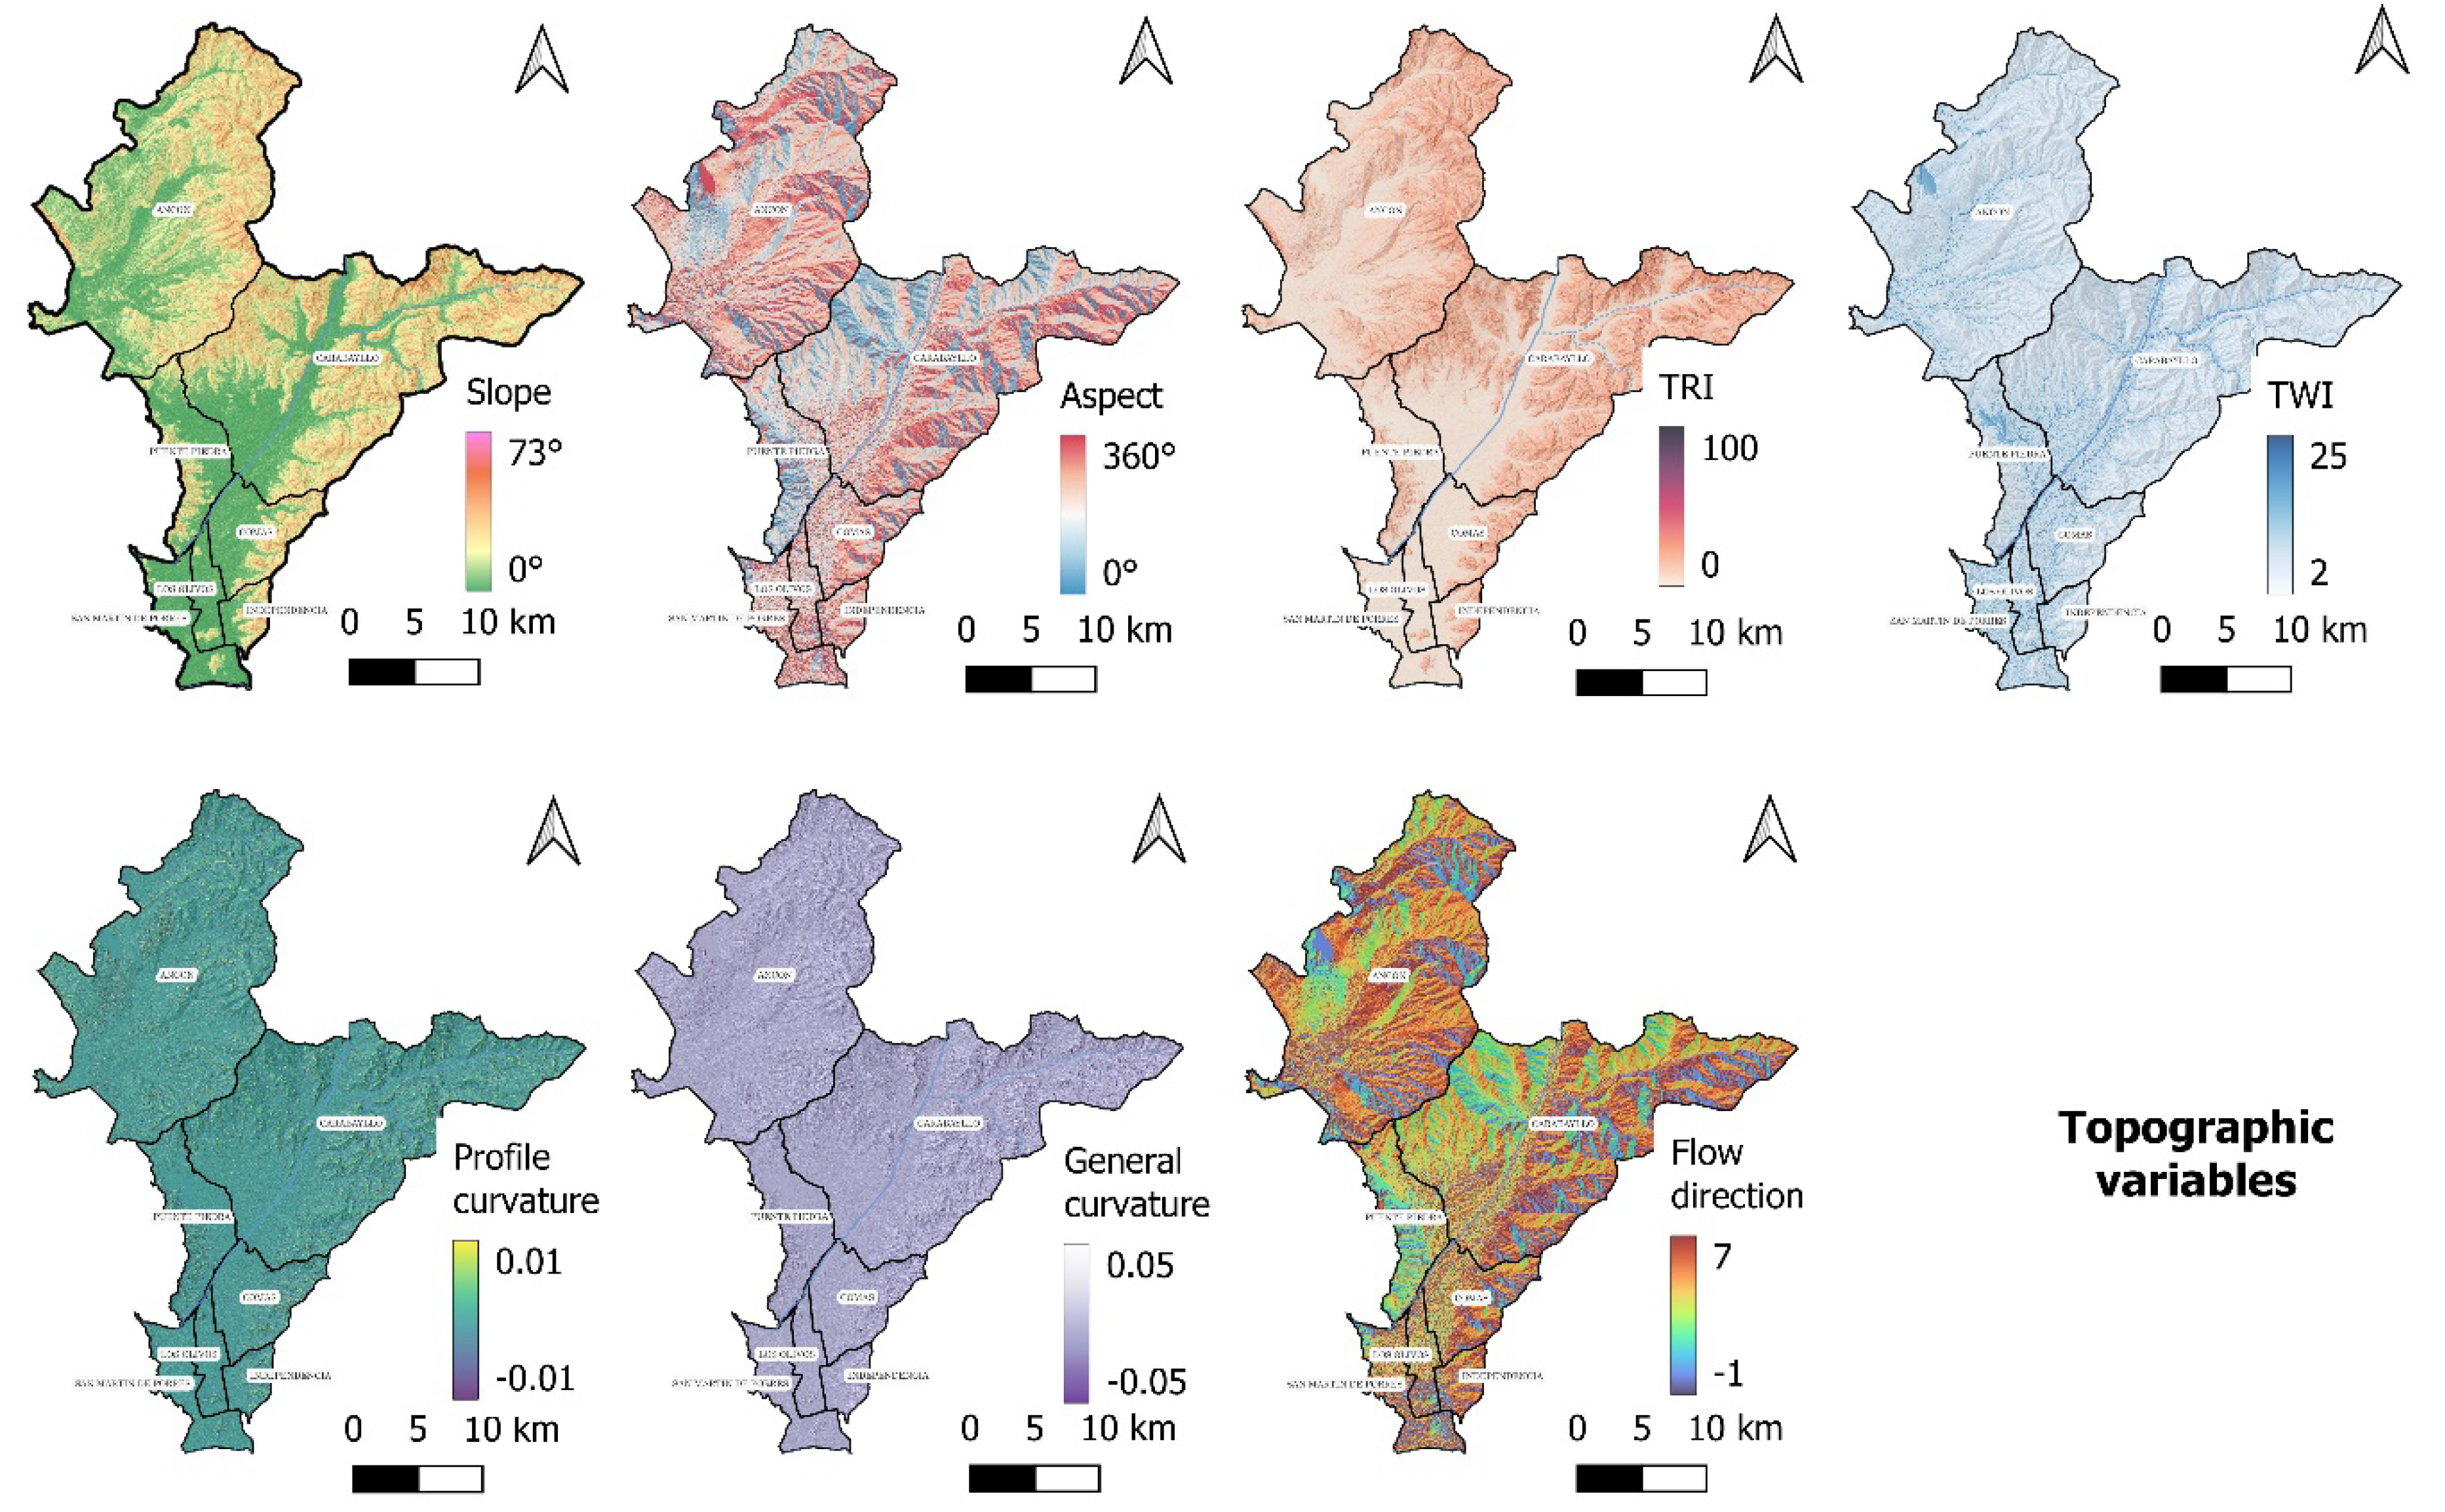
| Topographical | Slope | T1 | PCA1 PCA2 PCA3 |
Continuous | ||
| Aspect | T2 | Continuous | ||||
| Topographic wetness index (TWI) | T3 | |||||
| Terrain roughness index (TRI) | T4 | Continuous | ||||
| Flow direction | T5 | Continuous | ||||
| Profile curvature | T6 | Continuous | ||||
| General curvature | T7 | Continuous | ||||
| Triggering factors | ||||||
| Seismic 8.8Mw (seismic microzonation) Precipitation anomalies in El Niño phenomenon |
D1 | - | Continuous | |||
| D2 | - | Continuous | ||||
2.4 Methods
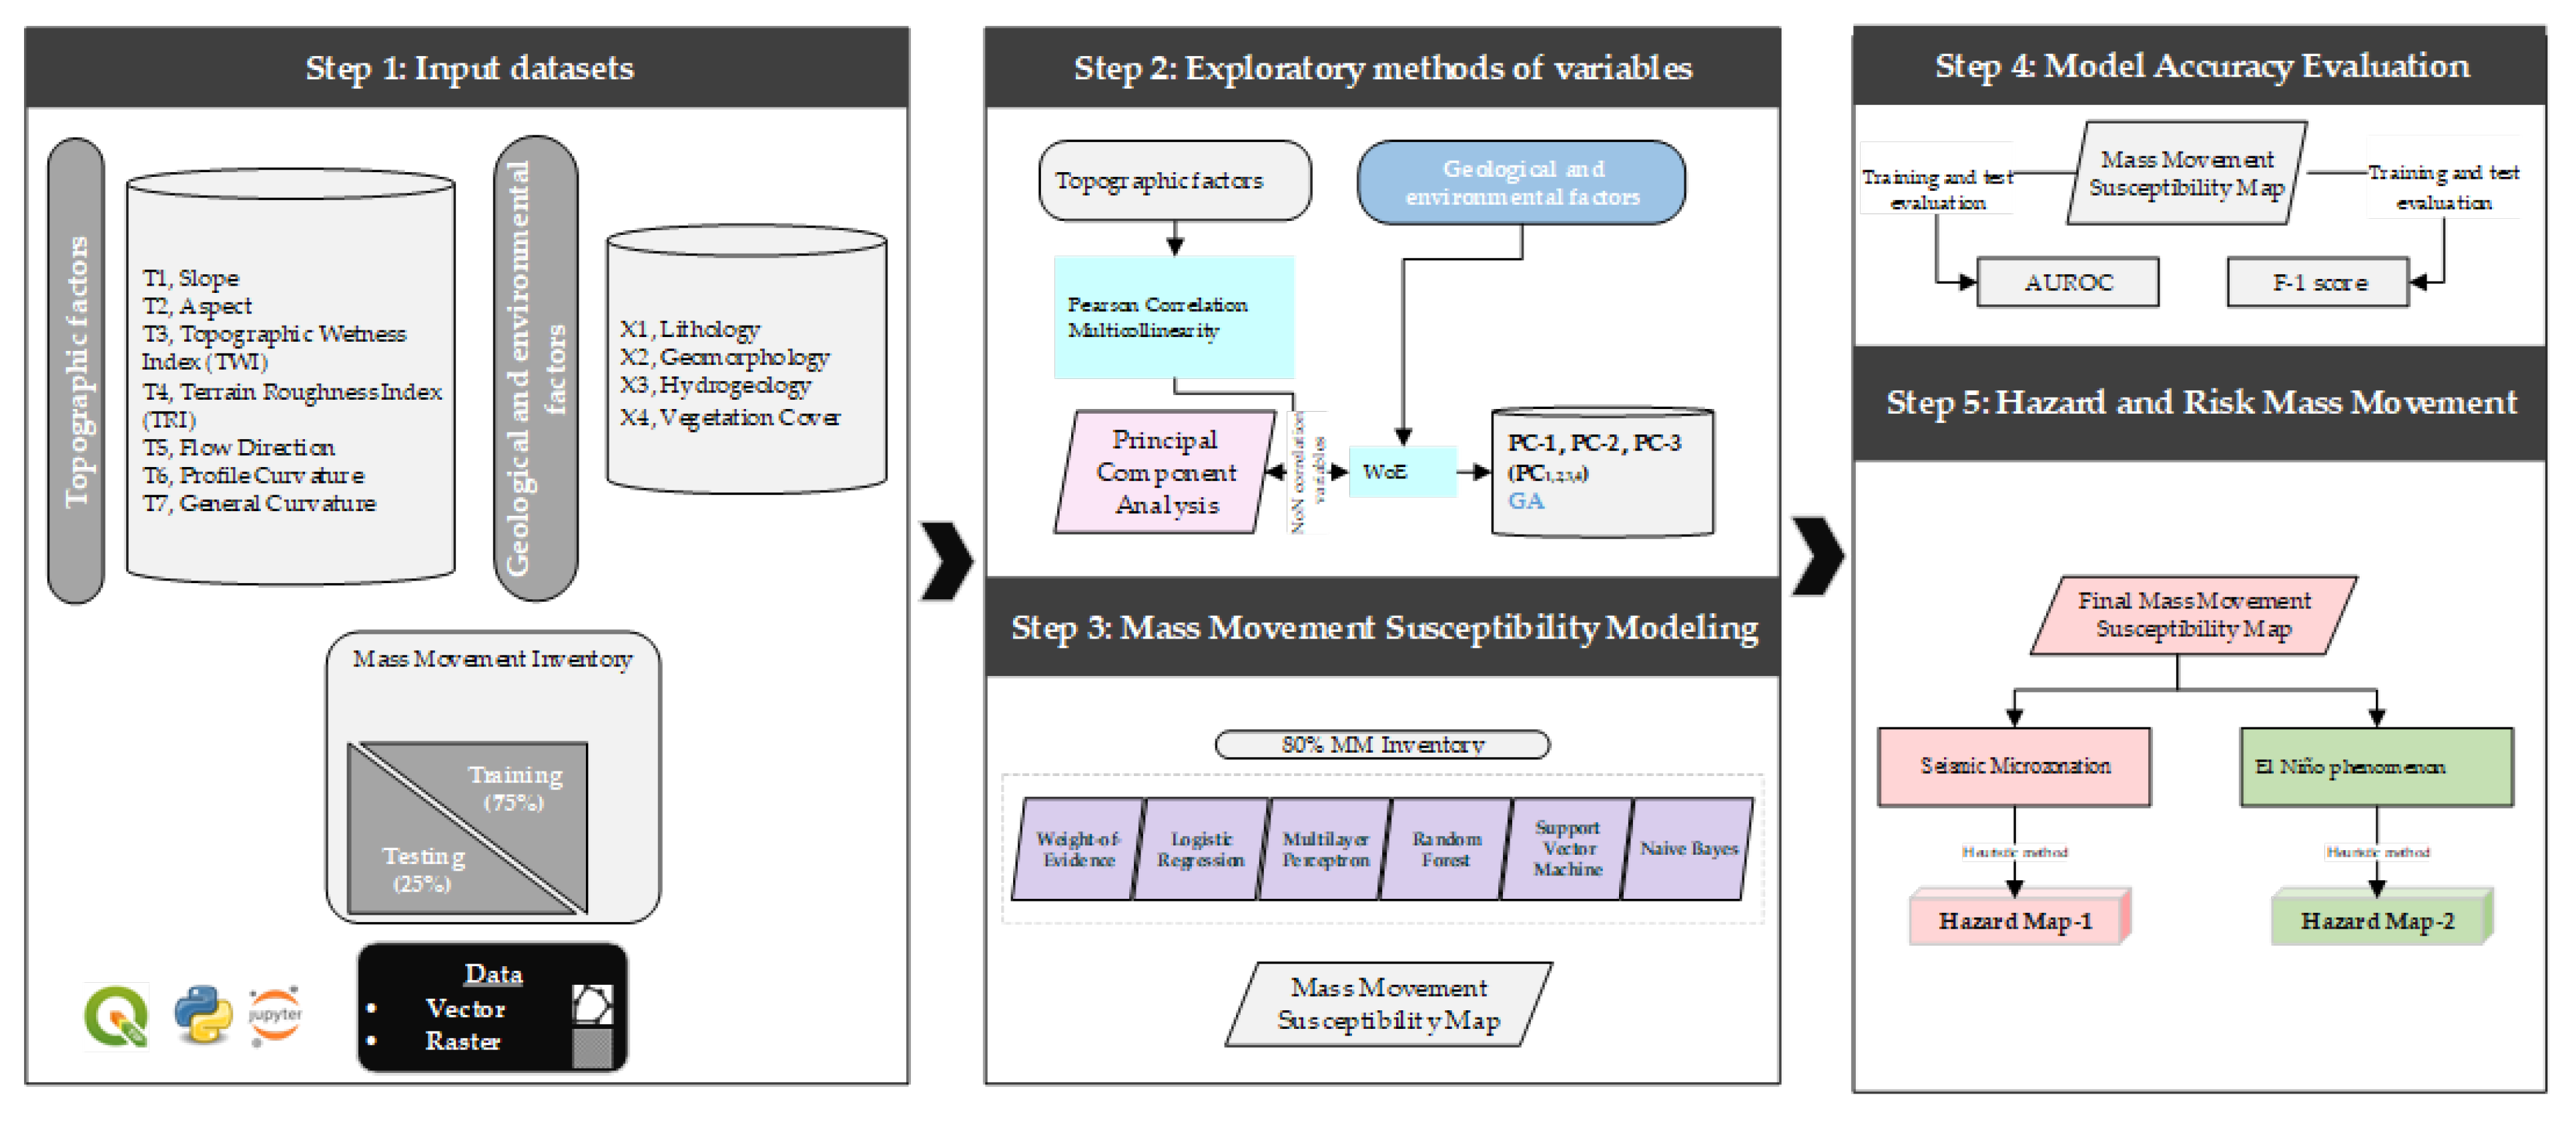
2.4.1. Exploratory Variable Methods
2.4.1.1. Pearson Correlation
2.4.1.2. Multicollinearity
2.4.1. Principal Component Analysis (PCA)
2.4.2. Weights of Evidence (WoE)
2.4.3. Logistic Regression (LR)
2.4.4. Multilayer Perceptron (MLP)
2.4.5. Support Vector Machine (SVM)
2.4.6. Random Forest (RF)
2.4.7. Naive Bayes (NB)
2.4.8. Validation and Testing of the Models
Curva ROC y AUC
F-1 Score
2.4.9. Machine Learning Hyperparameters
| Model | Hyperparameters |
| LR | method='bfgs', |
| MLP | lr=0.1, arquitectura [4,4,4,1], epochs=1000, activation 'relu' |
| SVM | Kernel='linear' |
| RF | n_estimators=360, max_depth=11, criterion='gini', min_samples_split=5, min_samples_leaf=1 |
| NB | priors=None, var_smoothing=1e-9 |
3. Results
3.1. Exploration of Variables

| Name | Variable | VIF |
| Intercept | - | 10.1 |
| Slope | T1 | 67.3 |
| Aspect | T2 | 1.5 |
| Topographic Wetness Index (TWI) | T3 | - |
| ÍTerrain Roughness Index (TRI) | T4 | 67.3 |
| Flow direction | T5 | 1.4 |
| Profile curvature | T6 | 3 |
| General curvature | T7 | 3 |
3.2 Mass Movement Susceptibility (MMS)
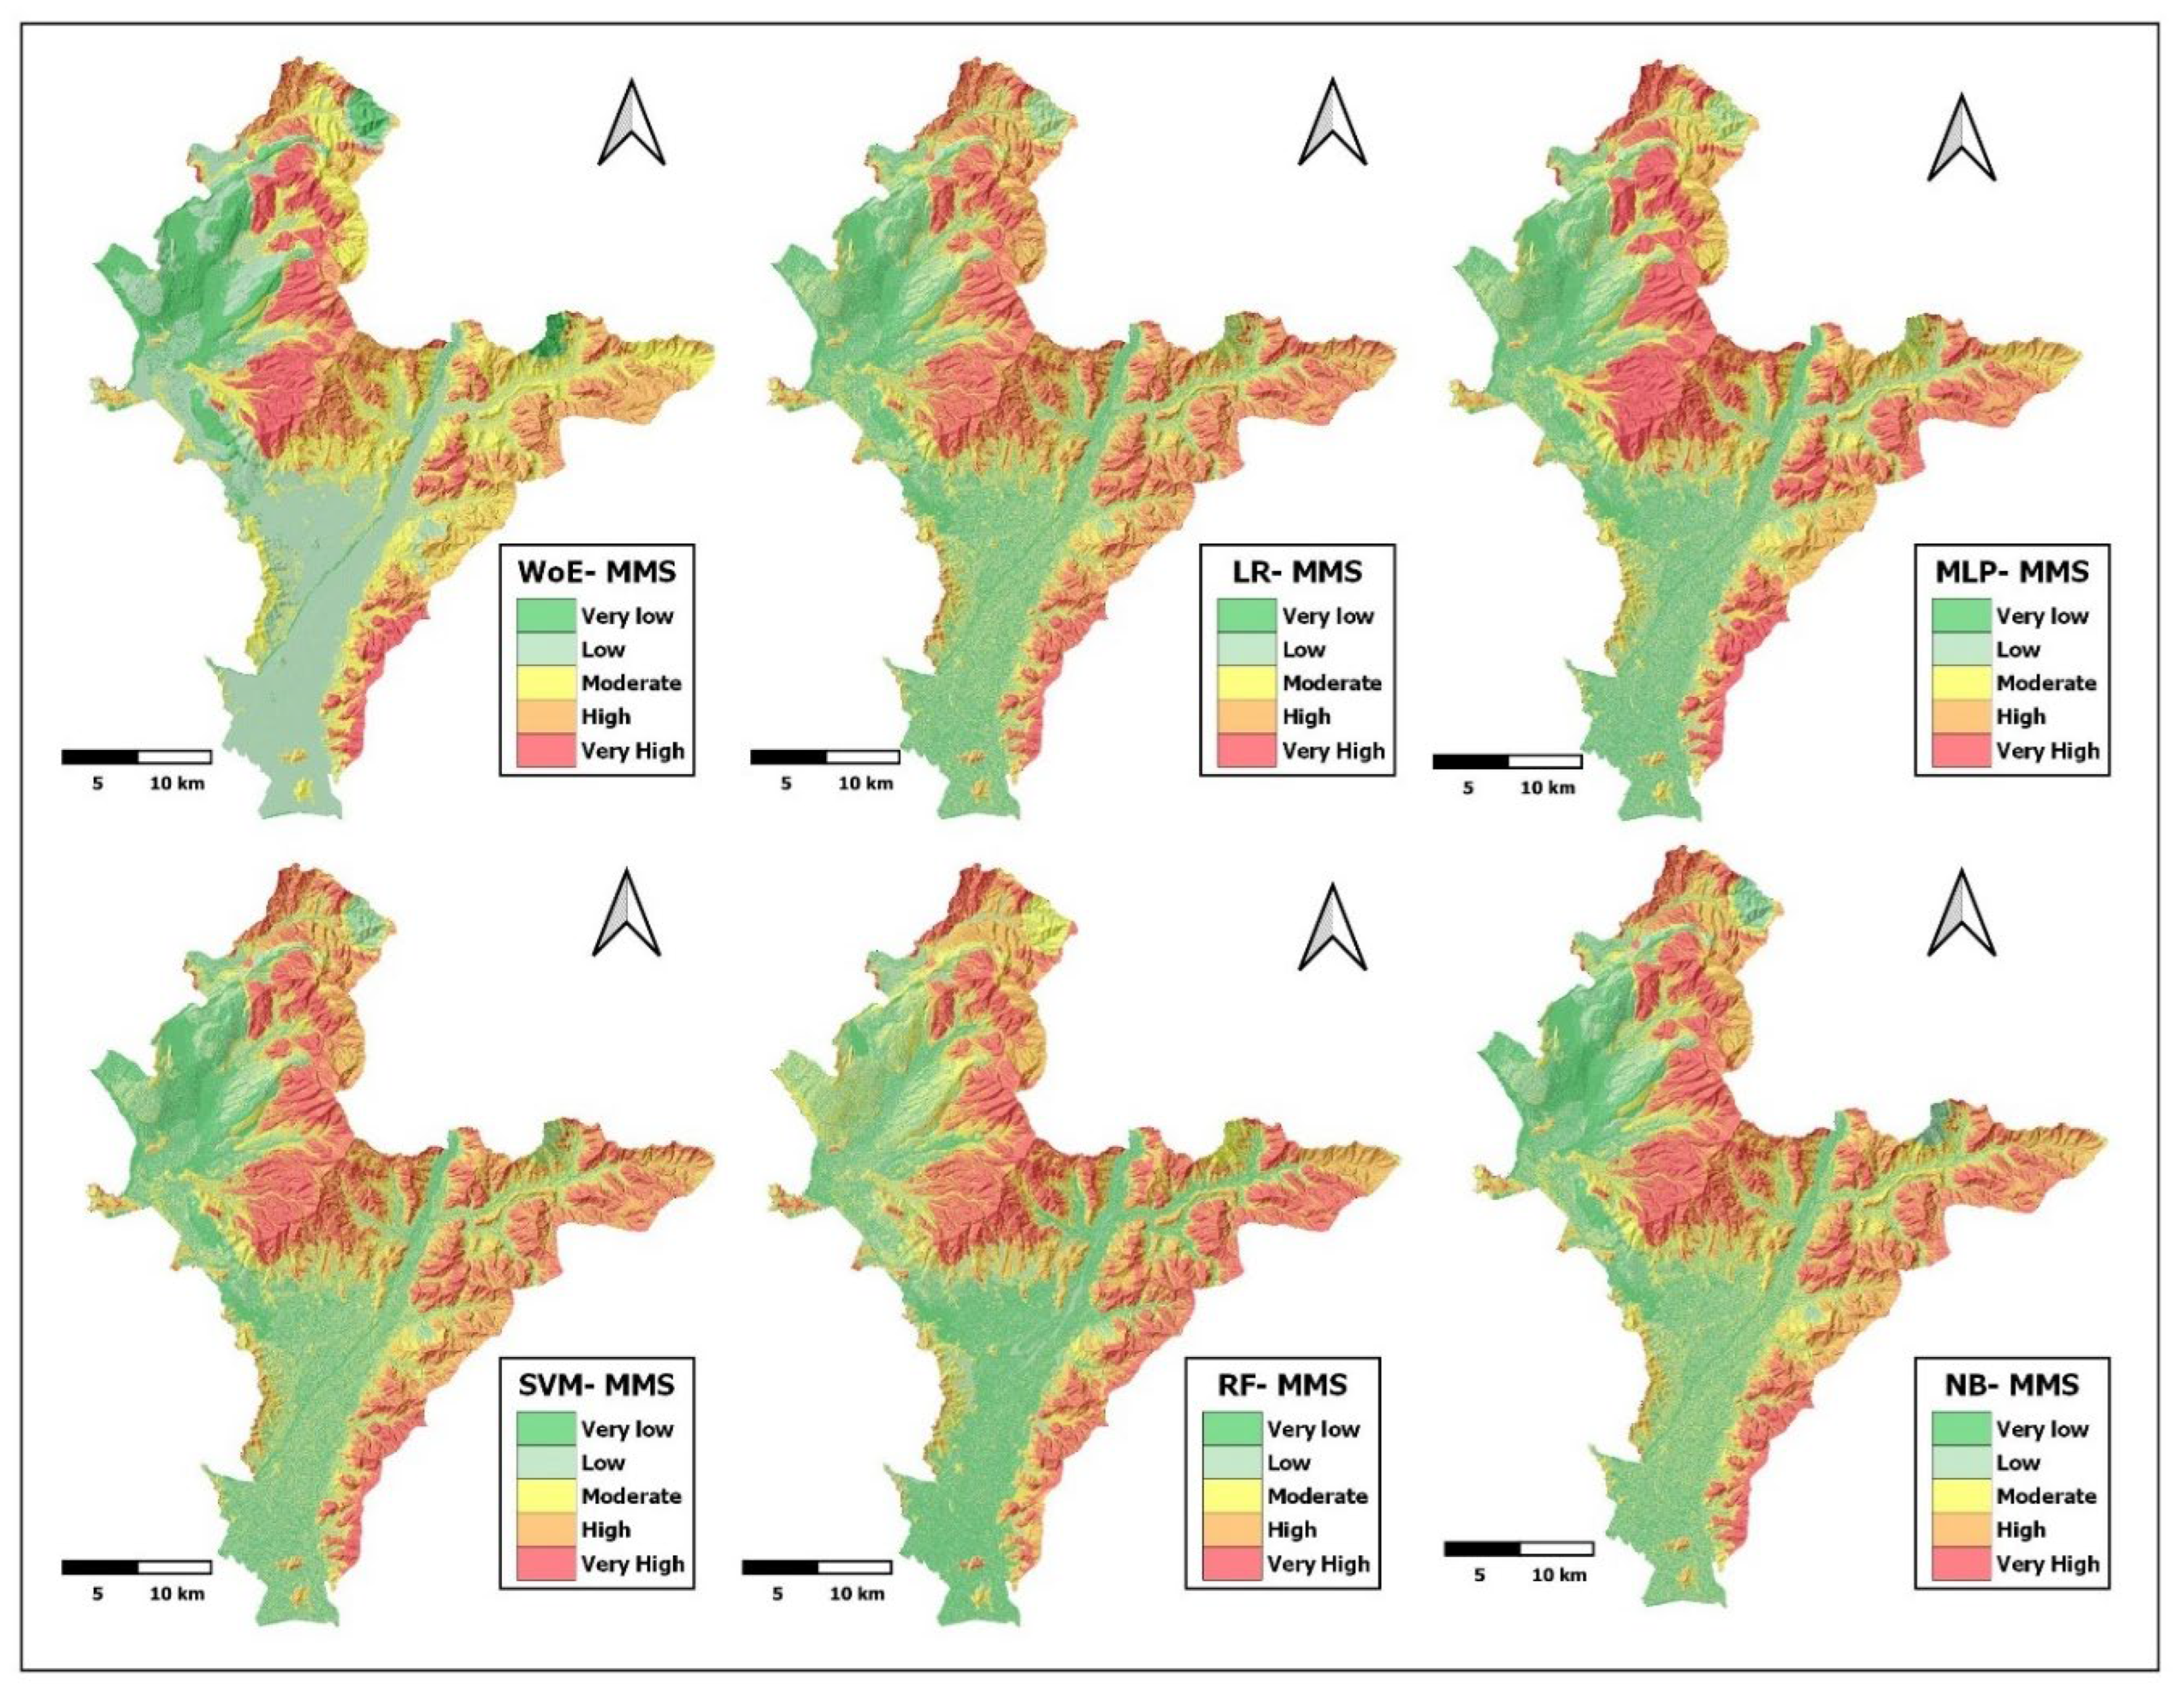
3.3. MM Hazard Scenarios
4. Discussion
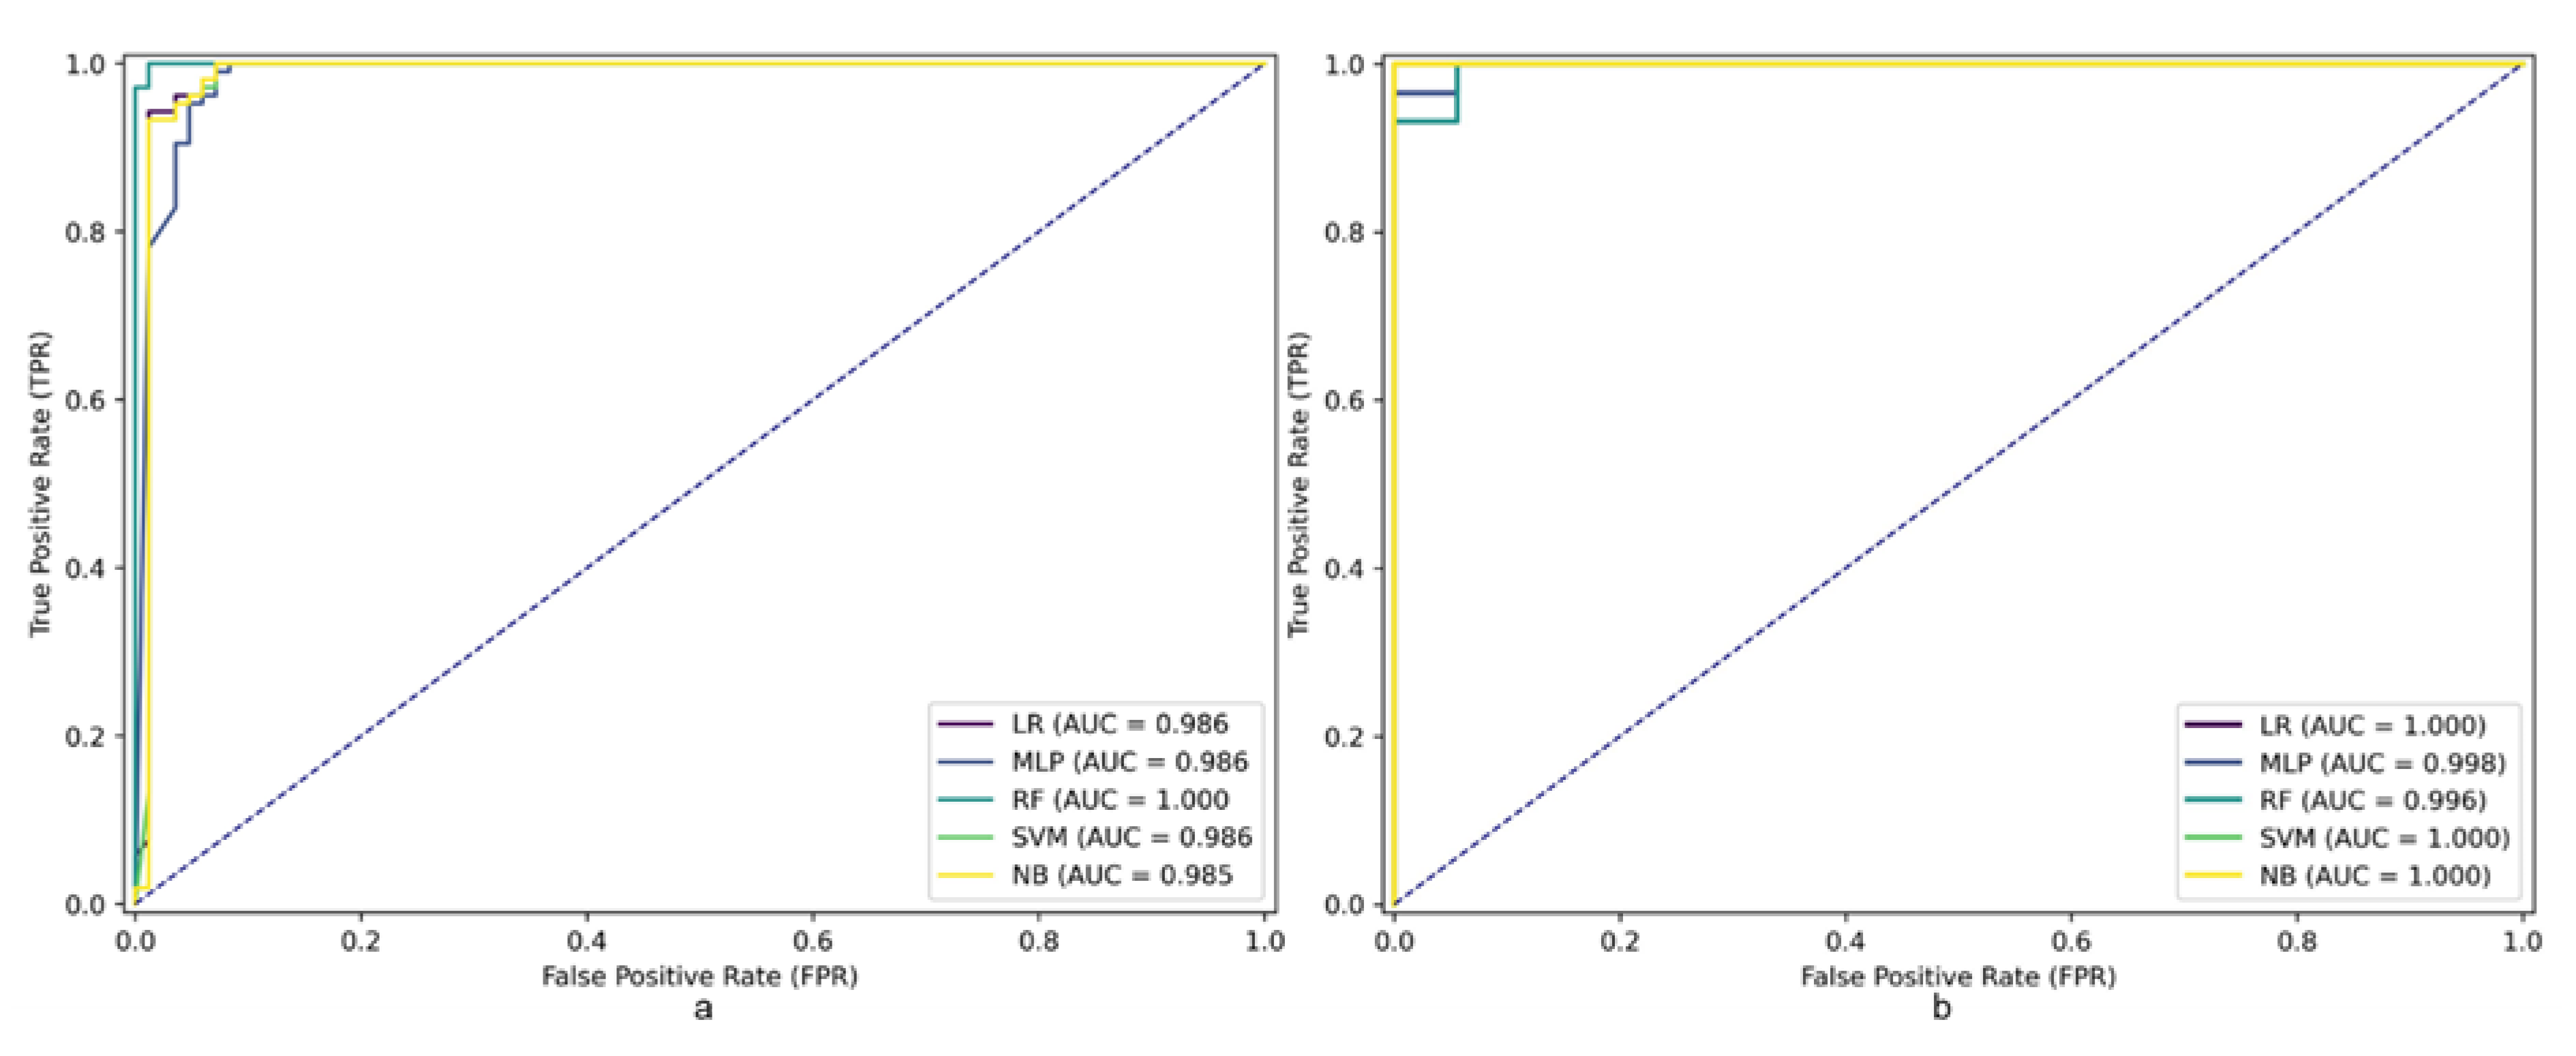
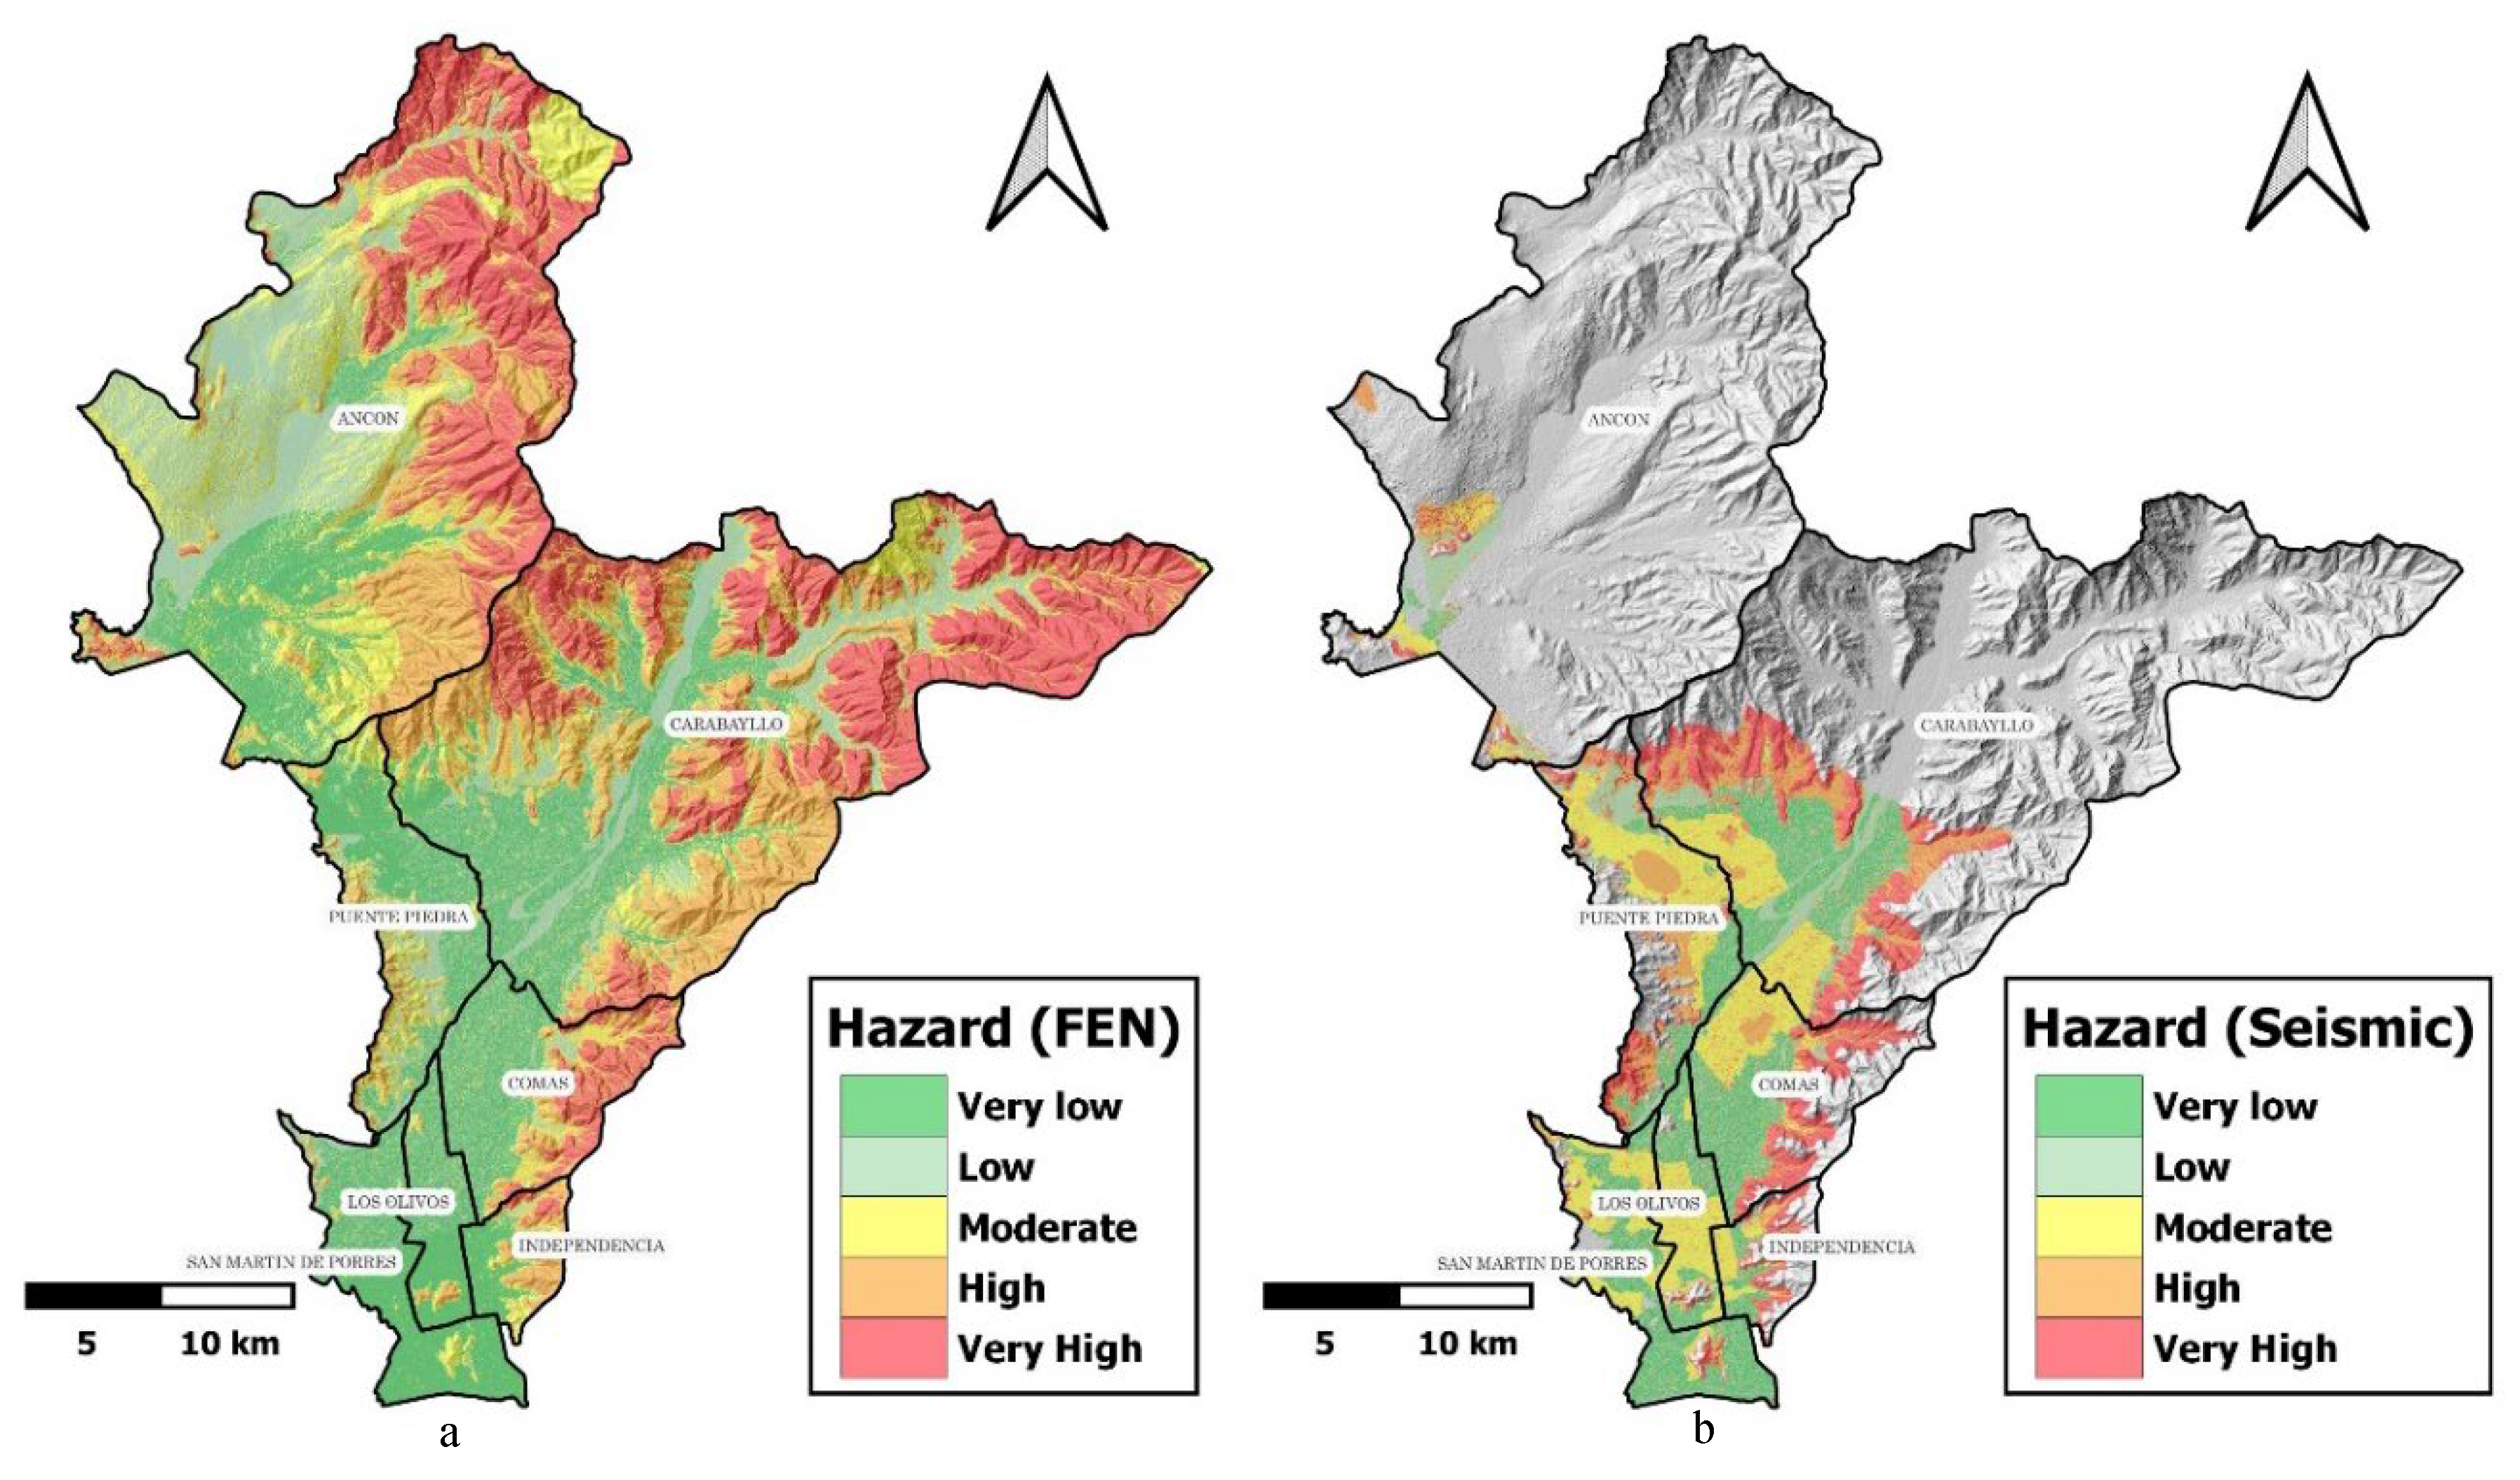
| Distrito | En Niño phenomenon - Hazard level (km2) | Seismic - Hazard level (km2) | ||||||||
| VL | L | M | H | VH | VL | L | M | H | VH | |
| Ancón | 38.711 | 73.605 | 80.316 | 47.446 | 69.538 | 0.613 | 5.095 | 3.192 | 4.127 | 2.191 |
| Carabayllo | 41.491 | 50.580 | 50.618 | 81.983 | 86.703 | 12.946 | 13.747 | 11.755 | 17.185 | 20.933 |
| Comas | 15.012 | 9.032 | 6.663 | 8.591 | 9.473 | 8.248 | 5.827 | 7.046 | 5.863 | 9.757 |
| Independencia | 5.441 | 0.678 | 3.817 | 5.087 | 0.987 | 1.648 | 0.884 | 2.431 | 1.716 | 3.446 |
| Los Olivos | 12.621 | 3.600 | 1.325 | 0.678 | 0.000 | 3.985 | 2.522 | 8.483 | 1.704 | 0.486 |
| Puente Piedra | 20.155 | 14.179 | 12.097 | 3.849 | 0.026 | 4.385 | 6.866 | 11.316 | 11.307 | 6.217 |
| San Martin de Porres | 26.692 | 6.196 | 2.599 | 0.477 | 0.000 | 13.712 | 7.333 | 0.000 | 3.176 | 1.086 |
| Sum | 160.122 | 157.868 | 157.435 | 148.114 | 166.725 | 45.538 | 42.274 | 44.223 | 45.078 | 44.118 |
| % | 20.3 | 20.0 | 19.9 | 18.7 | 21.1 | 20.6 | 19.1 | 20.0 | 20.4 | 19.9 |
4.1. Limitations
4.1. Perspectives
5. Conclusions
Author Contributions
Funding
Data Availability Statement
Acknowledgments
Conflicts of Interest
Appendix A
Appendix B
References
- El Comercio. Vivir en las alturas. 2016. Available online: https://elcomercio.pe/eldominical/actualidad/vivir-alturas-392960-noticia/ (accessed on 27 March 2024).
- Tavera, H. Escenario de sismo y tsunami en el borde occidental de la región central del Perú. Lima, Perú, 2014. Available online: https://repositorio.igp.gob.pe/handle/20.500.12816/779.
- INDECI. Dashboard de control - reporte de emergencias. 2024. Available online: https://app.powerbi.com/view?r=eyJrIjoiNTFkOWRhYWQtYmMwMS00OWNmLTg4ZTctNjZjYTc1OTIyN2M0IiwidCI6IjNlZWNkMjZlLTlhNTUtNDg4MC04ODEyLWEzMGZjZGU3OGEyZCJ9&pageName=ReportSectioncd99edcca07a5ff10551 (accessed on 27 January 2024).
- Chang, L., Xing, G., Yin, H., Fan, L., Zhang, R., Zhao, N., Huang, F., Ma, J. Landslide susceptibility evaluation and interpretability analysis of typical loess areas based on deep learning. Nat. Hazards Res. 2023, 3, 155–169. [Google Scholar] [CrossRef]
- van Westen, C. J. Landslide hazard and risk zonation - Why is it still so difficult? Bull. Eng. Geol. Environ. 2006, 65, 167–184. [Google Scholar] [CrossRef]
- Huang, F., Cao, Z., Guo, J., Jiang, S.H., Li, S., Guo, Z. Comparisons of heuristic, general statistical and machine learning models for landslide susceptibility prediction and mapping. Catena 2020, 191, 104580. [Google Scholar] [CrossRef]
- Panchal, S. , Shrivastava, A.K. Landslide hazard assessment using analytic hierarchy process (AHP): A case study of National Highway 5 in India. Ain Shams Eng. J. 1016, 13, 101626. [Google Scholar] [CrossRef]
- Sun, X., Chen. Landslide susceptibility mapping using logistic regression analysis along the Jinsha river and its tributaries close to Derong and Deqin County, southwestern China. ISPRS Int. J. Geo-Information 2018, 7, 1–29. [Google Scholar] [CrossRef]
- Pourghasemi, H.R., Moradi. Landslide susceptibility mapping by binary logistic regression, analytical hierarchy process, and statistical index models and assessment of their performances. Nat. Hazards 2013, 69, 749–779. [Google Scholar] [CrossRef]
- Pourghasemi, H.R., Pradhan. Application of fuzzy logic and analytical hierarchy process (AHP) to landslide susceptibility mapping at Haraz watershed, Iran. Nat. Hazards 2012, 63, 965–996. [Google Scholar] [CrossRef]
- Hu, X., Zhang, H., Mei, H., Xiao, D., Li, Y., Li, M. Landslide susceptibility mapping using the stacking ensemble machine learning method in lushui, southwest China. Appl. Sci. 2020, 10. [Google Scholar] [CrossRef]
- Goyes-Peñafiel, P., Hernandez-Rojas, A. Double landslide susceptibility assessment based on artificial neural networks and weights of evidence. Bol. Geol. 2021, 43, 173–191. [Google Scholar] [CrossRef]
- Faraji Sabokbar, H., Shadman Roodposhti, M., Tazik, E. Landslide susceptibility mapping using geographically-weighted principal component analysis. Geomorphology 2014, 226, 15–24. [Google Scholar] [CrossRef]
- Mao, Y., Li, Y., Teng, F., Sabonchi, A.K.S., Azarafza, M., Zhang, M. Utilizing Hybrid Machine Learning and Soft Computing Techniques for Landslide Susceptibility Mapping in a Drainage Basin. Water (Switzerland) 2024, 16. [Google Scholar] [CrossRef]
- Yu, H., Pei, W., Zhang, J., Chen, G. Landslide Susceptibility Mapping and Driving Mechanisms in a Vulnerable Region Based on Multiple Machine Learning Models. Remote Sens. 2023, 15. [Google Scholar] [CrossRef]
- Boussouf, S., Fernández, T., Hart, A.B. Landslide susceptibility mapping using maximum entropy (MaxEnt) and geographically weighted logistic regression (GWLR) models in the Río Aguas catchment (Almería, SE Spain). Nat. Hazards 2023, 117, 207–235. [Google Scholar] [CrossRef]
- Achu, A. L., Aju, C.D., Di Napoli, M., Prakash, P., Gopinath, G., Shaji, E., Chandra, V. Machine-learning based landslide susceptibility modelling with emphasis on uncertainty analysis. Geosci. Front. 2023, 14, 101657. [Google Scholar] [CrossRef]
- INGEMMET. Mapa de susceptibilidad por movimientos en masa en Lima Metropolitana. SIGRID 2015. Available online: https://sigrid.cenepred.gob.pe/sigridv3/documento/3653 (accessed on 27 March 2024).
- CAF. El fenomeno el niño 1997 - 1998. Lima, Perú, 1998. Available online: http://scioteca.caf.com/bitstream/handle/123456789/675/Las lecciones de El Niño. Ecuador.pdf?sequence=1&isAllowed=y (accessed on 27 March 2024).
- SENAMHI. El fenómeno EL NIÑO en el Perú. Lima, Perú, 2014. Available online: https://www.minam.gob.pe/wp-content/uploads/2014/07/Dossier-El-Niño-Final_web.pdf (accessed on 27 March 2024).
- Achour, Y., Boumezbeur, A., Hadji, R., Chouabbi, A., Cavaleiro, V., Bendaoud, E.A. Landslide susceptibility mapping using analytic hierarchy process and information value methods along a highway road section in Constantine, Algeria. Arab. J. Geosci. 2017, 10. [Google Scholar] [CrossRef]
- Field, A. Discovering statistics using SPSS (and sex and drugs and rock “n” roll), Third Edit. 2009.
- Menard, S. Applied Logistic Regression Analysis. Colorado, USA, 2002.
- Alibuhtto, M.C., Peiris, T.S.G. Principal Component Regression for Solving Multicollinearity Problem. in 5th International Symposium 2015, pp. 231–238.
- Kelkar, K.A. Mass movement phenomena in the western San Juan mountains. Master's Thesis, Colorado. Texas A&M University, Colorado, USA, 2017. [Google Scholar]
- Aristizábal-Giraldo, E., Vasquez Guarin, M., Ruíz, D. Métodos estadísticos para la evaluación de la susceptibilidad por movimientos en masa. TecnoLógicas 2019, 22, 39–60. [Google Scholar] [CrossRef]
- Basu, T., Das, A., Pal, S. Application of geographically weighted principal component analysis and fuzzy approach for unsupervised landslide susceptibility mapping on Gish River Basin, India. Geocarto Int. 2022, 37, 1294–1317. [Google Scholar] [CrossRef]
- Goyes-Peñafiel, P., Hernandez-Rojas, A. Landslide susceptibility index based on the integration of logistic regression and weights of evidence: A case study in Popayan, Colombia. Eng. Geol. 2021, 280. [Google Scholar] [CrossRef]
- Bonham-Carter, G. Geographic information systems for geoscientists: Modelling with GIS, vol. 21, no. 9. Pergamon, 1995.
- van Westen, C. J. Use of weights of evidence modeling for landslide susceptibility mapping. Enschede, The Netherlands, 2002.
- Servicio Geologico Colombiano. Guia Metodologica para estudios de amenaza, vulnerabilidad y riesgo por movimientos en masa escala 1:25000. 2017.
- Feby, B. , Achu, A.L., Jimnisha, K., Ayisha, V.A., Reghunath, R. Landslide susceptibility modelling using integrated evidential belief function based logistic regression method: A study from Southern Western Ghats, India. Remote Sens. Appl. Soc. Environ. 2020, 20, 100411. [Google Scholar] [CrossRef]
- Umar, Z. , Pradhan, B., Ahmad, A., Jebur, M.N., Tehrany, M.S. Earthquake induced landslide susceptibility mapping using an integrated ensemble frequency ratio and logistic regression models in West Sumatera Province, Indonesia. Catena 2014, 118, 124–135. [Google Scholar] [CrossRef]
- Yilmaz, I. Landslide susceptibility mapping using frequency ratio, logistic regression, artificial neural networks and their comparison: A case study from Kat landslides (Tokat-Turkey). Comput. Geosci. 2009, 35, 1125–1138. [Google Scholar] [CrossRef]
- Huang, J. , Zhou, Q., Wang, F. Mapping the landslide susceptibility in Lantau Island, Hong Kong, by frequency ratio and logistic regression model. Ann. GIS 2015, 21, 191–208. [Google Scholar] [CrossRef]
- Biçer, Ç. T. , Ercanoglu, M. A semi-quantitative landslide risk assessment of central Kahramanmaraş City in the Eastern Mediterranean region of Turkey. Arab. J. Geosci. 2020, 13. [Google Scholar] [CrossRef]
- Vakhshoori, V. , Pourghasemi, H.R., Zare, M., Blaschke, T. Landslide susceptibility mapping using GIS-based data mining algorithms. Water (Switzerland) 2019, 11, 7–13. [Google Scholar] [CrossRef]
- Cortes, C., Vapnik, V. Support-Vector Networks. Mach. Learn. 1995; 20. [Google Scholar] [CrossRef]
- Liu, S. , Wang, L., Zhang, W., He, Y., Pijush, S. A comprehensive review of machine learning-based methods in landslide susceptibility mapping. Geol. J. 2283, 58, 2283–2301. [Google Scholar] [CrossRef]
- Li, M. , Li, L., Lai, Y., He, L., He, Z., Wang, Z. Geological Hazard Susceptibility Analysis Based on RF, SVM, and NB Models, Using the Puge Section of the Zemu River Valley as an Example. Sustain. 2023, 15. [Google Scholar] [CrossRef]
- Merghadi, A. , Yunus, A.P, Dou, J., Whiteley, J., ThaiPham, B., Bui, D. T., Avtar, R., Abderrahmane, B. Machine learning methods for landslide susceptibility studies: A comparative overview of algorithm performance. Earth-Science Rev. 2020, 25, 103225. [Google Scholar] [CrossRef]
- Breiman, L. Random Forests. Mach. Learn. 2001. [Google Scholar] [CrossRef]
- Wu, X. , Song, Y., Chen, W., Kang, G., Qu, R., Wang, Z., Wang, J., Lv, P., Chen, H. Analysis of Geological Hazard Susceptibility of Landslides in Muli County Based on Random Forest Algorithm. Sustain 2023, 15. [Google Scholar] [CrossRef]
- Karakas, G. , Can, R., Kocaman, S., Nefeslioglu, H. A., Gokceoglu, C. Landslide susceptibility mapping with random forest model for Ordu, Turkey. Int. Arch. Photogramm. Remote Sens. 2020, 43, 1229–1236. [Google Scholar] [CrossRef]
- Mia, M. U. , Chowdhury, T. N., Chakrabortty, R., Pal, S. C., Al-Sadoon, M. K., Costache, R., Islam, A. R. M. T. Flood Susceptibility Modeling Using an Advanced Deep Learning-Based Iterative Classifier Optimizer. Land 2023, 12. [Google Scholar] [CrossRef]
- Nurwatik, N. , Ummah, M. H., Cahyono, A. B., Darminto, M. R., Hong, J. H. A Comparison Study of Landslide Susceptibility Spatial Modeling Using Machine Learning. ISPRS Int. J. Geo-Information 2022, 11. [Google Scholar] [CrossRef]
- Pham, B. T. , Pradhan, B., Tien Bui, D., Prakash, I., Dholakia, M. B. A comparative study of different machine learning methods for landslide susceptibility assessment: A case study of Uttarakhand area (India). Environ. Model. Softw. 2016, 84, 240–250. [Google Scholar] [CrossRef]
- Pradhan, B. , Sameen, M. I., Al-Najjar, H. A. H., Sheng, D., Alamri, A. M., Park, H. J. A meta-learning approach of optimisation for spatial prediction of landslides. Remote Sens. 2021, 13, 1–30. [Google Scholar] [CrossRef]
- Zhao, Y. , Wang, R., Jiang, Y., Liu, H., Wei, Z. GIS-based logistic regression for rainfall-induced landslide susceptibility mapping under different grid sizes in Yueqing, Southeastern China. Eng. Geol. 2019, 259, 105147. [Google Scholar] [CrossRef]
- Pham, B. T. , Shirzadi, A., Shahabi, H., Omidvar, E., Singh, S. K.,, Sahana, M., Asl, D. T., Ahmad, B. B., Quoc, N. K., Lee, S. Landslide susceptibility assessment by novel hybrid machine learning algorithms. Sustain. 2019, 11, 1–25. [Google Scholar] [CrossRef]
- Achour, Y. , Pourghasemi, H. R. How do machine learning techniques help in increasing accuracy of landslide susceptibility maps? Geosci. Front. 2020, 11, 871–883. [Google Scholar] [CrossRef]
- Sajadi, P. , Sang, Y. F., Gholamnia, M., Bonafoni, S., Mukherjee, S. Evaluation of the landslide susceptibility and its spatial difference in the whole Qinghai-Tibetan Plateau region by five learning algorithms. Geosci. Lett. 2022, 9. [Google Scholar] [CrossRef]
- Aditian, A. , Kubota, T., Shinohara, Y. Comparison of GIS-based landslide susceptibility models using frequency ratio, logistic regression, and artificial neural network in a tertiary region of Ambon, Indonesia. Geomorphology 2018, 318, 101–111. [Google Scholar] [CrossRef]
- Bijukchhen, S. M. , Kayastha, P., Dhital, M. R. A comparative evaluation of heuristic and bivariate statistical modelling for landslide susceptibility mappings in Ghurmi-Dhad Khola, east Nepal. Arab. J. Geosci. 2013, 6, 2727–2743. [Google Scholar] [CrossRef]
- Song, Y. , Yang, D., Wu, W., Zhang, X., Zhou, J., Tian, Z., Wang, C., Song, Y. Evaluating Landslide Susceptibility Using Sampling Methodology and Multiple Machine Learning Models. ISPRS Int. J. Geo-Information 2023, 12. [Google Scholar] [CrossRef]
- Tang, Y. , Feng, F., Guo, Z., Feng, W., Li, Z., Wang, J., Sun, Q., Ma, H., Li, Y. Integrating principal component analysis with statistically-based models for analysis of causal factors and landslide susceptibility mapping: A comparative study from the loess plateau area in Shanxi (China). J. Clean. Prod. 1241, 59, 124159. [Google Scholar] [CrossRef]
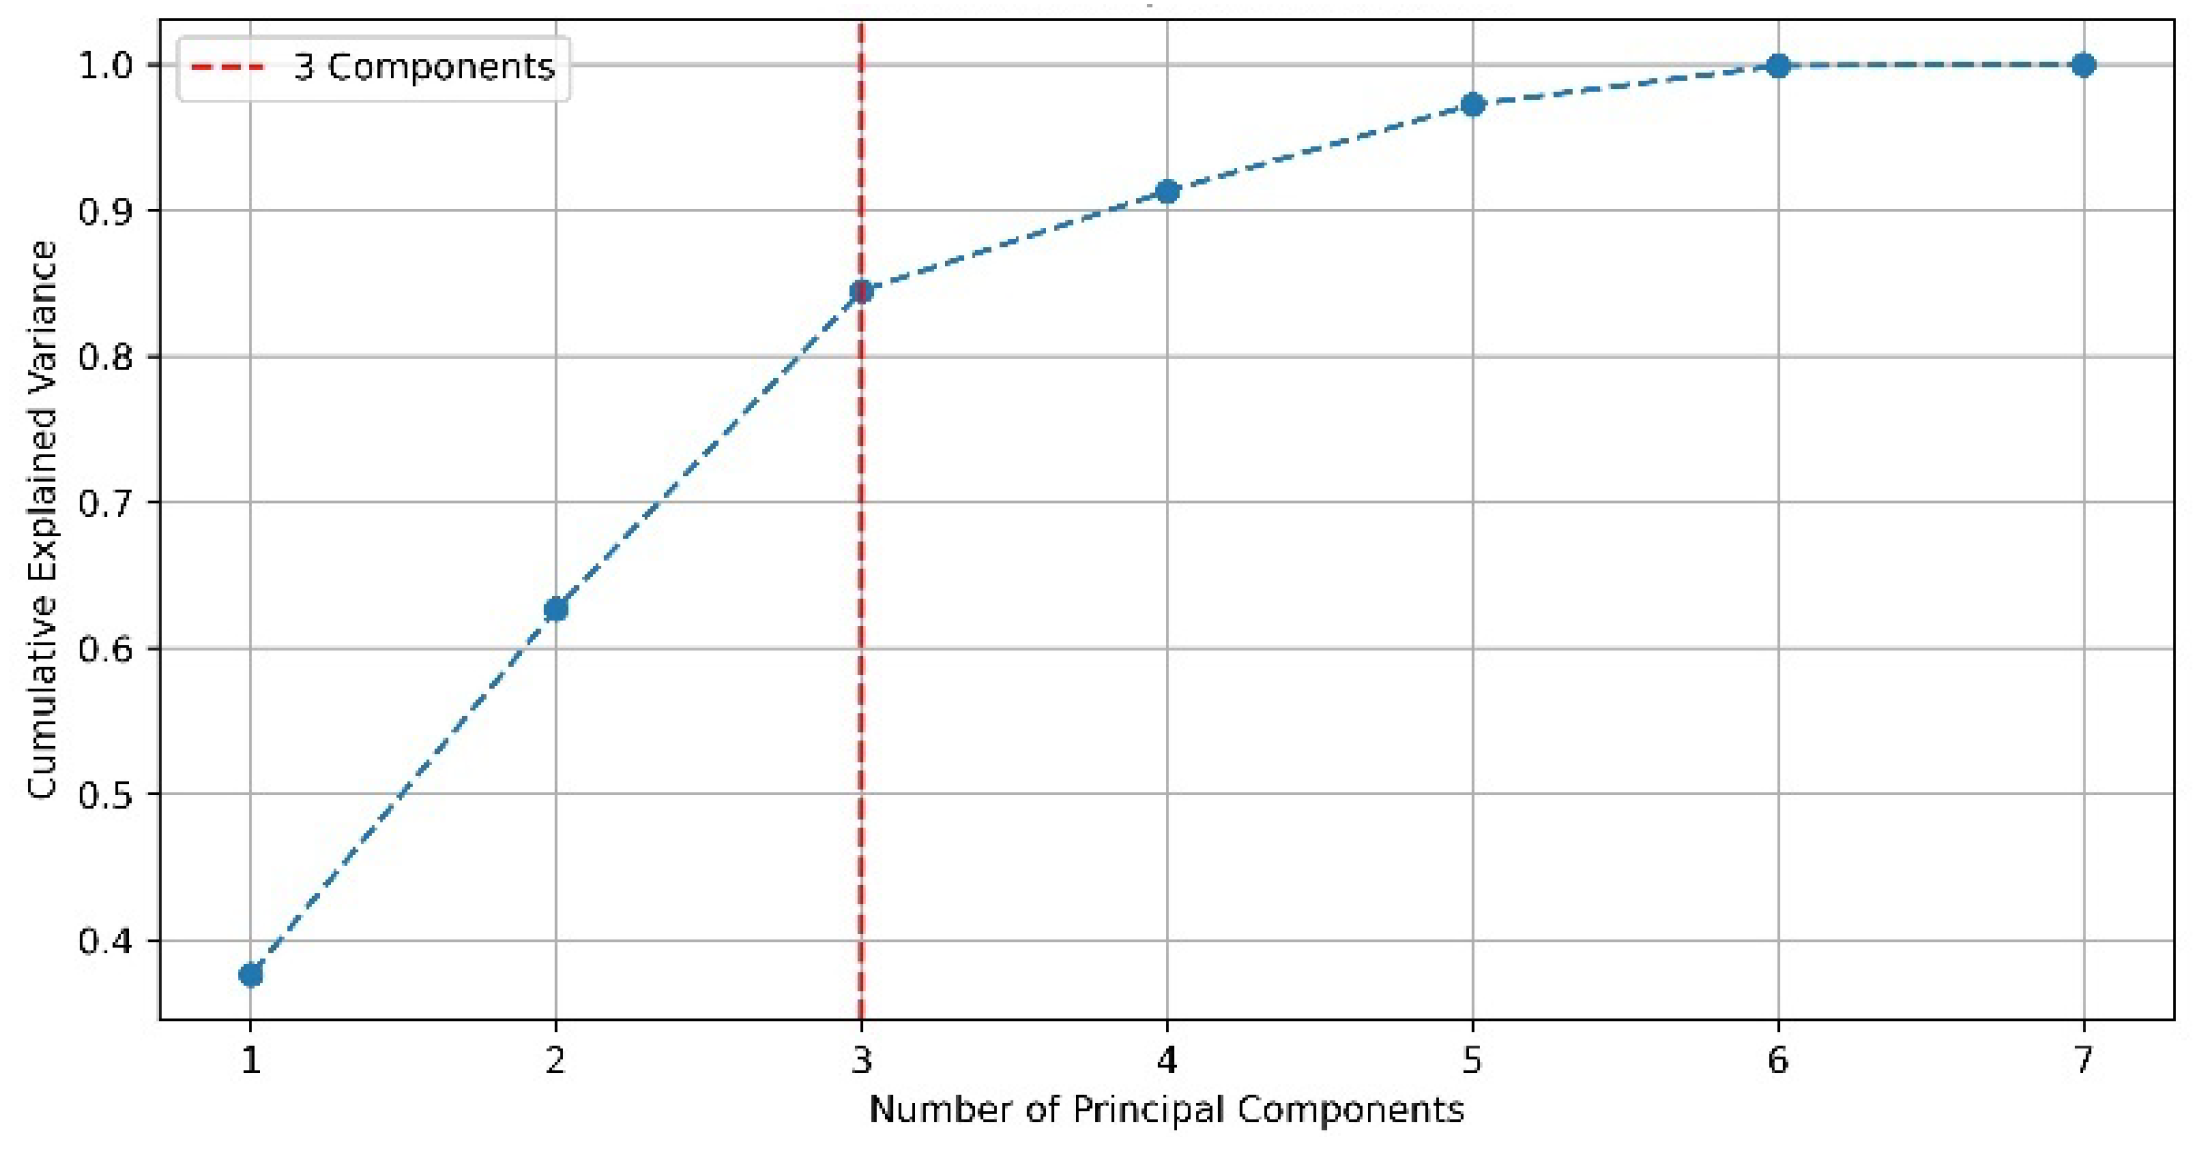
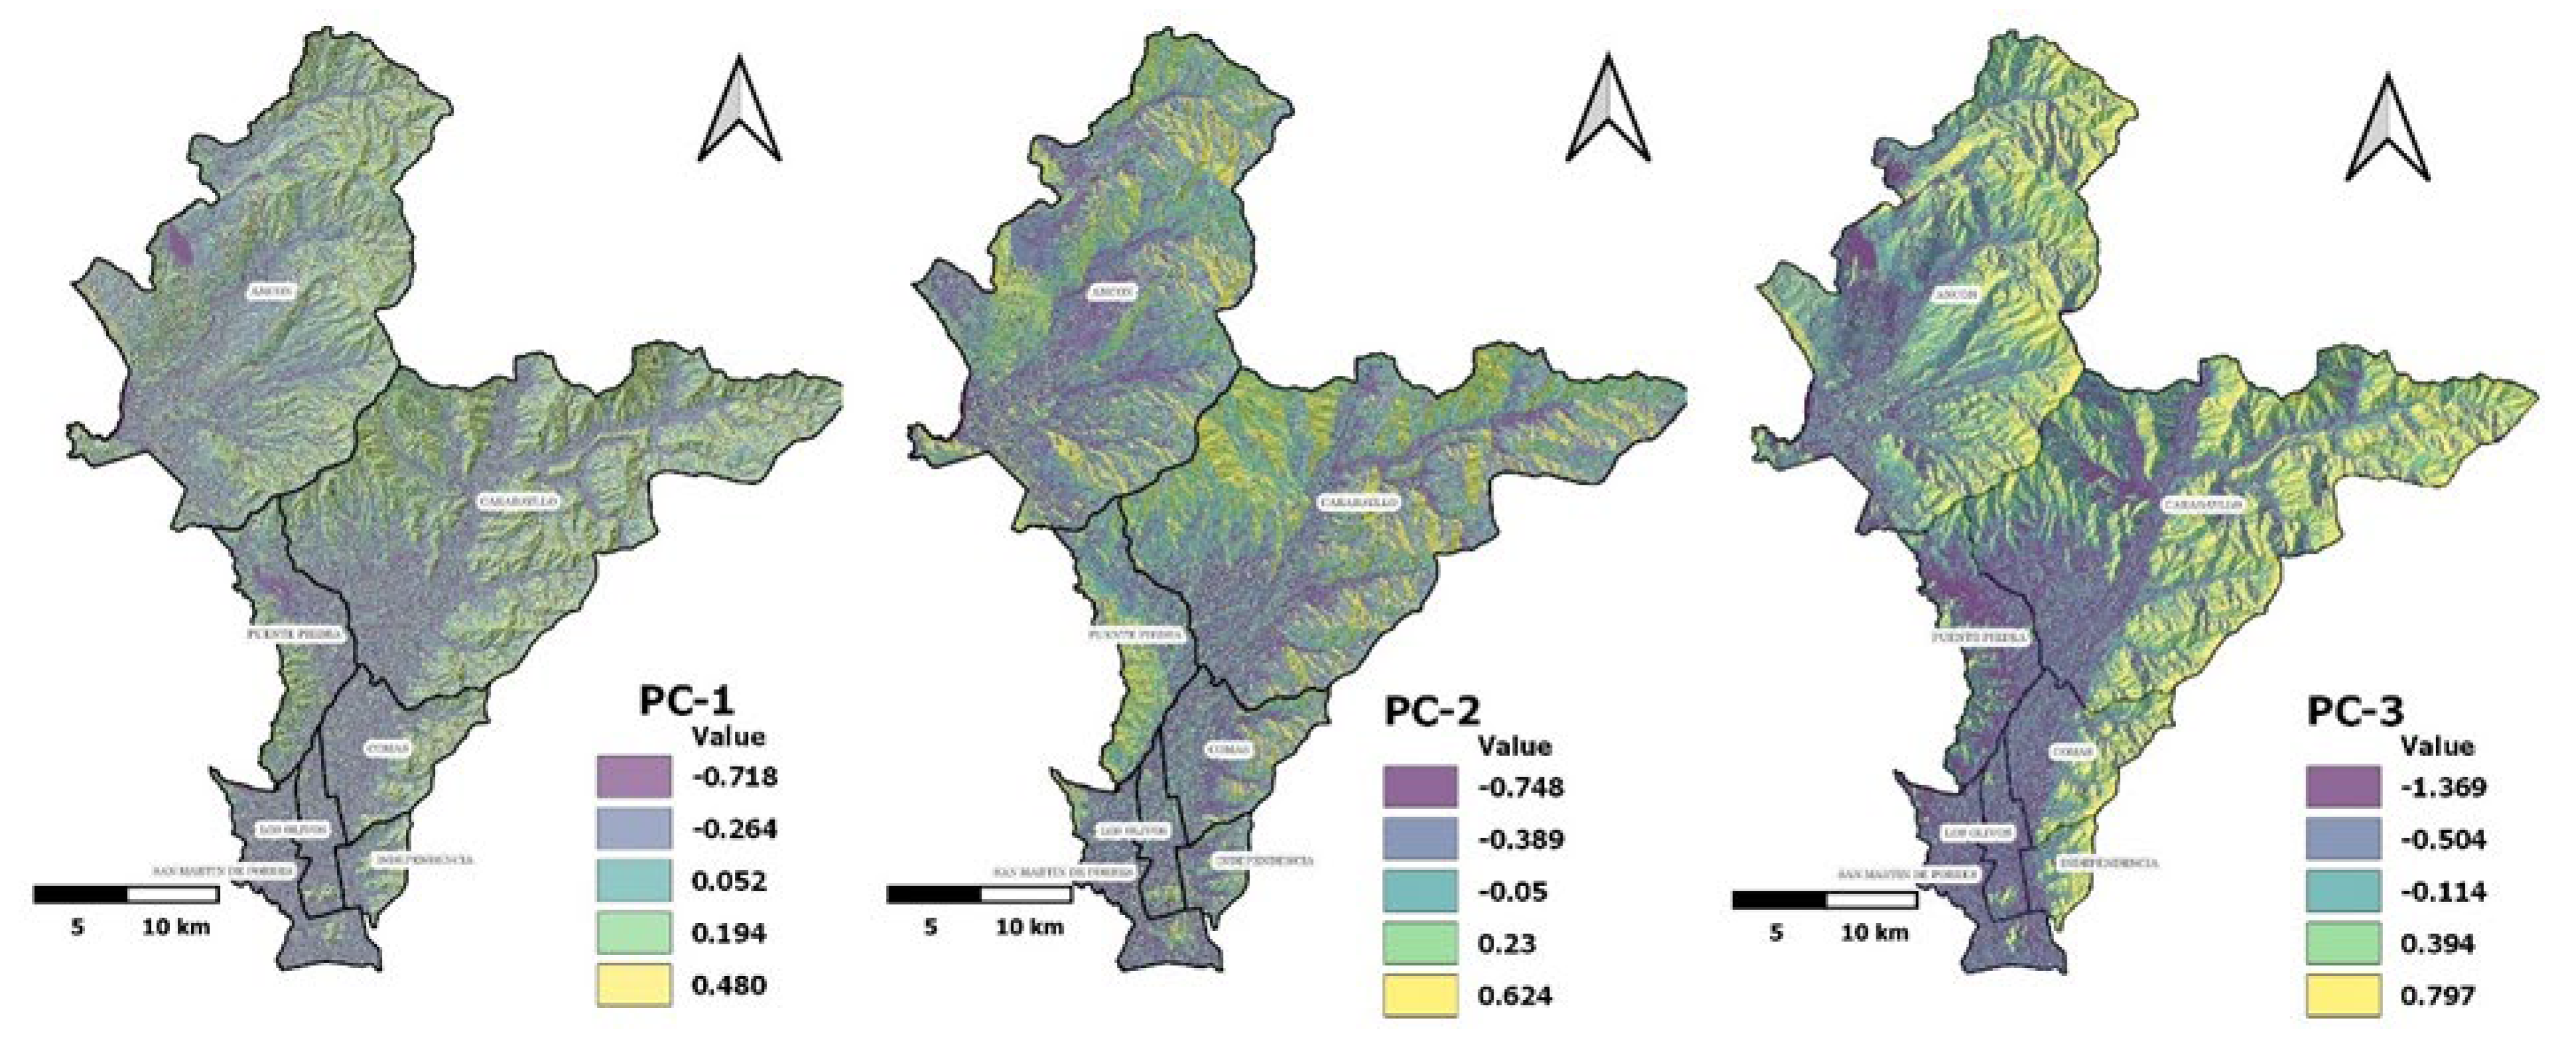
| PC | Weights | T1 | T2 | T3 | T4 | T5 | T6 | T7 |
| PC-1 | 0.377 | 0.565 | -0.102 | -0.502 | 0.566 | -0.038 | 0.237 | 0.203 |
| PC-2 | 0.250 | 0.240 | 0.104 | -0.065 | 0.238 | 0.087 | -0.648 | -0.667 |
| PC-3 | 0.218 | -0.019 | -0.689 | 0.035 | -0.034 | -0.705 | -0.112 | -0.114 |
| Models | Variables | VL (km2) |
L (km2) |
M (km2) |
H (km2) |
VH (km2) |
| WoE | X_1234, PC_121 | 92.352 | 257.426 | 180.316 | 145.113 | 116.071 |
| LR | X_1234, PC_121 | 157.959 | 162.505 | 157.243 | 153.230 | 162.130 |
| MLP | X_1234, PC_122 | 128.209 | 192.514 | 170.778 | 152.981 | 146.793 |
| SVM | X_1234, PC_123 | 158.280 | 162.000 | 156.579 | 155.760 | 160.448 |
| RF | X_1234, PC_123 | 122.548 | 194.783 | 158.764 | 154.008 | 162.963 |
| NB | X_1234, PC_123 | 145.511 | 174.507 | 156.579 | 155.573 | 160.895 |
| Heuristic* | - | 137.610 | 203.527 | 205.480 | 168.482 | 77.181 |
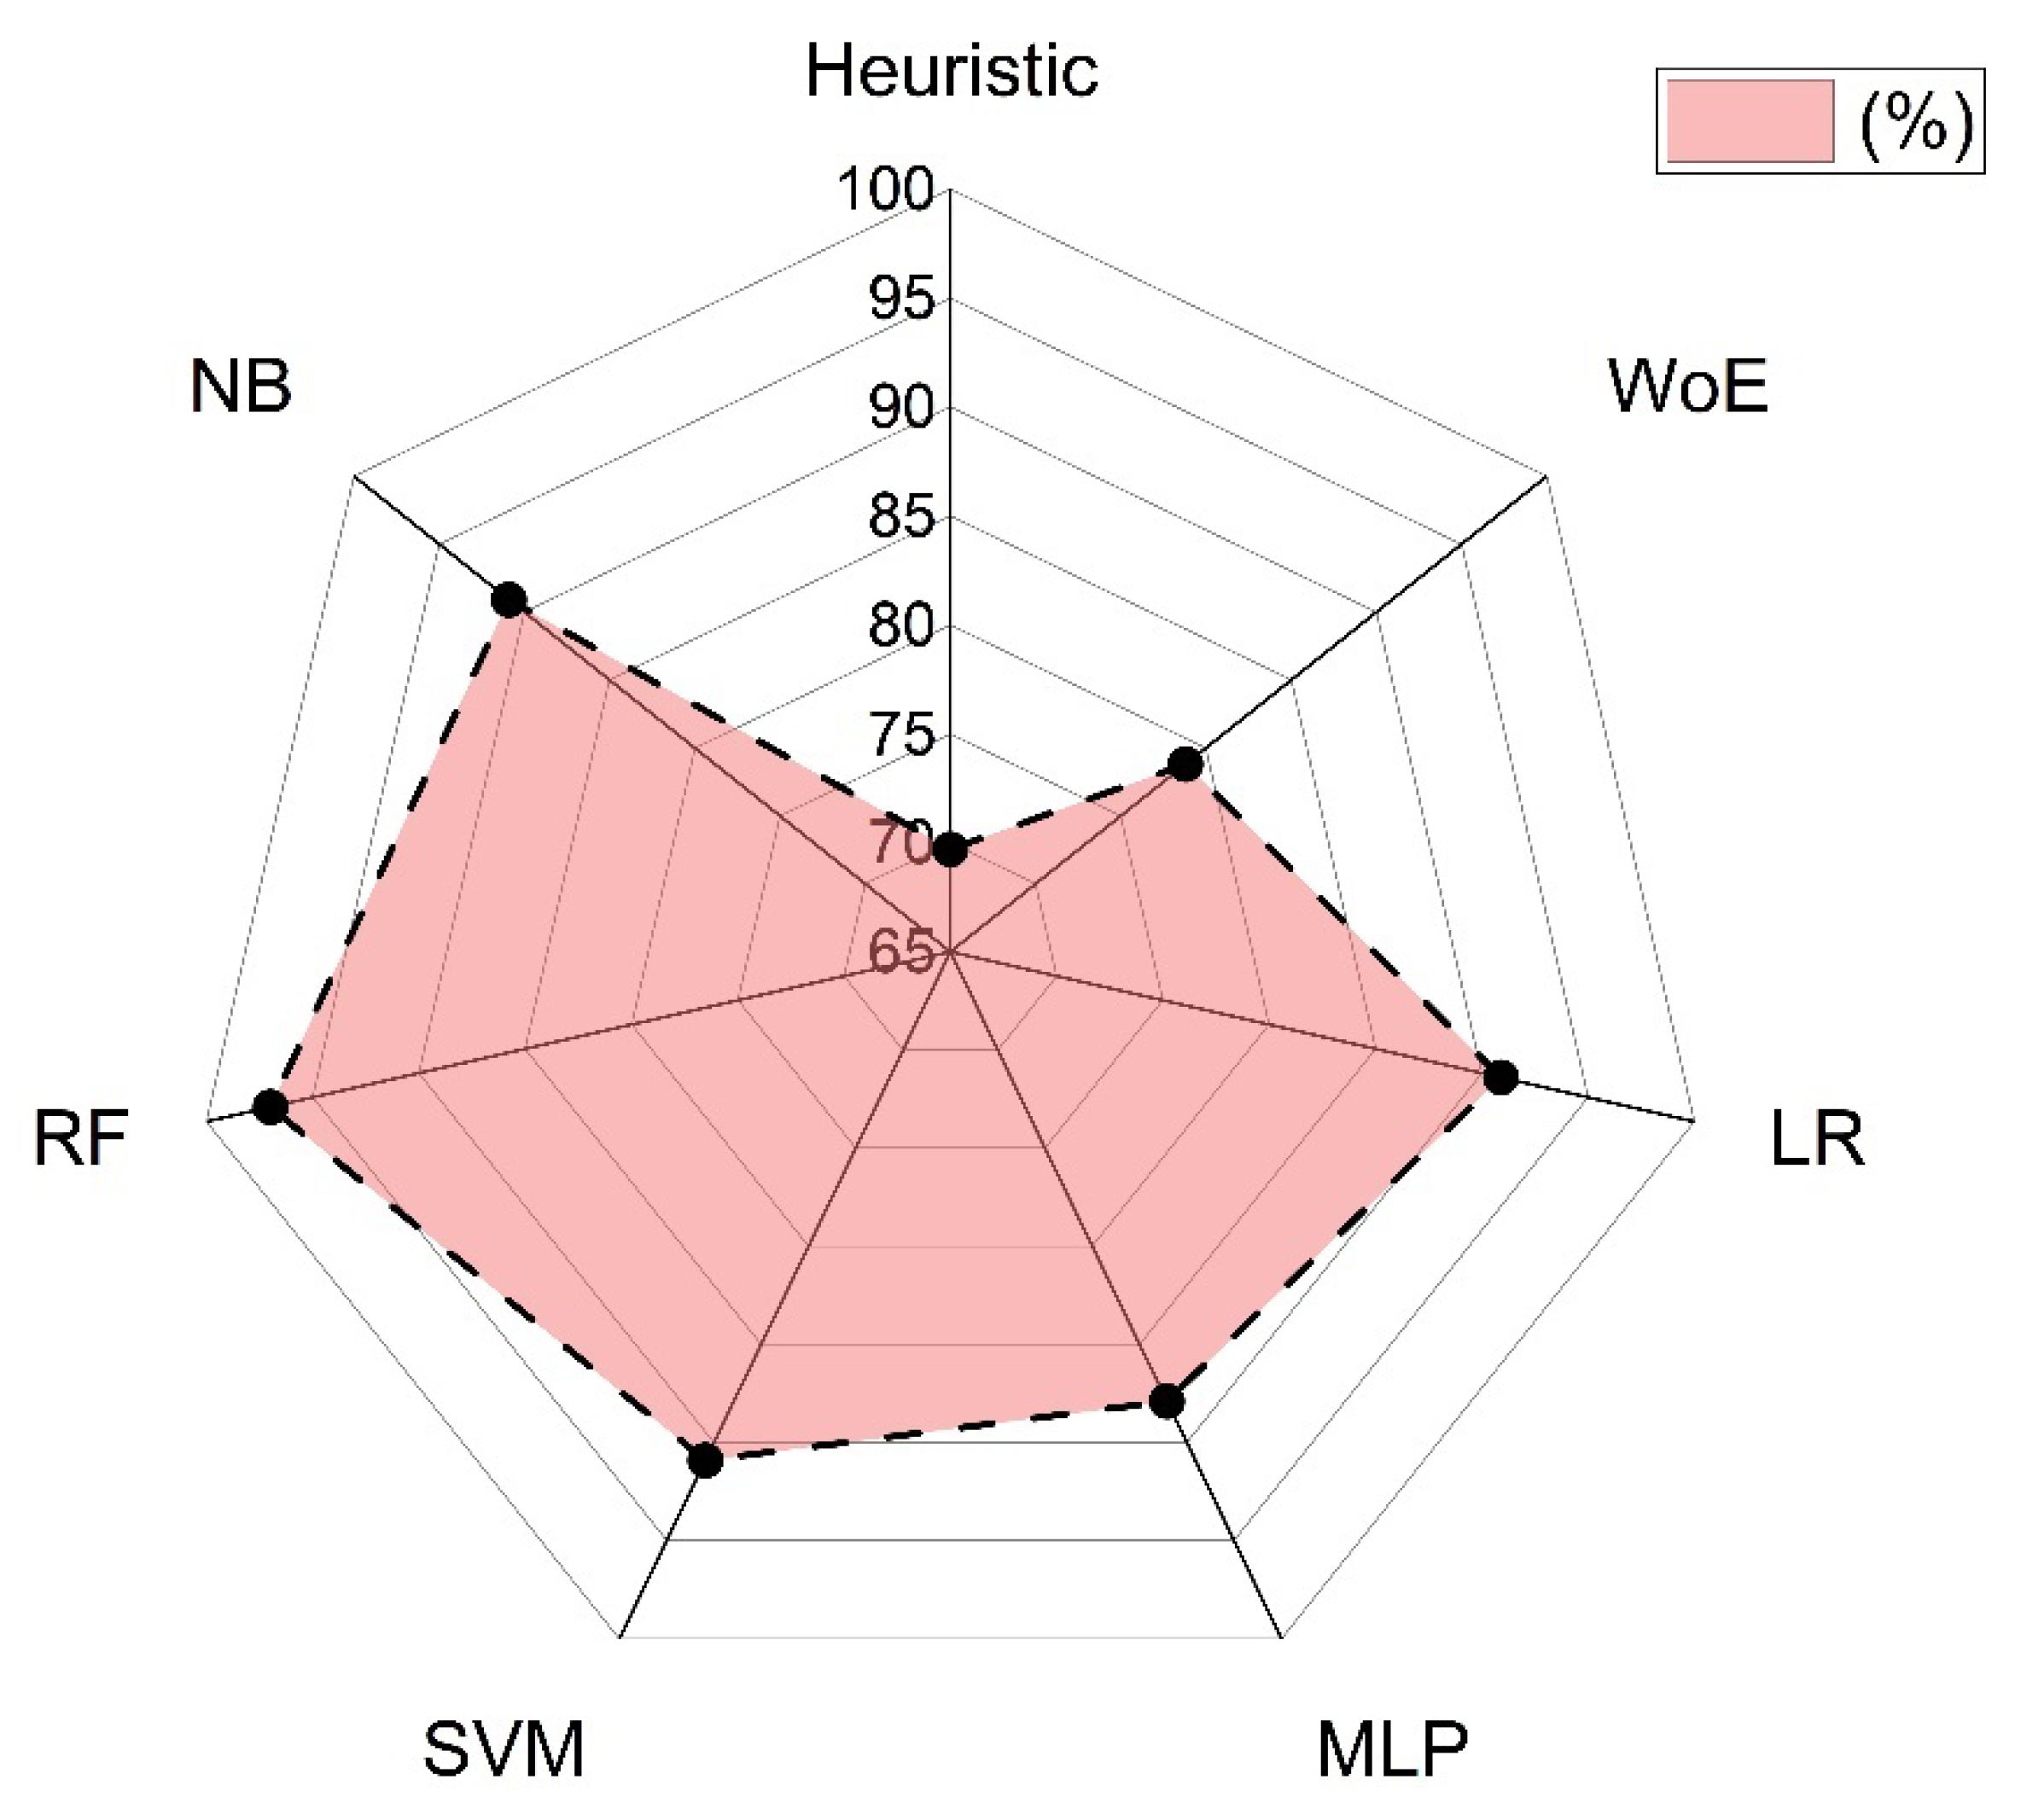
| Model | Variables | AUCtrain | AUCtest | F-1score | TP | TN | FP | FN | Accuracy |
| WoE | X_1234, PC_121 | - | - | - | - | - | - | - | - |
| LR | X_1234, PC_121 | 0.986 | 1.000 | 0.957 | 81 | 99 | 3 | 6 | 0.952 |
| MLP | X_1234, PC_122 | 0.986 | 0.998 | 0.963 | 76 | 105 | 8 | 0 | 0.958 |
| SVM | X_1234, PC_123 | 0.994 | 1.000 | 0.951 | 81 | 98 | 7 | 3 | 0.947 |
| RF | X_1234, PC_123 | 1.000 | 0.996 | 0.991 | 82 | 105 | 2 | 0 | 0.989 |
| NB | X_1234, PC_123 | 0.981 | 1.000 | 0.961 | 83 | 98 | 1 | 7 | 0.958 |
Disclaimer/Publisher’s Note: The statements, opinions and data contained in all publications are solely those of the individual author(s) and contributor(s) and not of MDPI and/or the editor(s). MDPI and/or the editor(s) disclaim responsibility for any injury to people or property resulting from any ideas, methods, instructions or products referred to in the content. |
© 2024 by the authors. Licensee MDPI, Basel, Switzerland. This article is an open access article distributed under the terms and conditions of the Creative Commons Attribution (CC BY) license (http://creativecommons.org/licenses/by/4.0/).


