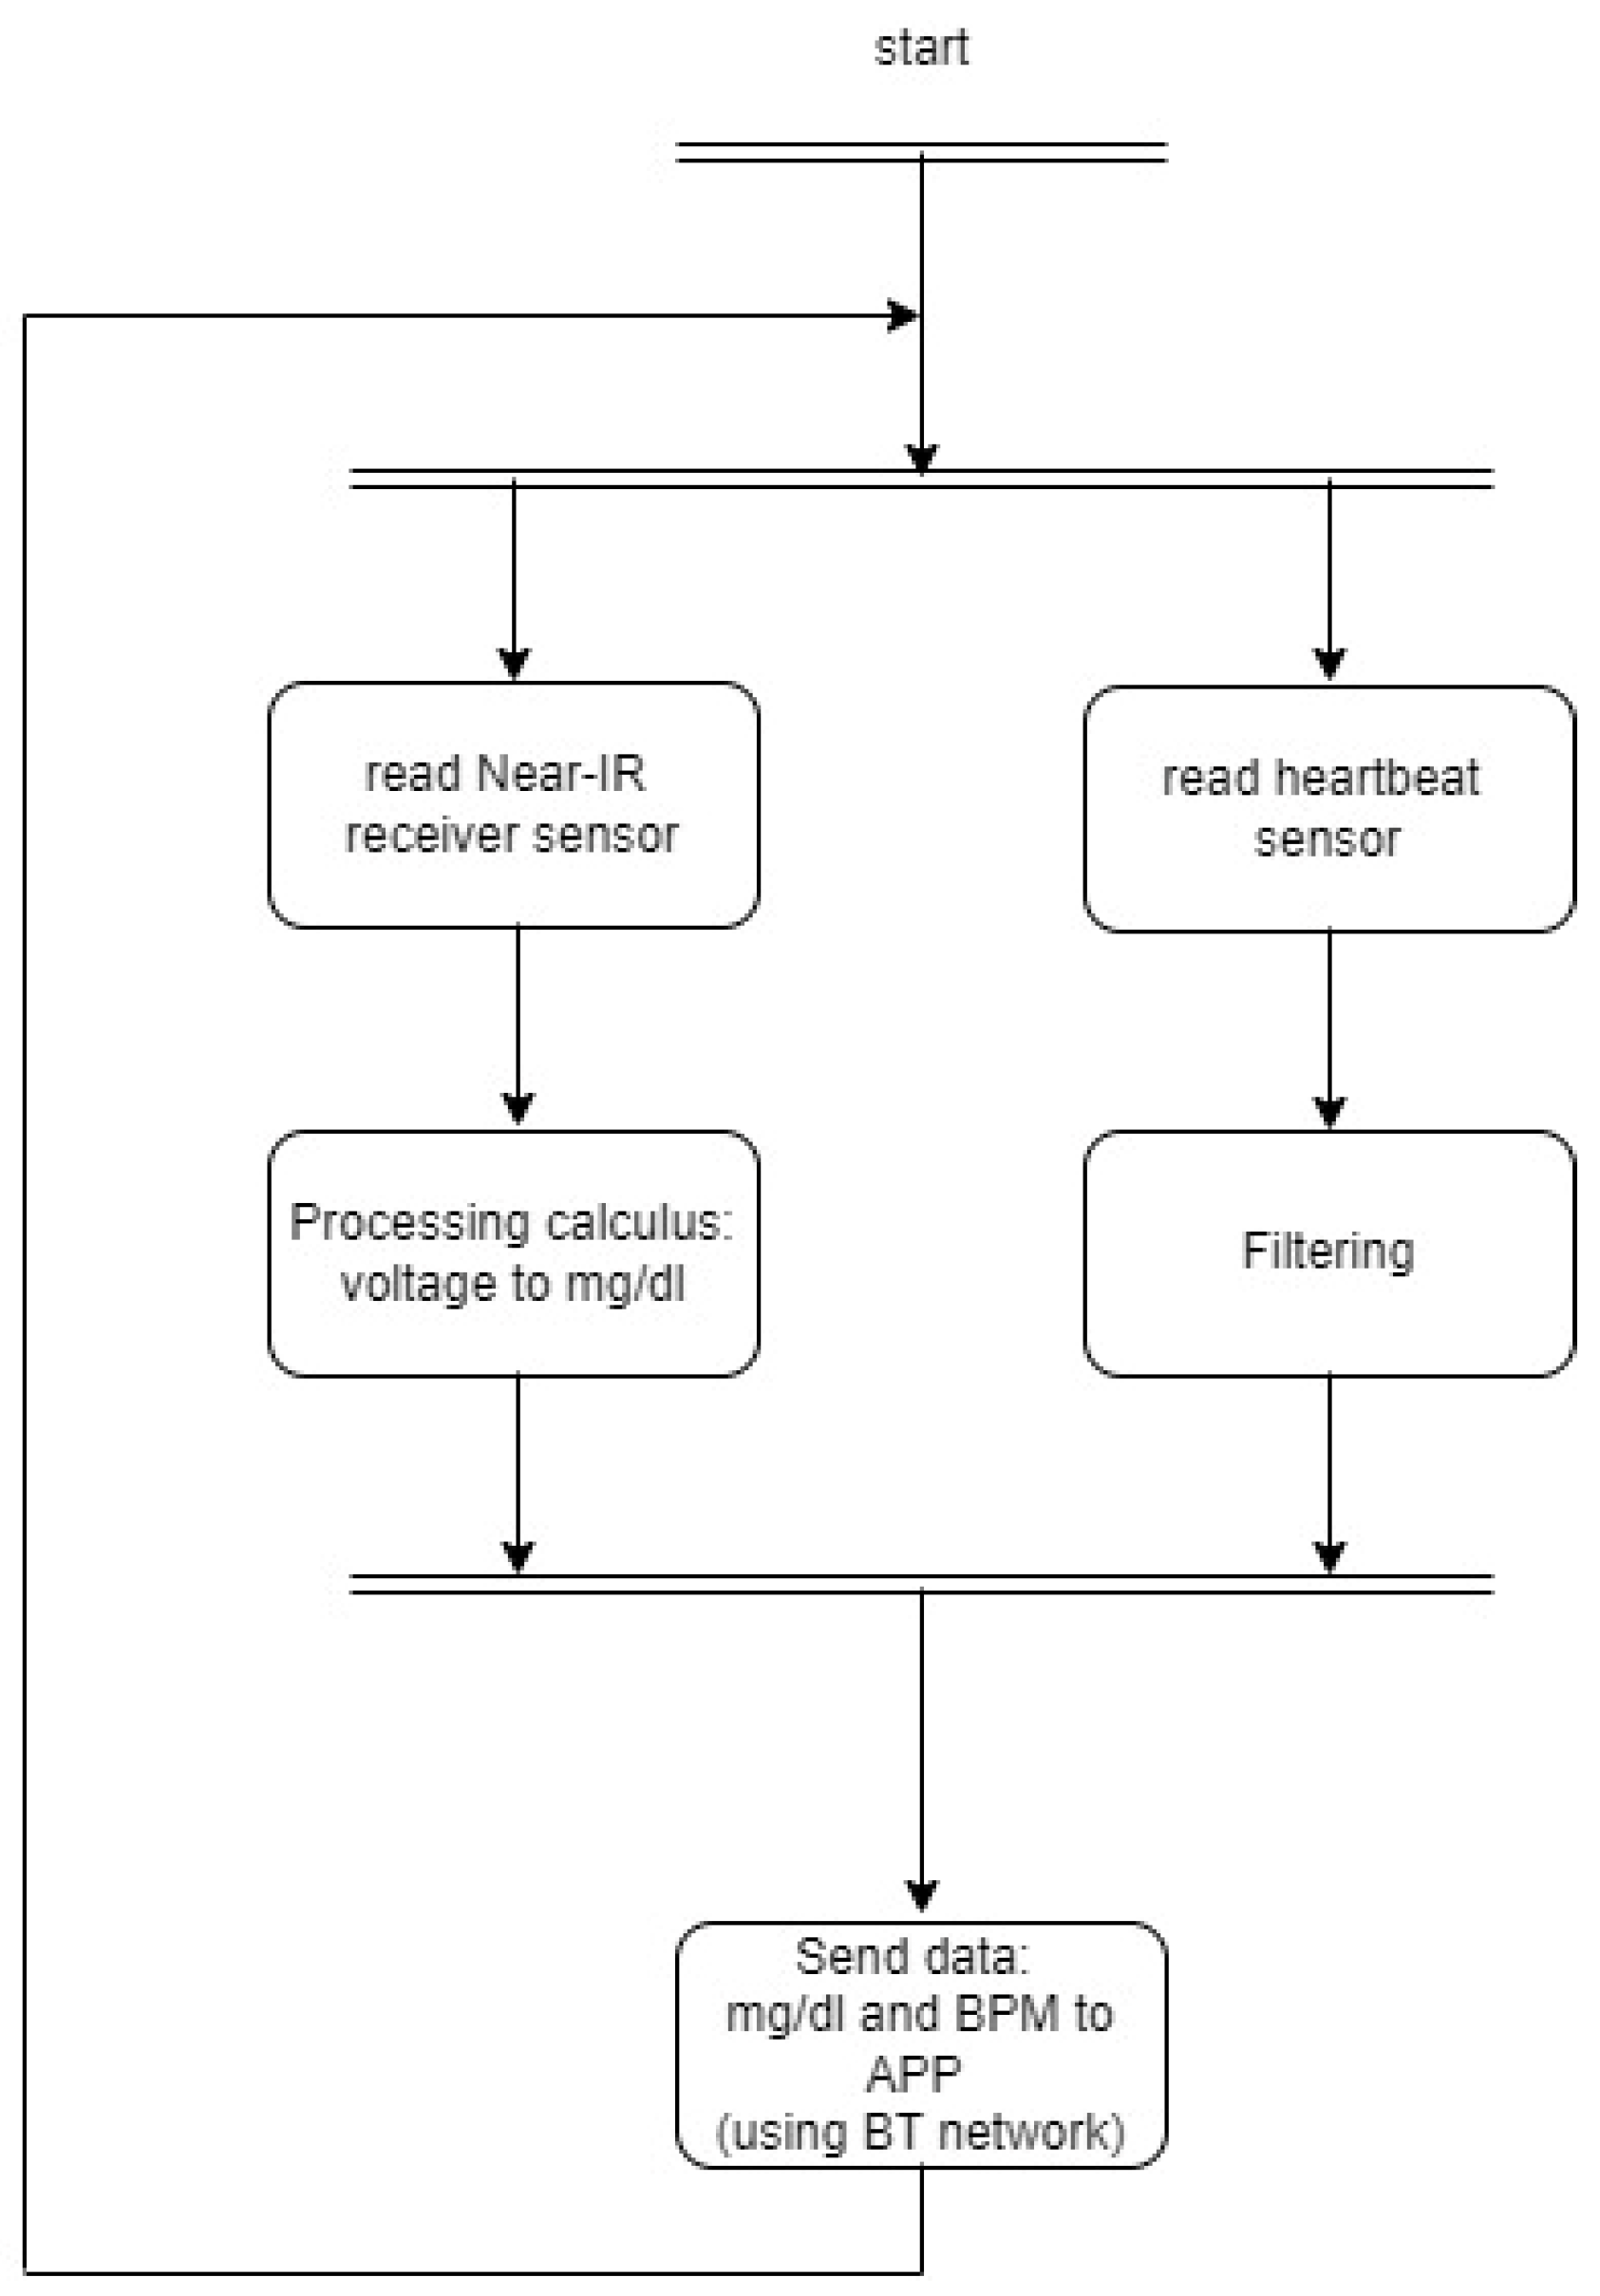
This section explains the elements that make up the architecture of this project: microcontroller (Arduino Uno), optical sensors, heartbeat sensor and wireless communication via the Bluetooth network. The firmware flowchart and its explanation are also presented. As well as the experimental tests and all the results obtained, which prove the functionality of the work as defined.
2.1. Ligth Spectrum and 940nm Infrared Spectrum
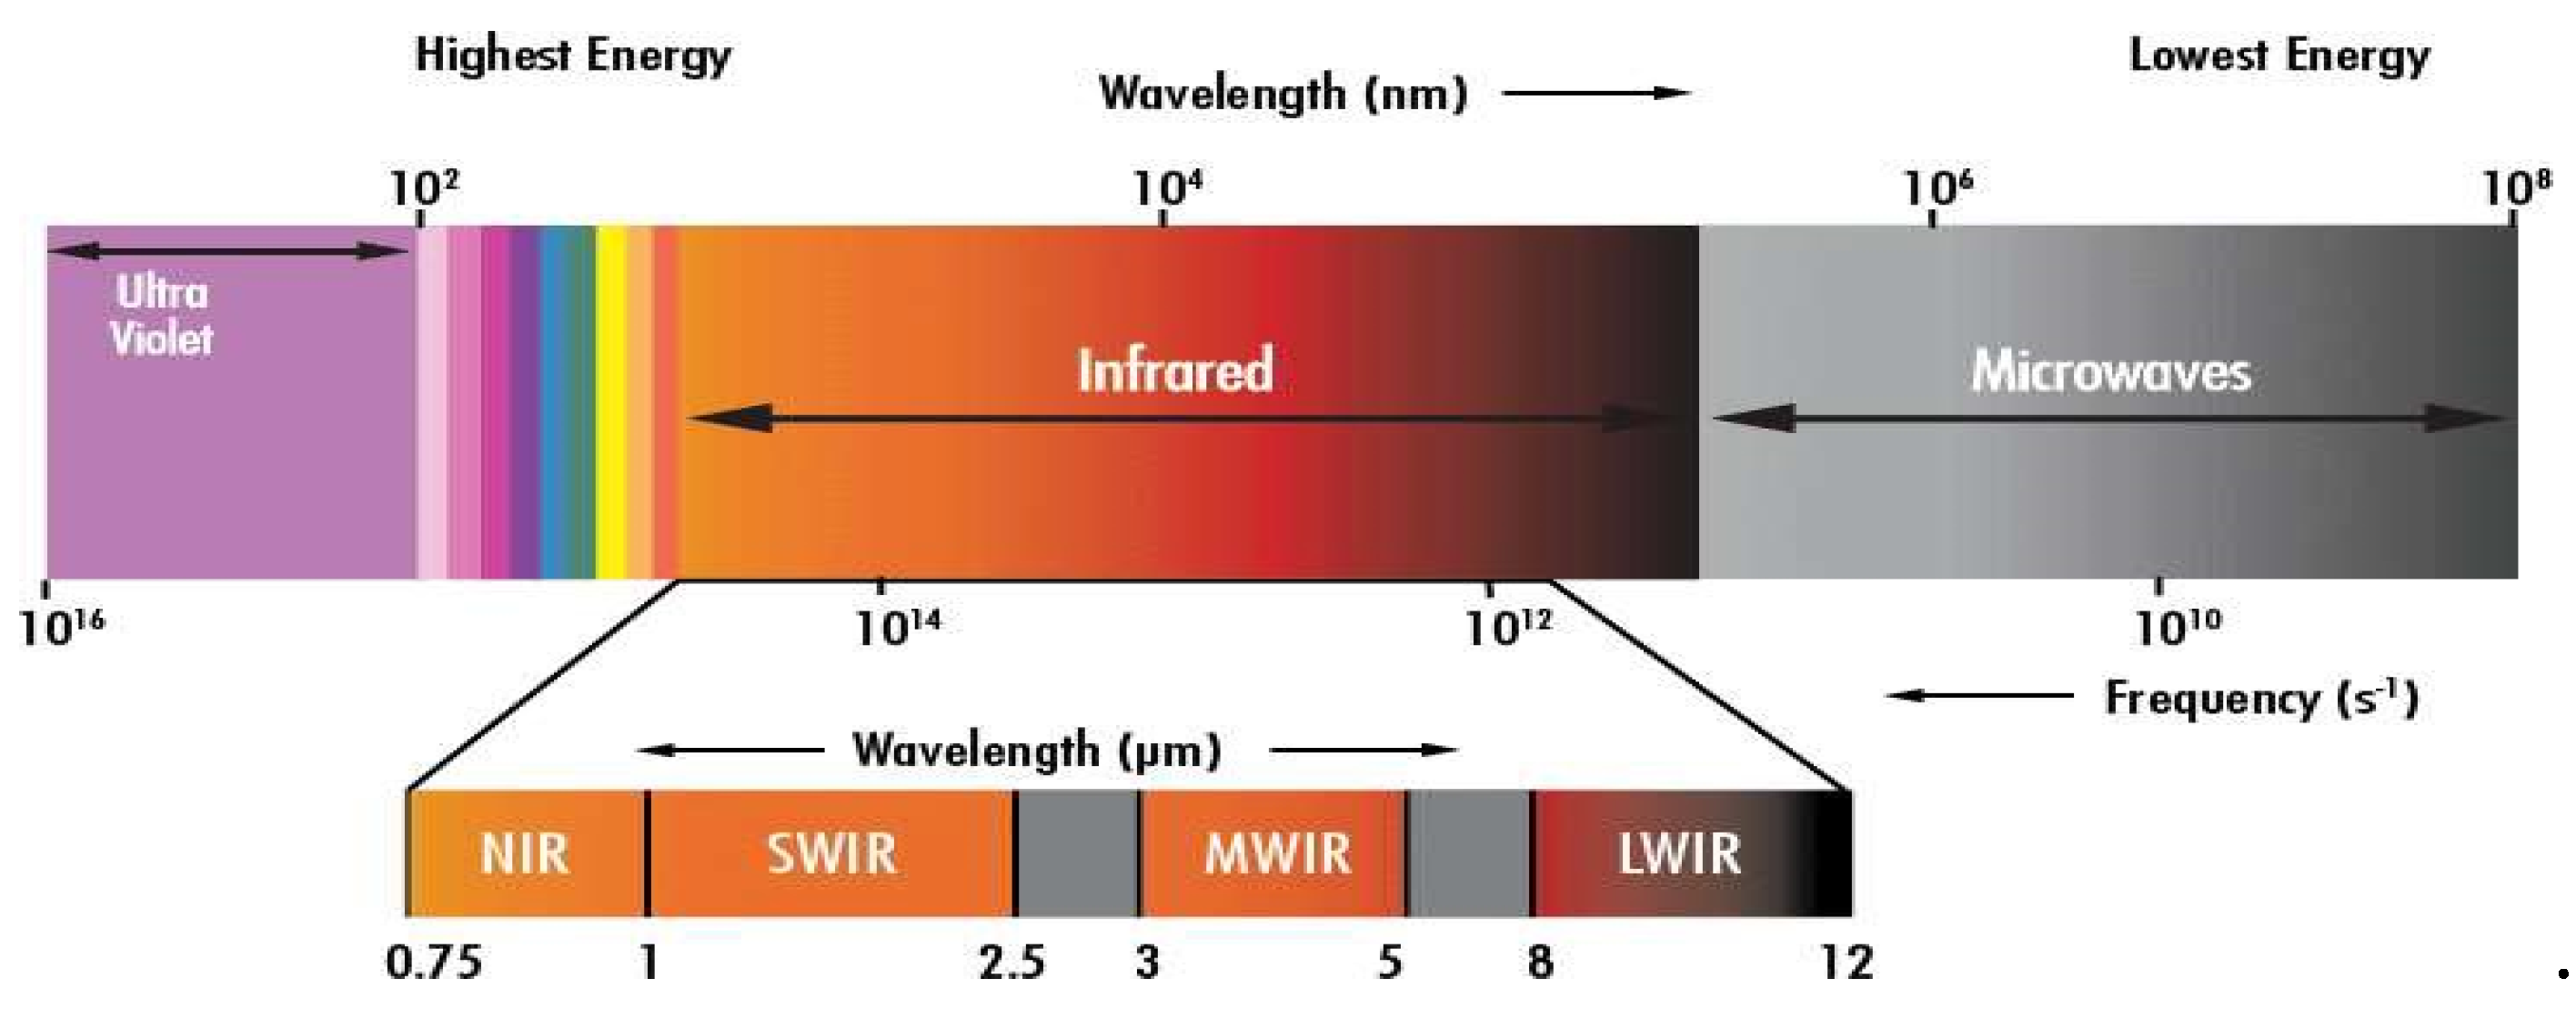
Within the vast electromagnetic spectrum, beyond the boundaries of human vision, lies the enigmatic realm of infrared radiation. Among its myriad wavelengths, the 940nm infrared spectrum stands out for its diverse applications across various fields, from telecommunications to healthcare [
4,
5]. In this work, we embark on a journey to explore the intricacies of the 940nm IR spectrum, shedding light on its properties, practical uses, and significance in contemporary science and technology.
Figure 1.
Light spectrum [
6].
Figure 1.
Light spectrum [
6].
The electromagnetic spectrum encompasses a broad range of wavelengths (the wavelength is the distance between repetitions of a wave), including those of visible light and beyond. Situated adjacent to the visible spectrum, the infrared region comprises wavelengths longer than those of visible light. Within this domain, the 940nm wavelength occupies a special place, offering unique characteristics that make it indispensable for numerous applications [
4,
5].
The versatility of the 940nm infrared spectrum lends itself to a wide array of applications, each harnessing its distinct properties to achieve specific objectives. Let’s delve into some key domains where the 940nm IR spectrum plays a pivotal role:
Telecommunications and Data Transmission: The 940nm wavelength serves as a cornerstone for optical communication systems, enabling high-speed data transmission over fiber optic networks. Its ability to travel through optical fibers with minimal attenuation ensures efficient and reliable communication over short/medium distances (e.g., LAN). Vertical Cavity Surface Emitting Lasers (VCSELs), for example, operates at 940 nm.
Sensing and Imaging Technologies: In fields such as surveillance, medical diagnostics, and environmental monitoring, the 940nm infrared spectrum is instrumental in enhancing sensing and imaging capabilities. Night vision cameras, for instance, utilize 940nm IR illuminators to capture clear images in low-light conditions, while medical devices leverage near-infrared spectroscopy (NIRS) for non-invasive tissue analysis.
Biomedical and Healthcare Applications: Researchers and healthcare practitioners harness the 940nm infrared spectrum for various biomedical applications, including diagnostics and therapeutic interventions. Near-infrared light, at 940nm wavelength, exhibits excellent tissue penetration properties, making it suitable for deep tissue imaging and photo biomodulation therapy [
4,
5].
Security and Defense Systems: In the realm of security and defense, infrared technology, including the 940nm spectrum, plays a critical role in surveillance and threat detection. Infrared surveillance cameras equipped with 940nm IR illuminators enable covert monitoring and perimeter protection, enhancing security measures in both civilian and military contexts.
In resume, 940nm infrared spectrum represents a fascinating intersection of science, technology, and innovation, offering a glimpse into the invisible forces that shape our world. From facilitating high-speed communication to advancing medical diagnostics and bolstering security, its applications are as diverse as they are profound. As we continue to unlock the potential of the 940nm IR spectrum, it serves as a testament to human ingenuity and our relentless quest to explore the unseen [
5].
2.2. System Design
This section explains the elements that make up the architecture of this project: microcontroller (Arduino Uno), optical sensors (near IR), heartbeat sensor and wireless communication via the Bluetooth network.
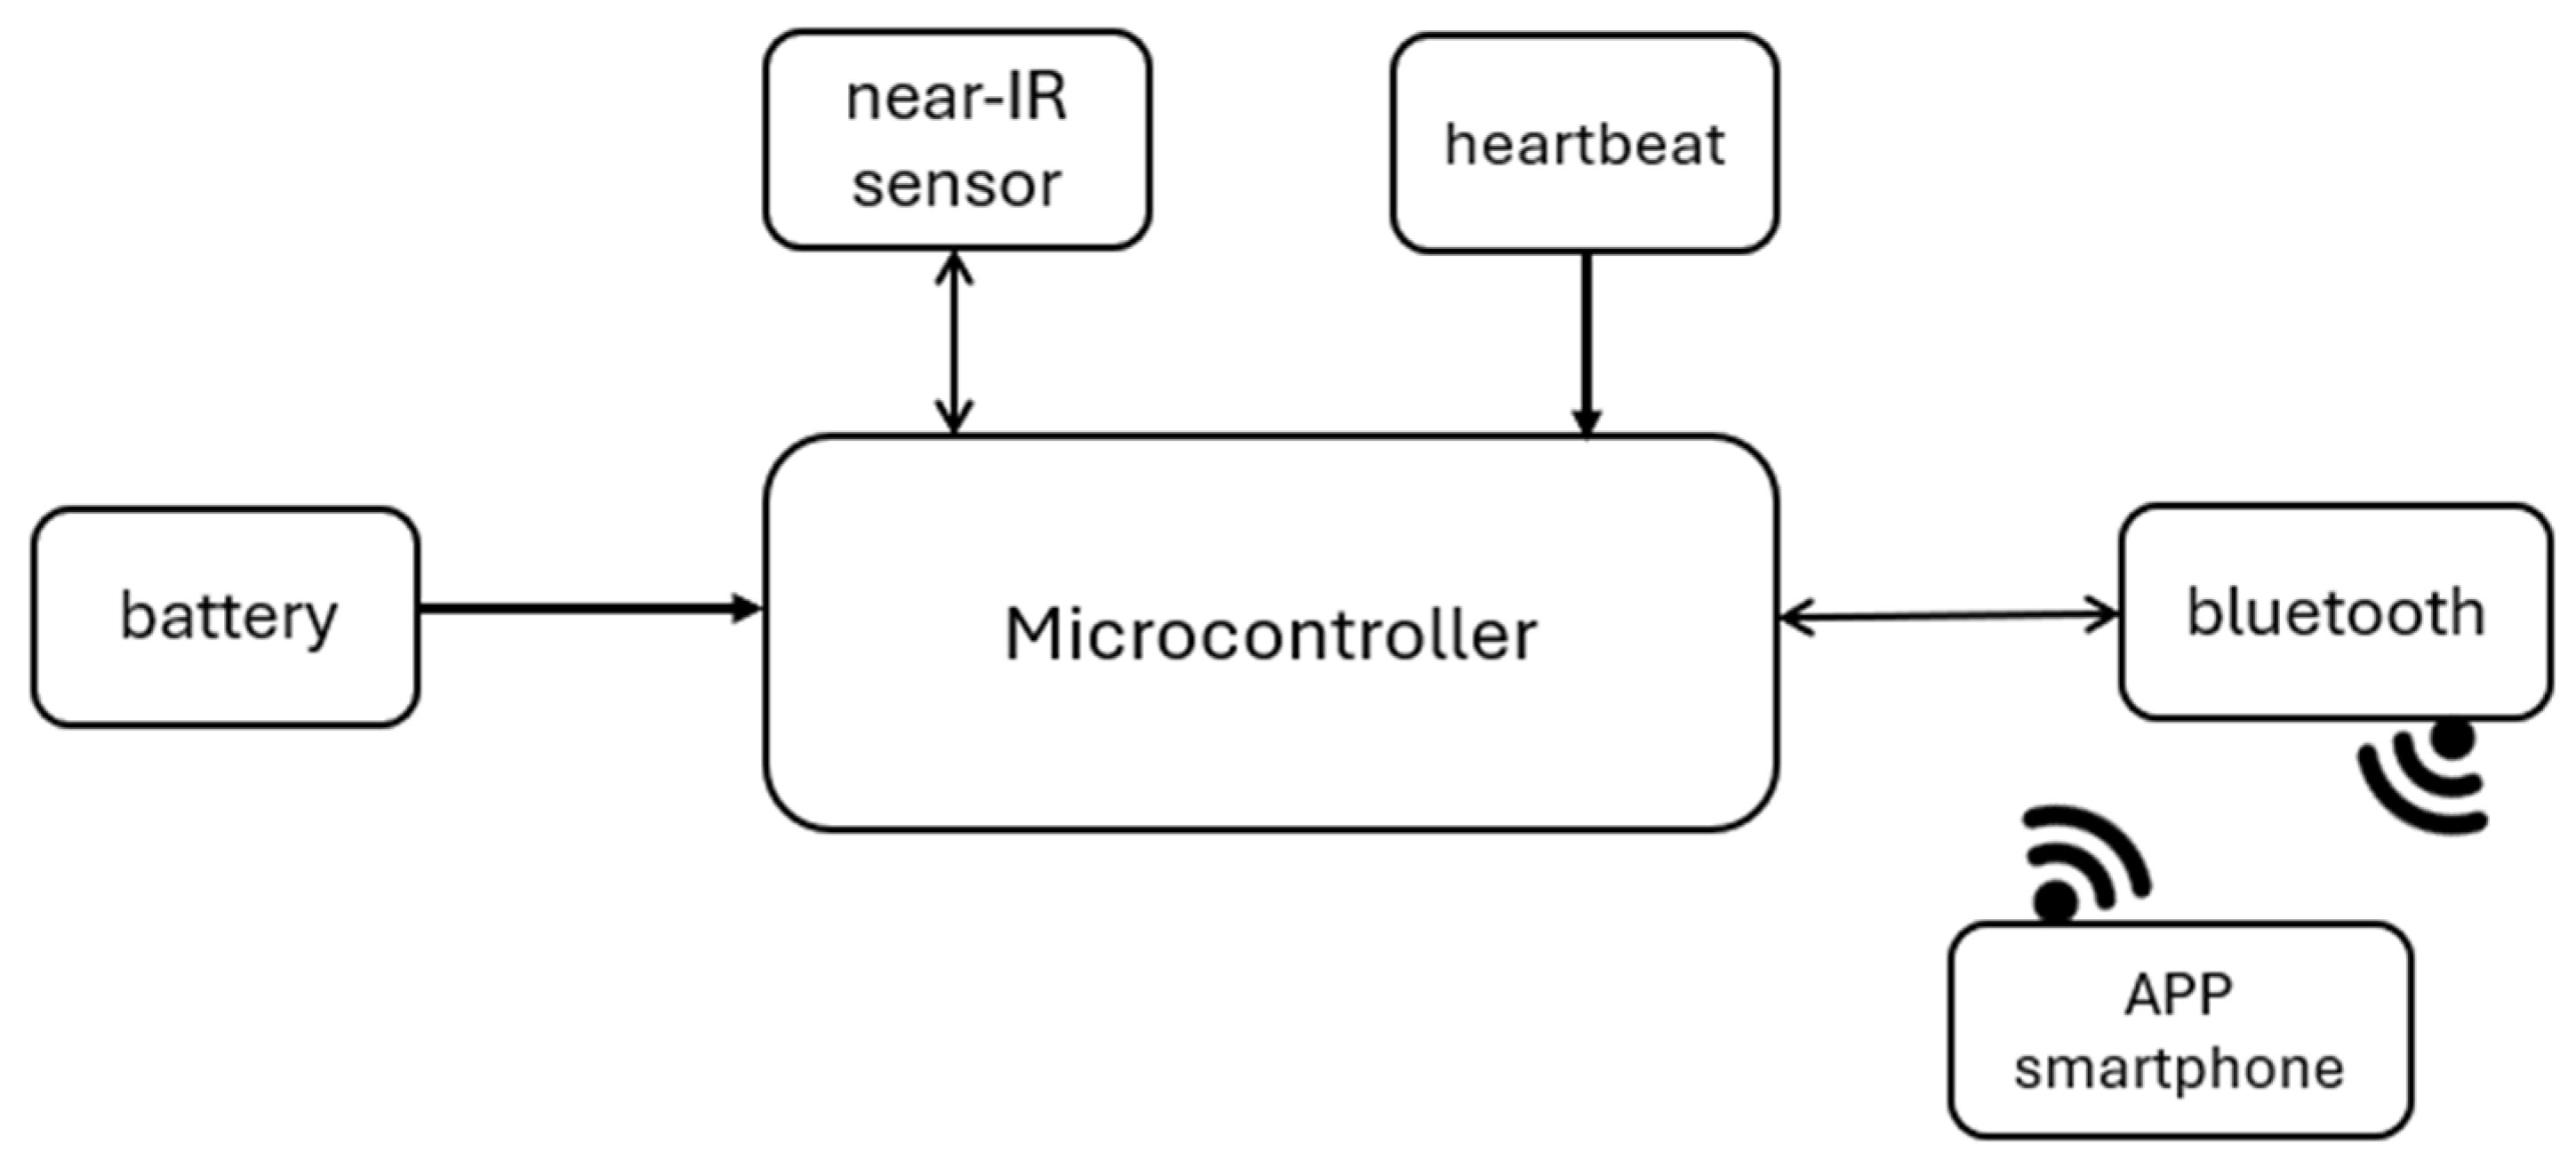
Figure 2 shows the project’s block diagram, which consists of a microcontroller (Arduino Uno), the main component as it receives information from the optical Near IR sensor and the heartbeat sensor, the two sensors used in the project. The Arduino is powered by 5 VDC so that it can work, receive data from the sensor and send it via the Bluetooth module. The Bluetooth module communicates this data with the application.
Figure 2.
System architecture.
Figure 2.
System architecture.
The development board used for this project is Arduino Uno [
7], with the ATMega328 microcontroller [
8]. The ATMega328 is a low-power chip, so it only needs 1.8-5.5 VDC to work, which is one of the main advantages of implementing it on Arduino boards, making power consumption extremely low [
8]. This microcontroller has an Analogue-to-Digital Converter (ADC) with ten-bit resolution. With this ADC it is possible to measure analogue signals and convert them into digital values for processing. Some of the features of the ADC in the ATMega328 are:
- -
Ten-bit resolution: Converts analogue signals into digital ones allowing through this resolution to produce 210 (1024) possible values for each conversion.
- -
Input voltage range: Possibility of measuring input voltages in the 0 V to 5 V range.
- -
Input channels: This ADC offers six input channels, labelled ADC0 to ADC5, each of which can be individually selected for conversion.
- -
Sample rate: The ADC’s maximum sample rate is 15,000 samples per second.
In addition to these features, the ADC uses the process of successive approximations to carry out the conversion. This process consists of a binary search algorithm to determine the digital representation of the analogue input signal. In this process, the ADC compares the analogue input voltage with a reference voltage and determines whether this voltage is higher or lower than the reference voltage. This process is repeated until the digital representation of the input voltage is determined within the desired resolution, which in the case of this microcontroller is 10 bits. The process of successive approximations is an efficient ADC conversion method for producing precise results with relatively low power consumption. However, there are other methods that are faster and more effective, such as flash conversion, which can provide a conversion time in just one clock cycle. Unfortunately, flash converters consume more power and need many comparators, making them impractical for precisions greater than 8 bits.
Sensors are devices which, using energy from the medium being measured, provide the output with a processable signal that is a function of a measurement variable. A sensor is classified as a device which, when subjected to the action of a non-electrical physical quantity, produces a characteristic of an electrical nature. Although the concept is broader, the concept of sensor and transducer is often confused. Transducers are devices that convert a signal of one physical form into another of a different physical form; in short, they convert one type of energy into another. The physical quantities associated with transducers are mechanical, thermal, magnetic, electrical, optical, and chemical. There are three classes of sensors: passive, active, and digital Sensors. Passive (analogue) sensors are those whose variation in the property to be measured is reflected in variations in impedance. Active (analogue) sensors are those whose energy is directly used by the process to be measured. Digital sensors are those that measure discrete quantities such as logic states and devices with a frequency output.
Non-invasive methods can generally be categorised as thermal, electrical, optical and nanotechnology. Much current research concentrates on optical methods, mid- and near-infrared spectroscopy in particular [
9,
10,
11,
12].
Near-infrared spectroscopy (NIRS) is a form of vibrational spectroscopy in which electromagnetic radiation causes vibrations such as stretching and bending of bonds in a chemical species [
6]. Each molecule consists of several different bonds that absorb radiation in different specific characteristic spectra. The absorption of radiation by a molecule leads to an increase in the energy level from an electronic ground state to a higher electronic excited state. The absorption of infrared radiation makes the transition from the energy level to the electron excited state. The NIR spectrum consists of harmonics and combined absorption bands of fundamental vibrations of
C-H,
O-H,
N-H and
S-H bonds [
1]. More in detail:
C-H Bonds (Carbon-Hydrogen): C-H bonds are present everywhere in organic molecules. They appear as distinctive bands in NIR spectra between 2050nm and 2180nm.
O-H Bonds (Water): Water molecules exhibit strong absorption in the NIR range. Their absorption bands are broad and dominant. The main absorption bands from liquid water are located around 1450nm and 1940nm.
N-H Bonds (Protein): Protein content is challenging to spot at lower concentrations, but it manifests as two distinctive bands. These bands occur at 2050nm and 2180nm.
S-H Bonds (Thiols): S-H bonds represent the presence of thiols, which are sulfur- containing organic compounds. Thiols are commonly found in proteins, amino acids, and other biological molecules. The absorption bands associated with S-H bonds typically occur around 2500nm in the NIR spectrum.
There are essentially three bands which are the second or upper harmonic band (750-1400nm), the first harmonic band (1400-2000nm) and the combined harmonic band (2000-2500nm). Detailing:
Second (Upper) Harmonic Band (750-1400nm): This band corresponds to the second harmonic of fundamental vibrations.
- o
-
Key Features:
- ▪
Overtone Absorptions: In this range, we observe overtone absorptions related to fundamental vibrations of various chemical bonds.
- ▪
C-H Bonds: The second harmonic band includes overtones (multiples of the fundamental frequency) of C-H bonds, which are prevalent in organic compounds.
- ▪
Protein and Lipid Content: Researchers often use this band to assess protein and lipid content in samples.
When analyzing food products or biological tissues, the second harmonic band provides valuable information about their composition.
First Harmonic Band (1400-2000nm): The first harmonic band corresponds to the fundamental vibrations of specific bonds.
- o
-
Key Features:
- ▪
O-H Bonds (Water): Water molecules exhibit strong absorption in this range. Monitoring water content is crucial for various applications.
- ▪
Protein Bands: The first harmonic band includes absorption features related to protein content (e.g., amide bonds).
- ▪
Starch and Sugar Bands: Starch and sugar content also contribute to the absorption in this region.
By analyzing the first harmonic band, researchers can assess hydration levels, protein concentrations, and carbohydrate content.
Combined Harmonic Band (2000-2500nm): This band combines both fundamental vibrations and overtones.
- o
-
Key Features:
- ▪
C-H, N-H, and O-H Bonds: The combined harmonic band includes absorption features related to C-H, N-H, and O-H bonds.
- ▪
Thiols (S-H Bonds): Thiols (sulfur-containing compounds) also contribute to absorption in this range.
When studying biological samples or assessing chemical reactions, the combined harmonic band provides insights into various functional groups.
As reported in [
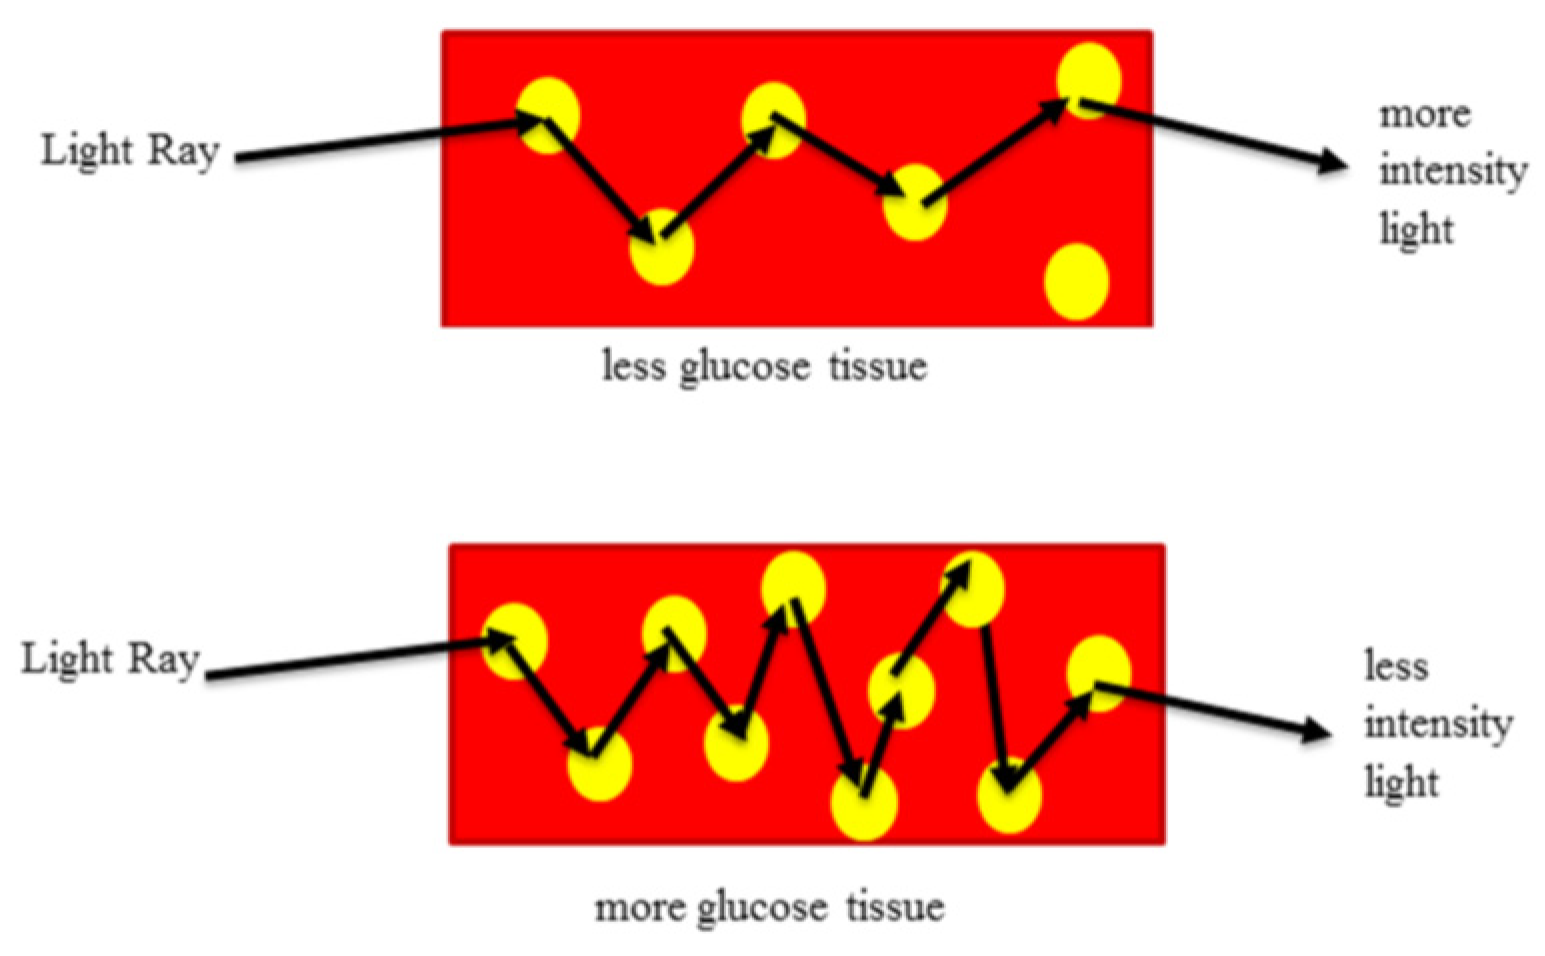
12], the region has a series of optical windows where there is low absorption of water, hemoglobin, and lipids. This allows NIR radiation to reach areas with a higher concentration of blood under the skin, as well as being non-destructive. Most importantly, the NIR method has a relatively low cost, as the materials can be purchased at affordable prices, e.g., 940nm Near-IR emitter and receiver LEDs. NIR can also penetrate deeper into the skin than mid-range IR radiation, making it the right option.
940nm was chosen for this experiment because, even though glucose has light absorption peaks at other wavelengths belonging to the NIR range (e.g., 970nm, 1197nm and others) it is at this wavelength that has the lowest signal attenuation by other biological components, such as red blood cells, water and platelets. Other possible choices related with higher peak absorptions of glucose on other regions, like the first harmonic or the combined region, were trade by the area of the second harmonic, by the crucial fact that the second allows deeper penetration in the biological tissue. Also, for lower wavelengths the absorption of deoxyhemoglobin, oxyhemoglobin and melanin increases, while for larger wavelengths water absorption as an increasing impact.
In addition, there is no need for prior sample preparation with this method and it provides rapid results.
However, shorter NIR wavelengths cause a high level of scattering in the tissue. Other disadvantages include poor sensitivity to low blood glucose concentrations, which makes accurate detection difficult, and interference from compounds with similar absorption characteristics to glucose.
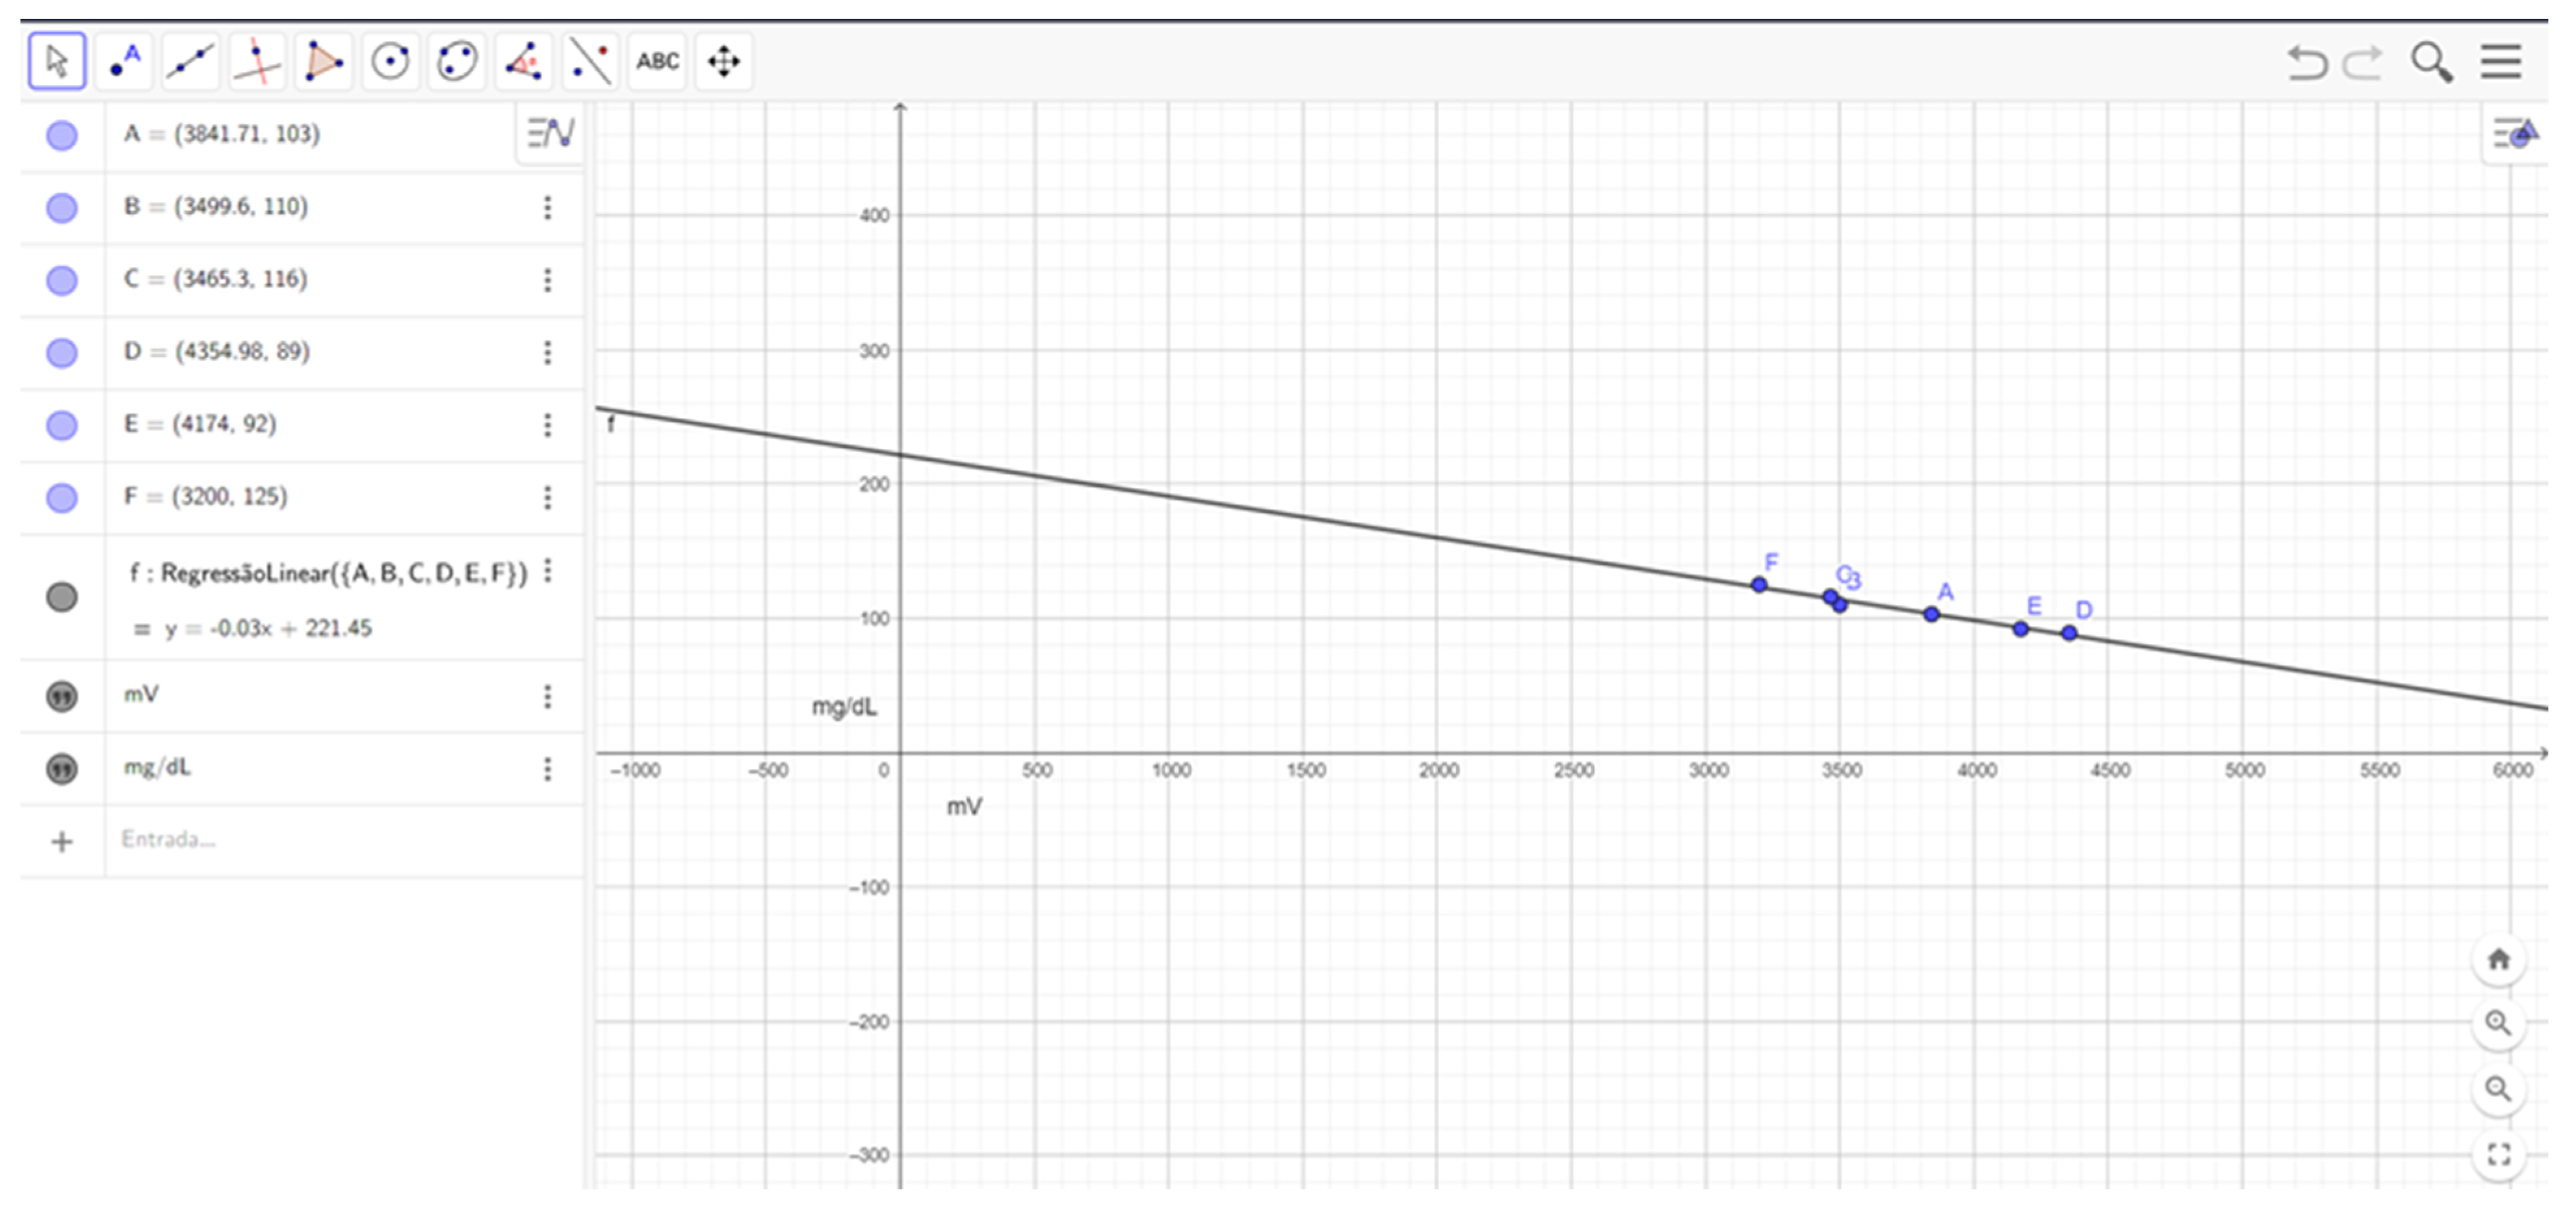
The optical sensor detects transmitted infrared radiation and converts it into electrical signals. Arduino Uno is connected to the Near-IR emitter and collect the data from the Near-IR receiver via the 10-bit analogue digital converter (ADC) that is part of the microcontroller’s architecture, with an accuracy per bit of 4.8 mV, after which the glucose level was calculated using a linear regression based on the measured values (this point is developed in
Section 3).
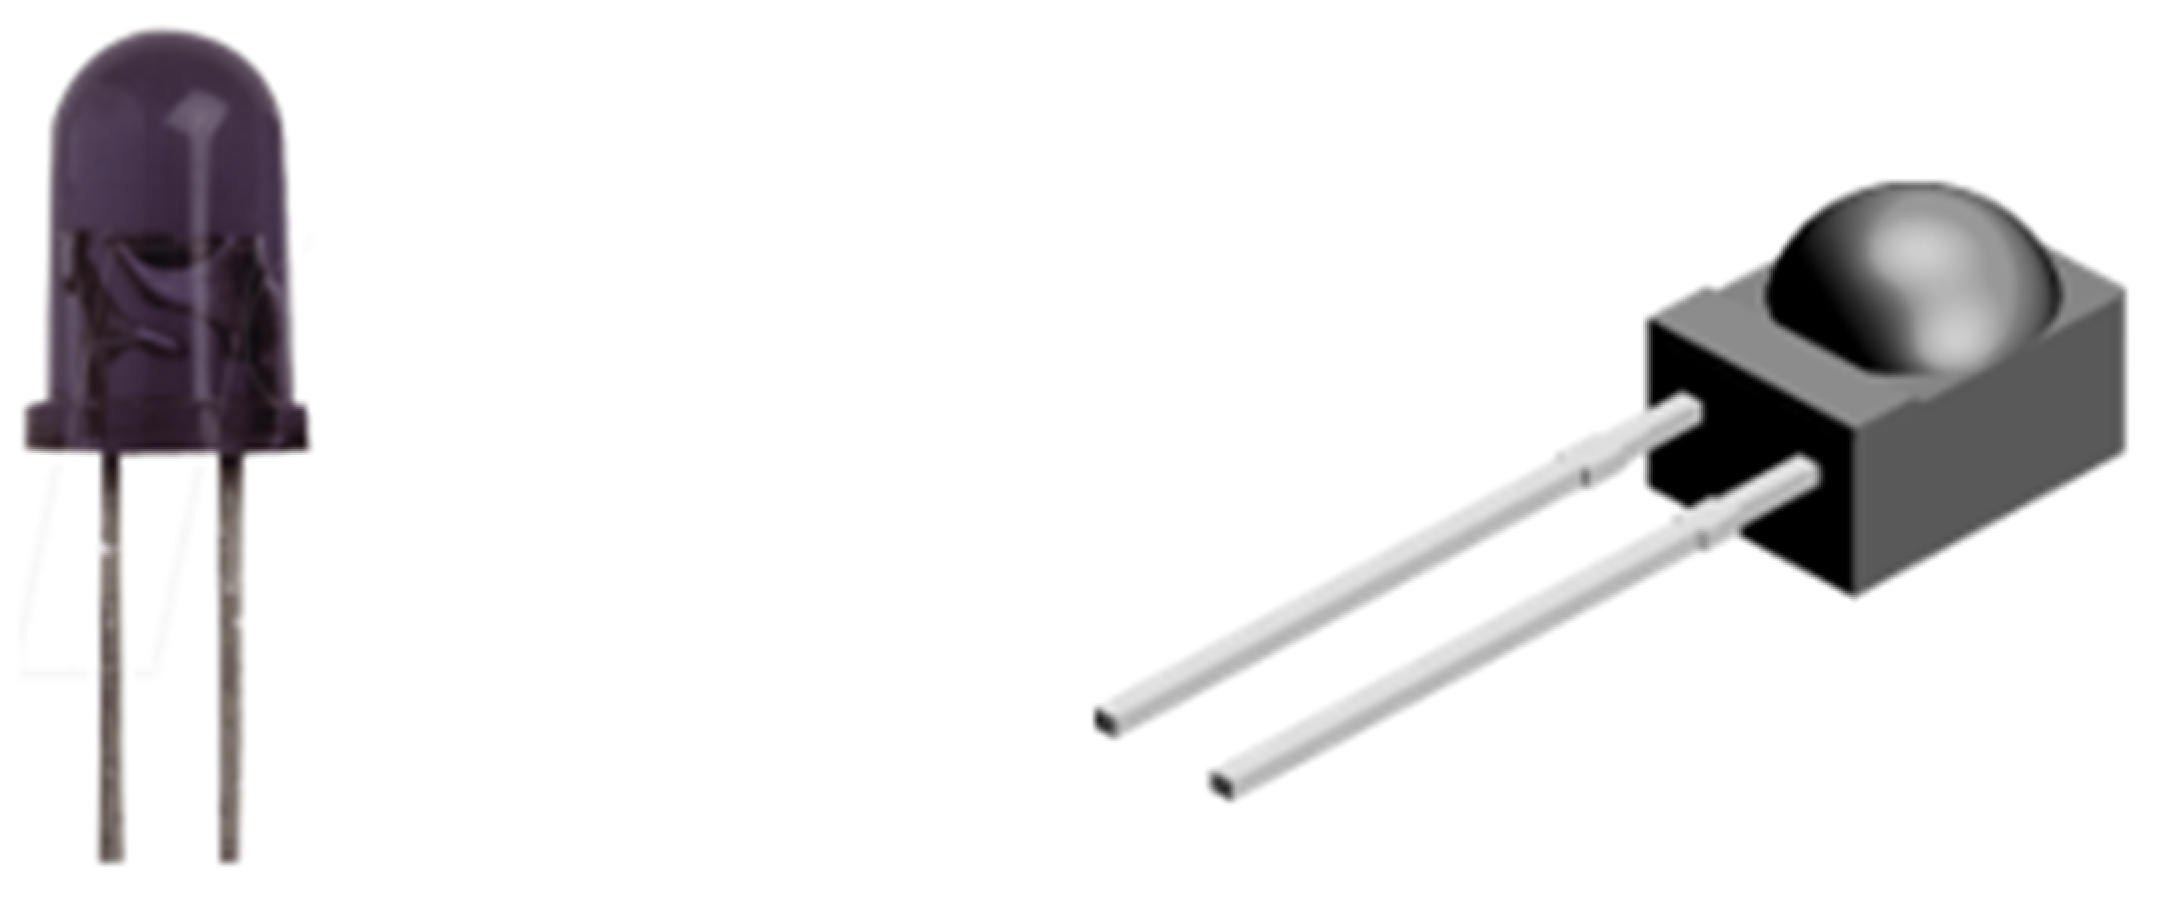
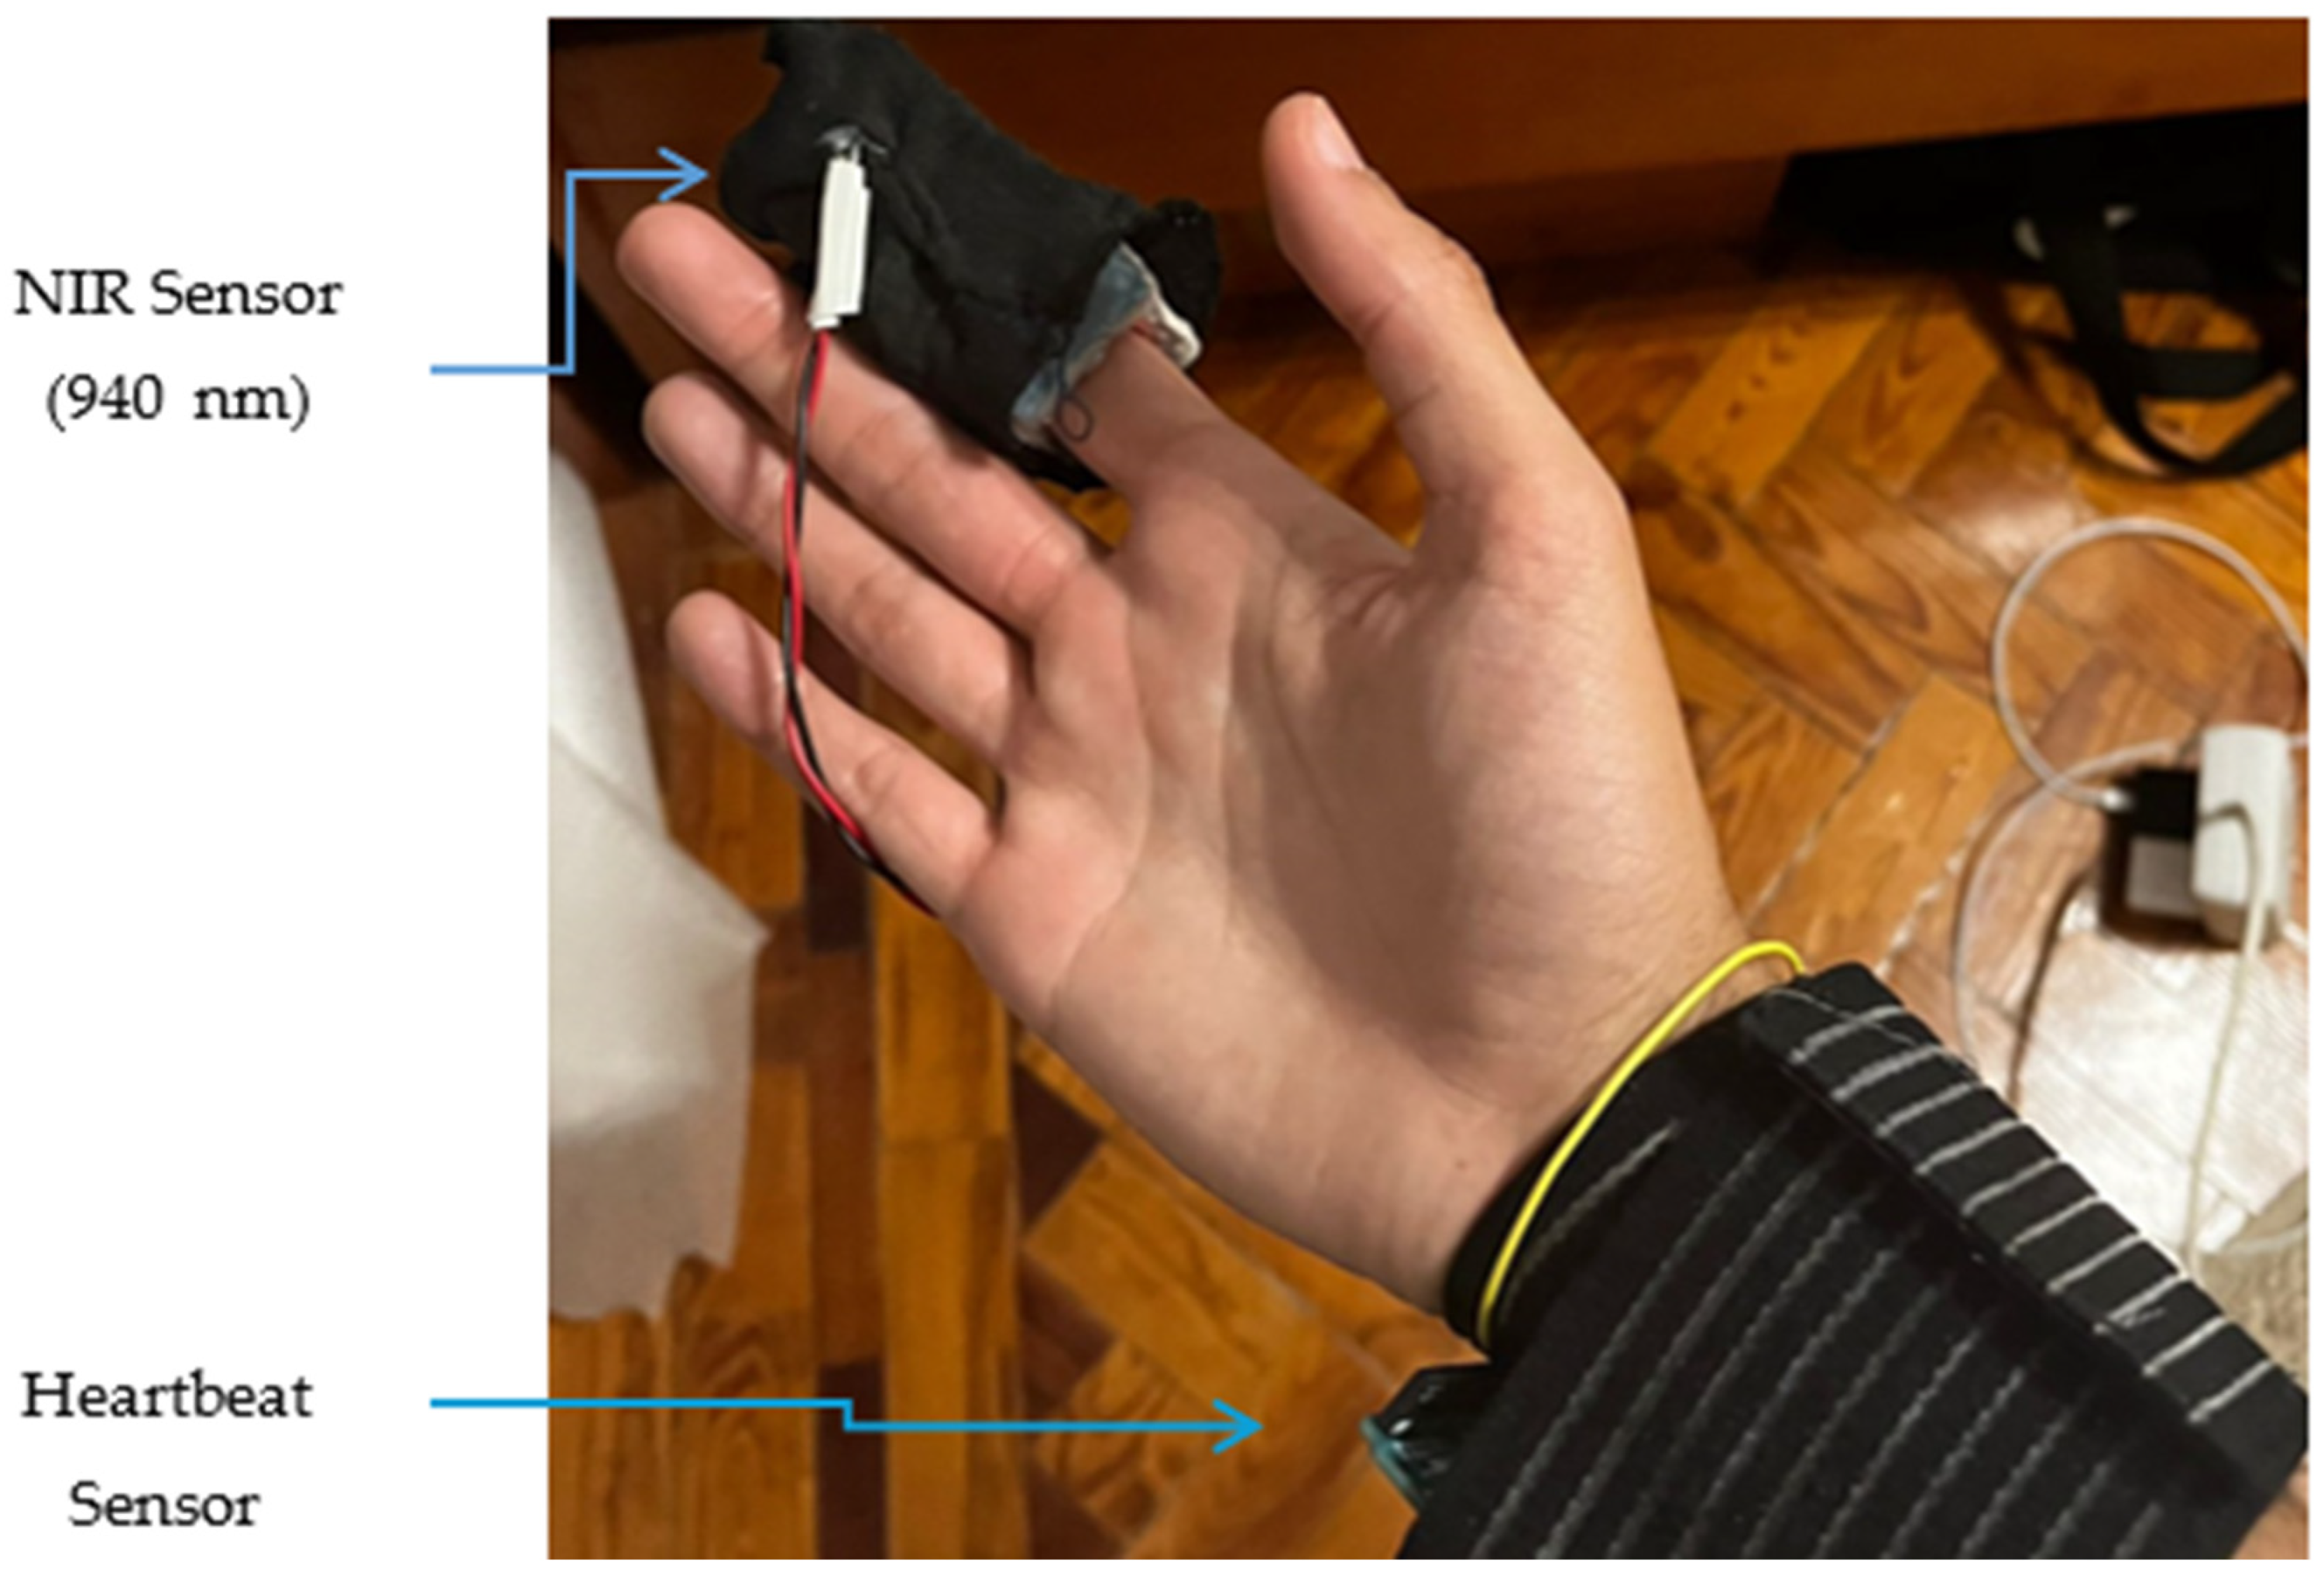
The Near-IR emitter and receiver have been integrated into a black housing to reduce the noise that can be caused by ambient light. A set of two emitter LED and receiver photodiode were arranged opposite each other, with a small space in the middle to allow the finger to be placed. Among the various places where we could place our NIR sensor and get our measurements are the lips, tongue, earlobes or fingertips, all of which are rich in blood vessels. The fingertip ended up being chosen for practical reasons relating to the construction of the black box that houses the NIR sensor. In the Figure 3 we can see the image of an IR Led of 940nm (TSAL6200) as well as the photodiode used as optical receiver (BPV22NF) with peak sensitivity at 940nm, both from Vishay, used in our experiment.
Figure 3.
NIR emitter LED (left) and Optical Receiver (right).
Figure 3.
NIR emitter LED (left) and Optical Receiver (right).
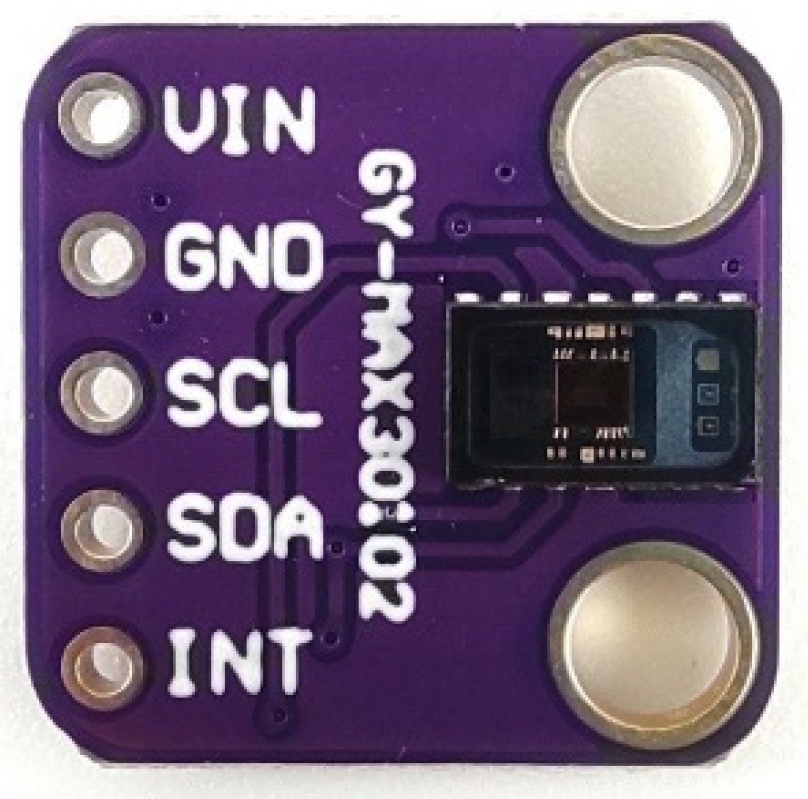
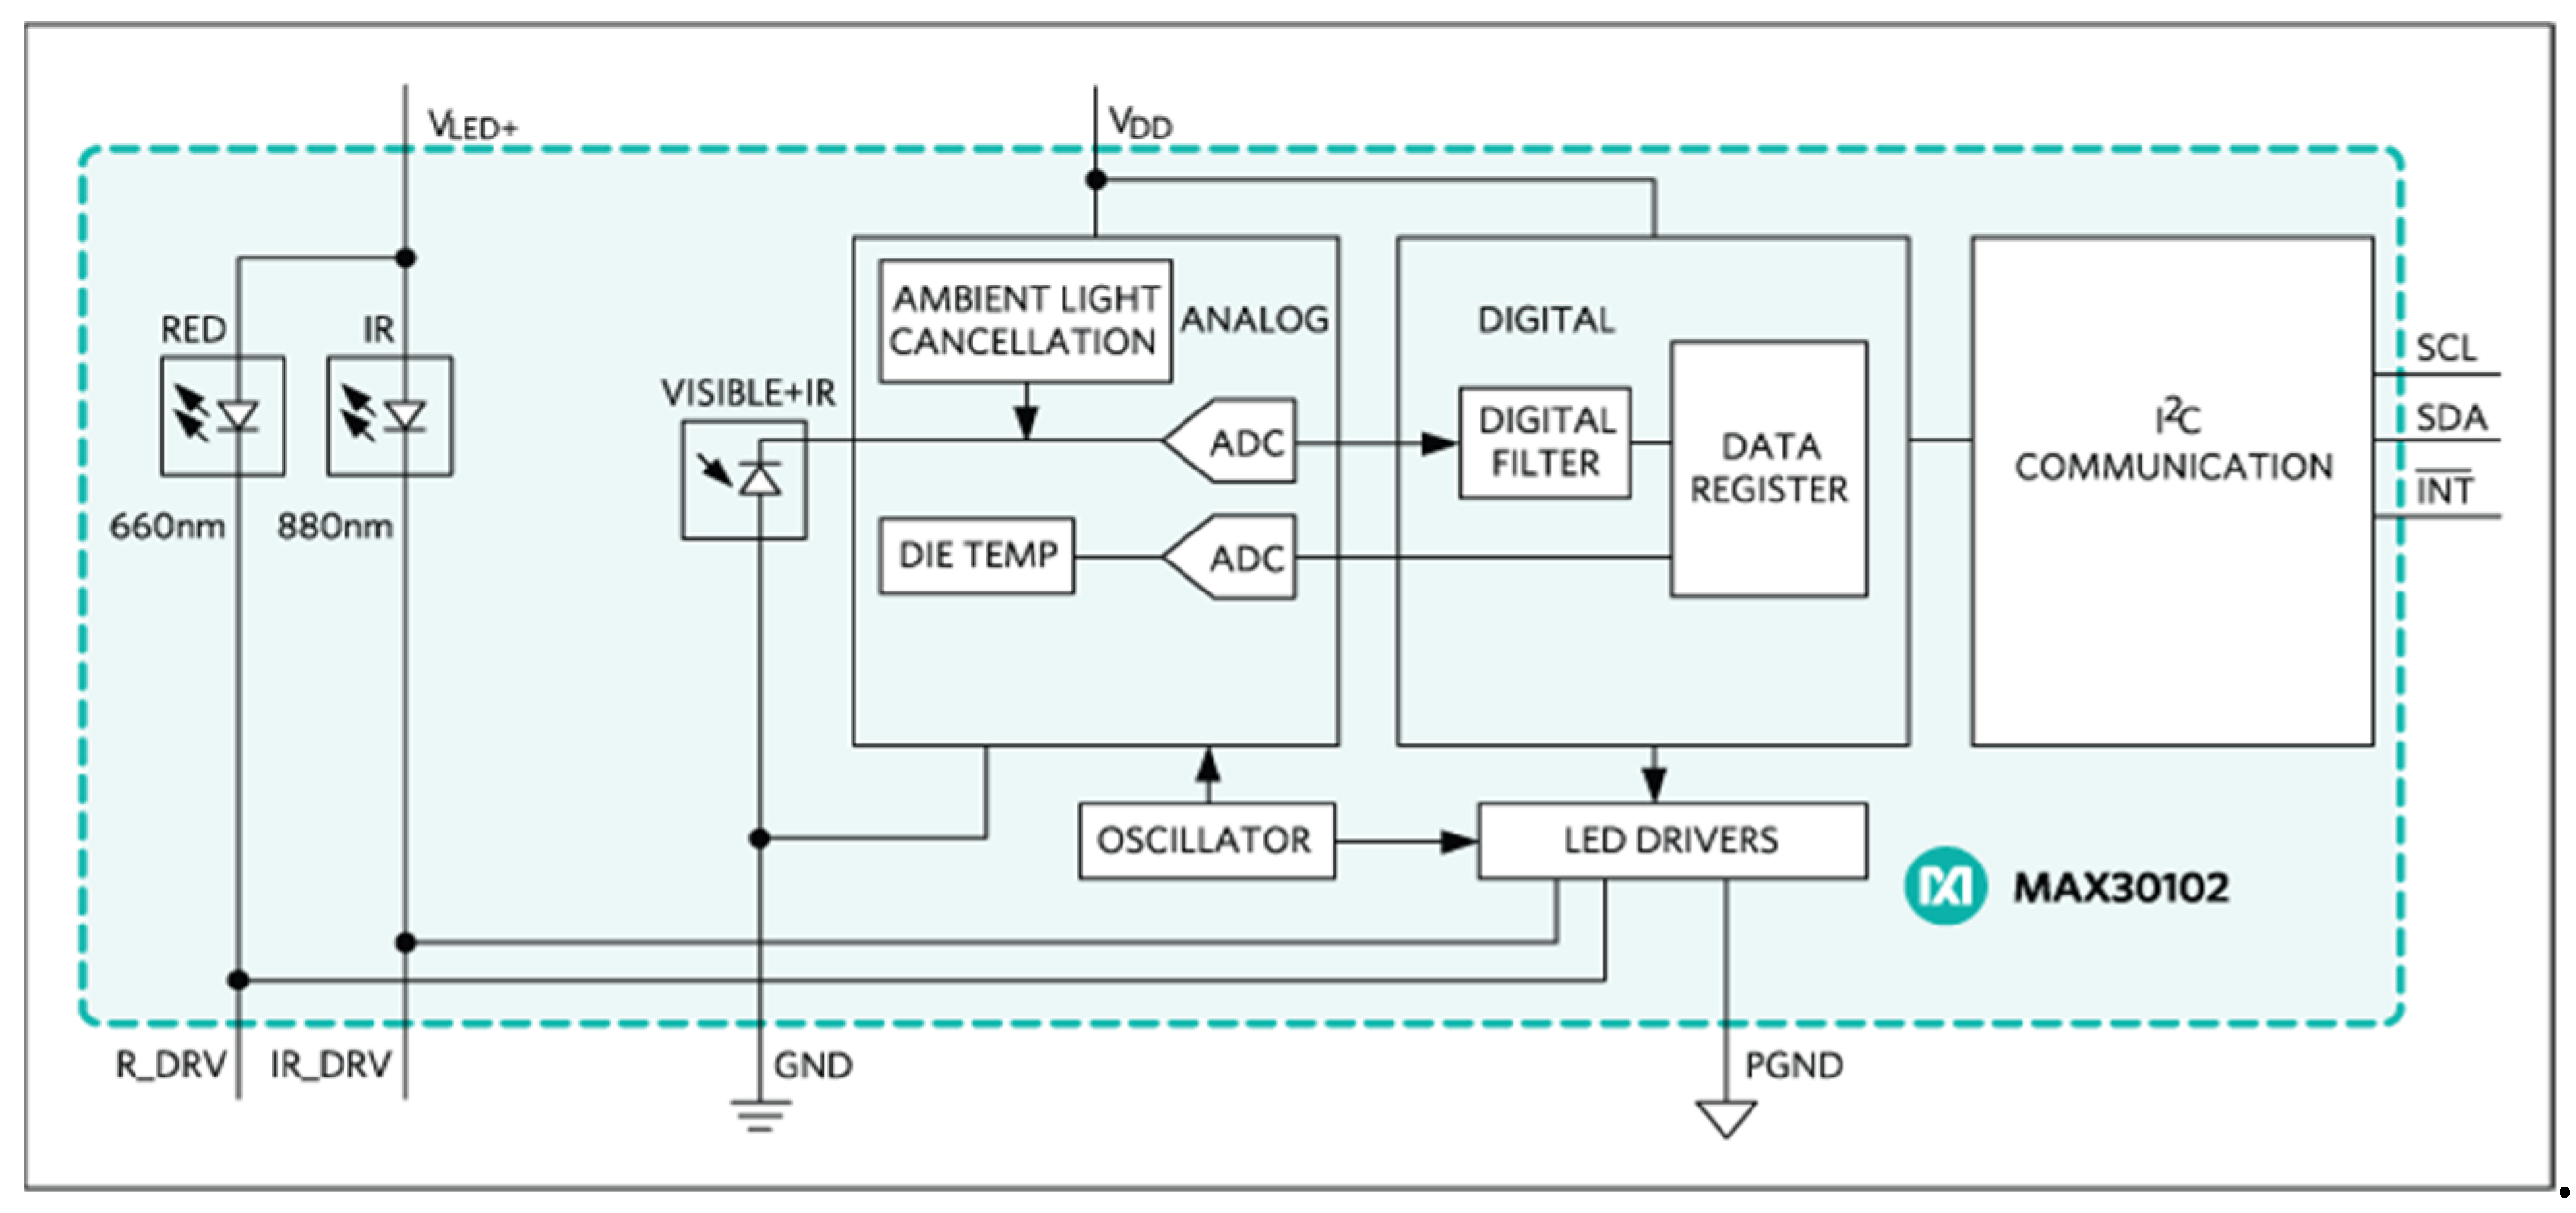
Another sensor used in the experiment, the MAX30102 (Figure 4 and Figure 5), is not relevant for measuring glucose levels, but is used to provide the user with more information, such as a heartbeat. The MAX30102 is an integrated pulse oximeter and heart rate sensor IC, from Analog Devices. It combines two LEDs (IR and Red LEDs), a photodetector, optimized optics, and low-noise analog signal processing to detect pulse oximetry (Saturation of Peripheral Oxygen, SpO2) and heart rate signals.
Figure 4.
MAX30102 Board (5 pin version).
Figure 4.
MAX30102 Board (5 pin version).
Figure 5.
MAX30102 Board (7 pin version).
Figure 5.
MAX30102 Board (7 pin version).
In our experiment we use the version of the MAX30102 with 5 pins.
The board has two voltage regulators, 3.3 VDC to power the LEDs and 1.8 VDC to power the IC of the MAX30102. Communication with the Arduino Uno is via I2C. One of the most important features of the MAX30102 is its low power consumption: the MAX30102 consumes less than 600μA during measurement (in standby mode only 0.7μA). The IR Led Wavelength is of 880nm (Figure 6).
Figure 6.
MAX30102 Block Diagram.
Figure 6.
MAX30102 Block Diagram.
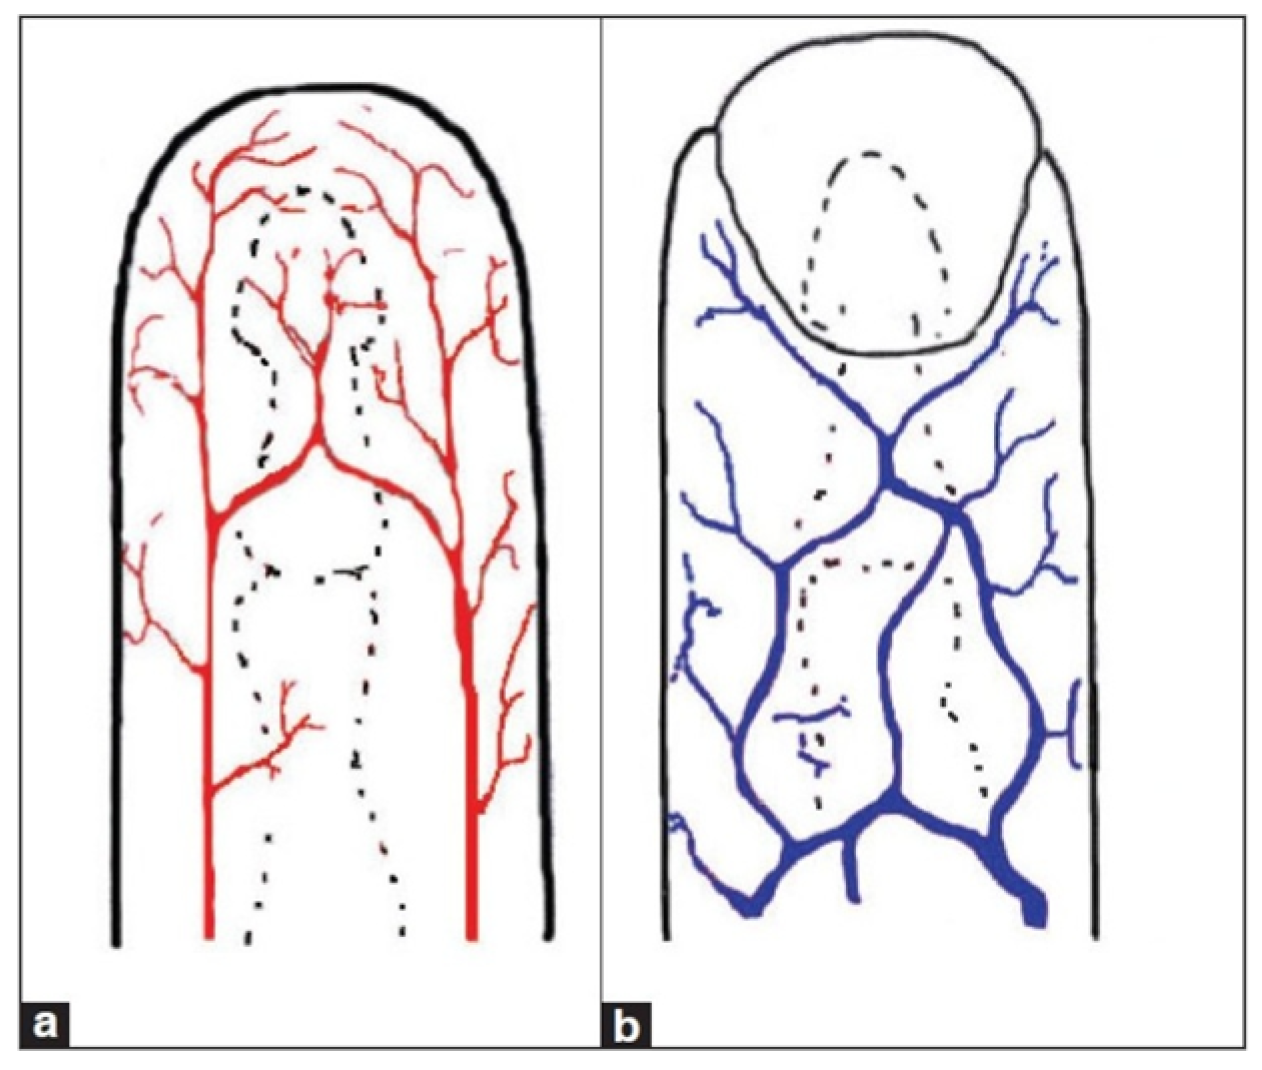
Our body is made up of veins and arteries, with the veins visually represented by blue lines (see Figure 7) and the arteries by red lines. In the veins, blood travels through the body’s tissues towards the heart, while in the arteries, blood flows from the heart towards the rest of the body. Structurally, arteries are blood vessels with thick, resistant walls, and blood flows through them at high pressure. In contrast, veins are less thick and blood flows through them at lower pressure. Structurally, arteries are blood vessels with thick, resistant walls and blood flows at high pressure through them. In contrast, veins are less thick and blood flows through them at lower pressure. The blood that flows through the arteries is rich in oxygen and can be called oxyhemoglobin (a complex formed by the binding of oxygen (O₂) to hemoglobin). Arteries are more absorbent of infrared light compared to other tissues. The blood that runs through the veins is low in oxygen and is known as deoxyhemoglobin (form of hemoglobin that has released its bound oxygen). When it comes to light absorption, deoxyhemoglobin has a particular affinity for red light. This affinity is what contributes to the purplish-blue appearance of deoxygenated blood. As light passes through our tissues, deoxyhemoglobin selectively absorbs red wavelengths, allowing other colors to pass through.
Figure 7.
Blood circulation example: Arteries (a) and veins (b).
Figure 7.
Blood circulation example: Arteries (a) and veins (b).
By comparing the absorption levels of oxyhemoglobin and deoxyhemoglobin the sensor will calculate the SpO2 percentage.
The blood that runs through the arteries is rich in oxygen. The more oxygenated the blood, the more hemoglobin it contains, so the blood is redder and consequently absorbs more infrared light. In short, the more oxygenated the blood, the greater the amount of infrared light absorbed. As was said previously the sensor IR and red LEDs are used to generate the light that penetrates the skin and red-colored tissues. The infrared LED penetrates the skin and are predominantly absorbed by the arteries, while the red LED penetrates even further away and are predominantly absorbed by the veins. When the light passes through the skin, it encounters reflection from the flowing blood in the blood vessels. The sensor employs a photodiode (along with a photonic filter-ambient light cancellation), to measure the amount of light reflected by the blood. The photodiode receives the light reflected signals and convert them into analog data. This data is then converted into digital data by the ADC (Figure 6). As the heart pumps, the reflected light (that which is not absorbed) is altered, generating a wave reading on the photo detector, which then generates a waveform that correlates the heartbeat rate.
The Bluetooth module used in this work is the HC-05. It has a range of up to ten meters without obstacles and can be configured in two modes, Master, and Slave.
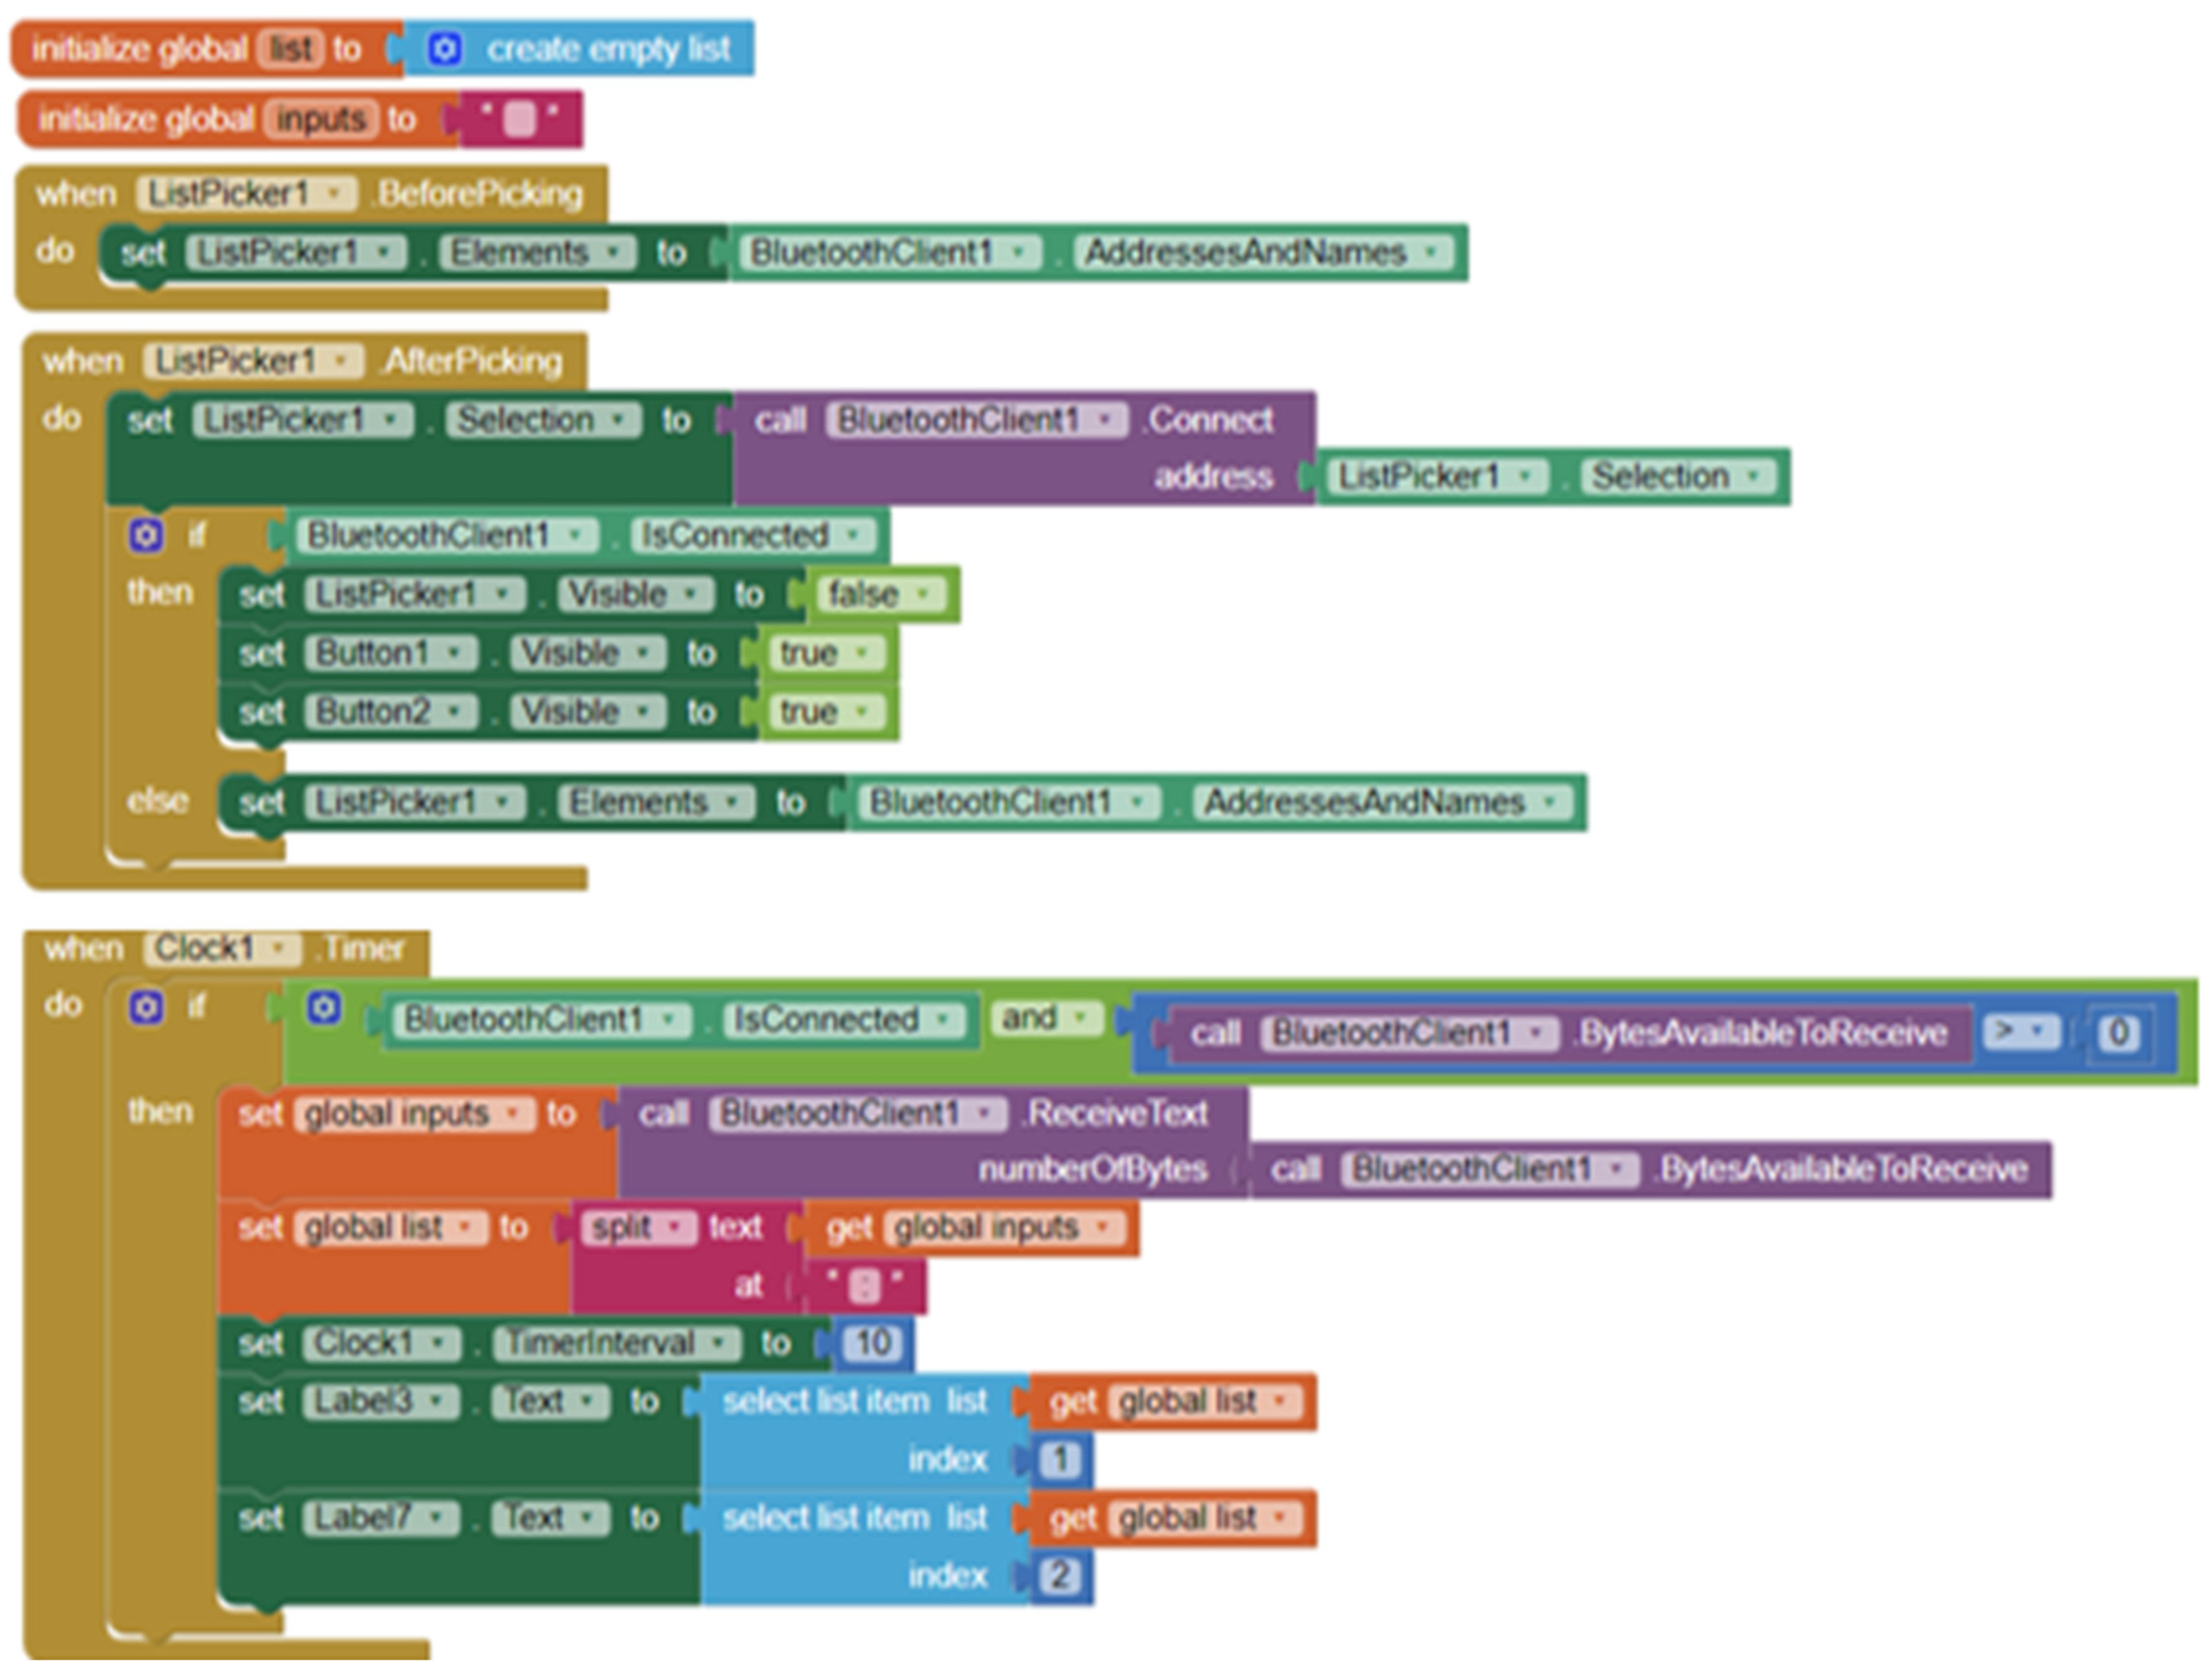
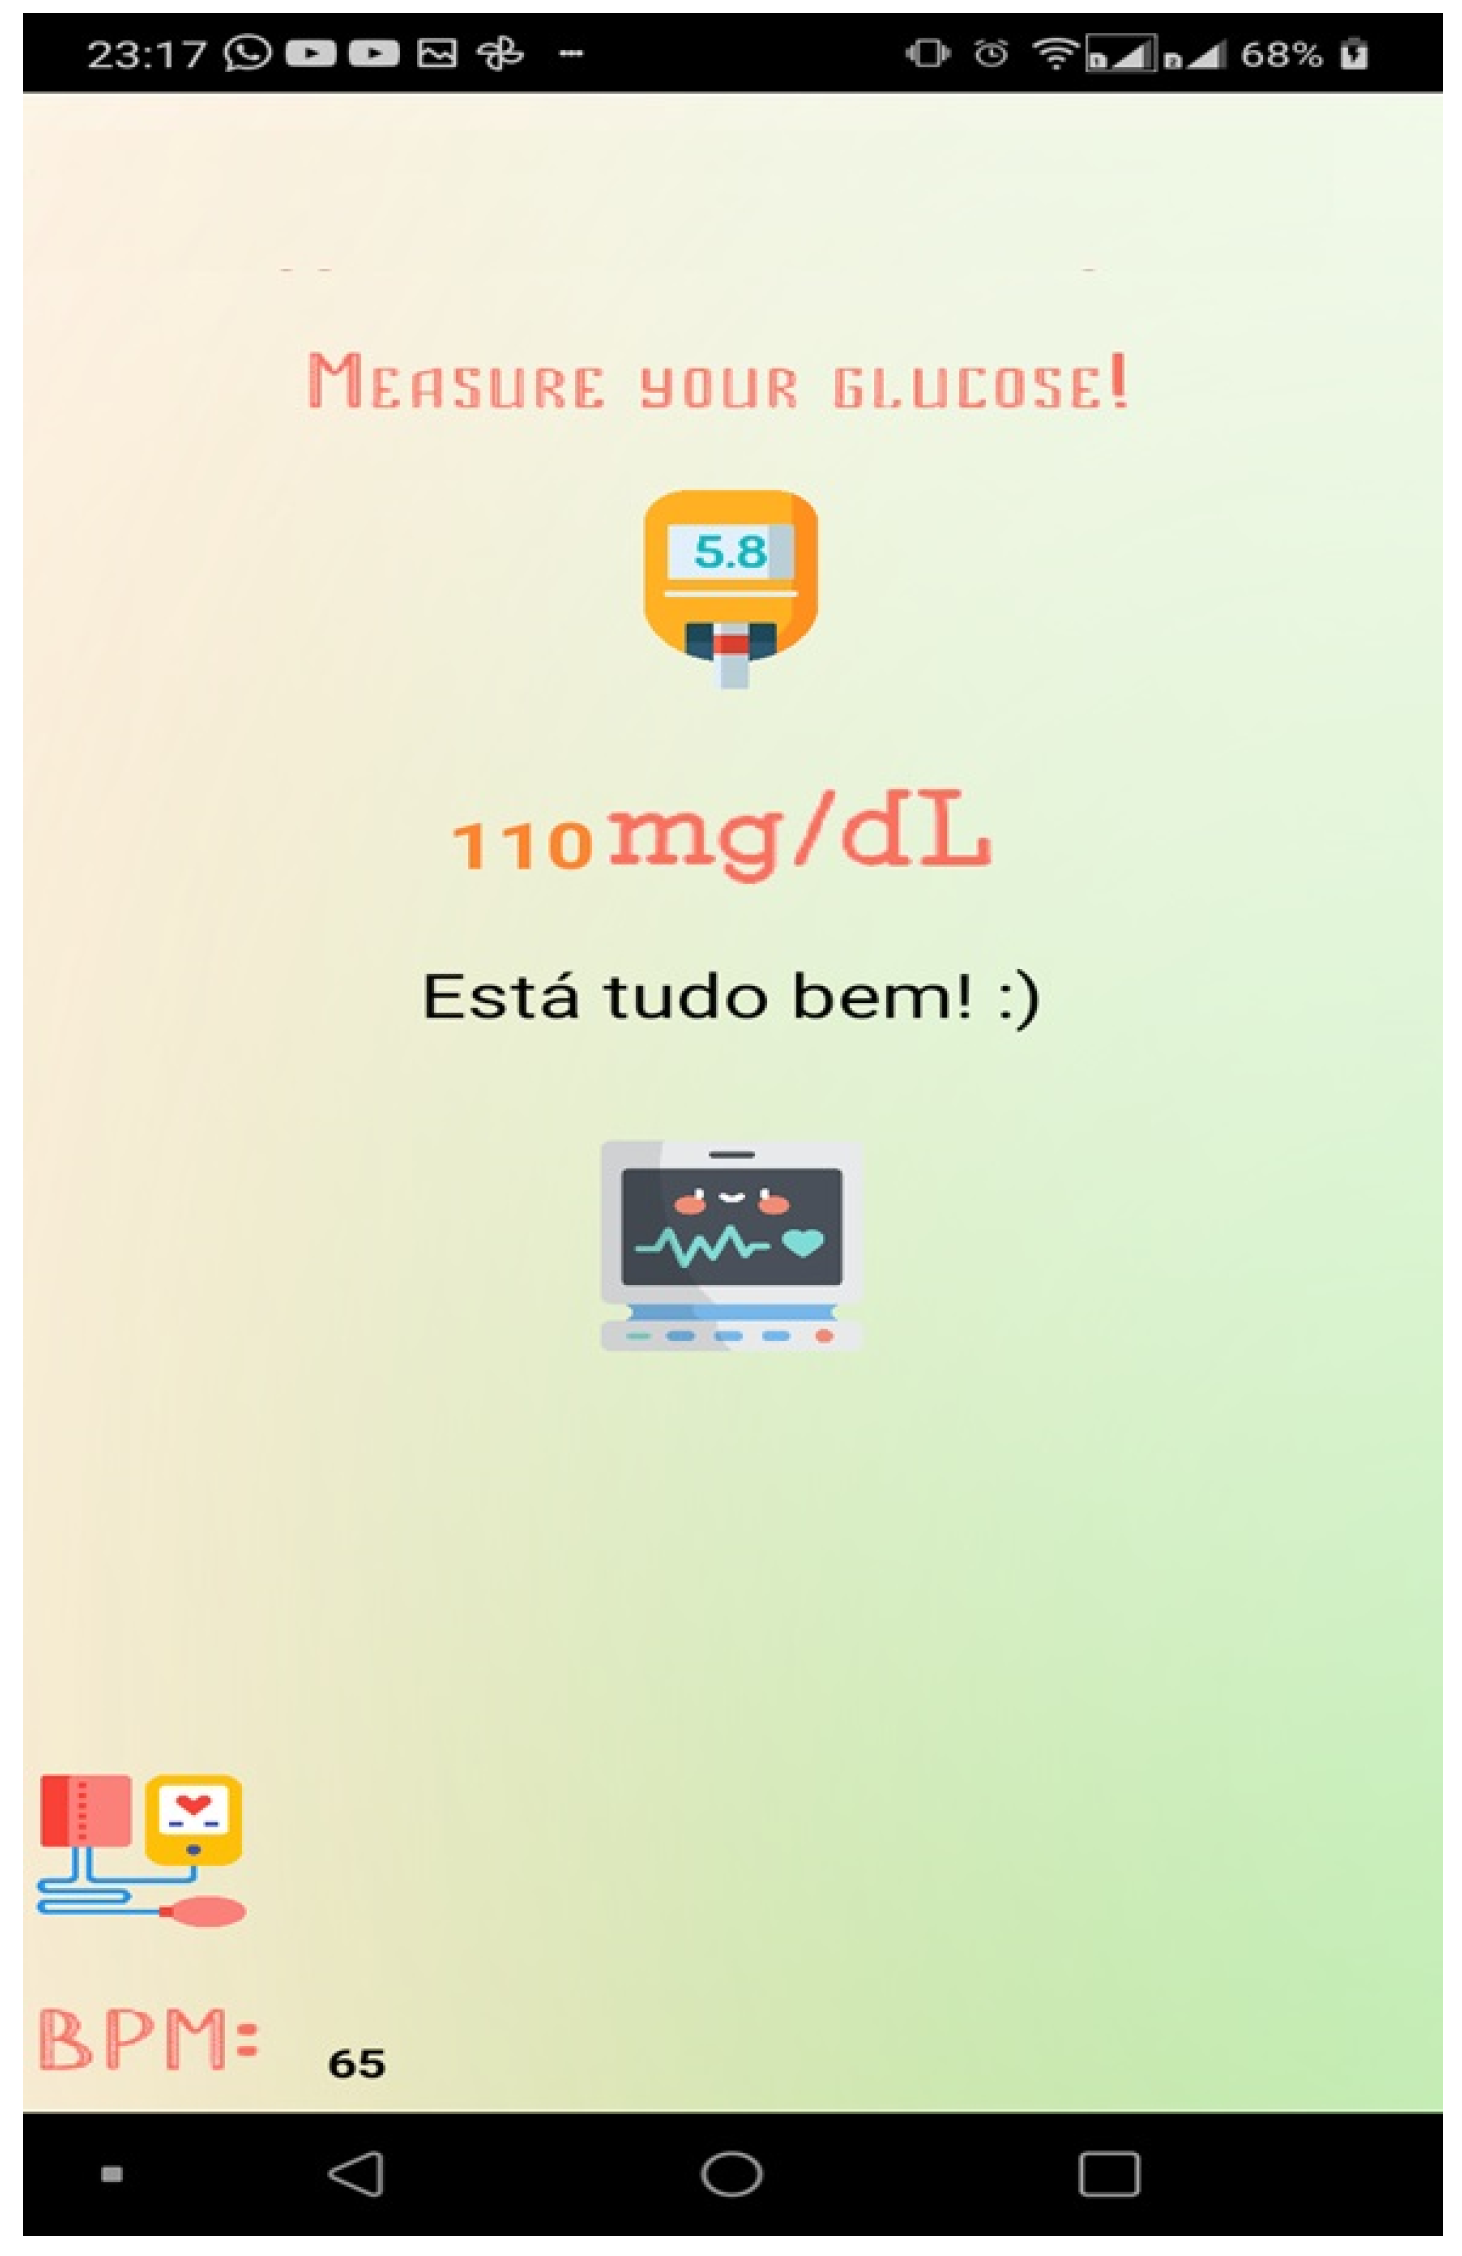
This work uses two programming languages, C/C++ and block programming. The C/C++ programming language is used to develop the firmware for the Arduino Uno. Block programming (APP Inventor) is used to program the application (APP) resident on the smartphone.
