1. Introduction
Renewable energy generation has become an essential factor in the sustainable development of countries, regions, and even individuals in recent years. The use of feedstocks to produce biogas and biomethane has a vast potential, which could cover about 20% of today’s global gas demand. Waste from agriculture and industry negatively affects health and the environment, becoming significant emitters of greenhouse gases such as methane and nitrous oxide [
1,
2]. Methane fermentation is one of the most beneficial technologies for converting organic waste into renewable energy. Agricultural biogas plants reduce the environmental impact of agriculture. The digestate, obtained from the processed substrates, can be effectively used as an organic fertiliser [
3,
4]. In addition, biogas can contribute to mitigating the harmful effects of using fossil fuels [
5], the combustion of which has contributed to a significant increase in CO
2 concentrations in the atmosphere [
6]. Biogas can act as an alternative energy source by generating electricity, heat, and cooling and replacing natural gas derived from fossil fuels [
7]. Biogas produced in biogas plants mainly contain methane CH
4 and carbon dioxide CO
2 [
8]. In addition, biogas also contains water, nitrogen, hydrogen sulphide, ammonia, oxygen, siloxanes, and other particles in smaller proportions [
9]. The composition of biogas depends mainly on the substrate used and the technology employed [
10].
When building a biogas plant, the location plays a key role, which mainly depends on the availability of input materials (type of farm), the availability of the electricity grid, and the distance from urbanised areas (due to the potential impact of the biogas plant on noise and odours) [
11,
12,
13]. From the point of view of agricultural development, the most important are micro biogas plants, built directly on farms and fed with waste (e.g., slurry) generated on the farm. A farm with a micro biogas plant is seen as modern and environmentally friendly. The profitability of agricultural biogas plants located at cattle farms depends mainly on the price of electricity and on having the capital to purchase and maintain an electrical generator [
14,
15]. In addition, suitable technical conditions for connecting such an energy source at the location are necessary [
16]. The costs associated with constructing a biogas plant, calculated per cow, decrease with the increase in herd size [
17]. When calculating the profitability of an investment in an agricultural biogas plant, the equipment’s maintenance and servicing costs should also be considered [
18,
19]. Various numerical methods, such as AHP [
20], Vikor [
21], and the numerical taxonomy method [
22], can be used to assess the profitability of the investment. The payback period for the construction of an agricultural microbial gas plant is 6-7 years [
23] (investments with a payback of up to 8 years are considered financially beneficial [
24,
25]). In comparison, the payback for a P.V. plant is within 5-6 years [
26].
Agricultural biogas plants enable the generation of electricity heat and cooling and have several other advantages, among which are:
the possibility of using biogas as a fuel for internal combustion engines [
27];
an increase in regional/national energy security through the development of distributed energy [
28];
a reduction in the cost of disposing of organic waste [
29];
mitigation of adverse climate change [
30];
use of local energy resources [
31];
production of wholesome manure [
32].
Despite the apparent increase in biogas production, there is often a lack of relevant knowledge and technology in agriculture [
33]. Therefore, an essential action is to broker information from agriculture to the technology industry, covering all legal, environmental, administrative, organisational, and logistical aspects, to implement as many biogas plant projects as possible successfully [
34]. Many adverse effects, including financial losses, result from investors’ ignorance, who often violate the basic principles of biotechnology when selecting substrates for their installations [
35]. Existing installations are constantly being improved in terms of their production efficiency and environmental impact [
36]. The local use of the generated energy avoids the losses associated with the transmission of energy over longer distances [
37].
Biogas power plants are among the renewable energy sources characterised by the constancy of the generated power over time. It was confirmed by the authors’ previous studies conducted in biogas plants connected to the medium-voltage grid [
8]. However, there is a lack of analysis in the literature of the results of studies that would present an in-depth analysis of the impact of generation in biogas plants on the voltage of the electrical system supplying consumers installed on farms. This topic is all the more important because, in Poland, farmers with small agricultural biogas plants have reported problems with operating some loads, including milking apparatus. Therefore, the authors decided to fill this research gap by conducting a comprehensive study in a micro biogas plant in Poland, in the Podlaskie Province. Presenting the proposed solutions to a wider audience may make it possible in the future to avoid mistakes made in the construction of microgas plants and even influence the companies building their components to optimise the amount and quality of energy fed into the grid. It may contribute to a faster development of this type of energy source (thanks, among other things, to a shorter payback time). It is very important for the sustainable development of rural areas. Indeed, agricultural micro biogas plants not only avoid atmospheric emissions of greenhouse gases (through the local production of electricity, heat, and cooling from agricultural waste) but also contribute to making rural areas more attractive (through the reduction of odour emissions from animal production and the generation of additional jobs).
2. Materials and Methods
The study was conducted at a Polish agricultural biogas plant connected directly to a farm installation. The main substrate used in this biogas plant was manure from approximately 120 dairy cows. The agricultural biogas plant had three facilities - a digester, an engine house, and a digestate tank. The digester had a diameter of 15.5 m and a wall height of 3.7 m (the total height, including the biogas tank, was 8.7 m). During regular operation, the digester held approximately 590 m3 of substrate, mixed by two agitators with a rated power of 9 kW. The engine room was made in the form of a container, in which an internal combustion engine connected to a generator was installed, as well as other technical equipment for pumping and purifying biogas and controlling the biogas plant’s technological processes. Biogas purification takes place in a gas filter and an activated carbon filter. The biogas produced is combusted in two combustion engines, type WG1605, each with a power output of 20 kW (with an efficiency of 97 %). A type 4P/IE2 asynchronous generator with a speed of 1,500 rpm is coupled to the engines. The biogas combustion engine was cooled by circulating water in the engine and the cooling block. The final component of the biogas plant was an open concrete digestate tank.
The owner of the biogas plant reported the following problems with its operation:
Due to voltage exceedances at the agricultural biogas plant’s connection point, it is impossible to run the second generator.
Increasingly frequent cluster malfunction - voltage error displayed.
The slurry stayed in the fermenter for an average of two to three weeks, but no less than 12 days. Daily, part of the digested slurry was pumped out of the digester into the digestion tank. The dose of pumped digestate was controlled automatically and depended on the amount of biogas produced, which in turn depended on the parameters of the slurry fed in. A pressure sensor determined the charge level in the reactor. Once the slurry pumping process was complete, when the pressure dropped below the set value, a new portion was pumped from the collection channel to compensate for the substrate’s shortfall.
Power quality is defined as a set of parameters describing the characteristics of the power supply process to the user under normal operating conditions, characterising the supply voltage, and determining the continuity of the power supply to the consumer. The following parameters describing power quality were analysed in the study [
38,
39]:
Mains frequency is the number of repetitions in the time waveform of the fundamental component of the supply voltage measured over a specified time interval. The frequency deviation is the difference between a given value and the rated frequency value exhibited during regular power system operation over at least a few seconds. The frequency deviation should, in most cases, not exceed +/- 1% of the rated grid frequency.
Voltage deviation (slow voltage variation) is the difference between the actual and rated mains voltage values. In most cases, the free voltage variation should not exceed +/- 10 % of the rated mains voltage value.
-
Voltage fluctuations (rapid changes in voltage). Indicators that characterise voltage fluctuations include:
- -
The amplitude of voltage fluctuations is expressed as the ratio of the voltage variation value to the rated voltage. In most cases, this value should not exceed 3 %,
- -
frequency of voltage fluctuation amplitudes or, in the case of periodic fluctuations, the frequency of voltage fluctuations;
- -
Short-term flicker index Pst (index indicating the annoyance of flickering light over a few minutes). Pst = 1 is the conventional threshold for the annoyance of light flicker;
- -
the long-term flicker index P
lt (an index indicating the annoyance of flickering light over a long period, of the order of a few hours). In most cases, the index P
lt should not exceed 1. The value of the index is determined from successive values of P
st, according to the relation:
in which P
sti (i = 1, 2, 3, ... 12) are successive values of the short-term flicker indices P
st .
-
Voltage asymmetry – unequal voltage values and/or unequal angles between successive phase voltages. The asymmetry of the system of supply voltages results, among other things, in the appearance of symmetrical components of the opposite order. The parameter describing this condition is the voltage asymmetry factor α
U% (opposite voltage asymmetry) [
37,
40]:
where: U
1 , U
2 - the composite values of the symmetrical components of the consensual and opposite order of the voltage
In most cases, the voltage asymmetry factor should not exceed 2 %.
The distortion of the voltage waveform, defined by the total harmonic distortion factor (THD) [
41]:
where: U
1 - rms value of voltage for the first harmonic, U
h - rms value of voltage for the h-th harmonic, h - order of harmonic.
In most cases, the voltage distortion coefficient THDU in low-voltage networks must not exceed 8 %.
At the agricultural biogas plant under study, electricity was the primary end product, and its production was maintained at the highest possible level. The tests were carried out using a SONEL PQM-701 portable power quality para-meter analyser, performing measurements in accordance with Class A of the EN 61000-4-30 standard [
42].
3. Results
3.1. Analysis of the Supply Network Parameters of the Agricultural Biogas Plant under Study
The recorded values of the grid frequencies are shown in
Figure 1.
Although frequent changes in frequency values were recorded, the maximum deviation from the rated value was slight and did not exceed 0.18%. However, it is worth noting that there is a particular recurring regularity. The lowest recorded frequency values were in the afternoon (during maximum load in the electricity network) and then increased as the load decreased.
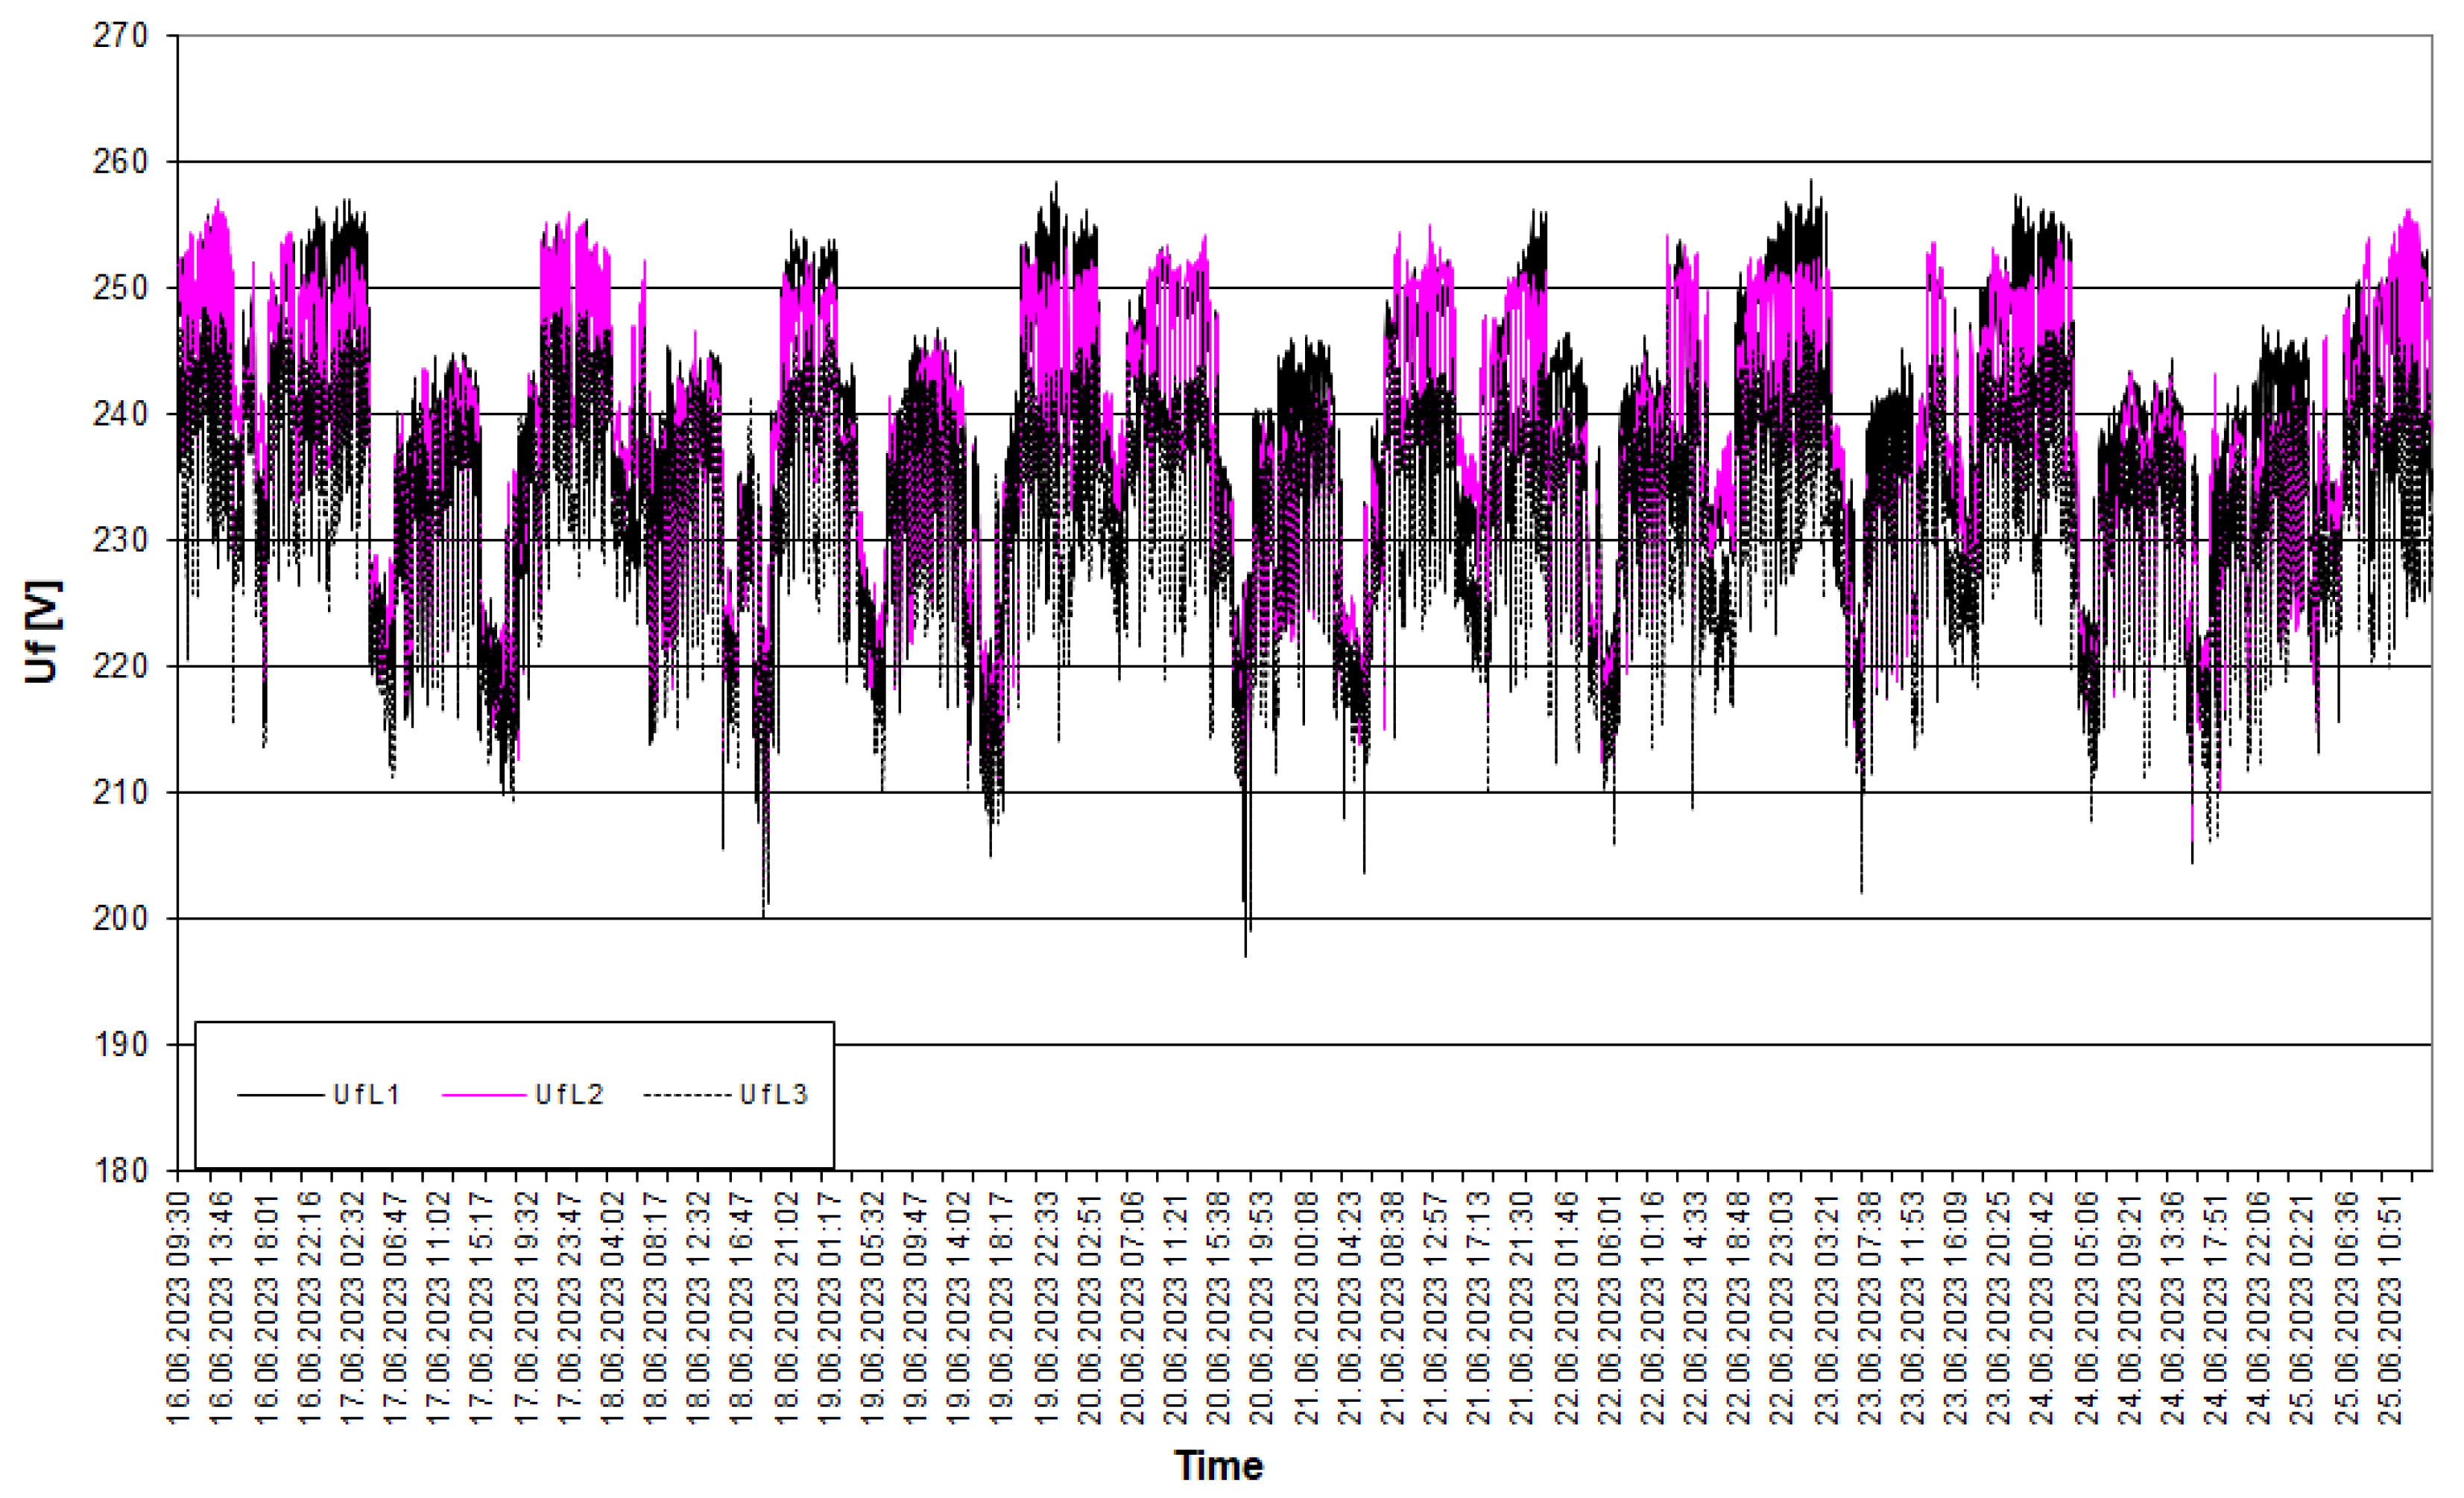
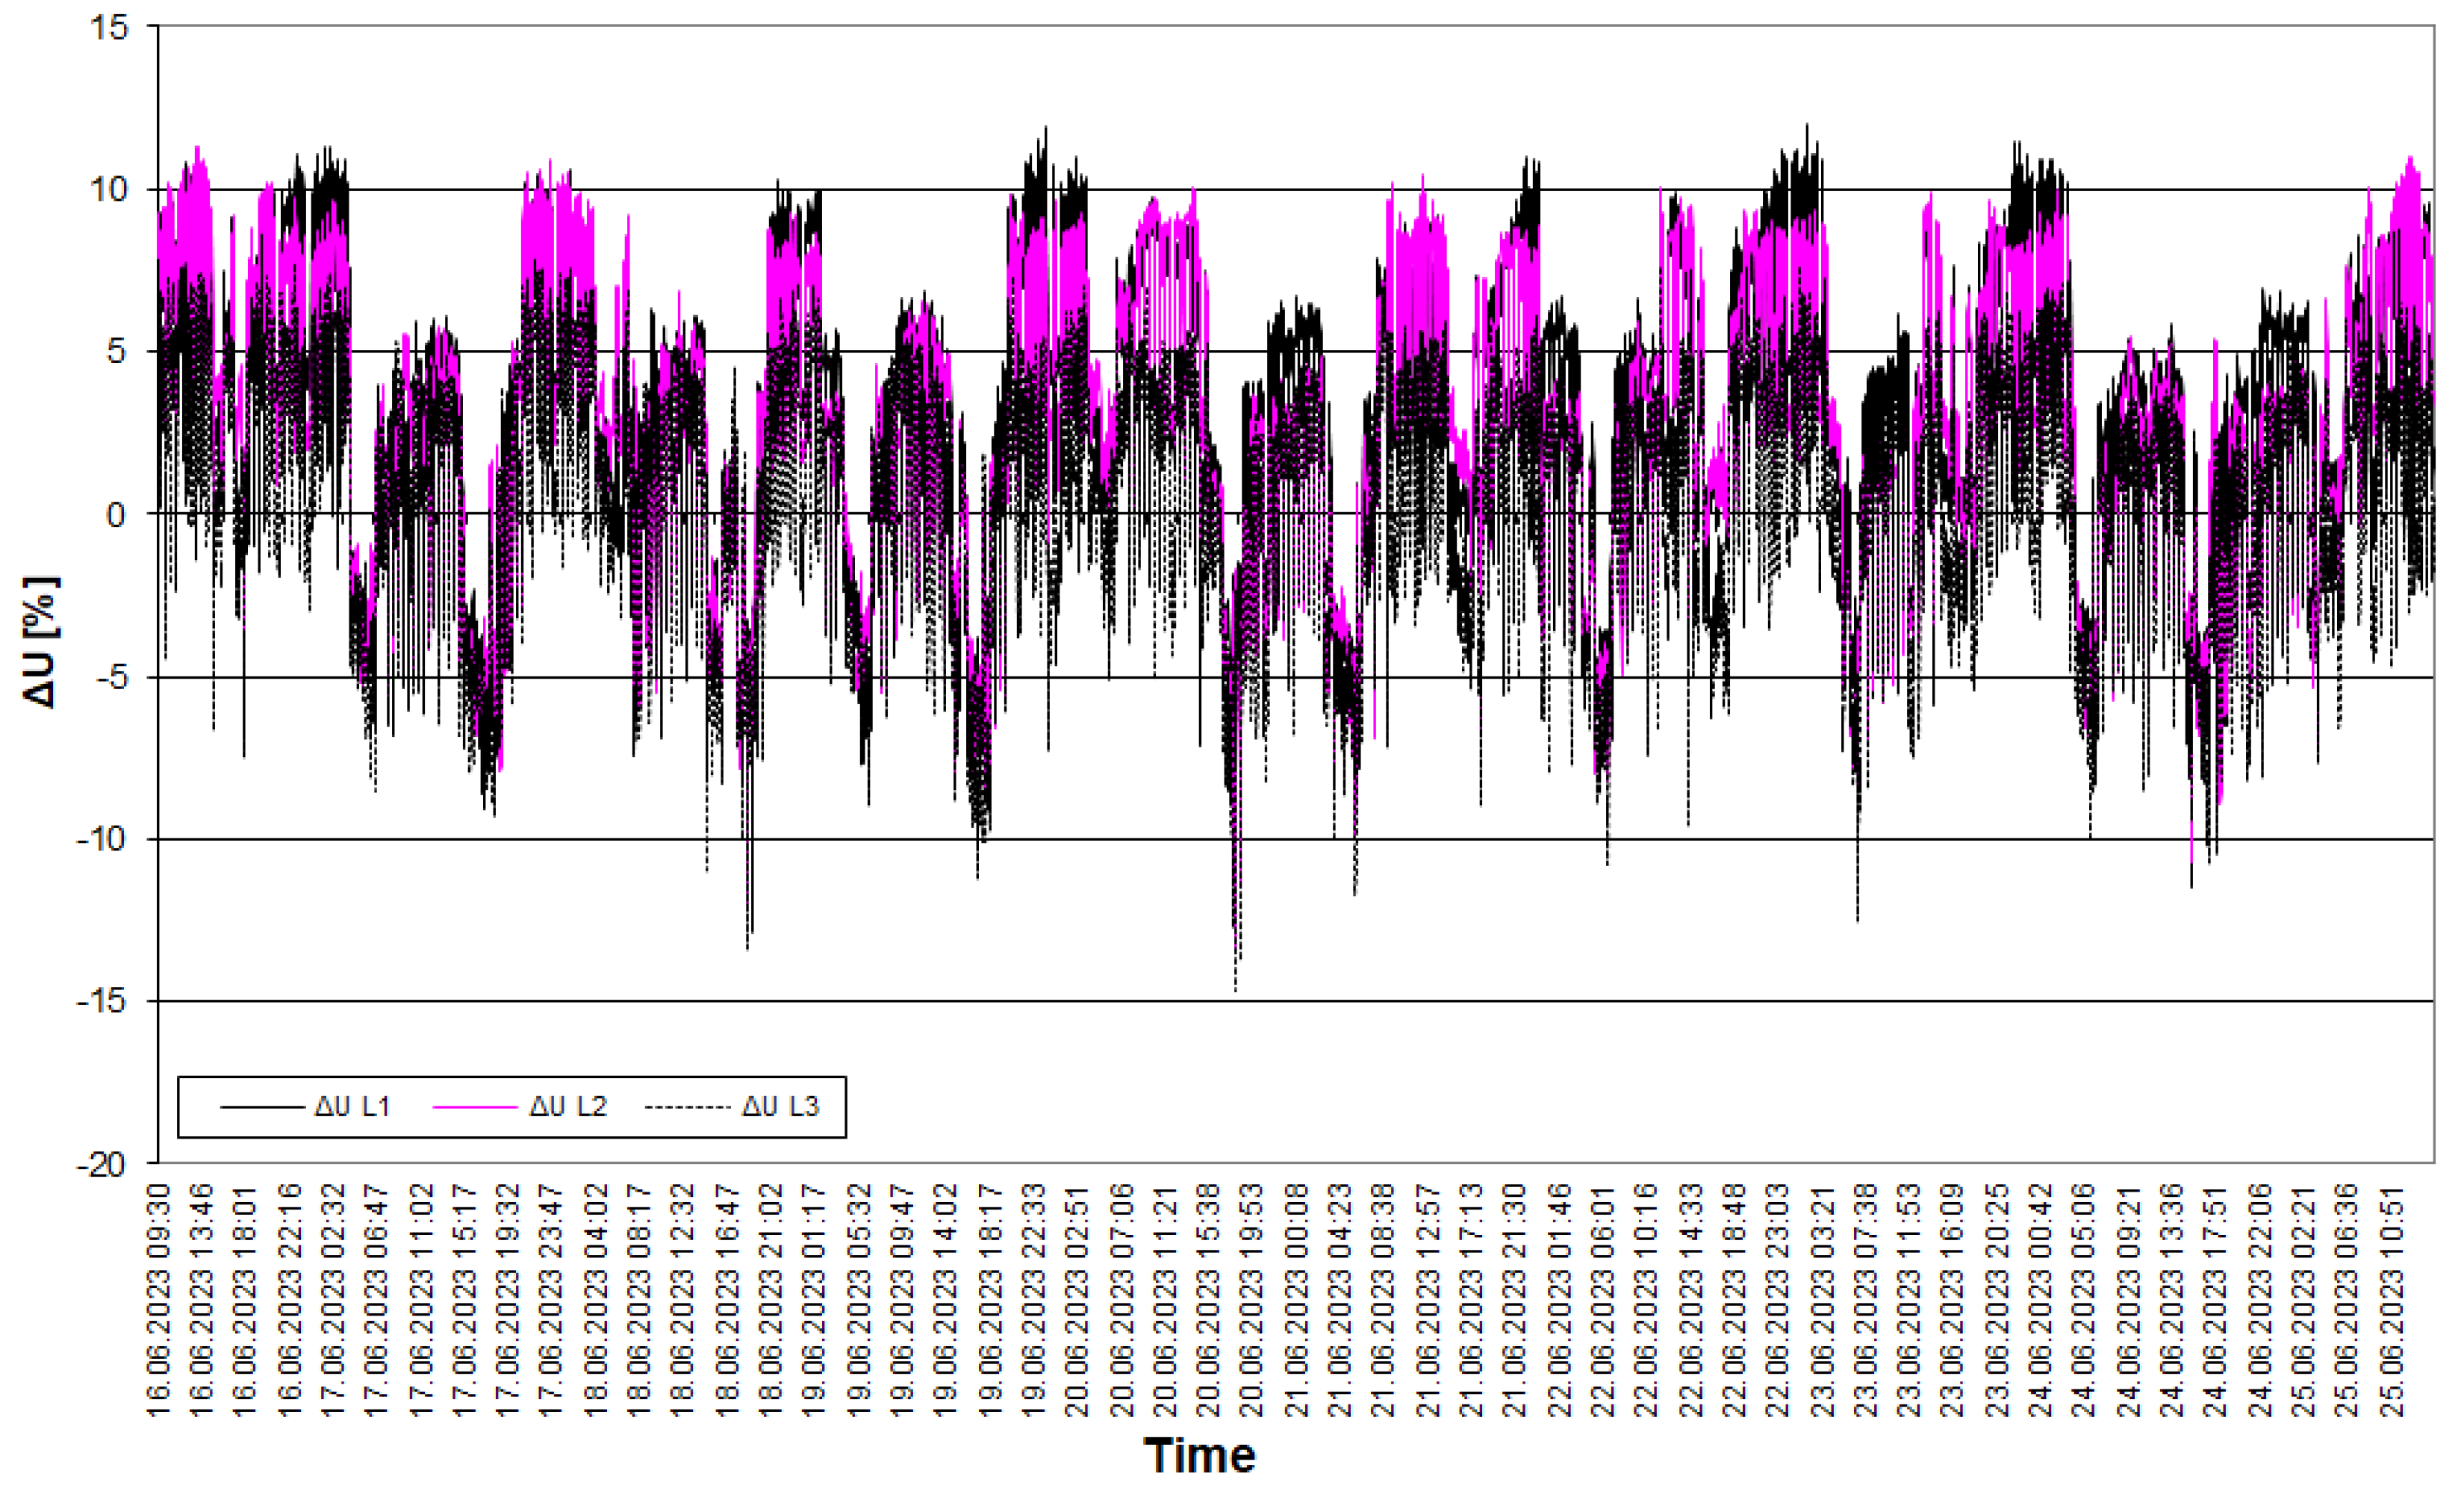
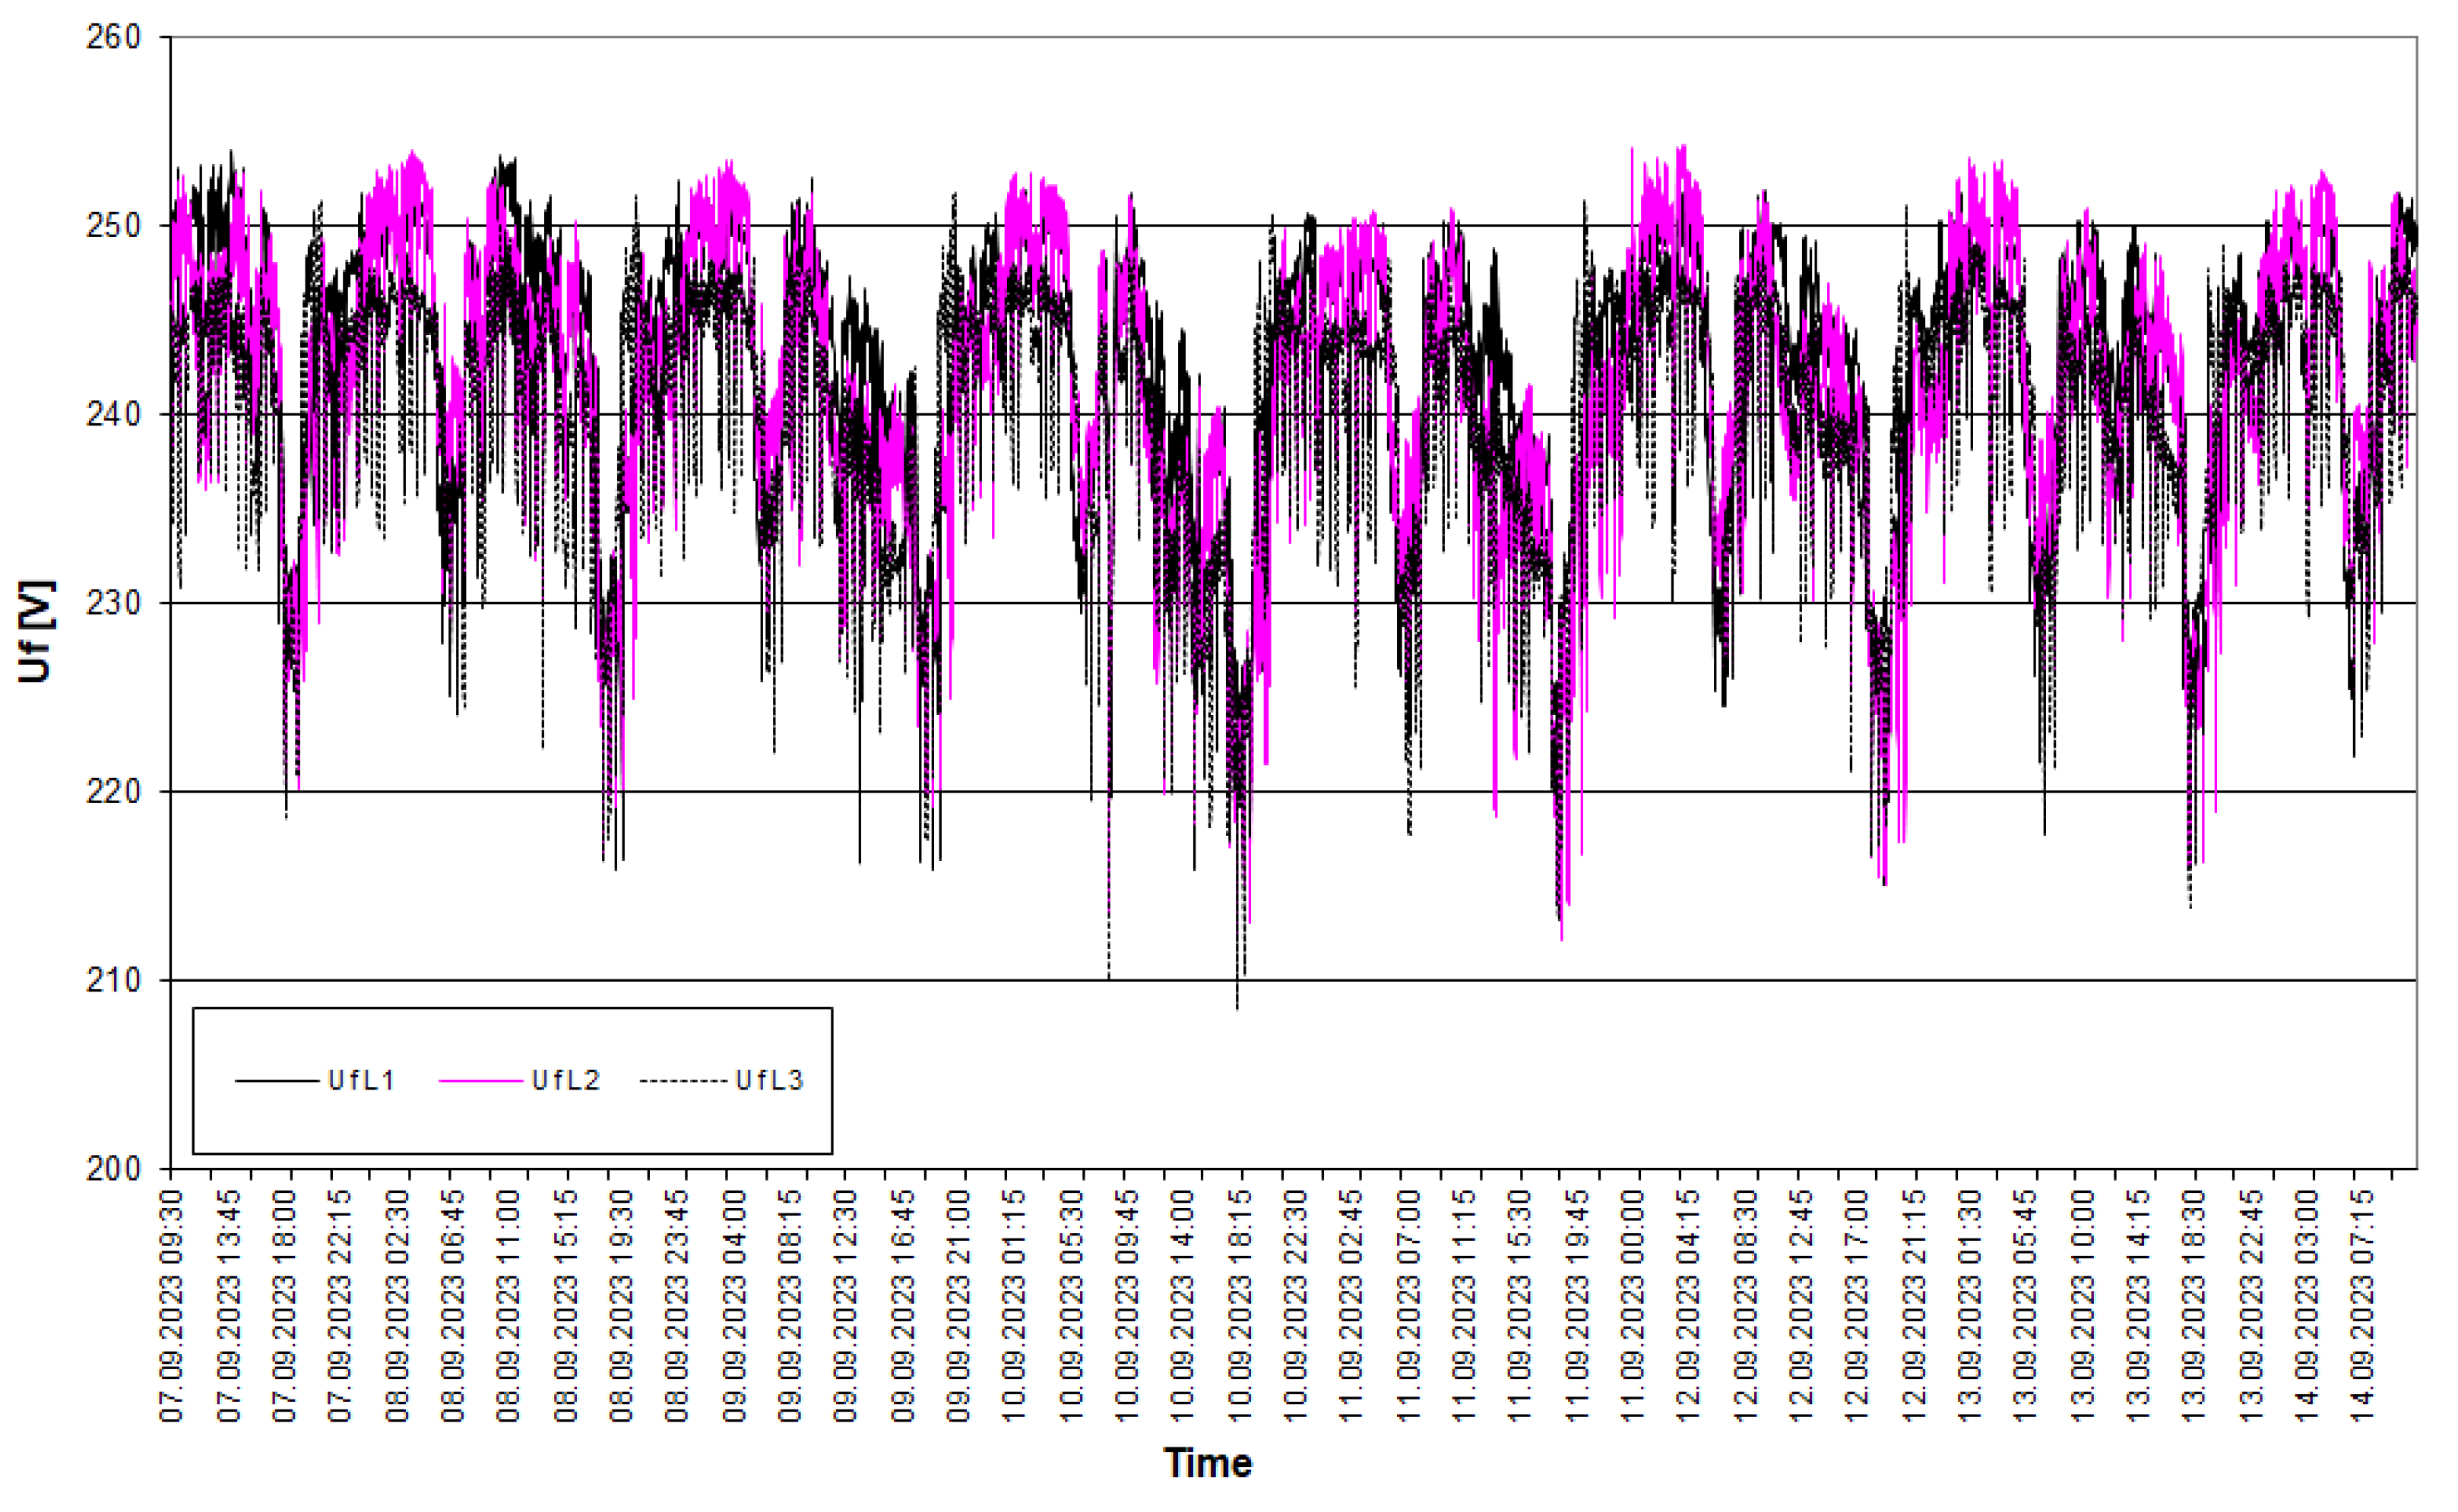
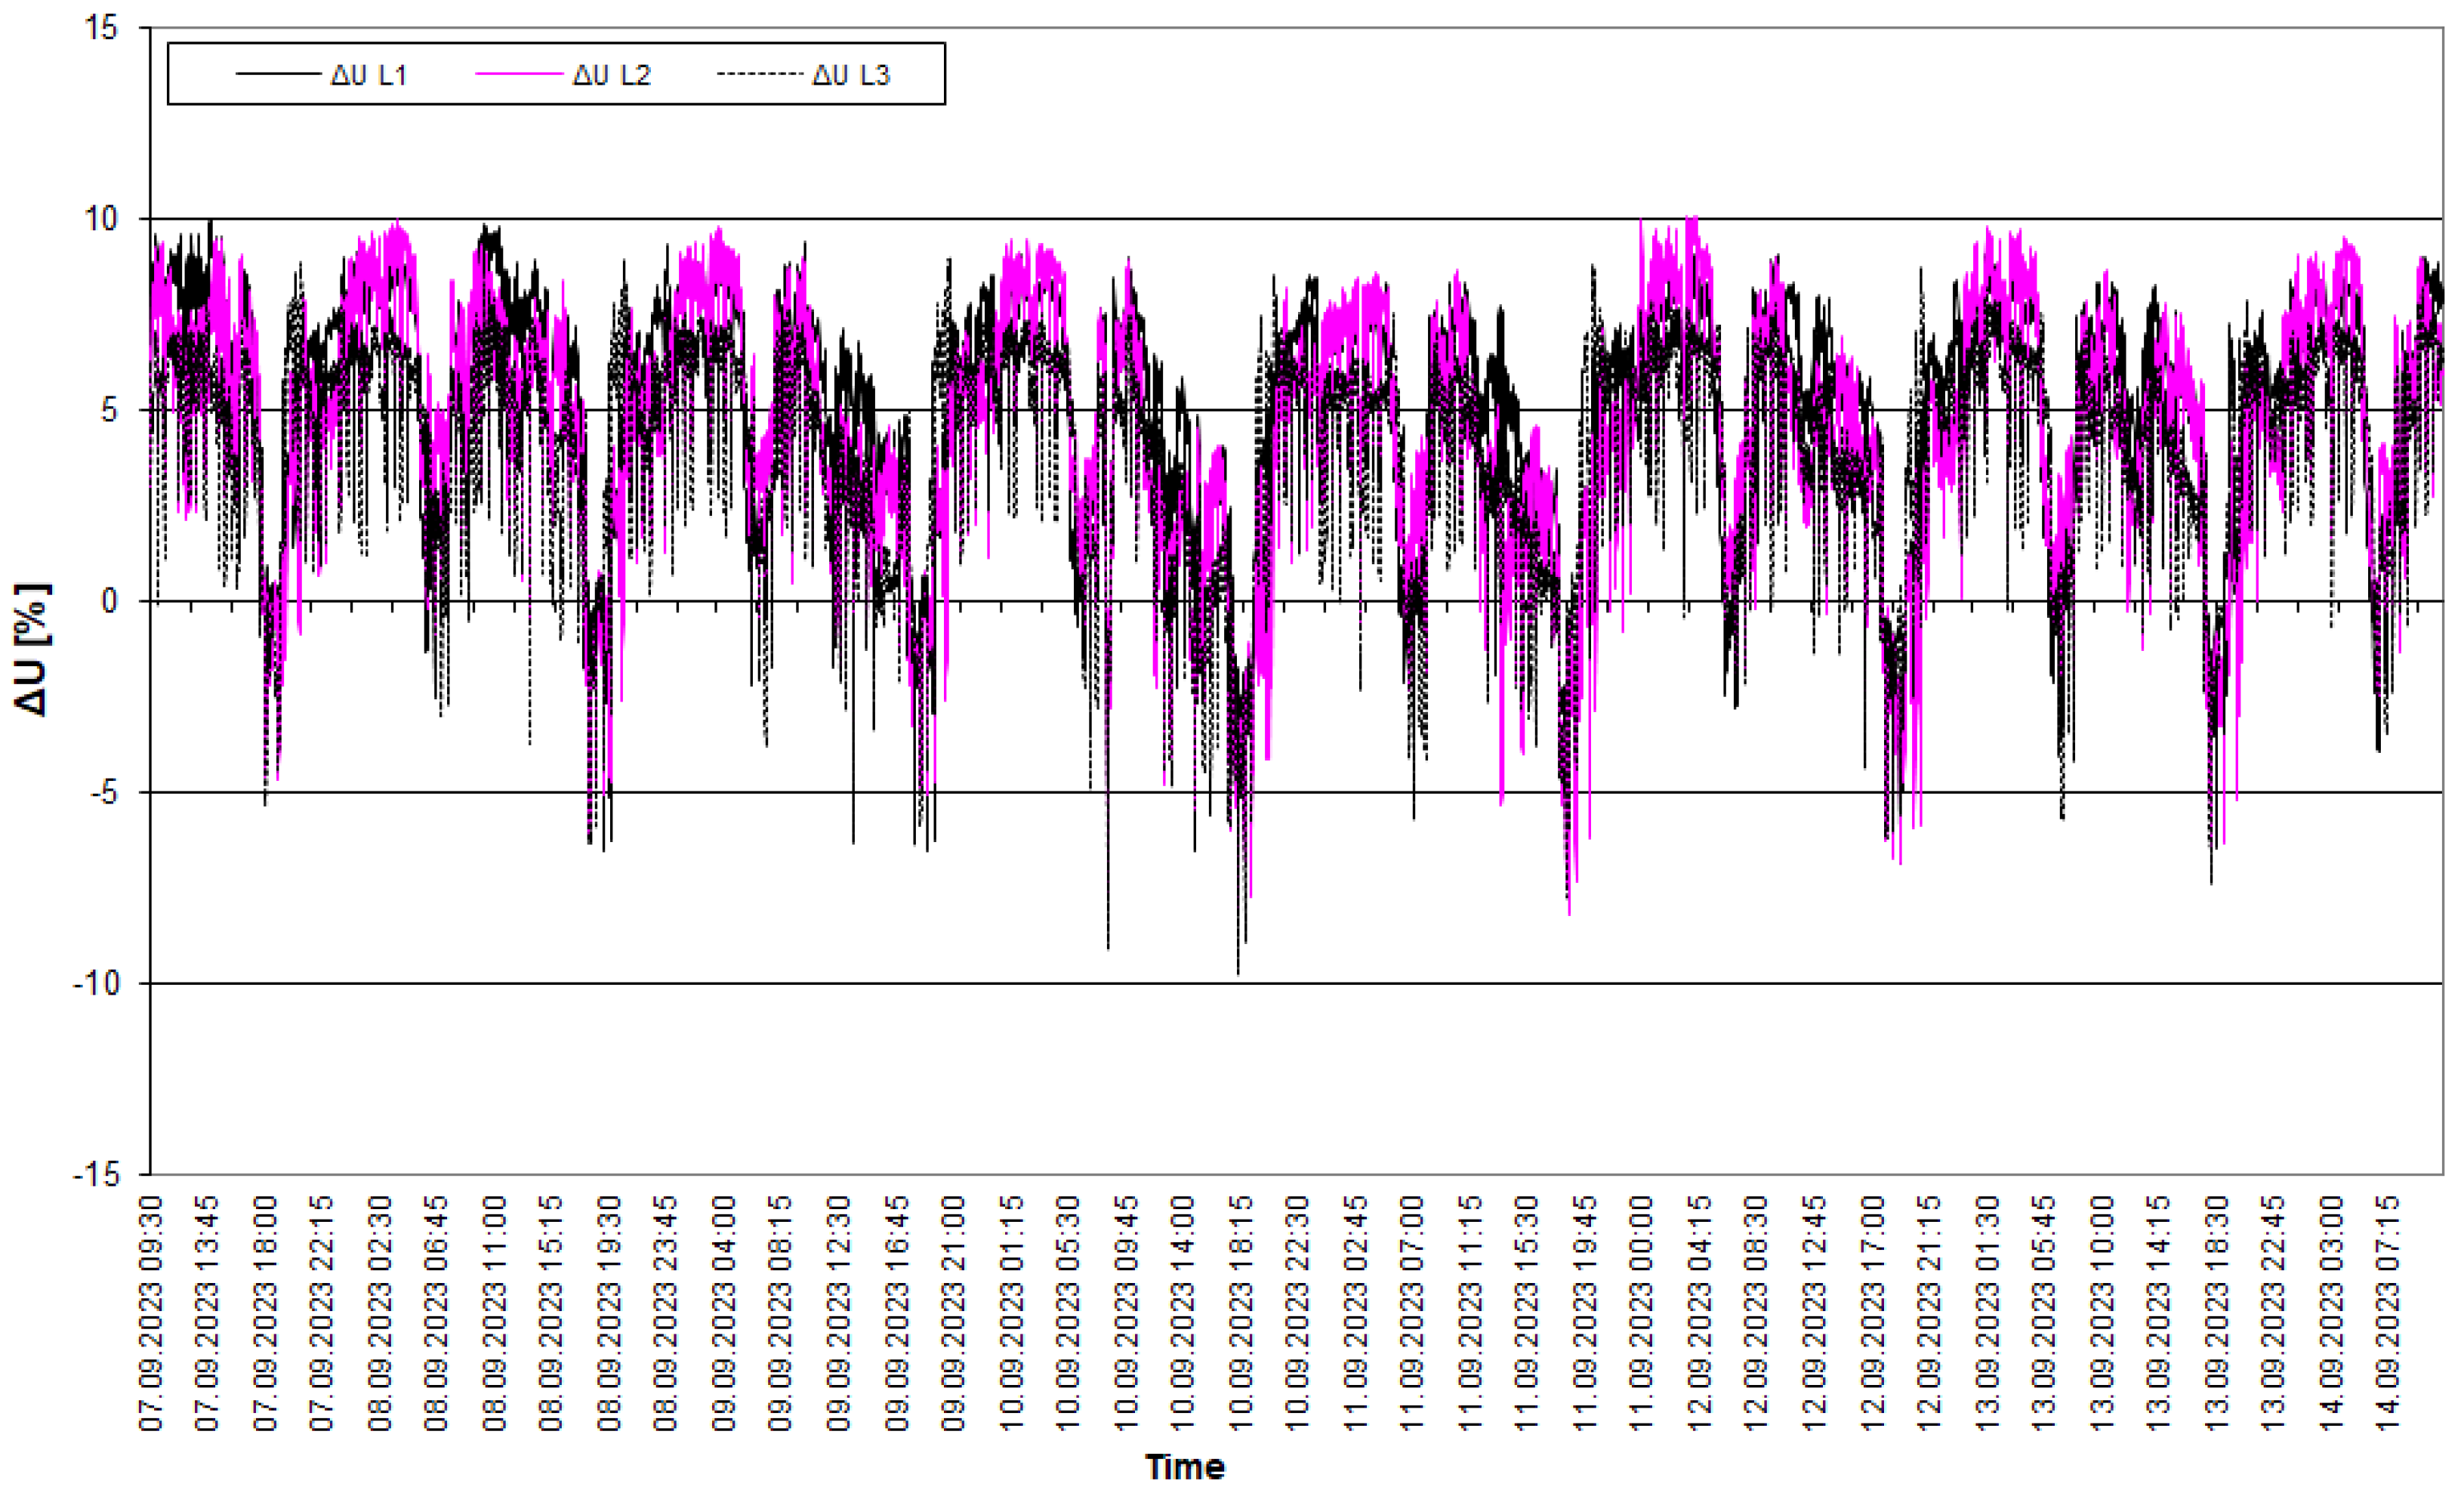
The waveforms of the variation of voltage levels and the percentage deviation of the voltage from the rated voltage recorded during the tests are shown in
Figure 2 and
Figure 3.
When analysing the recorded voltage waveforms, as in the case of frequency, a cyclic pattern of changes can be observed. The voltage changes according to the change in load occurring in the energy system (it decreases as the load increases). Increases in voltage deviation values accompany voltage decreases. The voltage value varies from around 200 V to nearly 260 V. Such large changes can cause interference with electronic equipment.
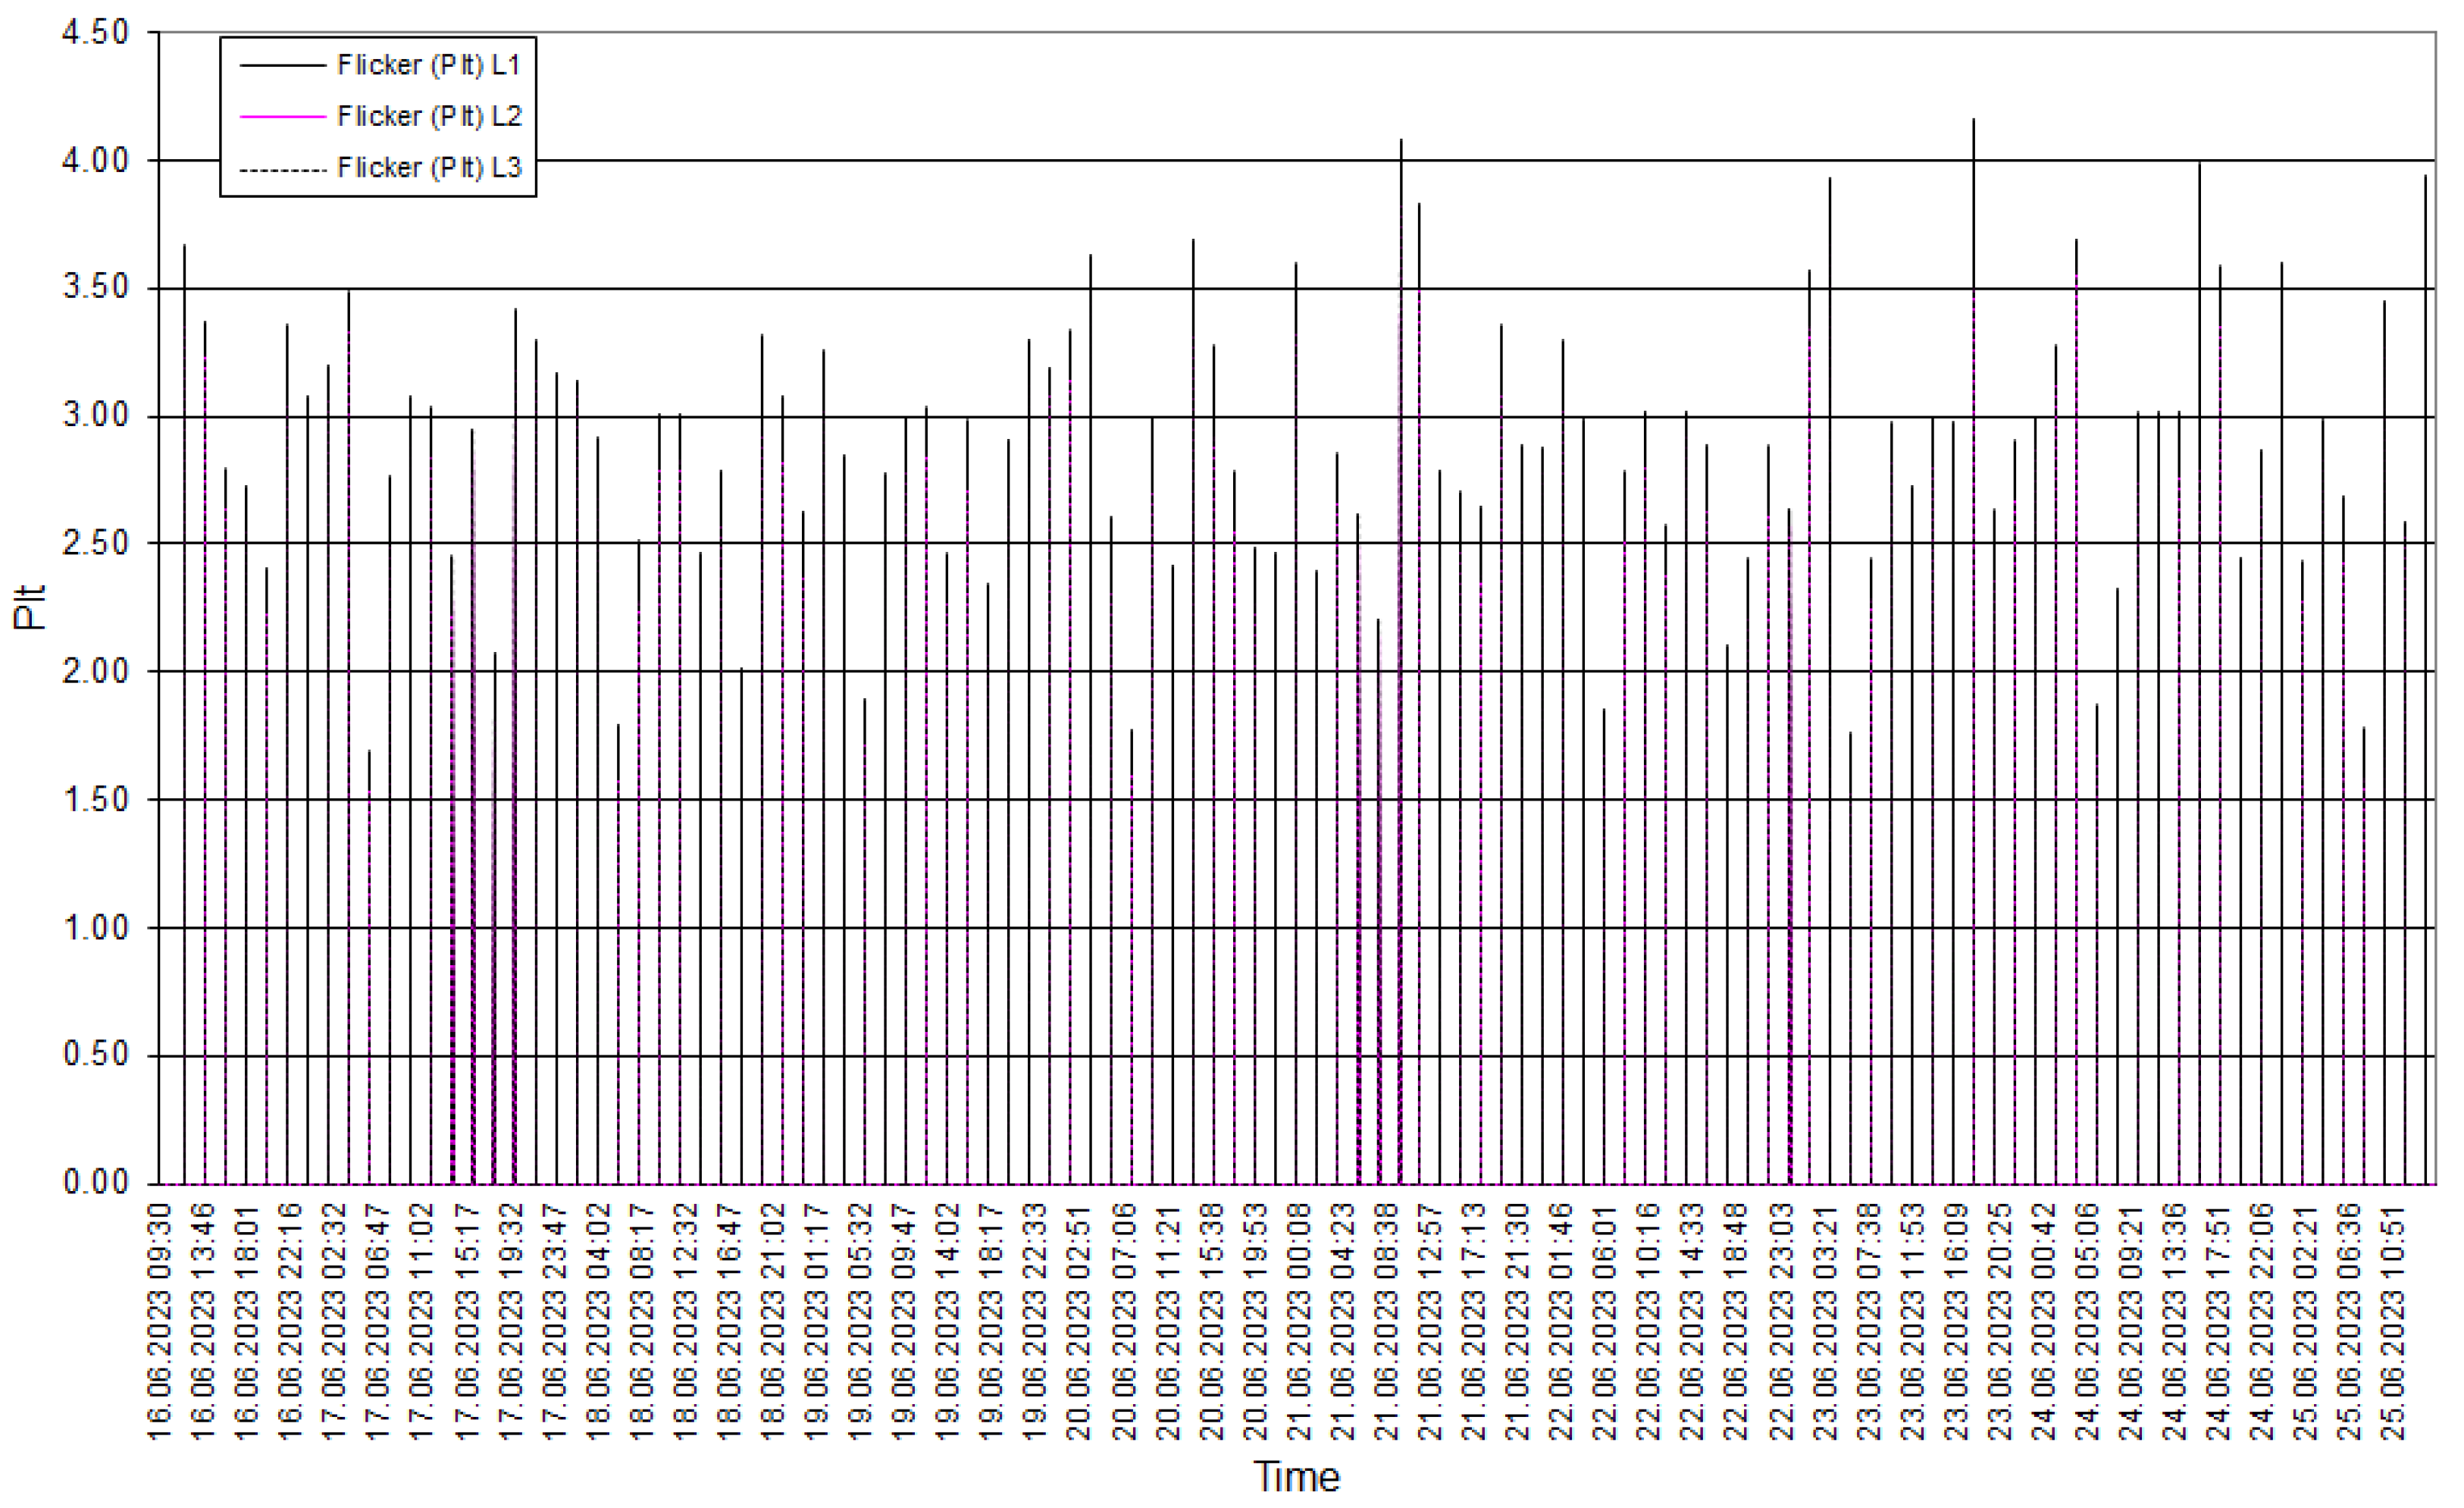
The recorded values of the long-term flicker annoyance factor (Plt) are included in
Figure 4.
The values of the long-term flicker annoyance index also vary cyclically. The lowest Plt index occurs at night and the highest in the afternoon. It is usually related to the presence of so-called unstable loads (loads that consume electricity that are significant in value and variable in time) in the power system.
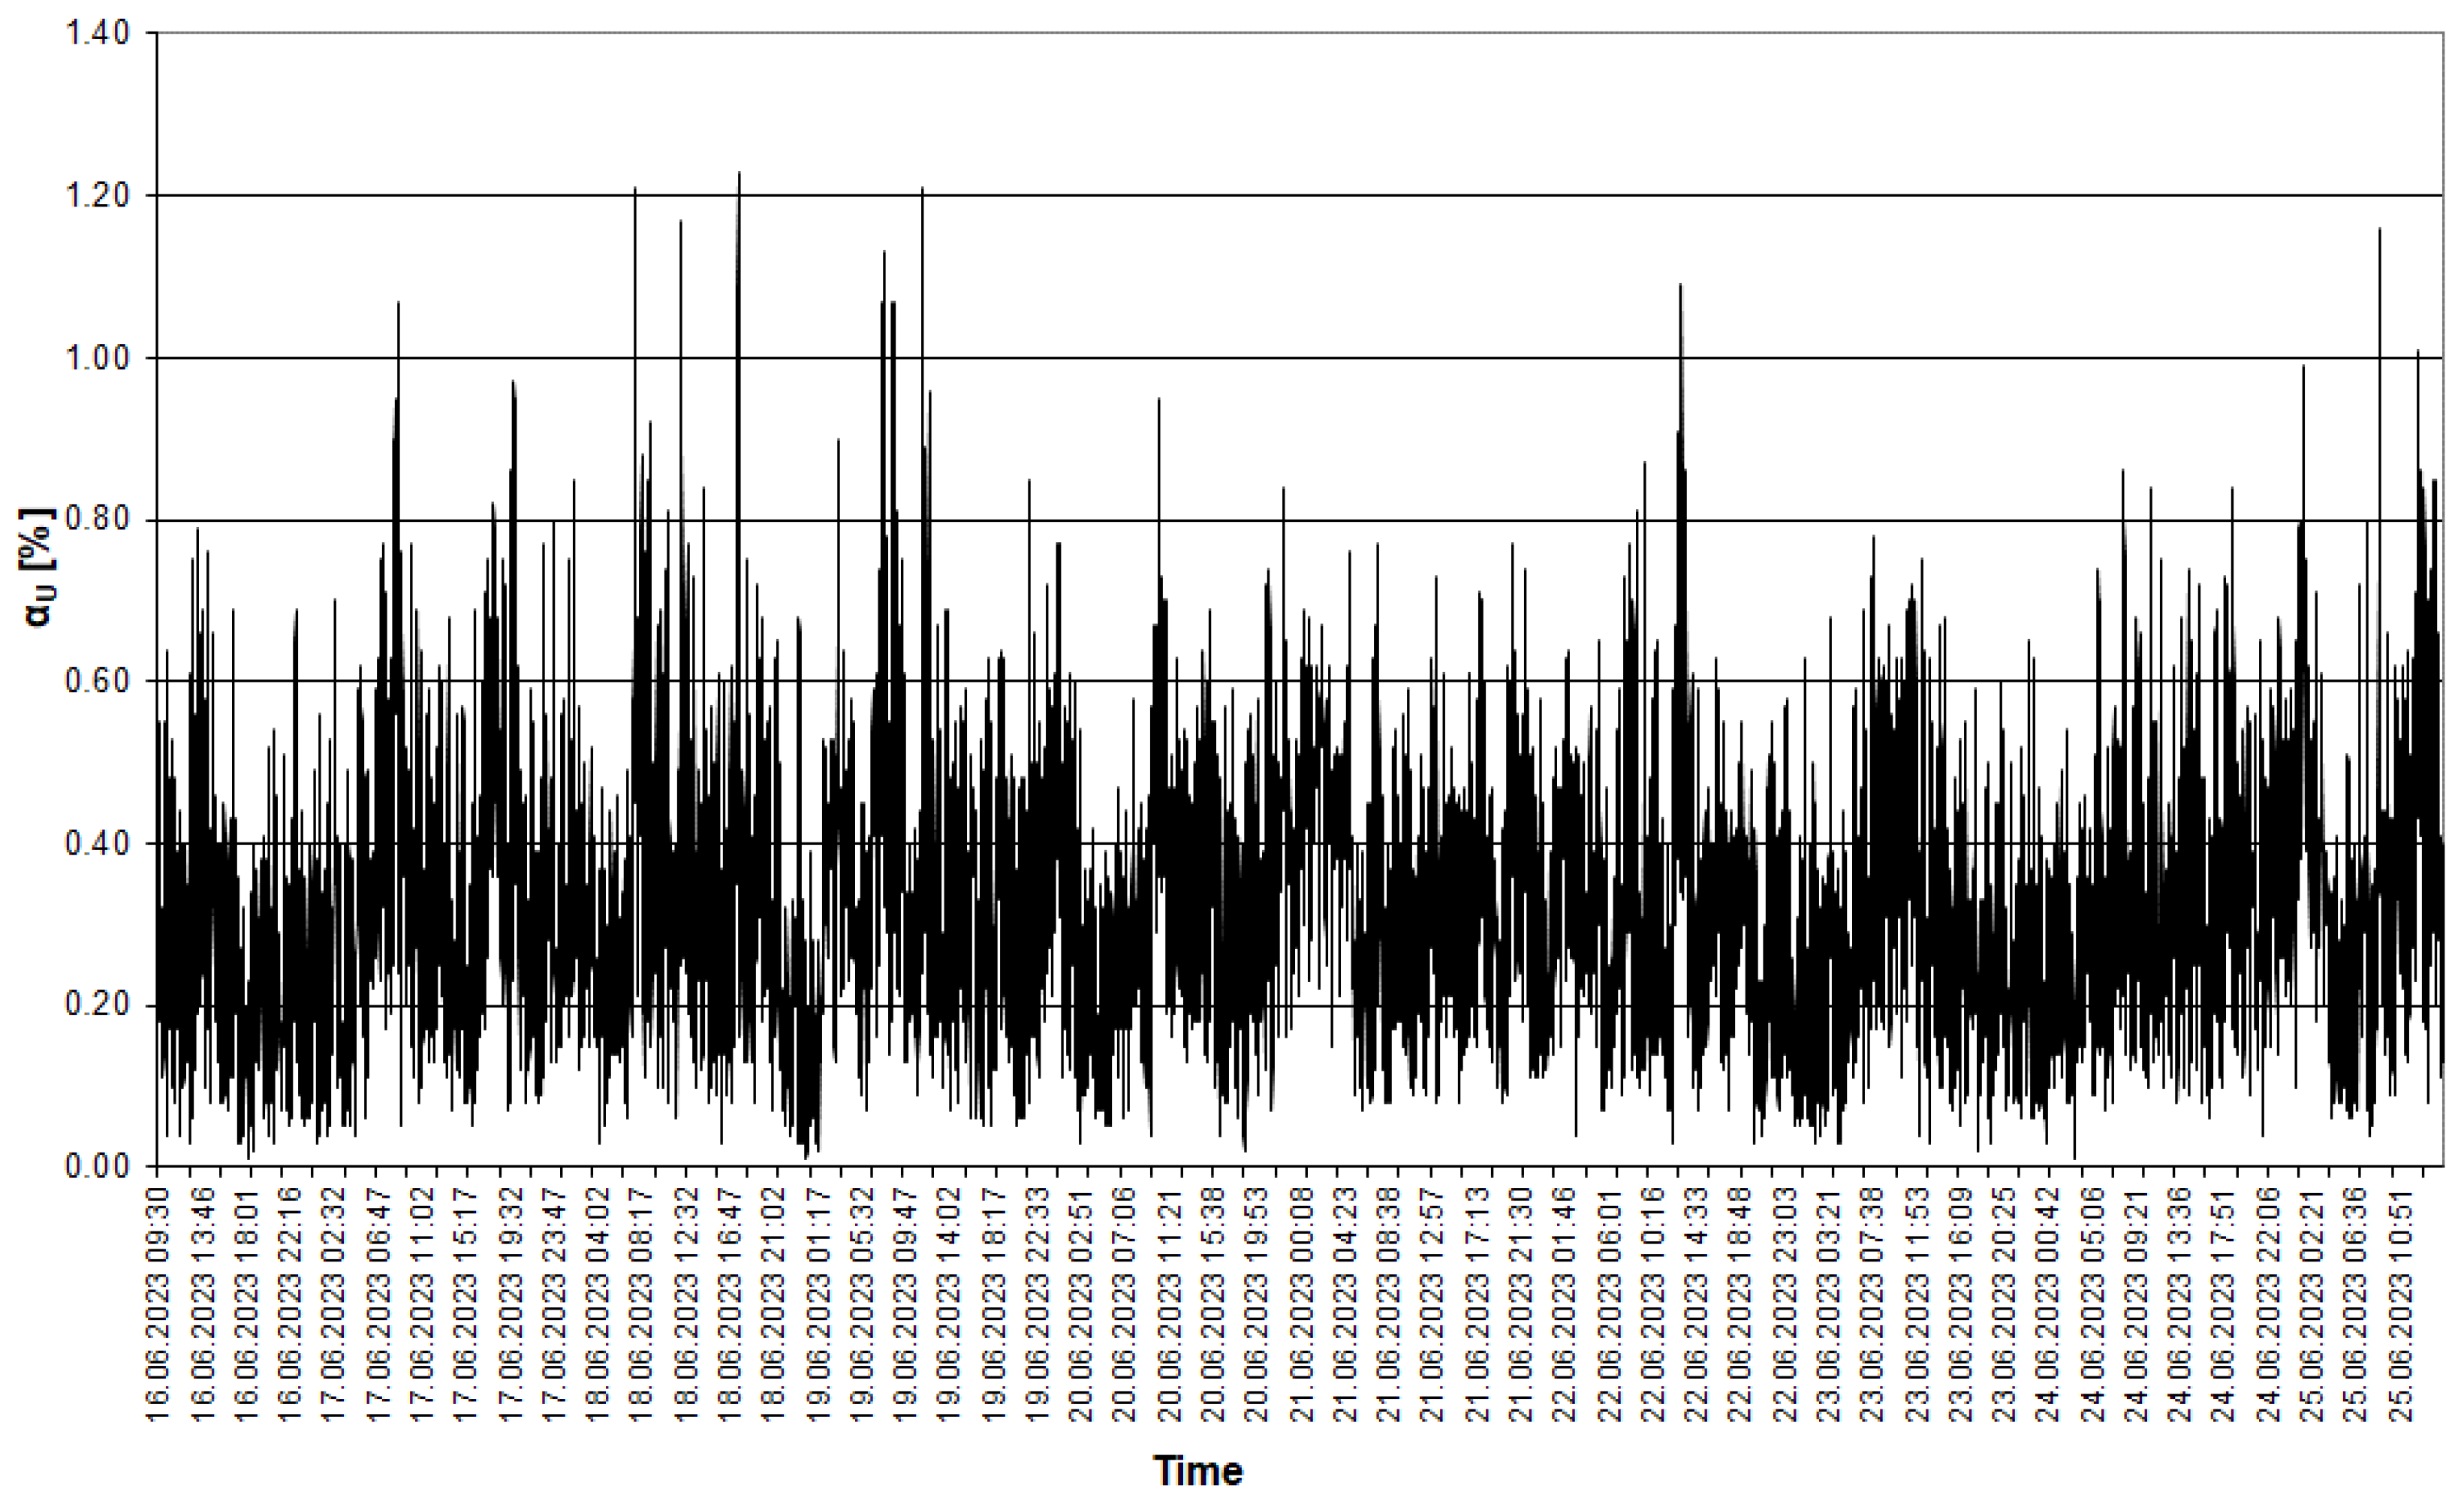
Figure 5.
Variation of the voltage asymmetry factor (αU ) recorded at the connection point of the agricultural biogas plant.
Figure 5.
Variation of the voltage asymmetry factor (αU ) recorded at the connection point of the agricultural biogas plant.
The voltage asymmetry factor also varies cyclically. The recorded waveform usually reaches a maximum in the afternoon, while the minimum occurs at night.
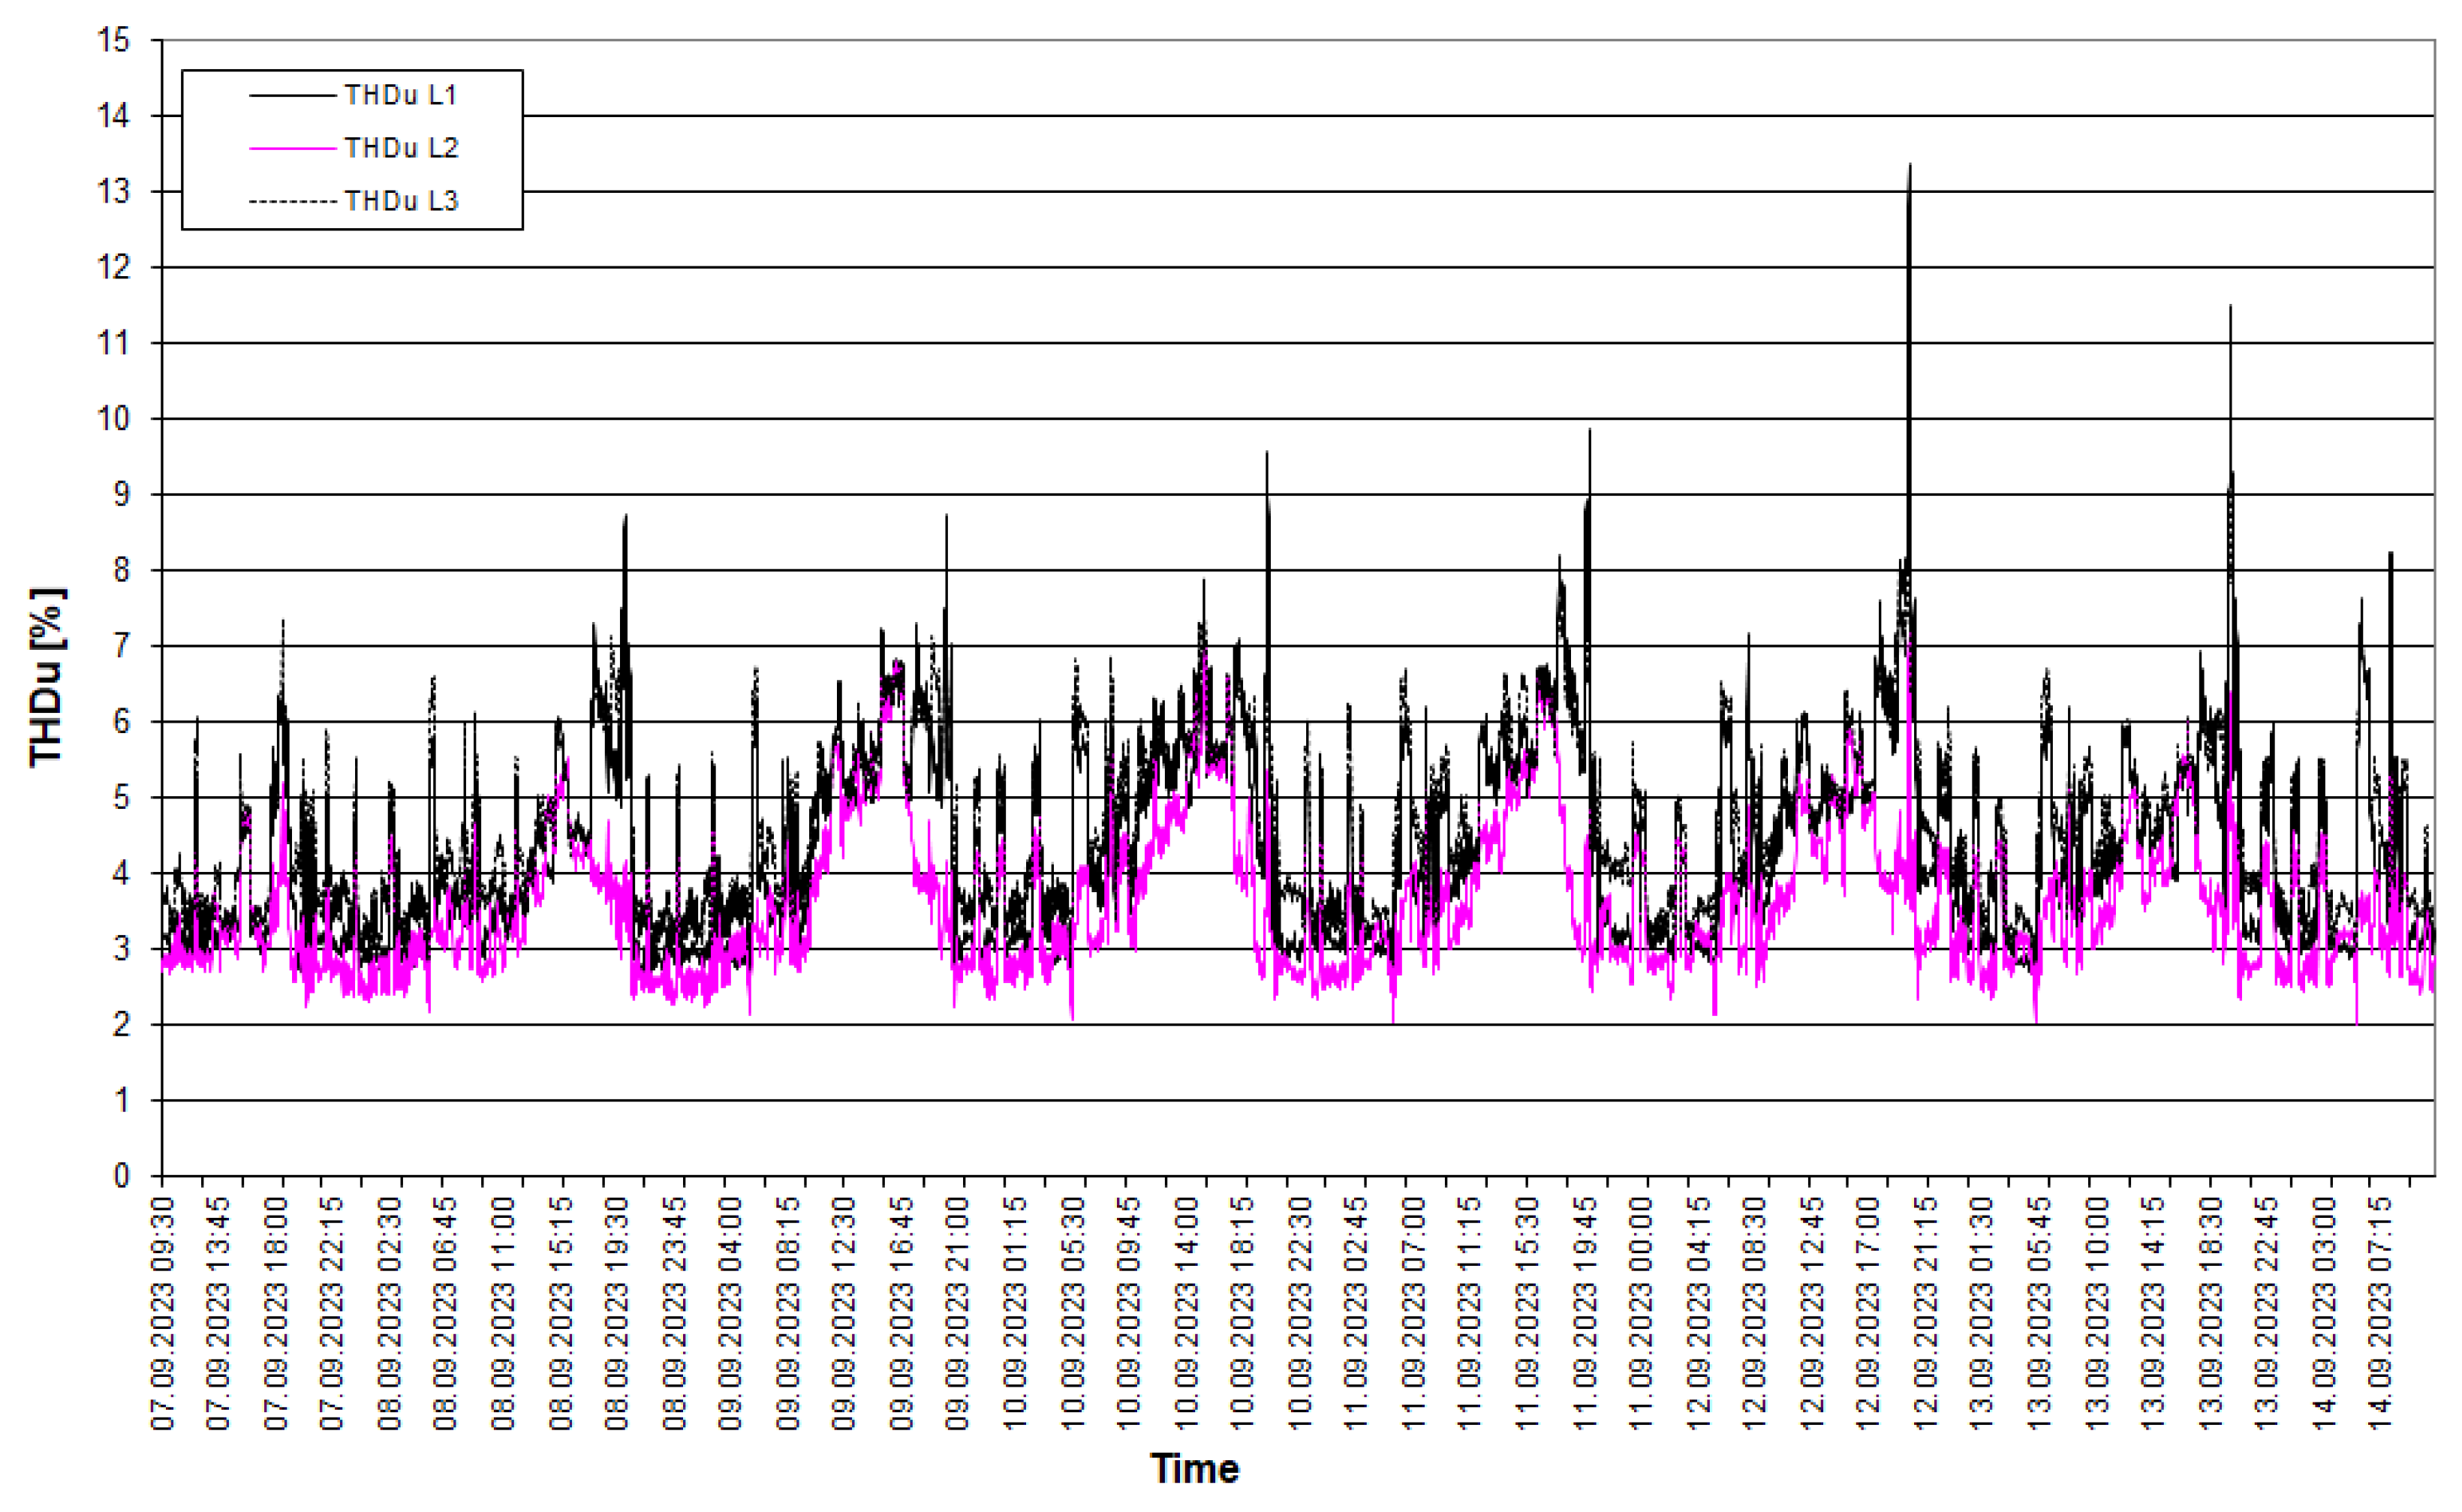
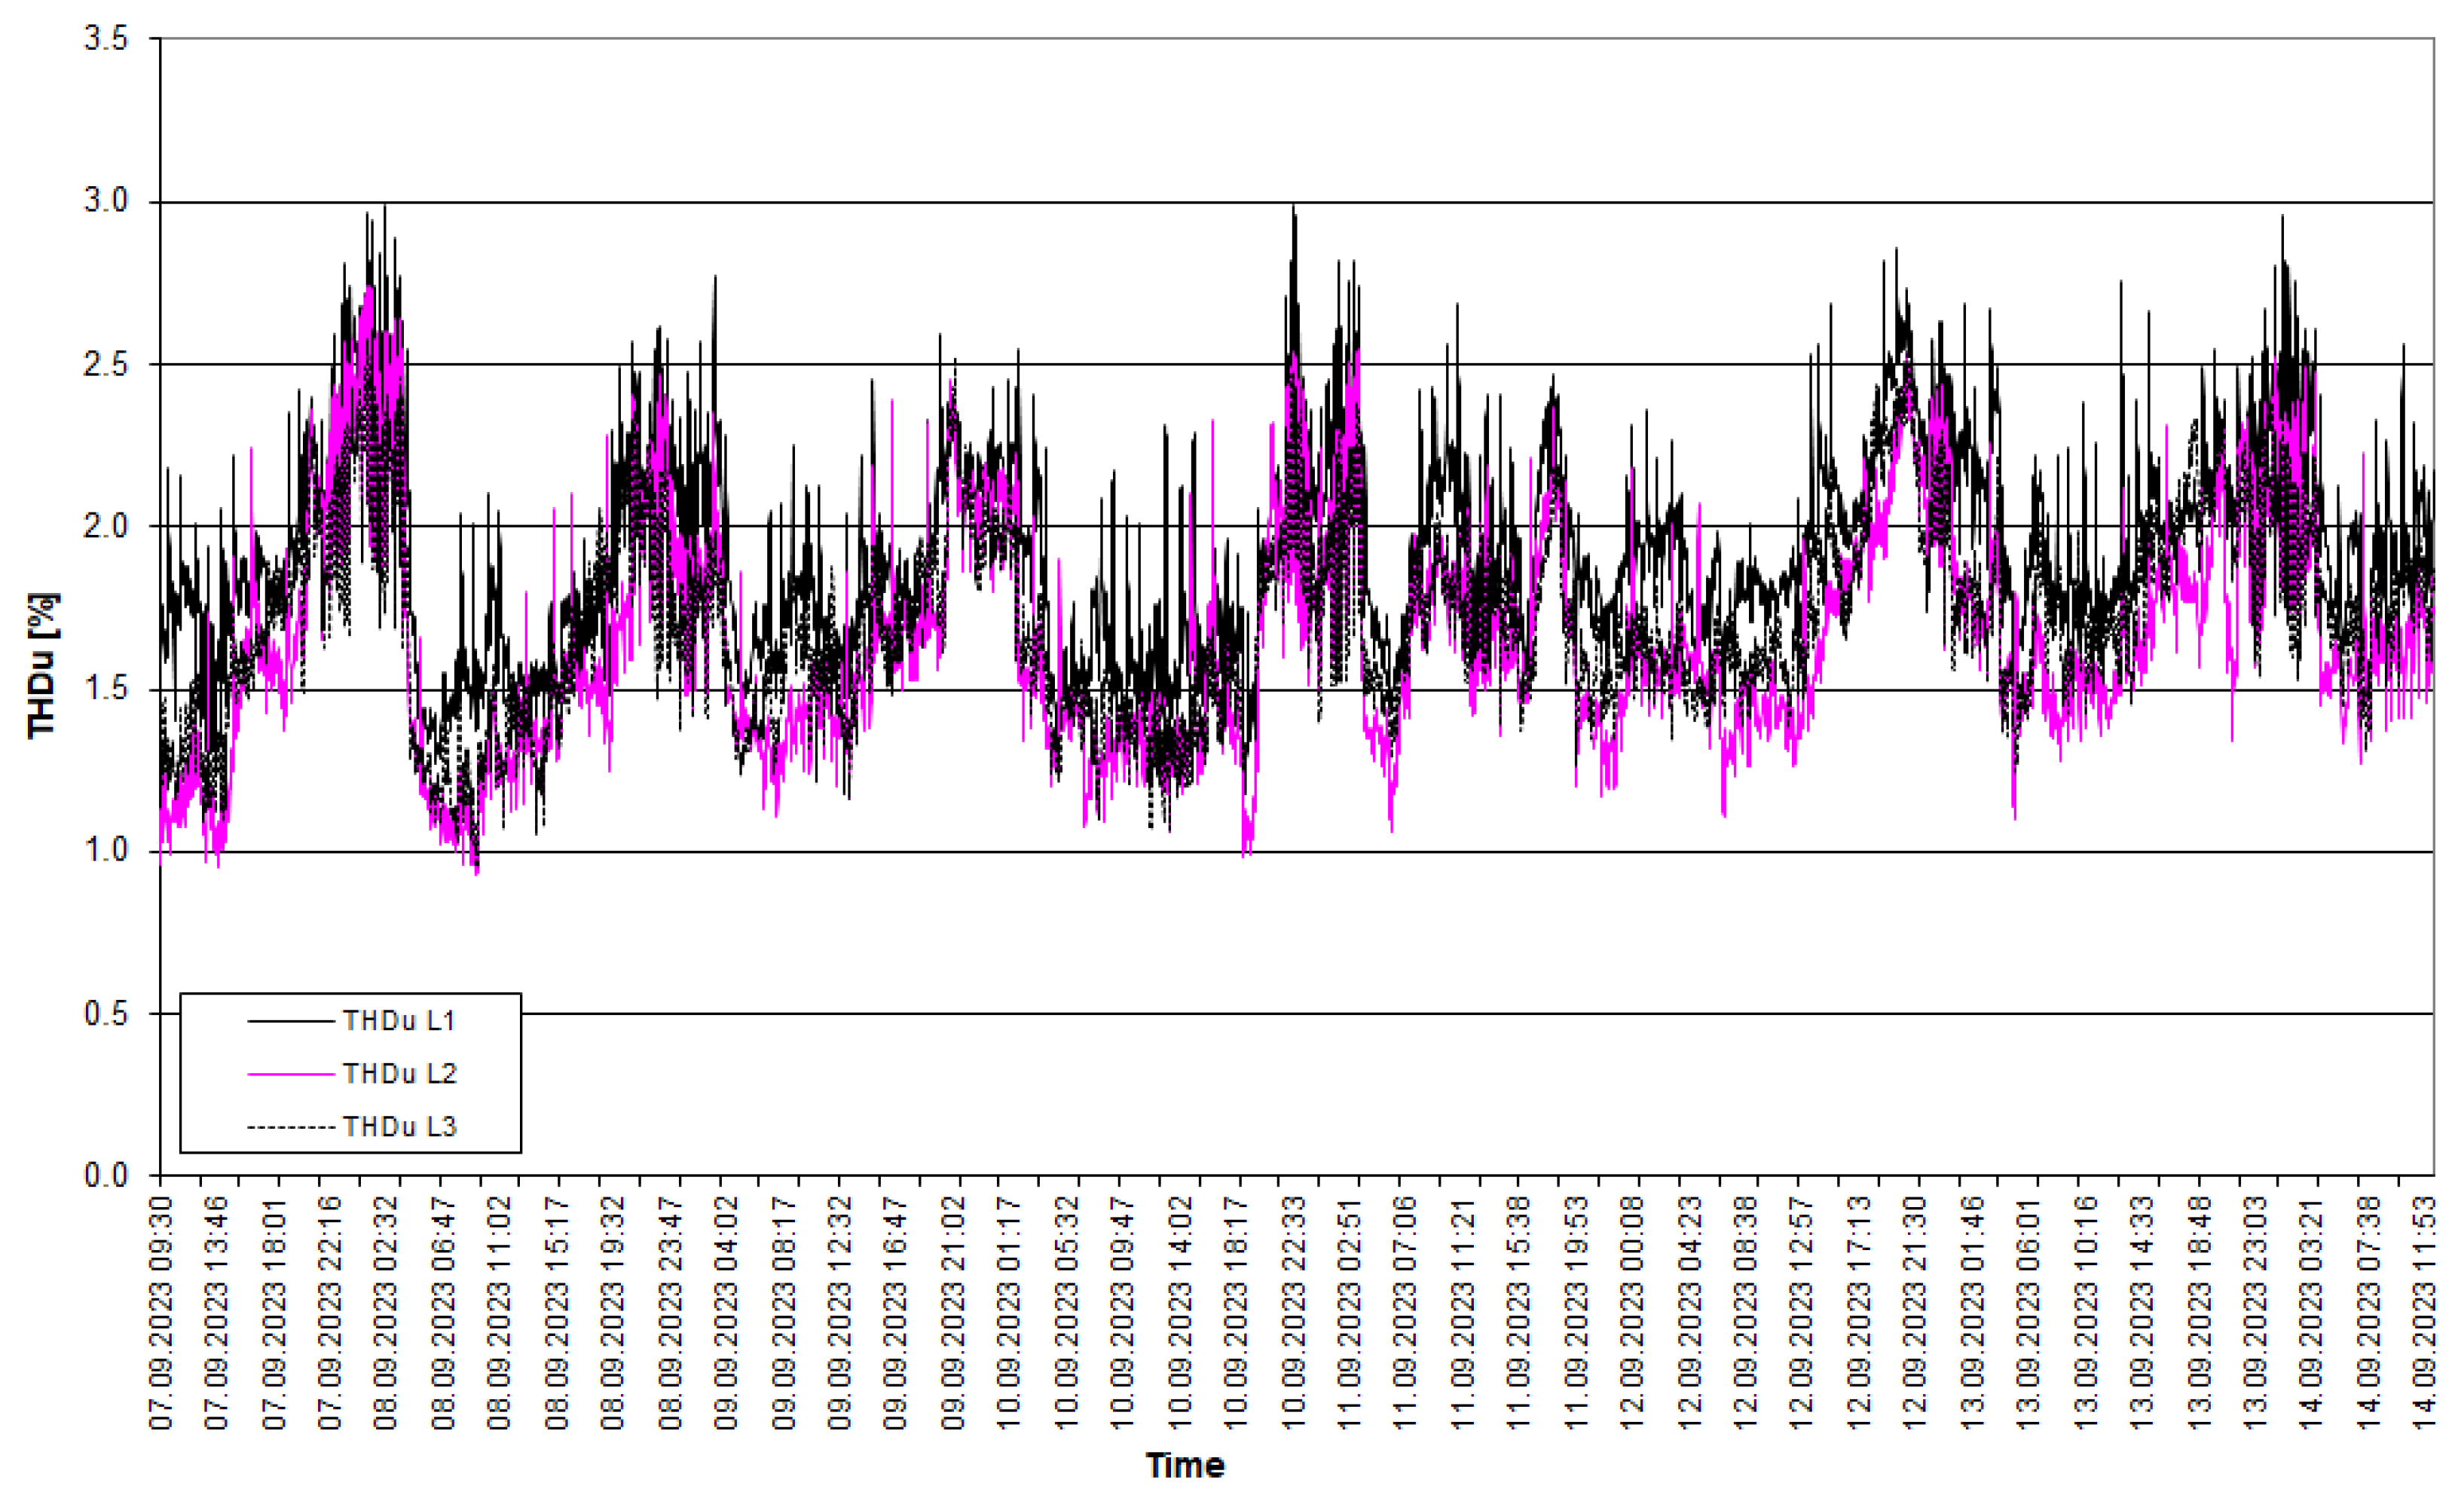
The recorded THDU values for each phase are shown in
Figure 6.
The values of the total voltage distortion coefficient recorded at the biogas plant also vary in the diurnal system, which is mainly due to the cyclic operation of equipment drawing current distorted from the sinusoidal waveform from the grid. The highest values were recorded mainly in the afternoon.
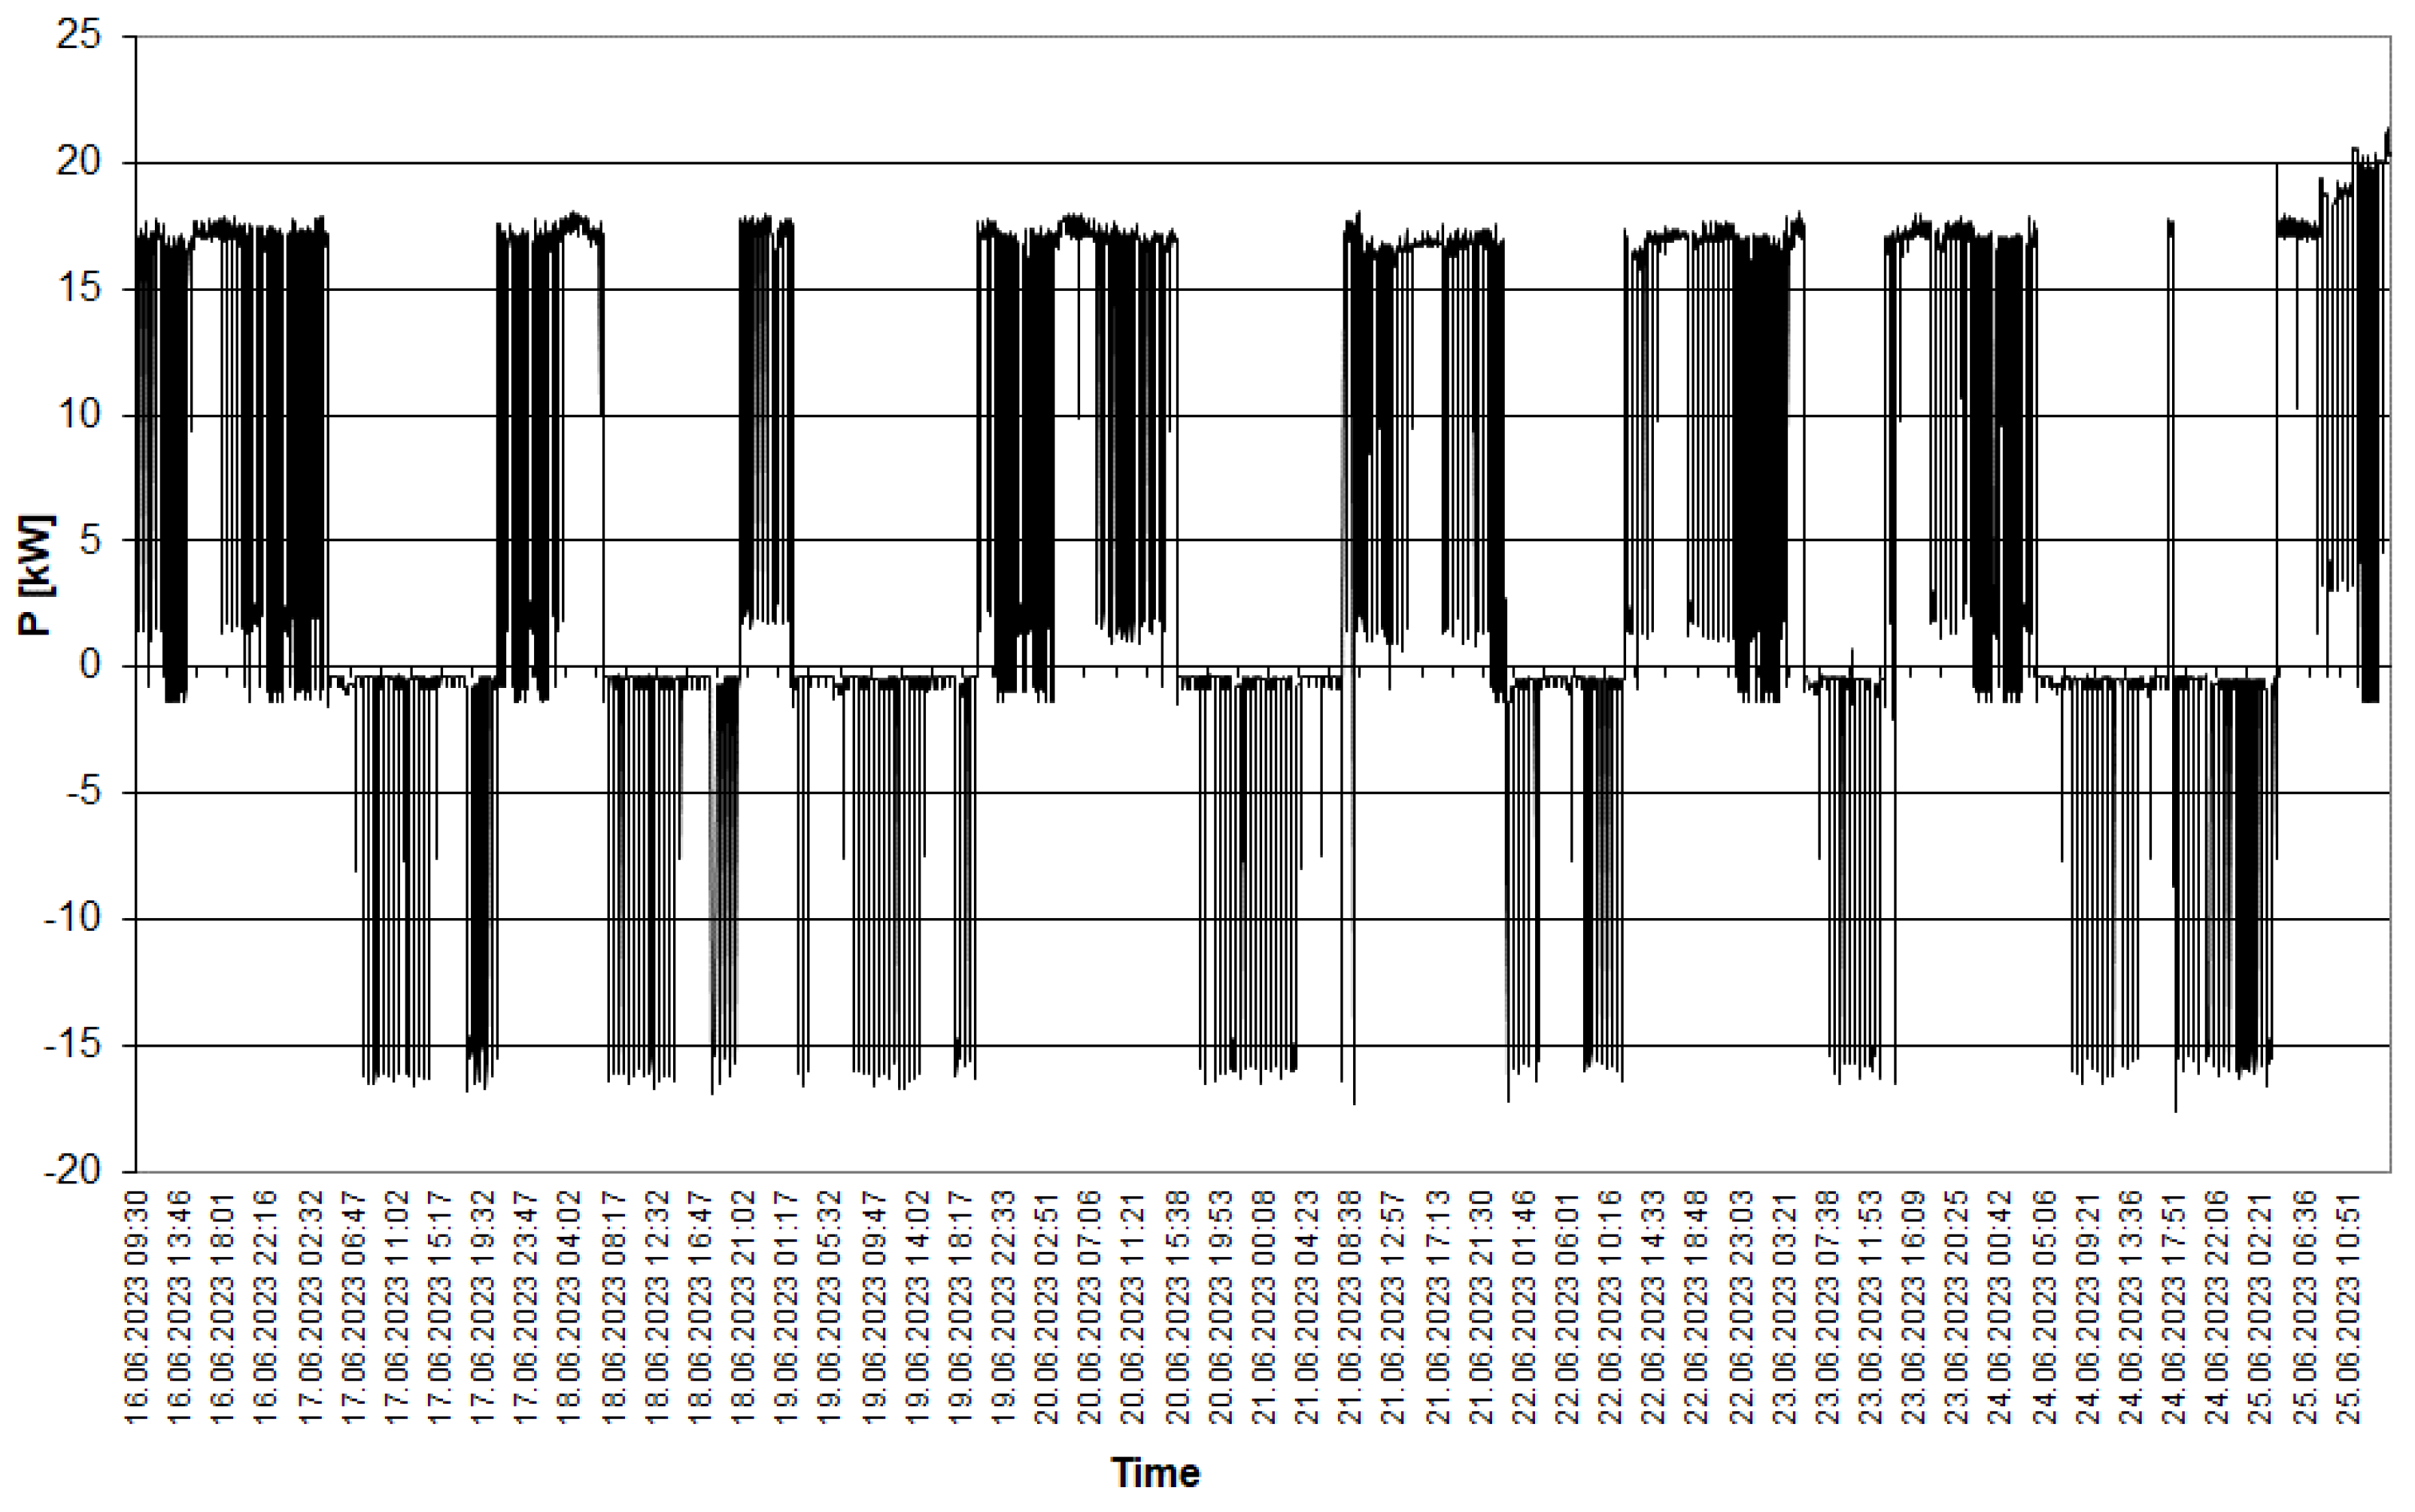
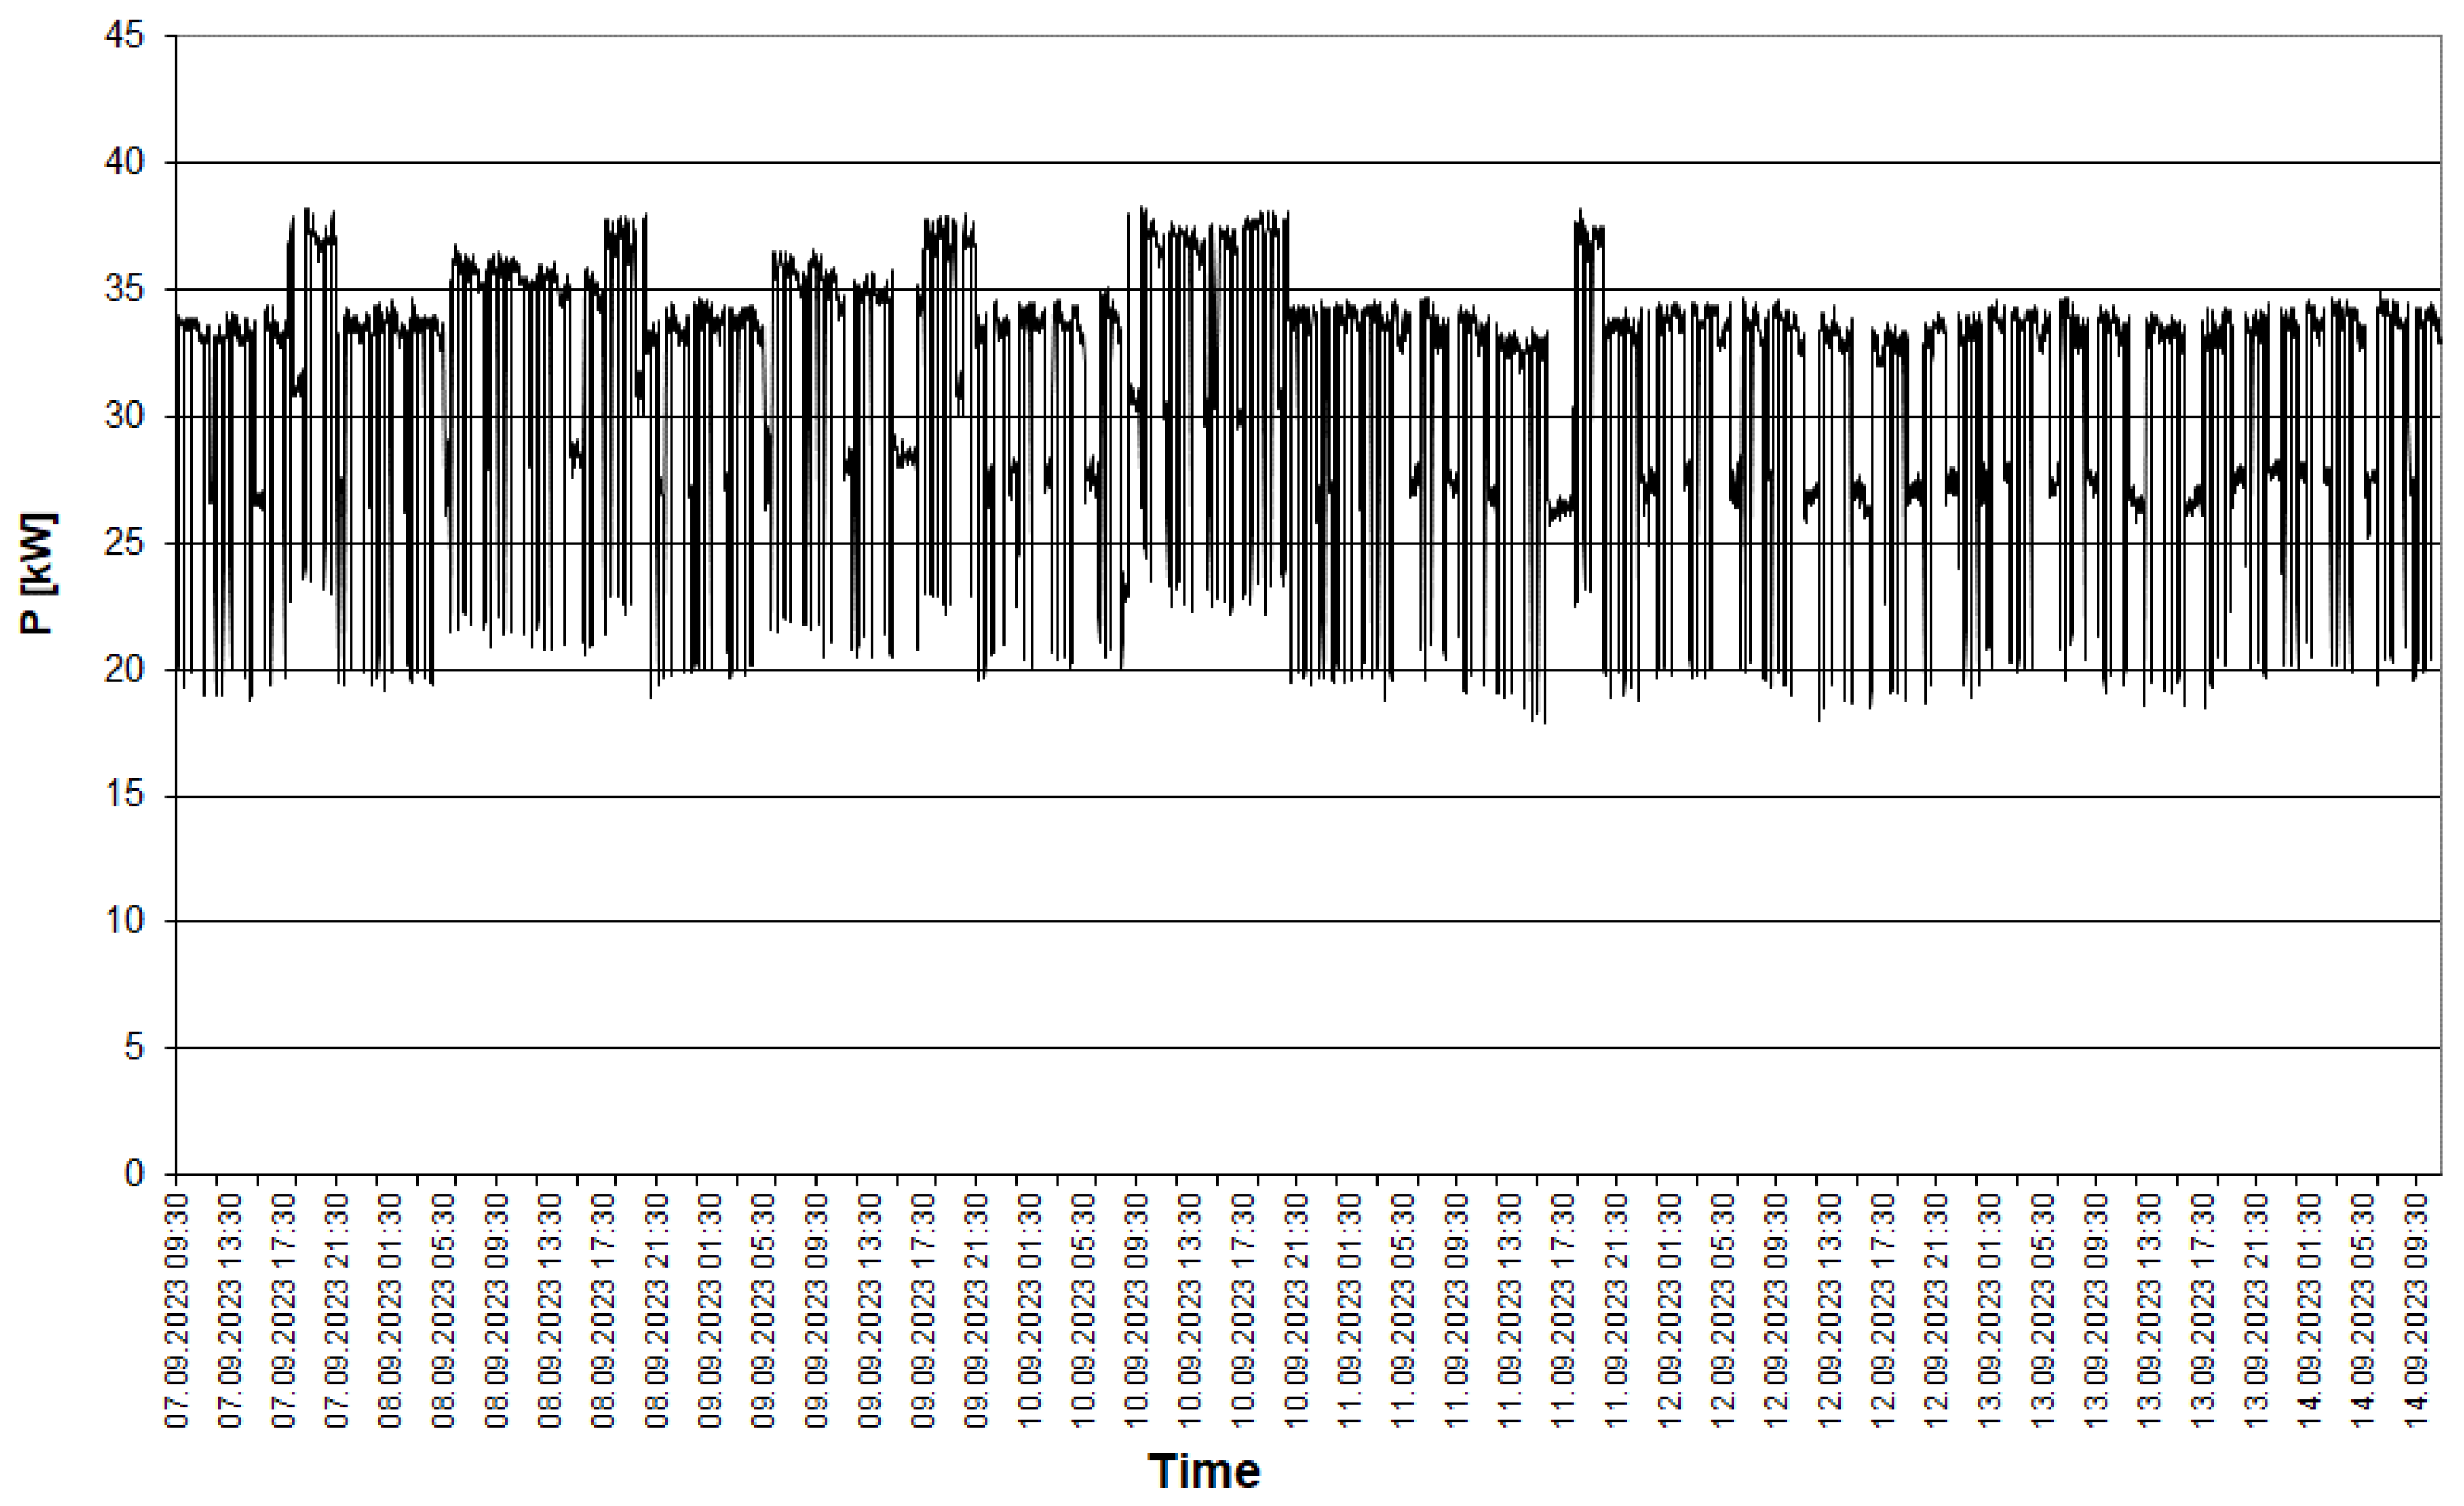
The results of the analysis of the active power levels generated by the agricultural biogas plant are summarised in
Figure 7.
As seen from
Figure 7 and the information received from the owner, only one turbogenerator is in operation at the agricultural biogas plant. Long periods when the biogas plant is not generating electricity (the power is negative) are also evident. The times when the agitator is running are also clearly visible on the waveform - then the value of the recorded power drops close to zero (when the generator is running) or around - 17 kW (when there was no energy production). Therefore, it can be assumed that one generator of 20 kW is necessary to cover the peak needs of an agricultural biogas plant. Without the operation of the agitator, the biogas plant consumes about 1 kW (control systems, monitoring, etc.). The inability to switch on the second generator is due to a voltage in the mains that exceeds the permissible value (253 V). Even with one generator running, voltage exceedances were recorded (
Figure 2), which caused this generator unit to be disconnected from the grid (to protect other electrical equipment sensitive to voltage exceedances). The voltage overshoots are also evident in the voltage deviation waveform (
Figure 3), which repeatedly exceeds the regulatory limit of 10 %. In order to allow the second generator to operate, an analysis of the power supply system should be carried out to prevent voltage overshoots.
3.2. Analysis of the Feeding System of the Biogas Plant under Study
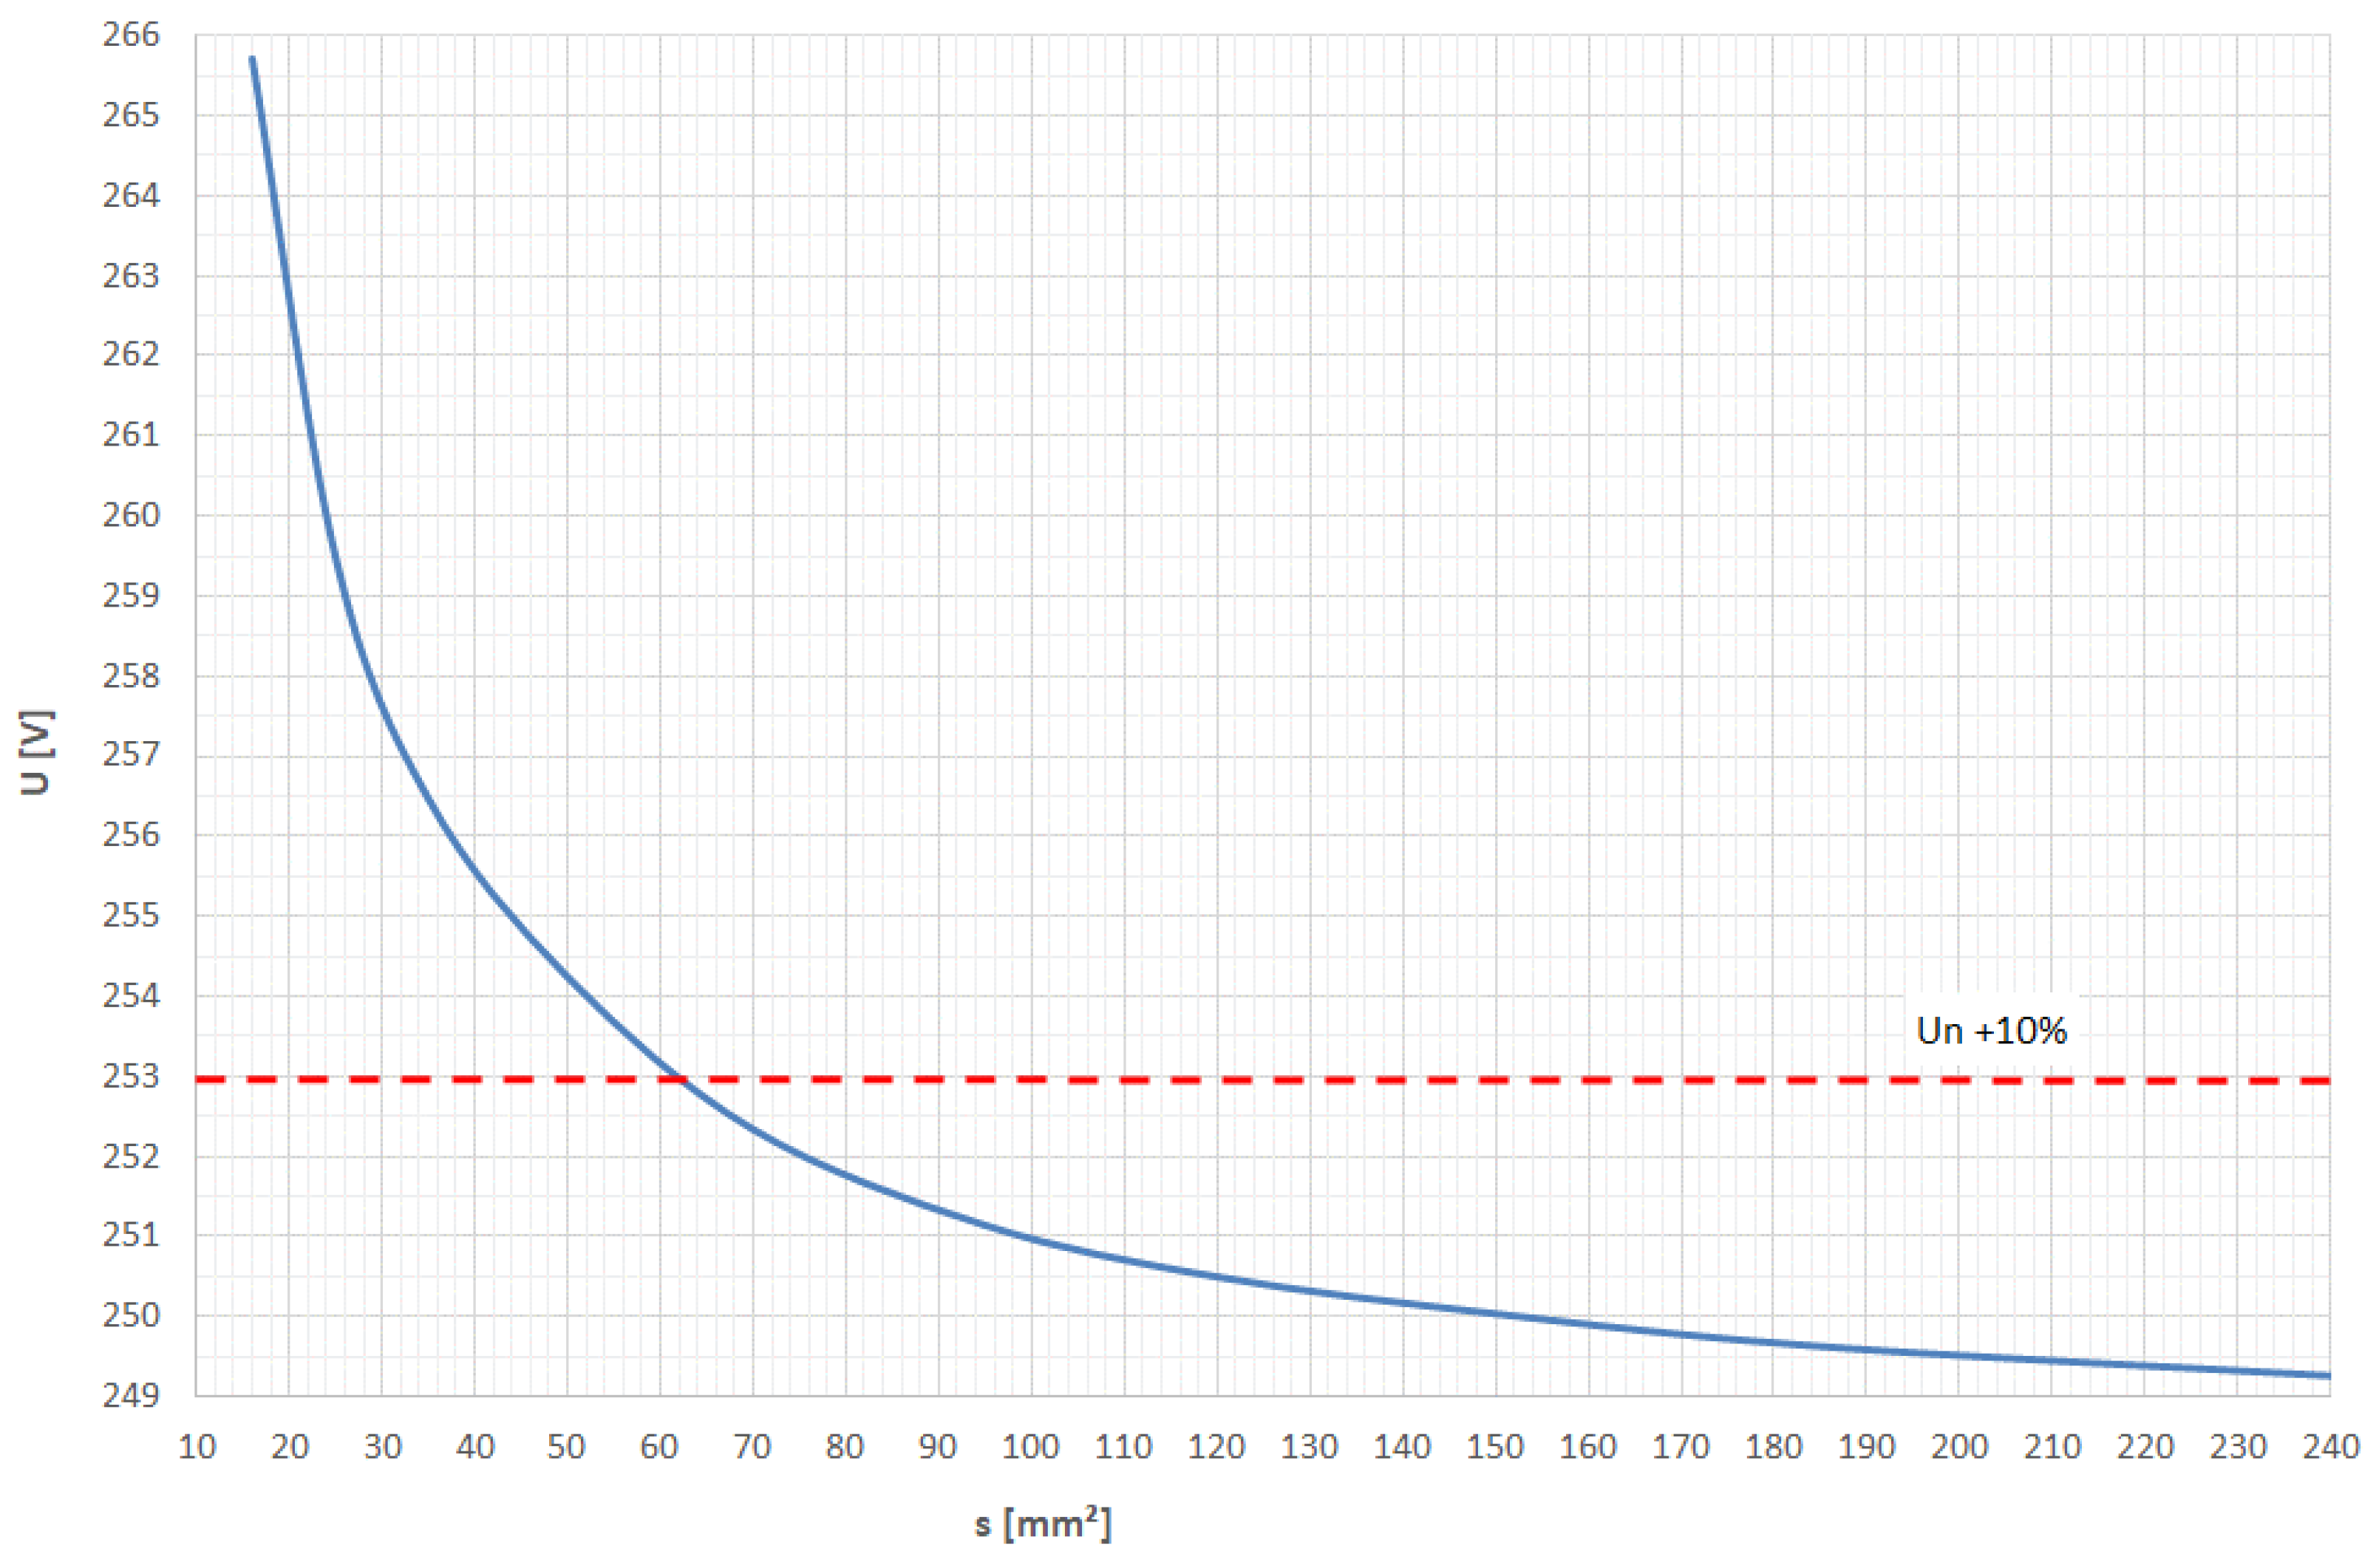
The original power supply system for the biogas plant under consideration consisted of a 198 m long cable line made using YKY 4x25 mm
2. As shown in
Figure 8, this cross-section does not guarantee that the voltage is maintained within the legal limits.
As can be seen, to meet the voltage requirements, the cable cross-section should be no smaller than 61 mm2 (the closest standardised cross-section is 70 mm2 ). However, due to the reduction of losses occurring in the supply line to the agricultural biogas plant, the supply cable was changed to YKY 4x120 mm2.
3.3. Analysis of the Main Supply Parameters of the Studied Agricultural Biogas Plant after Changing the Supply Cable
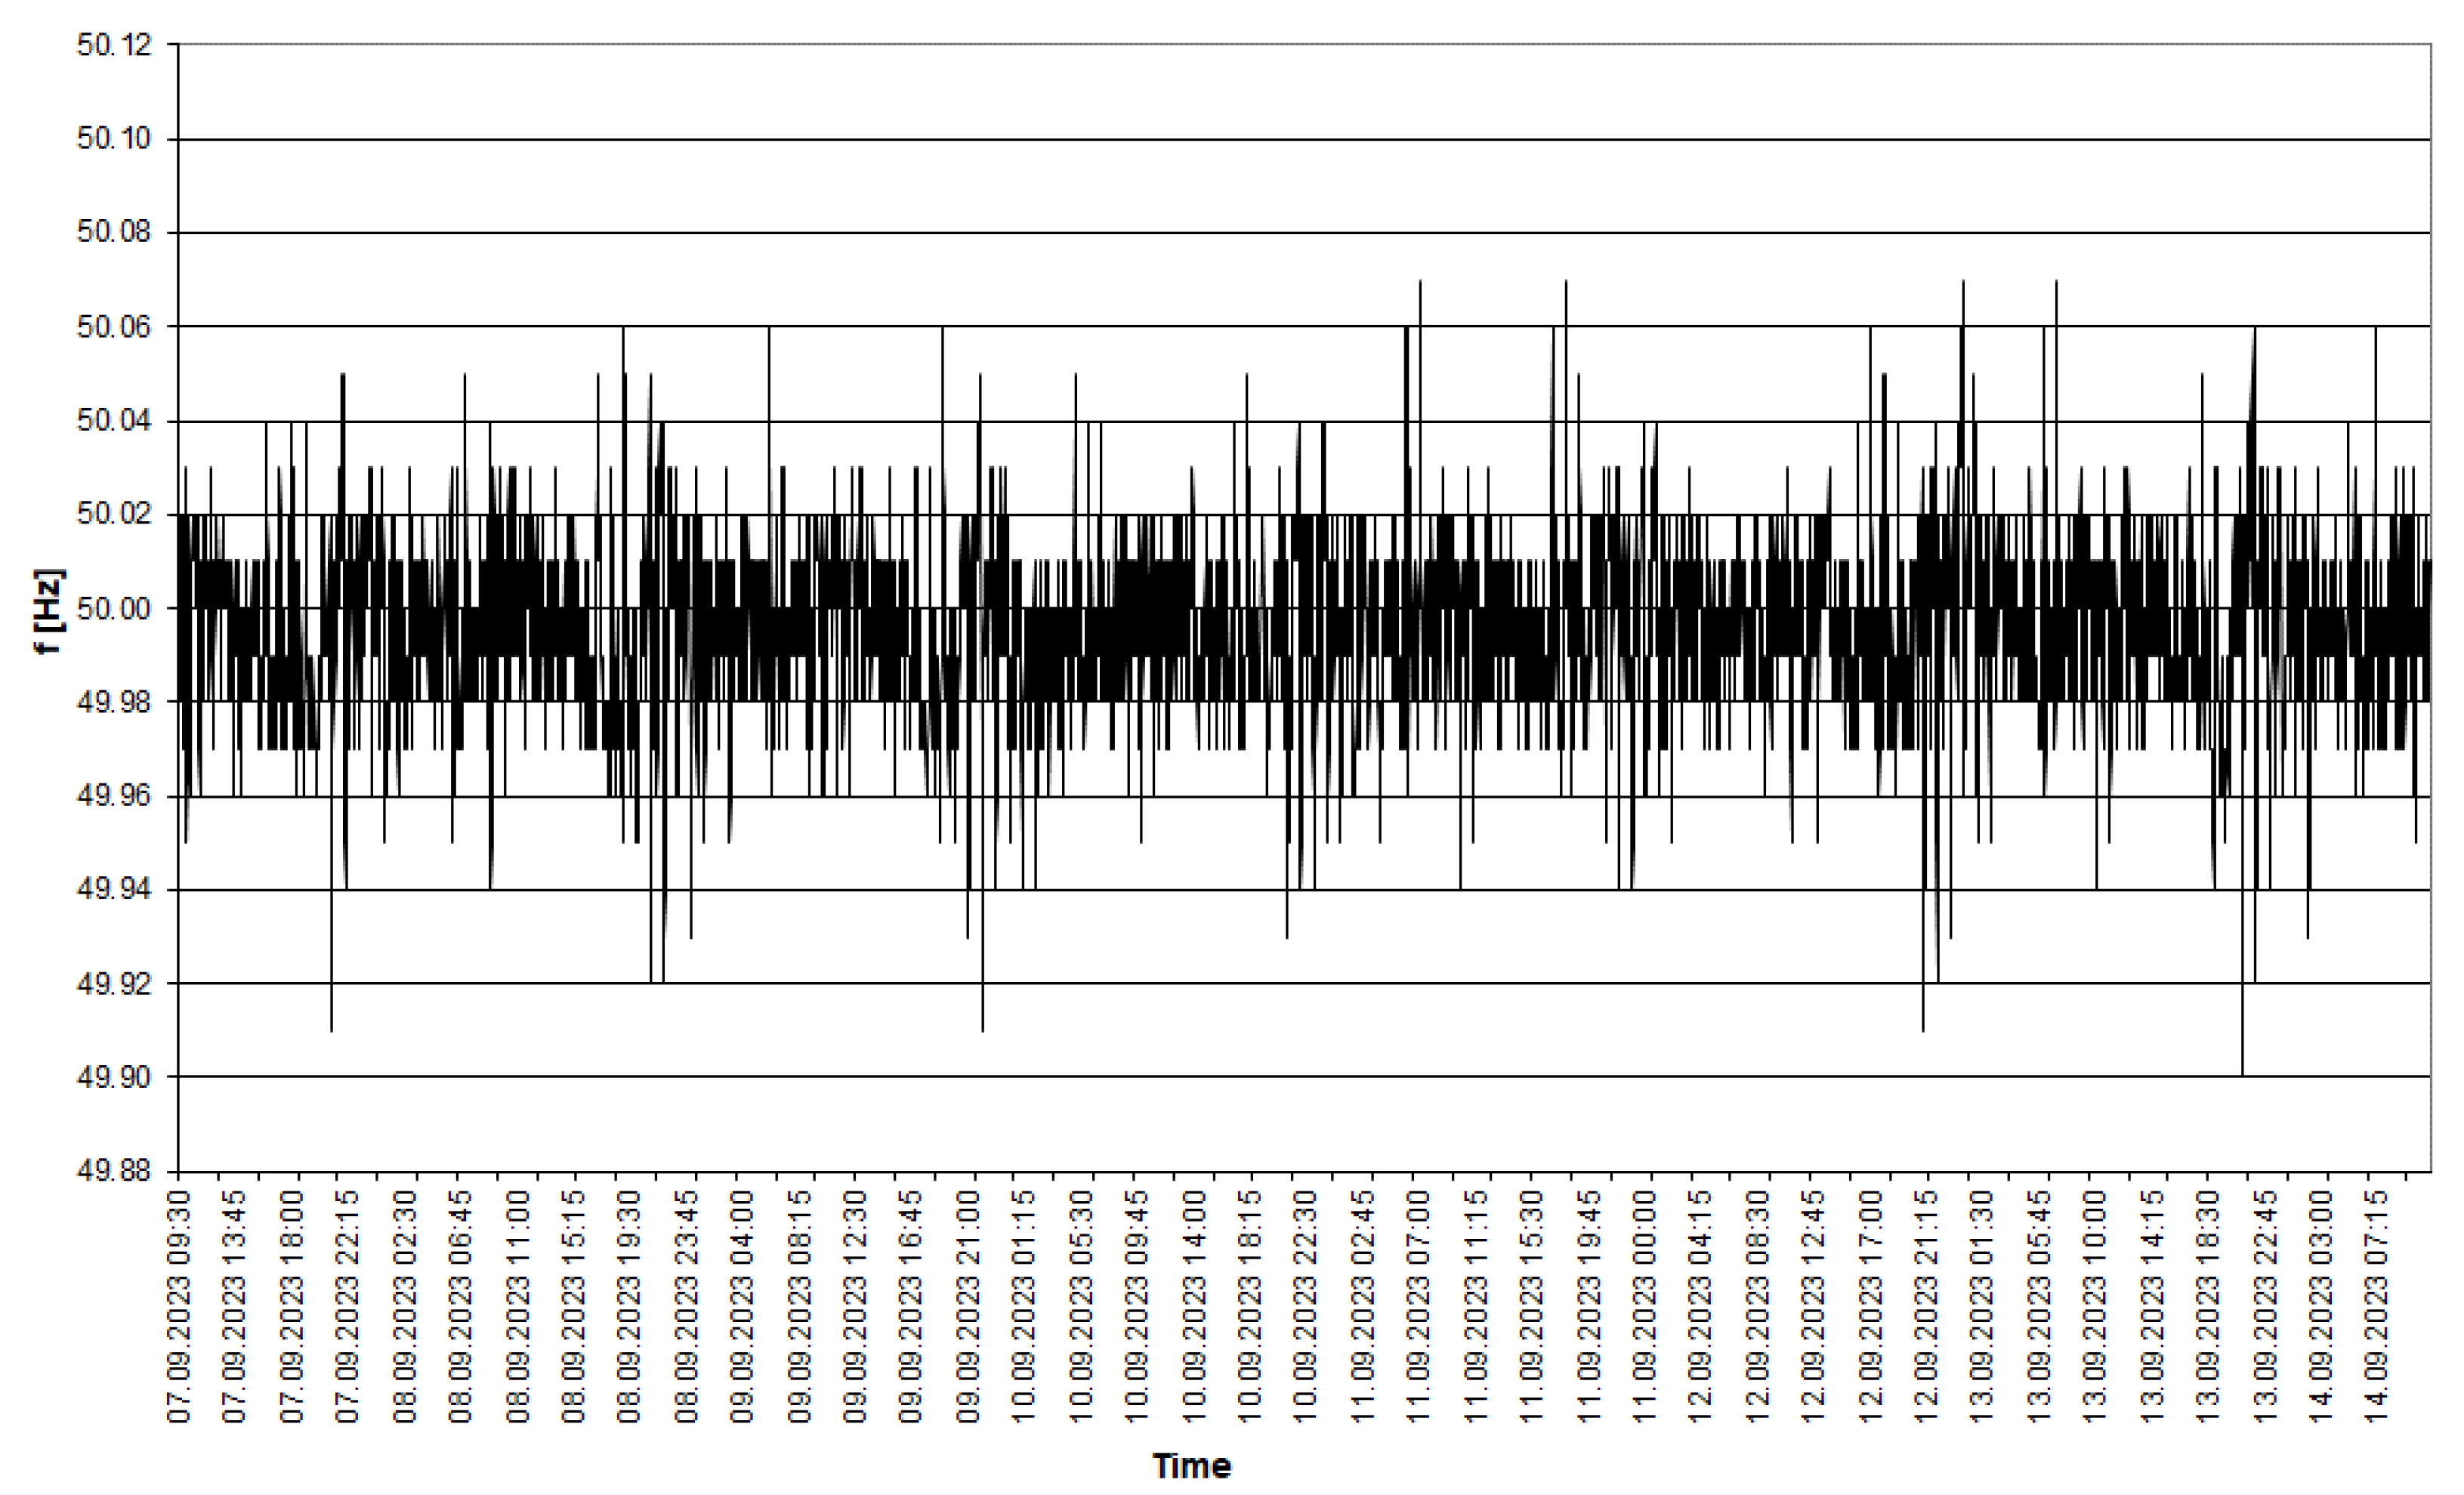
The recorded values of the mains frequency after the power system conversion are shown in
Figure 9.
Analysing the course of the variation of the frequency value recorded after the power cable change, repeatability analogous to that before the conversion can be observed.
Analysing the recorded voltage waveforms (
Figure 10) and voltage deviation (
Figure 11), as in the previous case, it is possible to notice a cyclic variation. However, the variations are noticeably more minor - it is much less frequent for the voltage to take values above 250 V, and only one measurement was recorded in which the voltage dropped below 210 V. This is reflected in the voltage deviation values (
Figure 11), which were within +/- 10 % of the rated voltage throughout the recorded period.
The unstable operation of the agricultural biogas plant is reflected in the recorded values of the flicker nuisance index (
Figure 12). These are nearly three times lower than the values found in the system before the power cable change (
Figure 4).
As with the original system, a cyclic variation of the voltage asymmetry factor was also recorded after changing the power cable (
Figure 13). This does not show any significant differences in the values achieved, but comparing the two waveforms (
Figure 5 and
Figure 13), it is clear that the waveform recorded after the power cable change is less ‘jagged.’
As in the original system, the maximum values of the voltage distortion factor occur in the afternoon and evening. However, these values are almost twice as low as the first biogas plant studied.
The maximum changes in the recorded active power values of the agricultural biogas plant after changing the feed cable (
Figure 15) resulted from the operation of the two digester mixers. It is worth noting that at no time during the measurement was the active power equal to the generator’s rated power. It was caused by the energy consumption of the equipment installed in the biogas plant.
3.4. Analysis of the Main Supply Parameters of the Studied Agricultural Biogas Plant after Changing the Supply Cable
The value standardised in Polish regulations [
38,
39] is the 95 % quantile. It is defined in the standard [
38] as the highest value obtained from 95 % of the recording time during a week. A summary of the recorded supply voltage frequency values is shown in
Table 1.
A summary of the measured voltage levels in each phase of the system supplying the agricultural biogas plant is shown in
Table 2. Several relationships emerge from the analysis of the values presented there. In both cases, the asymmetry of the voltages in the individual phases is noticeable. The lowest voltage occurred in the third phase and was most likely due to the asymmetrical connection of single-phase loads to the grid. However, in each phase, the voltage recorded after the power cable change was lower than that of the primary circuit. It translated into voltage deviation values. After the change of the power cable, although momentary exceedances of the permissible voltage deviation values were registered, the regulatory normal quantile of 95 % slightly exceeded 9 %. The operation of the biogas plant causes an increase in the voltage at its point of connection. As can be seen from the measurements taken, this voltage is kept close to the upper limit allowed by the regulations. Switching on the digester mixer reduces generation by almost half, resulting in a drop in voltage values. Turning it off causes the voltage to rise again; this cycle repeats every 30 minutes. It is not a beneficial phenomenon from the point of view of both the quality of the generated electricity and the durability of the consumer equipment (the cyclic, step-by-step change in the value of the generated voltage is mainly noticeable as a change in the intensity of the lighting installed on the farm, and can also lead to malfunctioning of voltage-sensitive equipment (mainly electronic), in extreme cases leading to their deactivation or even damage).
Table 2 provides the answer to the malfunction of the milking apparatus - its shutdown. Before the power cable was replaced, the lowest recorded voltage value was only 197 V. This is below 200 V, usually accepted as the voltage limit in milking clusters. For this reason, the clusters reported a voltage error and went into emergency mode. After replacing the power cable, the lowest recorded voltage value was 208 V, higher than the minimum value allowed by the regulations. As a result, there were no more emergency shutdowns of the consumers during the test period.
A summary of the results of the statistical analysis of the values of the voltage asymmetry coefficient in the power supply system of the biogas plant under study is presented in
Table 3. As was shown during the analysis of the recorded waveforms of variation of the asymmetry coefficients, the analysis of the values presented in
Table 3 did not reveal any significant differences in the values of this parameter before and after the change of the power supply cable.
A summary of the results of the statistical analysis of the long-term flicker nuisance value (P
lt) at the connection point of the agricultural biogas plant during the recording period is presented in
Table 4. The values presented there show that the P
lt factor in each analysed system exceeds the permissible value (1). However, replacing the power cable reduced the value of the 95 % quantile by almost three times.
In the primary system, non-compliance with the voltage distortion requirements from the sinusoidal waveform was observed (
Table 5). The maximum THDU value is almost 1.7 times higher than the required (8 %) [
38,
39]. The higher harmonics cause additional voltage and power losses (increased cable heating) in the biogas plant’s power supply system. These overshoots are correlated with voltage drops occurring in the electricity network. Changing the power cable reduced the value of the voltage distortion factor by almost half.
5. Conclusions
As the authors’ investigations showed, the power supply voltage problems reported by the owner were technical in origin. The inability to start the second generator was due to an incorrect selection of the cross-sectional area of the cable supplying the biogas plant. A cross-section that was too small was the cause of significant voltage drops, which resulted in high voltage values at the connection point, significantly exceeding the permissible value. Replacement of the power cable enabled the continuous operation of both generators but did not completely solve the voltage problems. The operation of the digester mixers caused the most considerable voltage variations. Simultaneous operation of both mixers resulted in an average drop of about 14.2 kW in the power input to the electrical system. The solution to this problem would be to increase the number of mixers while reducing their power rating. In addition, the mixers should operate in cycles (only one of the mixers would always be switched on). It would allow the system to operate at constant power, significantly reducing voltage variations at the connection point of the biogas plant. In addition, the lower-powered motors would have smaller inrush currents, which would not cause large voltage fluctuations at start-up. In addition, oversizing the generator capacity (relative to the connection capacity) would cover auto consumption and enable power close to the connection capacity to be fed into the grid.
Author Contributions
Conceptualization, A.B. and Z.S.; methodology, Z.S., and M.P.; software, A.MI.; validation, A.B., Z.S., and W.R.; formal analysis, W.R.; investigation, A.MI.; resources, A.MA.; data curation, Z.S., and A.MA.; writing—original draft preparation, Z.S., and M.P.; writing—review and editing, A.B. and W.R.; visualization, A.MI.; supervision, Z.S. and A.MA.; project administration, W.R. and A.MA.; funding acquisition, M.P. and A.B. All authors have read and agreed to the published version of the manuscript.
Funding
This research received no external funding
Informed Consent Statement
Not applicable.
Data Availability Statement
Data are contained within the article.
Conflicts of Interest
The authors declare no conflicts of interest.
References
- Monteny, G.-J.; Bannink, A.; Chadwick, D. Greenhouse gas abatement strategies for animal husbandry. Agric. Ecosyst. Environ. 2006, 112, 163-170. [CrossRef]
- Scheftelowitz, M.; Thrän, D. Unlocking the energy potential of manure-An assessment of the biogas production potential at the farm level in Germany. Agriculture 2016, 6, 20. [CrossRef]
- Akyürek, Z. Potential of biogas energy from animal waste in the Mediterranean region of Turkey. J. Energy Syst. 2018, 160-167. [CrossRef]
- Saracevic, E.; Frühauf, S.; Miltner, A.; Karnpakdee, K.; Munk, B.; Lebuhn, M.; Wlcek, B.; Leber, J.; Lizasoain, J.; Friedl, A.; et al. Utilisation of food and agricultural residues for a flexible biogas production: Process stability and effects on needed biogas storage capacities. Energies 2019, 12, 2678. [CrossRef]
- Friedlingstein, P.; O’sullivan, M.; Jones, M.W.; Andrew, R.M.; Hauck, J.; Olsen, A.; Zaehle, S. Global carbon budget. Earth Sys. Sci. Data 2020, 12, 3269-3340. [CrossRef]
- Korberg, A.D.; Skov, I.R.; Mathiesen, B.V.. The role of biogas and biogas-derived fuels in Denmark’s 100% renewable energy system. Energy 2020, 199, 117426. [CrossRef]
- Angelidaki, I.; Treu, L.; Tsapekos, P.; Luo, G.; Campanaro, S.; Wenzel, H.; Kougias, P.G. Biogas upgrading and utilisation: Current status and perspectives. Biotechnol. Adv. 2018, 36, 452-466. [CrossRef]
- Tymińska, M.; Skibko, Z.; Borusiewicz, A. The Effect of Agricultural Biogas Plants on the Quality of Farm Energy Supply. Energies 2023, 16, 4600. [CrossRef]
- Meneses-Quelal, O.; Velázquez-Martí, B. Pretreatment of animal manure biomass to improve biogas production: A review. Energies 2020, 13, 3573 . [CrossRef]
- Kaltschmitt M., Scholwin F., Gattermann H., Schattauer A., Weiland P., Biogas - Production Utilisation, in: Institut für Energetik und Umwelt Gmbh, Leipzig, 2005.
- Lansing S., Botero R., Martin J. F., Waste treatment and biogas quality in small-scale agricultural digesters, Bioresource Technology, Volume 99, Issue 13, 2008, 5881-5890. [CrossRef]
- Czekała W., Nowak M. and Bojarski W. Anaerobic Digestion and Composting as Methods of Bio-Waste Management. Agricultural Engineering, 2023, Vol.27 (Issue 1), pp. 173-186. [CrossRef]
- Derehajło S., Tymińska M., Skibko Z., Borusiewicz A., Romaniuk W., Kuboń M., Olech E., Koszel M.. Heavy Metal Content in Substrates in Agricultural Biogas Plants. Agricultural Engineering. 2023;27(1): 315-329. [CrossRef]
- Giesy R., Wilkie A., De Vries A., Nordstedt R. Economic Feasibility of Anaerobic Digestion To Produce Electricity on Florida Dairy Farms1. EDIS. 2006. [CrossRef]
- Gloy B. A., Dressler J. B., Financial barriers to the adoption of anaerobic digestion on U.S. livestock operations, Agricultural Finance Review, 03 Aug 2010, Vol. 70, Issue 2, 157 - 168. [CrossRef]
- Soljan Z, Holdyński G, Zajkowski M. Decomposition of the load’s current supplied from a sinusoidal and asymmetrical voltage source in accordance with the Currents’ Physical Components (CPC) Theory. In: Rusek S, Goňo R, eds. Proceedings of the 2019 20th International Scientific Conference on Electric Power Engineering (EPE). ; 2019:389-394. [CrossRef]
- Klavon K. H., Lansing S. A., Mulbry W., Moss A. R., Felton G., Economic analysis of small-scale agricultural digesters in the United States, Biomass and Bioenergy, Volume 54, 2013, 36-45. [CrossRef]
- Larina Y., Galchynska J., Kucheruk P., Zghurska O., Ortina G., Al-Nadzhar F., Marusei T., Kuboń M. and Dzieniszewski G. Estimation of the Domestic Agricultural Sector Potential for the Growth of Energy Cultures for Bioenergy Fuel Production. Agricultural Engineering, 2021, Vol.25 (Issue 1), pp. 73-82. [CrossRef]
- Dach, J.; Boniecki, P.; Przybył, J.; Janczak, D.; Lewicki, A.; Czekała, W.; Witaszek, K.; Rodríguez Carmona, P.C.; Cieślik, M. Energetic efficiency analysis of the agricultural biogas plant in 250 kWe experimental installation. Energy 2014, 69, 34-38. [CrossRef]
- Saaty T. L., Vargas L. G., Dellmann K.L.: The allocation ofintangible resources: The analytic hierarchy process and linear programming. Socioecon. Plann. Sci., No. 37, 2003. [CrossRef]
- San Cristobal J. R.: Multi-criteria decision-making in the selection of a renewable energy project in Spain: The Vikor method. Renew. Energy, No. 36, 2011. [CrossRef]
- Stoltmann A., Bućko P.: Analysis of the biogas plant location using analytic hierarchy process (ahp) and numerical taxonomy methods - methods comparison. Zeszyty Naukowe Wydziału Elektrotechniki i Automatyki Politechniki Gdańskiej Nr 53. 2017. ISSN: 1425-5766 (in polisch) https://www.google.com/url?sa=t&source=web&rct=j&opi=89978449&url=https://yadda.icm.edu.pl/baztech/element/bwmeta1.element.baztech-291c516d-5758-4f23-815e-62df0afc8864/c/ZN_WEIAPG_53-29.pdf&ved=2ahUKEwjyp4rTxuWFAxU6PxAIHeHoDagQFnoECBsQAQ&usg=AOvVaw1nDzQXR50HzVDrOTZ0pMa1.
- Mazurkiewicz, J. The Impact of Manure Use for Energy Purposes on the Economic Balance of a Dairy Farm. Energies 2023, 16, 6735. [CrossRef]
- Vilas Bôas, T.F.; Barros, R.M.; Pinto, J.A.; dos Santos, I.F.S.; Lora, E.E.S.; Andrade, R.V.; Tiago Filho, G.L.; Almeida, K.A.; de Oliveira Machado, G. Energy Potential from the Generation of Biogas from Anaerobic Digestion of Olive Oil Extraction Wastes in Brazil. Clean. Waste Syst. 2023, 4, 100083. [CrossRef]
- Furtado, L.A.; Guerreiro Ribeiro, S.; Pradelle, F.; Parise, J.A.R. Modeling and Techno-Economic Analysis of a Hybrid Sugarcane Plant Fed by Vinasse Biogas and Bagasse Surplus for Electricity Generation. J. Clean. Prod. 2023, 413, 137511. [CrossRef]
- wind, Solar Payback Times under a Year in Some Parts of World, Says Rystad. Available online: https://www.pv-magazine.com/2022/10/14/wind-solar-payback-times-under-a-year-in-some-parts-of-world-says-rystad/ (accessed on 23.04.2024).
- Hagman, L.; Blumenthal, A.; Eklund, M.; Svensson, N. The role of biogas solutions in sustainable biorefineries. J. Clean. Prod. 2018, 172, 3982-3989. [CrossRef]
- Kuboń, M.; Skibko, Z.; Tabor, S.; Malaga-Toboła, U.; Borusiewicz, A.; Romaniuk, W.; Zarajczyk, J.; Neuberger, P. Analysis of Voltage Distortions in the Power Grid Arising from Agricultural Biogas Plant Operation. Energies 2023, 16, 6189. [CrossRef]
- Burg, V.; Bowman, G.; Haubensak, M.; Baier, U.; Thees, O. Valorization of an untapped resource: Energy and greenhouse gas emissions benefits of converting manure to biogas through anaerobic digestion. Resour. Conserv. Recycl. 2018, 136, 53-62. [CrossRef]
- Tamburini, E.; Gaglio, M.; Castaldelli, G.; Fano, E. A. Biogas from Agri-Food and Agricultural Waste Can Appreciate Agro-Ecosystem Services: the Case Study of Emilia Romagna Region. Sustainability 2020, 12, 8392. [CrossRef]
- Jeung, J.H.; Chung, W.J.; Chang, S.W. Evaluation of Anaerobic Co-Digestion to Enhance the Efficiency of Livestock Manure Anaerobic Digestion. Sustainability 2019, 11, 7170 . [CrossRef]
- Mao, C.; Feng, Y.; Wang, X.; Ren, G. Review on research achievements of biogas from anaerobic digestion. Renew. Sustain. Energy Rev. 2015, 45, 540-555 . [CrossRef]
- Rao P. V., Baral S. S., Dey R., Mutnuri S., Biogas generation potential by anaerobic digestion for sustainable energy development in India, Renewable and Sustainable Energy Reviews, Volume 14, Issue 7, 2010, 2086-2094. [CrossRef]
- Garrison M. and Richard T., Methane and Manure: Feasibility Analysis of Price and Policy Alternatives. Transactions of the ASAE. 48. 2005. [CrossRef]
- Chen Y., Yang G., Sweeney S., Feng Y., Household biogas use in rural China: A study of opportunities and constraints, Renewable and Sustainable Energy Reviews, Volume 14, Issue 1, 2010, 545-549. [CrossRef]
- Korberg, A.D.; Skov, I.R.; Mathiesen, B.V.. The role of biogas and biogas-derived fuels in a 100% renewable energy system in Denmark. Energy 2020, 199, 117426. [CrossRef]
- Hołdyński, G., Skibko, Z., Borusiewicz, A. (2023). Analysis of the Influence of Load on the Value of Zero-Voltage Asymmetry in Medium-Voltage Networks Operating with Renewable Energy Sources. Energies, 16, 1-13. [CrossRef]
- EN 50160:2010; Supply Voltage Parameters for Public Distribution Networks. E.U.: Maastricht, The Netherlands, 2010.
- Regulation of the Minister of Economy of May 4, 2007 on detailed conditions for the operation of the electric power system (in polisch). Dz.U. 2007 nr 93 poz. 623.
- Robak S., Pawlicki A., Pawlicki B., The analysis of the voltage and current asymmetry in the power transmission lines. Przegląd Elektrotechniczny, R. 90 NR 7, 2014. [CrossRef]
- Kosicki Ł., Typańska D., The research of current and voltage distortions generated by luminaries with the light emmiting diodes. Electrical Engineering No 92, 2017. [CrossRef]
- IEC 61000-4-30:2015+AMD1: 2021 CSV Consolidated version, Electromagnetic compatibility (EMC) - Part 4-30: Testing and measurement techniques - Power quality measurement methods.
Figure 1.
Frequency value variation recorded at the connection point of an agricultural biogas plant.
Figure 1.
Frequency value variation recorded at the connection point of an agricultural biogas plant.
Figure 2.
Voltage variation recorded at the connection point of an agricultural biogas plant.
Figure 2.
Voltage variation recorded at the connection point of an agricultural biogas plant.
Figure 3.
Variation of voltage deviation values recorded at the connection point of an agricultural biogas plant.
Figure 3.
Variation of voltage deviation values recorded at the connection point of an agricultural biogas plant.
Figure 4.
Variation of the long-term flicker nuisance factor (Plt) recorded at the connection point of an agricultural biogas plant.
Figure 4.
Variation of the long-term flicker nuisance factor (Plt) recorded at the connection point of an agricultural biogas plant.
Figure 6.
The course of variation of the total voltage distortion coefficient (THDU ) was recorded at the connection point of the agricultural biogas plant.
Figure 6.
The course of variation of the total voltage distortion coefficient (THDU ) was recorded at the connection point of the agricultural biogas plant.
Figure 7.
The recorded course of variation of the three-phase active power value generated at an agricultural biogas plant.
Figure 7.
The recorded course of variation of the three-phase active power value generated at an agricultural biogas plant.
Figure 8.
Dependence of the voltage value (U) occurring at the connection point of an agricultural biogas plant as a function of the cross-sectional area (s) of the working conductor of the supply cable.
Figure 8.
Dependence of the voltage value (U) occurring at the connection point of an agricultural biogas plant as a function of the cross-sectional area (s) of the working conductor of the supply cable.
Figure 9.
Frequency variation waveform recorded after changing the power cable.
Figure 9.
Frequency variation waveform recorded after changing the power cable.
Figure 10.
Voltage variation waveform recorded after changing the power cable.
Figure 10.
Voltage variation waveform recorded after changing the power cable.
Figure 11.
Voltage deviation variation waveform recorded after changing the power cable.
Figure 11.
Voltage deviation variation waveform recorded after changing the power cable.
Figure 12.
Variation waveform of the long-term flicker nuisance factor (Plt) recorded after changing the power cable.
Figure 12.
Variation waveform of the long-term flicker nuisance factor (Plt) recorded after changing the power cable.
Figure 13.
Variation waveform of the voltage asymmetry factor (αU ) recorded after changing the power cable.
Figure 13.
Variation waveform of the voltage asymmetry factor (αU ) recorded after changing the power cable.
Figure 14.
The waveform of the total voltage distortion coefficient (THDU ) variation was recorded after changing the power cable.
Figure 14.
The waveform of the total voltage distortion coefficient (THDU ) variation was recorded after changing the power cable.
Figure 15.
Recorded the course of the variation of the three-phase active power value generated in an agricultural biogas plant.
Figure 15.
Recorded the course of the variation of the three-phase active power value generated in an agricultural biogas plant.
Table 1.
Results of statistical frequency analysis.
Table 1.
Results of statistical frequency analysis.
| Parameter |
Before the changes |
After changes |
| Frequency |
Deviation from rated value |
Frequency |
Deviation from rated value |
| [Hz] |
[%] |
[Hz] |
[%] |
| Average value |
49.995 |
-0.010 |
49.996 |
-0.008 |
| Minimum value |
49.910 |
-0.180 |
49.900 |
-0.200 |
| Maximum value |
50.080 |
0.160 |
50.070 |
0.140 |
| Quantile 95 |
49.970 |
0.040 |
49.970 |
0.040 |
Table 2.
Results of statistical analysis of tension levels.
Table 2.
Results of statistical analysis of tension levels.
| Parameter |
L1 phase |
L2 phase |
L3 phase |
| phase voltage |
deviation from the rated voltage |
phase voltage |
deviation from the rated voltage |
phase voltage |
deviation from the rated voltage |
| [V] |
[%] |
[V] |
[%] |
[V] |
[%] |
| Before the changes |
| Average value |
238.913 |
3.452 |
238.120 |
3.109 |
233.096 |
0.934 |
| Minimum value |
203.260 |
-11.986 |
200.130 |
-13.341 |
197.070 |
-14.666 |
| Maximum value |
258.650 |
11.999 |
257.120 |
11.336 |
248.810 |
7.738 |
| Quantile 95 |
253.480 |
9.760 |
252.110 |
10.167 |
244.450 |
10.850 |
| After changes |
| Average value |
242.655 |
5.073 |
241.368 |
4.515 |
240.101 |
3.967 |
| Minimum value |
214.320 |
-7.197 |
212.130 |
-8.145 |
208.580 |
-9.682 |
| Maximum value |
254.120 |
10.037 |
254.280 |
10.106 |
251.760 |
9.015 |
| Quantile 95 |
250.980 |
8.678 |
251.737 |
9.005 |
247.690 |
7.253 |
Table 3.
Results of statistical analysis of voltage asymmetry coefficients.
Table 3.
Results of statistical analysis of voltage asymmetry coefficients.
| Parameter |
Before the changes |
After changes |
| αU
|
αU
|
| [%] |
[%] |
| Average value |
0.315 |
0.350 |
| Minimum value |
0.010 |
0.020 |
| Maximum value |
1.230 |
1.120 |
| Quantile 95 |
0.610 |
0.620 |
Table 4.
Results of statistical analysis of the long-term flicker annoyance index values (Plt).
Table 4.
Results of statistical analysis of the long-term flicker annoyance index values (Plt).
| |
Before the changes |
After changes |
| Parameter |
PltL1
|
PltL2
|
PltL3
|
PltL1
|
PltL2
|
PltL3
|
| Average value |
2.688 |
2.762 |
2.887 |
0.993 |
1.141 |
1.074 |
| Minimum value |
1.540 |
1.620 |
1.690 |
0.720 |
0.830 |
0.790 |
| Maximum value |
3.840 |
3.960 |
4.160 |
2.180 |
1.830 |
1.860 |
| Quantile 95 |
3.500 |
3.580 |
3.767 |
1.384 |
1.691 |
1.440 |
Table 5.
Results of statistical analysis of the coefficients of higher harmonic content of voltage - THDU.
Table 5.
Results of statistical analysis of the coefficients of higher harmonic content of voltage - THDU.
| Parameter |
Before the changes |
After changes |
| THDUL1
|
THDUL2
|
THDUL3
|
THDUL1
|
THDUL2
|
THDUL3
|
| [%] |
[%] |
[%] |
[%] |
[%] |
[%] |
| Average value |
4.366 |
3.641 |
4.693 |
2.114 |
1.821 |
1.925 |
| Minimum value |
2.360 |
2.020 |
2.820 |
1.220 |
1.010 |
1.010 |
| Maximum value |
13.380 |
7.190 |
10.750 |
7.330 |
6.050 |
6.290 |
| Quantile 95 |
8.557 |
5.470 |
7.550 |
2.760 |
2.530 |
2.700 |
|
Disclaimer/Publisher’s Note: The statements, opinions and data contained in all publications are solely those of the individual author(s) and contributor(s) and not of MDPI and/or the editor(s). MDPI and/or the editor(s) disclaim responsibility for any injury to people or property resulting from any ideas, methods, instructions or products referred to in the content. |
© 2024 by the authors. Licensee MDPI, Basel, Switzerland. This article is an open access article distributed under the terms and conditions of the Creative Commons Attribution (CC BY) license (http://creativecommons.org/licenses/by/4.0/).
