5. Results
From the culture supernatant of the soil bacterial isolate
Corallococcus coralloides DSM 2259, which was cultivated on a Casein yeast peptone (
CYP) plate,
Corallopyronin B was generated. The test antibiotic prevented the growth of various
Gram +ve bacteria (
MICs ranging from
1 to 10 mcg/ml) and reduced the development of many
Gram -ve bacteria (including
Escherichia coli) at
MICs more than
100 mcg/ml. Conversely, eukaryotic cells—such as those found in fungi and humans—were unaffected. By preventing bacterial
DNA-dependent RNA polymerase, the test antibiotic was demonstrated to have a bactericidal effect (
RNLP). When
600 mg of the dose per
70 kg of body weight was given
SC in
phases 1/2 of randomized human clinical trials, the
Cmax was
8.6 mcg/ml at
Tmax of
one hour;
T1/2 reached
136 mins as a result of
first-order kinetics of elimination. About
six to seven hours after
SC was given, it ceased working. Less than
6% of experimental candidates experienced unusual toxicity in
phases 1/2 of the preclinical and randomized human clinical trials, manifested as decreased bile flow. A detectable
83% protein binding with plasma albumin was found. After the test antibiotics were refined and purified using the
reverse phase HPLC technology, Corallopyronin B was the predominant component (
Table 4).
The 3T3 neutral red uptake phototoxicity test was used to determine the phototoxicity, and it revealed no phototoxicity. However, the Ames test was used to determine the mutagenicity and carcinogenicity of the test antibiotic, and the results showed that there was no genotoxicity or carcinogenicity. The main isolates of
Gram-negative bacteria that produce the antibiotic
Corallopyronin B are shown using a stereomicroscope in
Figure 11.
Table 9 and
Table 10, respectively, show that there was a considerable decrease in protein synthesis and
mRNA synthesis as the dosage of Myxopyronin
B was increased. Docking experiments with
the MCULE and
SWISS DOCK software showed that the test antibiotic’s mechanism of action was most likely caused by inhibiting
RNA polymerase by binding to its switch region. The test antibiotic’s high
∆G was found to be roughly
15 J/mol using the SWISS
-MODEL software. However, utilizing
SWISS-MODEL software, it was discovered that the test antibiotic’s low
Kd near the switch area was roughly
-720 nM.
Table 11 provides a summary of the biochemical profile and morphology of the strong bacterial isolates used in this investigation to produce the test antibiotic.
Corallococcus coralloides DSM 2259 was the most common bacterial isolate that secreted the extracellular test antibiotic, according to its appearance and biochemical responses. The study involved
150 human volunteers in total, with a mean age of
28.9[
8.1] years (
SD).
The 88% confidence intervals (
CIs) for the long transformed ratios of Cmax,
AUC (0-26), and AUC (0-∞) for the test antibiotic were, in order,
93.3 to
94.6, 90.5 to 95.2, and 90.7 to 93.1.
Corallopyronin B was found to have a mean protein binding (
PB) of about
83%. It was shown that
Albumin exhibited the predominant protein binding for both Rifampicin and
Corallopyronin B. The therapeutic activity was discovered to be attributed to the unbound fraction. The structure of
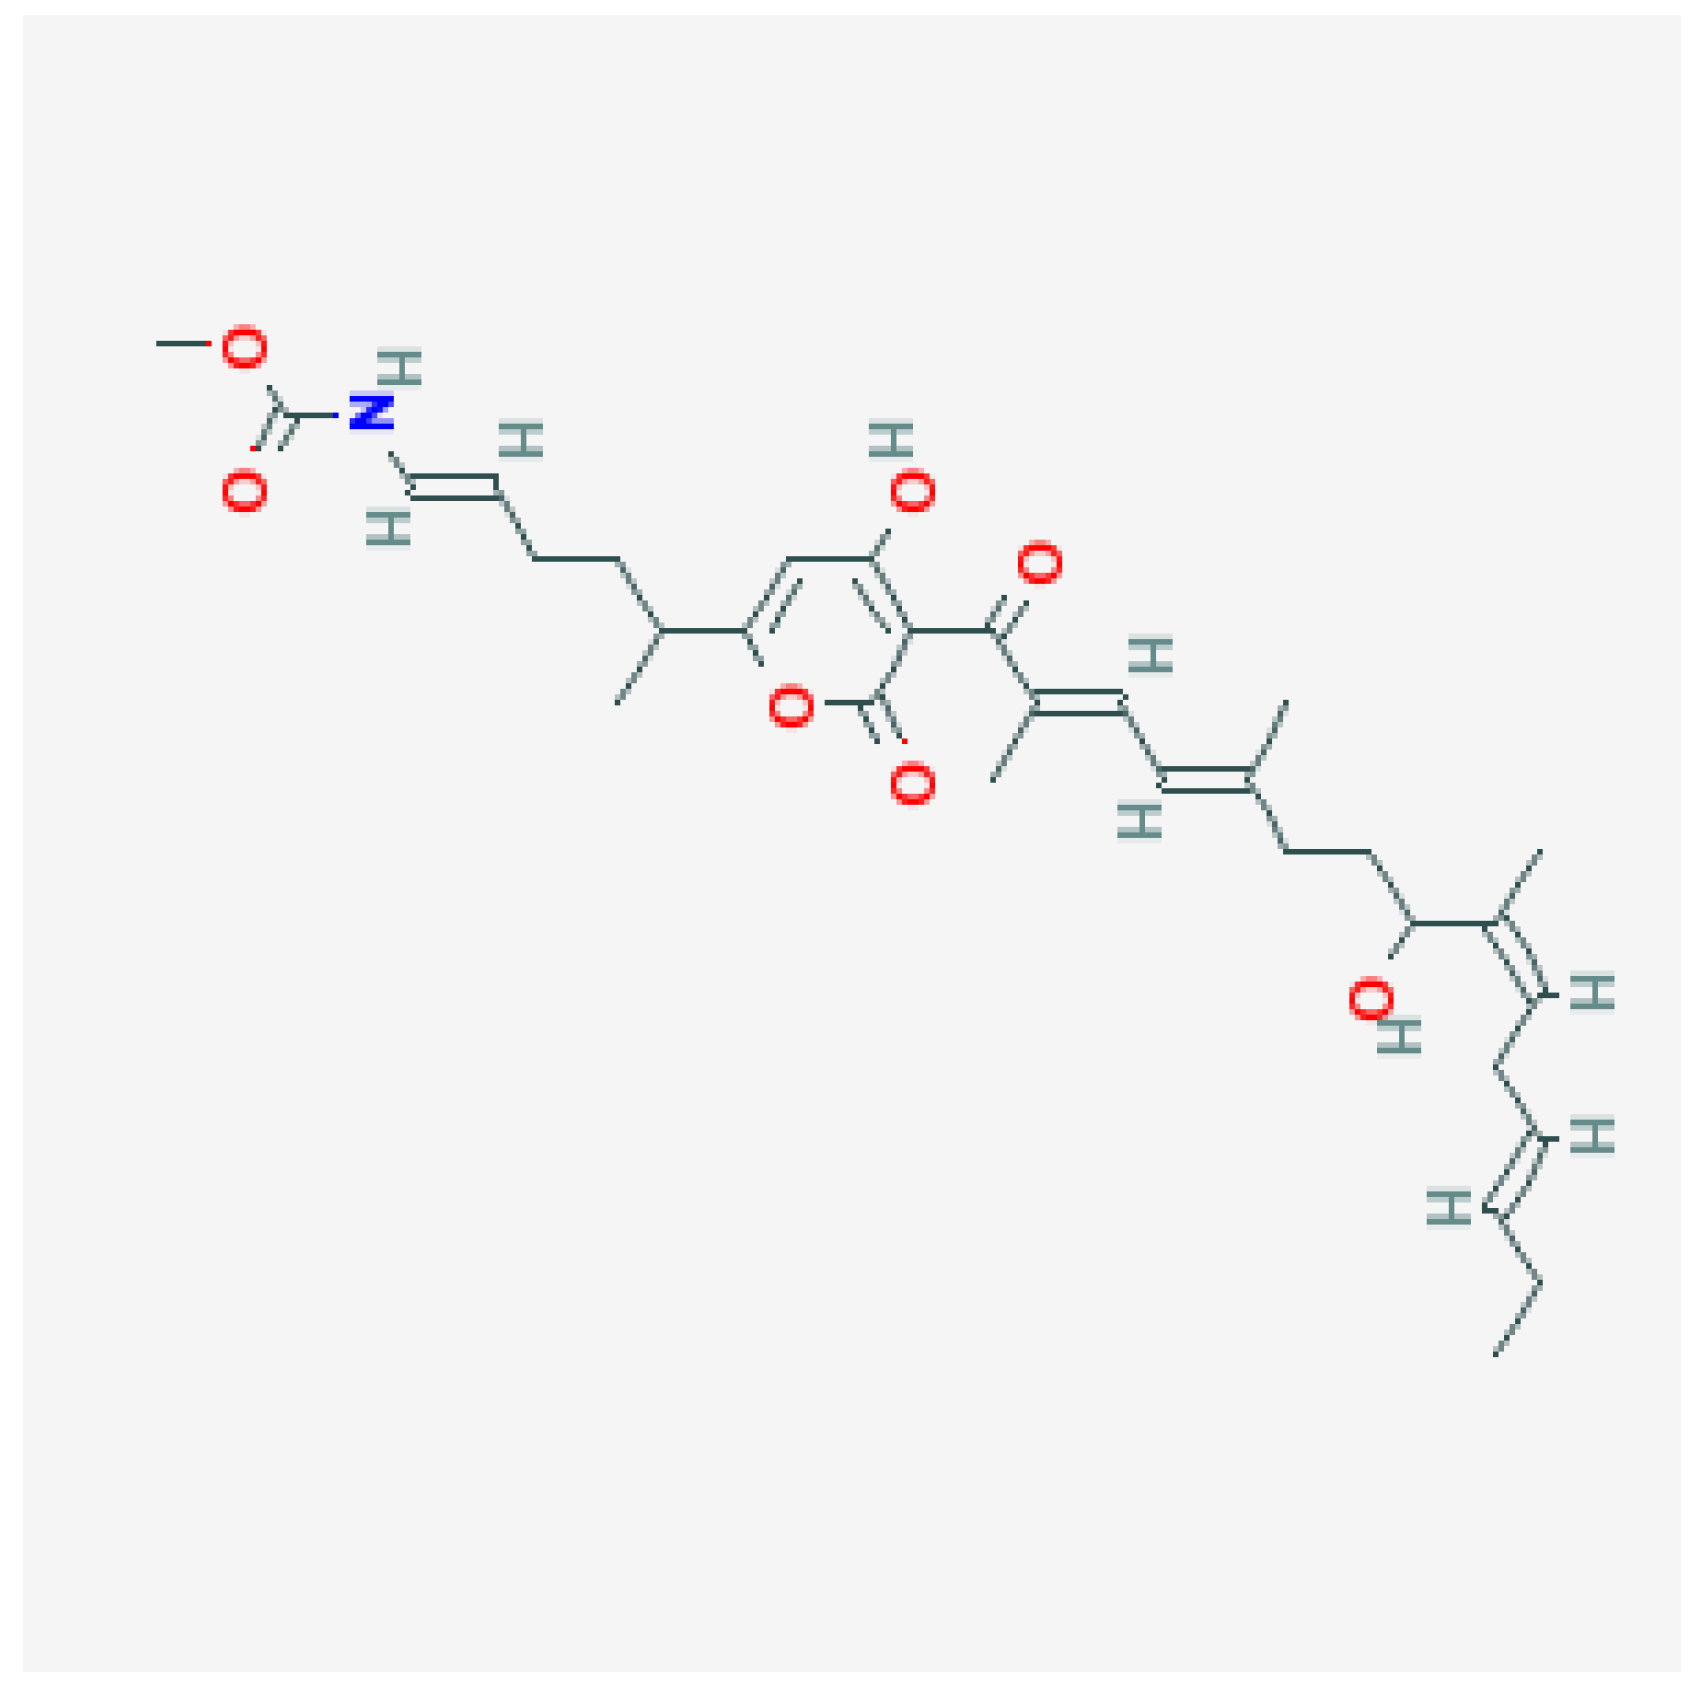
Corallopyronin B, which was isolated from bacterial isolates of
Corallococcus coralloides DSM 2259 collected from various soil conditions in Egypt, is depicted in
Figure 1. Using a mass spectrometer, the molecular formula of the purified test antibiotic was found to be
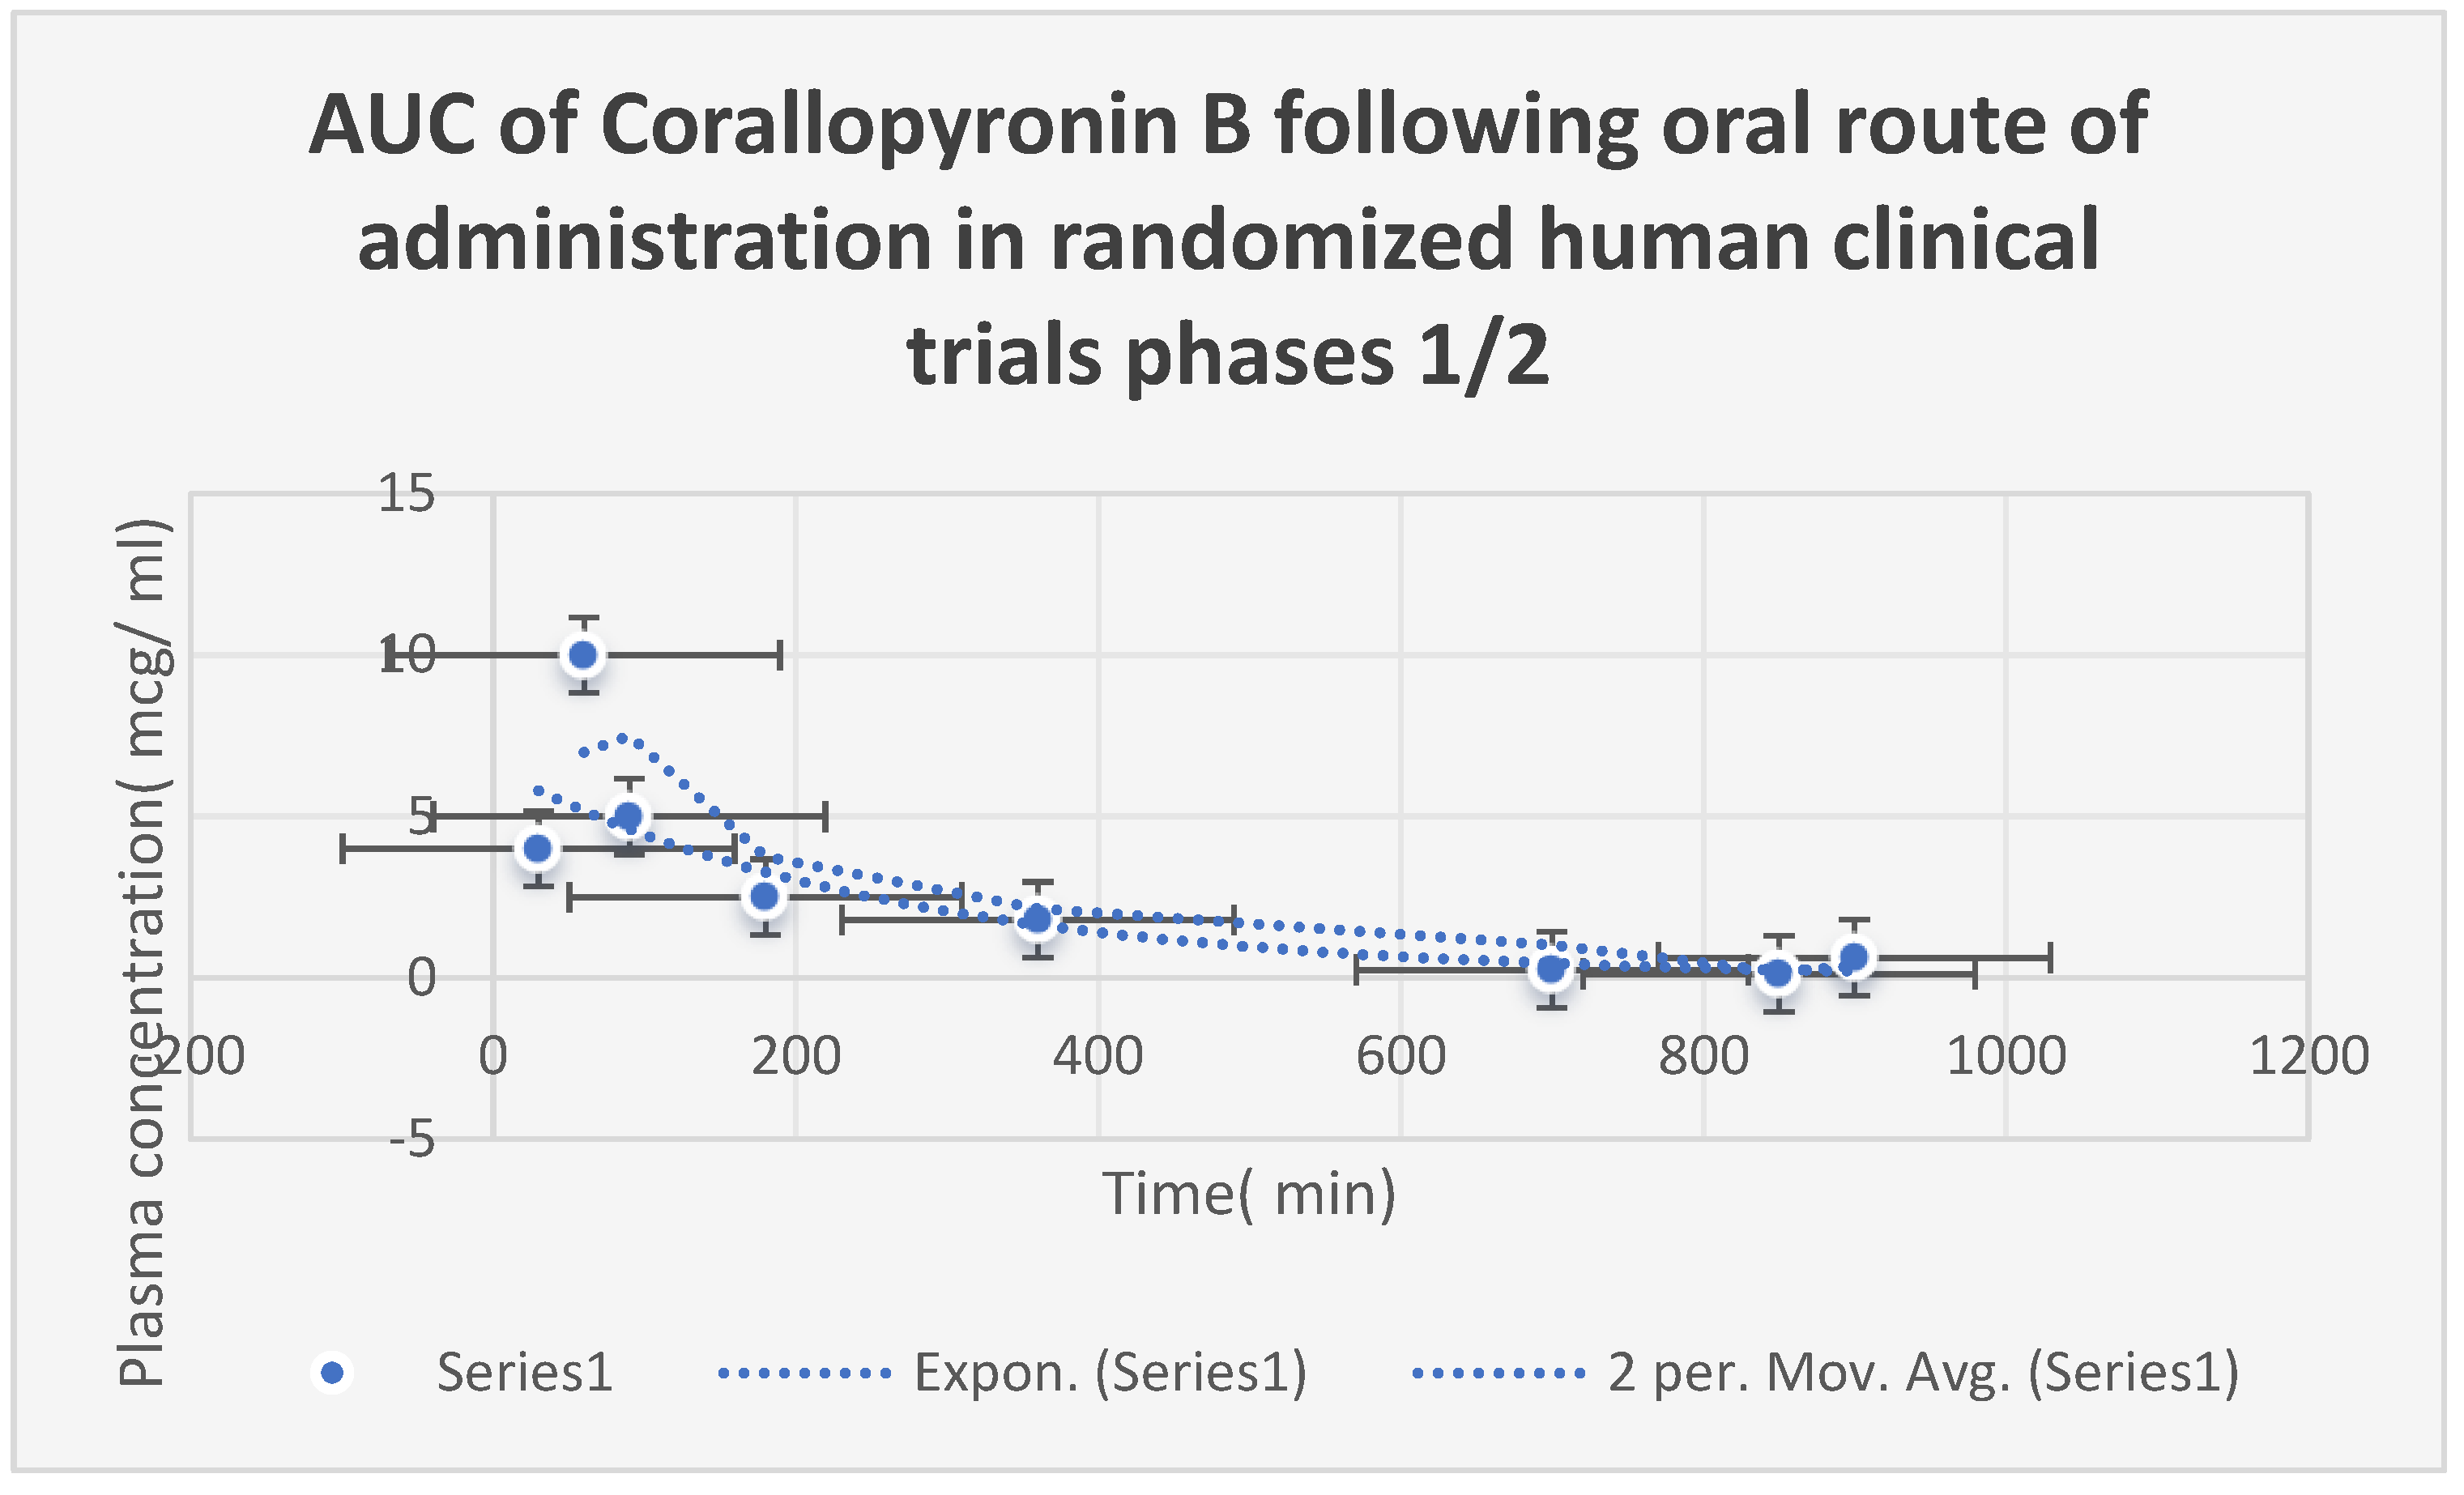
C31H43NO7. The area under the curve (
AUC) after
oral Corallopyronin B dosing during
phases 1/2 of clinical trials is shown in
Figure 9. The range of effective doses was
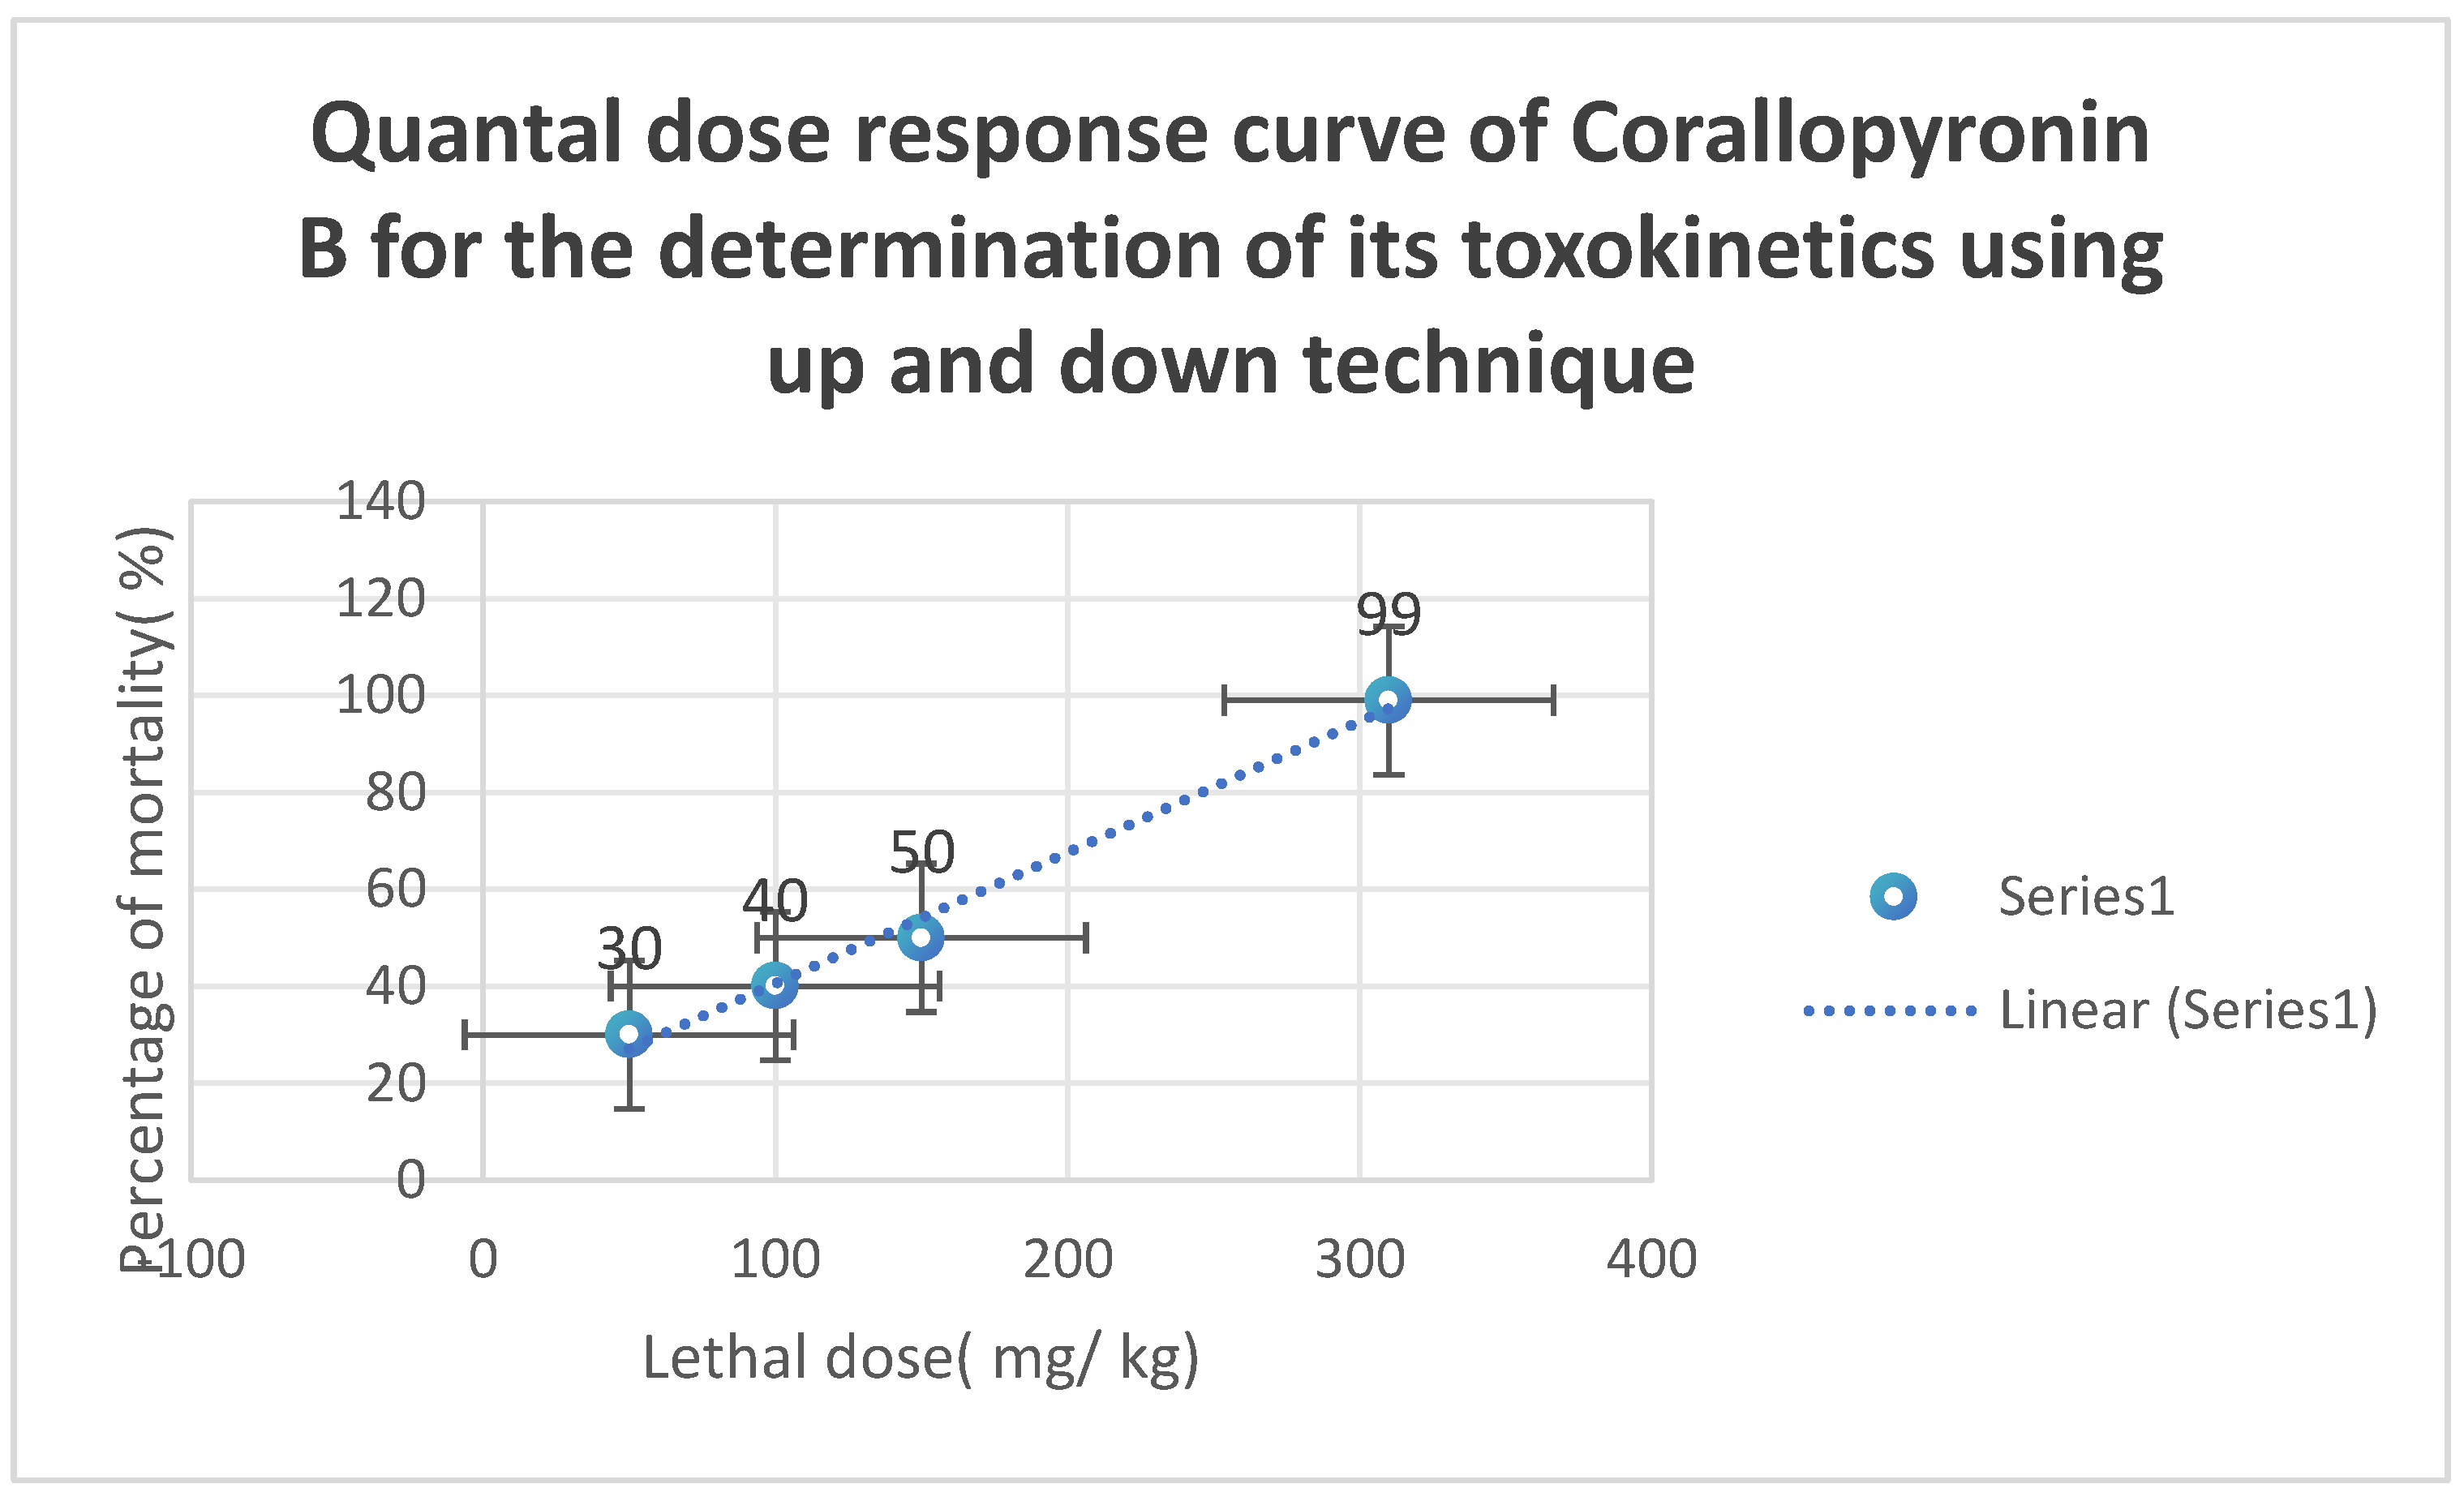
9.5–10 mg/kg of body weight. The action started after over thirty minutes. It adhered to the kinetics of first-order elimination. The quantal dosage response curve for the assessment of
Corallopyronin B’s toxicokinetics is displayed in
Figure 10. It was discovered that
LD50% was
150 mg/kg and
LD99% was around
310 mg/kg.
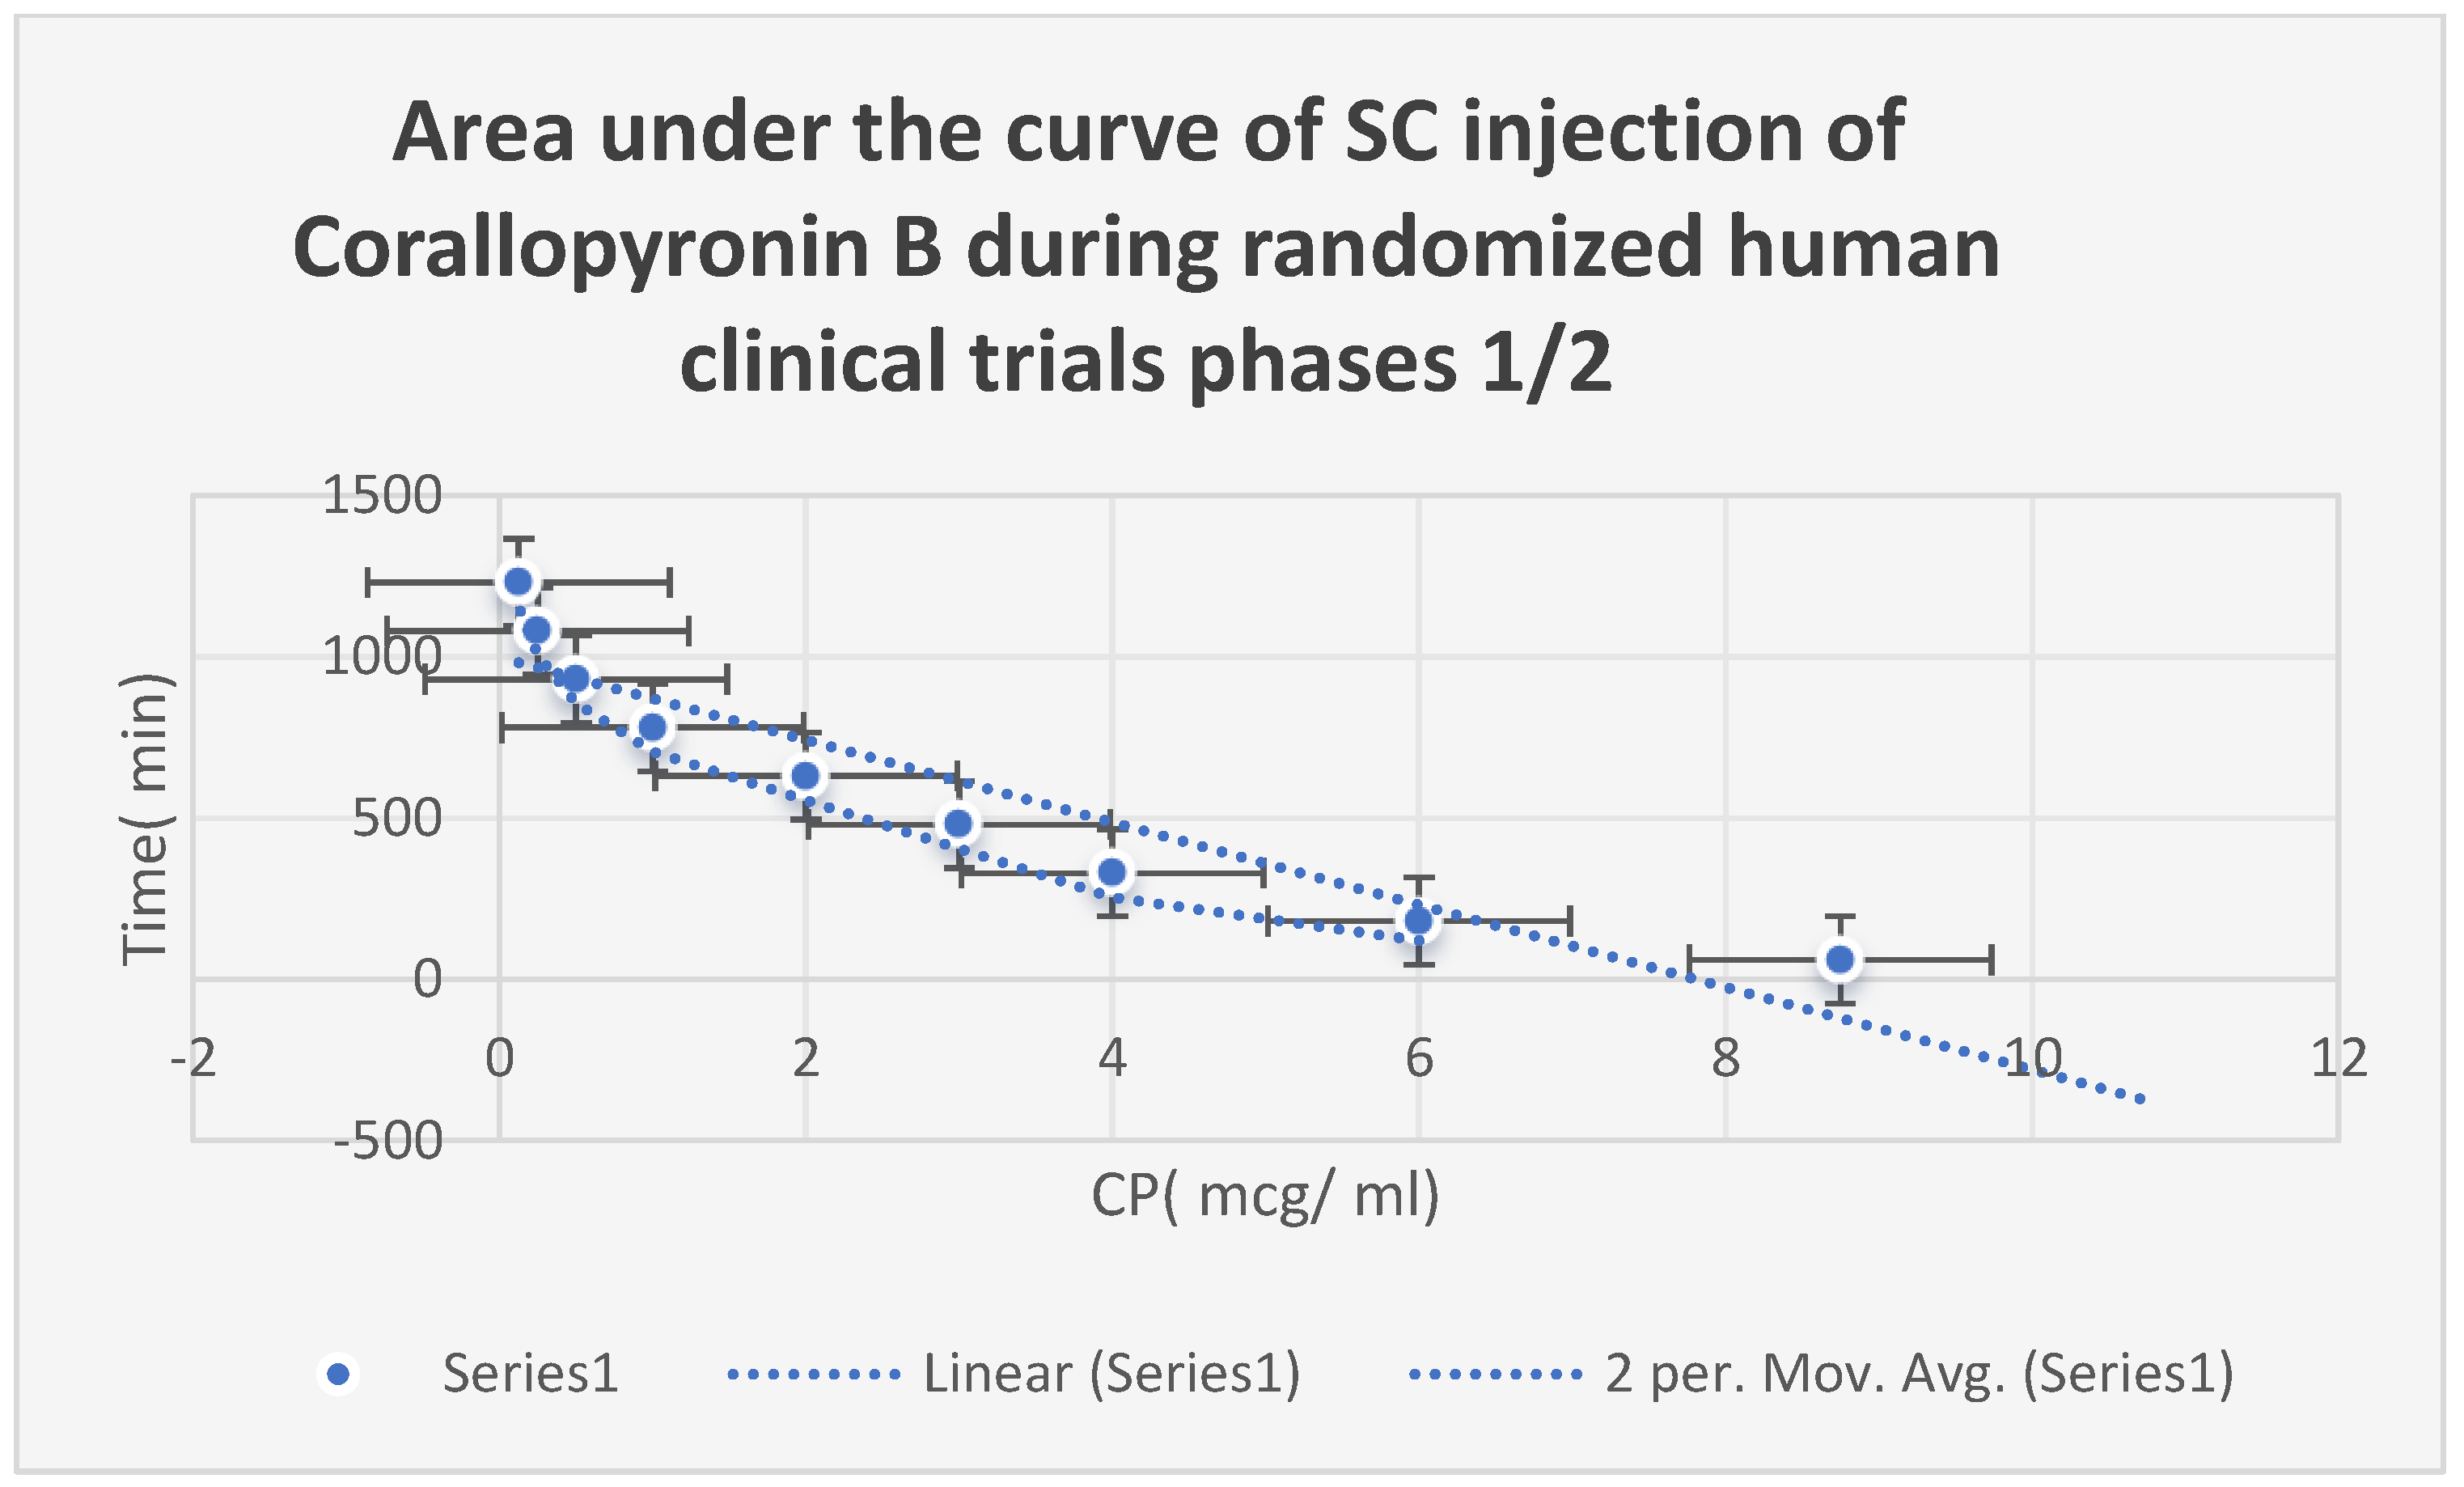
The AUC of
Corallopyronin B after
SC injection in
phases 1/2 of randomized human clinical trials is displayed in
Figure 8. The range of effective doses was
8–9 mg/kg of body weight. The beginning of the action was noted after a close
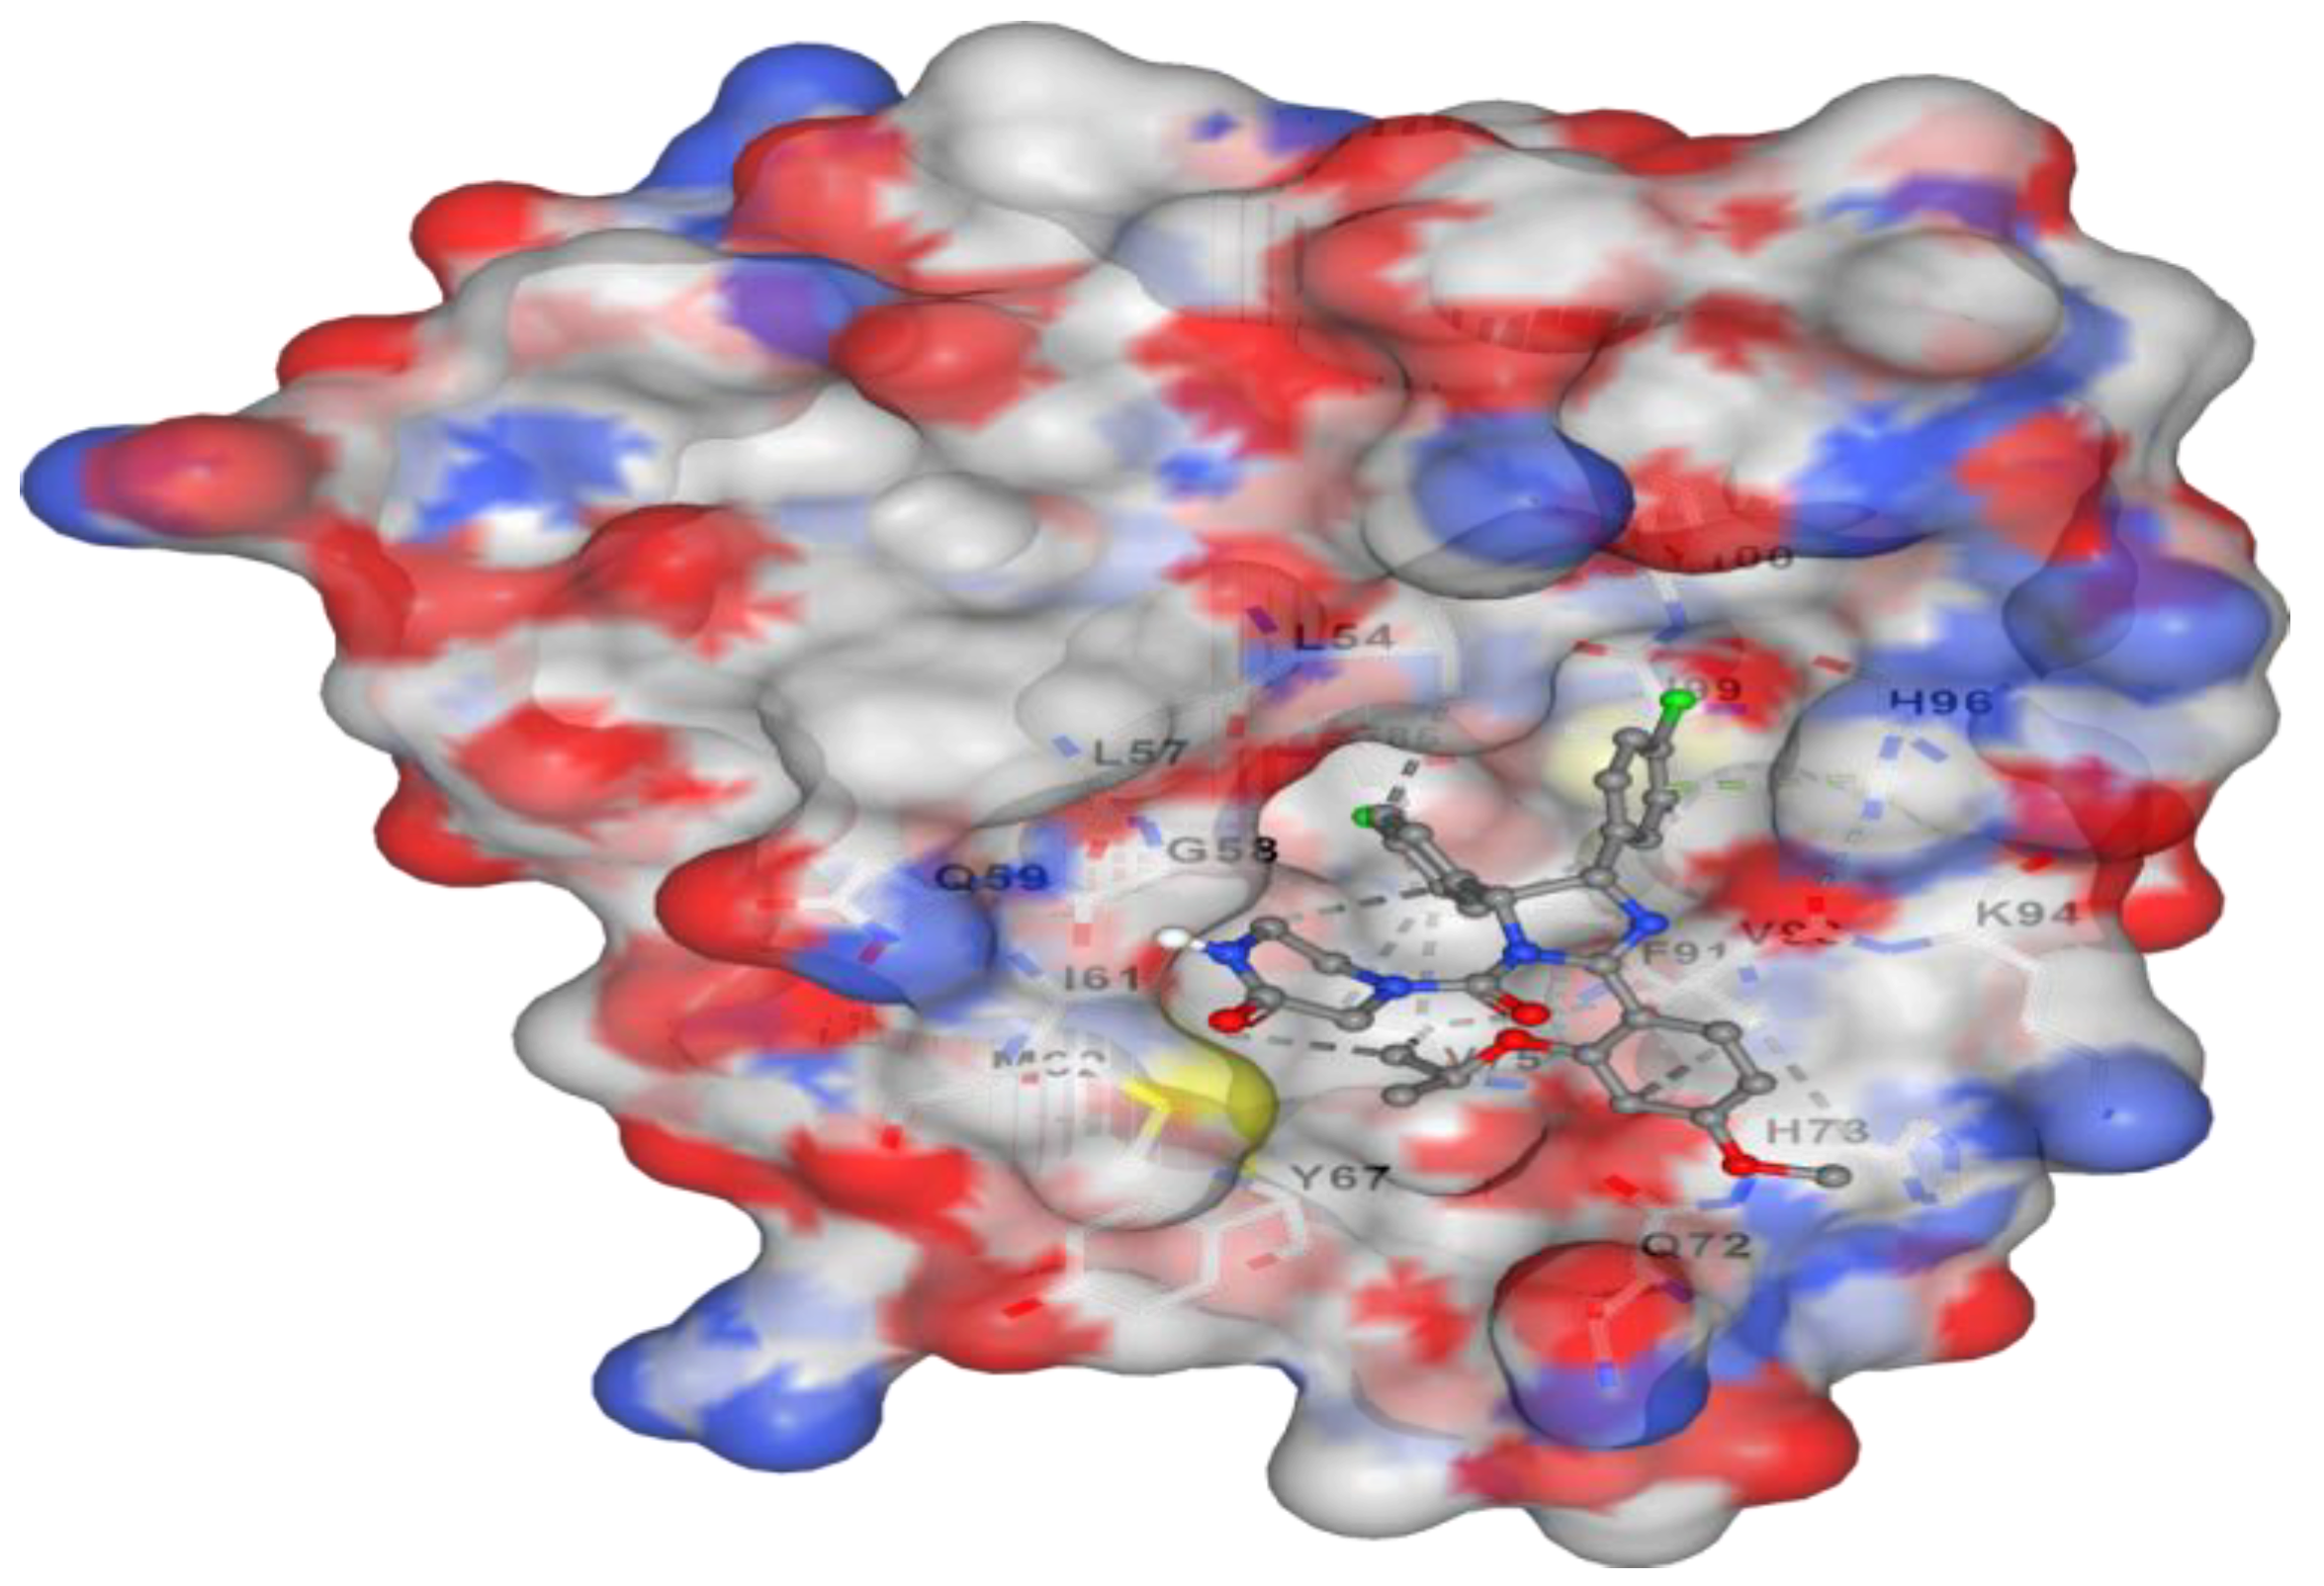
15 minutes. It adhered to the kinetics of first-order elimination. The docking of the
Corallopyronin B ligand on Bacterial
RNA polymerase is shown in
Figure 2. High affinity and an inhibitory impact were demonstrated by
Corallopyronin B towards the
RNA Polymerase switch region.
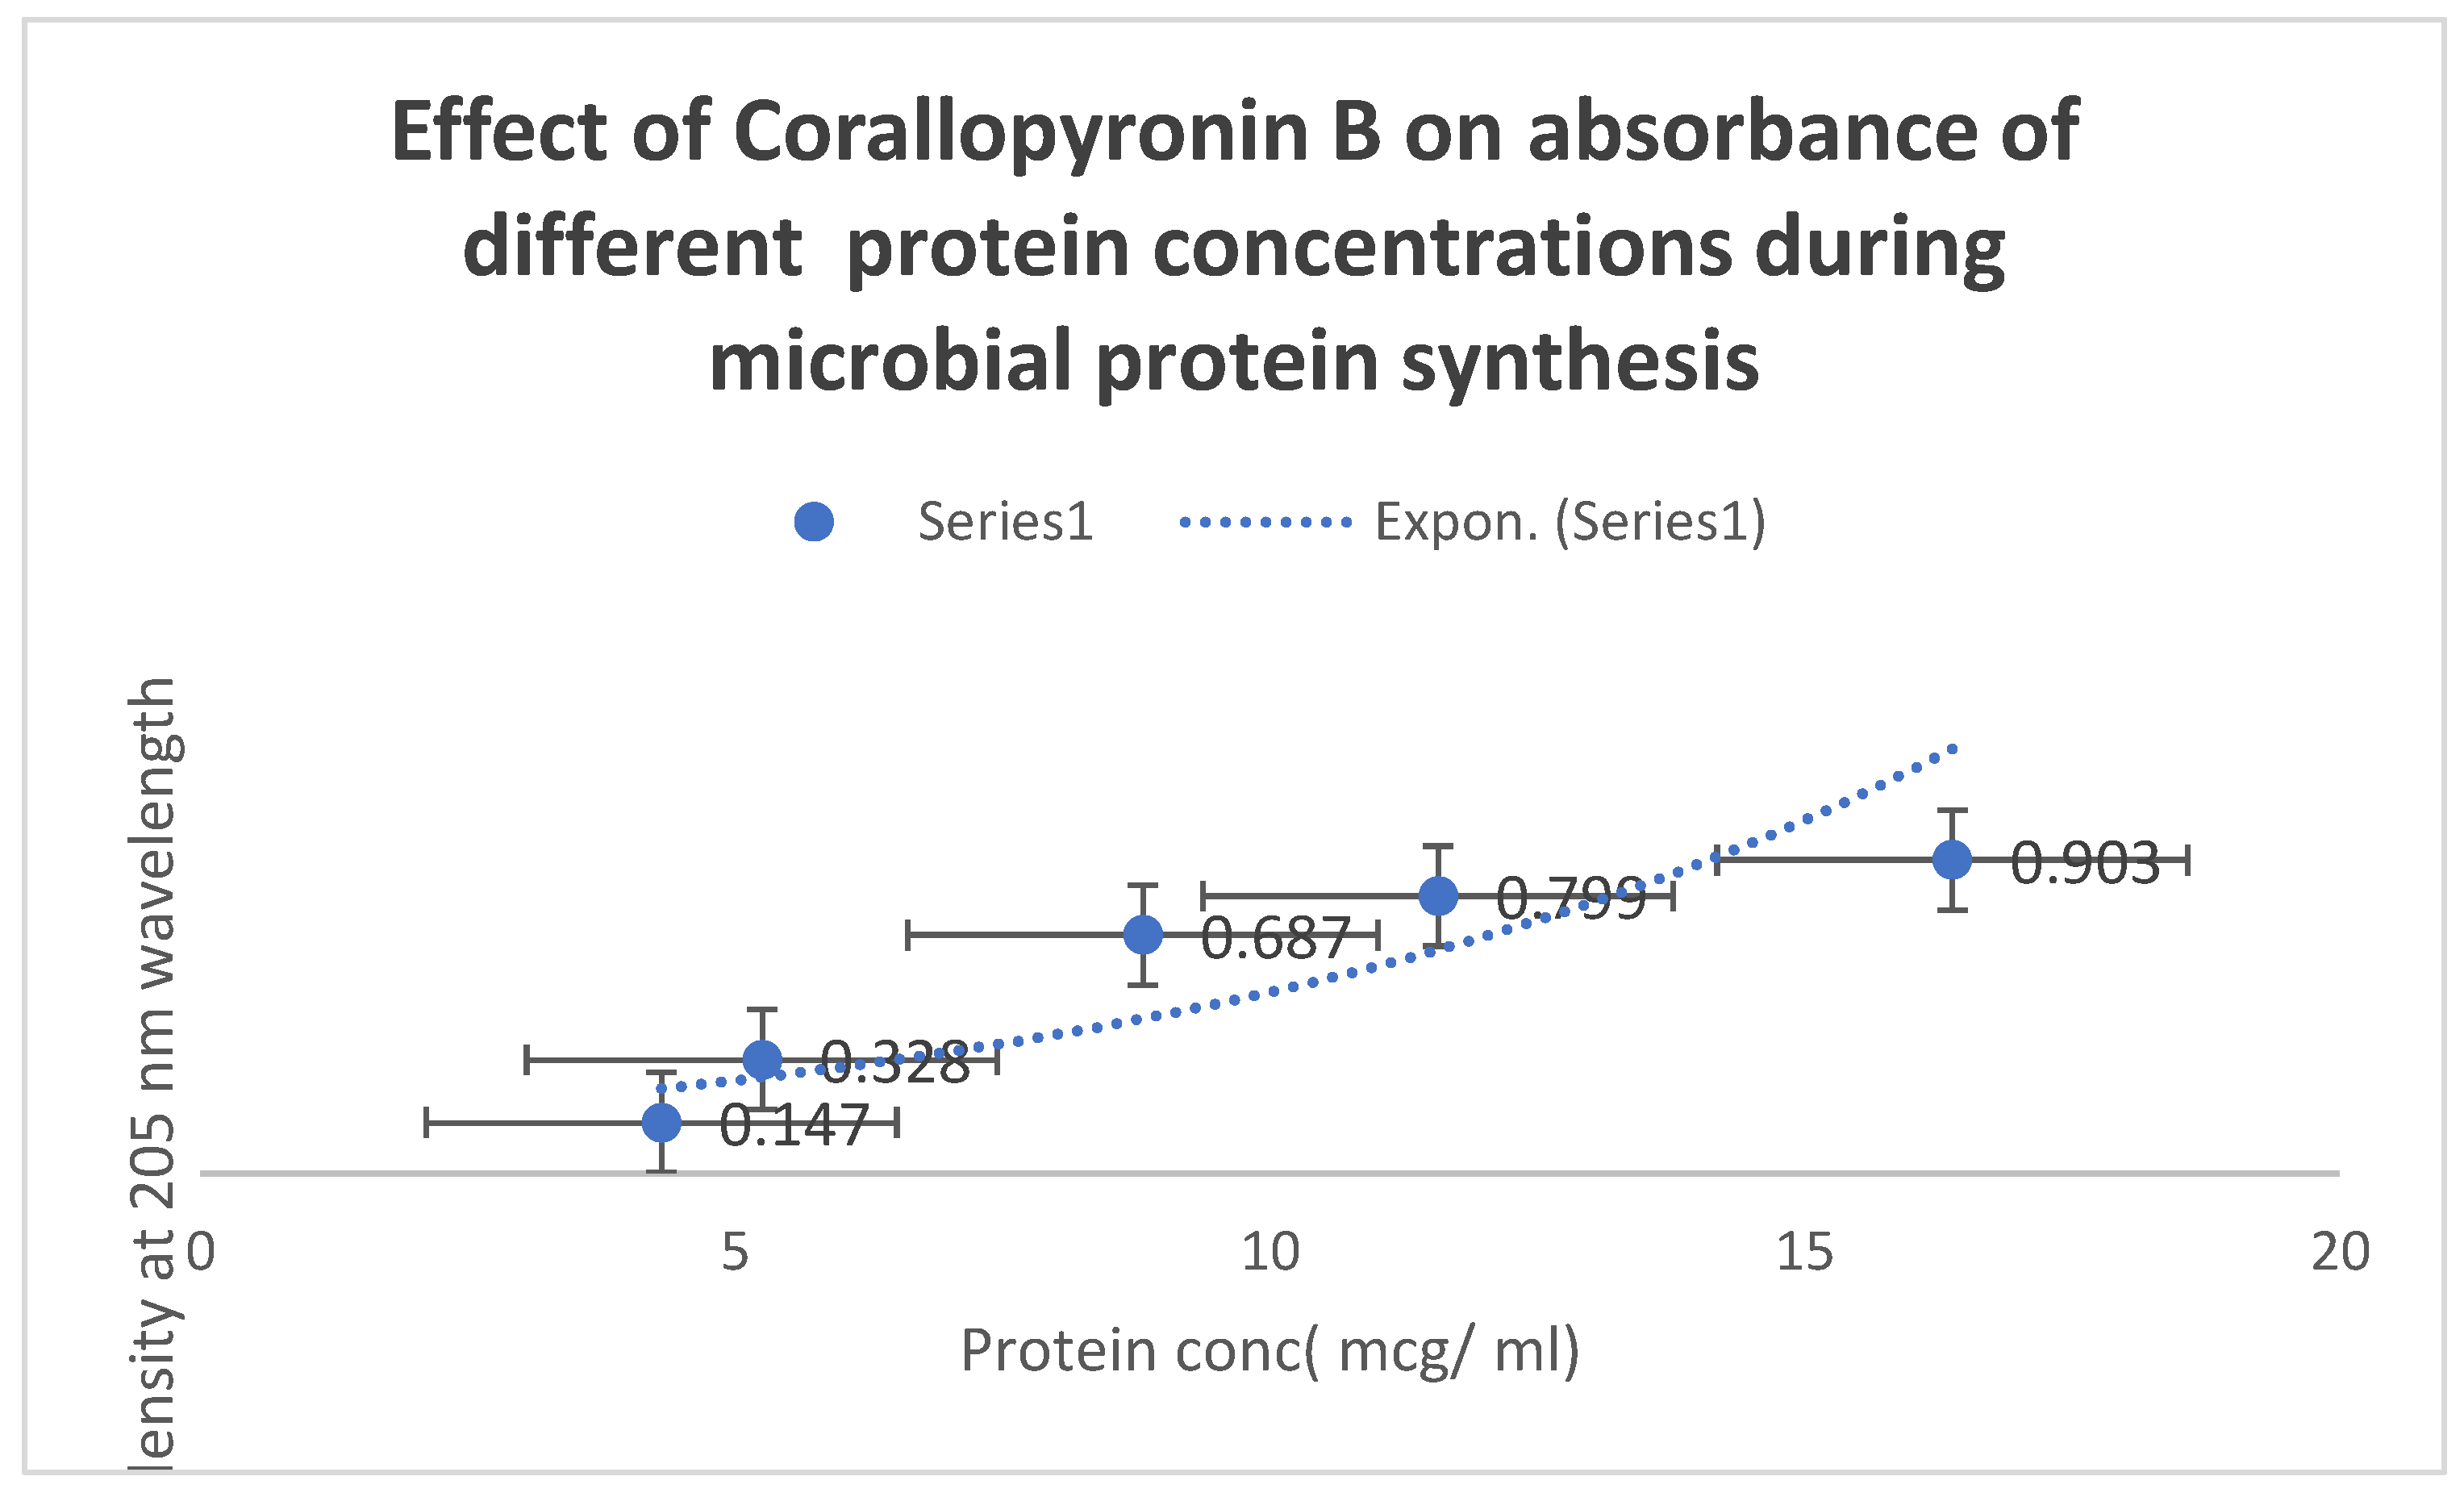
Figure 7 uses the
UV spectrophotometer absorbance at
205 nm to illustrate how
Corallopyronin B affects protein synthesis. A significant reduction in protein synthesis was seen upon administration of escalating dosages of the antibiotic
Corallopyronin B.
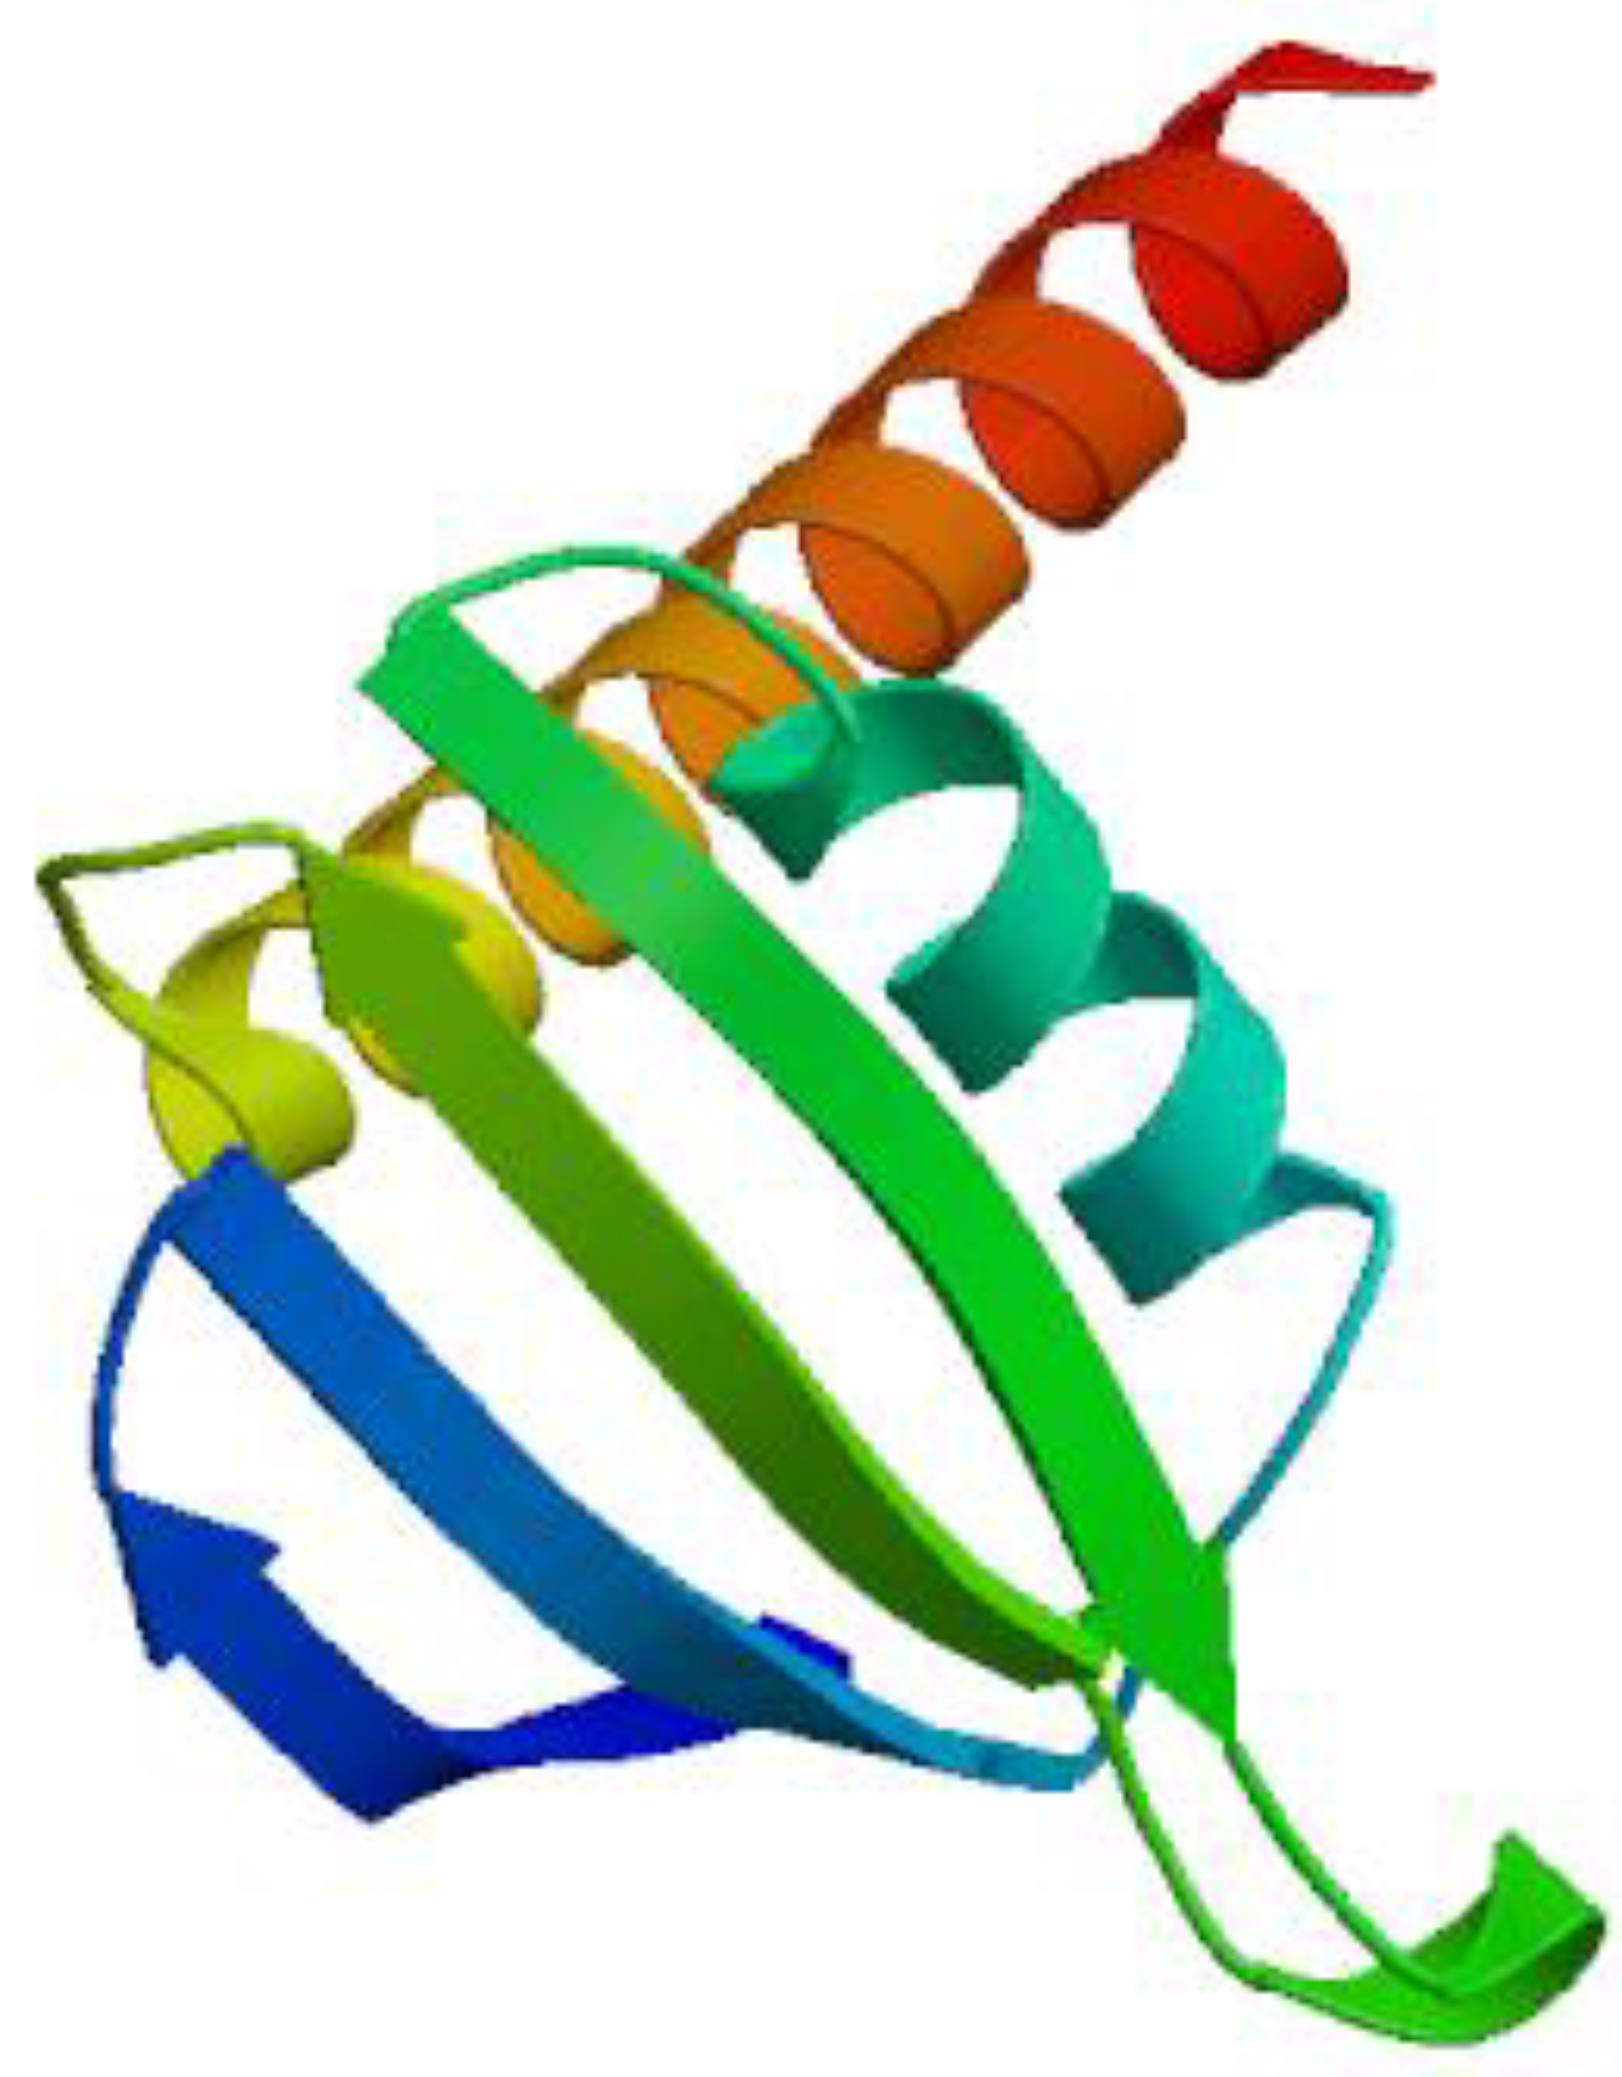
The three-dimensional structure of bacterial prokaryotic
RNA polymerase is depicted in
Figure 3. This structure includes the switch binding site, to which
Corallopyronin B Ligand binds strongly, inhibiting the activity of bacterial
RNA polymerase selectively, which in turn causes the inhibition of
mRNA transcription and ultimately the death of the microbe.
Alpha and
Beta spiral sheets make up the
RNA polymerase enzyme’s secondary structure. It had a molecular mass of about
198 amino acids.
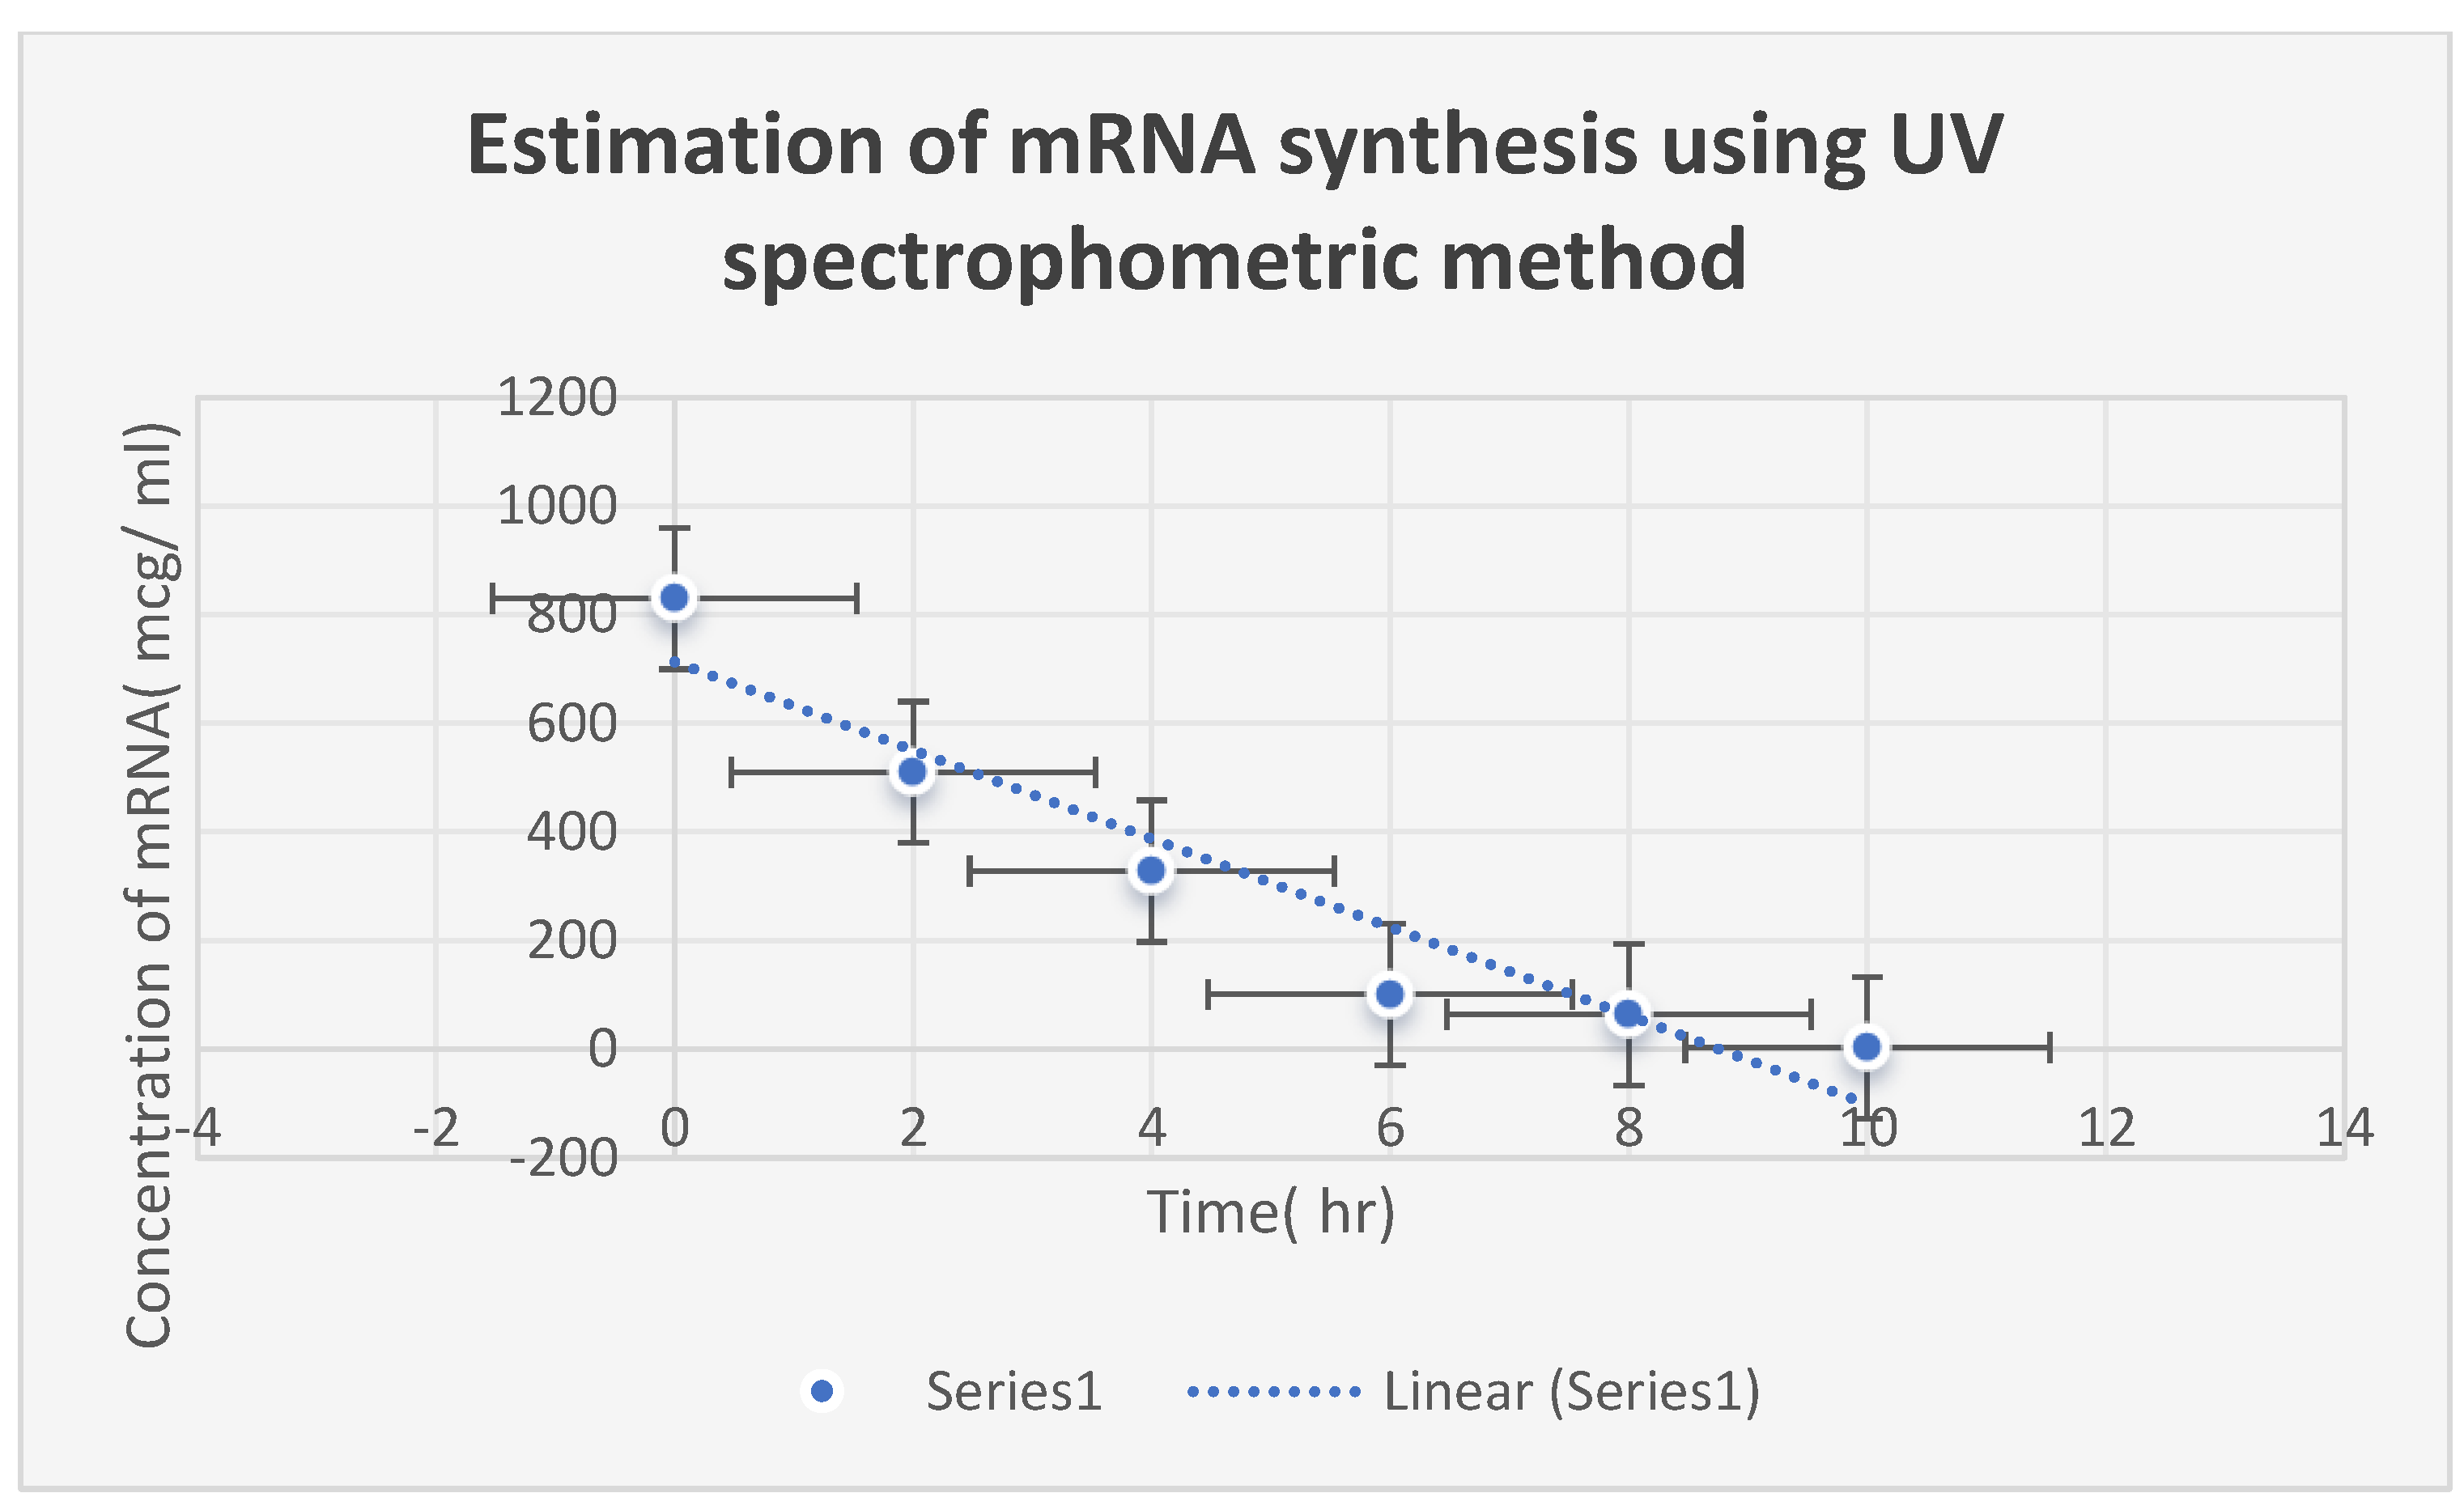
Figure 6 speaks about estimating Corallopyronin B’s impact on the productivity of microbial
mRNA. An increase in the dosage of the antibiotic
Myxopyronin B was found to cause a commensurate decrease in
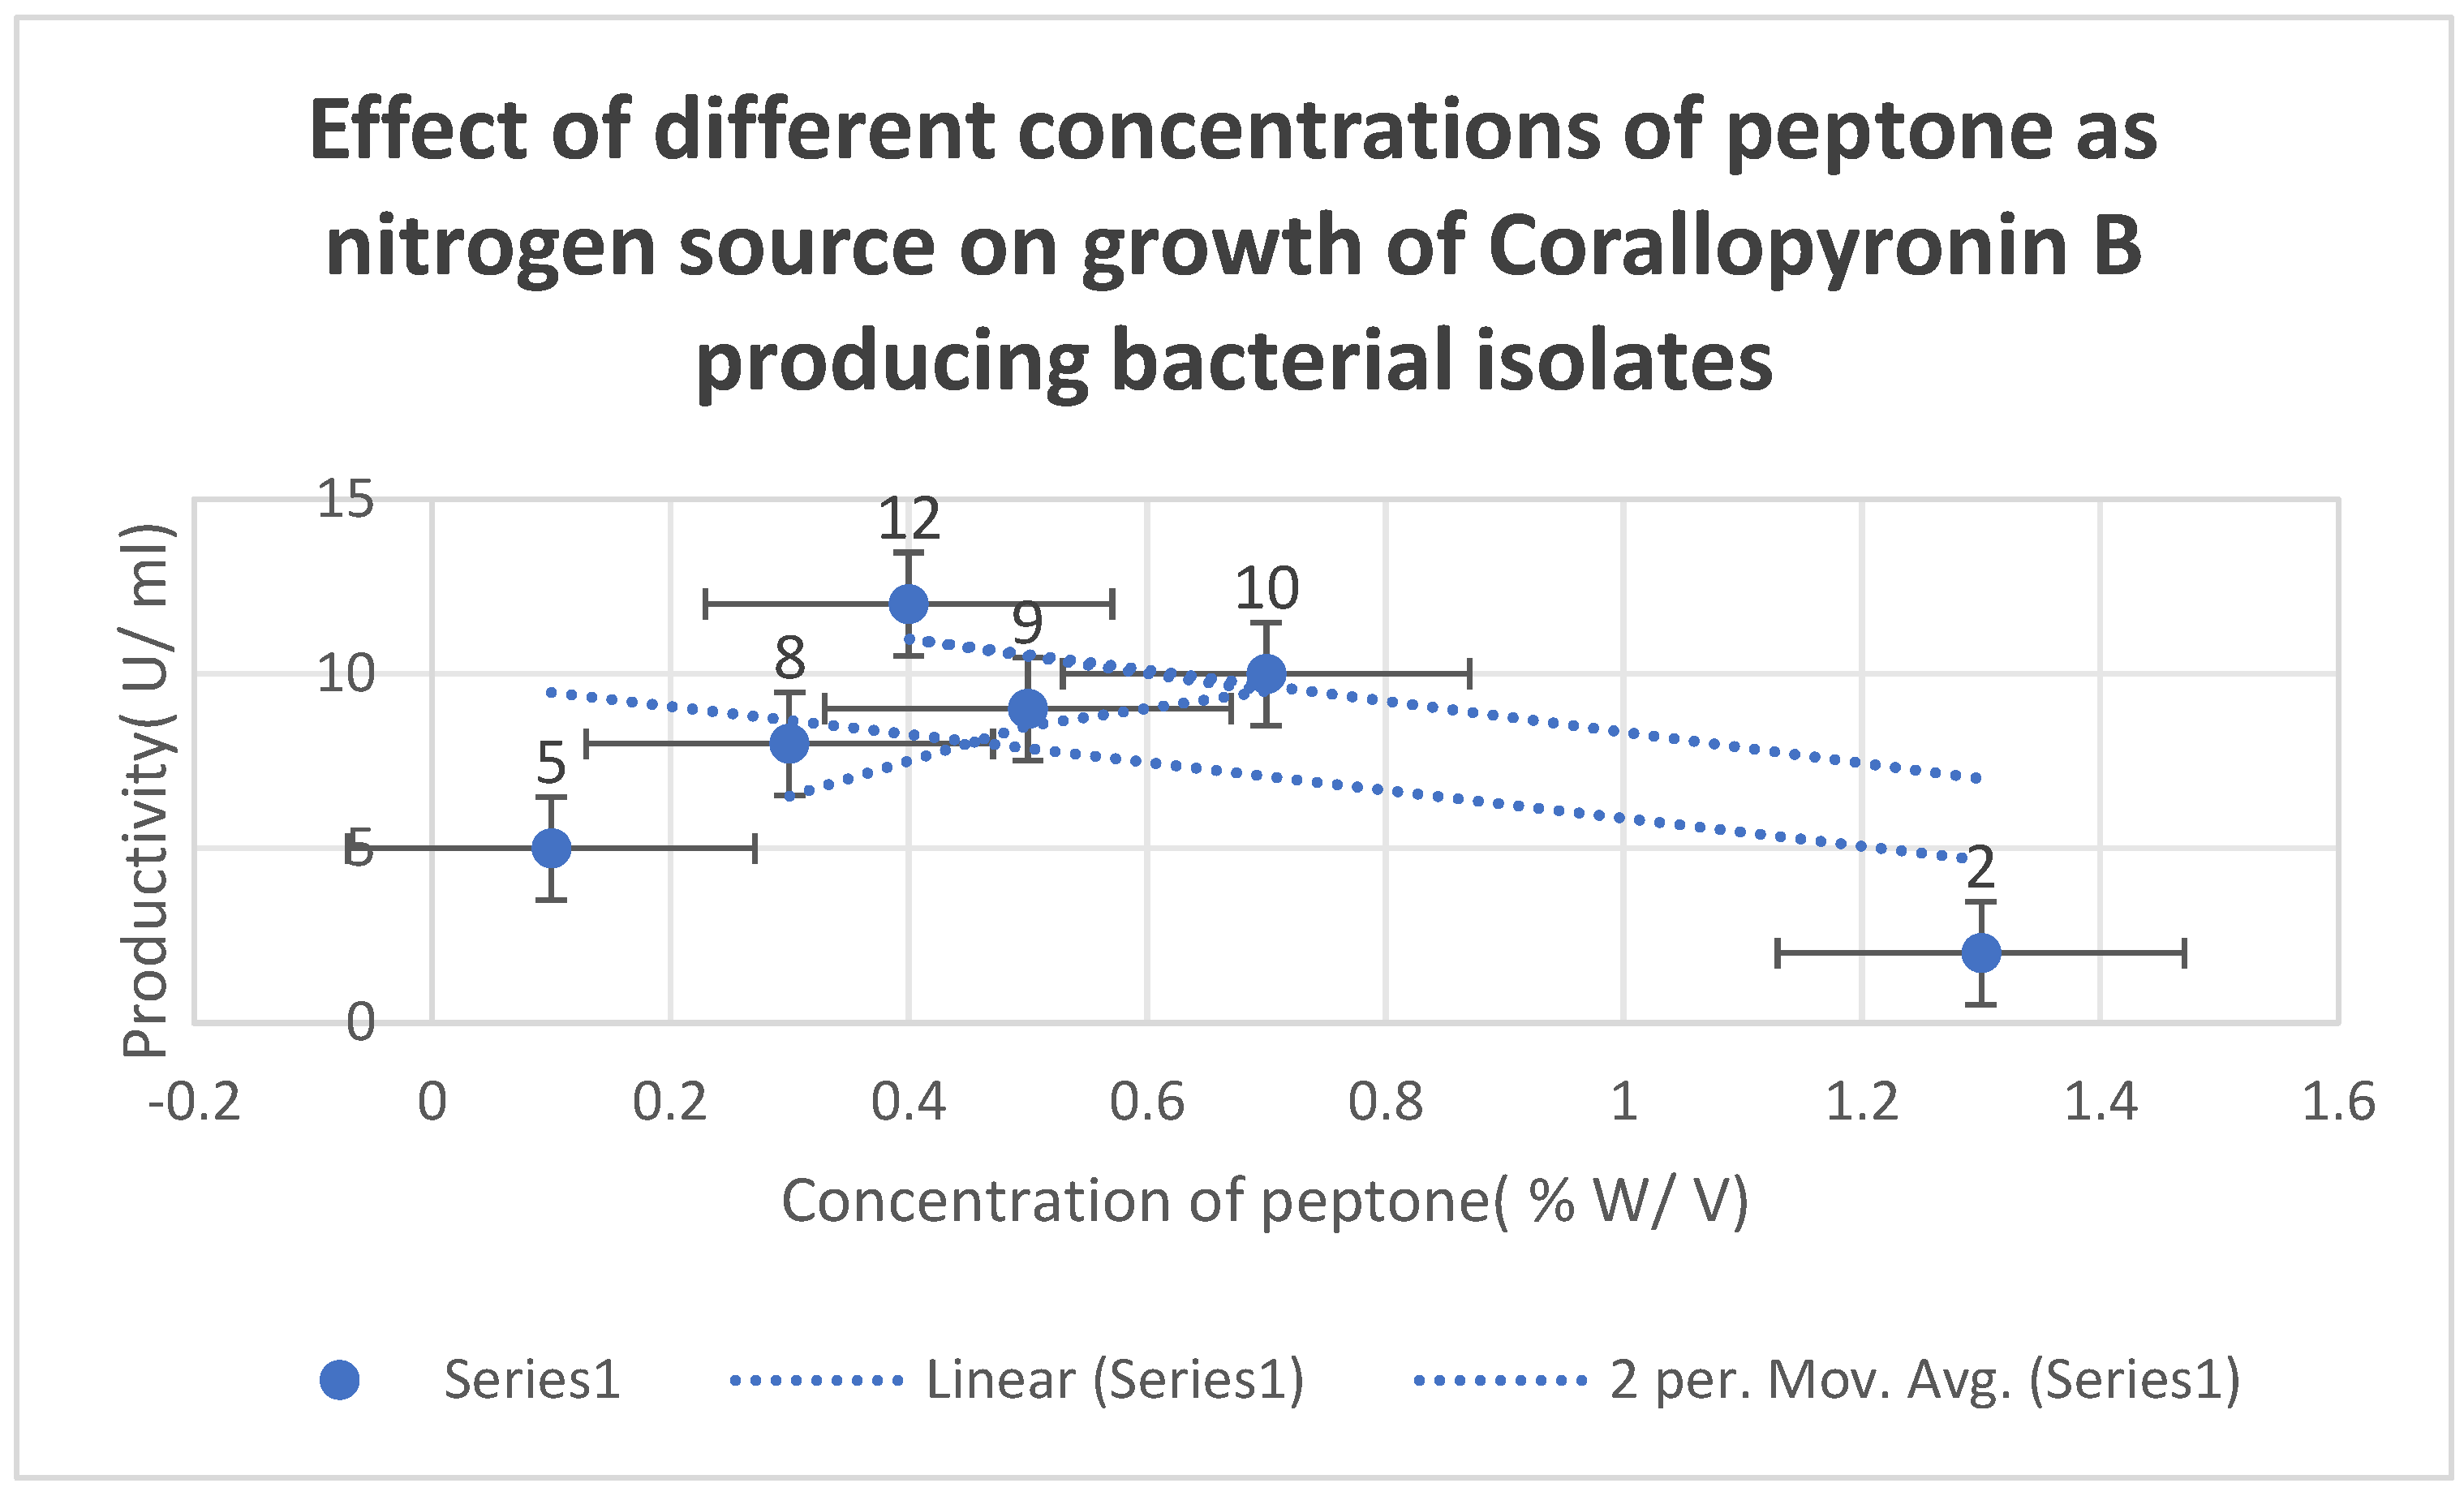
mRNA production. The effects of varying peptone concentrations as a nitrogen growth factor on
Corallopyronin B production are depicted in
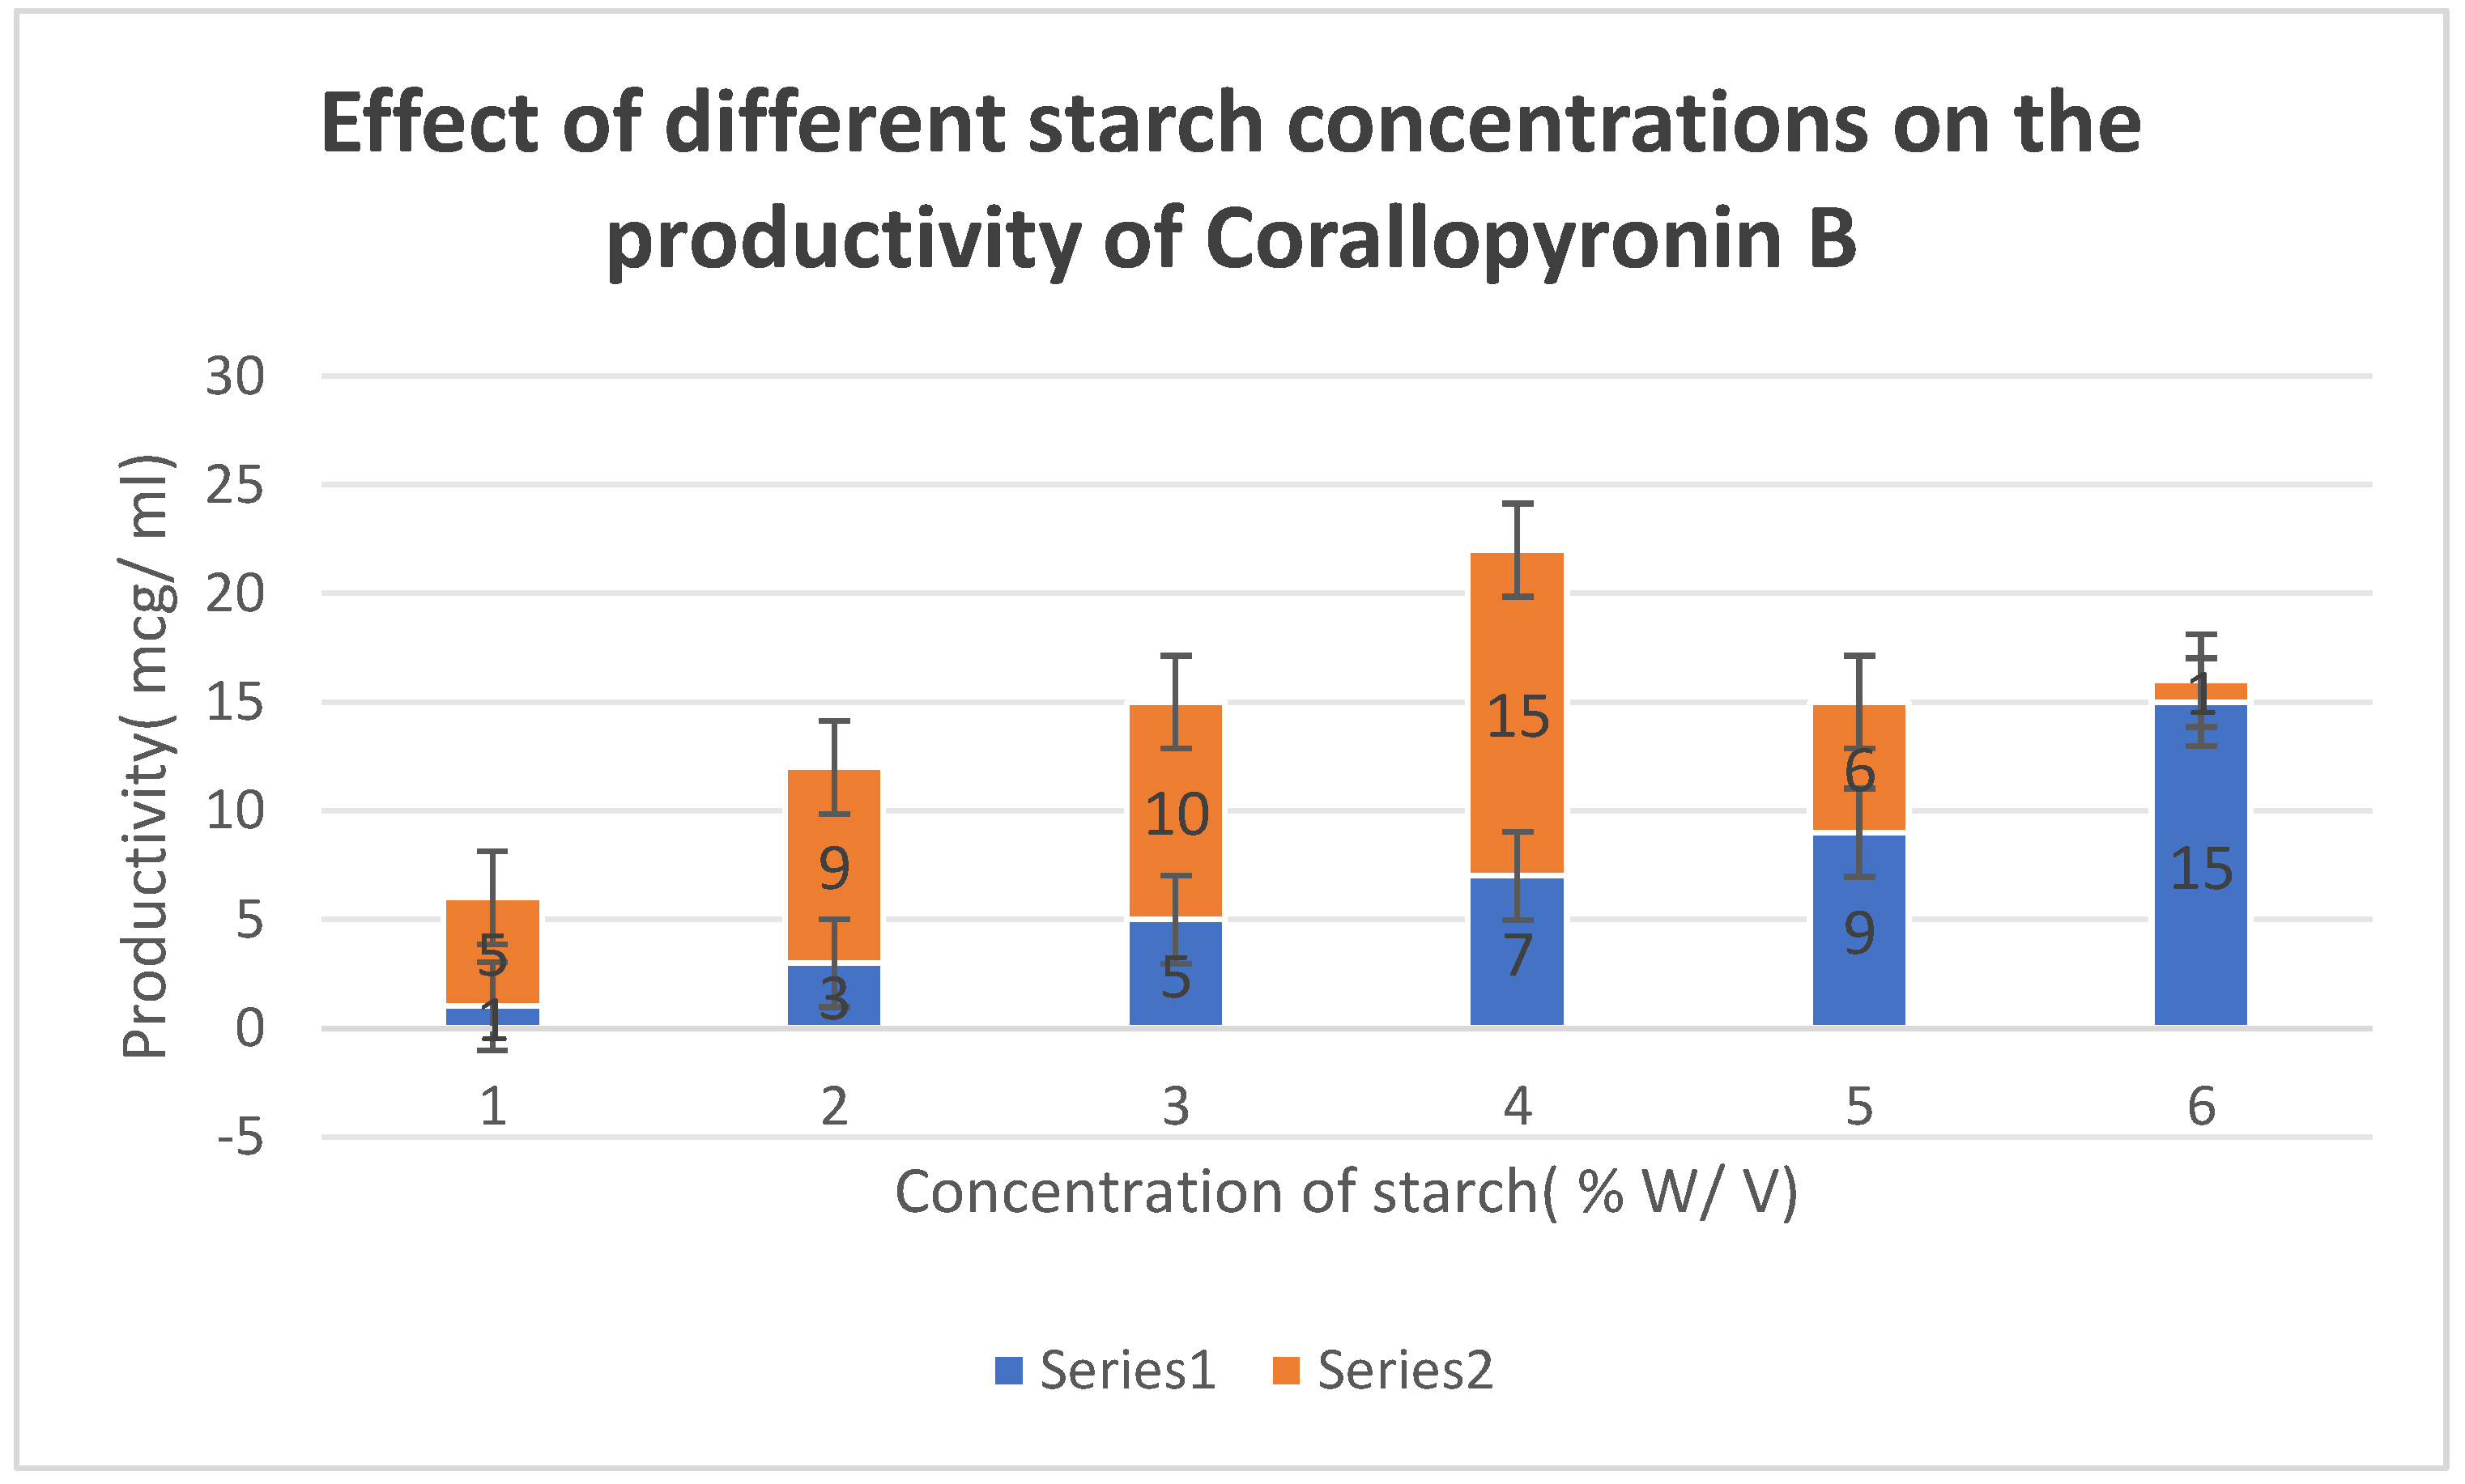
Figure 5. The effect of different soluble starch concentrations on the synthesis of
Corallopyronin B is depicted in
Figure 4. The resolution of biological reactions is shown in
Table 11.
Table 8 uses
the Broth microdilution technique to show the minimum bactericidal concentrations (
MBCs) of
Corallopyronin B on various bacteria. The measurement of the amount of
mRNA using a
UV spectrophotometer at
260 nm following the addition of
Corallopyronin B is displayed in
Table 9. The distribution of bacterial isolates that produce
Corallopyronin B is displayed in
Table 3. The degree of purity of the test antibiotics after they were purified using
the reversed-phase HPLC process is shown in
Table 4.
Table 5 shows how to use
BLASTn software to detect
16S rRNA in isolates that produce
Corallopyronin B.
Table 7 shows
Corallopyronin B’s minimum inhibitory concentrations (
MICs) on several bacteria using the broth microdilution method.
Corallopyronin B’s zones of inhibition and minimum inhibitory concentrations are estimated using the Agar diffusion assay with paper discs, as shown in
Table 6.
Figure 1.
It demonstrates the structure of Corallopyronin B extracted from bacterial isolates Corallococcus coralloides DSM 2259 collected from different soil environments in Egypt. The molecular formula of the purified test antibiotic was noticed to be C31H43NO7 determined through a mass spectrometer.
Figure 2.
It represents the docking of Corallopyronin B ligand on Bacterial RNA polymerase. Corallopyronin B showed high affinity and inhibitory effect towards the switch region of RNA Polymerase. The molecular mass of Corallopyronin B was observed to be nearly 540 Da. ∆G was found to be roughly 15 J/mol; nevertheless, it was discovered that the test antibiotic’s Kd near the switch area was roughly -720 nM.
Figure 3.
It demonstrates the 3D structure of bacterial prokaryotic RNA polymerase comprising the switch binding site to which Corallopyronin B Ligand is strongly bound inhibiting bacterial RNA polymerase activity selectively leading to the inhibition of mRNA transcription and subsequently the mortality of the microbe. The secondary structure of the RNA polymerase enzyme consisted of spiral alpha and beta sheets. Its molecular mass was approximately 198 amino acids.
Figure 4.
It shows the impact of various concentrations of Soluble starch on the production of Corallopyronin B.
Figure 4.
It shows the impact of various concentrations of Soluble starch on the production of Corallopyronin B.
Figure 5.
It shows the effects of different Peptone concentrations as a nitrogen growth factor on the productivity of Corallopyronin B.
Figure 5.
It shows the effects of different Peptone concentrations as a nitrogen growth factor on the productivity of Corallopyronin B.
Figure 6.
It refers to the estimation of the effect of Corallopyronin B on microbial mRNA productivity. mRNA synthesis was detected to be diminished proportionately upon employment of exploding doses of Myxopyronin B antibiotic.
Figure 6.
It refers to the estimation of the effect of Corallopyronin B on microbial mRNA productivity. mRNA synthesis was detected to be diminished proportionately upon employment of exploding doses of Myxopyronin B antibiotic.
Figure 7.
It demonstrates the influence of Corallopyronin B on protein synthesis using UV spectrophotometer absorption at 205 nm. Protein synthesis was noticed to be decreased dramatically upon utilization of increasing doses of Corallopyronin B antibiotic.
Figure 7.
It demonstrates the influence of Corallopyronin B on protein synthesis using UV spectrophotometer absorption at 205 nm. Protein synthesis was noticed to be decreased dramatically upon utilization of increasing doses of Corallopyronin B antibiotic.
Figure 8.
It shows the AUC of Corallopyronin B following SC administration in randomized human clinical trials stages 1/2. Efficacious dose ranged from 8-9 mg/ kg of body weight. The onset of action was observed following closely 15 minutes. It followed the first order of elimination kinetics. Bioavailability approximately reached 96%.
Figure 9.
Area under the curve (AUC) following oral administration of Corallopyronin B during clinical trials phases 1/2. Efficacious dose ranged from 9.5-10 mg/ kg of body weight. The onset of action was observed following nearly 30 minutes. It followed the first order of elimination kinetics. Bioavailability reached approximately 95%.
Figure 10.
The quantal dose-response curve for the determination of toxicokinetics of Corallopyronin B. LD50 % was found to be 150 mg/kg; while LD99 % was nearly 310 mg/ kg.
Figure 10.
The quantal dose-response curve for the determination of toxicokinetics of Corallopyronin B. LD50 % was found to be 150 mg/kg; while LD99 % was nearly 310 mg/ kg.
Figure 11.
It demonstrates the major Gram-negative bacterial isolates producing Corallopyronin B antibiotic using a Stereomicroscope.
Figure 11.
It demonstrates the major Gram-negative bacterial isolates producing Corallopyronin B antibiotic using a Stereomicroscope.
Table 3.
It shows the distribution of Corallopyronin B-producing bacterial isolates.
Table 3.
It shows the distribution of Corallopyronin B-producing bacterial isolates.
| No of +ve bacterial isolates producing Corallopyronin A |
No of -ve bacterial isolates producing Corallopyronin A
|
| 61 |
39 |
Table 4.
It demonstrates the degree of purity of test antibiotics following the purification via the reversed-phase HPLC technique:.
Table 4.
It demonstrates the degree of purity of test antibiotics following the purification via the reversed-phase HPLC technique:.
| Test antibiotic |
Degree of purity (%) |
| Corallopyronin A |
7 |
| Corallopyronin B |
90 |
| Corallopyronin C |
3 |
Table 5.
It demonstrates 16 S rRNA detection of Corallopyronin B-producing isolates using BLASTn software.
Table 5.
It demonstrates 16 S rRNA detection of Corallopyronin B-producing isolates using BLASTn software.
| Description |
Query Cover |
E value |
Per. ident |
Acc. Len |
| Corallococcus coralloid’s DSM 2259, complete genome |
100% |
0 |
100 |
10080619 |
| Corallococcus sp. NCRR chromosome, complete genome |
100% |
0 |
99.05 |
9787125 |
| Corallococcus coralloid’s strain B035 chromosome, complete genome |
100% |
0 |
98.57 |
9587888 |
| Corallococcus sp. EGB chromosome, complete genome |
100% |
0 |
96.83 |
9431171 |
| Myxococcus fulvus 124B02, complete genome |
100% |
0 |
92.08 |
11048835 |
| Myxococcus sp. MH1 DNA, complete genome |
100% |
0 |
91.92 |
10778154 |
| Myxococcus sp. SDU36 chromosome, complete genome |
100% |
0 |
91.63 |
9016985 |
| Myxococcus xanthus strain GH3.5.6c2 chromosome, complete genome |
100% |
0 |
91.28 |
9321034 |
| Vulgatibacter incomptus strain DSM 27710, complete genome |
99% |
2.00E-153 |
82.99 |
4350553 |
| Anaeromyxobacter sp. Fw109-5, complete genome |
99% |
1.00E-125 |
80.43 |
5277990 |
| Uncultured bacterium clone F5K2Q4C04IF4QS 23S ribosomal RNA gene, partial sequence |
77% |
3.00E-122 |
83.53 |
492 |
| Uncultured bacterium clone F5K2Q4C04I5GUV 23S ribosomal RNA gene, partial sequence |
77% |
6.00E-114 |
82.73 |
491 |
Table 6.
It shows the estimation of zones of inhibition and minimum inhibitory concentrations of Corallopyronin B via Agar diffusion assay using paper discs.
Table 6.
It shows the estimation of zones of inhibition and minimum inhibitory concentrations of Corallopyronin B via Agar diffusion assay using paper discs.
| Test organism 1
|
MIC (µg/ ml) |
Diameter of inhibition zone (mm) |
| Bacillus subtilis |
5 |
10 |
| Staphylococcus aureus |
6 |
16 |
| Streptococcus pneumonae |
10 |
7 |
| Escherichia coli |
119 |
13 |
| Pseudomonas aeruginosa |
129 |
0 |
| Candida albicans |
114 |
0 |
| Sacchromyces cerevisiae |
109 |
0 |
| Salmonella typhimurium |
137 |
15 |
| Bacillus cereus |
14 |
12 |
| Micrococcus luteus |
18 |
7 |
| Serratia Marcescens |
140 |
10 |
| Mucor hiemalis |
0 |
19 |
| Shigella dysentery |
109 |
14 |
| Proteus mirabilis |
123 |
8 |
| Rickettsiae prowazaki |
146 |
11 |
| Chlamydiae pneumonae |
125 |
19 |
| Legionella pneumophilla |
116 |
9 |
Table 7.
It demonstrates MICs of Corallopyronin B on different microorganisms using broth microdilution techniqu:.
Table 7.
It demonstrates MICs of Corallopyronin B on different microorganisms using broth microdilution techniqu:.
| Pathogenic m.o |
MIC (µg/ ml)
|
| Bacillus subtilis |
10 |
| Bacillus cereus |
7 |
| Staphylococcus aureus |
9 |
| Pneumococci |
6 |
| E.coli |
127 |
| Pseudomonas aeruginosa |
0 |
| Candida albicans |
0 |
| Sacchromyces cerevisiae |
0 |
| Salmonella typhimurium |
109 |
| Haemophilus influenza |
0 |
| Gonococci |
105 |
| meningococci |
134 |
| Serratia Marcescens |
129 |
| Mucor hiemalis |
0 |
| Shigella dysenteriae |
111 |
| Micrococcus luteus |
0 |
| Proteus mirabilis |
0 |
| Rickettsiae prowazaki |
139 |
| Chlamydiae pneumonae |
131 |
| Legionella pneumophilla |
146 |
Table 8.
It demonstrates Minimum bactericidal concentrations (MBCs) of Corallopyronin B on different microorganisms using the Broth microdilution technique.
Table 8.
It demonstrates Minimum bactericidal concentrations (MBCs) of Corallopyronin B on different microorganisms using the Broth microdilution technique.
| Pathogenic m.o |
MBC (µg/ ml) |
| Bacillus subtilis |
24 |
| Bacillus cereus |
23 |
| Staphylococcus aureus |
39 |
| Pneumococci |
44 |
| E.coli |
338 |
| Pseudomonas aeruginosa |
399 |
| Candida albicans |
0 |
| Sacchromyces cerevisiae |
0 |
| Salmonella typhimurium |
320 |
| Haemophilus influenza |
0 |
| Gonococci |
380 |
| meningococci |
377 |
| Serratia Marcescens |
307 |
| Mucor hiemalis |
0 |
| Shigella dysenteriae |
309 |
| Micrococcus luteus |
0 |
| Proteus mirabilis |
0 |
| Rickettsiae prowazaki |
400 |
| Chlamydiae pneumonae |
416 |
| Legionella pneumophilla |
252 |
Table 9.
It shows the estimation of mRNA quantity via UV spectrophotometer at 260 nm after the addition of Corallopyronin B.
Table 9.
It shows the estimation of mRNA quantity via UV spectrophotometer at 260 nm after the addition of Corallopyronin B.
|
mRNA concentration (ng/ ml) |
Absorbance (optical density) at 260 nm |
| 600 |
0.729 |
| 567 |
0.501 |
| 204 |
0.247 |
| 25 |
0.093 |
Table 10.
It shows the effect of Corallopyronin A on microbial protein synthesis using a UV spectrophotometer at 205 nm.
Table 10.
It shows the effect of Corallopyronin A on microbial protein synthesis using a UV spectrophotometer at 205 nm.
| Bacterial protein concentration (mcg/ ml) |
Time (hr) |
| 91.3 |
2 |
| 45.96 |
4 |
| 28.38 |
7 |
| 3.37 |
10 |
| 0.26 |
3 |
Table 11.
The resolution of biochemical reactions.
Table 11.
The resolution of biochemical reactions.
| Test |
Result |
| Gram stain |
-ve rods |
| Cell shape |
Elongated bacilli with tapered ends |
| Spore shape |
Ellipsoidal |
| Spore site |
Central |
| Motility |
+ via gliding |
| Catalase |
+ |
| Oxidase |
- |
| Blood haemolysis |
- |
| Indol |
- |
| Methyl red |
- |
| Nitrate reduction test |
+ |
| Vogues Proskauer |
- |
| Citrate utilization |
- |
| Starch hydrolysis |
+ |
| Casein hydrolysis |
+ |
| Growth at 45 ℃ |
Bacterial isolates did not grow at 45 ℃; but were grown at 10-37 ℃ |
| Tween 80 |
+ |
| Tolerance salinity |
| 5% NaCl |
- |
| 7% NaCl |
- |
| Saccharide fermentation |
| Glucose |
- |
| Fructose |
- |
| Maltose |
- |
| Sucrose |
- |
6. Discuss
Globally, exploding morbidity and mortality due to antibiotic-resistant micro-organism infections were observed. Hence, amended hindrance and touchstone of infectious diseases, as well as appropriate use of approved antibacterial drugs were essential. The in vitro and in vivo antimicrobial activity of
Corallopyronin B, a novel antibiotic was evaluated in the present study. It demonstrated excellent bactericidal activity against a broad spectrum of
G +ve bacteria with
MICs that did not exceed
20 mcg/ ml. On the other hand, It showed broad bactericidal activities against
G -ve bacteria with minimal inhibitory concentrations greater than
100 mcg/ ml. Its mechanism of action was realized during the investigation of
RNA synthesis to be via the inhibition of prokaryotic
DNA-dependant-RNA polymerase; whereas no inhibitory impact was observed for Eukaryotic one. Docking studies through
SWISS DOCK software confirmed this as well. The antibiotic activities
Corallopyronin A, B, and
C were isolated from the culture supernatant of
29 bacterial isolates of Myxobacterium
Corallococcus coralloides DSM 2259 detected molecularly using
16 S rRNA technique (
Table 3). The antibiotic activity did not inhibit the growth or kill eukaryotic cells such as human and fungal cells reflecting selectivity towards the inhibition of the growth of prokaryotic bacterial cells. This selectivity effect minimized the adverse effects noticed during the present study. Docking studies via
SWISS DOCK software revealed that desmethylation of either Corallo
pyronin A, B, or C enhanced its biological activity. Purification was performed through reversed-phase
HPLC. Corallo
pyronin B was the main refined antibiotic. Its purity degree reached approximately
90 %; while the remaining purified antibiotics were detected to be
Corallopyronin A (7 %) and C (3 %). The antibacterial activity was assessed via the determination of
MICs of the test antibiotics using the agar diffusion technique utilizing paper discs
5 mm in diameter and the broth dilution assay. The initial density of each test microorganism was about
105/ ml of the culture suspension. The
MICs of test antibiotics against
G +ve bacteria ranged from
6 to
20 mcg/ ml; Whereas
MICs reached above
100 mcg/ ml against some selected
G -ve bacteria. On the other hand, no effect was detected against the growth of fungi and yeasts. (Irschik H et al., 1983) stated that
Myxovalargin A was a novel peptide antibiotic isolated from the culture supernatant of the
myxobacterium Myxococcus fulvus strain Mx f65. It was active against
Gram-positive bacteria (
MIC 0.3 approximately
5 micrograms/ ml), at higher concentrations also against
Gram-negative ones (
MIC 6 approximately 100 micrograms/ ml), and not at all against yeasts and molds. Its mechanism of action involved the inhibition of bacterial protein synthesis [
50]. According to (Glaus F et al., 2018)
Ripostatin, a novel antibiotic, isolated from the culture supernatant of
Myxobacterium,
Sorangium cellulosum strain So ce377. On the other hand, it interfered with the bacterial
RNA synthesis [
51]. On the other hand,
Corallopyronin B was found to be structurally related to
α-pyrone antibiotics from
myxobacteria. Its ability to inhibit
RNA polymerase was through interaction with the switch region of
RNA polymerase; while
Rifampicin inhibited the same enzyme through different regions [
52]. Myxopyronin showed no phototoxicity and mutagenicity in rabbit animal models during
the preclinical trials stage, in the present study. Rare adverse effects including cholestatic jaundice were reported in less than
5 % of the experimental subjects who received the test antibiotics during
randomized human clinical trials phases 1/2. The biological half-life of
Corallopyronin B reached approximately
2.25 hours.
0.4 % peptone and
7 % soluble starch were detected to be the optimal nitrogen and carbon growth factors for bacterial isolates producing the test antibiotics, respectively (
Figure 4 and Figure 5). The high
∆G of the test antibiotic was observed to be approximately
15 J/ mole as determined via
SWISS-MODEL software reflecting high catalytic activity of the test antibiotic towards the switch region. On the other hand, low
Kd of the test antibiotic towards the switch region was found to be approximately
-720 nM using
SWISS MODEL software indicating high affinity and binding capacity. Bioavailability studies were performed using
HPLC during randomized human clinical trials phases
1/2 revealed that
Corallopyronin B reached nearly
95% oral bioavailability, 96
% IM bioavailability, and
100% IV bioavailability. Metabolic studies using
HPLC revealed that the test antibiotic showed no in vivo induction of hepatic metabolizing C
ytochrome P450 enzymatic system; while
Rifampicin induced
CYP3A4 hepatic metabolizing enzyme potently. Up and down procedure intended for the evaluation of the acute toxicity profile of the test antibiotic showed that
LD50% was about
150 mg/ kg body weight; while
LD99% reached
310 mg/ kg. On the other hand, the therapeutic margin of the test antibiotic ranged from 7
mcg/ ml to
100 mcg/ ml.
Corallopyronin B-producing bacterial isolates were gram-negative, spore-forming
obligate aerobes and
chemoorganotrophic. They were
elongated rods with
tapered ends. No
flagella were present, but the cells moved via
gliding. They fermented
Tween 80,
starch, and
casein. On the other hand, they were positive for
catalase while negative for
oxidase tests. They reduced
nitrates
And were able to grow at
10-37 ℃. A total of
150 human subjects (mean
SD age,
27.3[ 8
.6] years were enrolled and completed the study.
The 88% confidence intervals (
CIs) for the long transformed ratios of
Cmax,
AUC (0-26), and AUC (0-∞) for the test antibiotic were, in order,
93.3 to
94.6, 90.5 to 95.2, and 90.7 to 93.1, respectively. The point estimates for
Cmax in the present study were outside the limit for bio-equivalence for the
Rifampicin standard drug.
The mean PB was observed for Corallopyronin B which approximated 83
% while that of
Rifampicin reached
88% [
53]. It was noticed that plasma protein binding was proportionally increased with increasing the doses of the test antibiotic. The plasma protein binding participated in extending the
Corallopyronin B duration of action. The major protein binding for
Corallopyronin B and
Rifampicin was noticed to be
Albumin. The unbound fraction was detected to be responsible for the therapeutic activity.
