1. Introduction
The cybersecurity in the Industrial Internet of Things(IIoT) plays a crucial role in overall network security protection. The Industrial Internet connects various industrial equipment and systems, such as factory production lines, warehousing systems, and logistics systems. The security of these devices and systems is key factors for the stability and reliability of production operations. Cybersecurity measures can prevent malicious attacks or unauthorized access, ensuring that production equipment and systems remain intact and secure [
1,
2,
3]. The Industrial Internet generates vast amounts of data, including production data, equipment status data, and supply chain data. This data is vital for business decision-making and operational efficiency. Cybersecurity measures protect the confidentiality, integrity, and availability of this data, guarding against data breaches, tampering, or loss [
4,
5]. Overall, cybersecurity plays a critical role in the Industrial Internet of Things. Enterprises should prioritize cybersecurity and implement effective measures to protect Industrial Internet systems and data, ensuring stable and reliable production operations.
Typically, the architecture of IIoT is divided into three basic layers [
6]: application layer, network layer and perception layer. The application layer It is also known as the business layer,is implemented as the top layer in IIoT architecture [
7]. The application layer receives the data transmitted from network layer and uses the data to provide required services or operations. The perception layer is also known as the sensor layer,is implemented as the bottom layer in IIoT architecture [
8]. The perception layer interacts with physical devices and components through smart devices(RFID,sensors,actutors.etc.) The network layer is is also known as the transmission layer, is implemented as the middle layer in IoT architecture [
9]. The network layer is used to receive the processed information provided by perception layer and determine the routes to transmit the data and information to the IIoT hub,devices, and applications via integrated networks. The network layer is the most important layer in IoT architecture, because various devices, and various communication technologies(Bluetooth, Wi-Fi, long-term evolution, etc.) are integrated in this layer. The network layer should transmit data to or from different things or applications, through interfaces or gateways among heterogeneous networks, and using various communication technologies and protocols. In the Three-Layer Architectures, the Physical Layer is usually involved in the network layer. The Physical Layer is responsible for handling the physical characteristics related to the transmission medium, such as modulation of electrical signals, utilization of the spectrum, and control of transmission power. The physical layer security prevents direct physical attacks, such as damage, eavesdropping, and tampering with network devices or transmission media. Ensuring the security of the physical layer effectively protects the entire communication system from the impact of such attacks [
10,
11,
12,
13]. This paper focus on how to design physical layer communication mechanisms to reduce the risk of service interruptions caused by physical layer failures or attacks.
The physical layer security is regarded as the first line of defense for industrial Internet security [
14,
15].This is because physical layer security involves the security of infrastructure such as network devices, sensors, and controllers. These infrastructure are the foundation of industrial Internet operations, and once they are threatened or attacked, it may have a serious impact on the entire network [
16,
17]. To ensure physical layer security, we need to take a series of measures. Strict control of physical access, protection of equipment, and hardware encryption are very important. This means we need to ensure that only authorized personnel can access and use related equipment and facilities. By implementing effective authentication mechanisms and access control policies, the risk of unauthorized access can be greatly reduced [
18,
19,
20]. In contrast, physical layer security, which exploits signal processing techniques to protect wireless transmissions from either passive or active attack from any adversary or malicious users, is becoming an important solution for secure communications [
21,
22,
23]. For example, by using the beam-forming technology [
24], the legitimate device can get a better secrecy rate, even if the legitimate channel quality is worse than that of an eavesdropper device [
25,
26,
27].
There has been a lot of research work on physical layer security in the wireless communicatons [
28,
29,
30,
31,
32,
33,
34], one of the effective methods is beamforming. It can achieve the secrecy capacity in multi-input-multi-output (MISO) systems by enhancing energy in a particular direction and suppressing energy in other directions [
35].Previous works on physical layer security usually assume the channel state information (CSI) of both legitimate and eavesdropper channel, or only the legitimate channel, is perfectly known. In most cases, the eavesdropping user adopts the passive eavesdropping mode, the transmitter cannot attain the CSI or location information of the device Eve’s channel. Therefore, many researchers use the security performance measurement index to analyze the security region (SR) or insecure region (ISR) of the system [
36,
37,
38].The SR means that Eve in this area cannot correctly decode the received confidential information, and the ISR means that the Eve in this area can correctly decode the received confidential information.The Secrecy Outage Region (SOR) was defined in [
36], it analyzes the geographical regions where secrecy outages may occur. Besides, it further studies the system security performance of the SOR by using the artificial noise technology. In [
37], the vulnerability region (VR) under zero security rate in multi hop networks was studied. By minimizing the VR, the number of eavesdropping users was reduced. The compromised secret region (CSR) was defined in [
39] and it proposed a secure transmission strategy of the minimum CSR. By numerically approximating the CSR, the optimal location and allocated power of the jammer are calculated, and the minimum CSR under the constraint of security outage probability is achieved.
This paper mainly studies the classical passive eavesdropping system model in the IIoT wireless communicatons, where the transmitter device (Alice) wishes to transmit to the legitimate device (Bob) in presence of eavesdropping device (Eve).Location information has been widely concerned in wireless networks [
40,
41].This paper mainly studies the scenario that only Bob’s location information is attained by Alice. In this paper, the spatial outage probability (SSOP) is defined by the physical region where uniformly distributed Eve causes secrecy outage to the legitimate transmission. Alice adopts beamforming to enlarge the signal to noise ratio (SNR) of the device Bob, the SR created by beamforming is highly related to the location information and array parameters. The simulation results show that the SSOP can be reduced or the area of the SR can be increased by adjusting the antenna parameters or the position of device Bob.
The remainder of this article is organized as follows, Section II provides the system and threat models and an overview of secure transmission protocols in the IIoT situation. The spatial outage probability is introduced in Section III. We provide a performance analysis, and the simulation results are discussed in Section IV. In Section V, the conclusions are given.
Notations: Bold lowercase and uppercase letters represent vectors and matrixes, respectively, i.e., and . and represent the transpose and Hermitian transpose, respectively. The Euclidean norm of a vector or a matrix is denoted by . The absolute value of a scalar is denoted by . represents a complex space of the dimension , and denotes an n-by-n identity matrix. denotes the distribution of a circularly symmetric complex Gaussian (CSCG) random variable with mean zero and variance . The distribution of a Gaussian random variable with zero mean and variance is denoted as . denotes the probability measure.
2. System Model
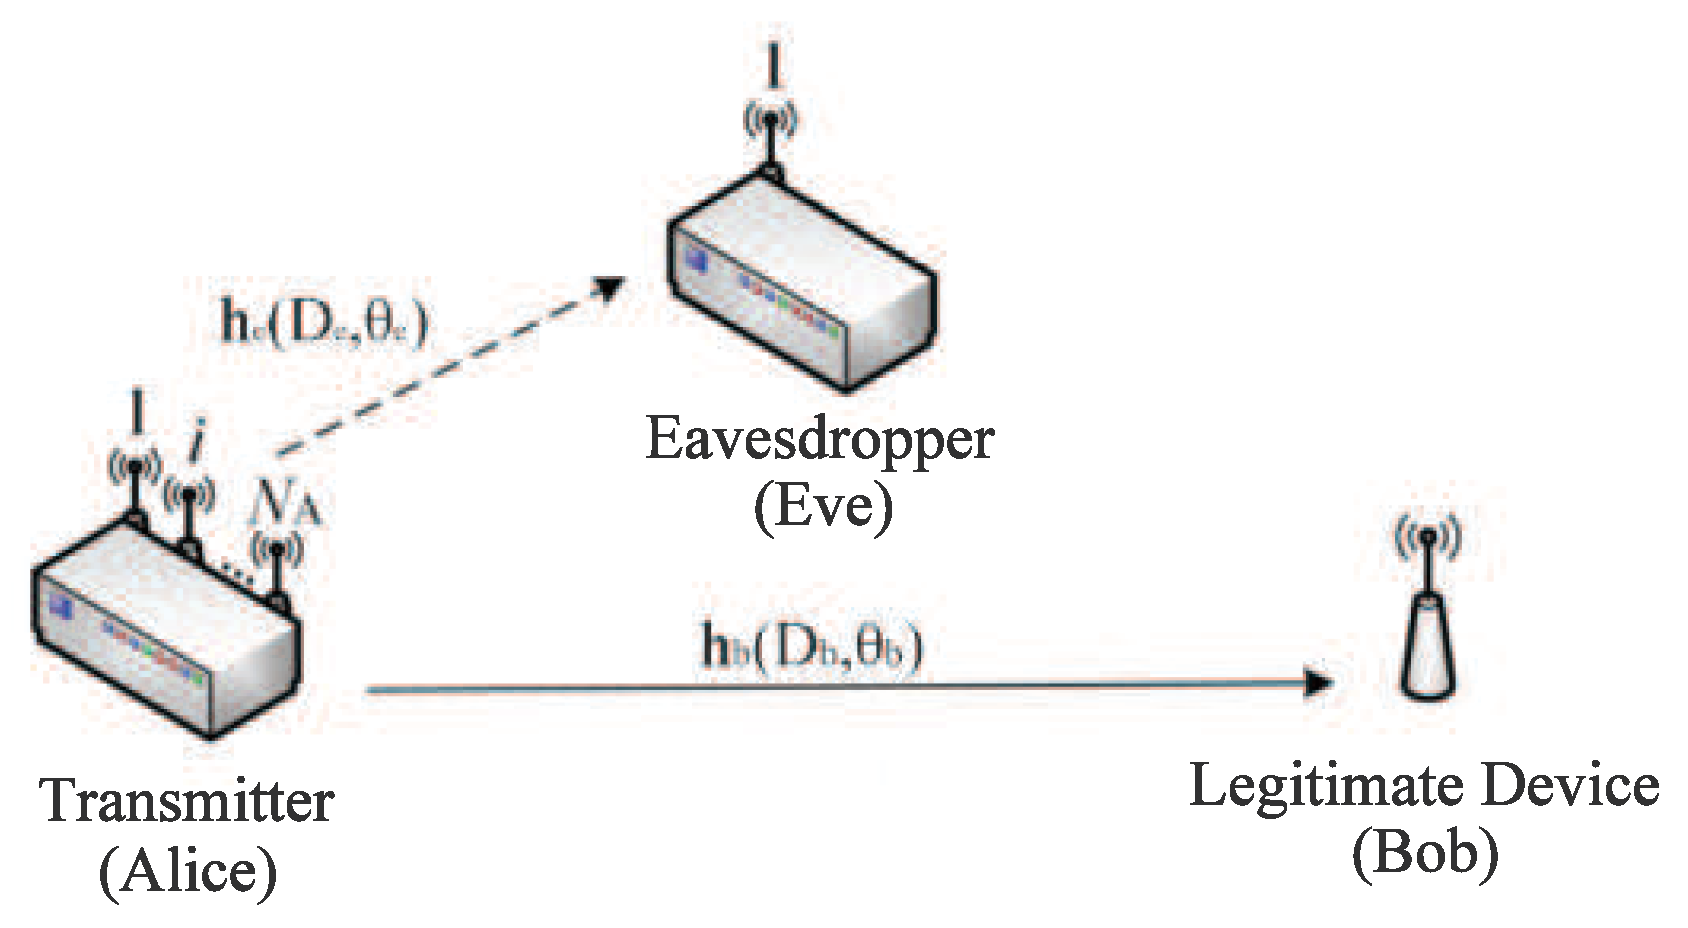
As shown in
Figure 1, we consider a typical wireless networked control systems scenario,where a data transmitter controller, Alice, and the legitimate receiver Bob, need to securely exchange data over wireless channels, while a single antenna malicious node, Eve, attempts to acquire or disrupt the information transmitted between them via eavesdropping or active attacks.All nodes are assumed to be stationary or slow-moving and communicating in a static IIoT environment,which leads to infrequent variations in wireless channels.Among of this, the transmitter (Alice) is equipped with a uniform linear antenna array with
N antennas where the antenna spacing is wavelength spacing, i.e.,
, the legitimate devices (Bob) and the eavesdropper (Eve) are equipped with a single antenna, respectively. The paper adopts the polar coordinate system, where Alice’s location is selected as the origin, Bob’s location is denoted as (
), Eve’s location is denoted as (
). The paper assumes Alice has known the CSI and the location information of Bob, but the CSI and the location information of Eve are unknown to Alice or Bob. We assume the legitimate channel (the channel between Alice and Bob) and the eavesdropping channel (the channel between Alice and Eve) are subject to quasi-static rayleigh fading with equal block length. As detailed below, the
legitimate channel and the eavesdropping channel are denoted as follows:
where
,
.
is the path loss exponent.
denotes the array steering vectors, i.e.,
,
.
In this paper, Eve is a passive eavesdropper, hence the location of Eve is unknown to Alice. In order to eavesdropping the secrecy information, Eve cannot be too far from Alice. This inspired us to propose a circular eavesdropping model as in
Figure 1. Eve’s location follows a uniform distribution in the circular [
42]:
where
denotes the uniform distribution,
denotes the maximum distance where Eve can eavesdrop the secrecy information.
Alice adopts beamforming to transmit information
s, the received signal at Bob and Eve are respectively given by:
where
is the power budget of Alice,
denotes the beam-forming vector,
.
and
respectively denote the circularly-symmetric complex Gaussian noise, i.e.,
,
. The SNR of legitimate channel and eavesdropping channel are given by
where
.
The channel capacity of Bob and Eve can be given by
3. Spatial Secrecy Outage Probability
When the channel rate of the eavesdropping channel
is greater than the channel capacity of the eavesdropping channel
, Eve can receive the confidential information and decode it. At this time, the confidential information is leaked to Eve, which is called secrecy outage. It can be seen
relies on the location of Eve and small-scale fading
from (5), when
is higher than a certain threshold, the secrecy outage event could be happen. The probability of the secrecy outage event called secrecy outage probability (SOP). In this paper, we adopt the insecure region
to illustrate the secrecy outage event for the uniformly distributed Eve,
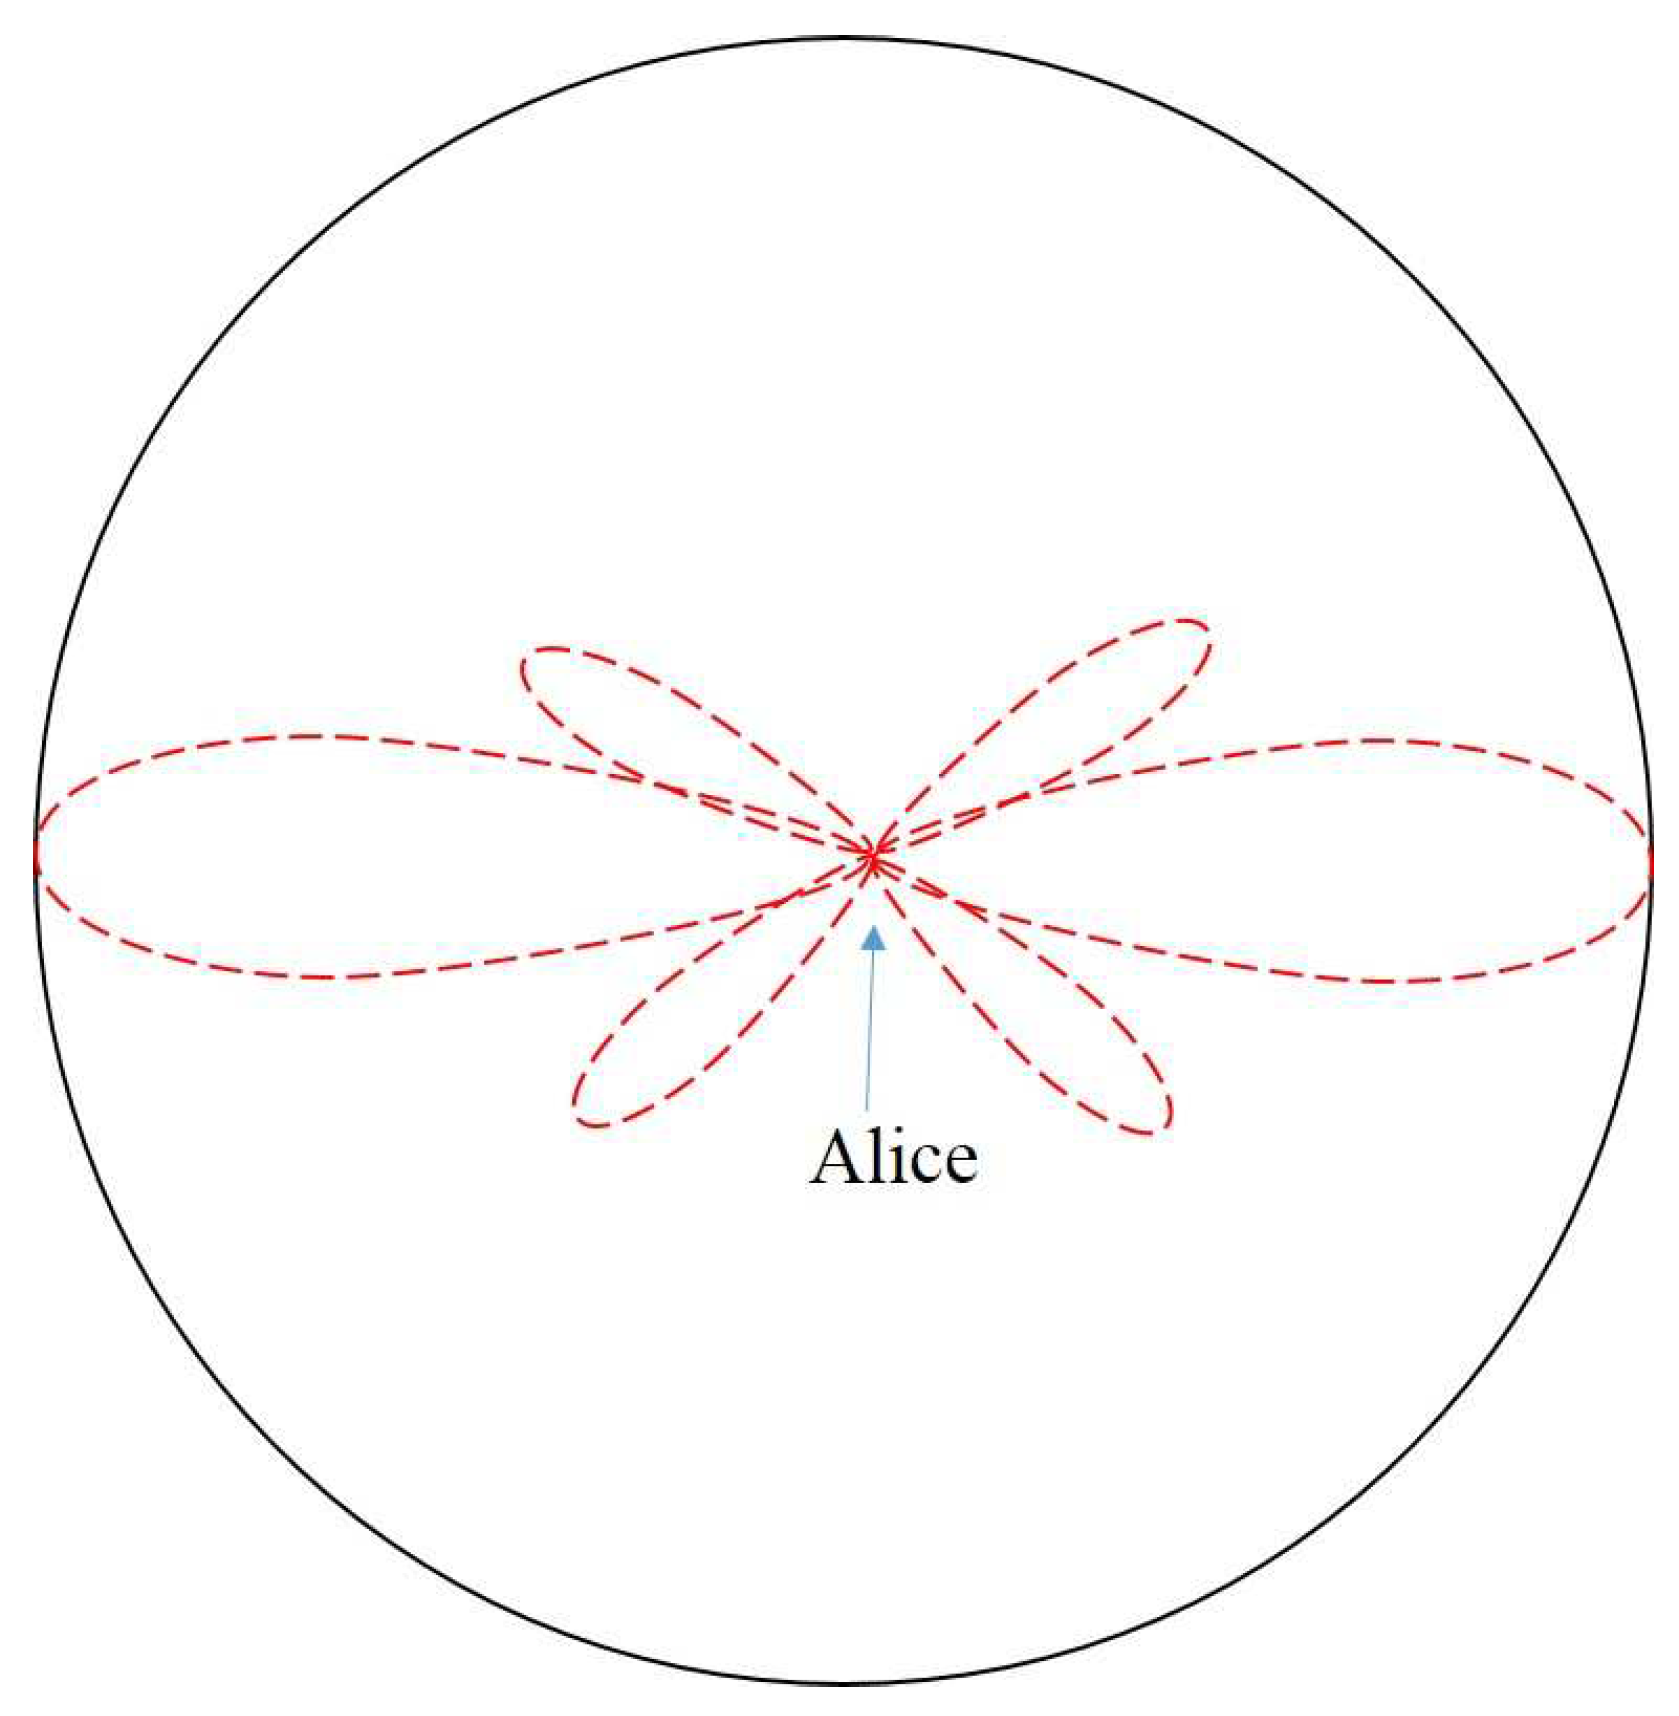
is defined by the geometric region where Eve causes the secrecy outage event, as shown in
Figure 2. The insecure region
can be denoted by
Substituting (5) into (6),
can be further denoted by
, where
is given by
Let
A be the area of the insecure region. According to the polar coordinate curve area formula, the area of insecure region
A can be denoted by
A is measured in
, and it depends on
and
. The SSOP can be defined by the probability that Eve is located in
on the premise of guaranteeing Bob’s reliable transmission. The SSOP denoted by
can be given by
depends on the equivalent channel factor
from (9) , and
is the random channel fading, hence we are more interesting in the expectation of
. The expectation of
can be denoted by
and can be denoted by
can be further calculated by
From (11),
can be obtained by numerical calculation. But the closed form expression can not be obtained except for the path loss exponent
. Therefore, this paper analyzes its upper bound expression
. There are two major obstacles to obtain the upper bound expression of
. The first obstacle is
, the second obstacle is
. This paper uses Jensens Inequality to overcome the two obstacles. The Jensens Inequality is given by
The equality holds when for any X.
1:
can be derived using (12) and is expressed by
where
is the Bessel function of the first kind with order zero.
: (1) The first obstacle .
In the expression
,
follows uniform distribution, i.e.,
. The probability density function (PDF) of
is
. The
can be further expressed as
In the inequality, the equality holds when .
For uniform linear array, the closed-form expression of
can be derived by
According to the first kind of the Bessel function, i.e.,
, (16) can be further denoted by
According to the relationship between trigonometric function and exponential function, and
, (17) can be further derived as
Hence the upper bound of
is
(2) The second obstacle .
According to (12),
can be denoted by
follows the exponential distribution with parameter 1, therefor . Substituting the results into (18), , the equality holds when .
According to the above analysis, the upper bound of the expectation of SSOP is (13) and when .
Thus, the proof is completed.
4. Simulation Results
In this section, we further provide numerical results to validate our theoretical analysis. Without losing generality, simulation parameters are set as follows in the MATLAB. we set the path loss index to be 2, the simulation results are derived from 10000 Monte-Carlo experiments. The power budgets at Alice is 30dBm and the number of antennas is 8, i.e., . is the distance between Alice and Bob,the default value is 10 m, is the maximum distance between Alice and Eve, to be set 50 m, is the legal channel transmission rate, The initial value is , is the SSOP threshold, the setpoint is 0.1, is the legitimate user reception probability threshold, to be set 0.9, is the incident angle, initial value is , simultaneously, the noise power is 30dBm, stands for the system throughput.
4.1. The Impact for the Averaged SSOP versus Bob’s Different Value of
In
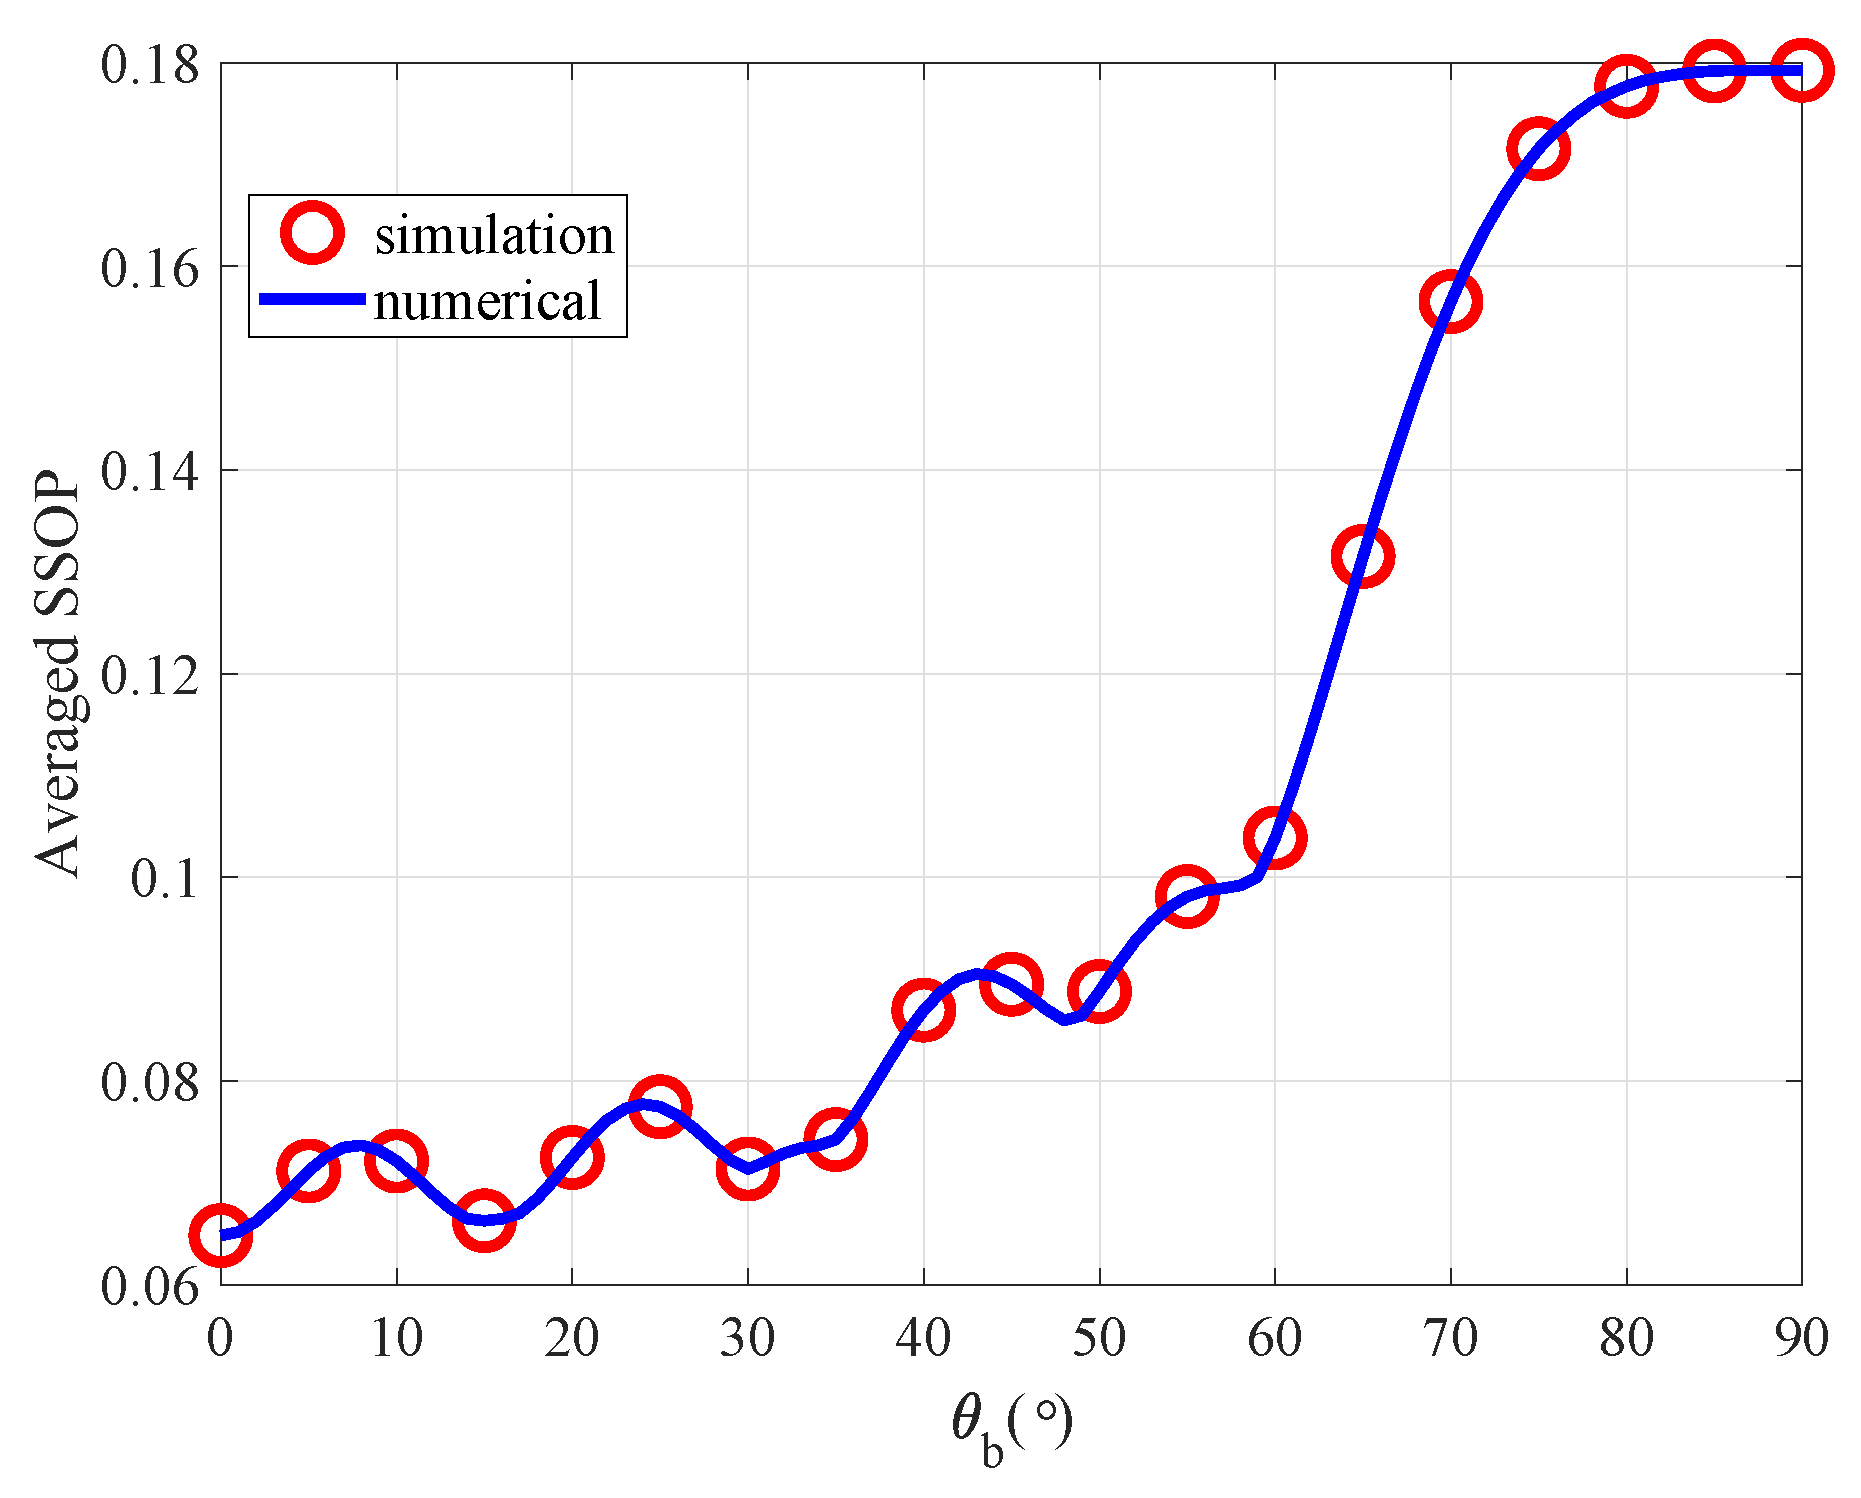
Figure 3, we analyzed the relationship between Bob’s different value of
and the
, from the simulation result, we can conclude there is a slight oscillation at the beginning,the underlying reason lies in the Alice signal influence. With the increase of the
, the
overall trend also increases. Therefore, when Bob located in the normal direction of the antenna array as the Alice direction, the results work perfectly. The root cause is when
=
, The antenna array has the narrowest beam width, at this point, the leakage of information is minimized also make the
to be minimal. Therefore, when the azimuth angle of legitimate users is known, the system’s security performance can be improved by adjusting the direction of the antenna array. The FIG.3 shows the theoretical analysis results and numerical simulation results plotted on a curve graph which can be observed that the two curves exhibit a good level of alignment. Furthermore, it further substantiates the theoretical analysis results mentioned earlier.
4.2. The Averaged SSOP versus Different Value of N
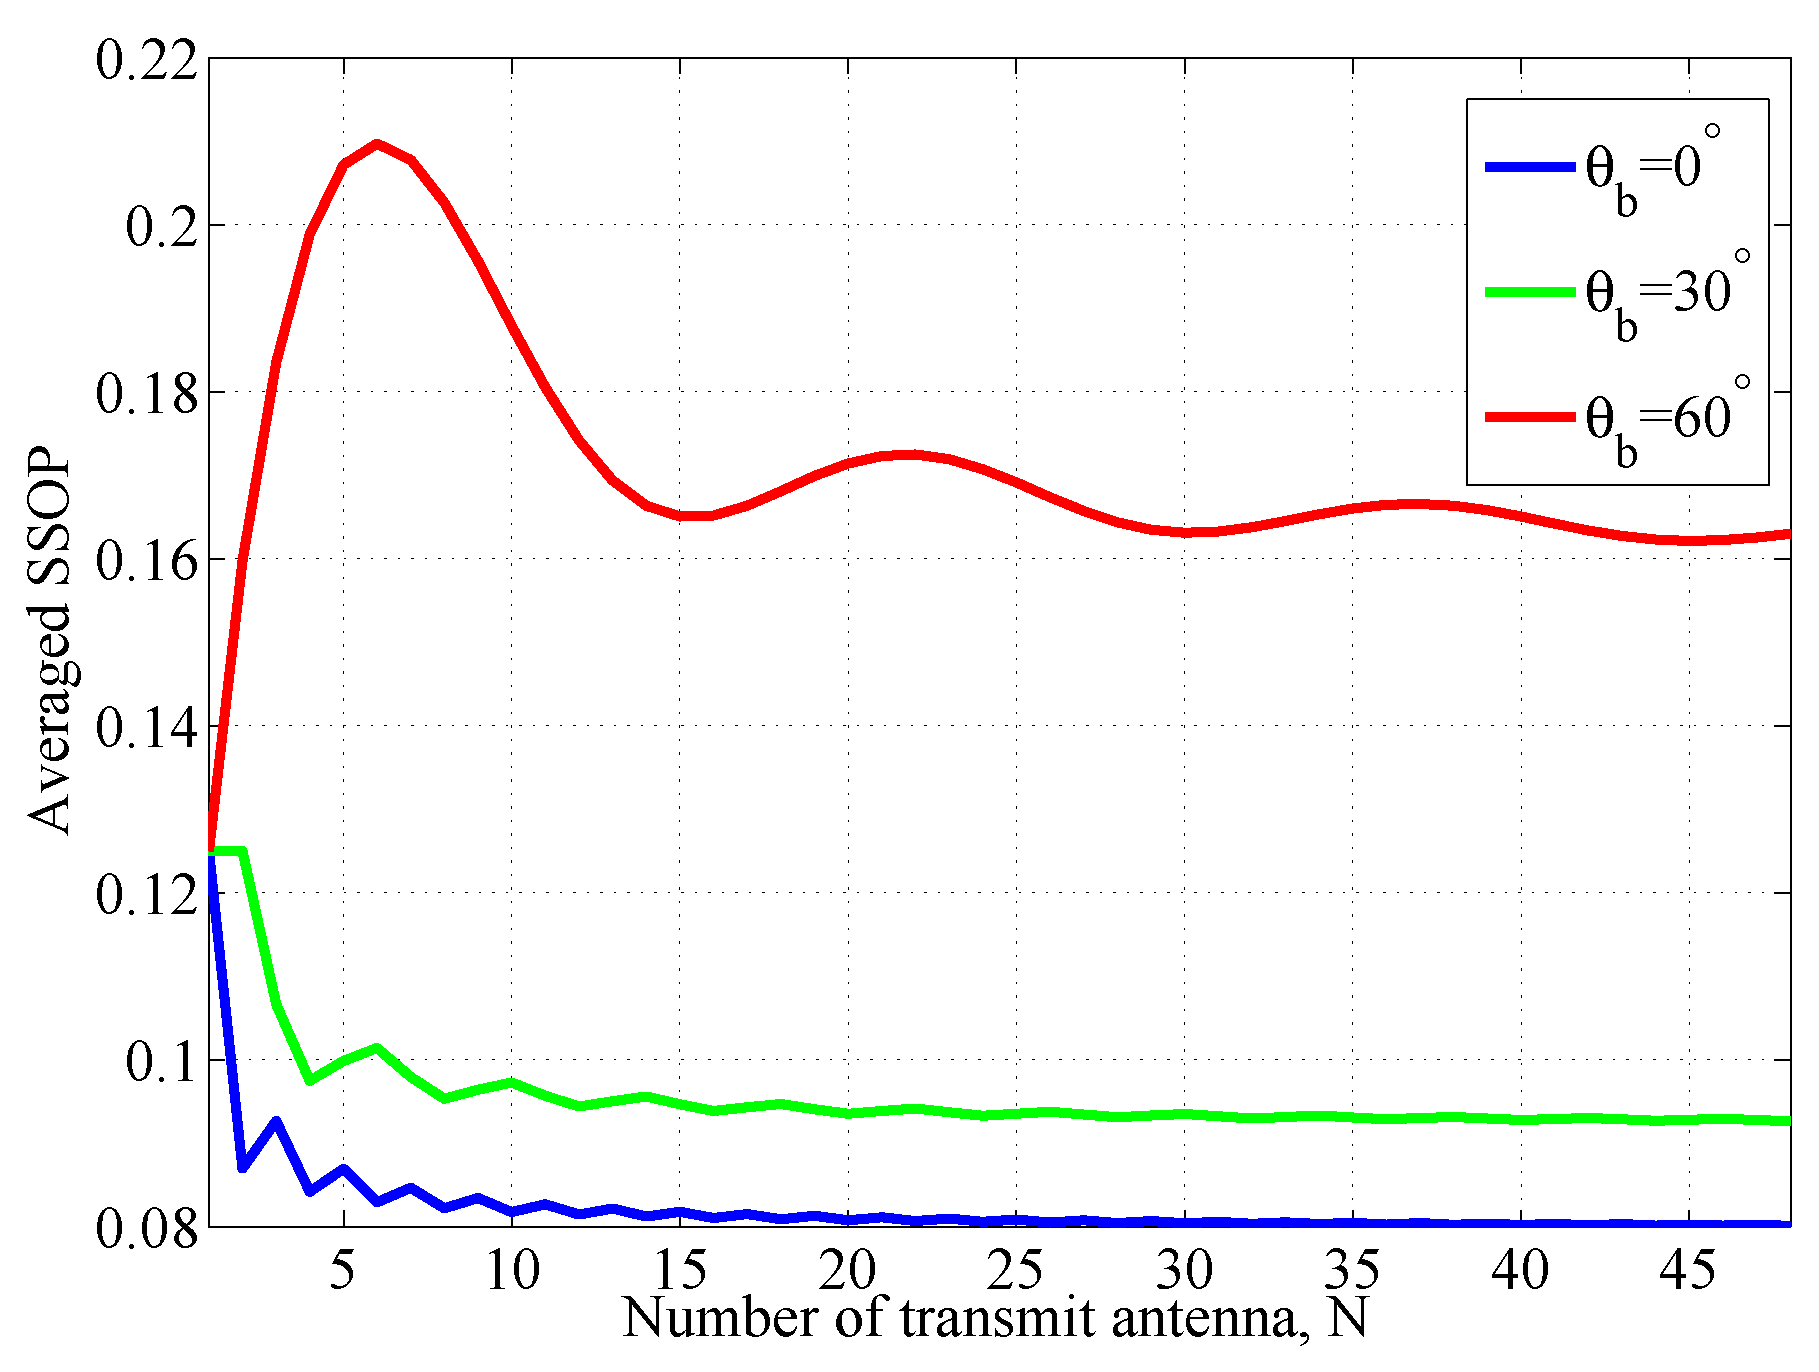
In
Figure 4, we plot the averaged SSOP,
, versus different value of
N for various
for
m,
m. It can be seen from figure that for different
,
fluctuates at different rate. The fluctuates is caused by
. With the increasing of
N,
approaches to a fixed value. Therefore, we can conclude that the system security performance does not always increase with the increase of the number of antennas. From this figure, the SSOP is the minimum when
, this is because when Bob is in the normal direction of the antenna array, more confidential information will be in the main lobe range of the transmitting beam. In practical communication systems, if the direction of the antenna array is adjustable, we can adjust the antenna array to align with Bob’s normal direction. At this point, the system’s security performance is optimized.
4.3. The Averaged SSOP versus Different Value of and
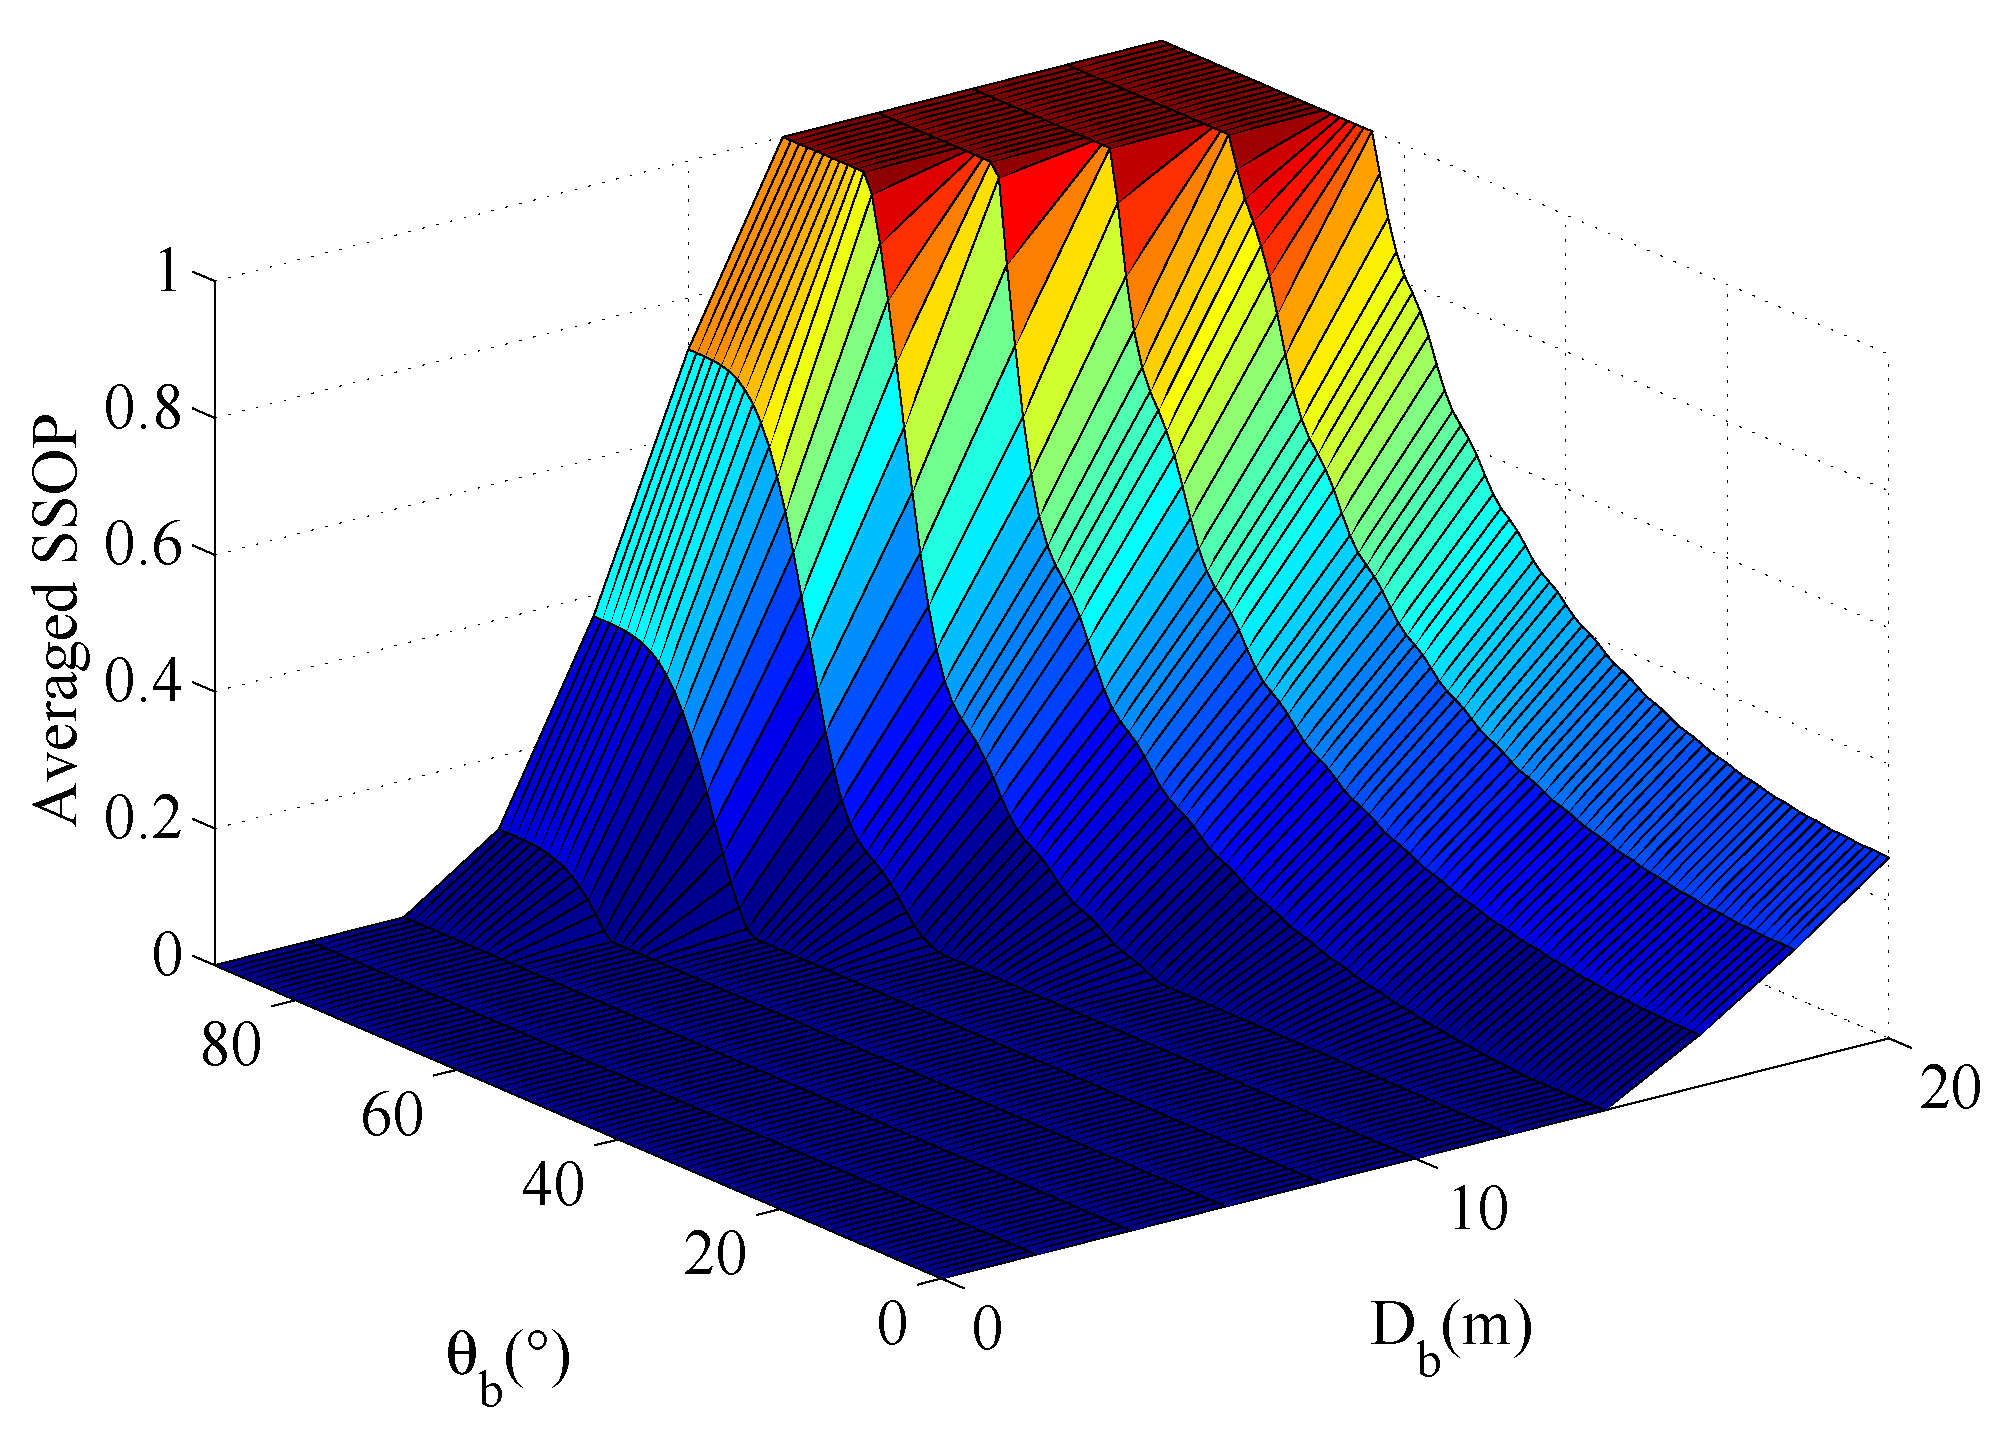
In
Figure 5, we plot the averaged SSOP,
, versus different value of
and
for
m. From the three dimensional figure we can see
when Bob located in different places on the premise of Alices location is selected as the origin. The region can be divided into 3 areas, the absolute safety zone (
), relatively safe zone (
) and danger zone (
),
denoted a predefined probability value. From this figure,
grows with the increasing of
and
. When Bob is in the normal vector direction of the antenna array, the safety performance of the system is the best.
4.4. The Averaged SSOP versus Different Value of and
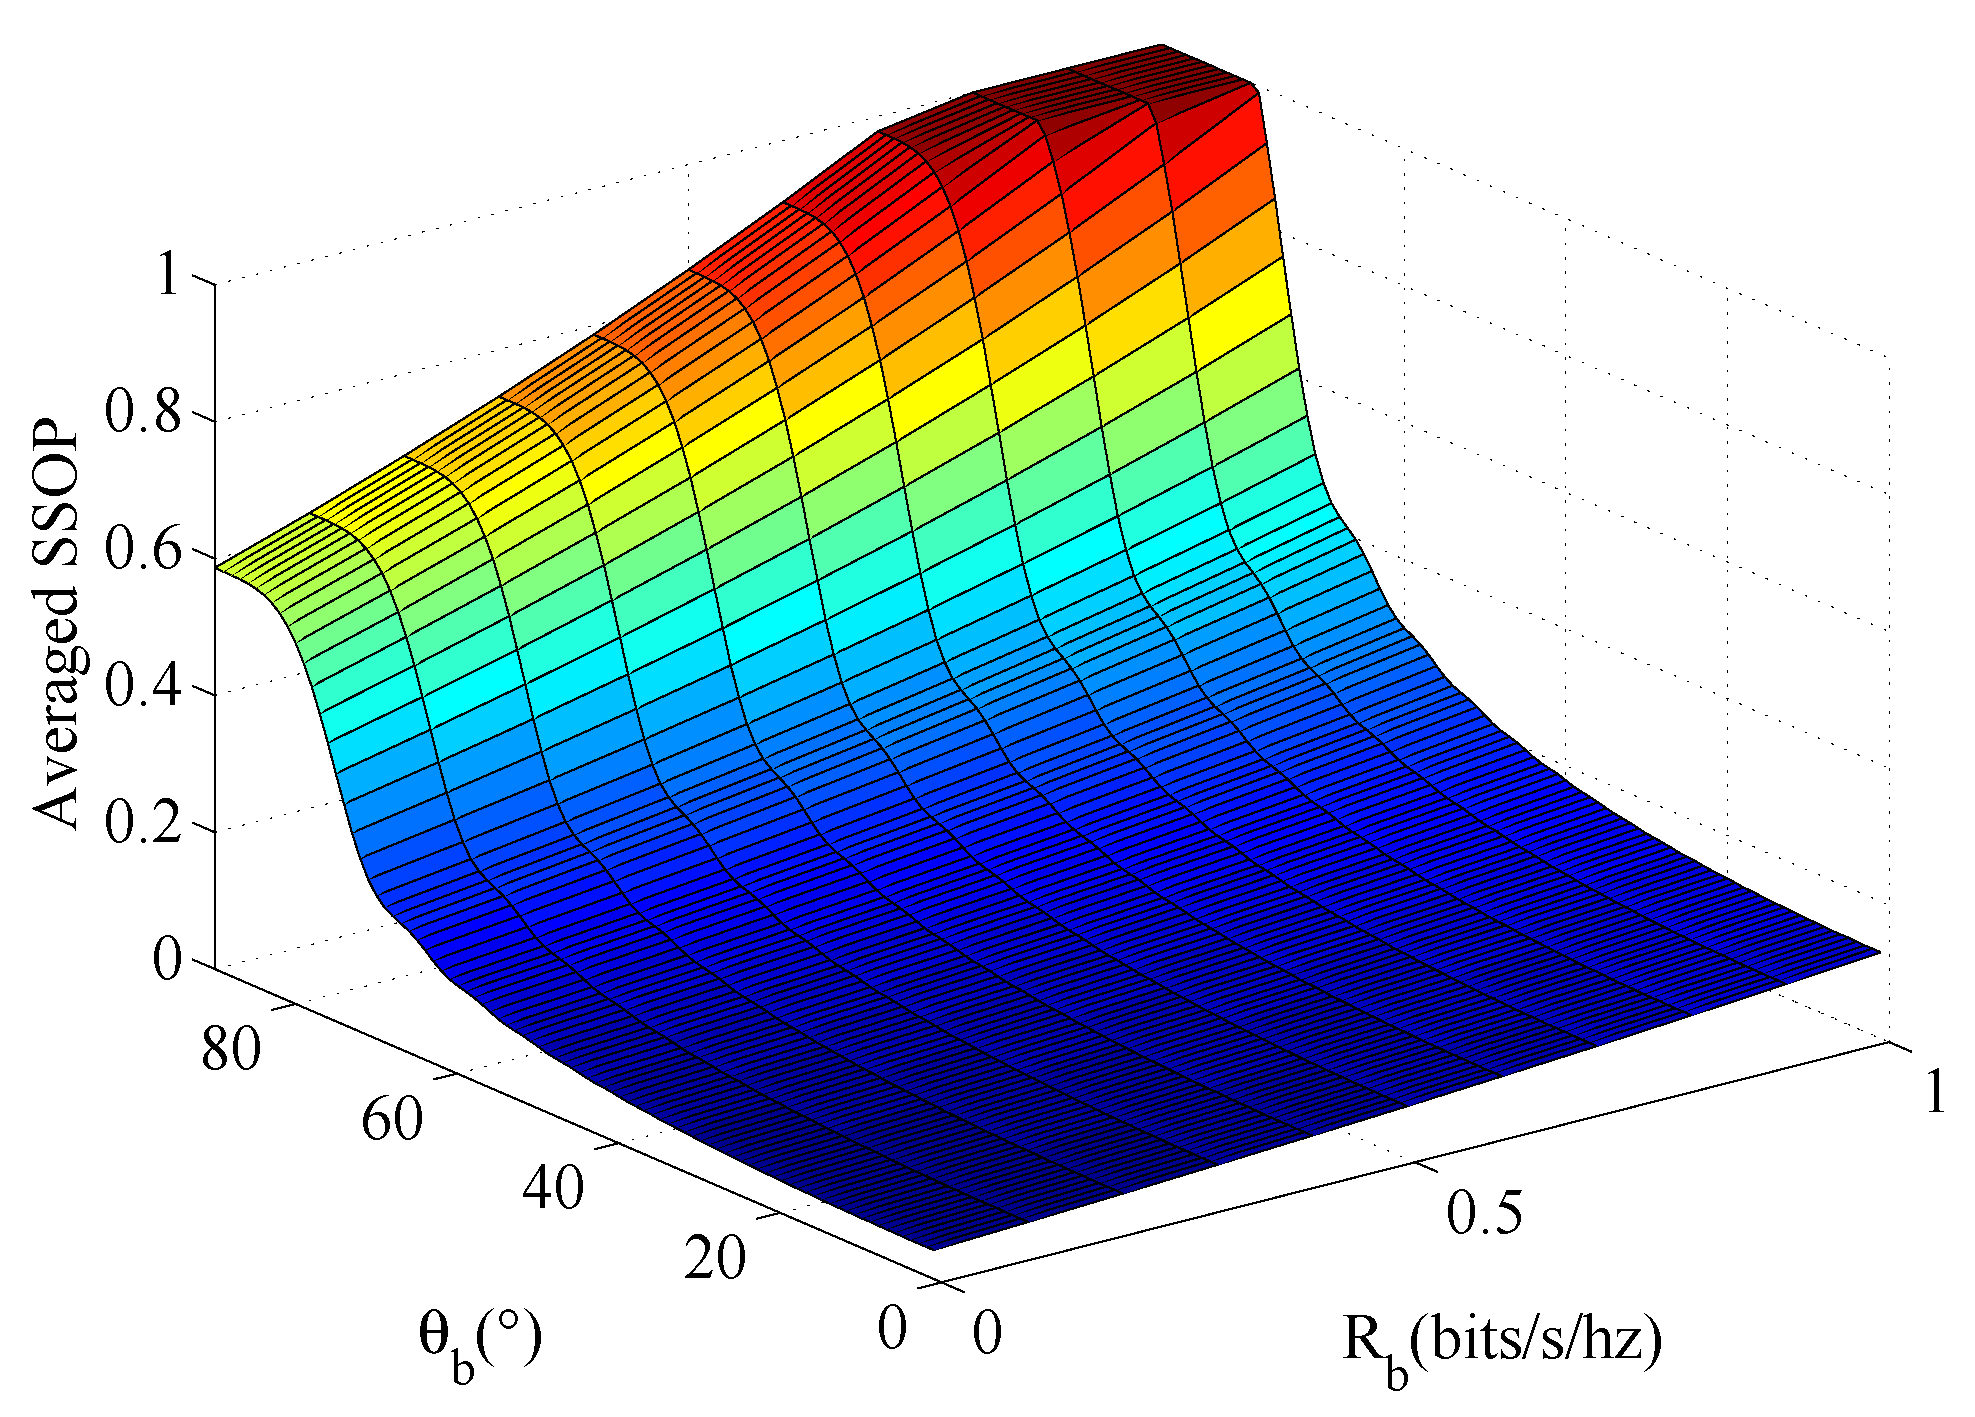
In
Figure 6, we plot the averaged SSOP,
, versus different value of
and
for
m,
m. It can be seen from the figure that when Bob is located in the normal direction of the transmitting antenna array, a larger legal channel rate
can be obtained under the same spatial outage probability constraint. Therefore, in the actual environment, the direction of the antenna array can be adjusted to Bob’s normal direction to improve the safety performance of the system.
4.5. The Relationship between System Throughput versus the Legitimate Channel Transmission Rate
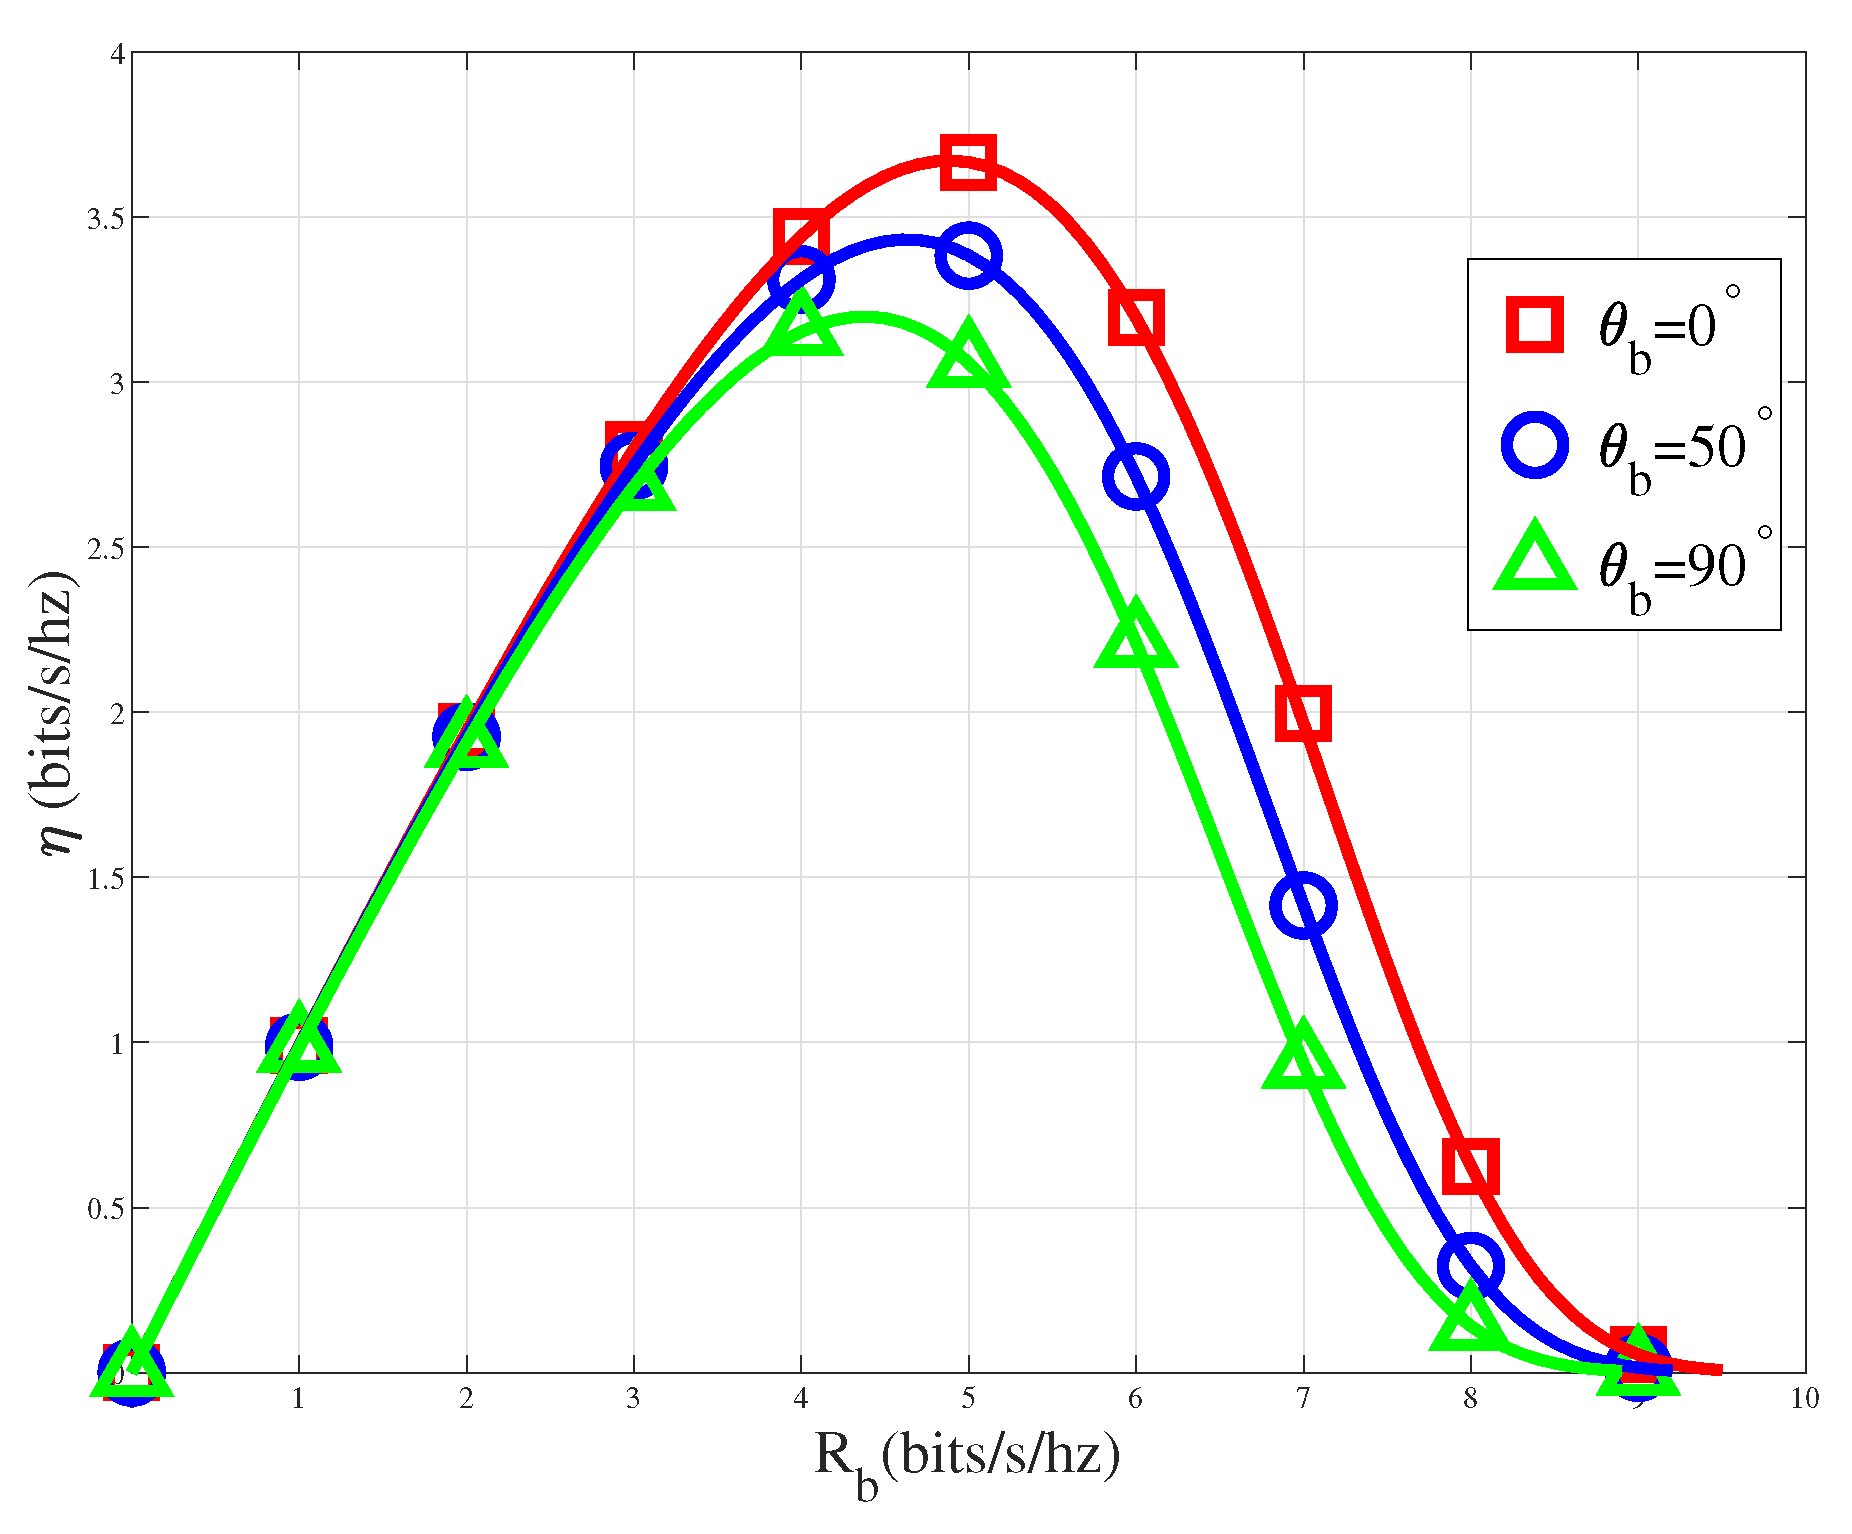
The relationship between system throughput
and the legitimate channel transmission rate
is is excellently illustrated in
Figure 7. In this experimental section, the present study posits the following assumptions: In this section, an exploration is conducted into a non-adaptive coding transmission scheme, wherein the transmission rate of the legitimate channel remains invariant throughout the data transmission process.The graphical representation reveals a non-linear relationship between system throughput
and the legitimate channel transmission rate
, exhibiting an initial ascent followed by a subsequent decline. This observed trend aligns with the anticipated variations derived from theoretical analysis. Given our knowledge of the channel information for the legitimate channel in practical communication scenarios, it becomes possible to strategically design the optimal transmission rate based on theoretical insights, aiming to attain the highest achievable system throughput.The graphical representation illustrates that the maximum value
is attained when Bob is positioned along the normal direction of the antenna array. This observation serves as additional validation for the analytical findings concerning Spatial Secrecy Outage Probability (SSOP). Specifically, it underscores that the system’s security performance is optimized when Bob is aligned with the normal direction of the transmitting antenna array.
4.6. The Relationship between System Throughput versus Different Transmission Power Levels
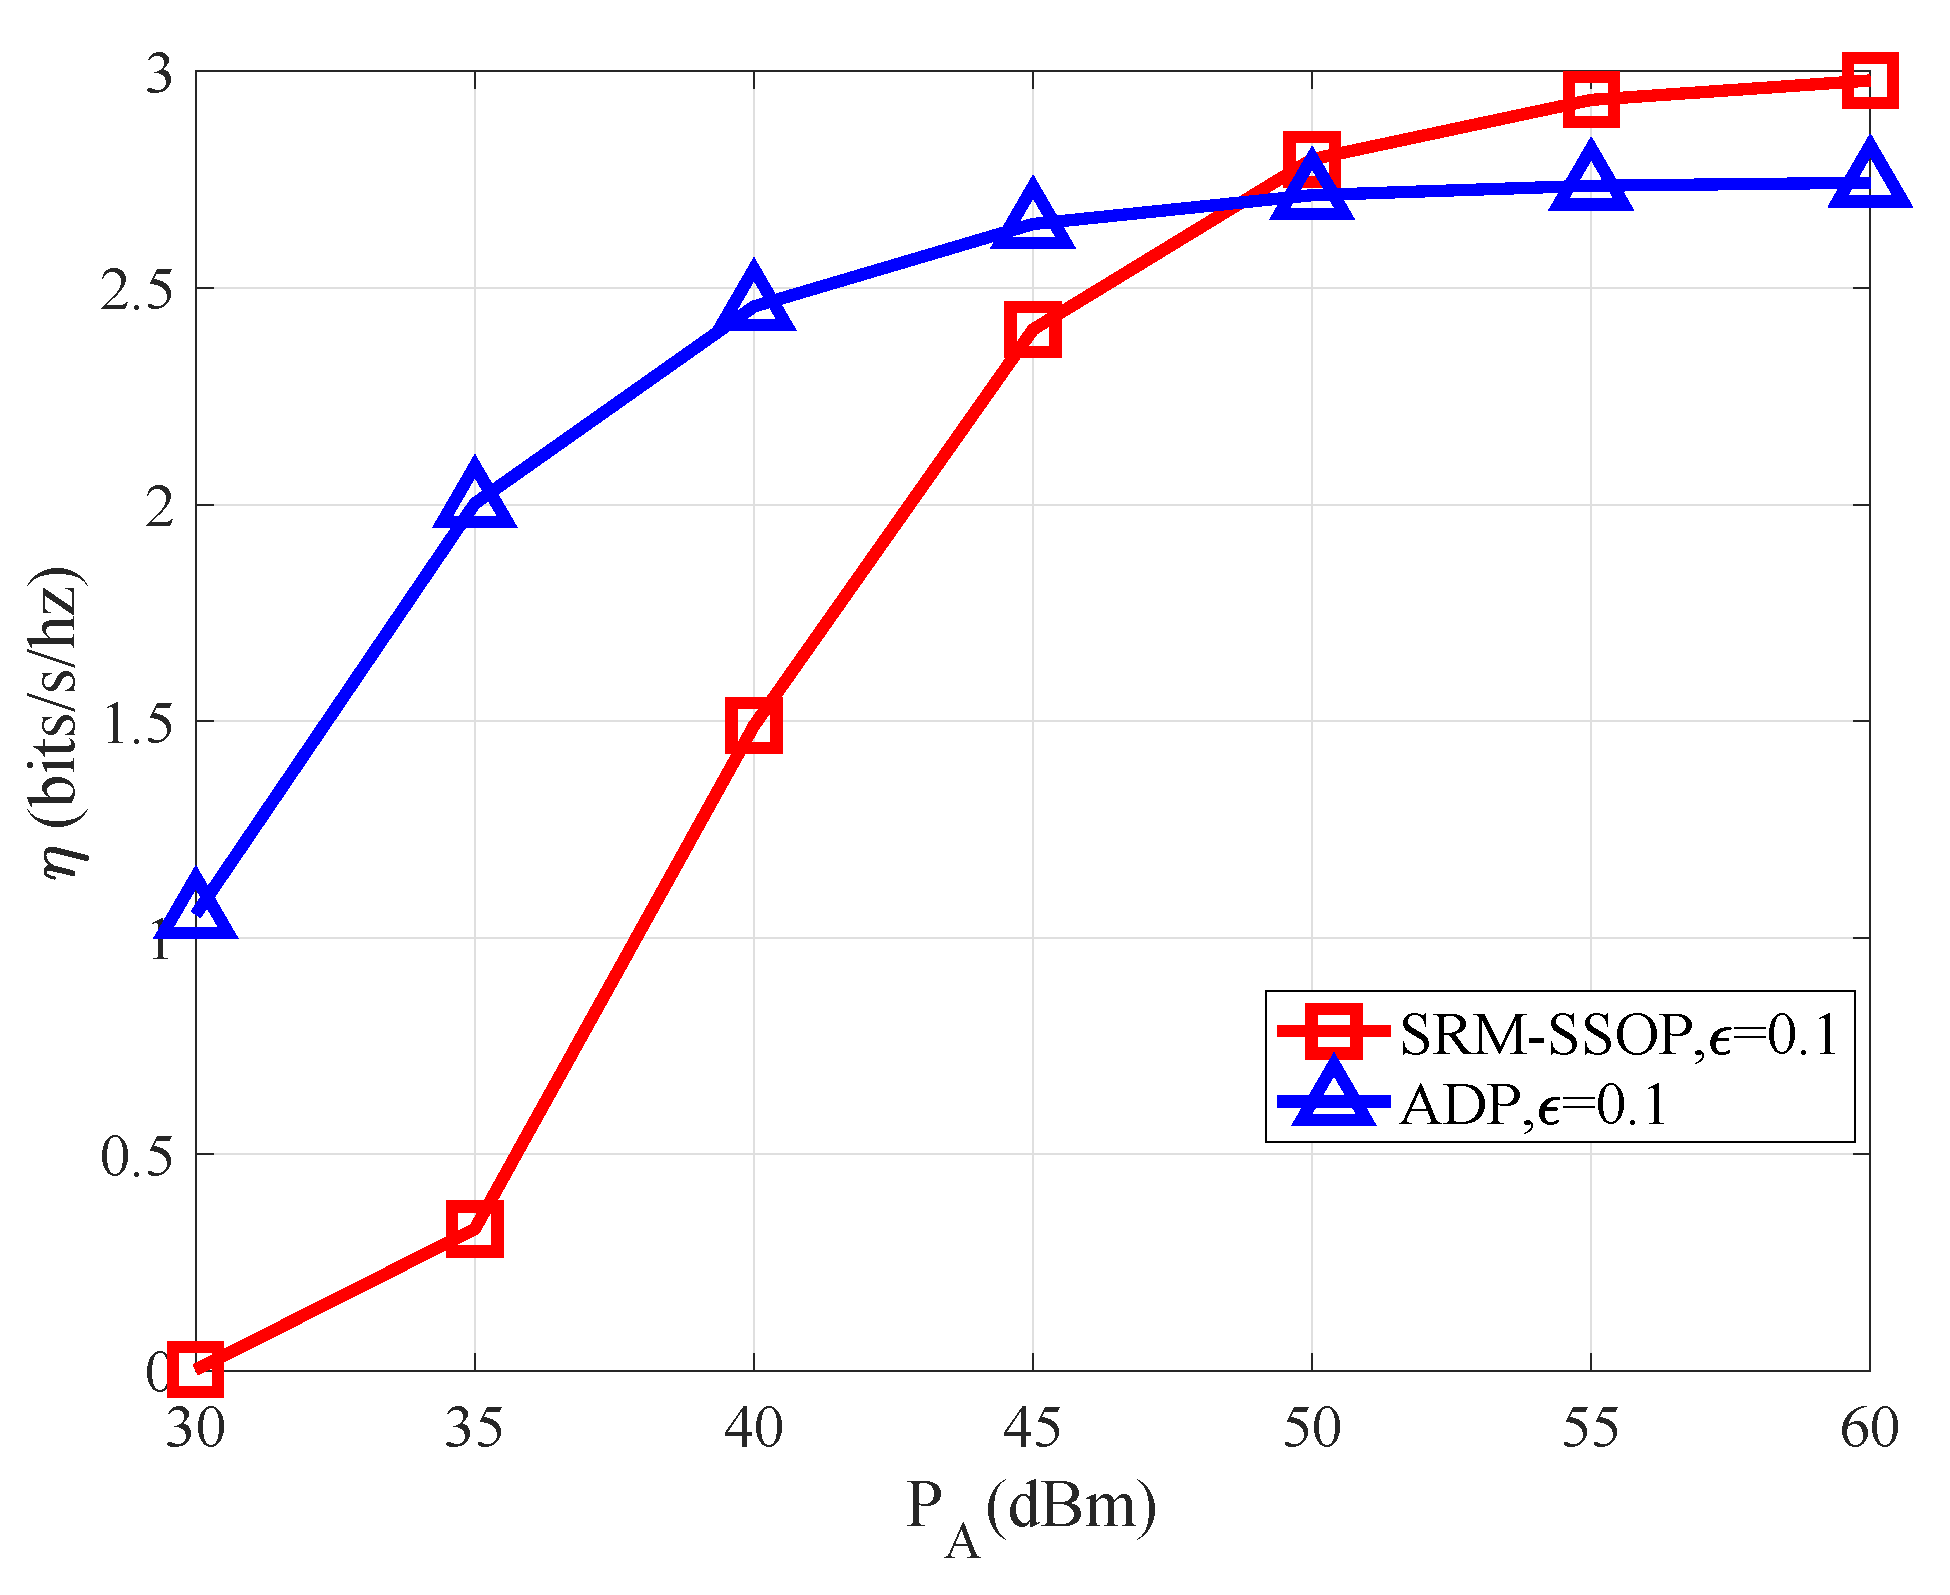
Figure 8 examines the comparative performance of system throughput
under varying transmit power
conditions. The graphical representation indicates a positive correlation between increasing transmit power
and system throughput
, reaching a gradual convergence towards a stable value. Consequently, the findings suggest that transmit power is not a limiting factor impeding the augmentation of system throughput.The figure also analyzes the comparative relationship between the system throughput optimization scheme under the proposed System Throughput Maximization based on Spatial Secrecy Outage Probability, SRM-SSOP algorithm conditions and the adaptive transmission mechanism (ADP) based on the [
43],The ADP transmission mechanism is an adaptive transmission scheme where the legitimate channel rate and secrecy rate can be dynamically adjusted based on channel state information. Operating under the constraint of secrecy outage probability, this mechanism aims to maximize system throughput. Due to the adaptive adjustment of transmission rate and secrecy rate according to channel state information, the ADP algorithm can achieve higher system throughput.From the simulated data, it is apparent that under strict outage probability constraints (
= 0.1), the presented approach in this paper exhibits superior performance compared to the optimization scheme based on ADP at elevated transmit power levels(
> 50dBm). While, in scenarios with lower transmit power, the system performance based on SRM-SSOP may be suboptimal compared to ADP, it is noteworthy that ADP constantly adjusts the coding length to adapt to dynamic transmission rates, introducing heightened complexity in coding and modulation. In contrast, the proposed approach maintains a fixed transmission rate, rendering it more suitable for practical engineering applications.
Figure 8.
The system throughput versus the different transmission power levels .
Figure 8.
The system throughput versus the different transmission power levels .
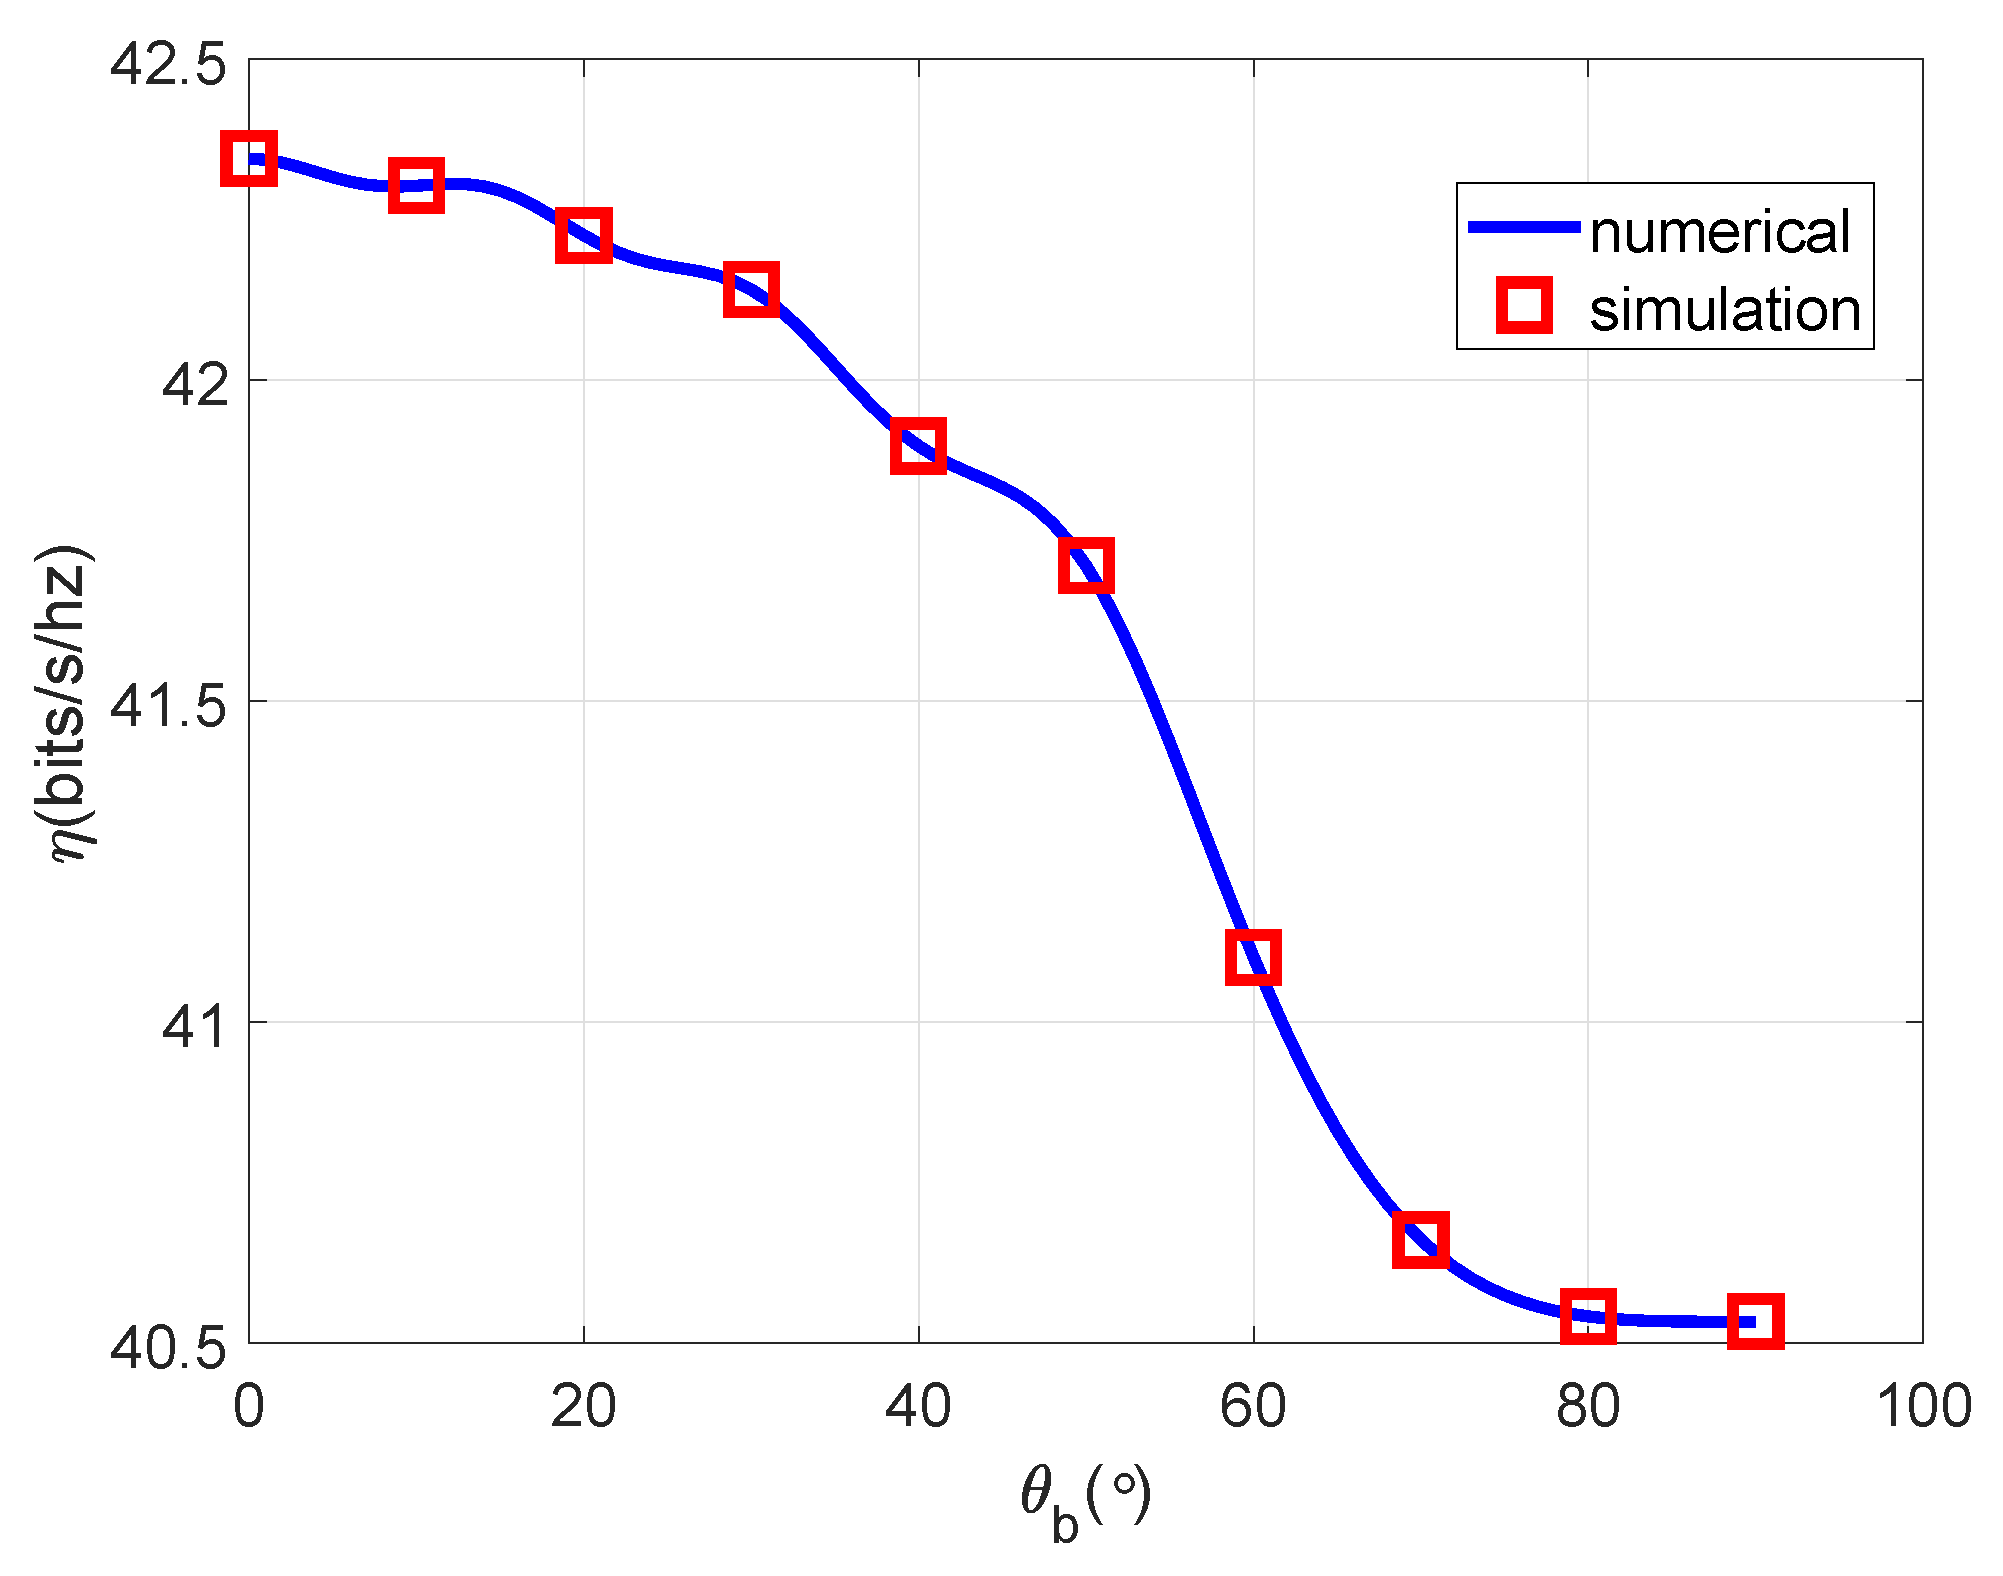
4.7. The Relationship between System Throughput versus Bob’s Azimuth Angle
In the
Figure 9, we analyzed the relationship between system throughput
and Bob’s azimuth angle
.Due to the symmetry of the function
with respect to angle
, based on the uniform linear array’s symmetry, we only investigate the case of
.From the algorithmic analysis earlier, we can deduce that
and
exhibit a decreasing trend.The graph illustrates a notable alignment between the simulation results and theoretical analysis, further affirming the correctness of the theoretical analysis,The graphical representation clearly indicates that the system throughput is maximized when
, corresponding to Bob’s alignment with the normal direction of the transmitting antenna array. At this configuration, the main lobe beam is the narrowest, leading to minimal information leakage. Consequently, with the flexibility of adjustable antenna direction, optimizing system throughput can be achieved by aligning the antenna array direction when Bob’s position is known.
