
Submitted:
12 May 2024
Posted:
13 May 2024
You are already at the latest version
Abstract
A pivotal strategy in decarbonizing the transport sector is by transitioning from internal combustion engine vehicles (ICEVs) to electric vehicles (EVs), especially if they are charged with renewable energy. To provide an incentive to the common populace to switch to EVs, cities should set up - or enable or even encourage the private sector to do so - electric vehicle charging stations (EVCS) at multiple and suitably accessible locations. This paper aims to present a digitaltwin-enabled methodology study for selecting the most suitable possible locations to establish EVCS with consideration of the low voltage (LV) network operation in terms of power losses, active and reactive power in EV charging demand and the effect of the EVCS on the transformers, based on examples in Newcastle upon Tyne (England, UK). It also evaluates the most suitable type of charger that could be installed at these locations by studying the estimated traffic, cost and impact of the EVCS on the power grid, both at peak and off hours. This paper demonstrates how digitaltwin technologies, such as the web-based tool AutoDesign by Northern Powergrid and EA Technology and open source Pandapower can be used for identifying the most viable and cost-effective locations to connect EVCSs to a Distribution Network Operators (DNO)’s LV network. The results of the analysis indicate that with the installation of the most suitable type of EVCS in a particular location, the local power grid would not be significantly affected at any hour of the day.
Keywords:
Electric vehicle charging station
; AutoDesign
; Pandapower
; Techno-economic assessment
1. Introduction
According to a study by Amin et al. (2020) [1], the transport sector consumes around one-fifth (20%) of global energy consumption. Accordingly, steps should be taken to decarbonize the transport sector so as to achieve a 30% reduction in emissions by 2030 [2]. This could be accomplished in part by increasing the number of Electric Vehicles (EVs) in the transportation network, if they are charged by renewable energy sources [3]. The successful design and execution of electro-mobility (e-mobility) [4] would also aid in achieving multiple United Nation’s Sustainable Development Goals (SDGs) - namely, SDG 9 (Industry, Innovation, and Infrastructure), SDG 11 (Sustainable Cities and Communities), SDG 12 (Responsible Consumption and Production) and SDG 13 (Climate Action). Manufacturing and running EVs could also rely on the actions taken to achieve SDG 7 (Affordable and Clean Energy) [5].
EVs provide an overall energy efficiency of 80%, which would be much greater than the 30% energy efficiency given by Internal Combustion Engine Vehicles (ICEVs) [6]. They have an improved storage capacity provided by batteries and could generate or store electricity when parked [7].. Ideally, of course, this should be electricity generated from renewable energy [7,8,9]. In light of the increasing awareness of sustainable development, users of EVs have begun to demand DNOs for new, renewable, low carbon technologies. Furthermore, in the past decade, battery storage technologies have become cheaper due to mass production and technological advancement [10]. This could open the gateway to a sustainable implementation of battery storage with the introduction of renewable energy technologies [11,12]. Additionally, a study conducted suggested that a PV-based electric vehicle charging station (EVCS) would reduce the power load on the local grid and thus provide greater stability to the system [13]. Such power system decarbonization would lead to an increase in the complexity of electricity networks. A multi-objective techno-environmental analysis approach is necessary in order to make sense of this, and the roles and (shatred, negotiated) benefitrs for a range of stakeholders [14].
In order to combat the convolution of network configuration, digital twin tools have been developed which are adaptable and expandable [15]. In this project, the web-based AutoDesign and Pandapower are the two software programs which were used to analyze the case studies, as have been by a range of other authors in this braod context due to their library (e.g. Padapower Python) functions [16,17,18,19,20,21,22] and application utiliities. Descriptions of Autodesign and Pandapowerare discussed in detail under Section 2. The charging stations should be established in multiple different locations to ensure availability to the users as well [23].
The project was aimed to in principle design/simulate an EVCS system using Northern Powergrid’s AutoDesign tool [24,25,26,27,28,29,30] and simulate the impact of the system on the grid under different loads and the hourly EV demand. Furthermore, the resulting model is analyzed and the results are simulated using Pandapower. An economical table is also produced using AutoDesign, which compares the cost and prices of each element in an EVCS. To design an EVCS system, the type of charger to be installed has been studied. The standards created for EVCS, plugs and sockets in Europe are included in IEC 61851 (IEC- International Electrotechnical Commission). It has included three different charging types [31]. The Level 1 charger is the slowest type. It has a low voltage rate of 120V, rated power of 1.4-7kW and maximum current range between 10-16 A. With these ratings, Level 1 chargers could have a charging duration between 6-10 hours and provide a range of 6-8 kilometers each hour [32]. Level 2 chargers are the most popular type and are the fastest type of AC chargers. They possess voltage rating, current rating, and rated power of 208/240V, 16-32A, 3.3-22kW respectively. It could provide a charging duration of less than 8 hours, with the range per hour being 19-45km [33]. The fastest charging type is the Level 3 charger. It is also called DC Fast Charging (DCFC). It has a rated power of 22kW and 350kW maximum output power. Since it is a DC source, it could provide direct power to the EV battery, while the AC-to-DC conversion occurs in the charging station before electrons enter the EV. It could fill up an EV at 60-90 minutes and give over 160km of range per hour. This type is typically placed in commercial or industrial areas due to the high cost and power drawn from the grid. It therefore requires dedicated grid infrastructure [34].
Th the impacts of the EV charging load on the grid. It has studied the voltage stability of the chargers and the effect of the peak load and the power quality of the charger on the power grid. It has also looked at the effect of the deployment of EVCS on the power transformers. For the effective design and deployment of EVCS, different locations have been carefully studied for selection as well. The crucial criteria that affect the location selection of an EVCS are considered, namely the population density, roads, transportation stations, petrol stations, parks, shopping malls, green areas, land value, and slope [35]. Furthermore, multiple approaches for the optimal location of CS have been considered in terms of distribution network (DN), charging station owner and the electric vehicle users. The DN are suppliers of electric power for all the electric loads in residential, commercial, and industrial sectors. Connecting a new load would affect the parameters of DN, such as active power loss cost, reactive power loss cost, voltage deviation cost, reliability cost, and DN configuration cost. For a charging station owner, the most crucial factor that would affect the location selection of an EVCS would be the maximum revenues and minimum investments [36].
2. Digital Twin Simulation Tools and Methods
Digital twin simulation tools play a pivotal role in the advancement of smart grid technology and the optimization of electric vehicle (EV) charging station placement. These innovative tools offer a dynamic virtual representation of real-world systems, enabling precise analysis and informed decision-making. In this section, two prominent digital twin simulation tools, namely AutoDesign and PandaPower, will be introduced. Through their capabilities and applications, we explore how these tools revolutionize the process of selecting optimal locations for EV charging stations, thereby driving the transition towards a sustainable and efficient transportation.
(A) AutoDesign
AutoDesign is a free online tool that has been launched by one of the Distribution Service Operators operating in the North of England (covering the North East of England and Yorkshire), namely Northern Powergrid with competitive funding support of the UK’s regulator (Ofgem) for innovation purposes. AutoDesign can be used to generate budget estimates for both enhanced or new connections to the electricity grid. Cost estimations can be done for Low Voltage connections that have a maximum capacity of 210 kVA, which would approximately be equal to EV charger loads. The AutoDesign tool makes use of three coloured LEDs - green for ‘yes’, amber for ‘probably’ and red for ‘no’, as indicators for users to determine the most viable connection options [24,25,26,27,28,29,30,37].
(B) Pandapower
The other software program used in the study is Pandapower, which is based on the data analysis and power system analysis toolbox PYPOWER in order to develop an easier use of the network calculation program. It possesses scripting capabilities which makes it easier for the programmer to link with existing geographical and technical information systems. It is intended for the automation of analysis and optimization in power systems. Pandapower has been specifically programmed for static analysis of three-phase power systems of transmission and sub-transmission systems and three-phase distribution systems. The software tool allows for modelling of the expansion, reinforcement and reconfiguration of a given network model and to suggest simulated options for increasing its robustness. Power flow, optimal power flow, state estimation and short circuit calculation are the electrical power systems analysis modules which are supported by PandaPower [16,38].
First, the possible locations that are ideal for an EVCS installation have been identified and two cases have been created. Each case has different sub-stations that could impact the grid differently. Investigating the first location is with respect to installing EVCS in a residential area, and the second location is at a workplace/commercial area. Both the locations are situated in Newcastle upon Tyne, England, UK. With the use of AutoDesign, the input load of each point has been created by entering either the point load or quantity of EV chargers and then the EV charging point has been designed by adding the required location and cable routes. Each location has different points and cable routes to observe the EV load impact on the grid. The grid topology of a single line system is shown above in Figure 1. It contains an external grid, a distributed transformer (sub-station), six buses, four lines and four loads. Each load profile represents a location in the area with different rated power. The external grid represents the incoming supply from the grid which supports the model via a 33/11kV substation transformer. Bus 1-4 represents the rated power of each location, while bus 5 indicates the power capacity profile of an EV vehicle which is assumed to be connected directly to the transformer.
Case Study 1
In this case study, the Elswick district of Newcastle upon Tyne (England, UK) is taken into consideration.
A separate study which had been undertaken in July 2022 by Eljay Research [39], commissioned jointly by Newcastle City Council and Northumbria University as part of a joint Net Zero Innovation project - funded by the {English] Local Government Association (and in turn from the UK’s Department of Levelling Up, Housing and Communities) and co-administered nationally by University College London [40] - had conducted in-depth surveys with 160 residents of the Elswick ward. These were conducted either by post, online or face-to-face. This consultation was carried out to gauge the interest of the residents in a Community Car Club (which would include an EVCS). The survey took into consideration the effect of the participant’s age, ethnic origin, mobility disabilities and household composition on their intrigue in the Community Car Club. The findings of the survey concluded that the district consisted of a larger percentage of younger adult residents, with over 40% of the local population under the age of 39. Young residents of the ward were more willing to support the idea [39].
Figure 2.
Elswick District of Newcastle upon Tyne, England, UK. Source: Adapted from [38; credit for original figure: Adrian McLoughlin, Newcastle City Council].
Figure 2.
Elswick District of Newcastle upon Tyne, England, UK. Source: Adapted from [38; credit for original figure: Adrian McLoughlin, Newcastle City Council].
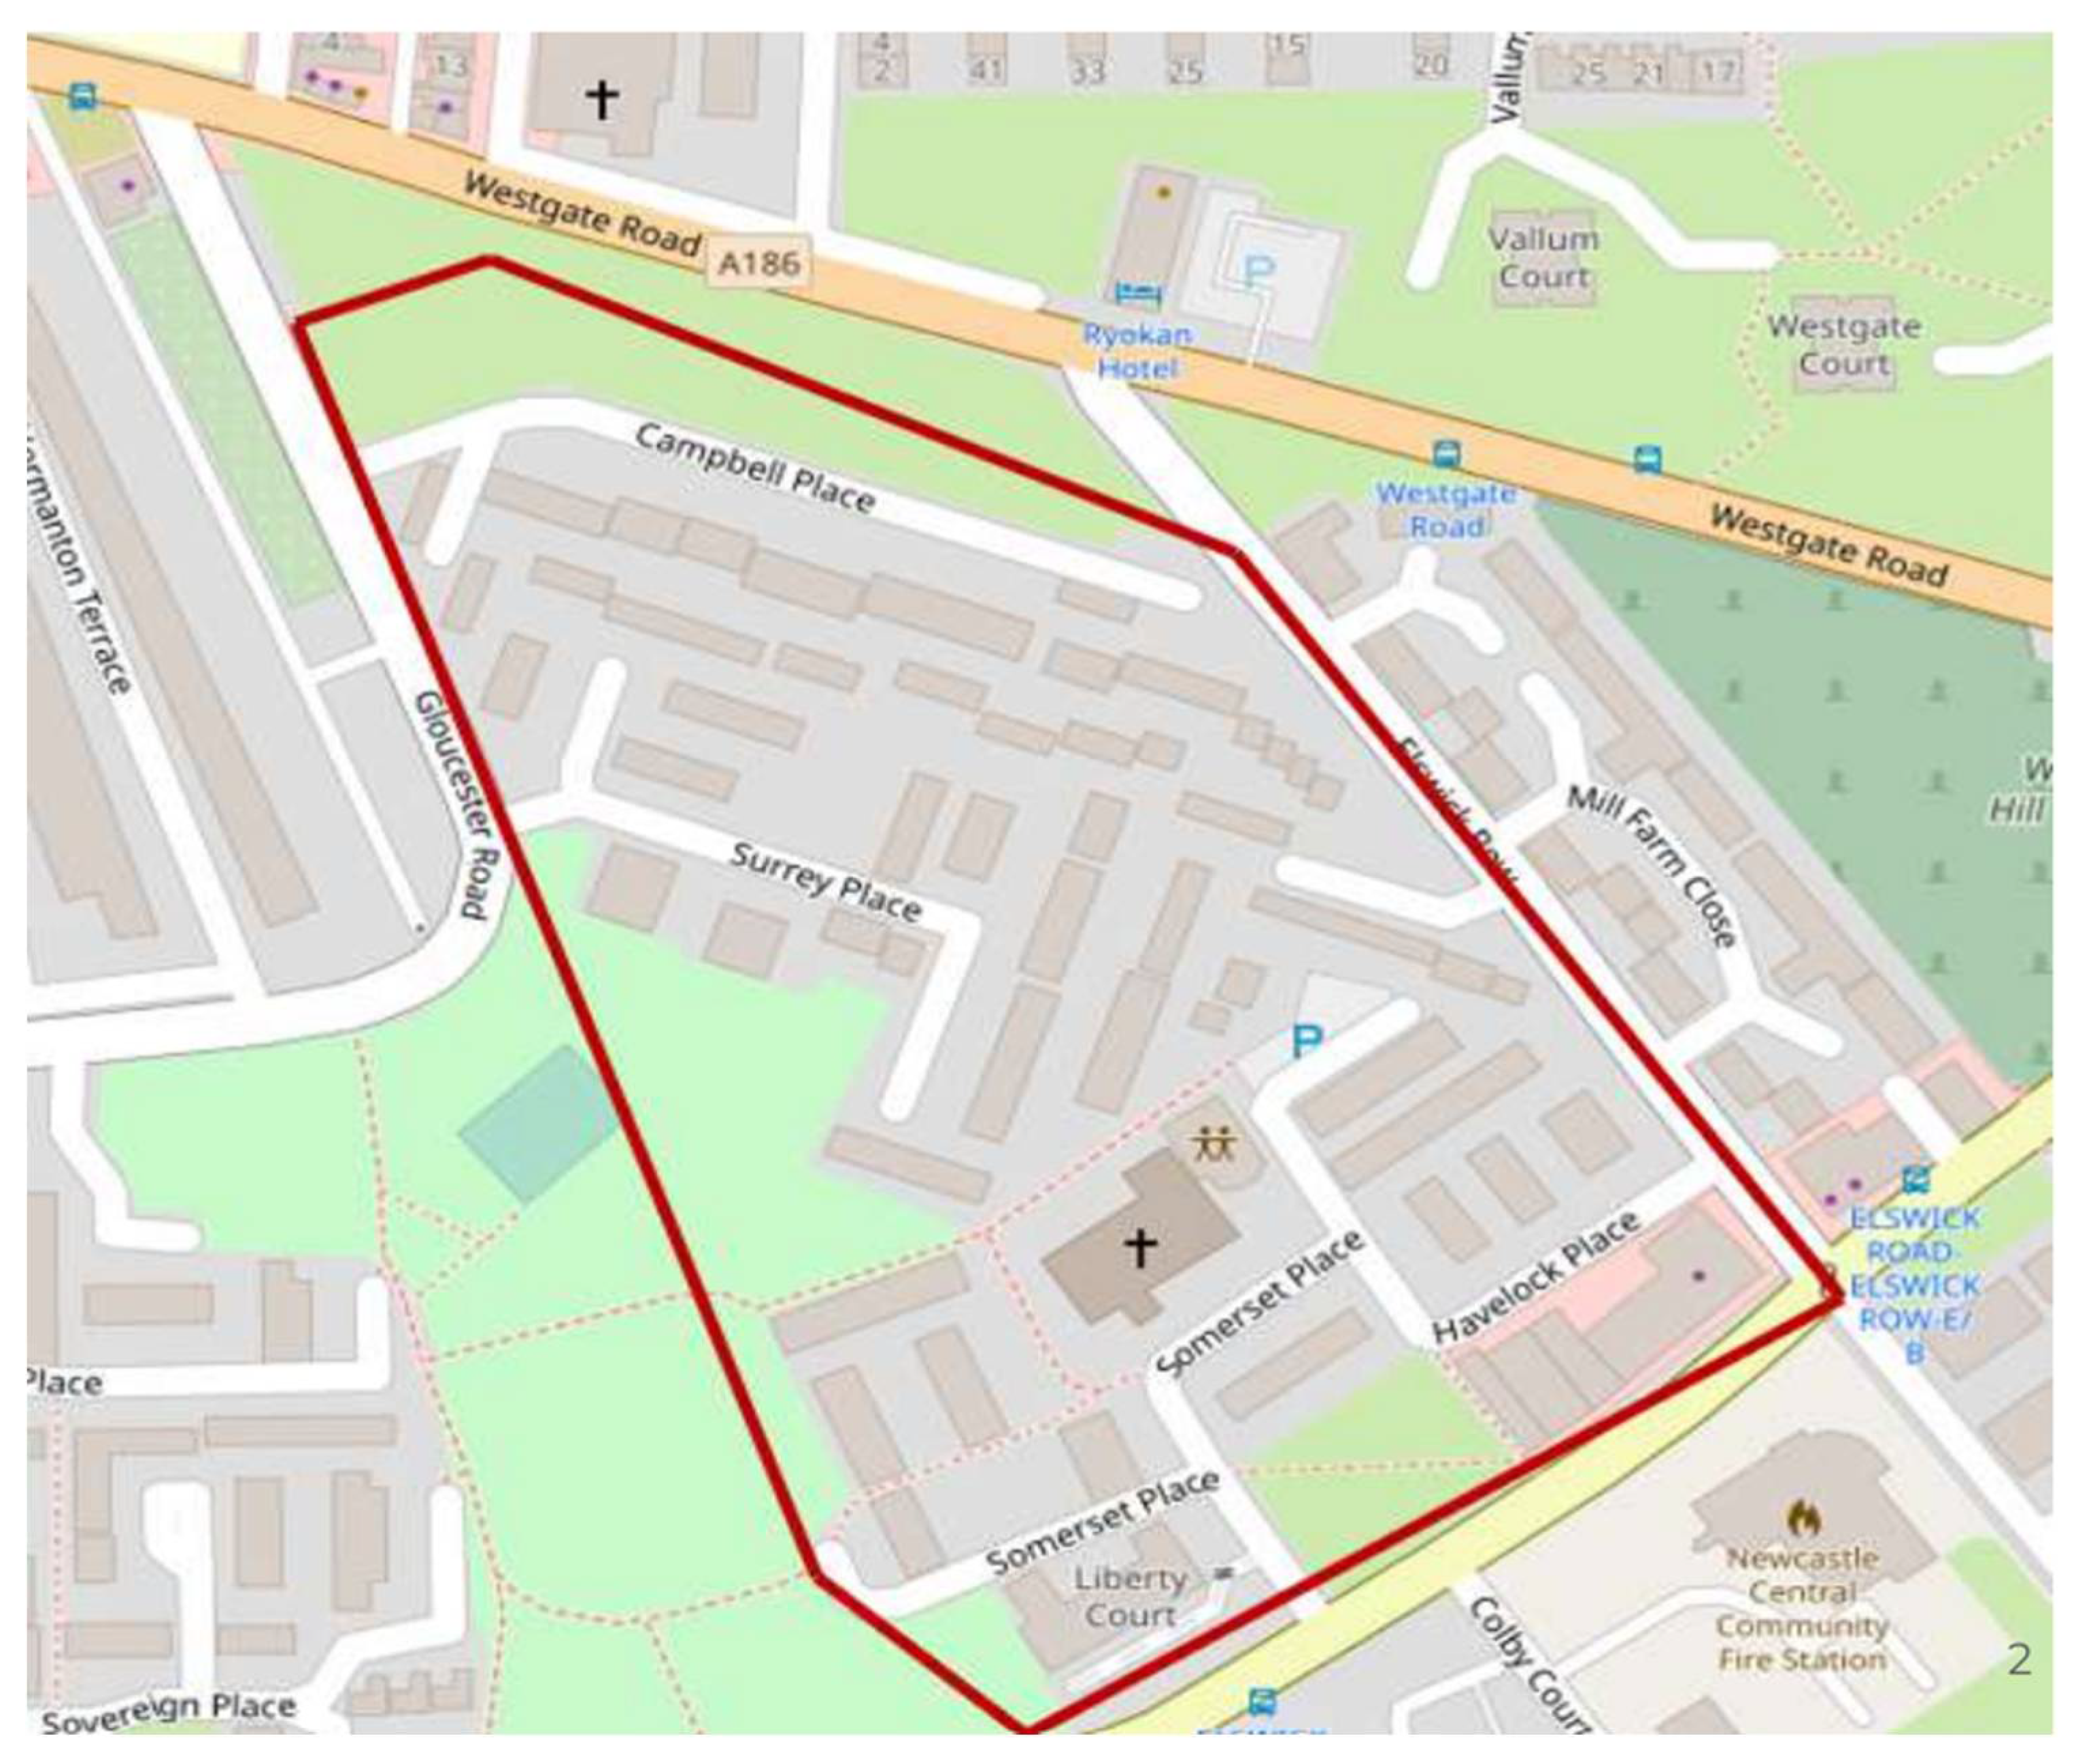
The Elswick ward of Newcastle upon Tyne would thus be a prime location to install an EVCS. The first charging point would be placed on the neighbourhood’s main road. This is an ideal location for residential use because the locals could easily access it without much delay due to traffic. The second charging point is considered to be located in a small parking space in the neighbourhood where the charging station could be used by the locals and be easily accessed by the EVs parked in the parking lot. The third charging station could be established in the parking lot near the main road. It could be accessed by both local and nonlocal users of EVs. The main road has local shops whose customers could charge their vehicles. In the survey mentioned above, participants had stressed upon the fact that distance and accessibility to the EVCS would be highly important for future use of the service by the residents. As such, they preferred the parking lots the most [39].
In order to estimate the active power (the power that is actually doing the work, measured in kW) from the apparent power (measured in KVA), one needs to consider the power factor. For a grid operator or DSO Distribution System Operator, KVA is the measure of the demand (e.g. the amount of power required to run chargers). It is found by VxA. The difference between the active power and apparent power is the reactive power (the power that is wasted, for example, by the resistance of the power cables). When one studies the load to a distribution network, we need to consider the resistance of the cables and capacitance/inductance; see sub-figure (b) in Figure 1 by Carvalho et al. [41] The equation is: Active Power = Apparent Power X Power Factor.
The first location would be suitable to have Level 1 AC chargers because of the low required chargers and rated power. For the second location, it would be preferable to install Level 2 AC chargers to accommodate accessibility by the households nearby. Level 3 DCFCs could be set up in the third location due to high demand for access by locals, small businesses, and passing EV owners such as cars, buses, bicycles etc.

Table 1.
Charateristics of considered EVCS points for Elswick District, Newcastle upon Tyne.
| Electric Vehicle Charging Station (EVCS) Point No. | Location Coordinates | No. of Chargers | Line length (km) |
|---|---|---|---|
| EV Charging Station Point 1 | 54.971124498371, -1.6340286359224014 | 2 | 0.014 |
| EV Charging Station Point 2 | 54.97186092380118, -1.6364106775778577 | 4 | 0.245 |
| EV Charging Station Point 3 | 54.97151557689389, -1.6334706359224032 | 6 | 0.101 |
Case Study 2
The second case study considers the EVCS to be set up in the city center of Newcastle upon Tyne, which is a commercial area [23].
Figure 3.
Newcastle upon Tyne city centre Source: Adapted from [38]; credit for original figure: Adrian McLoughlin, Newcastle City Council.
Figure 3.
Newcastle upon Tyne city centre Source: Adapted from [38]; credit for original figure: Adrian McLoughlin, Newcastle City Council.
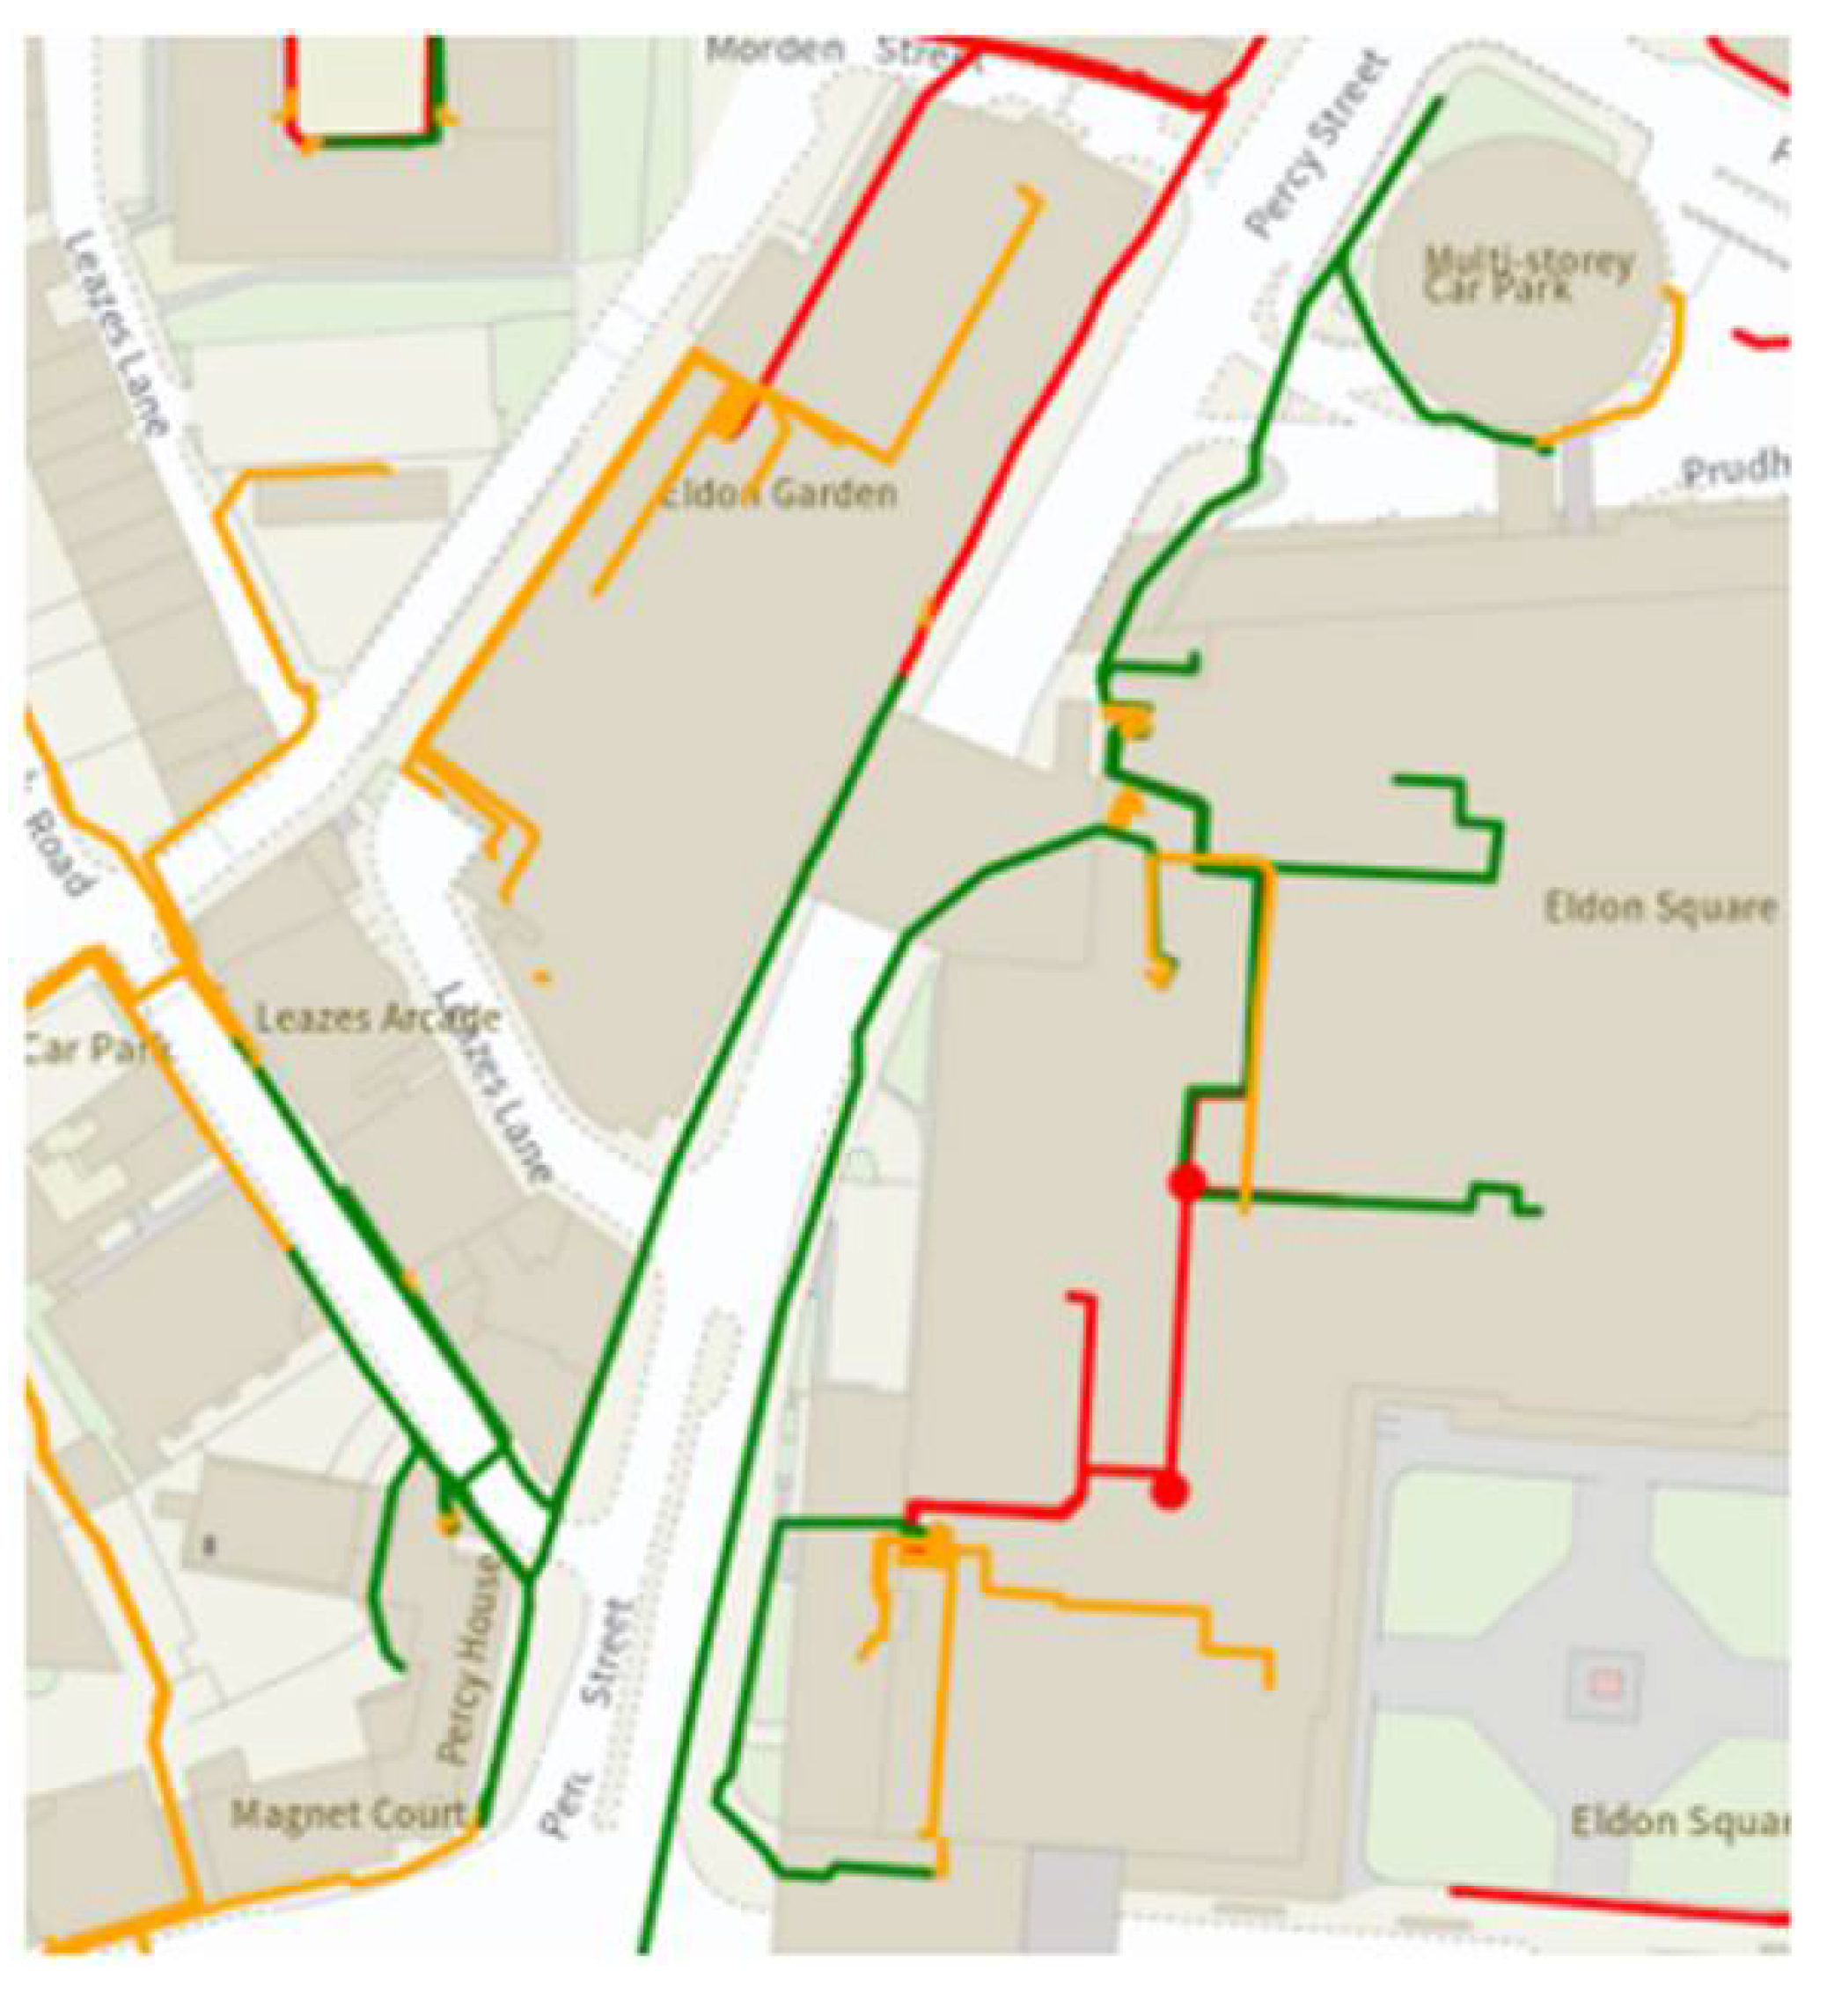
The first charging point could be located in a small car park. It would have a limited number of chargers due to constricted space. It would be an ideal location for nearby private offices, businesses, and apartments. The second location is at a bus station in the center of Eldon Square. Electric buses could charge while waiting for passengers to arrive or charge overnight. The third location would be at a multistorey parking lot, where EV owners can park their car and charge it without any attention. This would be an ideal location with regards to time management as the users would prefer to park and charge their EVs as they visit the shopping center or use any other nearby transportation such as the metro or bus. The establishment of an EVCS at this location would also be an excellent investment by a EVCS services company due to the high volume of EVs in the parking lot.
At the first location, an ideal type of charge would be Level 1 AC due to the low demand for power and chargers in the area. As for the second charging point, since ICE buses still have the most function at present, it would be more suitable to place Level 2 AC chargers, but preliminary study could take place for future investment as EV buses will overrule ICE buses. Finally, for the third charging point, due to high power demand at the multistorey parking lot, it would be ideal for placing many DCFC EV chargers with high power ratings.
Table 1.
charateristics of considered EVCS points for commercial city centre area, Newcastle upon Tyne, UK.
Table 1.
charateristics of considered EVCS points for commercial city centre area, Newcastle upon Tyne, UK.
| Charging Point No. | Location Coordinates | No. of Chargers | Line length (km) |
|---|---|---|---|
| Charging Point 1 | 54.97614593907092, -1.6162228847542444 | 2 | 0.23 |
| Charging Point 2 | 54.975735707661045, -1.615957906832188 | 4 | 0.05 |
| Charging Point 3 | 54.97614593907092, -1.6162228847542444 | 6 | 0.11 |
3. Results from Technical Analysis, Simulations and Design
The impact of the grid in the above locations has been analysed with the use of PyCharm Pandapower.
3.1. 3-Bus Single Line System
First, the fundamentals of the model have been designed, which are the external grid, transformer, bus, lines, and loads. After the importation of Pandapower’s libraries and submodules, an empty network (net) has been designed for the required system. The parameter initial voltage magnitude per unit (p.u.) has been set as flat and the initial voltage angle (p.u.) has been set to DC.
Three buses (b0-b2) have been created and each of them specify their own network and grid voltage level. The external grid is specified in the code as well. A 25MVA 10/10kV transformer sub-station has also been developed between the buses b1 and b2. To finish the system topology, the loads have been created and the code indicates the bus connection, real power (MW), and name. The code used to set-up the time-series module without data control is given in Table 4 below.
Table 2.
Configuraiton of 3-bus system without control data.
| 1 | import pandapower as pp |
| 2 | |
| 3 | # create an empty network |
| 4 | net = pp.create_empty_network() |
| 5 | pp.set_user_pf_options(net, init_vm_pu=”flat”, init_va_degree=”dc”, calculate_voltage_angles=True) |
| 6 | |
| 7 | # create buses |
| 8 | b0 = pp.create_bus(net, 33) |
| 9 | b1 = pp.create_bus(net, 11) |
| 10 | b2 = pp.create_bus(net, 11) |
| 11 | b4 = pp.create_bus(net, 11) |
| 12 | |
| 13 | # create external grid |
| 14 | pp.create_ext_grid(net, b0, name=”external grid”) |
| 15 | |
| 16 | # create transformer |
| 17 | pp.create_transformer(net, b0, b1, “25 MVA 110/10 kV”, name=’transformer’) |
| 18 | |
| 19 | # create lines |
| 20 | pp.create_line(net, b1, b2, 0.01, “149-AL1/24-ST1A 10.0”, name=”line1”) |
| 21 | pp.create_line(net, b1, b3, 0.24, “149-AL1/24-ST1A 10.0”, name=”line2”) |
| 22 | |
| 23 | # create loads |
| 24 | pp.create_load(net, b2, p_mw=0.011, name=’location1’) |
| 25 | pp.create_load(net, b3, p_mw=0.06, name=’EV power capacity’) |
| 26 | |
| 27 | pp.runpp(net) |
| 28 | print(net.res_line) |
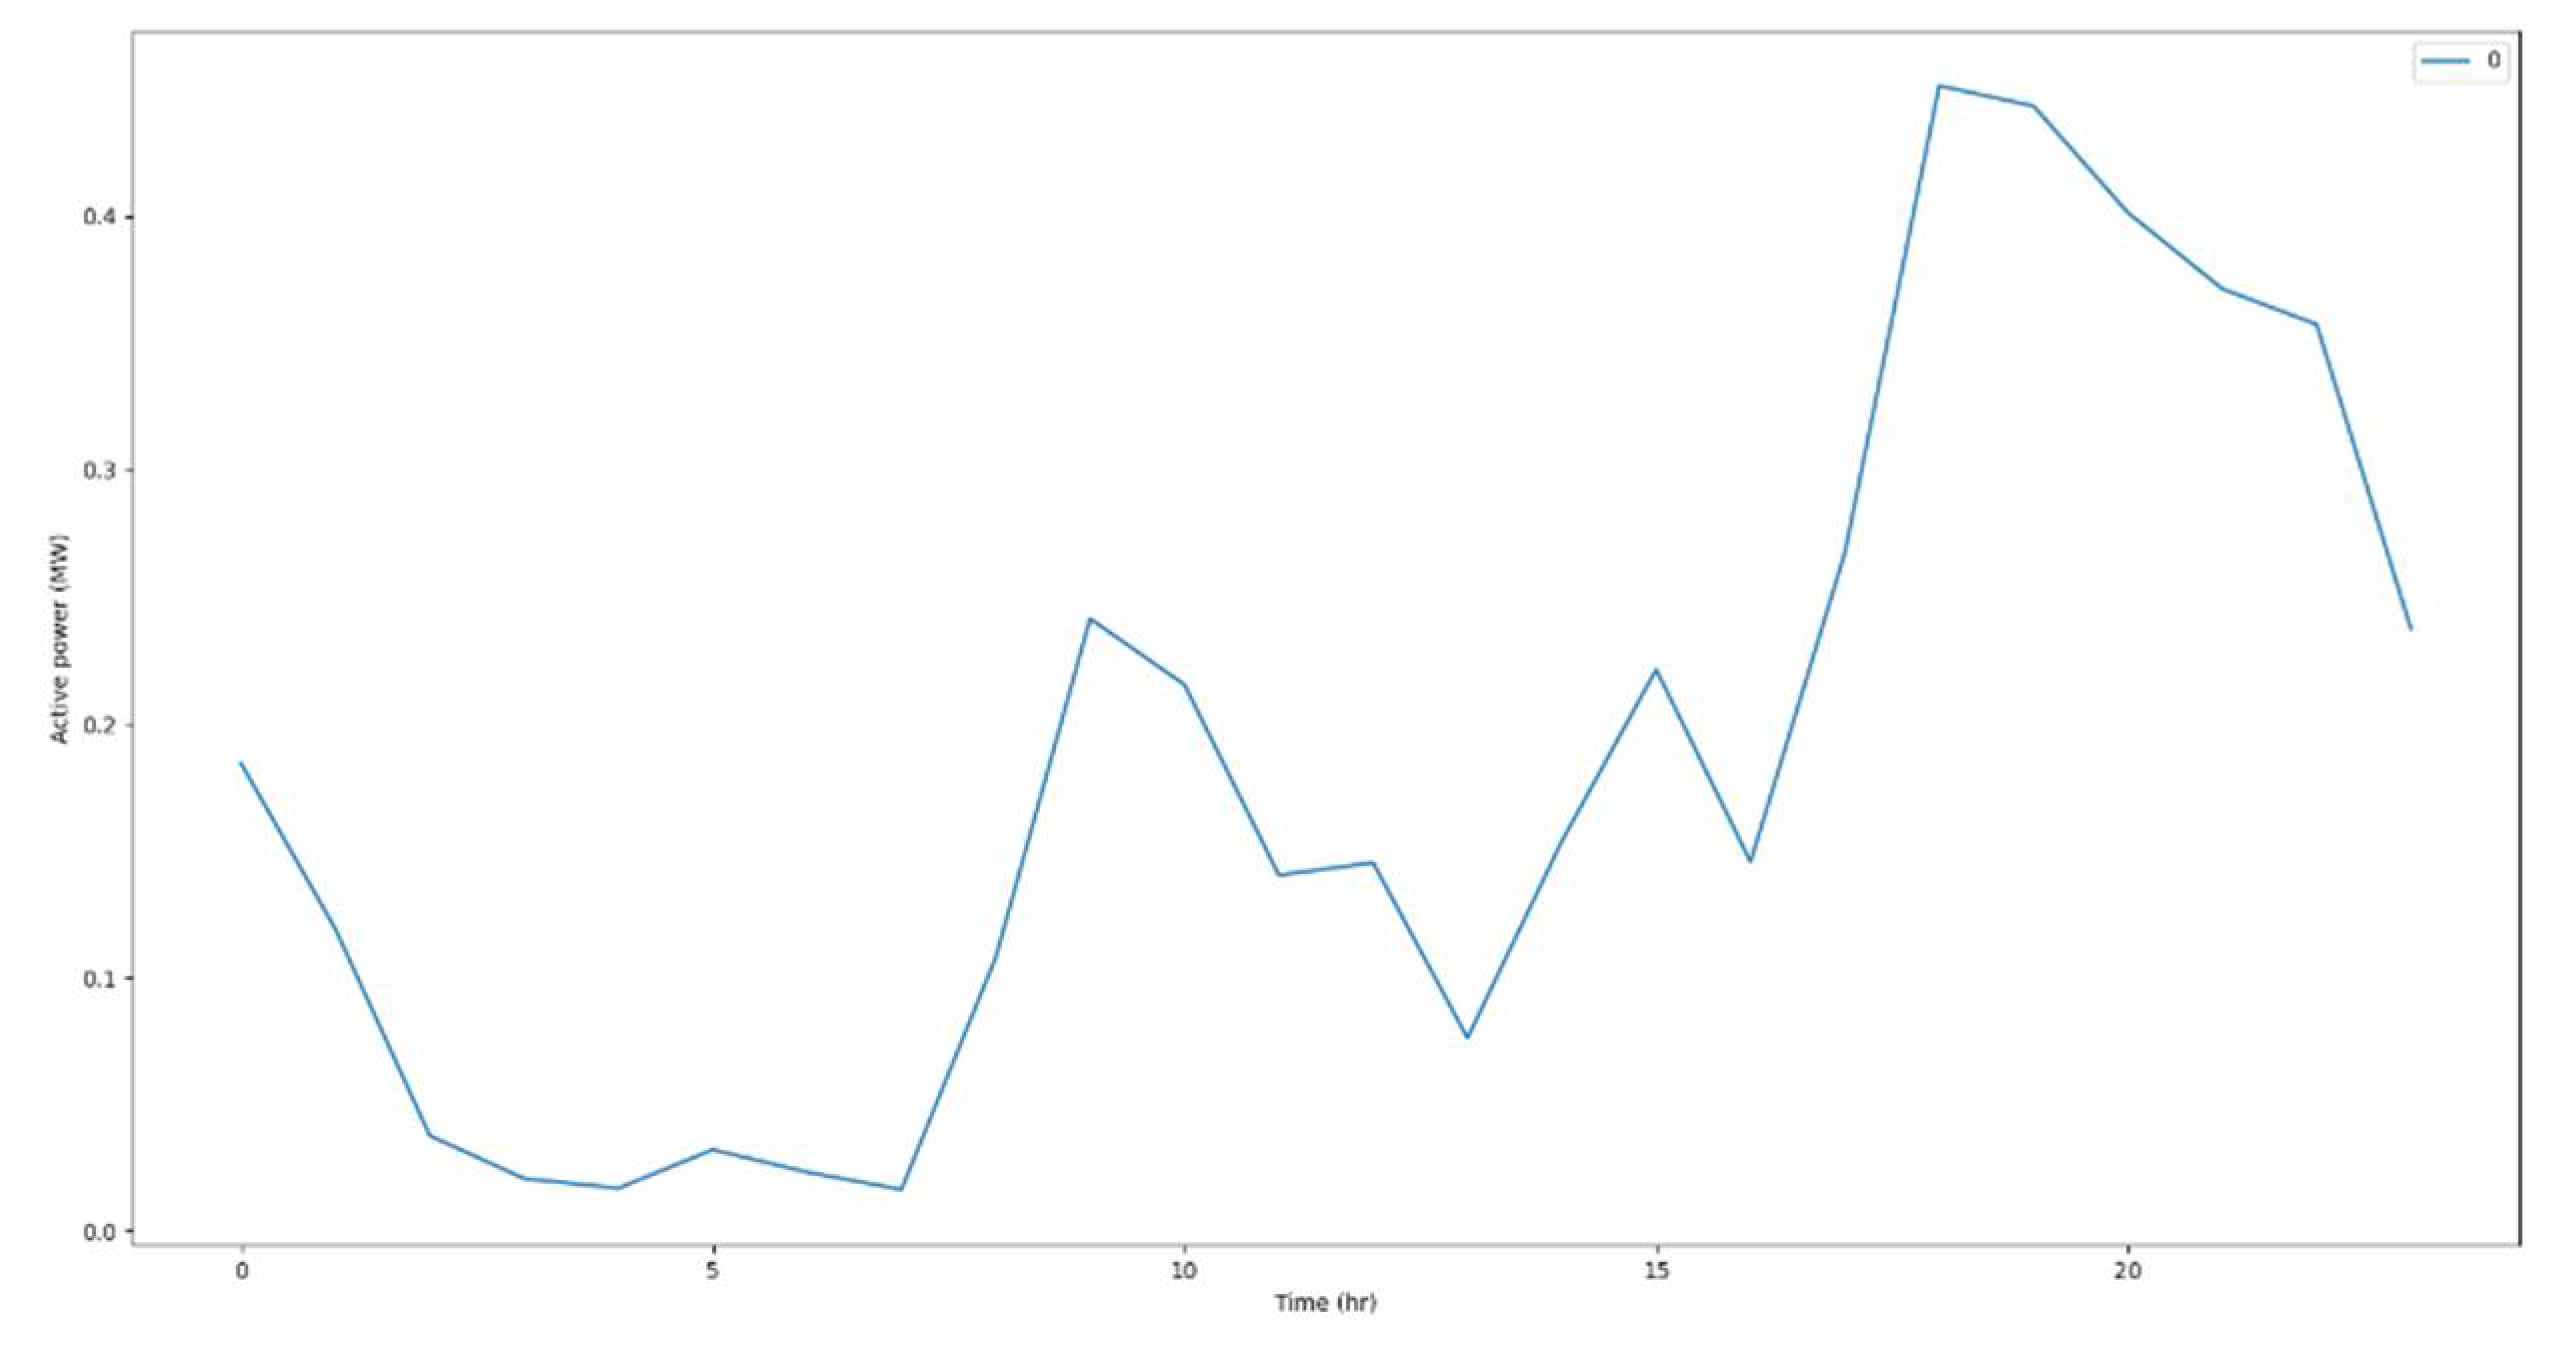
The power consumption data has been inputted to simulate the impact of the grid under these conditions over a day. The data represents the hourly EV power consumption at a specific time period, between 12 a.m.-12 p.m. The data has been imported as a data frame which indicates the excel file, sheet name and column. A controller that uses the time series module has then been made to read data from the generated DataSource and write it to the grid (net). After the values have been updated, the outputs of the module have been formatted and stored using the tool OutputWriter.
The EV power consumption has been assumed to be constant every hour and a timestep function is set from 0-23 hours (24 hours in total). An excel sheet has been created with two columns, the first column indicates the number of timesteps and the other indicates the resulting value. A time-series module has then been run which creates a loop over every timestep and the controllers would update the element variables. The results have been used to plot a visual graph. The code used to set-up the time-series module with control data is given in Figure 5 below.
Table 3.
Configuration of 3-bus system with control data.
| 1 | import pandapower as pp |
| 2 | import pandas as pd |
| 3 | from pandapower.timeseries.data_sources.fram_data import DFData |
| 4 | import pandapower.control as control |
| 5 | from pandapower.timeseries.output_writer import OutputWriter |
| 6 | from pandapower.timeseries.run_time_series import run_timeseries |
| 7 | import matplotlib.pyplot as plt |
| 8 | |
| 9 | # create an empty network |
| 10 | net = pp.create_empty_network() |
| 11 | pp.set_user_pf_options(net, init_vm_pu=”flat”, init_va_degree=”dc”, calculate_coltage_angles=True) |
| 12 | |
| 13 | # create buses |
| 14 | b0 = pp.create_bus(net, 33) |
| 15 | b1 = pp.create_bus(net, 11) |
| 16 | b2 = pp.create_bus(net, 11) |
| 17 | b3 = pp.create_bus(net, 11) |
| 18 | |
| 19 | # create external grid |
| 20 | pp.create_ext_grid(net, b0, name=”external grid”) |
| 21 | |
| 22 | # create transformer |
| 23 | pp.create_transformer(net, b0, b1, “25 MVA 110/10 kV”, name=’transformer’) |
| 24 | |
| 25 | # create lines |
| 26 | pp.create_line(net, b1, b2, 0.01, “149-AL1/24-ST1A 10.0”, name=”line1”) |
| 27 | pp.create_line(net, b1, b3, 0.24, “149-AL1/24-ST1A 10.0”, name=”line2”) |
| 28 | |
| 29 | # create loads |
| 30 | pp.create_load(net, b2, p_mw=0.011, name=’location1’) |
| 31 | pp.create_load(net, b3, p_mw=0.06, name=’Ev power capacity’) |
| 32 | |
| 33 | # create data frame and data source |
| 34 | df = pd.read_excel(“hourly EV energy demand.xlsx”, sheet_name=”Sheet1”, index_col=0) |
| 35 | ds = DFData(df) |
| 36 | |
| 37 | # create controller |
| 38 | const_load = control.ConstControl(net, ‘load’, ‘p_mw’, element_index=net.load.index, profile_name=”EV power consumption”, data_source=ds) |
| 39 | |
| 40 | # create output writer |
| 41 | ow = OutpotWriter(net, time_steps=(0,23), output_path=”./results/”, output_file_type=”.xlsx”) |
| 42 | ow.log_variable(“res_bus”, “p_mw”) |
| 43 | |
| 44 | # create timeseries |
| 45 | run_timeseries(net, n_timesteps=(0,23)) |
| 46 | |
| 47 | # read results from excel file |
| 48 | df = pd.read_excel(“./results/res_bus/p_mw.xlsx”, index_col=0) |
| 49 | |
| 50 | # plot results from excel file using data frame |
| 51 | df.plot() |
| 52 | plt.show() |
3.2. 6-Bus Single Line System
The second case with a 6-bus single line system has also been developed. The buses possess the same parameters as in the previous case, but the lines and loads would vary in length and active power, respectively.
Line 2 has been connected from b2 to b3 with 0.09km length, and line 3 has been connected from b3 to b4 with 0.25km length. For loads, load two has been connected at b3 with 0.022MW (22kW) active power and load three has been connected at b4 with 0.036MW (36kW) active power.
The simulation has been first run without including the time-series module and then again after including it.
3.3. Cost Analysis
AutoDesign has been used to estimate the budget of the potential connection cost (at 2022 prices). To estimate the cost of an EVCS, the three different levels of charging have been considered: Level 1 AC 120V (1.4kW), Level 2 AC 240V (3.3-6.6kW), and DC Fast Charging (25-50kW).
Table 4.
Cost Breakdown of EV charging stations.
| Item Name | Description | Qty | Unit Price (GBP) | Total Price (GBP) | Reference |
|---|---|---|---|---|---|
| Type of Chargers | |||||
| AC Level 1 | 120 V | 1 | 260 | www.alibaba.com |
|
| AC Level 2 | 240V | 1 | 800 | www.alibaba.com |
|
| DC Fast | 480V+ | 1 | 18000 | www.alibaba.com |
|
| Type of Charging cables | |||||
| AC Level 1 | 1 | 16 | www.alibaba.com |
||
| AC Level 2 | 1 | 35 | www.alibaba.com |
||
| DC Fast | 1 | 105 | www.alibaba.com |
||
| Office Components | |||||
| Desktop | Design, simulation and monitoring | 3 | 1,200 | 3,600 | www.alibaba.com |
| Monitor | 3 | 450 | 1,350 | www.alibaba.com |
|
| Desk | 3 | 560 | 1,680 | www.alibaba.com |
|
| Chair | 3 | 230 | 690 | www.alibaba.com |
Table 5.
AutoDesign Budget Estimation for each considered location.
| Location | Charging point | Final price without VAT (GBP) | VAT 20% (GBP) | Final price with VAT (GBP) |
|---|---|---|---|---|
| Elswick Row | 1 | 4,500 | 900 | 5,400 |
| 2 | 48,500 | 9,700 | 58,200 | |
| 3 | 23,000 | 4,600 | 27,600 | |
| Eldon Square | 1 | 78,500 | 15,700 | 94,200 |
| 2 | 13,200 | 2,640 | 15,840 | |
| 3 | 25,000 | 5,000 | 30,000 |
3.4. Simulation Results
3.4.1. Location 1
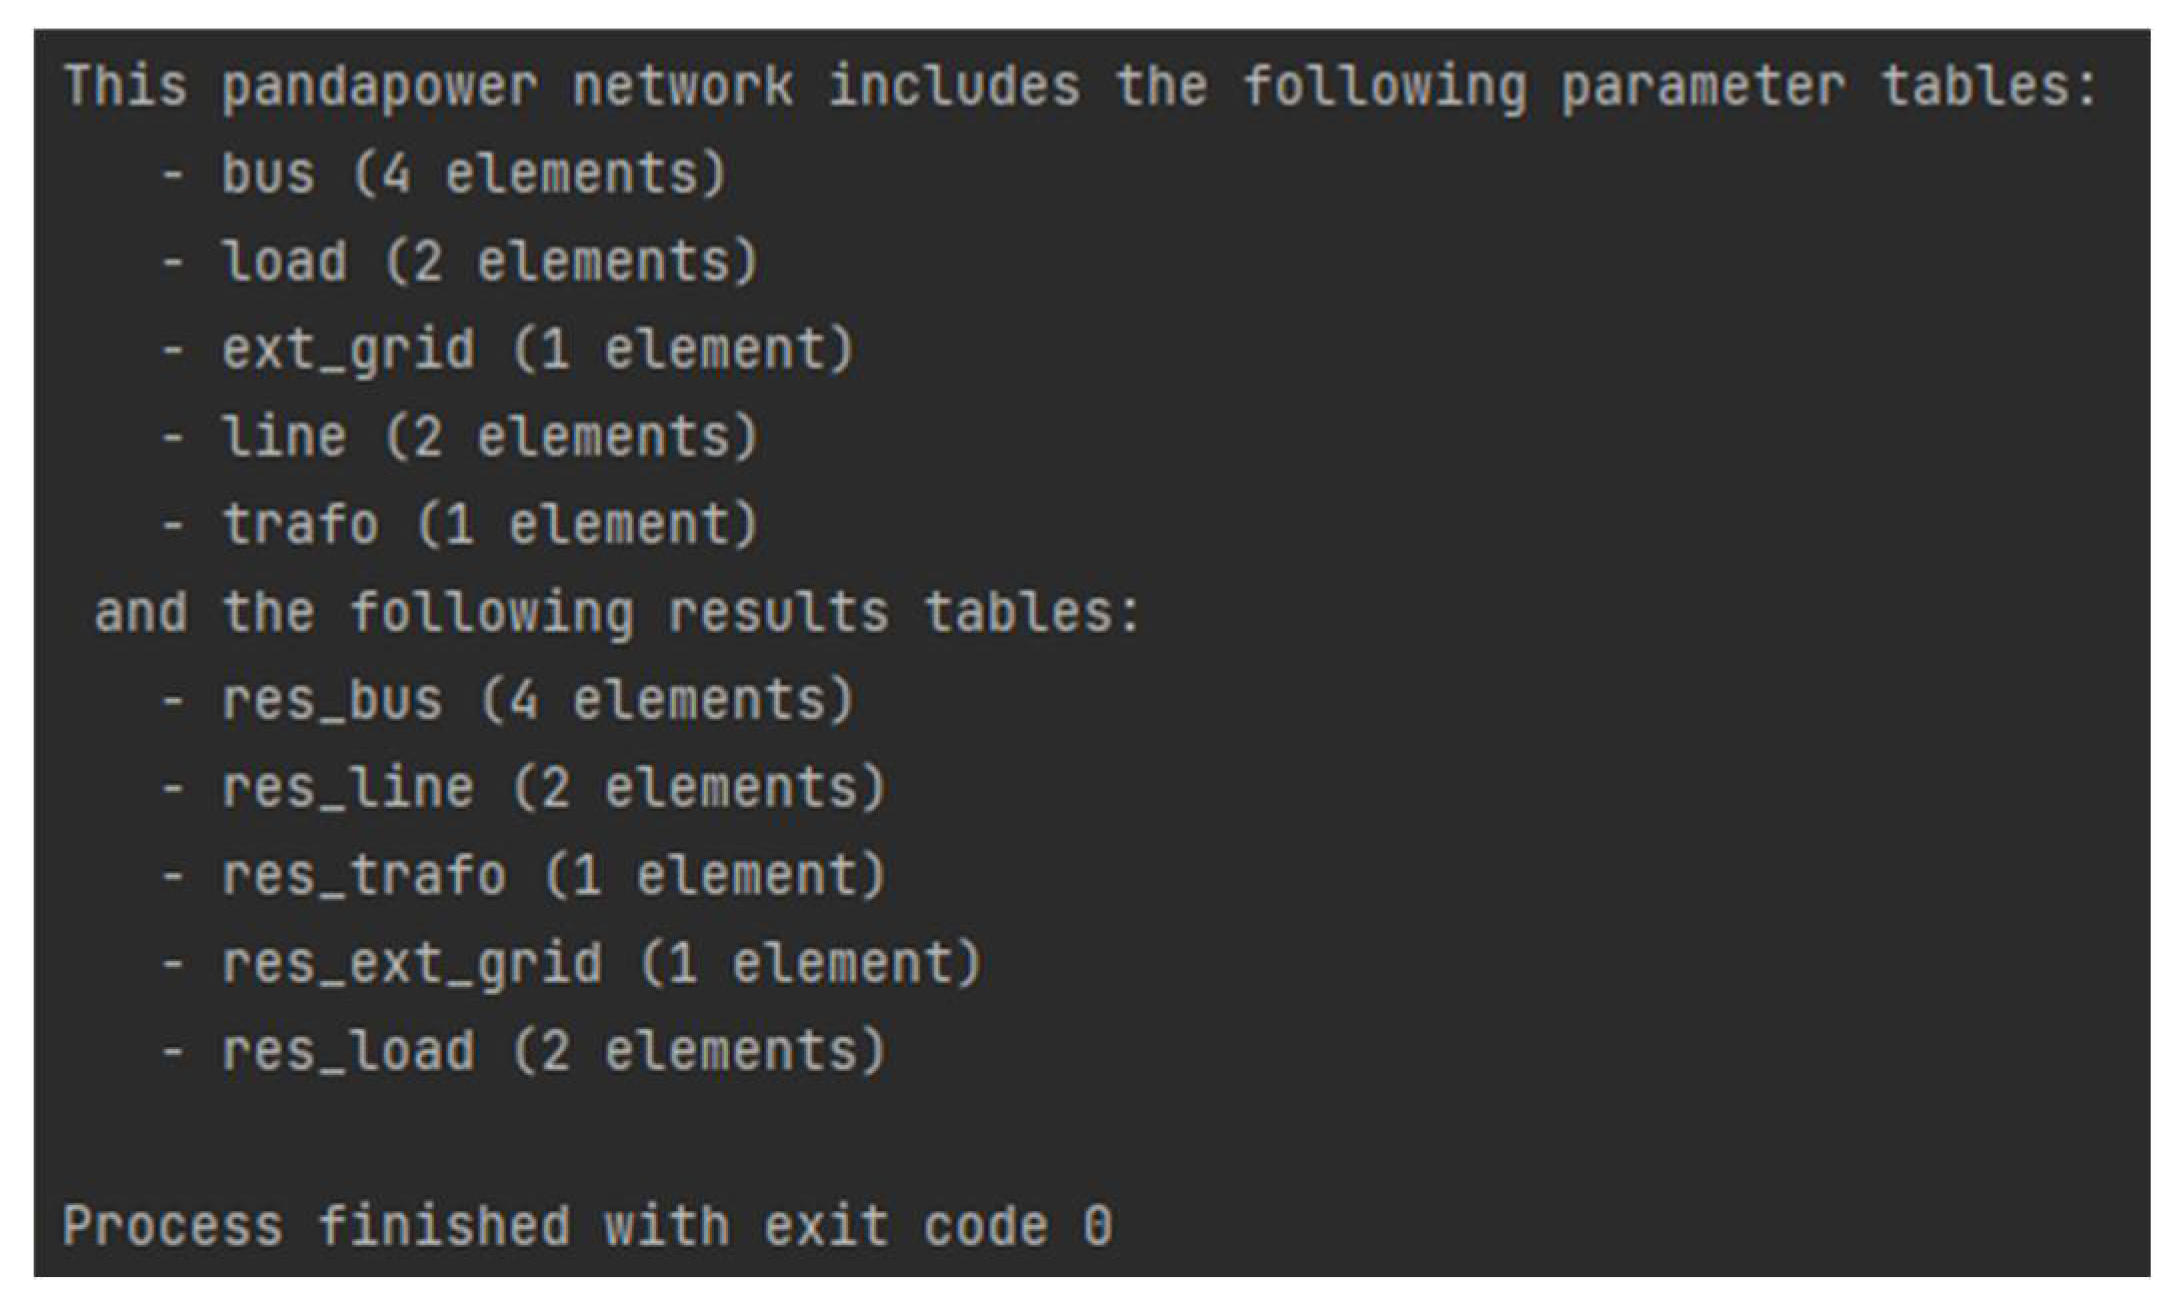
4. Bus
The function ‘res_element’ of Pandapower has been used to identify and observe the network elements which could be the loads, lines, the transformer or the external grid.
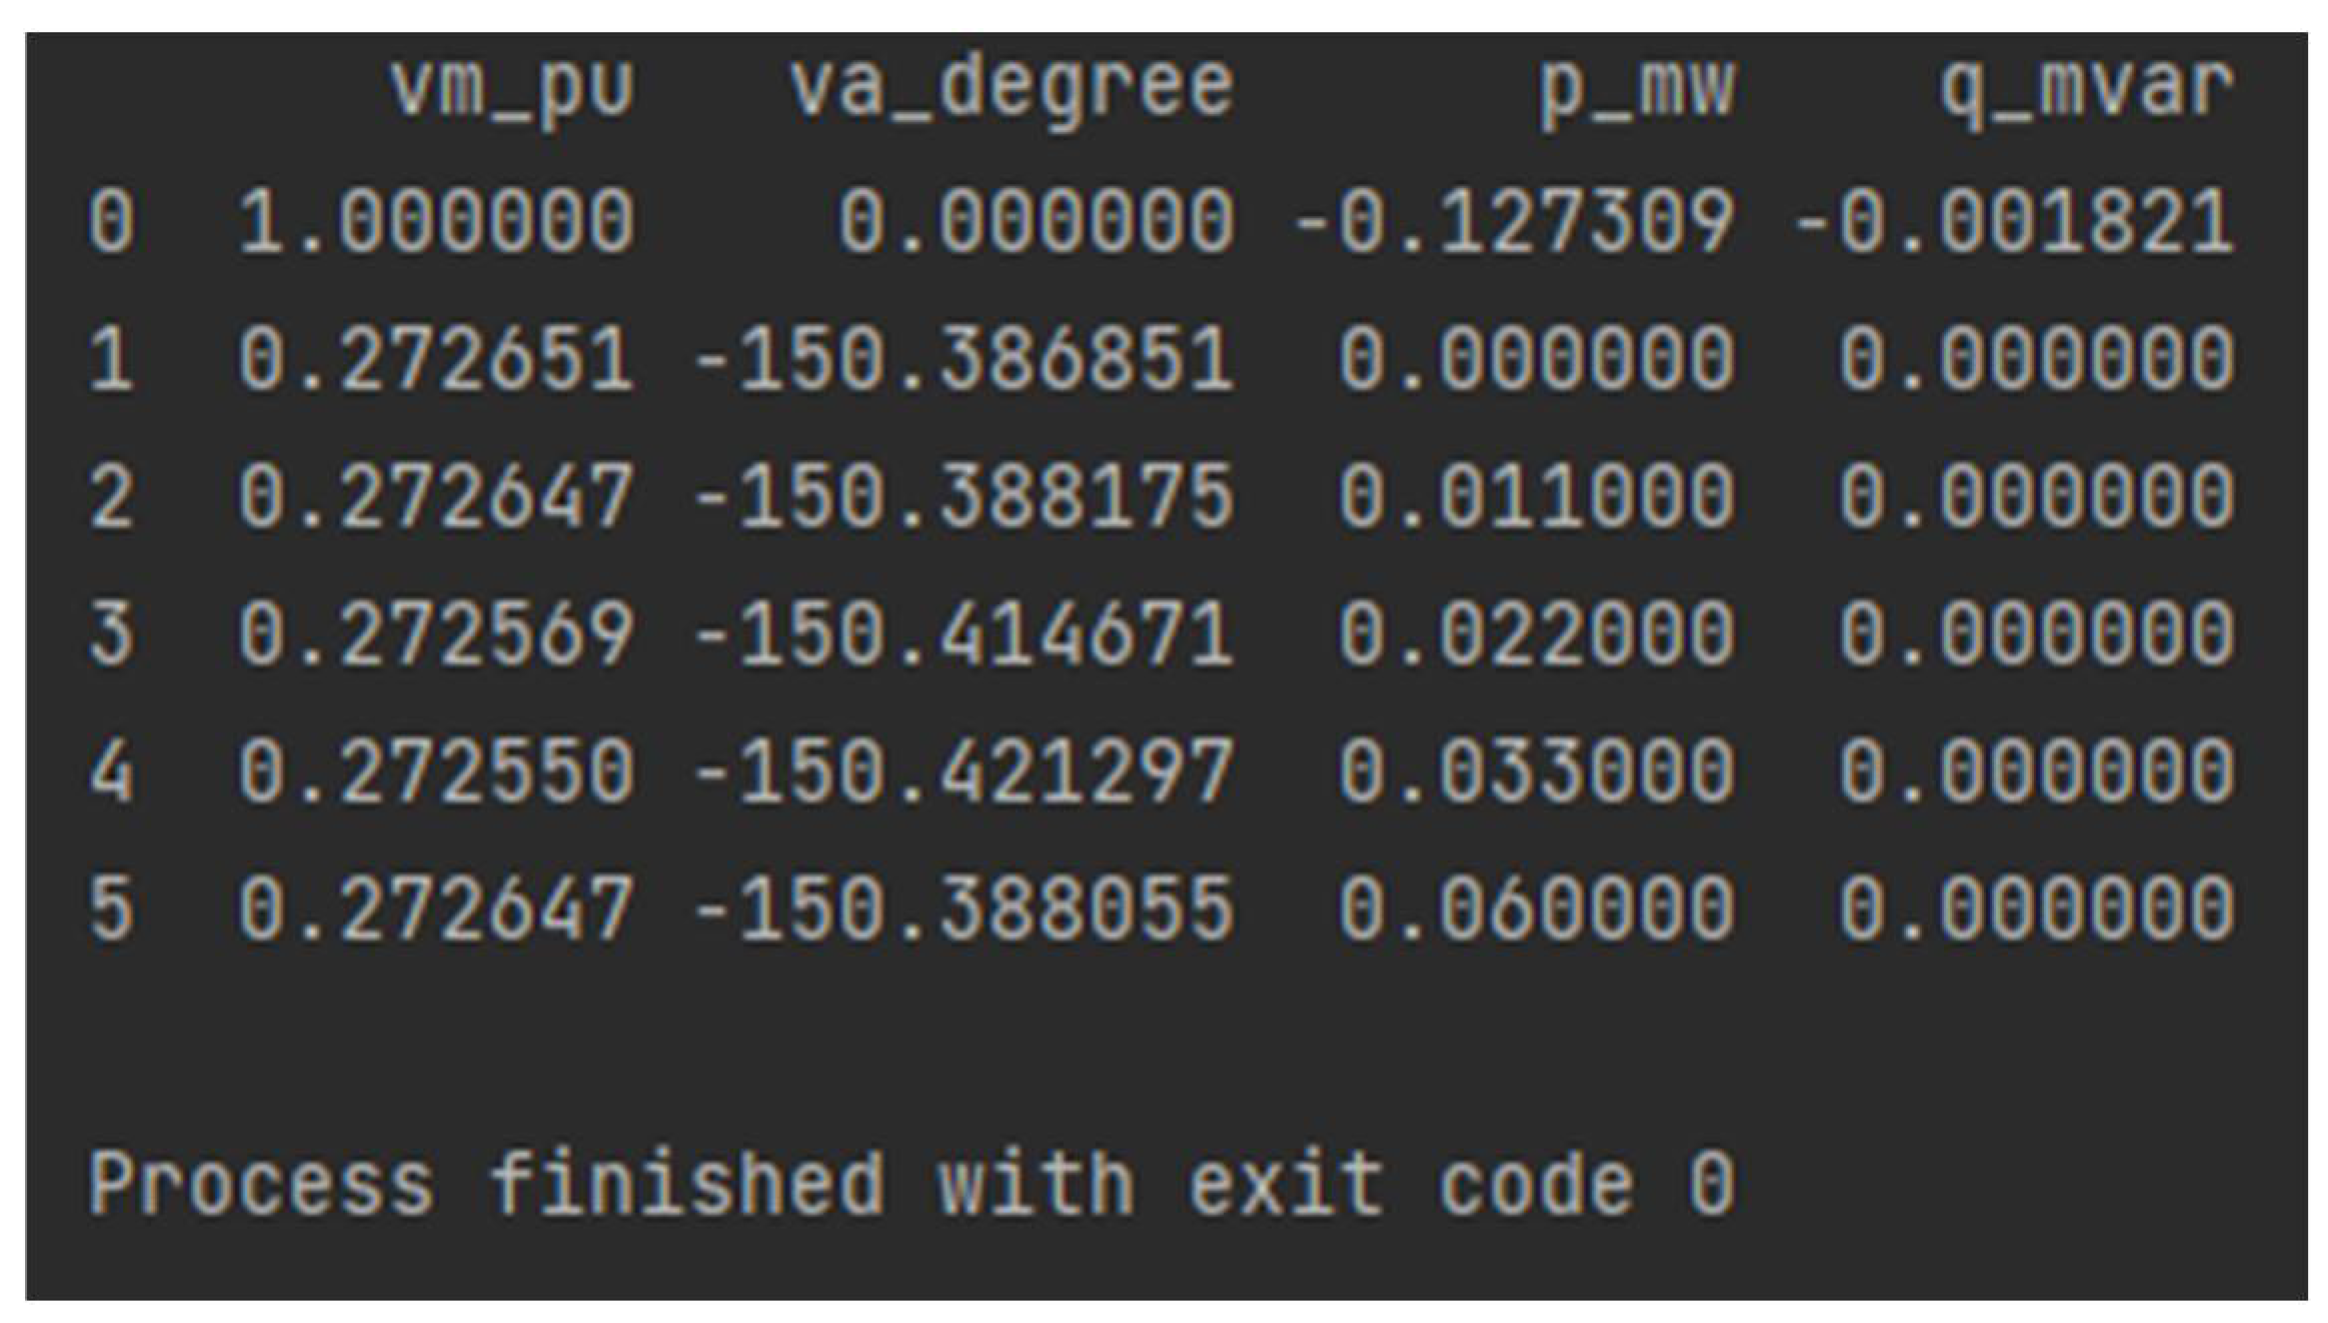
Figure 6.
Parameters and results values of the 3-bus system.
The four parameters of the buses b0-b3- voltage magnitude in p.u (vm_pu), voltage angle in degrees (va_degree), active power demand in MW (p_mw), and reactive power demand in MVAr (q_mvar), had been studied.
Figure 7.
Bus results of 3-bus system without control data.
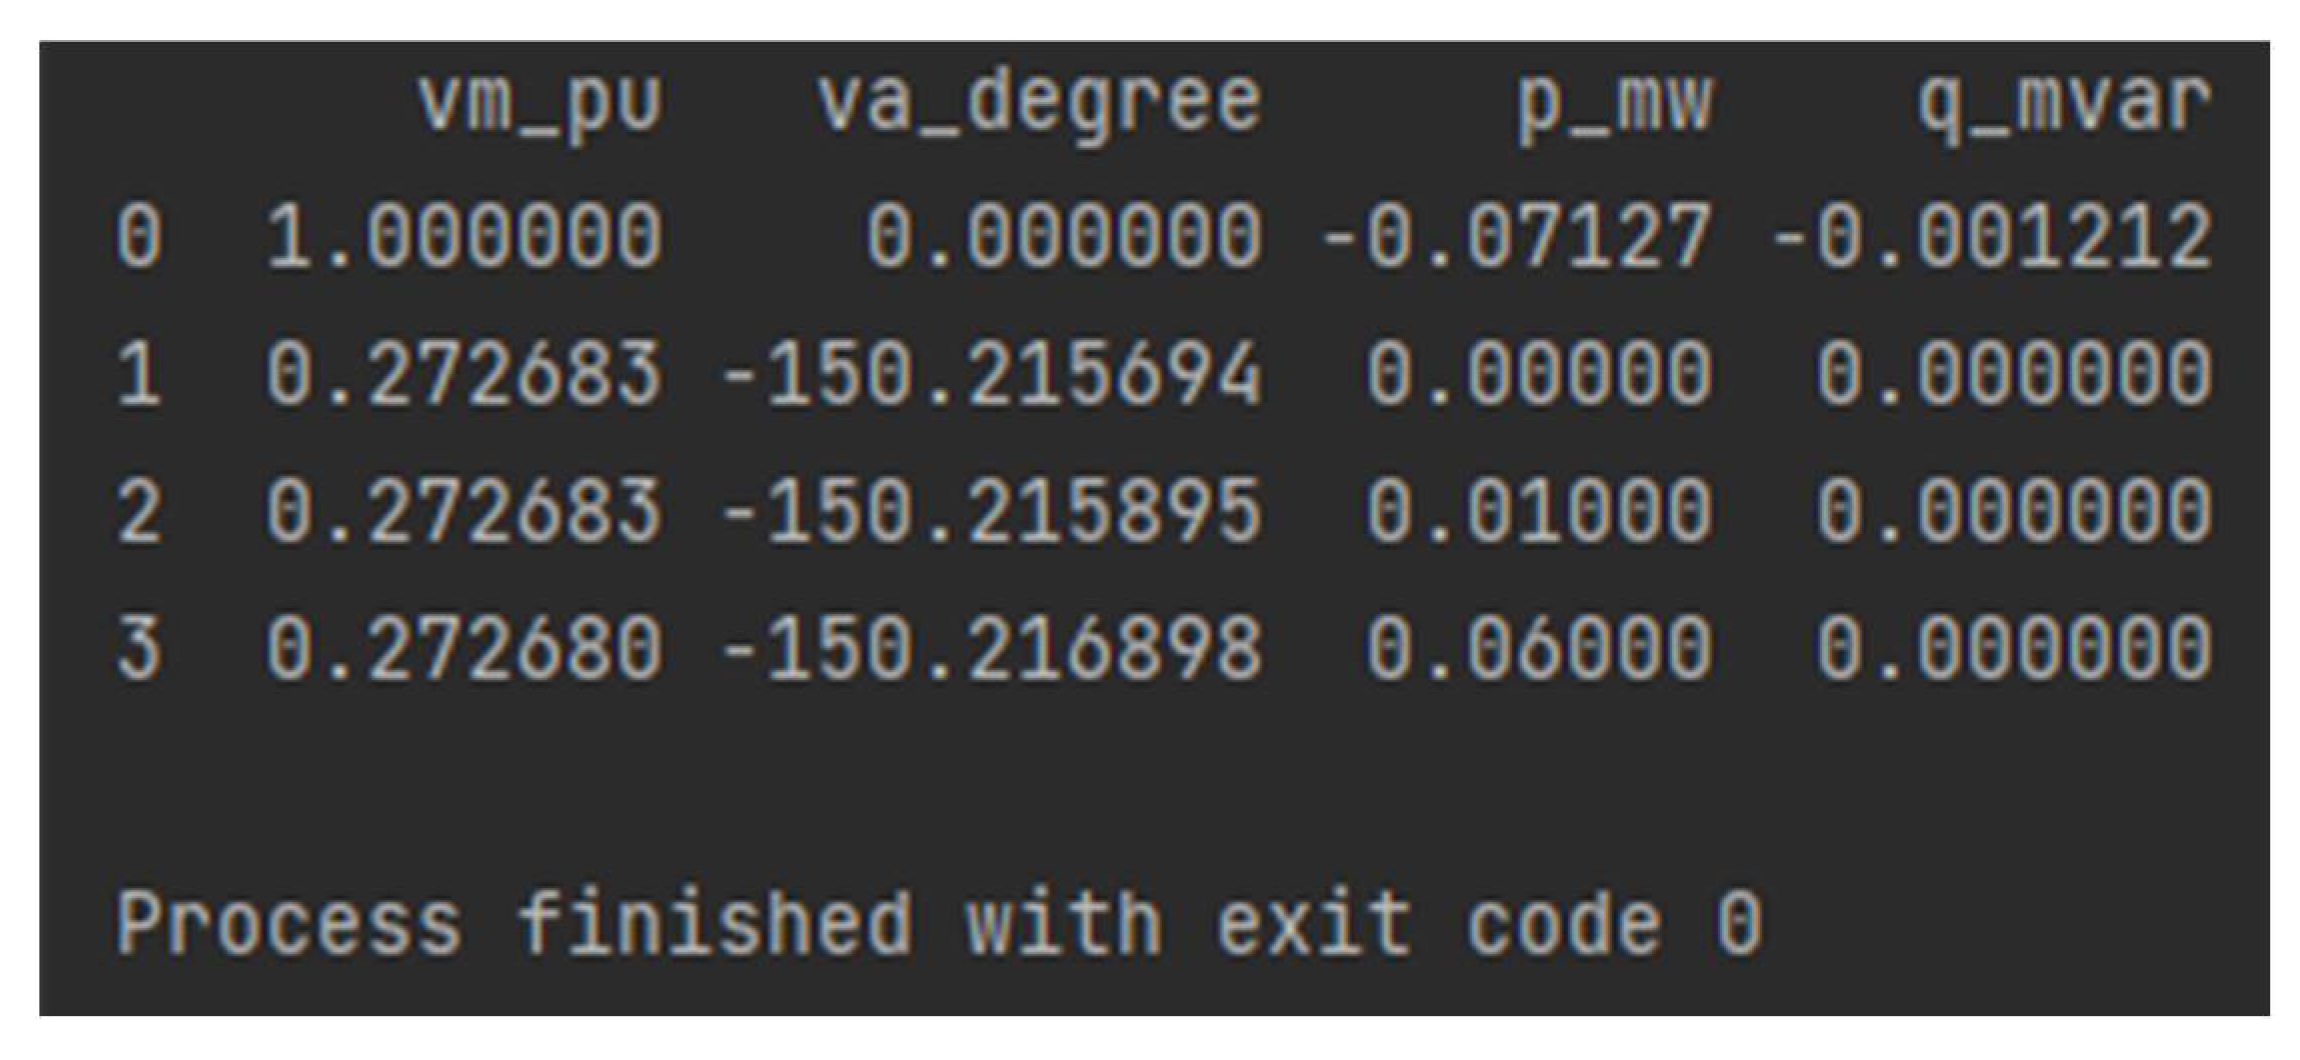
The bus b0, which is the external grid, had an initial voltage magnitude of 1 p.u, which is considered the maximum point of the system where b1-b3 are constant at 0.27 p.u. This scenario is ideal because the system could maintain constant and steady voltage at all buses after load impacts.
Next, the active power (p_mw) had been seen to be a slightly negative value due to the circuit’s limited amount of reactive power. This would mean that the external grid is consuming an amount of real power (0.07MW or 70kW).
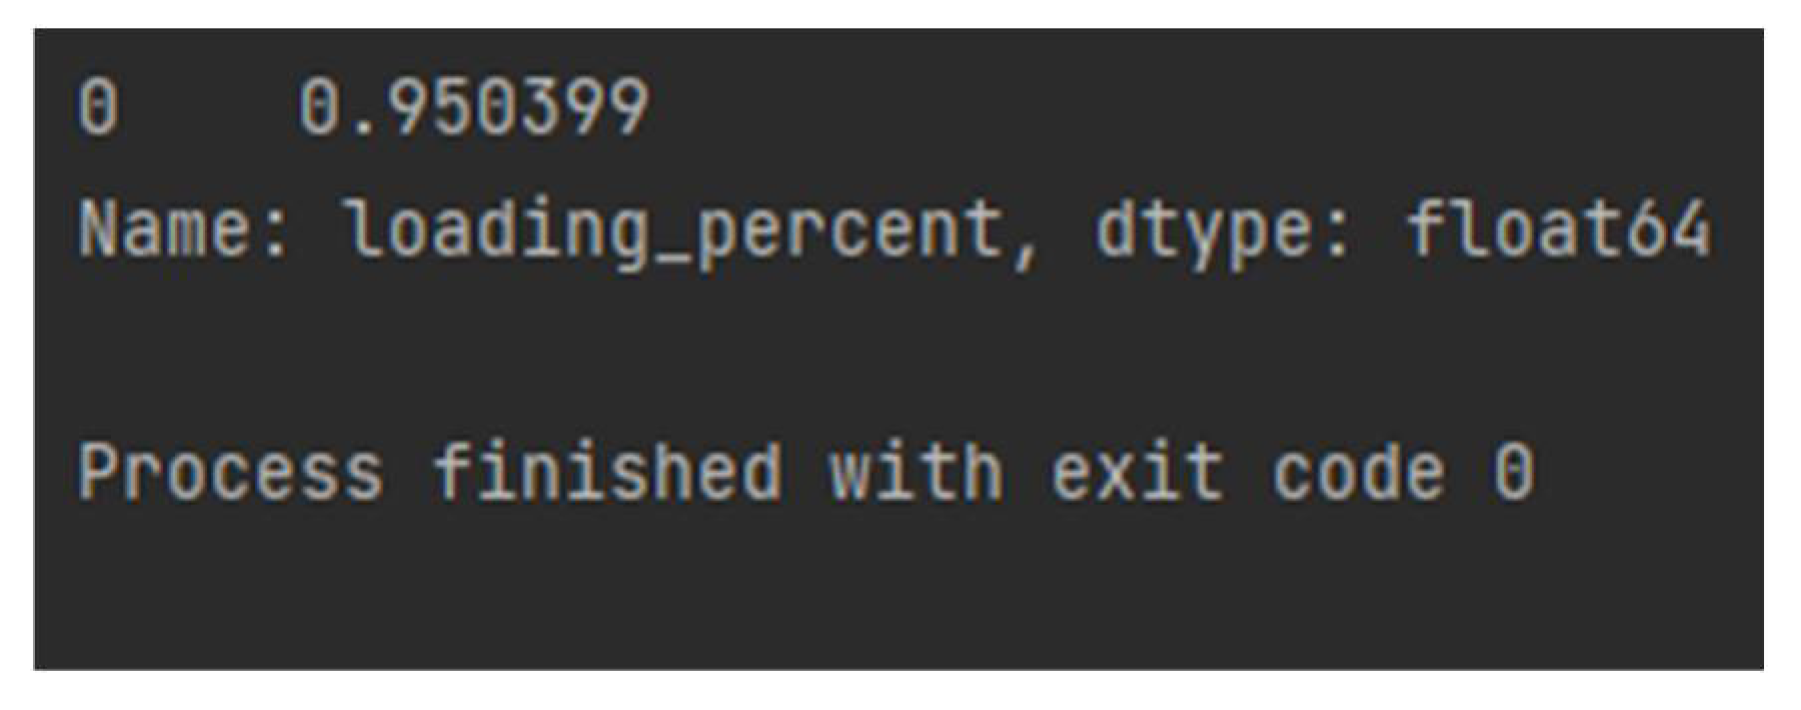
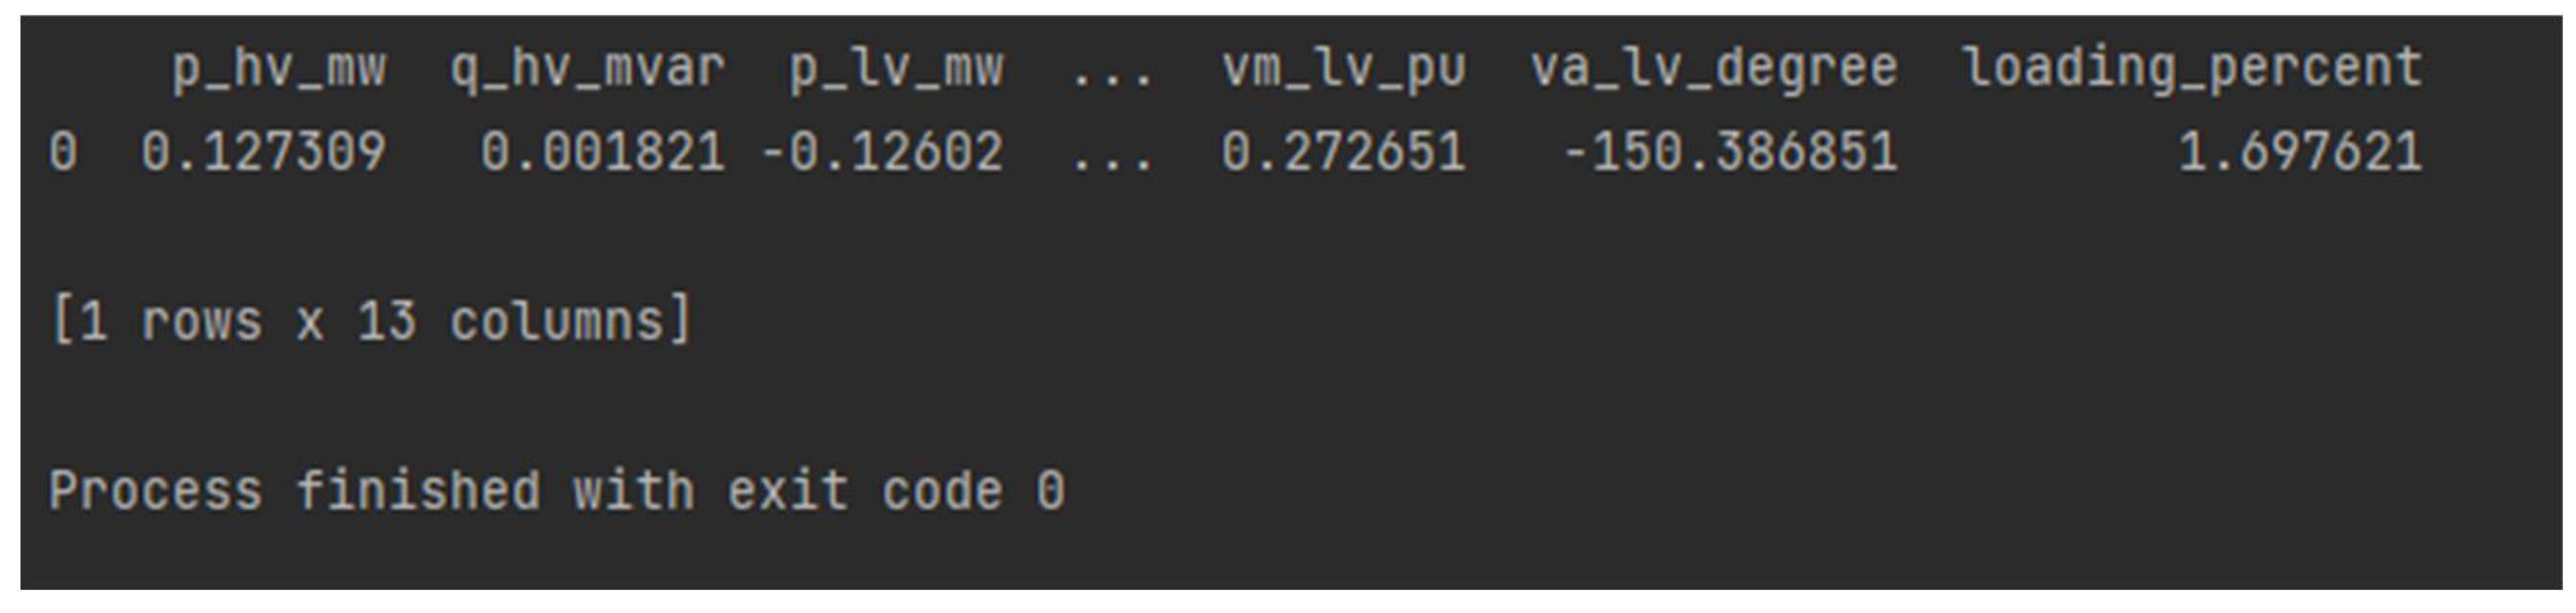
The load utilization relative to rated power % (loading per cent) and active power losses MW of the transformer had also been observed and could be considered negligible. It could be concluded that the transformer is not receiving any additional stress from the charging point and EV.
Figure 8.
Power loss of transformer in 3-bus system without control data.
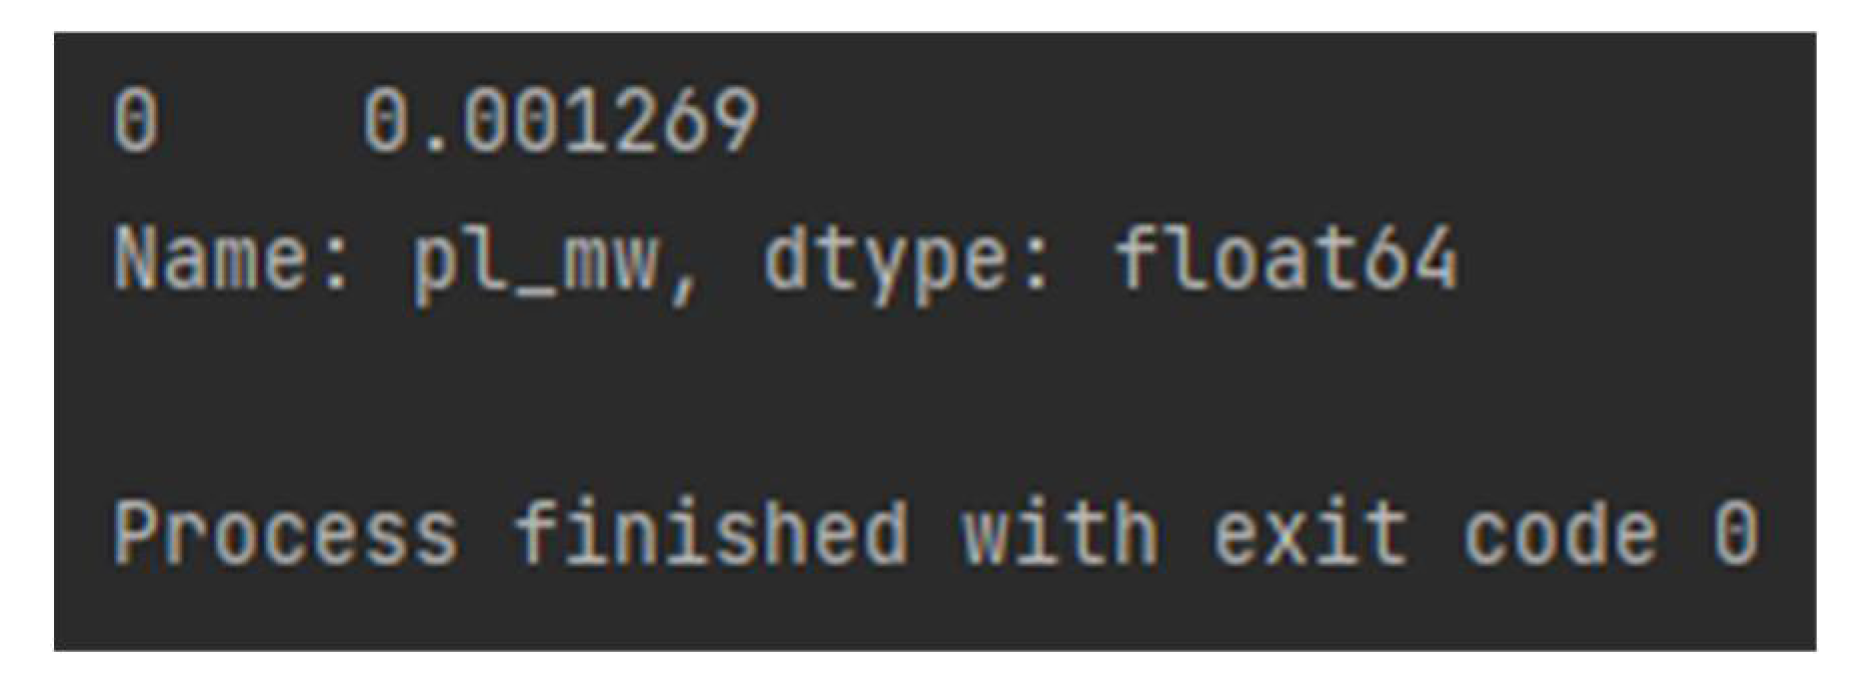
Figure 9.
Loading percent of transformer in the 3-bus system without control data.
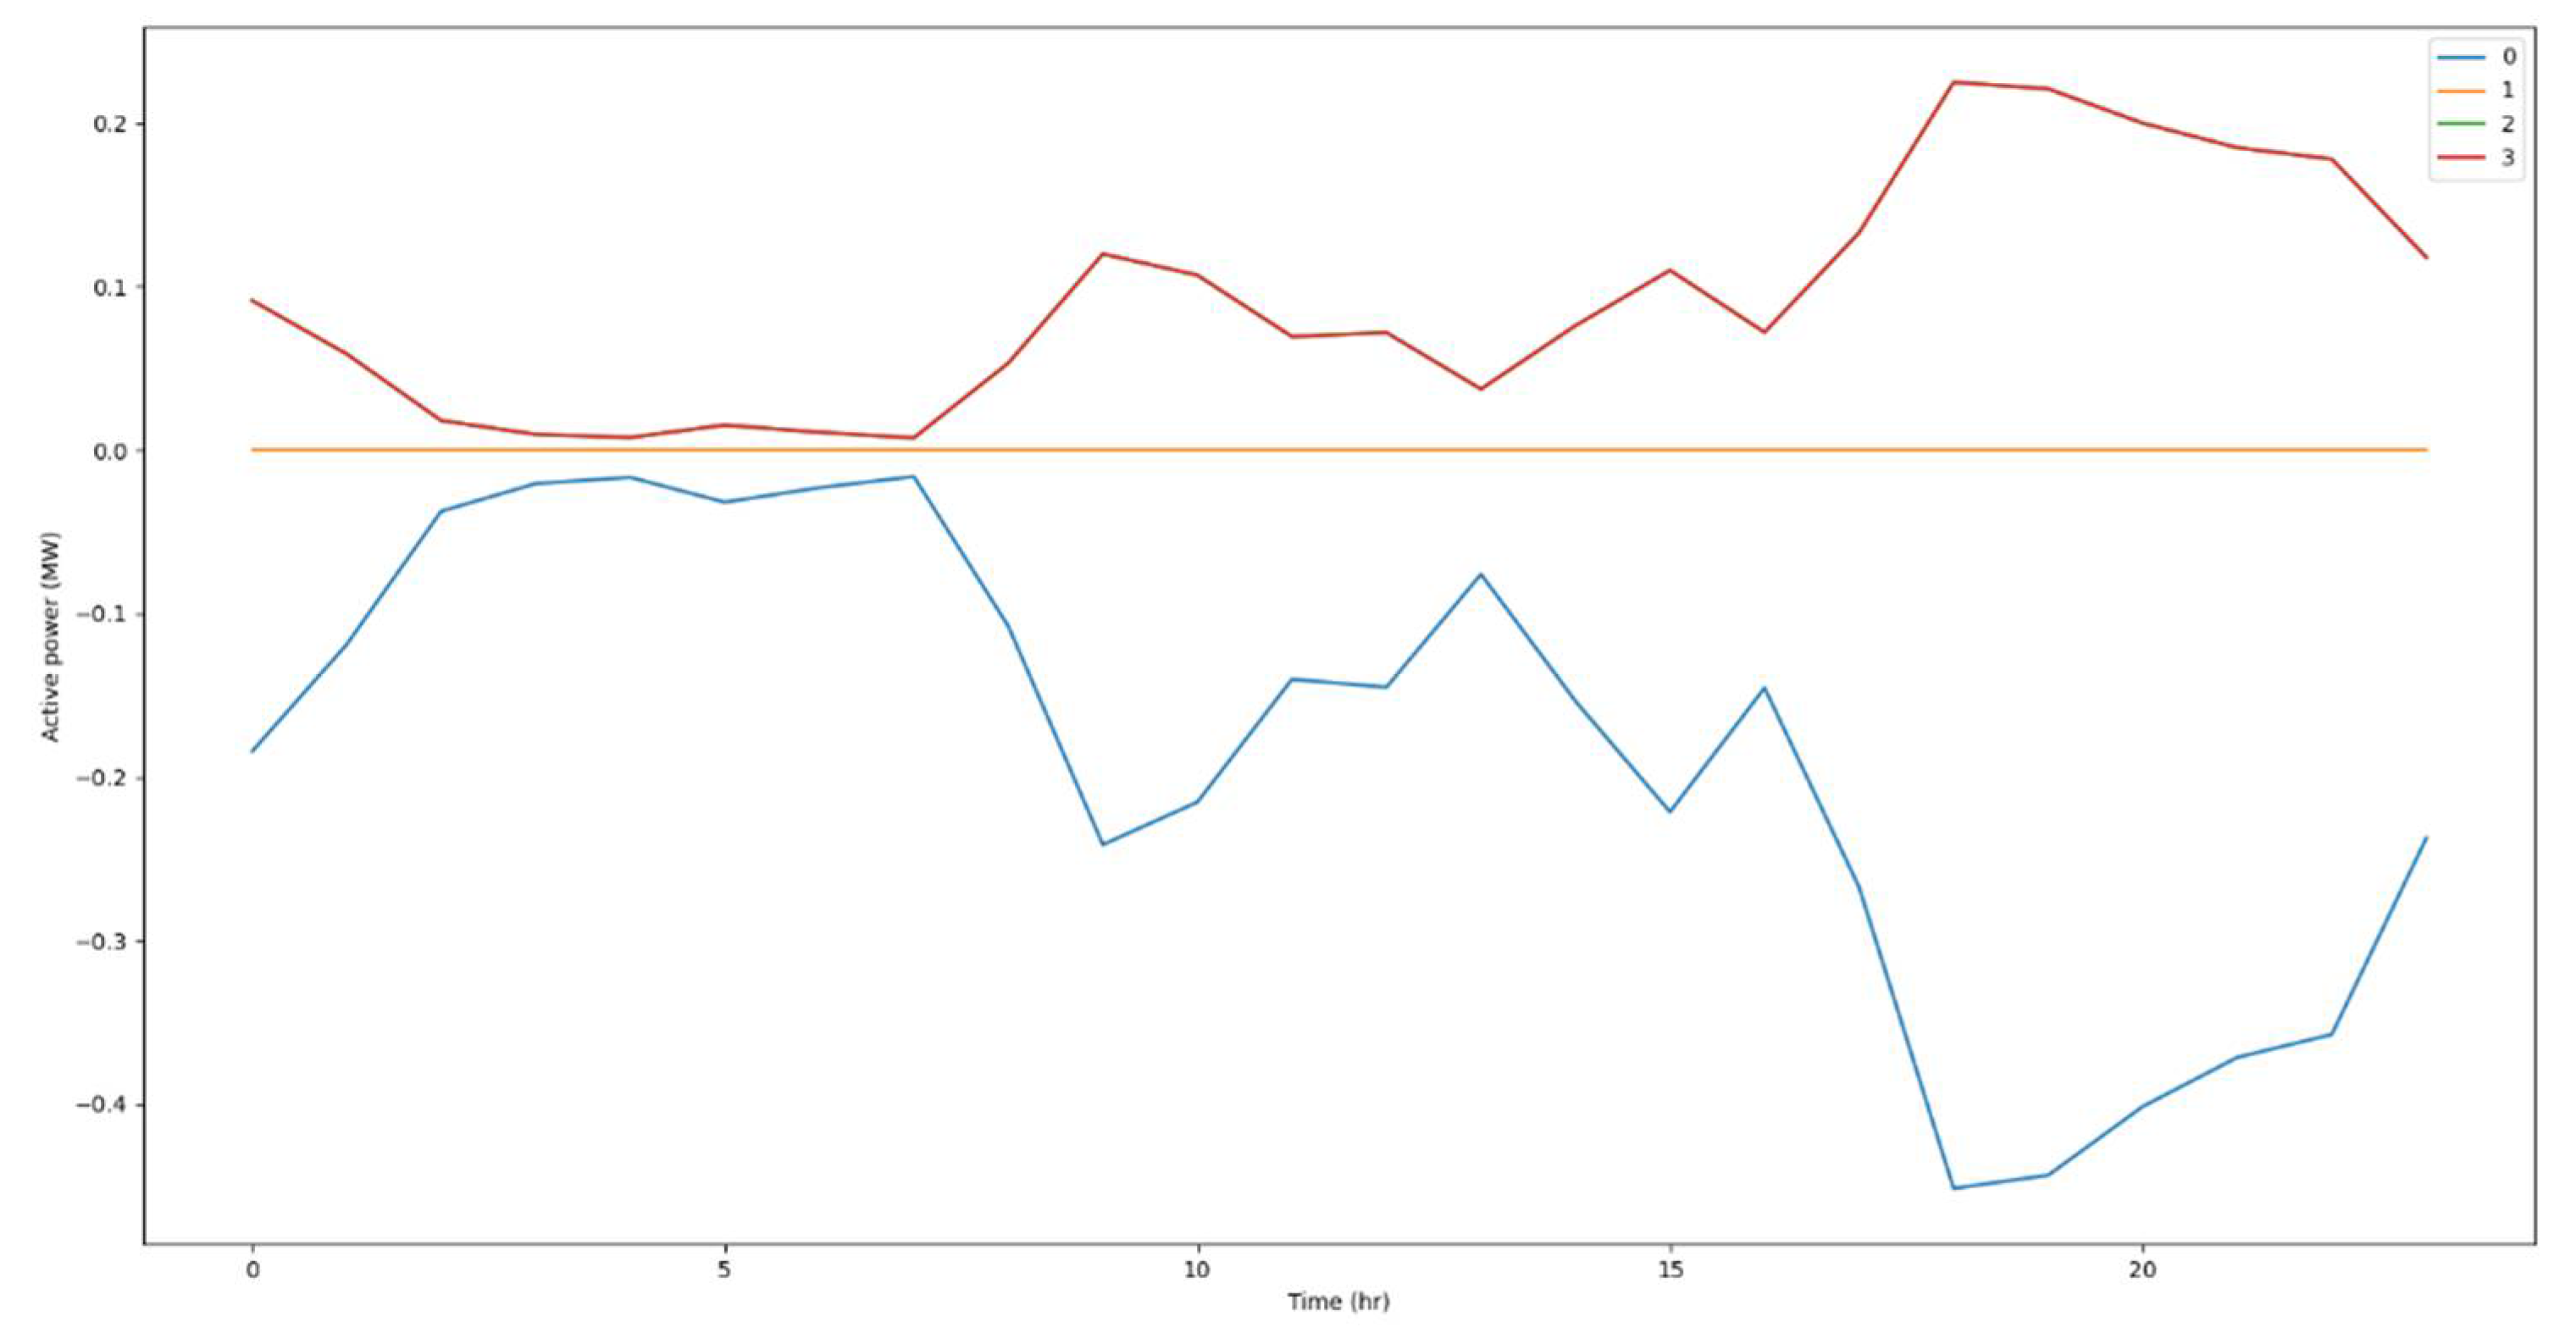
The time series module was then included to observe how the grid would react in a day using EV power consumption data in a graphical form.
It could be assumed that b2 and b3 had the same active power and thus b1 (the bus connected to the transformer) neither consumed nor supply power because the grid would consume most of the power from both loads. Furthermore, the grid absorbed almost double the number of loads combined at around 7 p.m. while the lowest power consumption was at 8 a.m.
Figure 10.
Simulation as to how the local grid would react in a day using EV power consumption data.
Figure 10.
Simulation as to how the local grid would react in a day using EV power consumption data.
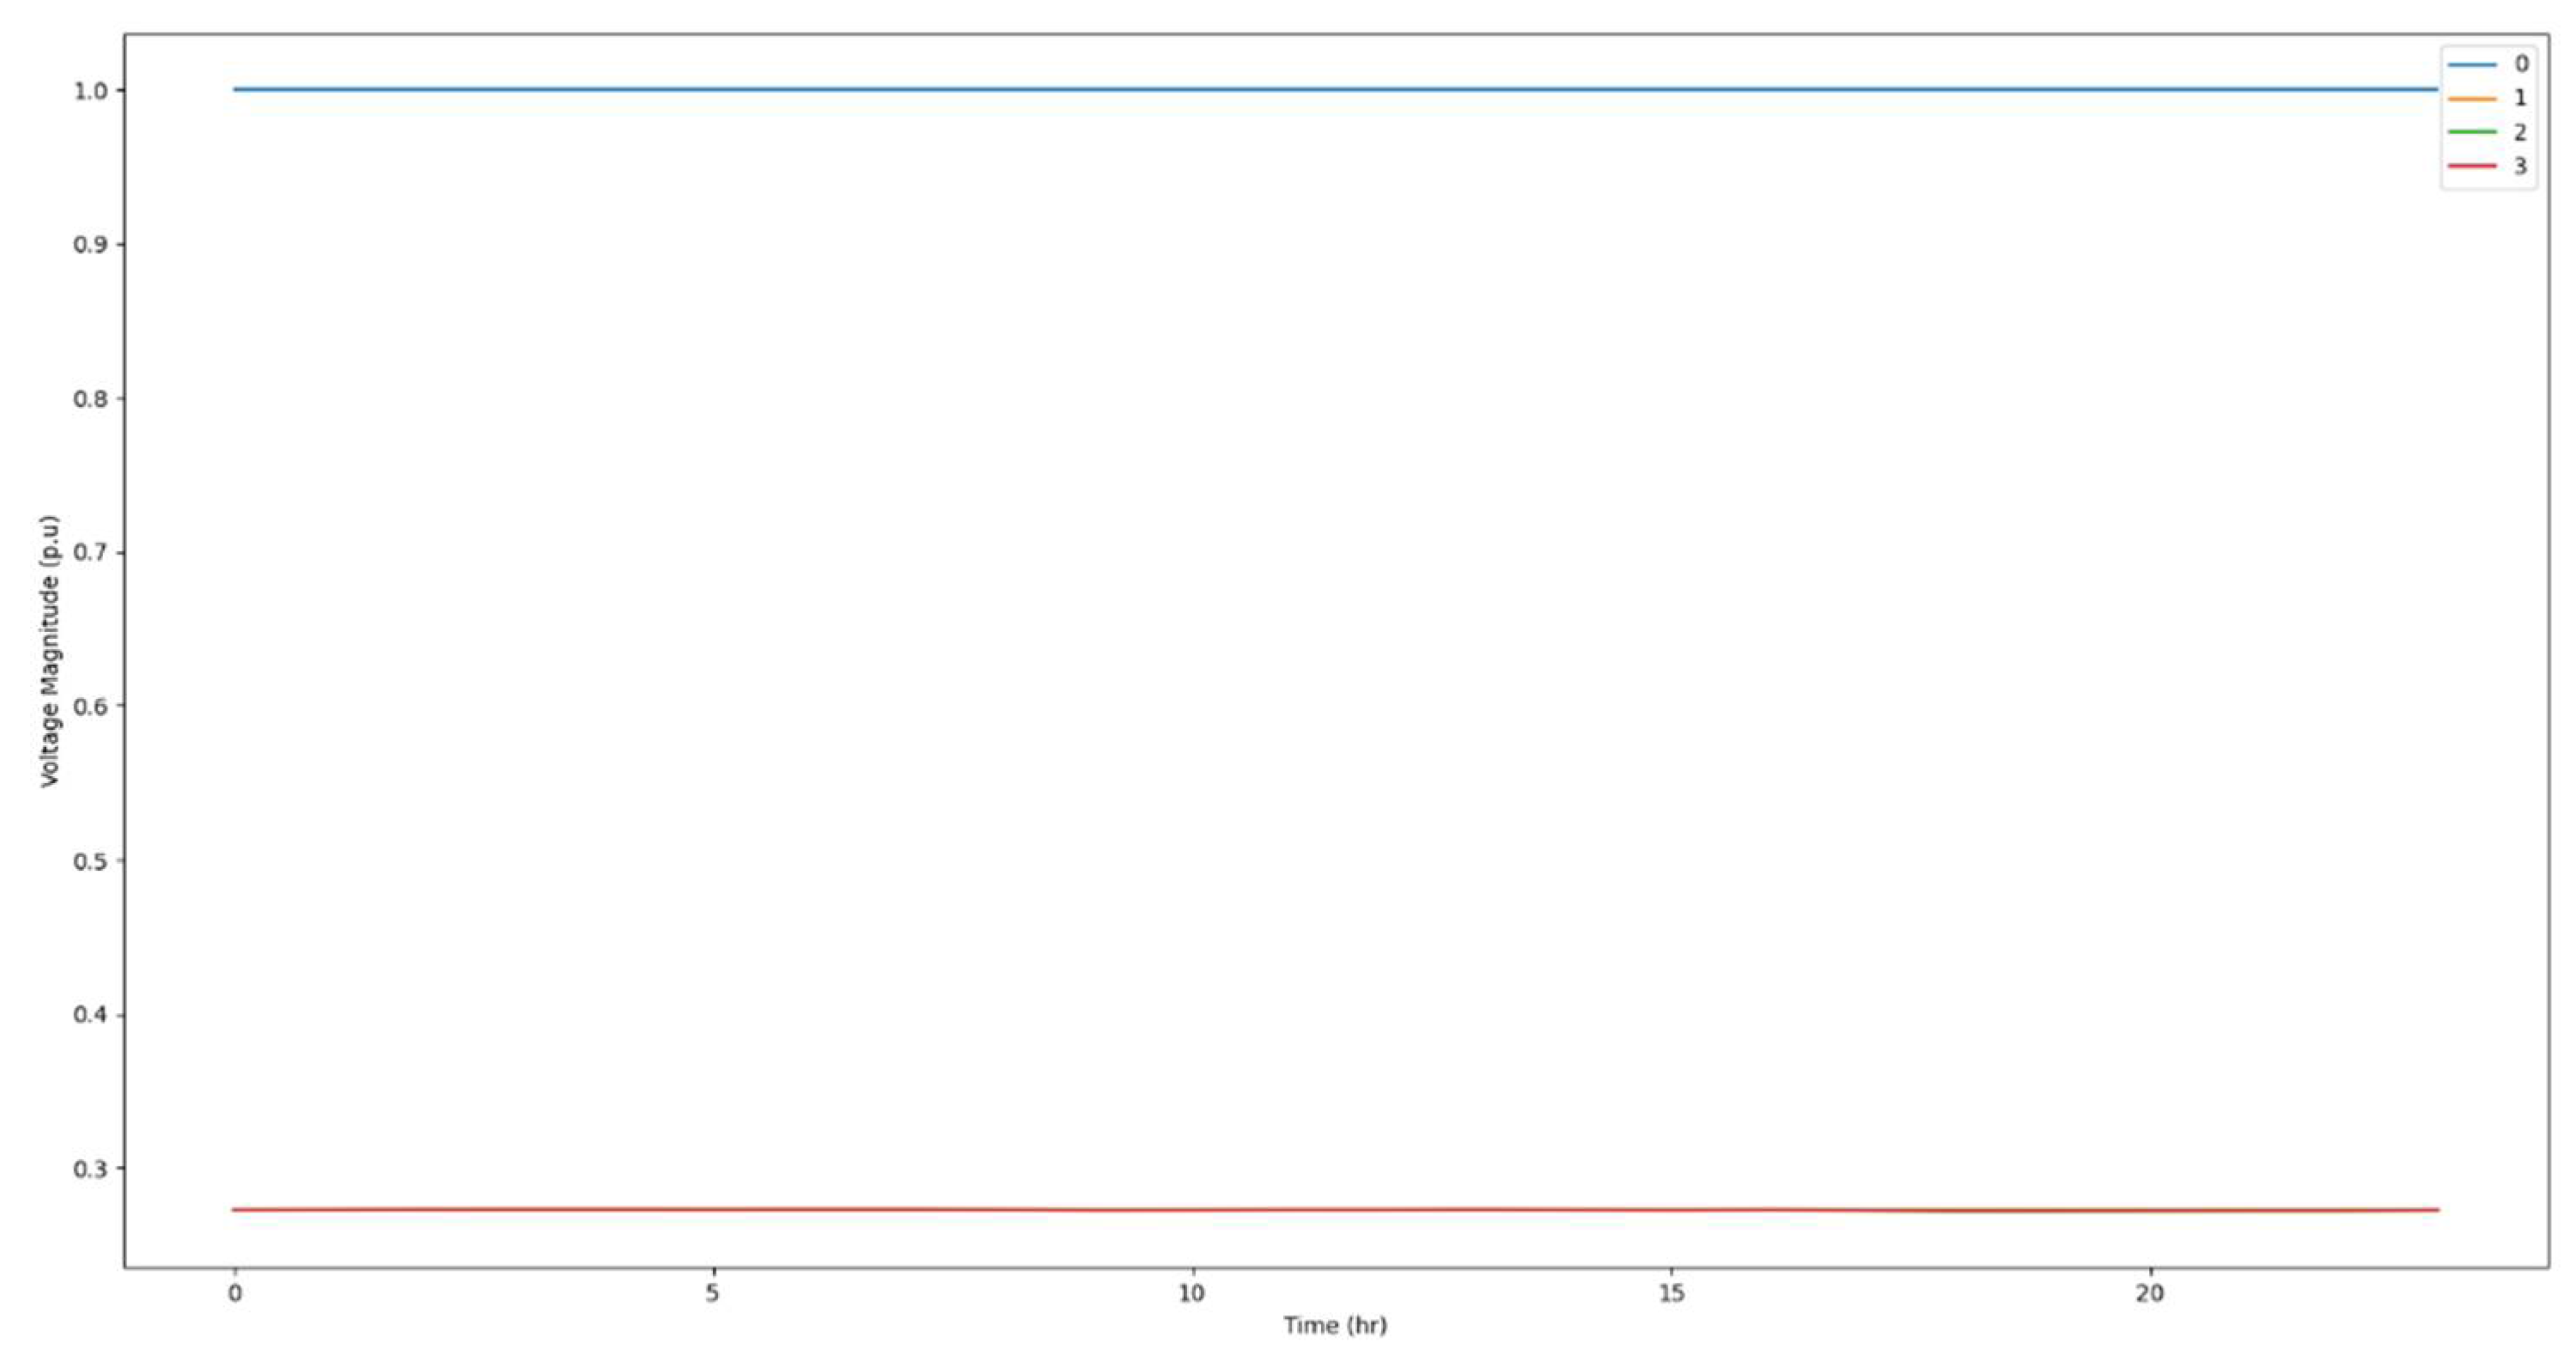
All buses had variations between those hours. They had a voltage drop at 7 p.m. but showed voltage stability from 4 a.m. -8 a.m. Voltage could be described as constant if it has a tolerance of 5%. Therefore, the overall voltage level could be considered constant. This would conclude that the voltage stability of the power system at all buses after disturbances is steady and does not exceed the voltage magnitude of bus 0 (external grid) as the system "injects" reactive power, which would stabilize the system.
Figure 11.
Voltage magnitude of buses in the 3-bus system with control data.
For the transformer, the active power losses (MW) and load utilization relative to rated power % (loading per cent) have been studied. Both variables of the transformer were constant from around 3-9 a.m. but peaked at 7 p.m. The loading per cent had the lowest value of 0.49% and peak value of 6%. It could be concluded that the transformer would not have any power consumption losses and loading per cent due to the low power profile from the hourly EV power demand at early morning. However, during peak hours the grid would be affected to a certain degree.
Furthermore, at peak hours the voltage magnitude of the grid would be steady with the load disturbances, but it would absorb more power rather than it would supply. For long-time use, this could affect the grid in terms of blackouts and disturbances in the future. But if the transformer could have low power losses and loading per cent, this system would not affect the grid at a detectable level.
Figure 12.
Active power of external grid in the 3-bus system with control data.
5. Bus
Next, it was investigated how the grid would react if multiple loads in different locations would be connected simultaneously with and without hourly EV power demand. It was seen that the network had a correct power flow function.
The network possessed voltage stability with the load disturbances at all buses, even though more loads had been added. However, the active power at b0 had almost doubled when compared to the 3-bus system due to the addition of new additional loads.
Figure 13.
Bus results of the 6-bus system without control data.
In order to study the effects of the 6 Bus system on the transformer, the load utilization relative to rated power % (loading per cent) and active power losses (MW) have been observed.
Figure 14.
Transformer results of the 6-bus system without control data.
For the active power losses, the values could be considered negligible - which would mean that the transformer would not have any sufficient power loss that would impact the grid's output. Most of the losses would mainly be heat losses such as resistive loss, eddy currents, hysteresis, and flux loss.
The load utilization relative to rated power % (loading per cent) is almost doubled from the previous system, which would mean that these load profiles could have impacted the grid because transformers are designed to give maximum efficiency at about 50% of loading. Thus, time series modules with hourly EV load profiles were used to provide more accurate results.
Figure 15.
Active power of buses in the 6-bus system with control data.
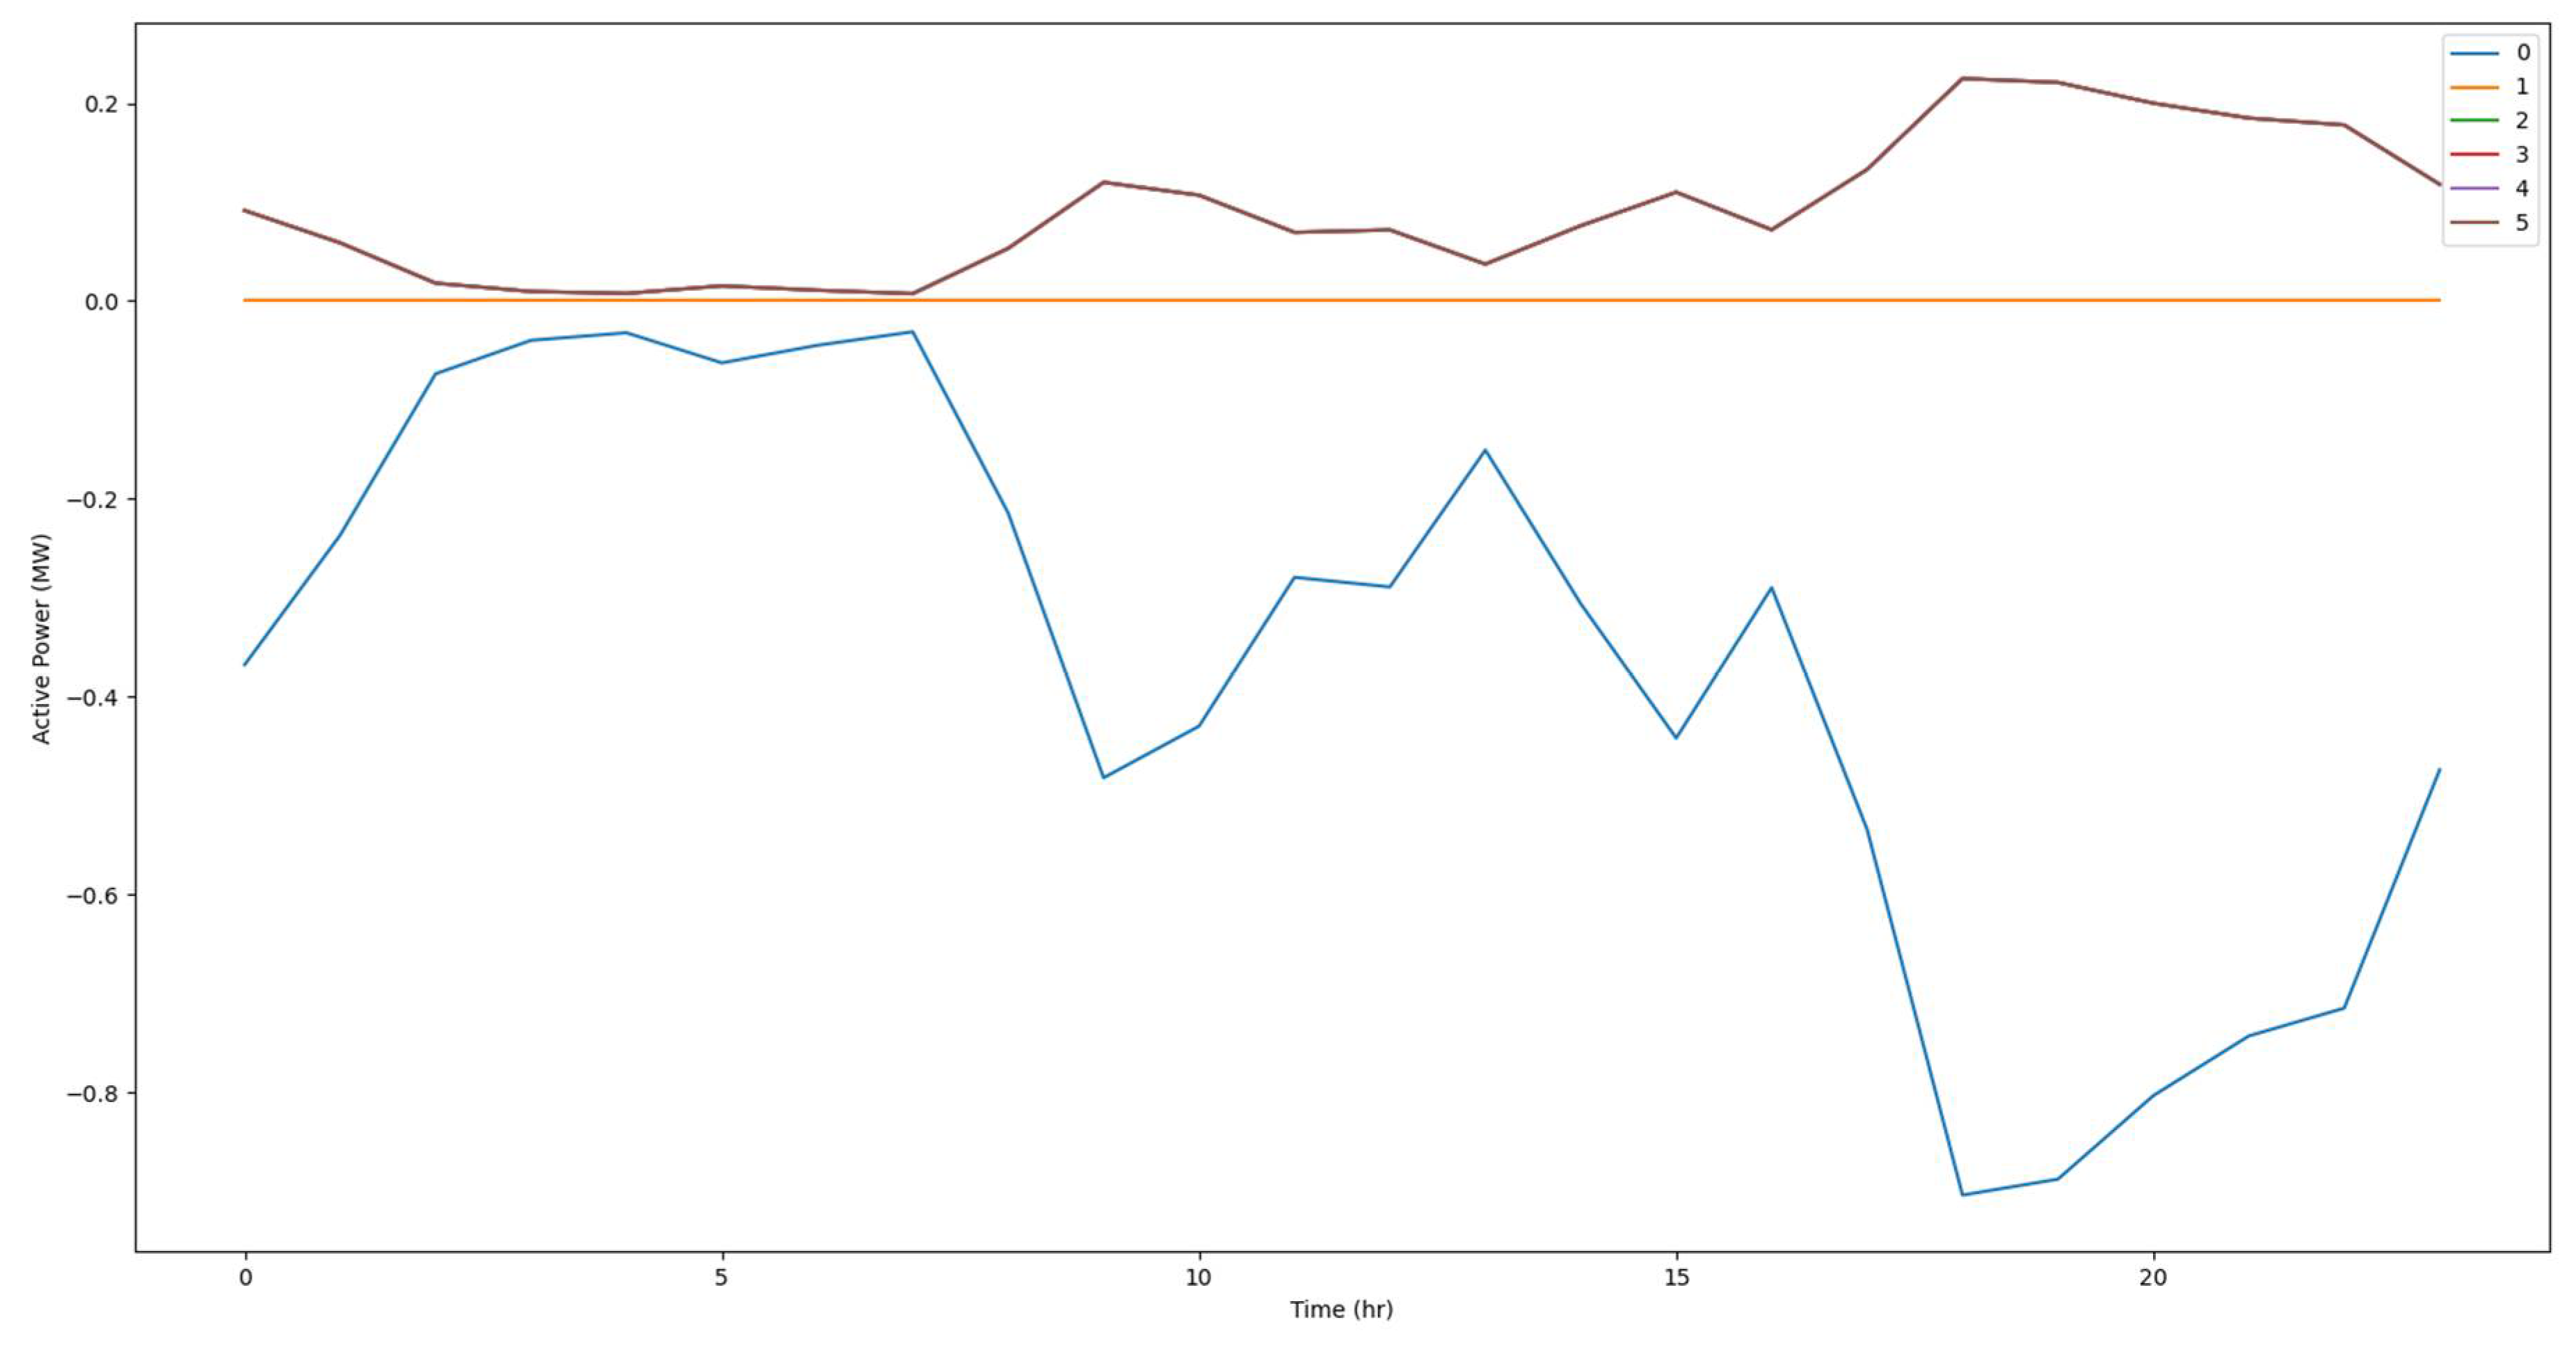
It had been observed that b0 (the external grid) consumed 0.90MW or 900kW active power, which is more significant than with the 3-bus system. Most power occurred during peak hours (8 p.m.), while the lowest power was about 0.03 MW or 30kW at 3-8 a.m. The grid is thus mainly affected at peak times in both cases, while it would consume the same amount of low power in the low peak times.
As seen in the Figure 16 above, the voltage magnitude of all buses fluctuates between low and peak hours. But they could be considered constant and identical to the 3-bus system. Thus, the voltage would be stable and would not surpass the grid's voltage with the load stresses.
Figure 16.
Voltage magnitude of b1-b5 in the 6-bus system with control data.
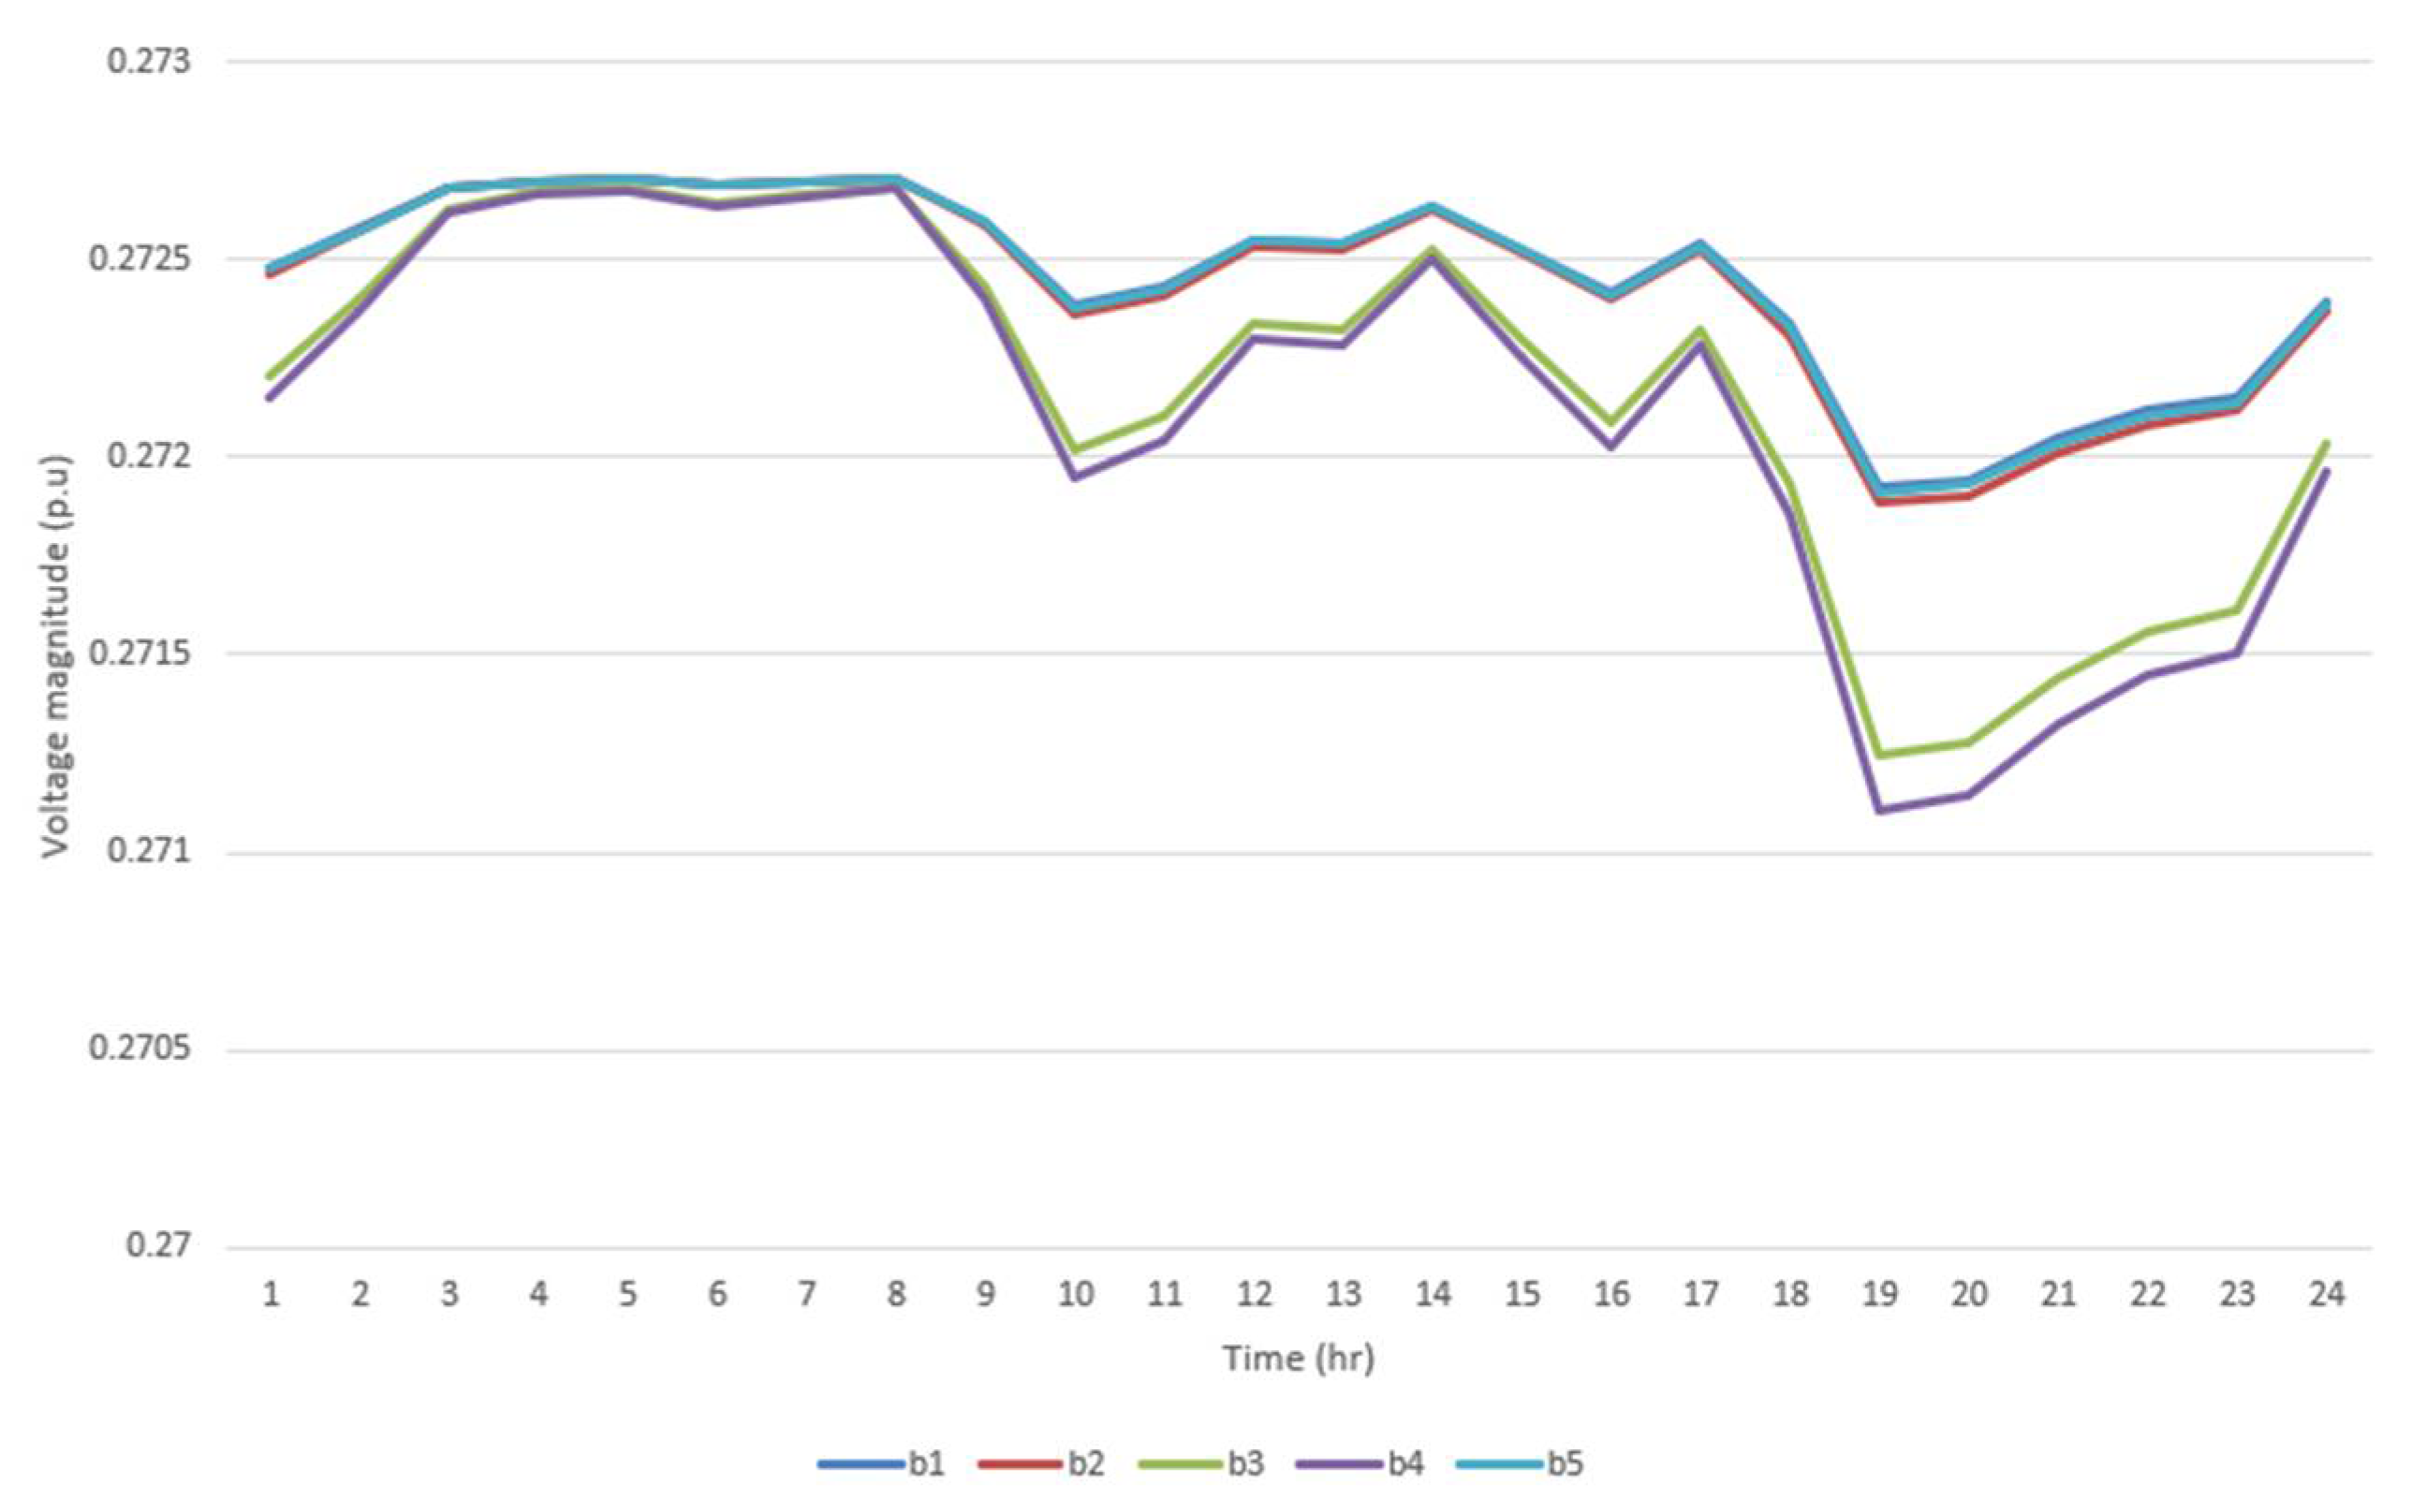
Figure 17.
Power loss of transformer in 6-bus system with control data.
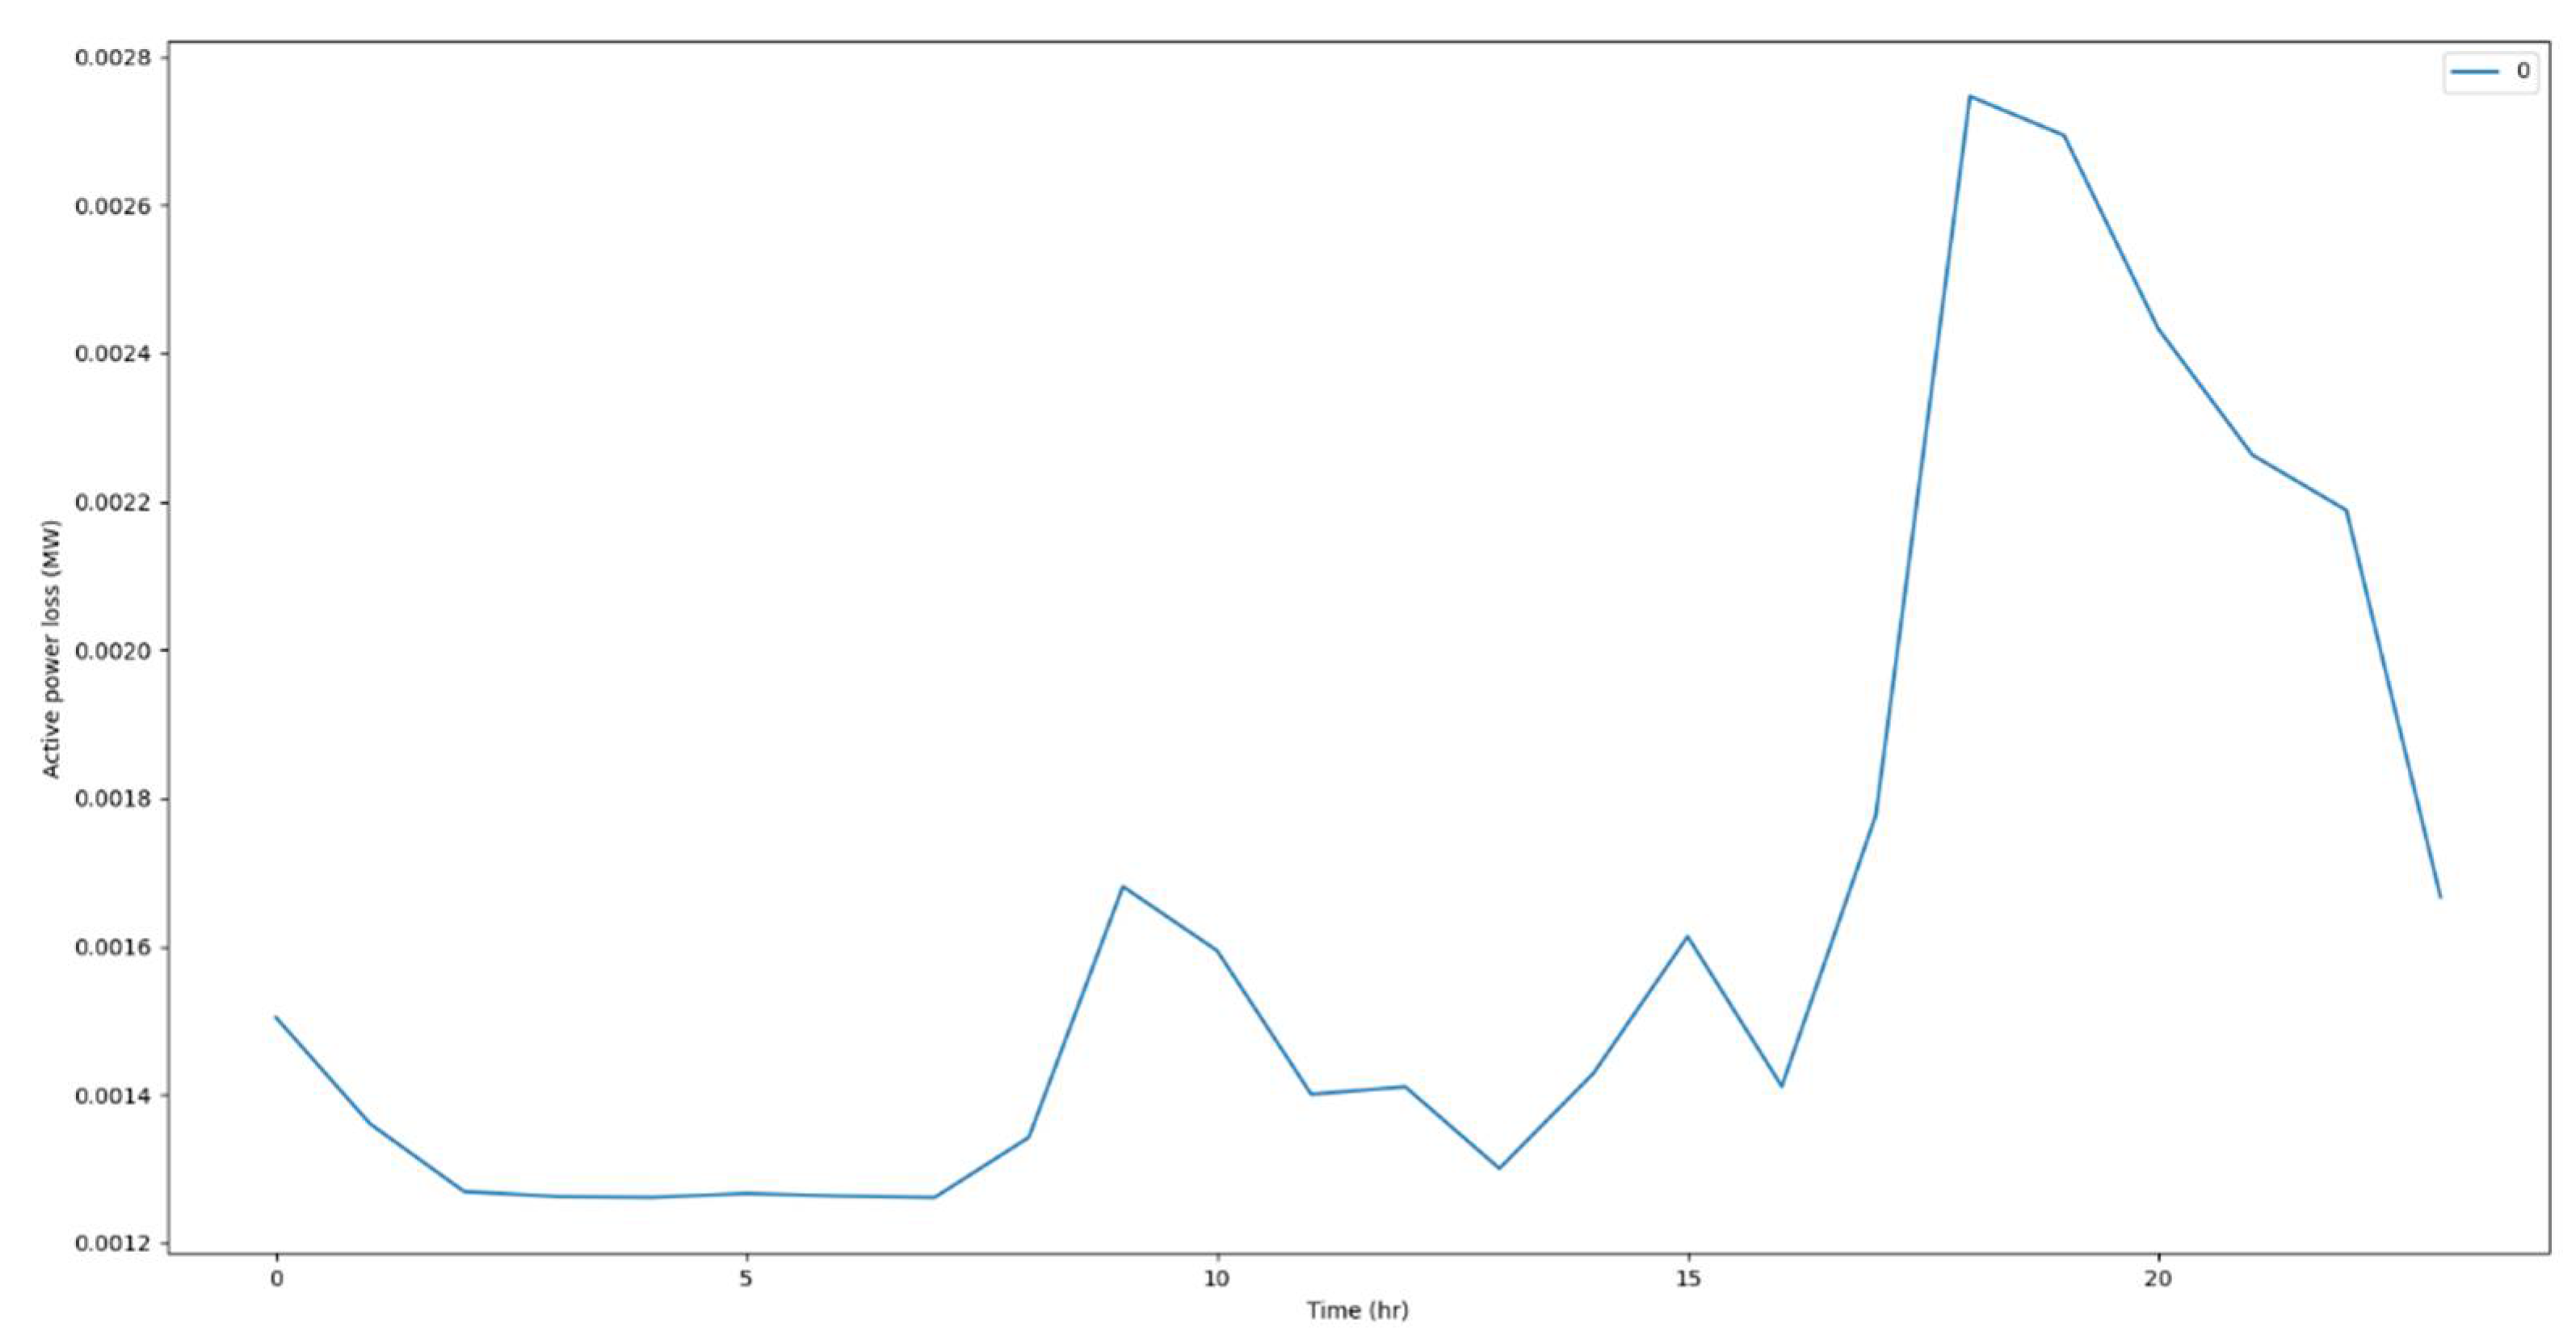
Figure 18.
Loading percent of transformer in the 6-bus system with control data.
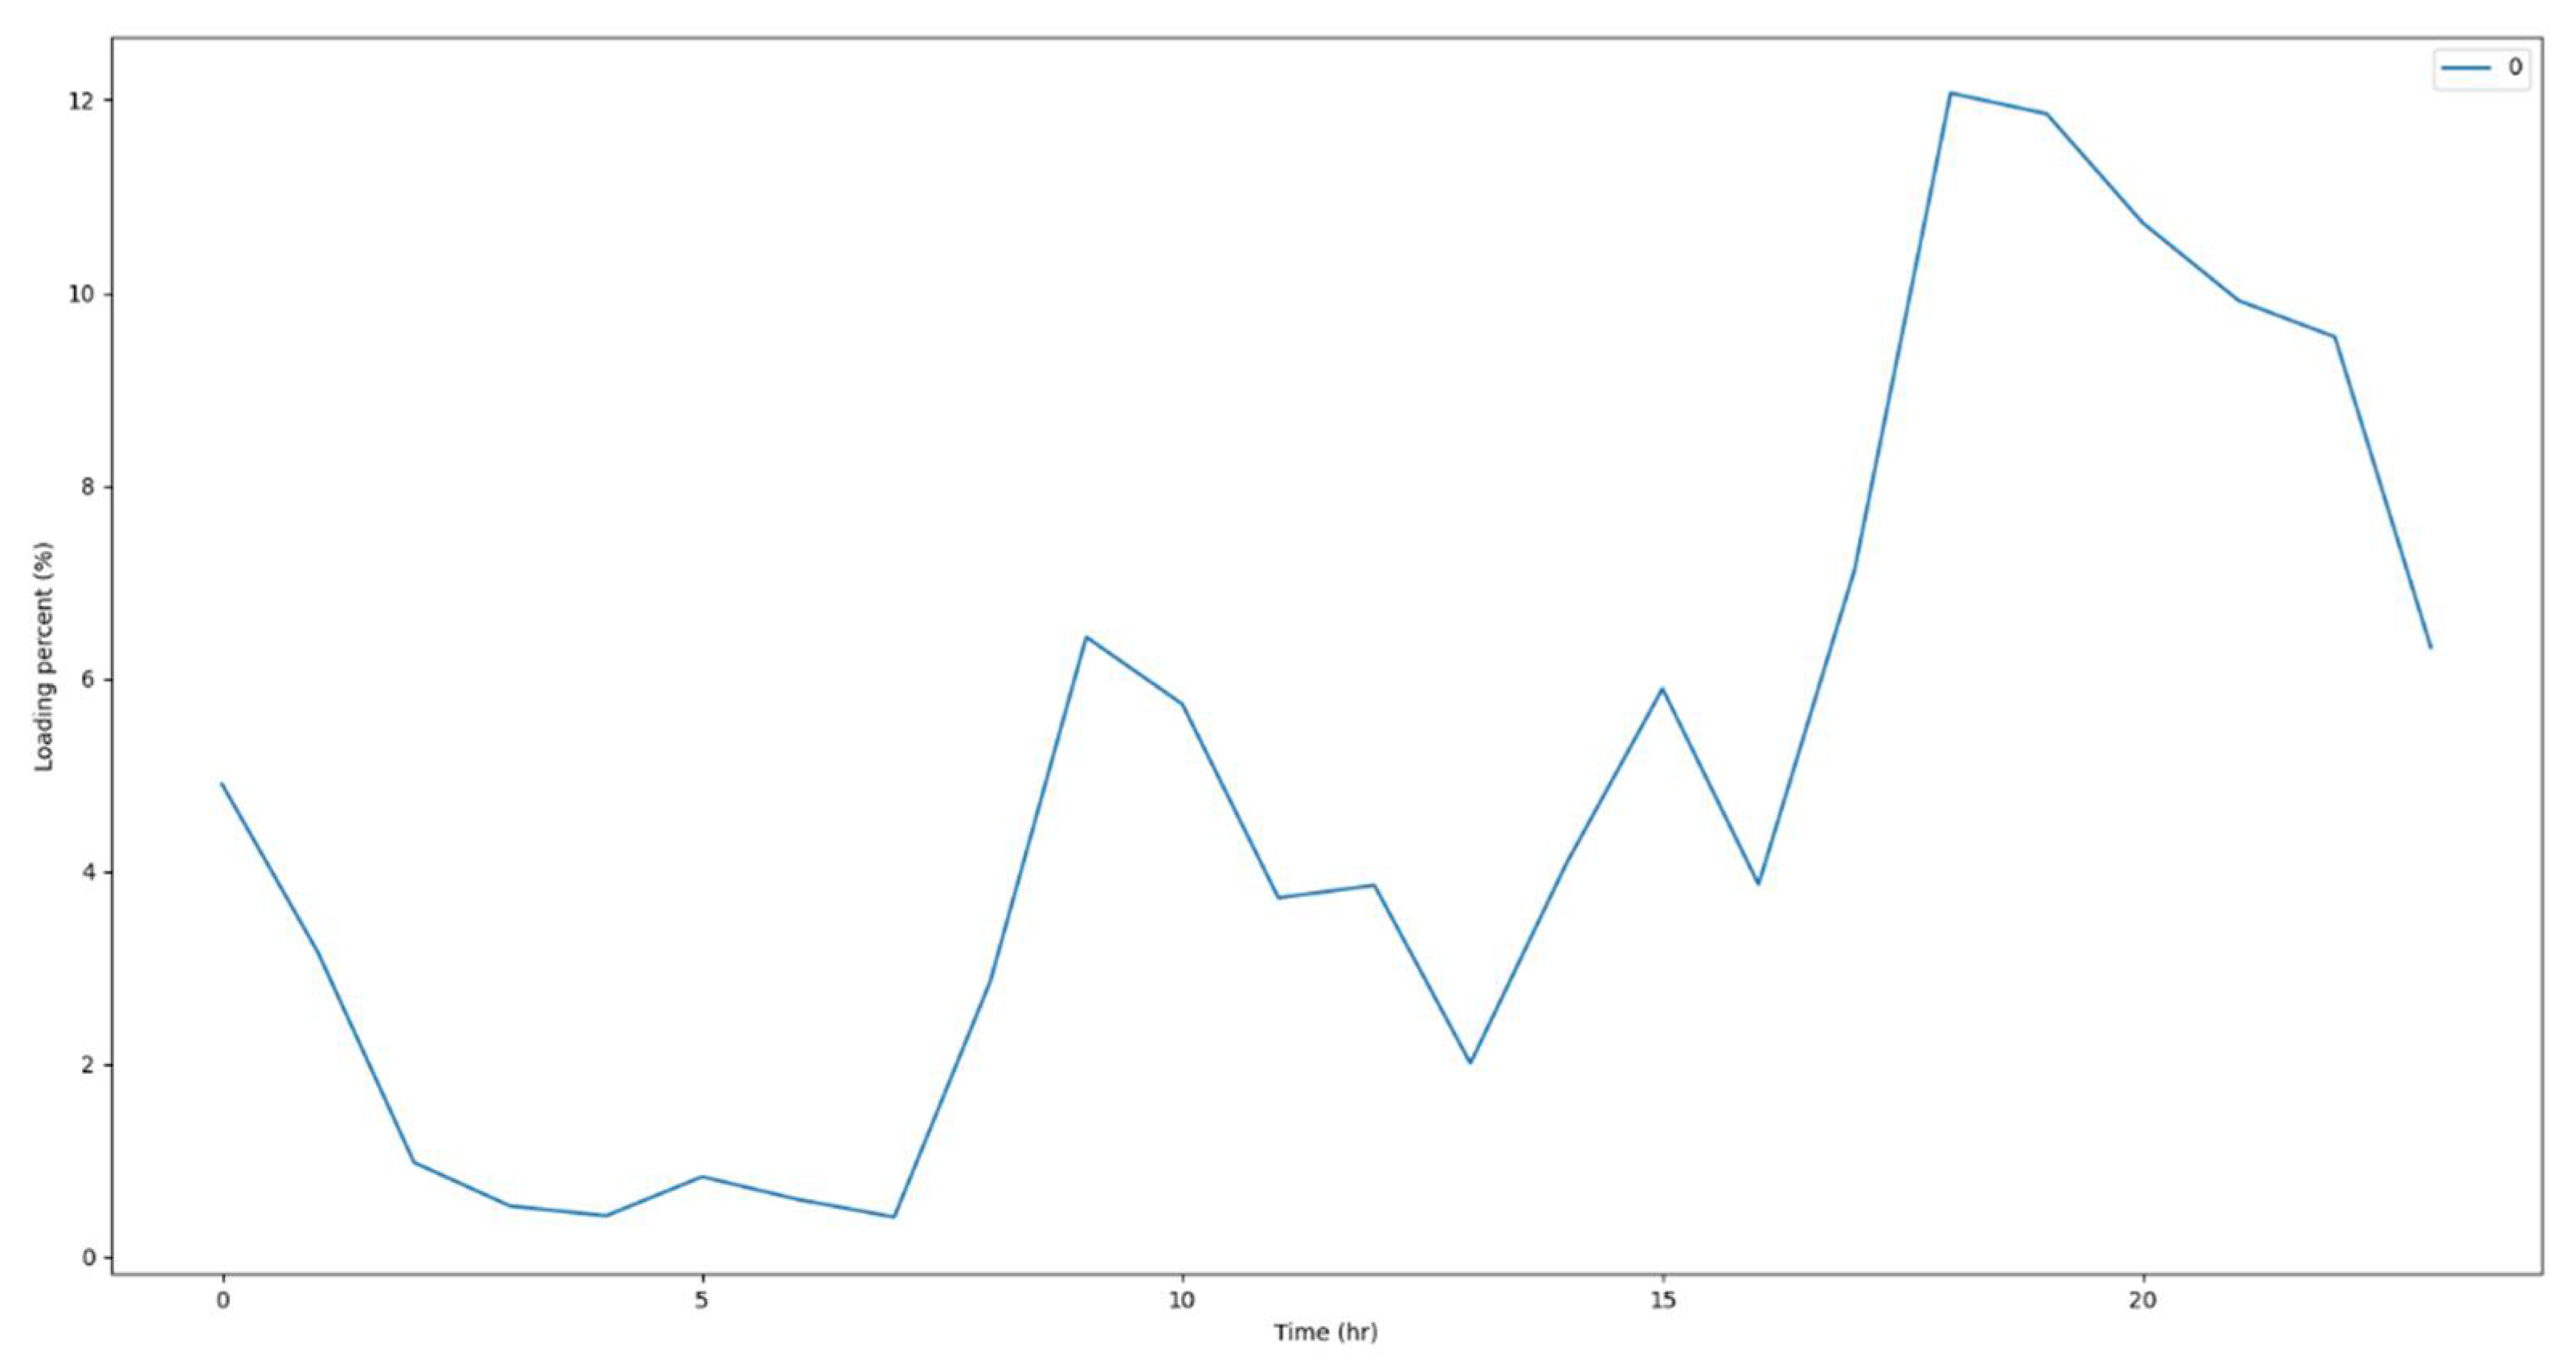
The active power losses could be neglected, as their values were minimal. However, the loading percent of the transformer almost doubled to 12% at peak times as compared to the 3-bus system.
At low peak times, the transformer would not be affected. In peak times, it had a certain amount of loading per cent but without any power losses. As stated previously, this could impact the grid - resulting in a higher power consumption demand than before.
- 3.2.1.
- Location 2
The testing procedure set out above was applied to the second location as well. The bus and transformer results were almost identical compared to the results for Location 1, even with the time series module. We could thereby conclude that the results of the 6-bus system would be the same as with Location 1.
6. Discussion
The 3-bus system has a small amount of active power and possesses voltage stability across all buses. The transformer has no active power loss and minimal loading per cent, thus resulting in minimal additional stress with or without the hourly EV demand. Next, for the 6-bus system the active power demand of the external grid is almost doubled, which would mean that the grid is consuming power instead of supplying it. As it has multiple loads connected simultaneously, the transformer should have some power loss and loading per cent. Instead, the power loss is negligible, and the loading per cent is at only 12%. It could thus be inferred that the transformer could function at reasonable levels with a maximum efficiency of up to 50%. For Location 1, in terms of cost the most suitable would be the first point - which would have a total cost of ca. £5,400 (at 2022 prices). However, in terms of optimization, it would be suggested that the third point would be the most suitable because Level 3 DC Fast Charging could provide a faster charging time and better convenience for costumers. The disadvantage would be that the DCFC would impact the grid at peak times at about 800kW. This could lead to overheating of the transformer, but the charging point could still be operated for a short period. For Location 2, in terms of cost, the most suitable would be the second type of charging stations - which would have a total cost of £13,200 (at 2022 prices). However, in terms of optimization it would be suggested that the DCFC chargers would be the most suitable due to the reasons stated above and furthermore to accommodate for the high volume of EVs that could be present in the multistorey parking lot. The disadvantage would be that the DC Fast Charging would impact the grid at peak times, which would lead to voltage instability and power losses.
7. Conclusions
The objective of the project was to determine the ideal location for the establishment of an EVCS using the AutoDesign tool, with the additional aid of the Pandapower power system tool to design (in a modelling and simulation environment) the system with different loads and charging points. First, each location was analyzed in terms of technical and economic aspects. Simulation was then carried out with the use of Pandapower in Python software (PyCharm) in order to observe the impact on the grid. The critical parameters that had been investigated were the external grid, the transformer, bus, lines, and loads, each with different elements. Based on the results of the simulations it has been concluded that the 6-bus system would have the highest impact on the grid at peak times (7-8 p.m.) at 800kW active power. Once both experimental and economic analyses had been conducted, it was suggested that for both locations the third type of EVCS would be the most suitable in these considered cases.
Author Contributions
Conceptualization, Xuewu Dai [XD] and Richard Kotter (RK); methodology, XD, RK, Stephanos Constantinou (SC); software, XD, SC; validation, XD, RK, Ayman Rizwan (AR), Y.Y. and Z.Z.; formal analysis, XD, RK, SC; investigation, XD, RK, SC; resources, XD, RK; data curation, XD, RK, SC; writing—original draft preparation, XD, RK, SC, AR; writing—review and editing, RK, XD, AR; visualization, XD, SC, RK; supervision, XD, RK; project administration, XD, RK; funding acquisition, XD, RK. All authors have read and agreed to the published version of the manuscript.
Funding
This work was supported in partial by the EPSRC project of Electric Fleets with On-site Renewable Energy Sources (EFORES) under grant EP/W028727/1, and the European Union’s Horizon 2020 research and innovation programme under the Marie Sklodowska-Curie Grant Agreement No. 872172 TESTBED2 project. We acknowledge the critical and much appreciated support of Adrian McLoughin (AMcL], Laura Coe (LC], and Tim Rippon [TR] – all (then, in the case of LC) officers at Newcastle City Council, and the support of Jonathan Barlow [JB], officer at South Tyneside Council. SC and AY were Masters student research assistants with XD and RK respectively, funded through an internal Graduate Futures Northumbria University scheme, for which we are grateful.
Institutional Review Board Statement
Not applicable, as the present study did not involve humans or animals. The research report by Eljay Research Limited was technically and ethically procured through and by Newcastle City Council’s Climate Change Advisory team of officers, reporting directly to the local authority Assistant Chief Executive. It followed all open and inclusive best practice, as stipulated by Newcastle City Council’s guidelines, and overseen by the relevant Cabinet Member.
Data Availability Statement
Only simulation data was created here, which we disclose here alongside the codes used.
Acknowledgments
In this section, you can acknowledge any support given which is not covered by the author contribution or funding sections. This may include administrative and technical support, or donations in kind (e.g., materials used for experiments).
Conflicts of Interest
The authors declare no conflicts of interest.
References
- Amin, A.; Tareen, W.U.K.; Usman, M.; Ali, H.; Bari, I.; Horan, B.; Mekhilef, S.; Asif, M.; Ahmed, S.; Mahmood, A. (2020) A Review of Optimal Charging Strategy for Electric Vehicles under Dynamic Pricing Schemes in the Distribution Charging Network. Sustainability 2020, 12, 10160. [Google Scholar] [CrossRef]
- Leal Filho, W.; Abubakar, I.R.; Kotter, R.; Grindsted, T.S.; Balogun, A.-L.; Salvia, A.L.; Aina, Y.A.; Wolf, F. (2021) Framing Electric Mobility for Urban Sustainability in a Circular Economy Context: An Overview of the Literature. Sustainability 2021, 13, 7786. [Google Scholar] [CrossRef]
- Kotter, R.; Ghanim, P.; Wang, Y.; Das, R.; Bentley, E.; O’Brien, G.; Dai, X.; Marzband, M. Business Models for SEEV4-City Operational Pilots. Interreg North Sea Region SEEV4-City. 2020. https://nrl.northumbria.ac.uk/id/eprint/44209/1/Business-Models-for-SEEV4-City-Operational-Pilots.pdf.
- Leal Filho, W. and Kotter, R. (eds) (2015) E-Mobility in Europe: Trends and Good Practice. Springer International: Cham. 2015. https://link.springer.com/book/10.1007/978-3-319-13194-8.
- Su M4 All (2021) Sustainable Mobility for All. Sustainable Electric Mobility:.
- Building Blocks and Policy Recommendations. Washington DC. 2021 https://www.sum4all.org/data/files/buildingblocksandpolicyrecommendations_english.pdf.
- Conti, M.; Kotter, R.; Putrus, G. (2015) Energy Efficiency in Electric and Plug-in Hybrid Electric Vehicles and its Impacts on Total Cost of Ownership. In: Electric Vehicle Business Models: Global Challenges. Beeton, D. & Meyer, G. (eds.). Cham: Springer, pp. 147-168. 2015. https://link.springer.com/chapter/10.1007/978-3-319-12244-1_9.
- Dai, X. et al. (2023) Data-Driven EV Charging Load Forecasting and Smart Charging.Transportation Reeserch Proceedia 72, 2023, pp. 2832-2839. [CrossRef]
- Handong, L. et al. (2022) Modelling and Uncertainty Analysis of On-site Renewable Sources for Optimal EV Charging. In: Proceesings of the International Conference on CApacity building in the Renewable Energy Sector (I-CARES) 2022, 22-23 June 2022, Newcastle Upon Tyne.
- https://researchportal.northumbria.ac.uk/ws/portalfiles/portal/77201872/Modelling_and_Uncertainty_Analysis_of_On_site_Renewable_Sources_for_Optimal_EV_Charging.pdf.
- Vadium, I.T. et al. (2019) Electric vehicle Carbon footprint reduction via intelligent charging strategies," 2019 8th International Conference on Modern Power Systems (MPS), Cluj-Napoca, Cluj, Romania, 2019, pp. 1-6. [CrossRef]
- Ma, Y. et al. (2023). Optimal Electric Vehicle Charging for Solar-Wind Powered Car Park. In: Proceedings of the 2023 IEEE Smart World Congress (SWC), Portsmouth, United Kingdom, 2023, pp. 873-878. IEEE Xplore https://ieeexplore.ieee.org/abstract/document/10448563. [CrossRef]
- Bentley, B. et al. (2021) On Beneficial Vehicle-to-Grid (V2G) Services. In: Proeedings of the 9th International Conference on Modern Power Systems (MPS), Cluj-Napoca, Romania, 2021, pp. 1-6, IEEE Xplore https://ieeexplore.ieee.org/document/9492671. [CrossRef]
- Wang, Y.; Das, R.; Putrus, G.; Kotter, R. Economic evaluation of photovoltaic and energy storage technologies for future domestic energy systems - A case study of the UK. Elsevier. 2020, 203, 117826. [Google Scholar] [CrossRef]
- Kumar, S.; Jaladi, K.K. (2020) Grid Connected Electric Vehicle Charging Station Using PV Source. In: Proceedings of the 2020 First IEEE International Conference on Measurement, Instrumentation, Control and Automation (ICMICA), Kurukshetra, India, 24-26 June 2020, pp. 1-4. [CrossRef]
- Das, R.; Wang, Y.; Putrus, G.; Kotter, R.; Marzband, M.; Herteleer, B.; Warmerdam, J. Multi-Objective Techno-Economic-Environmental Optimisation of Electric Vehicles for Energy Services. Appl. Energ. 2020, 257. [Google Scholar] [CrossRef]
- Antić, T.; Thurner, L.; Capuder, T.; Pavic, I. Modeling and open source implementation of balanced and unbalanced harmonic analysis in radial distribution networks. Electr. Power Syst. Res. 2022, 209, 107935. [Google Scholar] [CrossRef]
- Scheidler, A.; Kraiczy, M.; Thurner, L.; Braun, B. (2017) Automated Grid Planning for Distribution Grids with Increasing PV Penetration. In: Proceedings of the 6th International Workshop on Solar Integration. https://www.researchgate.net/profile/Markus-Kraiczy/publication/313240540_Automated_Grid_Planning_for_Distribution_Grids_with_Increasing_PV_Penetration/links/5893697145851563f828ea09/Automated-Grid-Planning-for-Distribution-Grids-with-Increasing-PV-Penetration.pdf.
- Grabner, M.; Souvent, A.; Suljanović, N.; Košir, A.; Blažič, B. (2019) Probabilistic Methodology for Calculating PV Hosting Capacity in LV Networks Using Actual Building Roof Data. Energies 2019, 12, 4086. [Google Scholar] [CrossRef]
- Antić, T.; Keane, A.; Capuder, T. (2022) Pp OPF -- Pandapower Implementation of Three-phase Optimal Power Flow Model. arXiv:2211.11032 [math.OC]. [CrossRef]
- Antić, T.; Thurner, L.; Capuder, T.; Pavić, I. (2022) Modeling and open source implementation of balanced and unbalanced harmonic analysis in radial distribution. Electric Power Systems Research 209, 107935. [CrossRef]
- Tardif, J.M.; Diaz-Gonzalez, F.; Kegel, M.; Sola, A.; Salom, J. (2020) A Co-simulation Framework for Assessing the Interaction between Heat Pumps and the Low Voltage Grid on a District Scale. In: Proceedings of the 16th IBPSA Conference Rome, Italy, Sept. 2-4, 2019; pp. 3242-3249. [CrossRef]
- Békési, G.B.; Barancsuk, L.; Táczi, I.; Hartmann, B. (2022) Benchmarking Various Pseudo-Measurement Data Generation Techniques in a Low-Voltage State Estimation Pilot Environment. Appl. Sci. 2022, 12, 3187. [Google Scholar] [CrossRef]
- Bogunović, N.; Vlahinić, S.; Franković, D.; Komen, V. (2020) Application of PandaPower Tool in Evaluating the Potential of Using PV Distributed Generation for Voltage Regulation in Electrical Power Networks. In: Proceedings of the 43rd International Convention on Information, Communication and Electronic Technology (MIPRO), Opatija, Croatia, 2020, pp. 912-917. https://doi.org/10.23919/MIPRO48935.2020.9245182.ElBanhawy, E.Y., Dalton, R., Thompson, E.M., Kotter, R. (2012). Real-time electric mobility simulations in metropolitan areas. A case study: Newcastle-Gateshead. In: Digital Physicality - Proceedings of the 30th eCAADe Conference, Vol. 1, pp. 533-546. Czech Technical University: Prague. https://papers.cumincad.org/data/works/att/eCAADe_2012-vol-1-lowres.pdf#page=534.
- https://www.northernpowergrid.com/news/northern-powergrid-launches-innovative-tool-to-accelerate-ev-uptake; https://www.northernpowergrid.com/auto-design.
- https://smarter.energynetworks.org/projects/nia_npg_024.
- https://www.northernpowergrid.com/your-powergrid/ice-work-plan/article/developing-our-budget-estimating-tool.
- https://eatechnology.com/resources/blogs-white-papers/autodesign/.
- https://www.thenorthernecho.co.uk/business/18210306.company-launches-tool-speed-electric-vehicle-uptake/].
- Autodesign: LV Connections Self-Service Tool. Available online:.
- https://smarter.energynetworks.org/projects/nia_npg_024.
- Autodesign. Available online:.
- https://eatechnology.com/resources/blogs-white-papers/autodesign/.
- Bahrami, A. EV Charging Definitions, Modes, Levels, Communication Protocols and Applied Standards, 2020, 1.2, pp. 1-57. [CrossRef]
- Arif, S.M.; Lie, T.T.; Seet, B.C.; Ayyadi, S.; Jensen, K. Review of Electric Vehicle Technologies, Charging Methods, Standards and Optimization Techniques. Electronics 2021, 10, https://www.mdpi.com/2079–9292/10/16/1910. [Google Scholar] [CrossRef]
- Falvo, M.C.; Sbordone A.D.; Bayram S.I.; Devetsikiotis, M. EV charging stations and modes: International standards. In: Proceedings of the 2014 International Symposium on Power Electronics, Electrical Drives, Automation and Motion (SPEEDAM 2014), Ischia, Italy, 18-20 June 2014. [CrossRef]
- How DC Fast Charging Works. Available online: https://www.advancedenergy.org/2022/01/24/how-dc-fast-charging-works/#:~:text=DC%20fast%20charging%2C%20though%20%E2%80%94%20as,1%20or%20Level%202%20charging.
- Ma, C.-T. (2019) System Planning of Grid-Connected Electric Vehicle Charging Stations and Key Technologies: A Review. Energies 2019, 12. [Google Scholar] [CrossRef]
- Deb, S.; Kalita, K.; Mahanta, P. (2017) Review of impact of electric vehicle charging station on the power grid. In: Proceedings of the IEEE International Conference on Technological Advancements in Power and Energy (TAP Energy), Kerala, India, 21-23 December 2017. [CrossRef]
- AutoDesign Tool. Available online:.
- https://www.northernpowergrid.com/auto-design.
- Thurner, L.; Scheidler, A.; Schäfer, F.; Menke, J.-H.; Dollichon, J.; Wenderoth, F.; Meinecke, S.; Braun, M. Pandapower - an Open-Source Python Tool for Convenient Modeling, Analysis and Optimization of Electric Power Systems. IEEE Trans. Power Syst. 2018, 33, 6510–6521. [Google Scholar] [CrossRef]
- Eljay Research Ltd. (2022) Shaping a Community Car Club in Elswick, Newcastle upon Tyne, UK. Consultation Feedback. July 2022. Report commissioned by, and to, Newcastle City Council and Northumbria University for the NZIP project funded by the Local Government Association https://www.local.gov.uk/case-studies/embedding-ev-car-club-targeted-neighbourhoods.
- Local Government Association & University College London / Newcastle City Council / Northumbria University (2022). Embedding an EV car club into targeted neighbourhoods. Newcastle City Council’s Net Zero Team and Strategic Transport Team collaborated with Northumbria University and CoWheels, to determine whether it was feasible to deploy an EV car club vehicle into a targeted neighbourhood in the Elswick Ward of Newcastle upon Tyne. https://www.local.gov.uk/case-studies/embedding-ev-car-club-targeted-neighbourhoods.
- Carvalho, R; Buzna, L. ; Gibbens, R.; Kelly, F. (2015) Critical behaviour in charging of electric vehicles, New J. Phys. 2015, 17, 095001.
- Vadium, I.T.; Das, R.; Wang, Y.; Putrus, G.; Kotter, R., "Electric vehicle Carbon footprint reduction via intelligent charging strategies," 2019 8th International Conference on Modern Power Systems (MPS), Cluj-Napoca, Cluj, Romania, 2019, pp. 1-6. [CrossRef]
Figure 1.
Grid Topology of the example Low Voltage (LV) Distribution Network [source: authors].

Disclaimer/Publisher’s Note: The statements, opinions and data contained in all publications are solely those of the individual author(s) and contributor(s) and not of MDPI and/or the editor(s). MDPI and/or the editor(s) disclaim responsibility for any injury to people or property resulting from any ideas, methods, instructions or products referred to in the content. |
© 2024 by the authors. Licensee MDPI, Basel, Switzerland. This article is an open access article distributed under the terms and conditions of the Creative Commons Attribution (CC BY) license (http://creativecommons.org/licenses/by/4.0/).
Copyright: This open access article is published under a Creative Commons CC BY 4.0 license, which permit the free download, distribution, and reuse, provided that the author and preprint are cited in any reuse.


