Submitted:
13 May 2024
Posted:
13 May 2024
You are already at the latest version
Abstract

Keywords:
1. Introduction
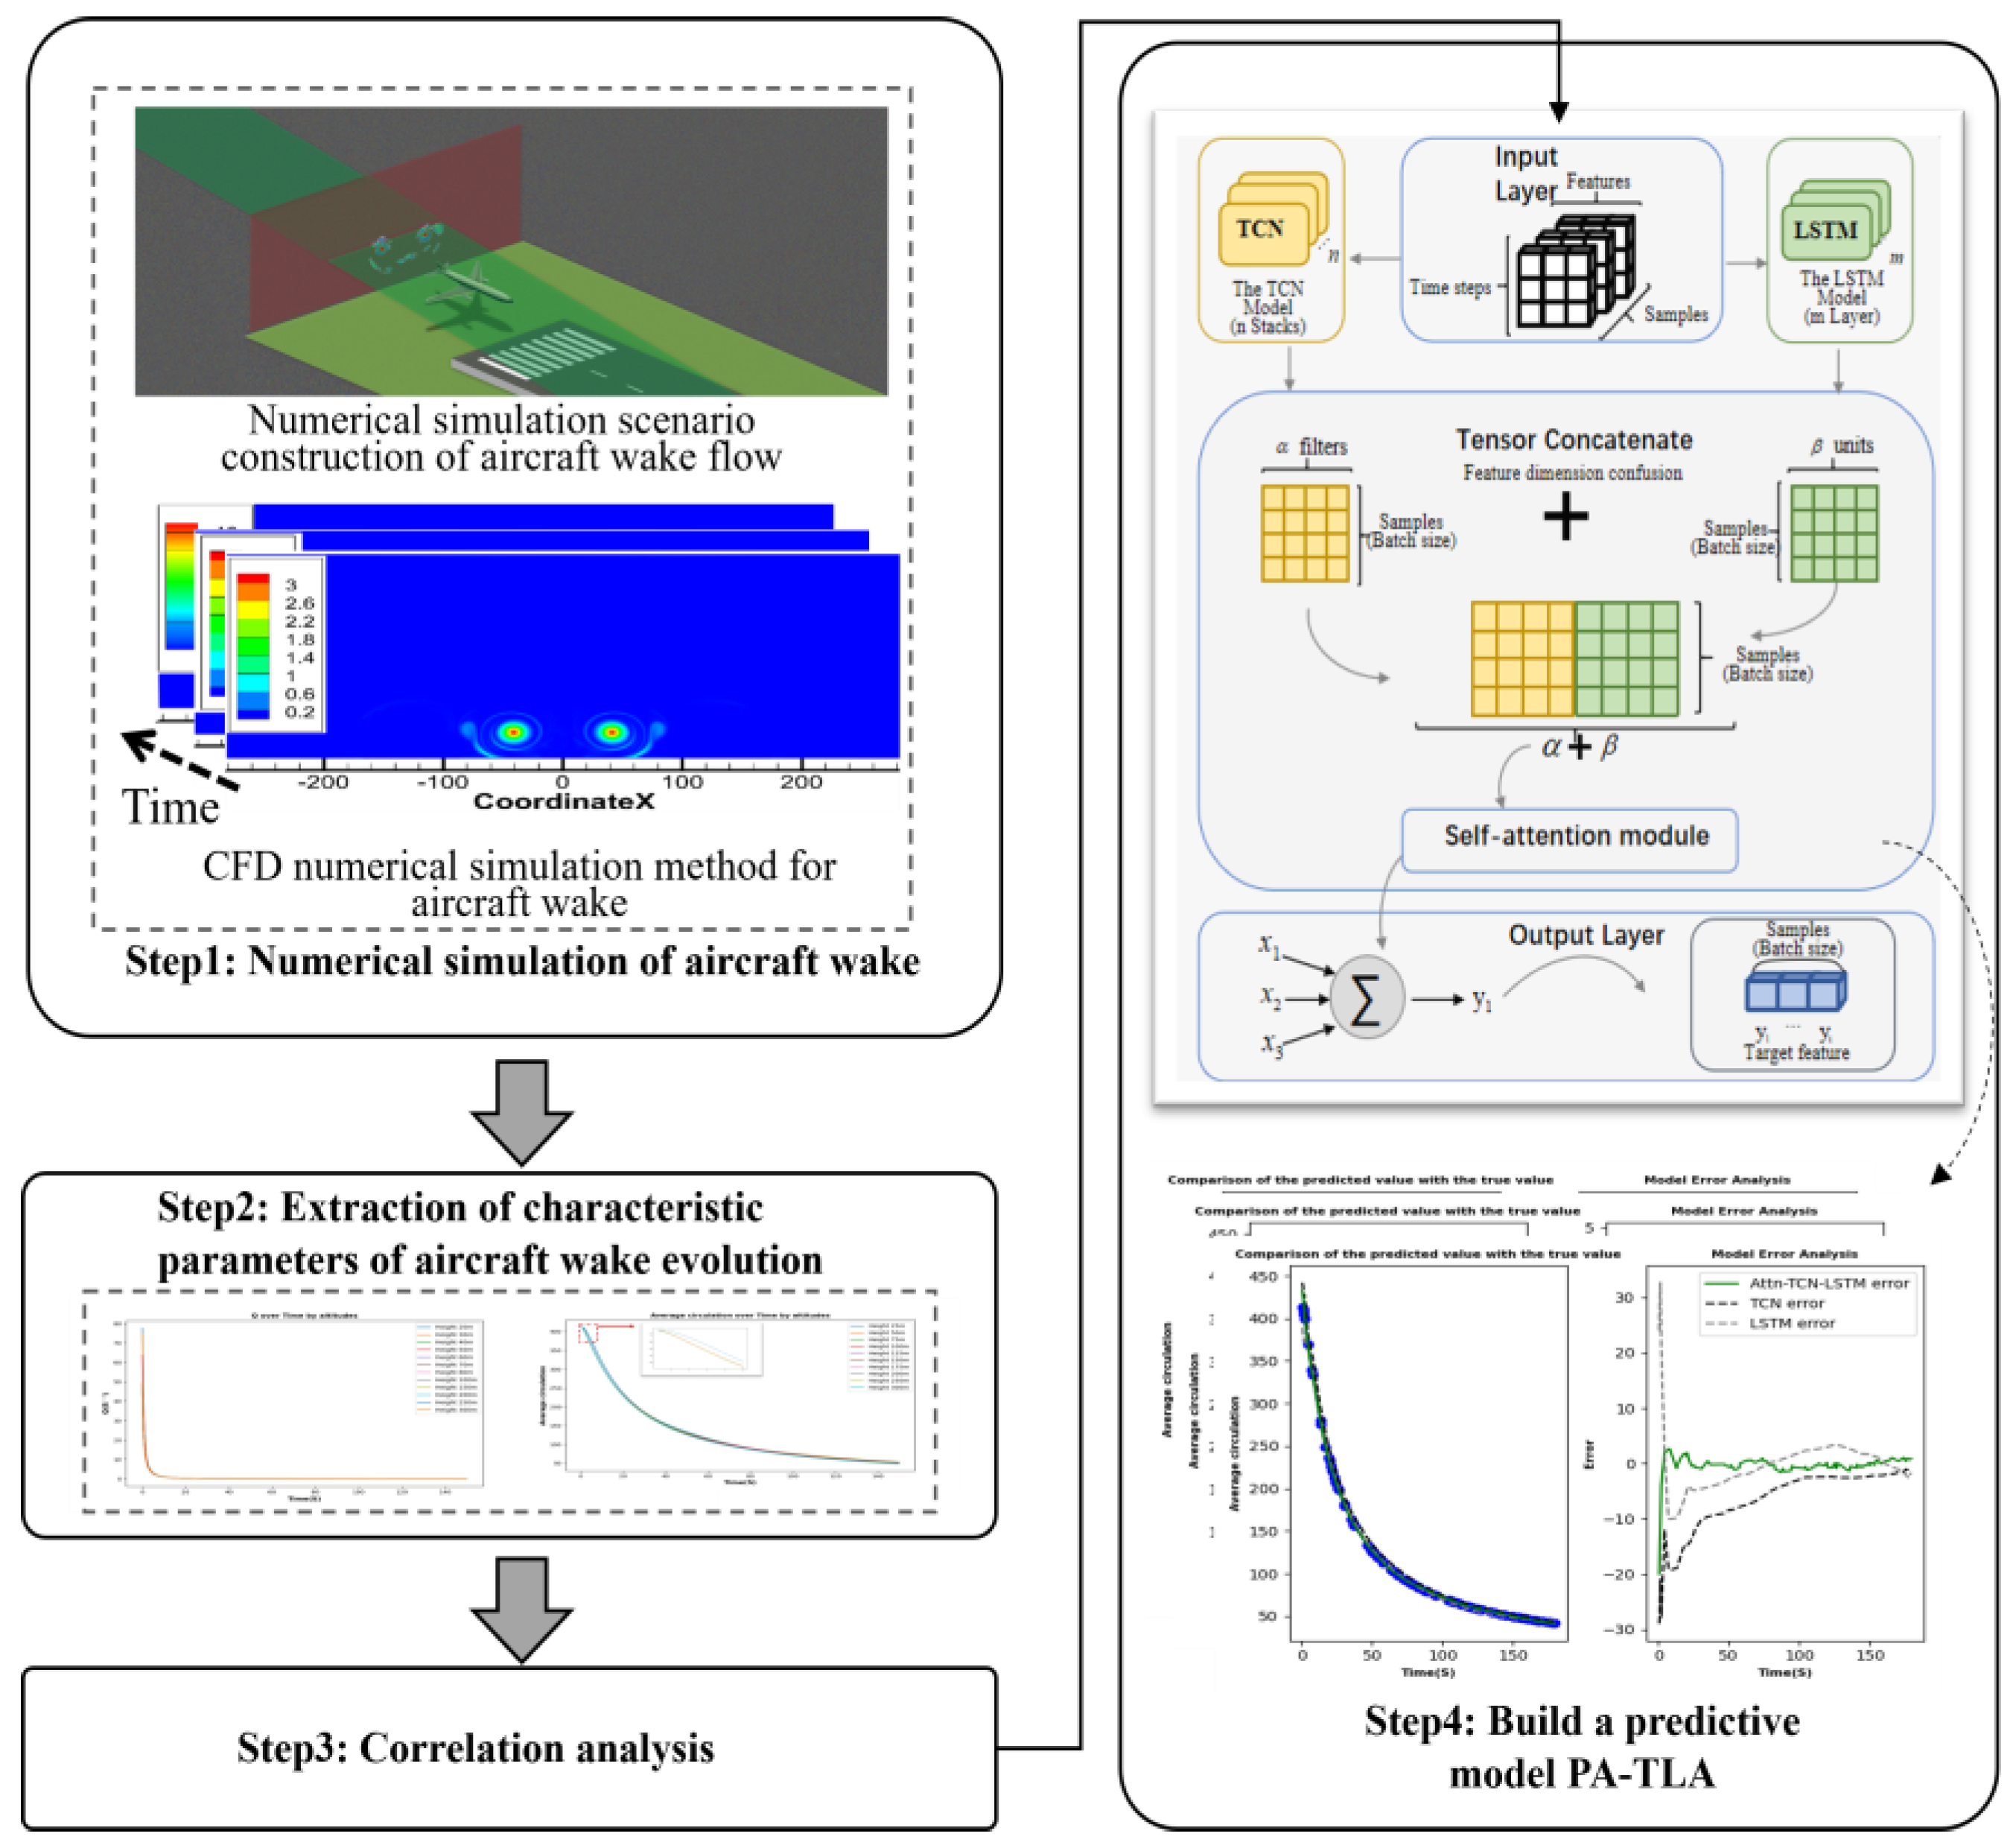
- Utilizing deep learning neural networks to predict aircraft wake evolution, addressing the long computational times of numerical simulations.
- Proposing a hybrid deep learning neural network model with a parallel processing structure, extracting feature information from the time series of aircraft wake evolution.
- Analyzing the characteristics of aircraft near-ground wake evolution, providing theoretical value for enhancing airport operational efficiency.
2. Methodology
2.1. Aircraft Wake Vortex Numerical Simulation
2.1.1. Aircraft Wake Vortex Numerical Simulation Scenario Construction
2.1.2. Wake Vortex Tangential Velocity Model
2.1.3. Aircraft Wake Vortex CFD Numerical Simulation Method
2.2. Extraction of Aircraft Wake Evolution Characteristic Parameters
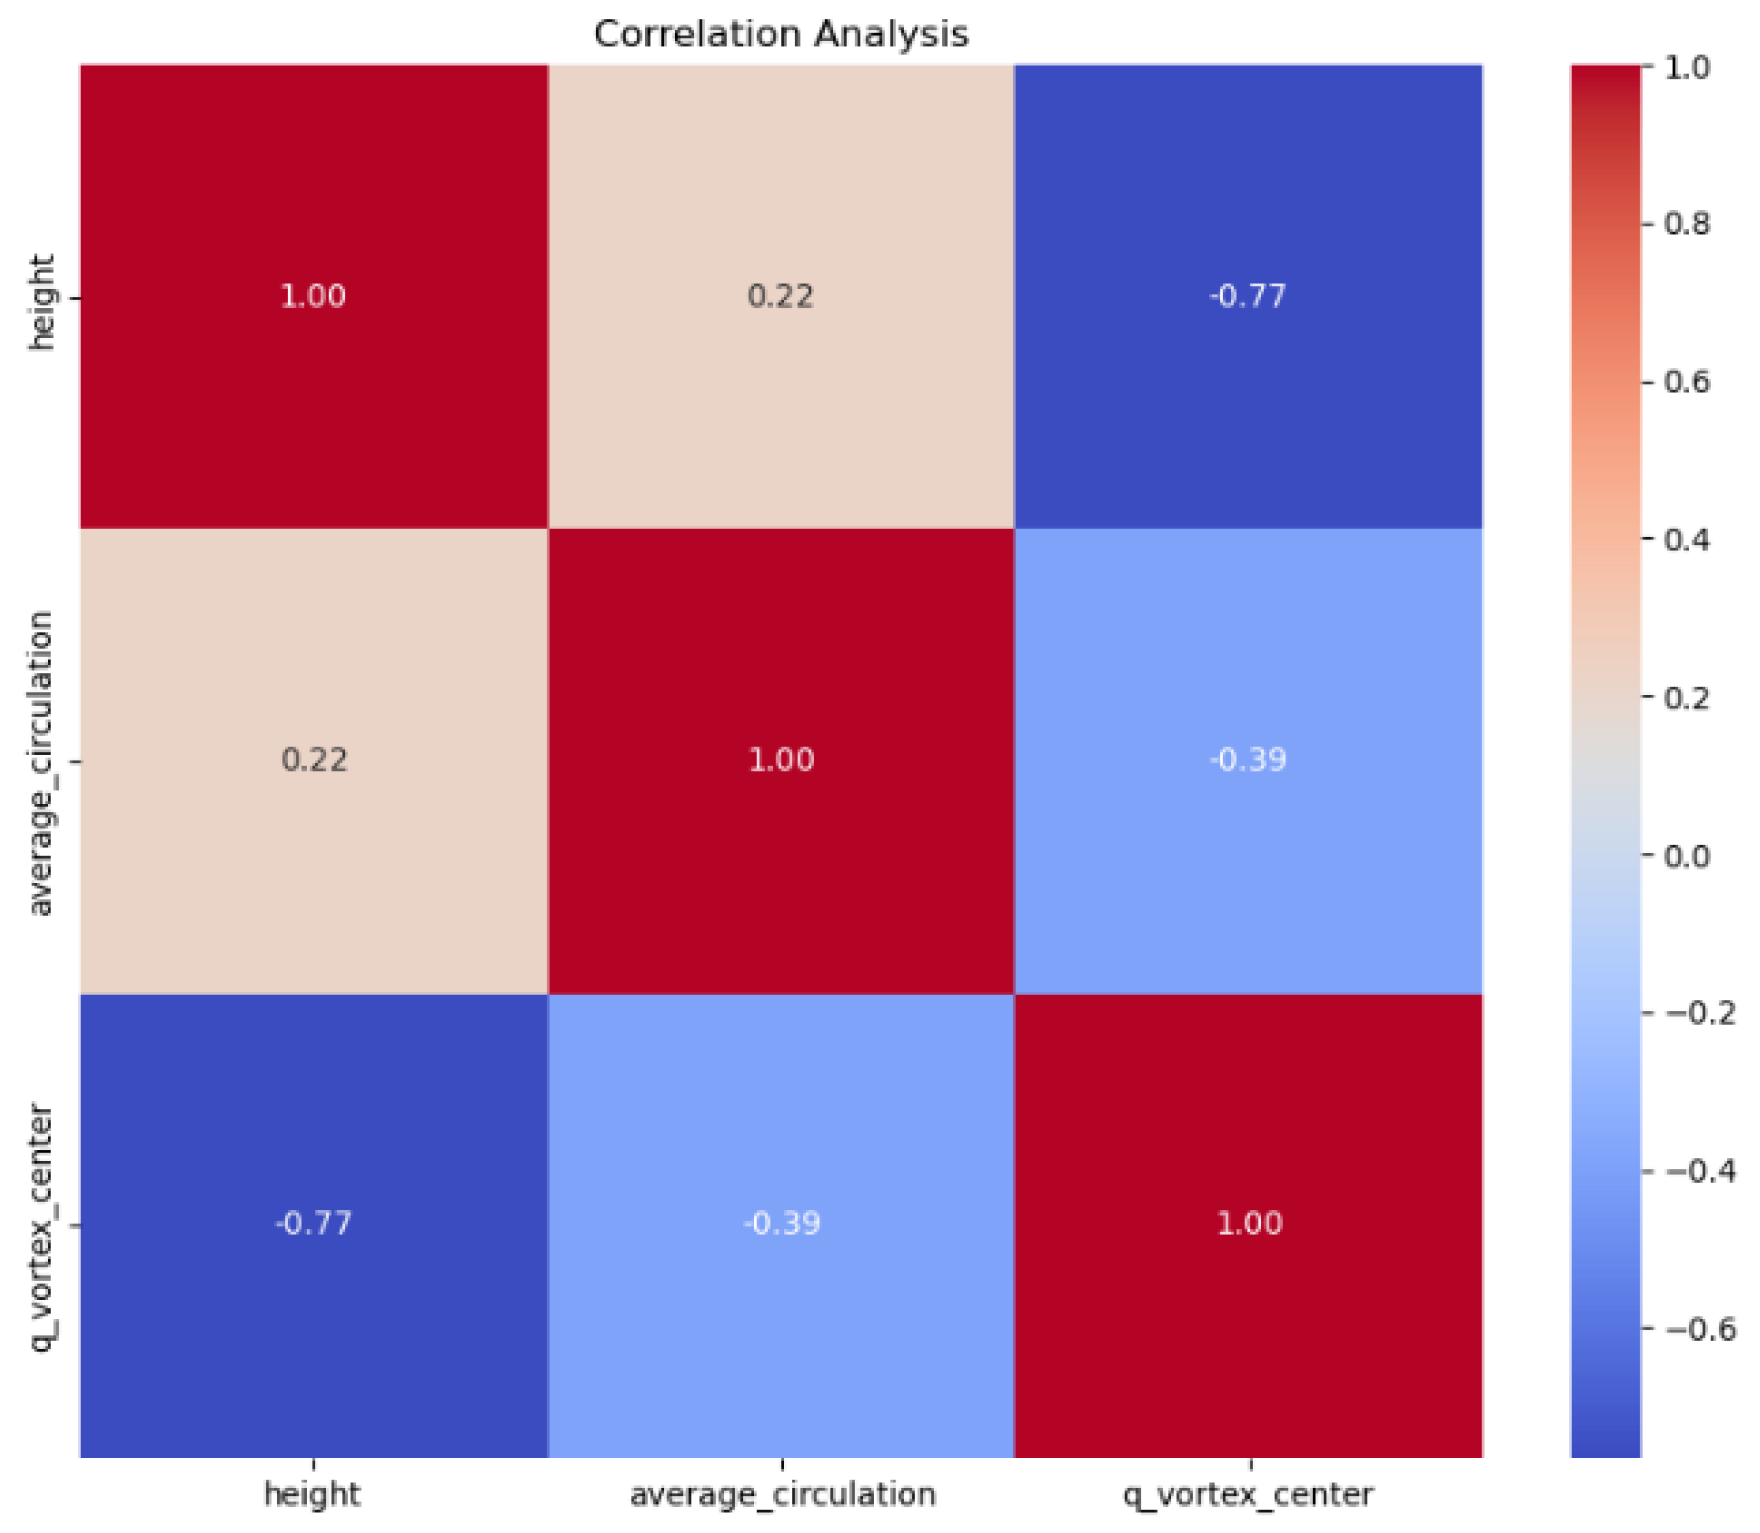
2.3. Correlation Analysis
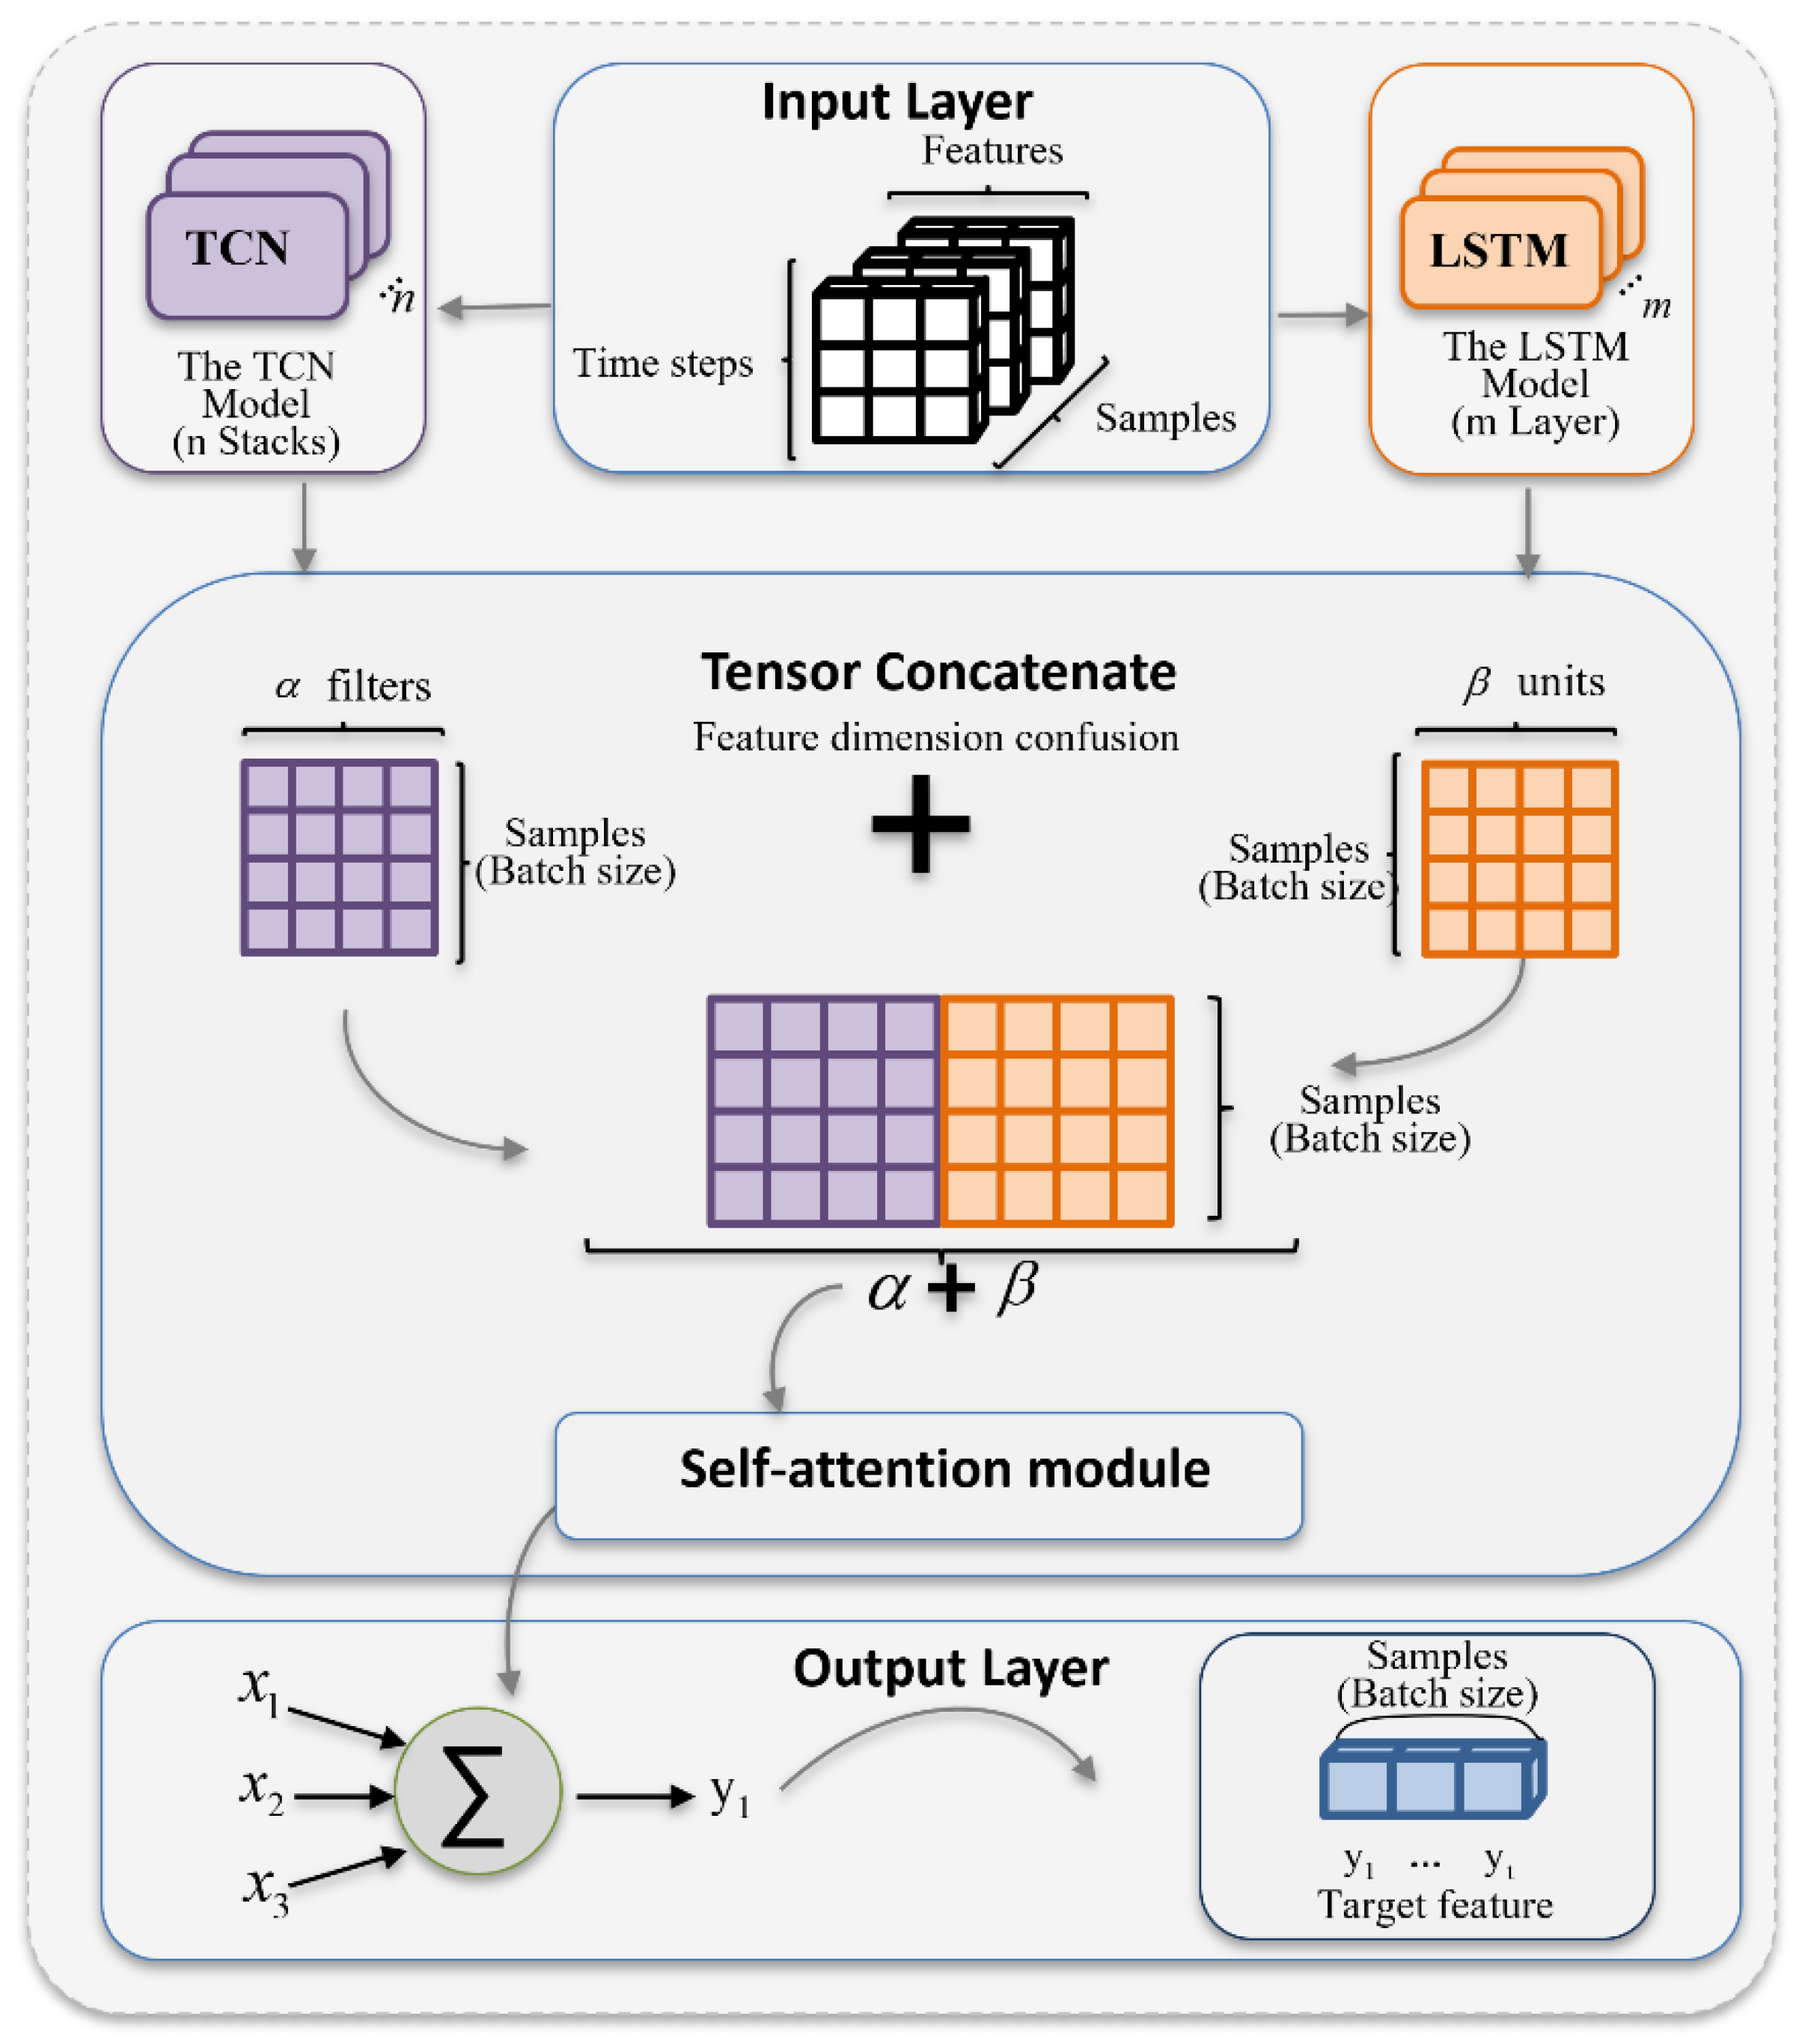
2.4. Wake Parameter Prediction Model Based on PA-TLA
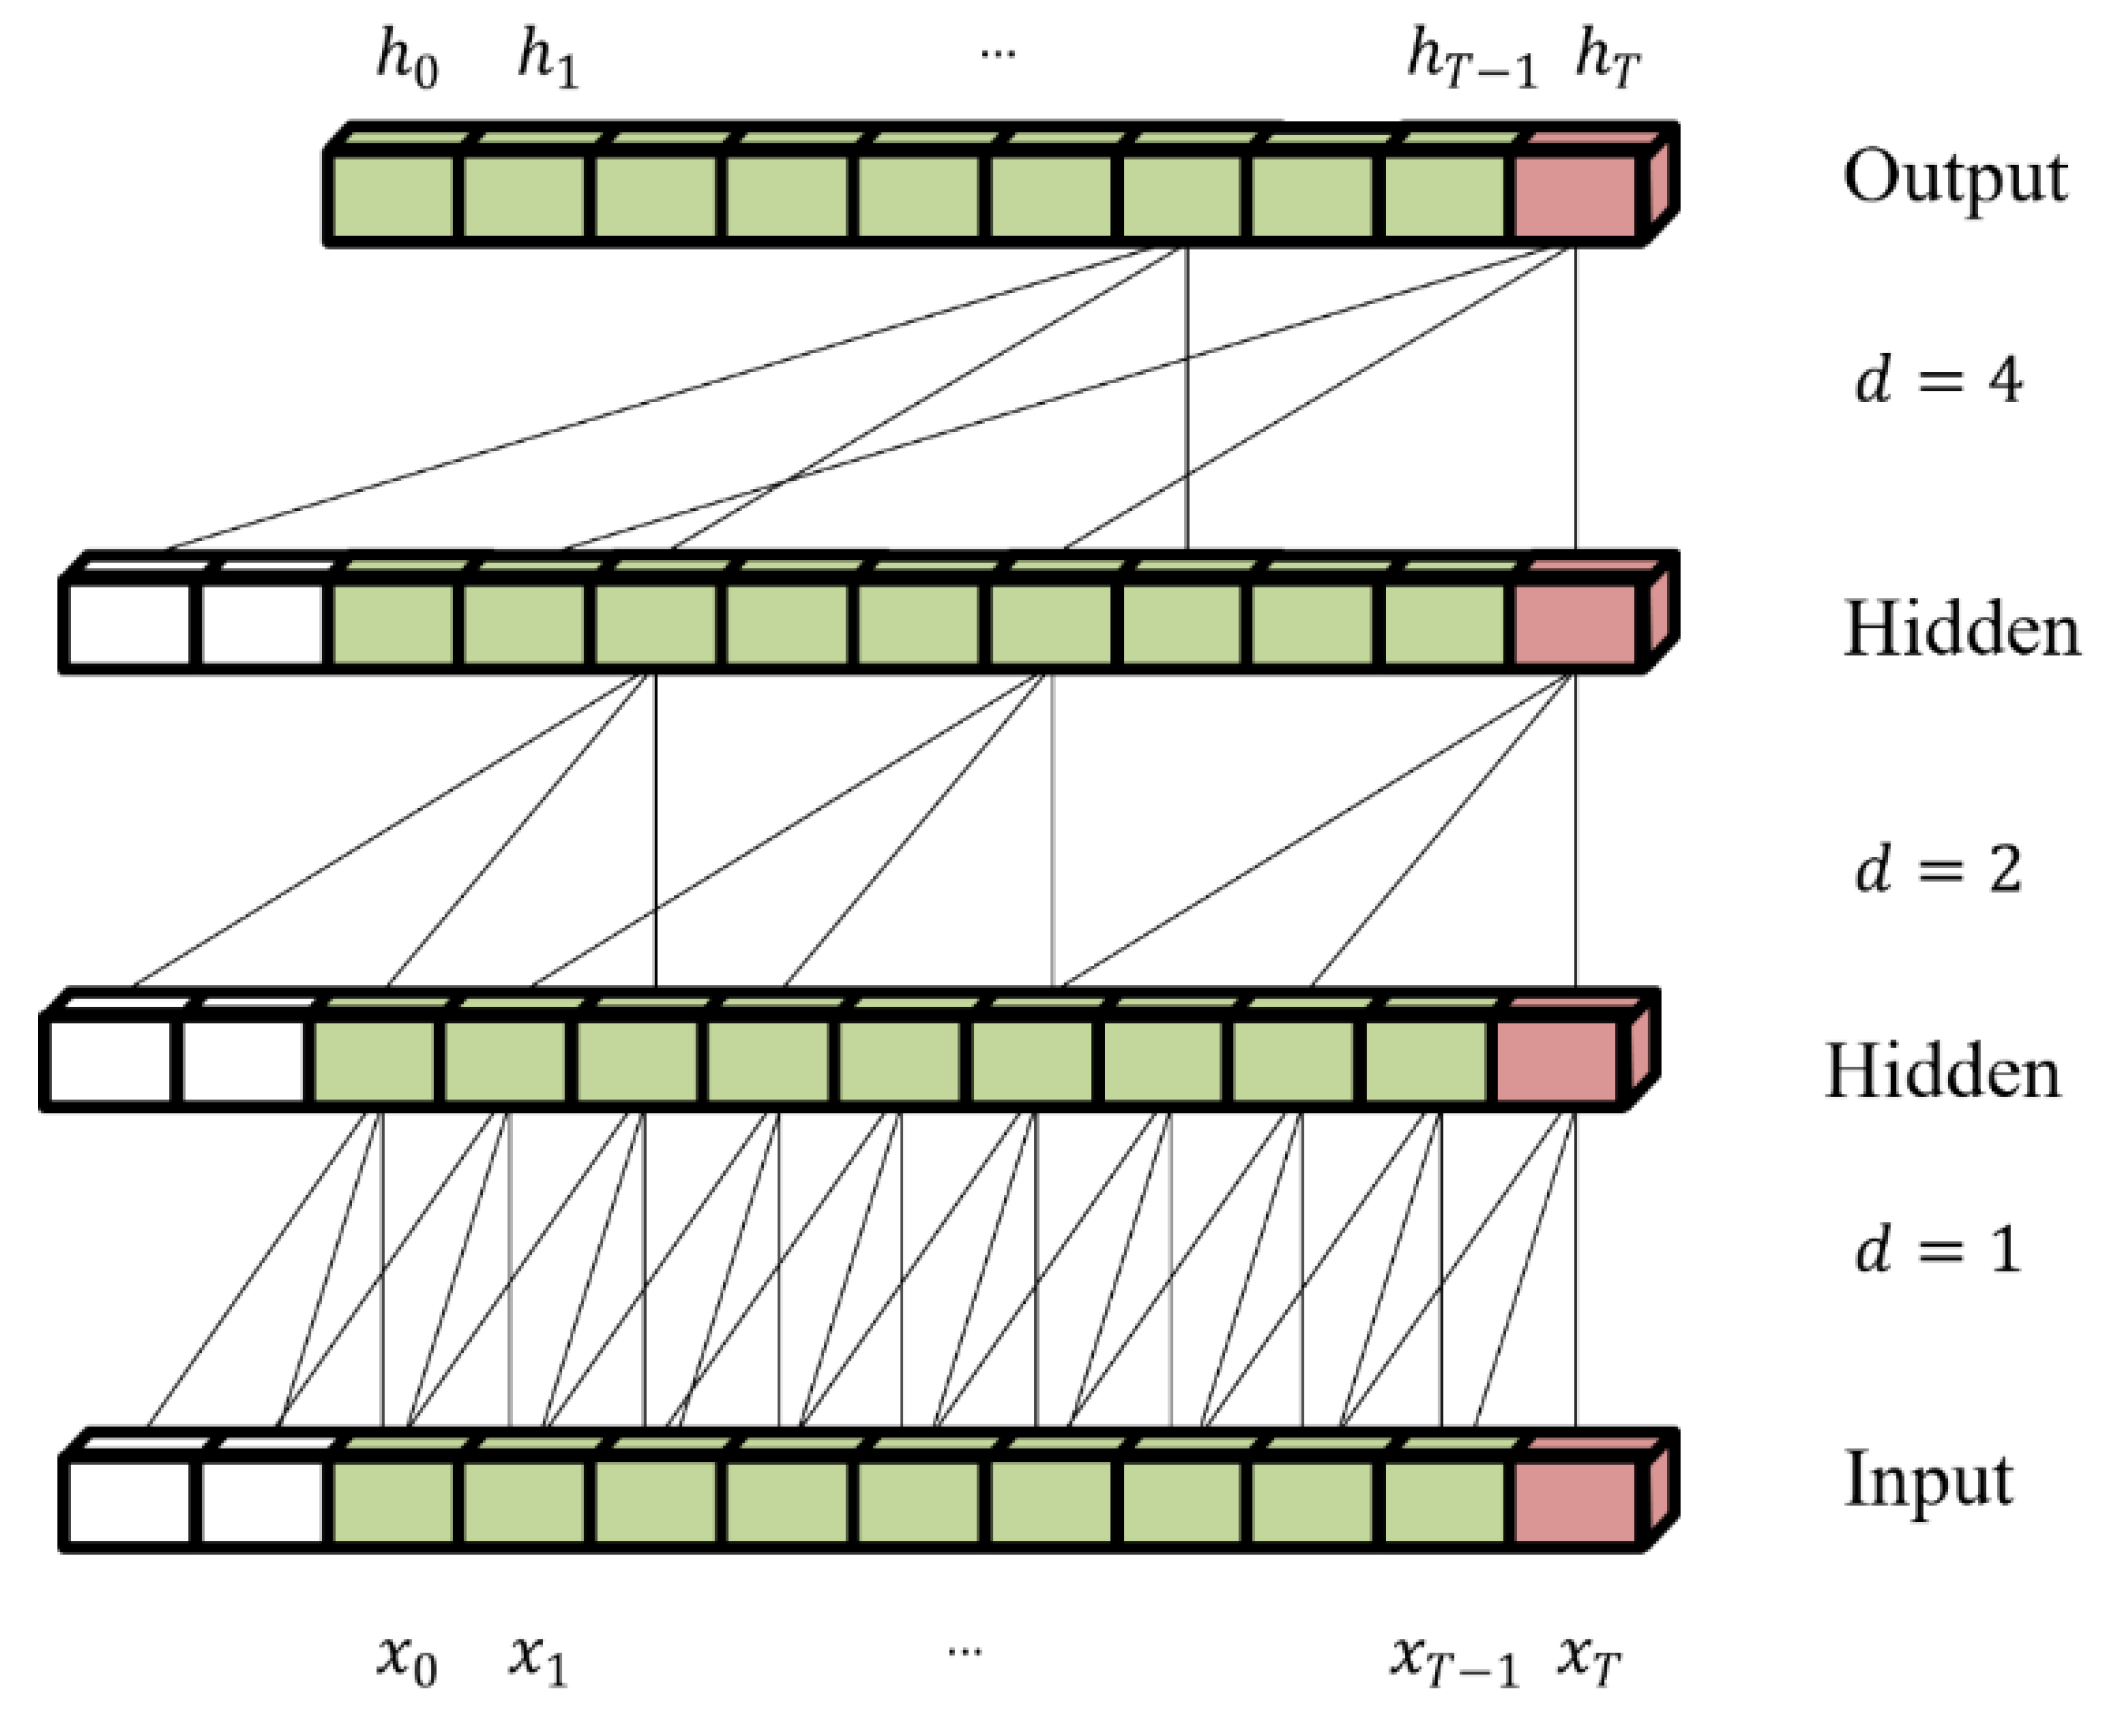
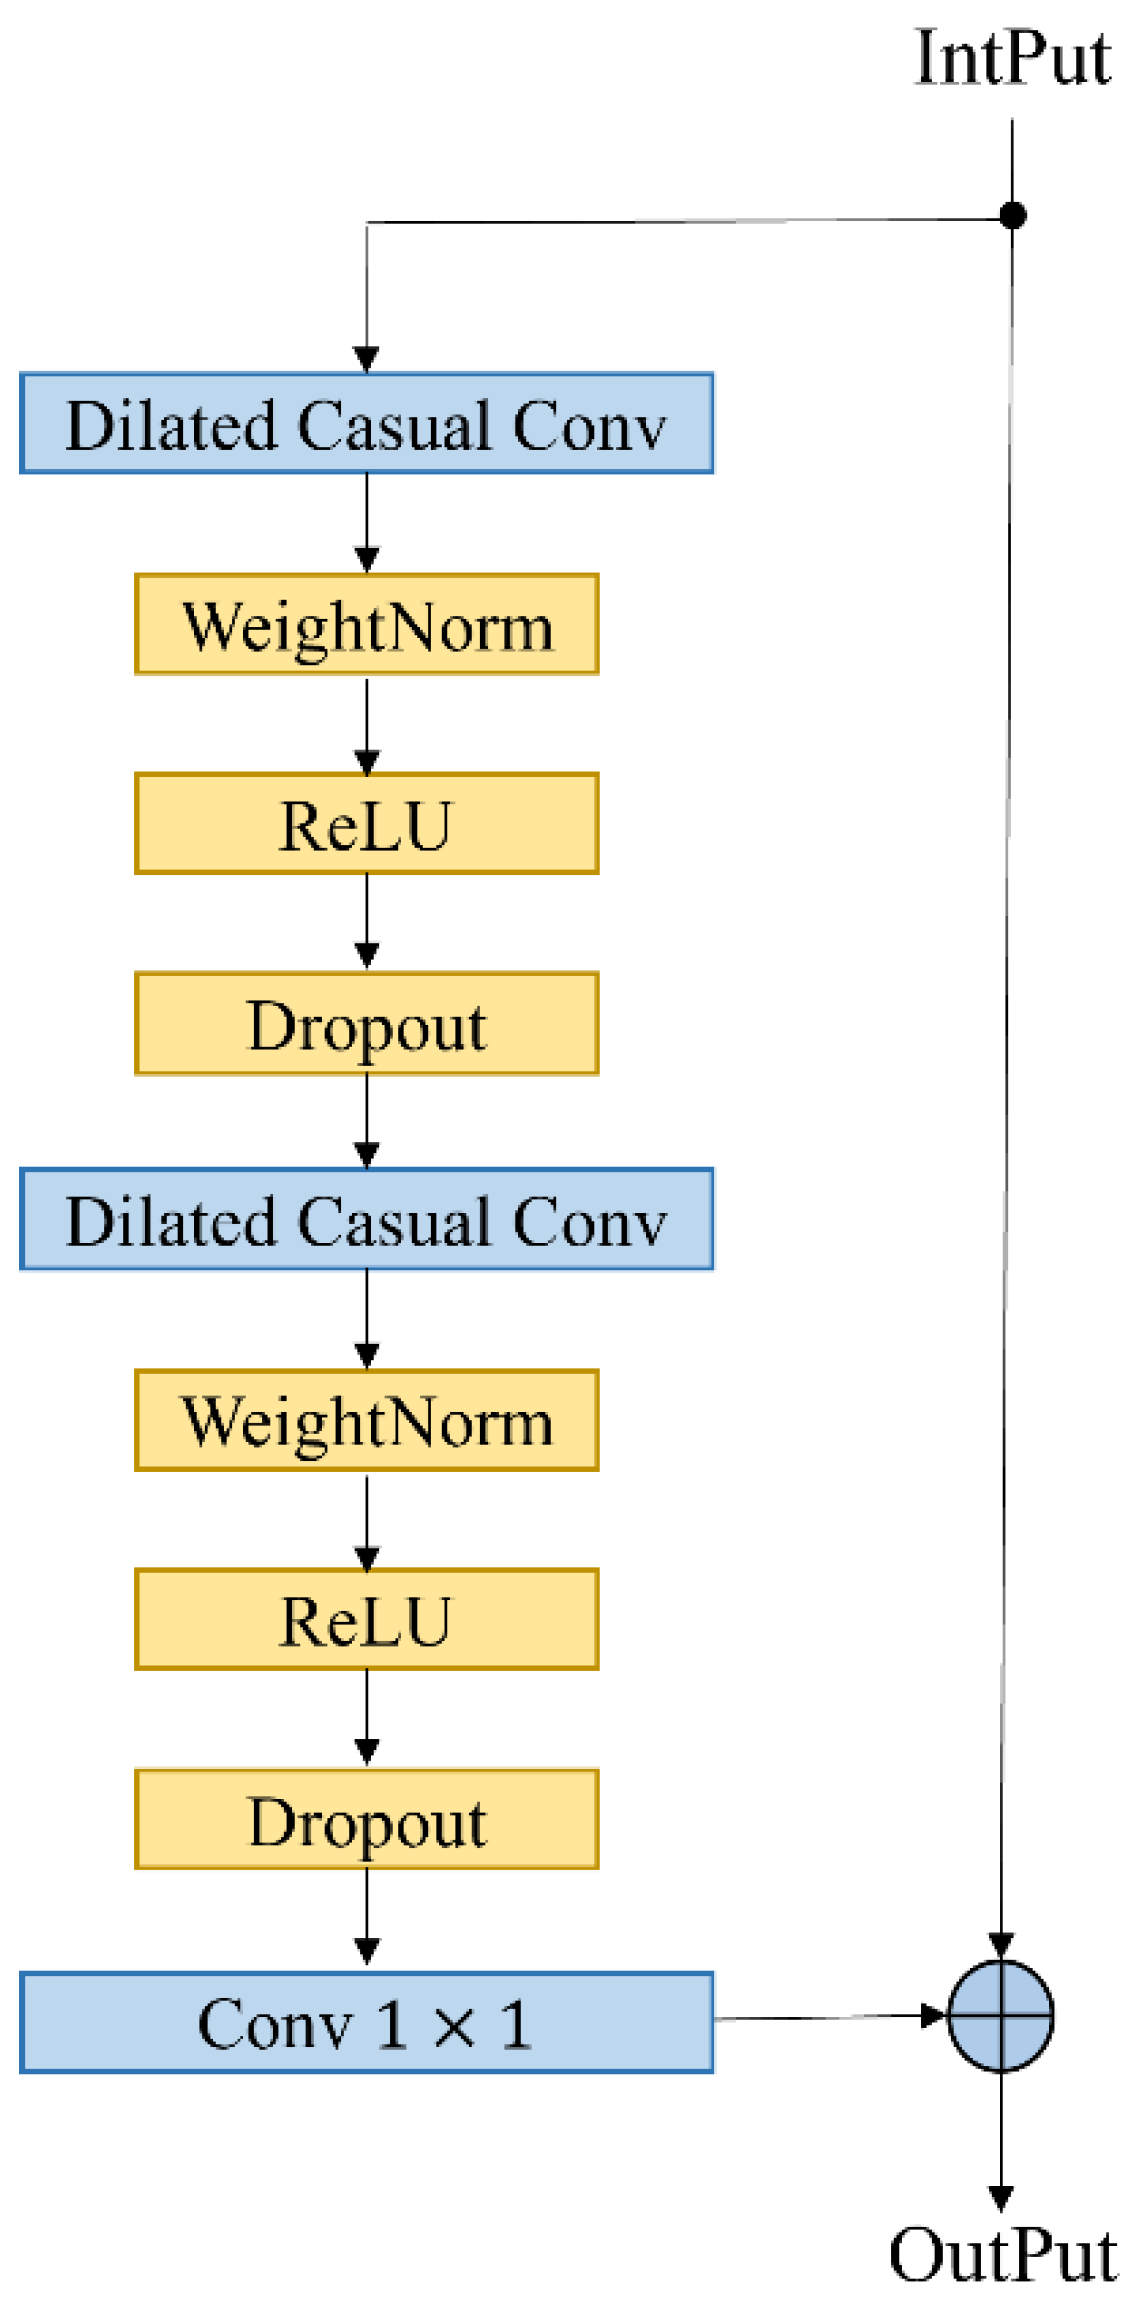
2.4.1. Sequence Space Feature Representation Based on TCN
2.4.2. LSTM
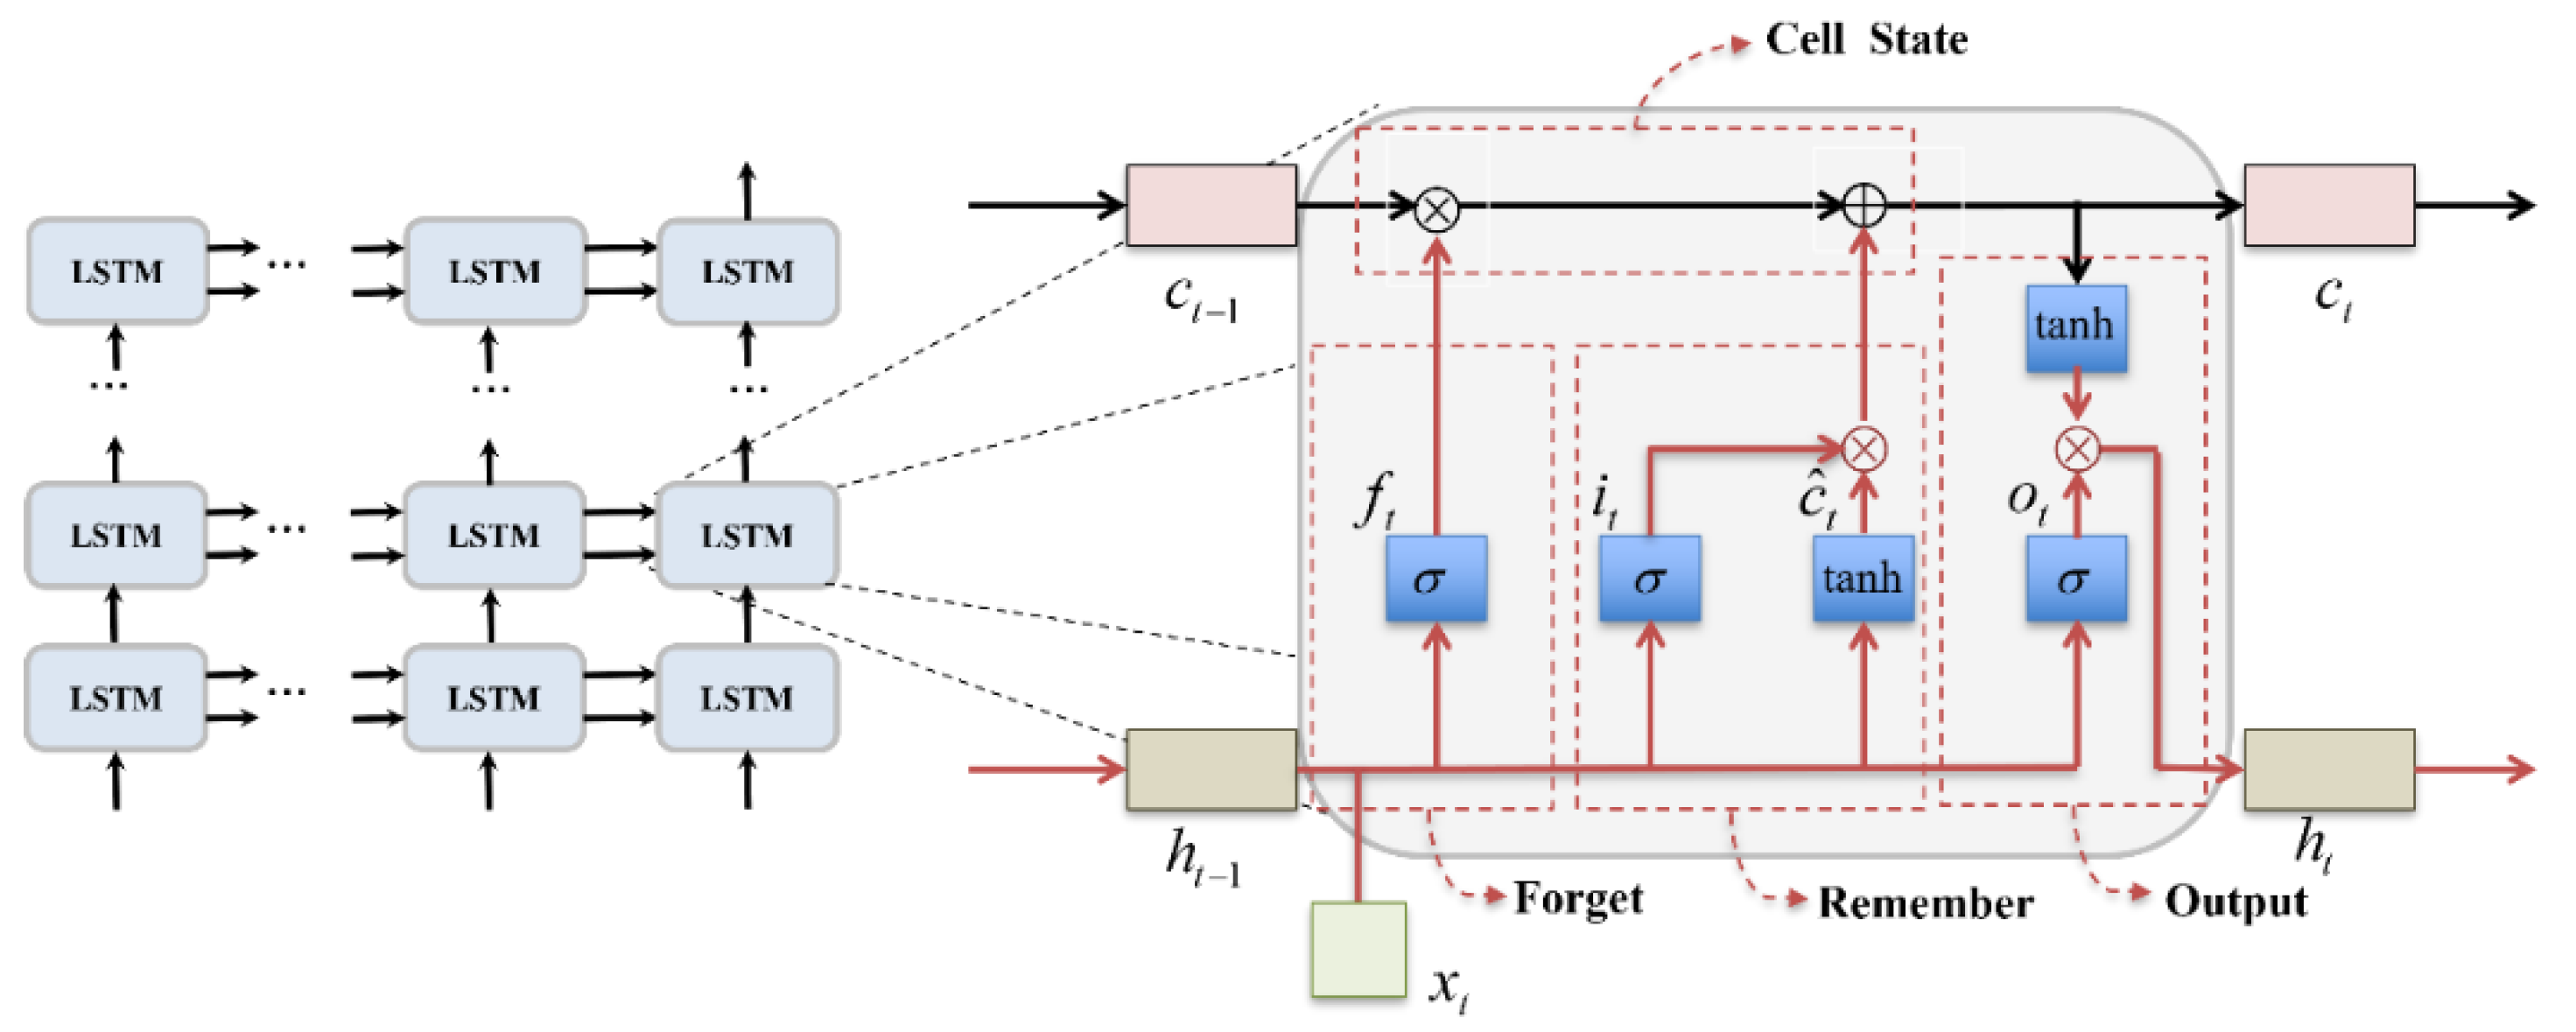
2.4.3. Attention-Based Tensor Concatenation Module
3. Experiments
3.1. Material Preparation
3.1.1. Wake Vortex CFD Numerical Simulation Data
3.1.2. CFD Data Validation
3.2. Evaluation Criteria
3.3. PA-TLA Parameter Configuration
3.4. Results Analysis
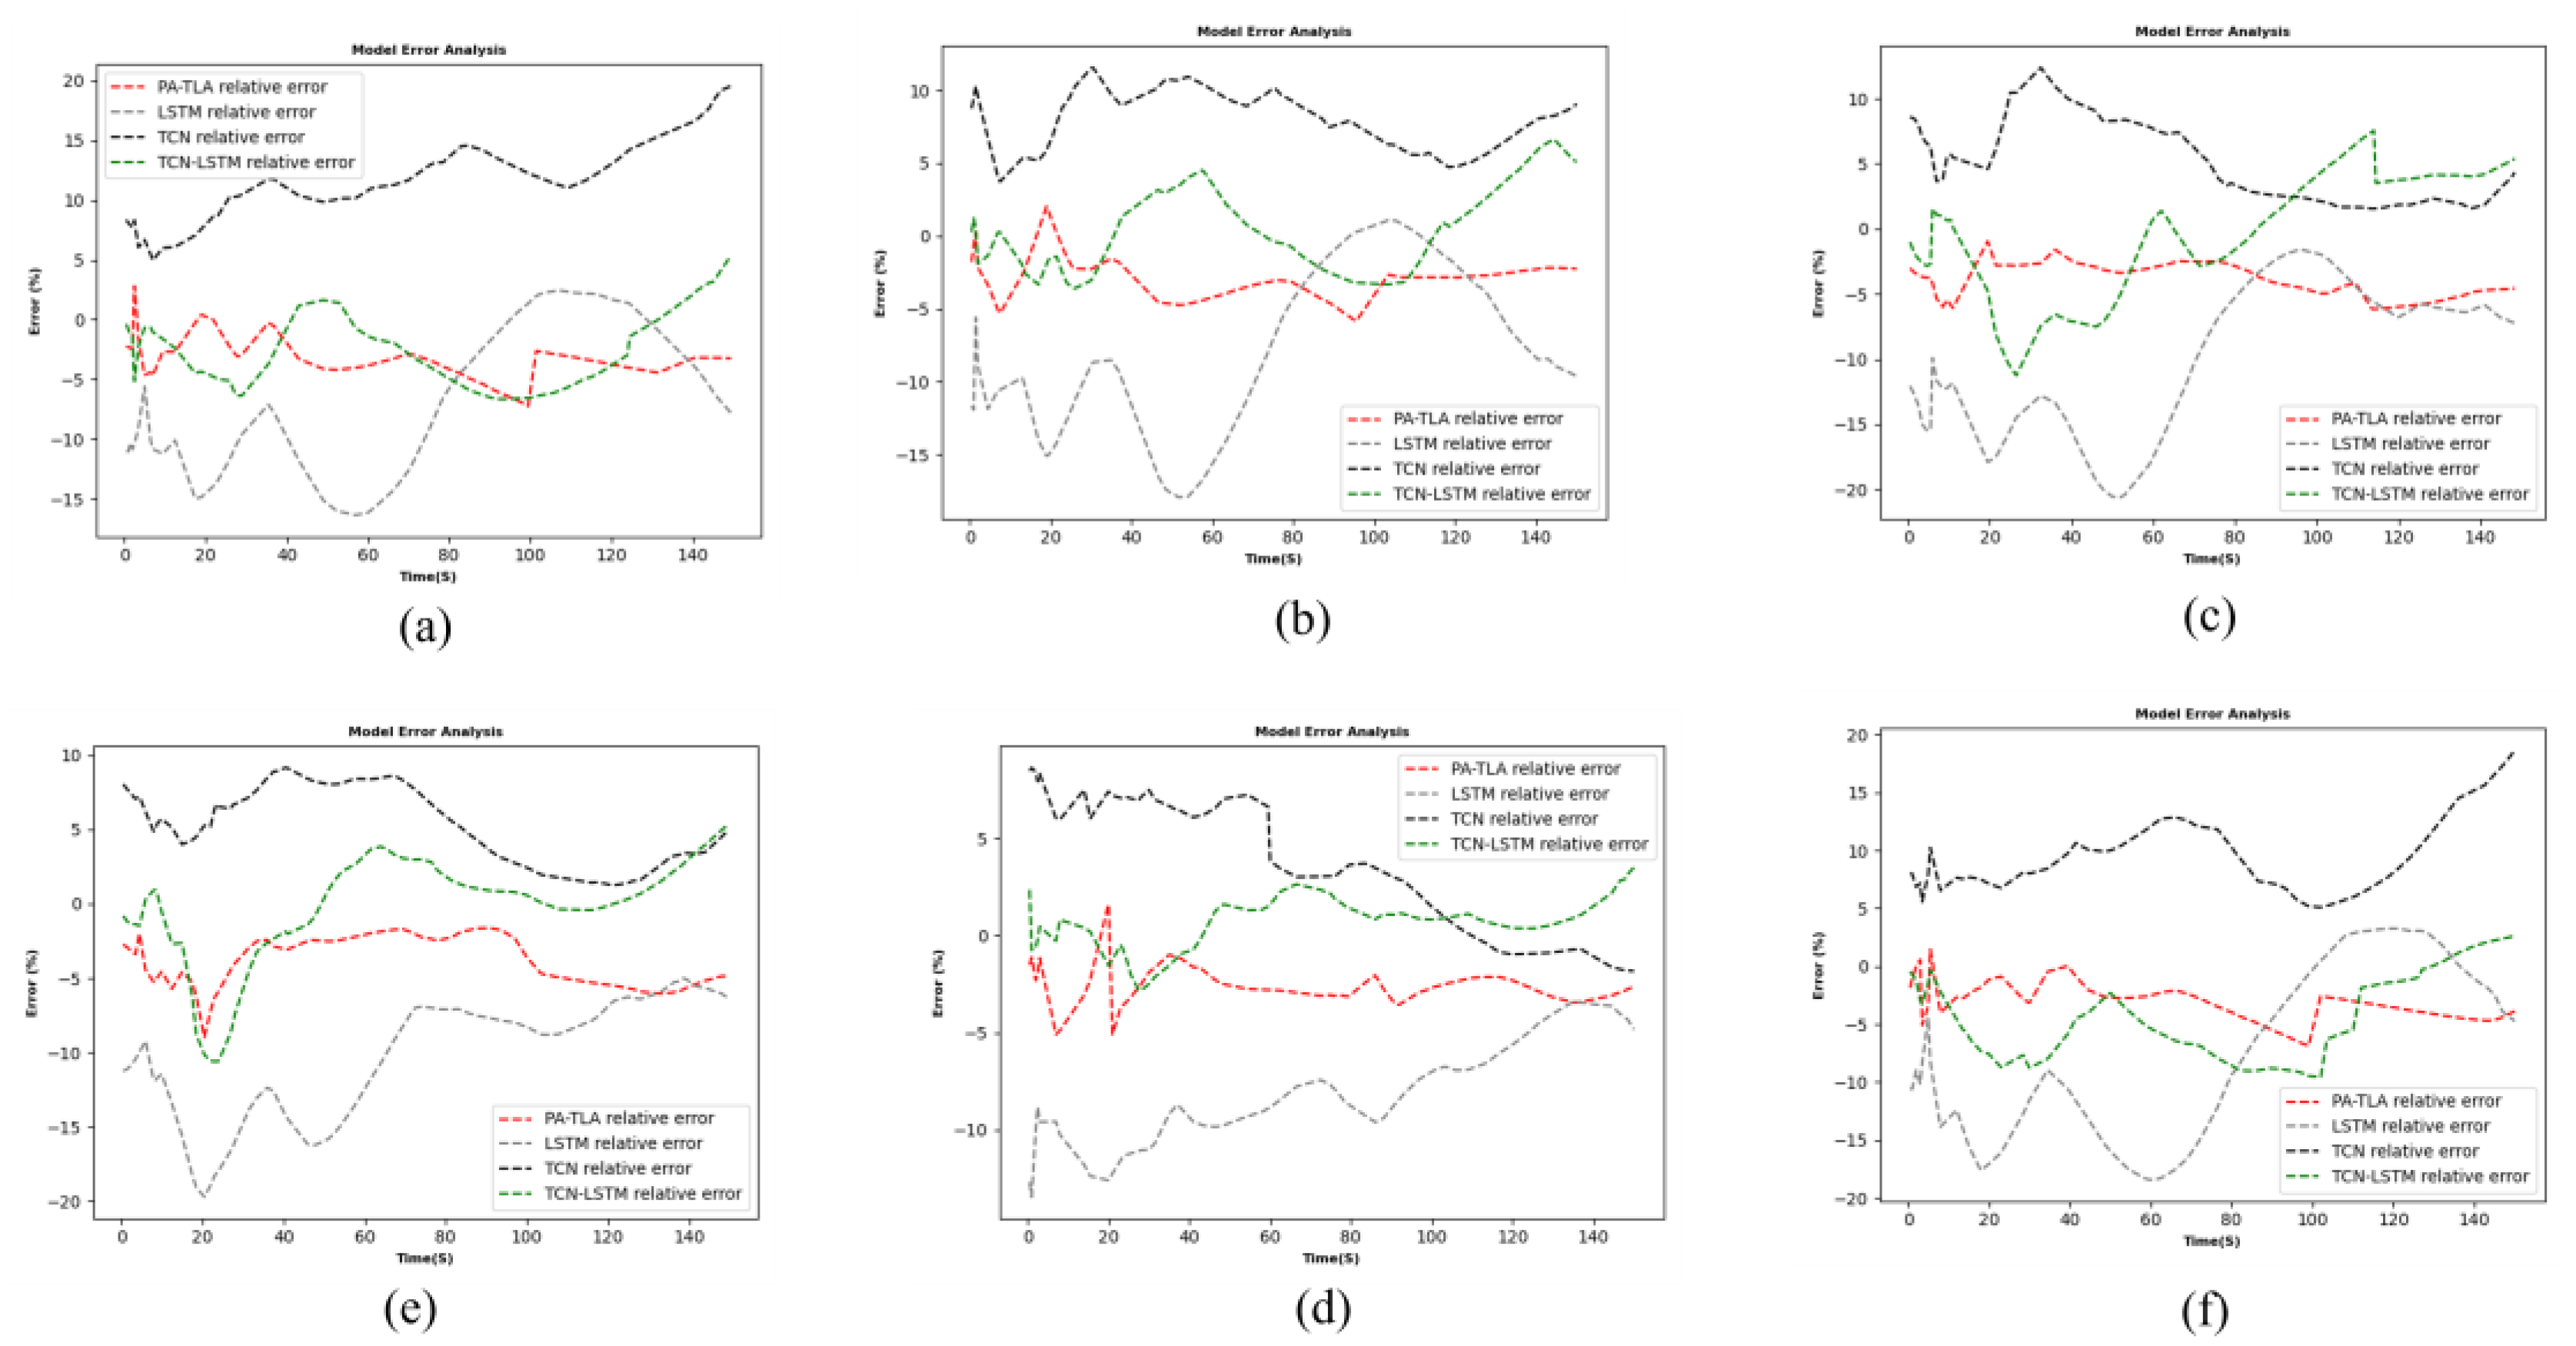
3.4.1. Wake Evolution Prediction Model Based on PA-TLA
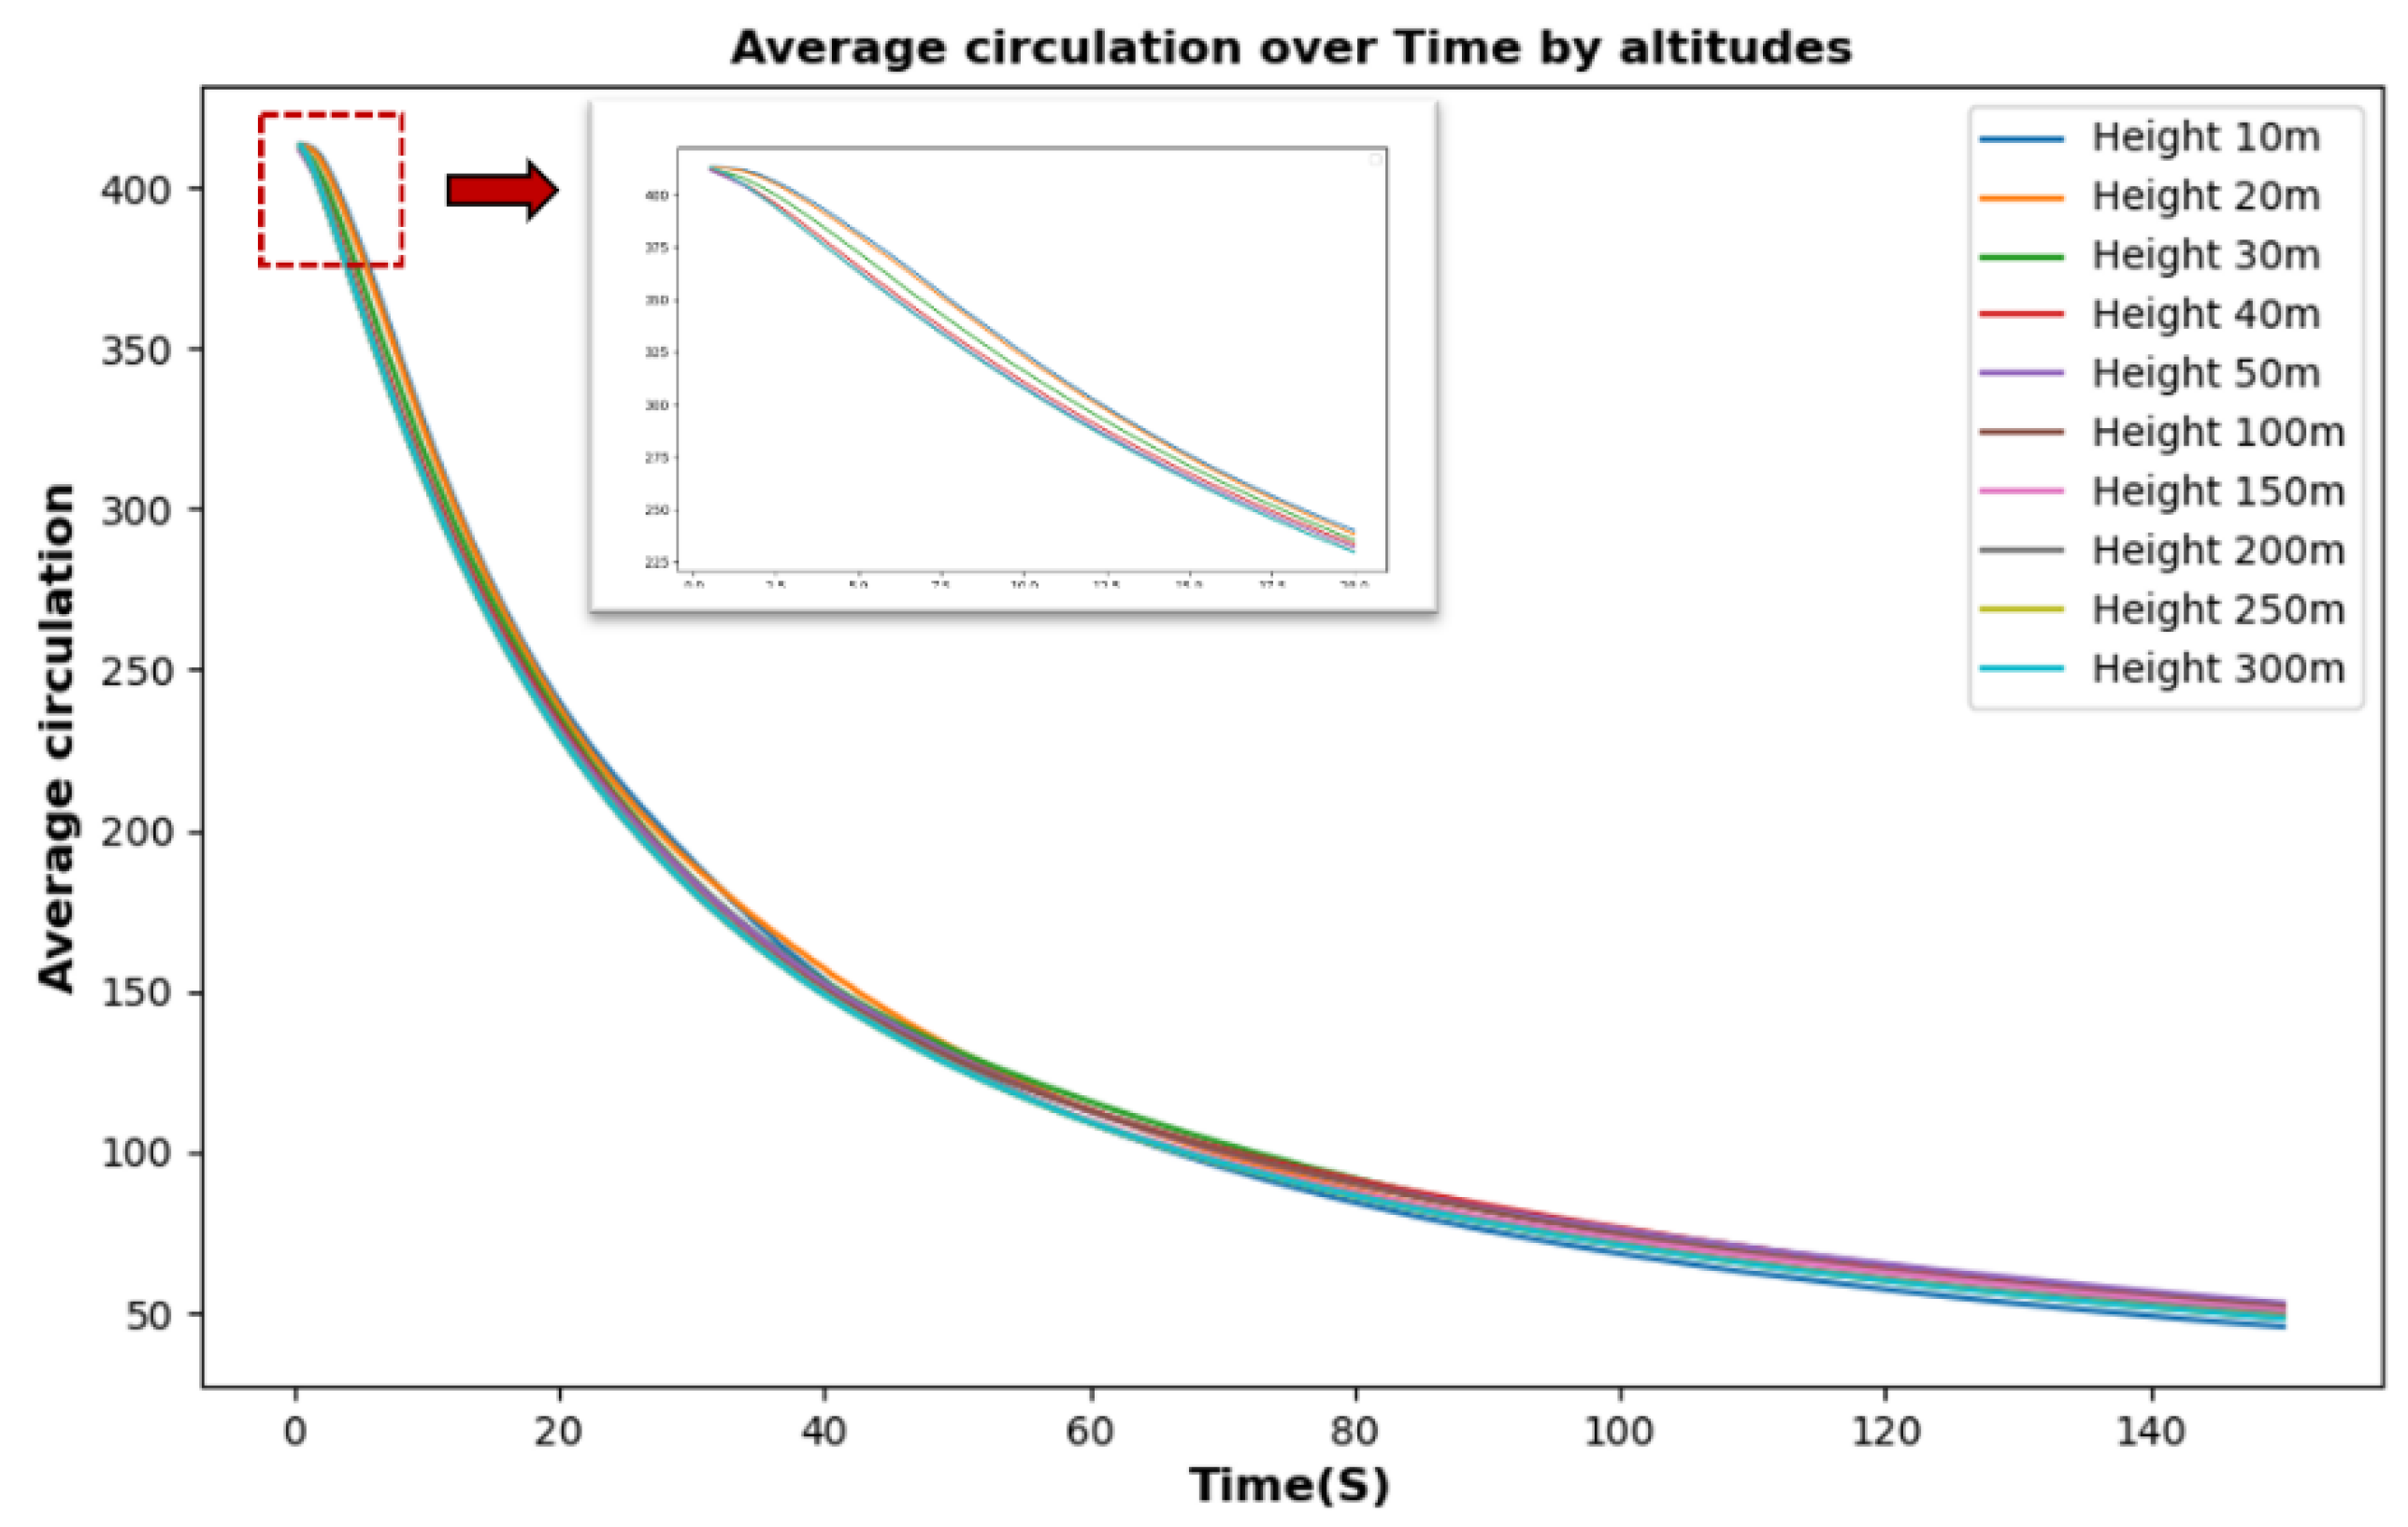
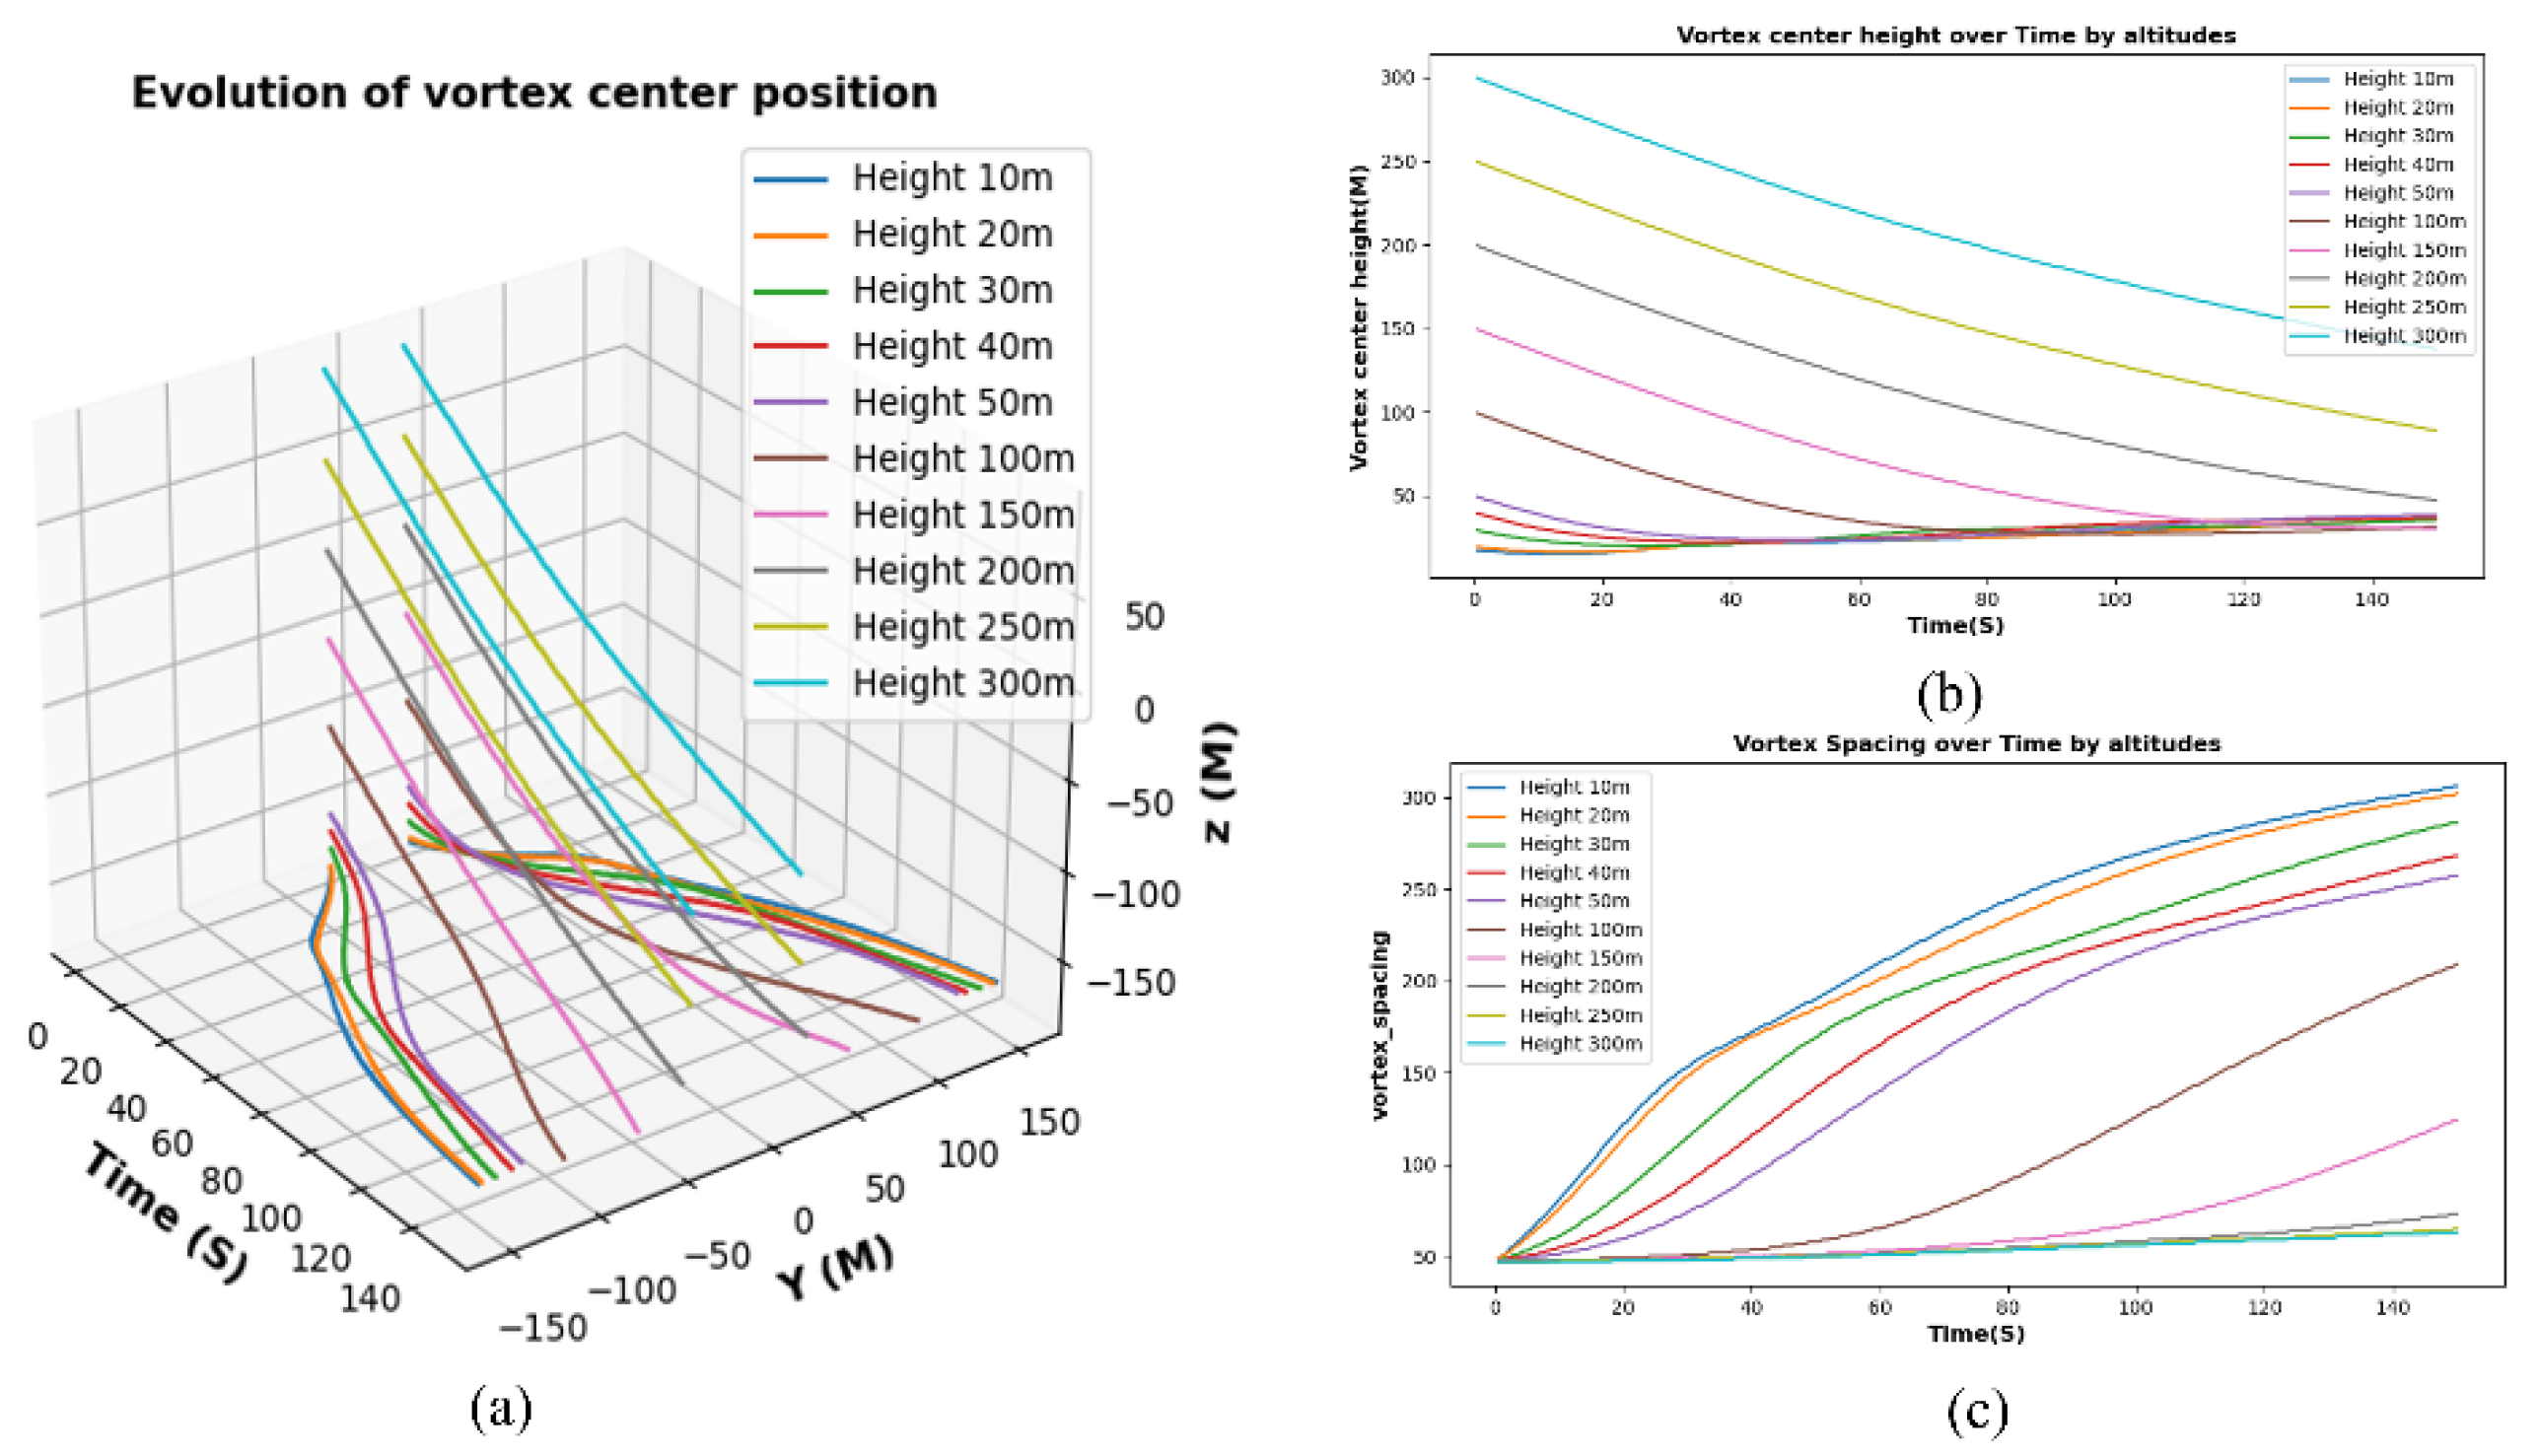
3.4.2. Analysis of Near-Ground Phase Wake Vortex Evolution Characteristics Combining Numerical Simulation and PA-TLA Model
Conclusion
- (1).
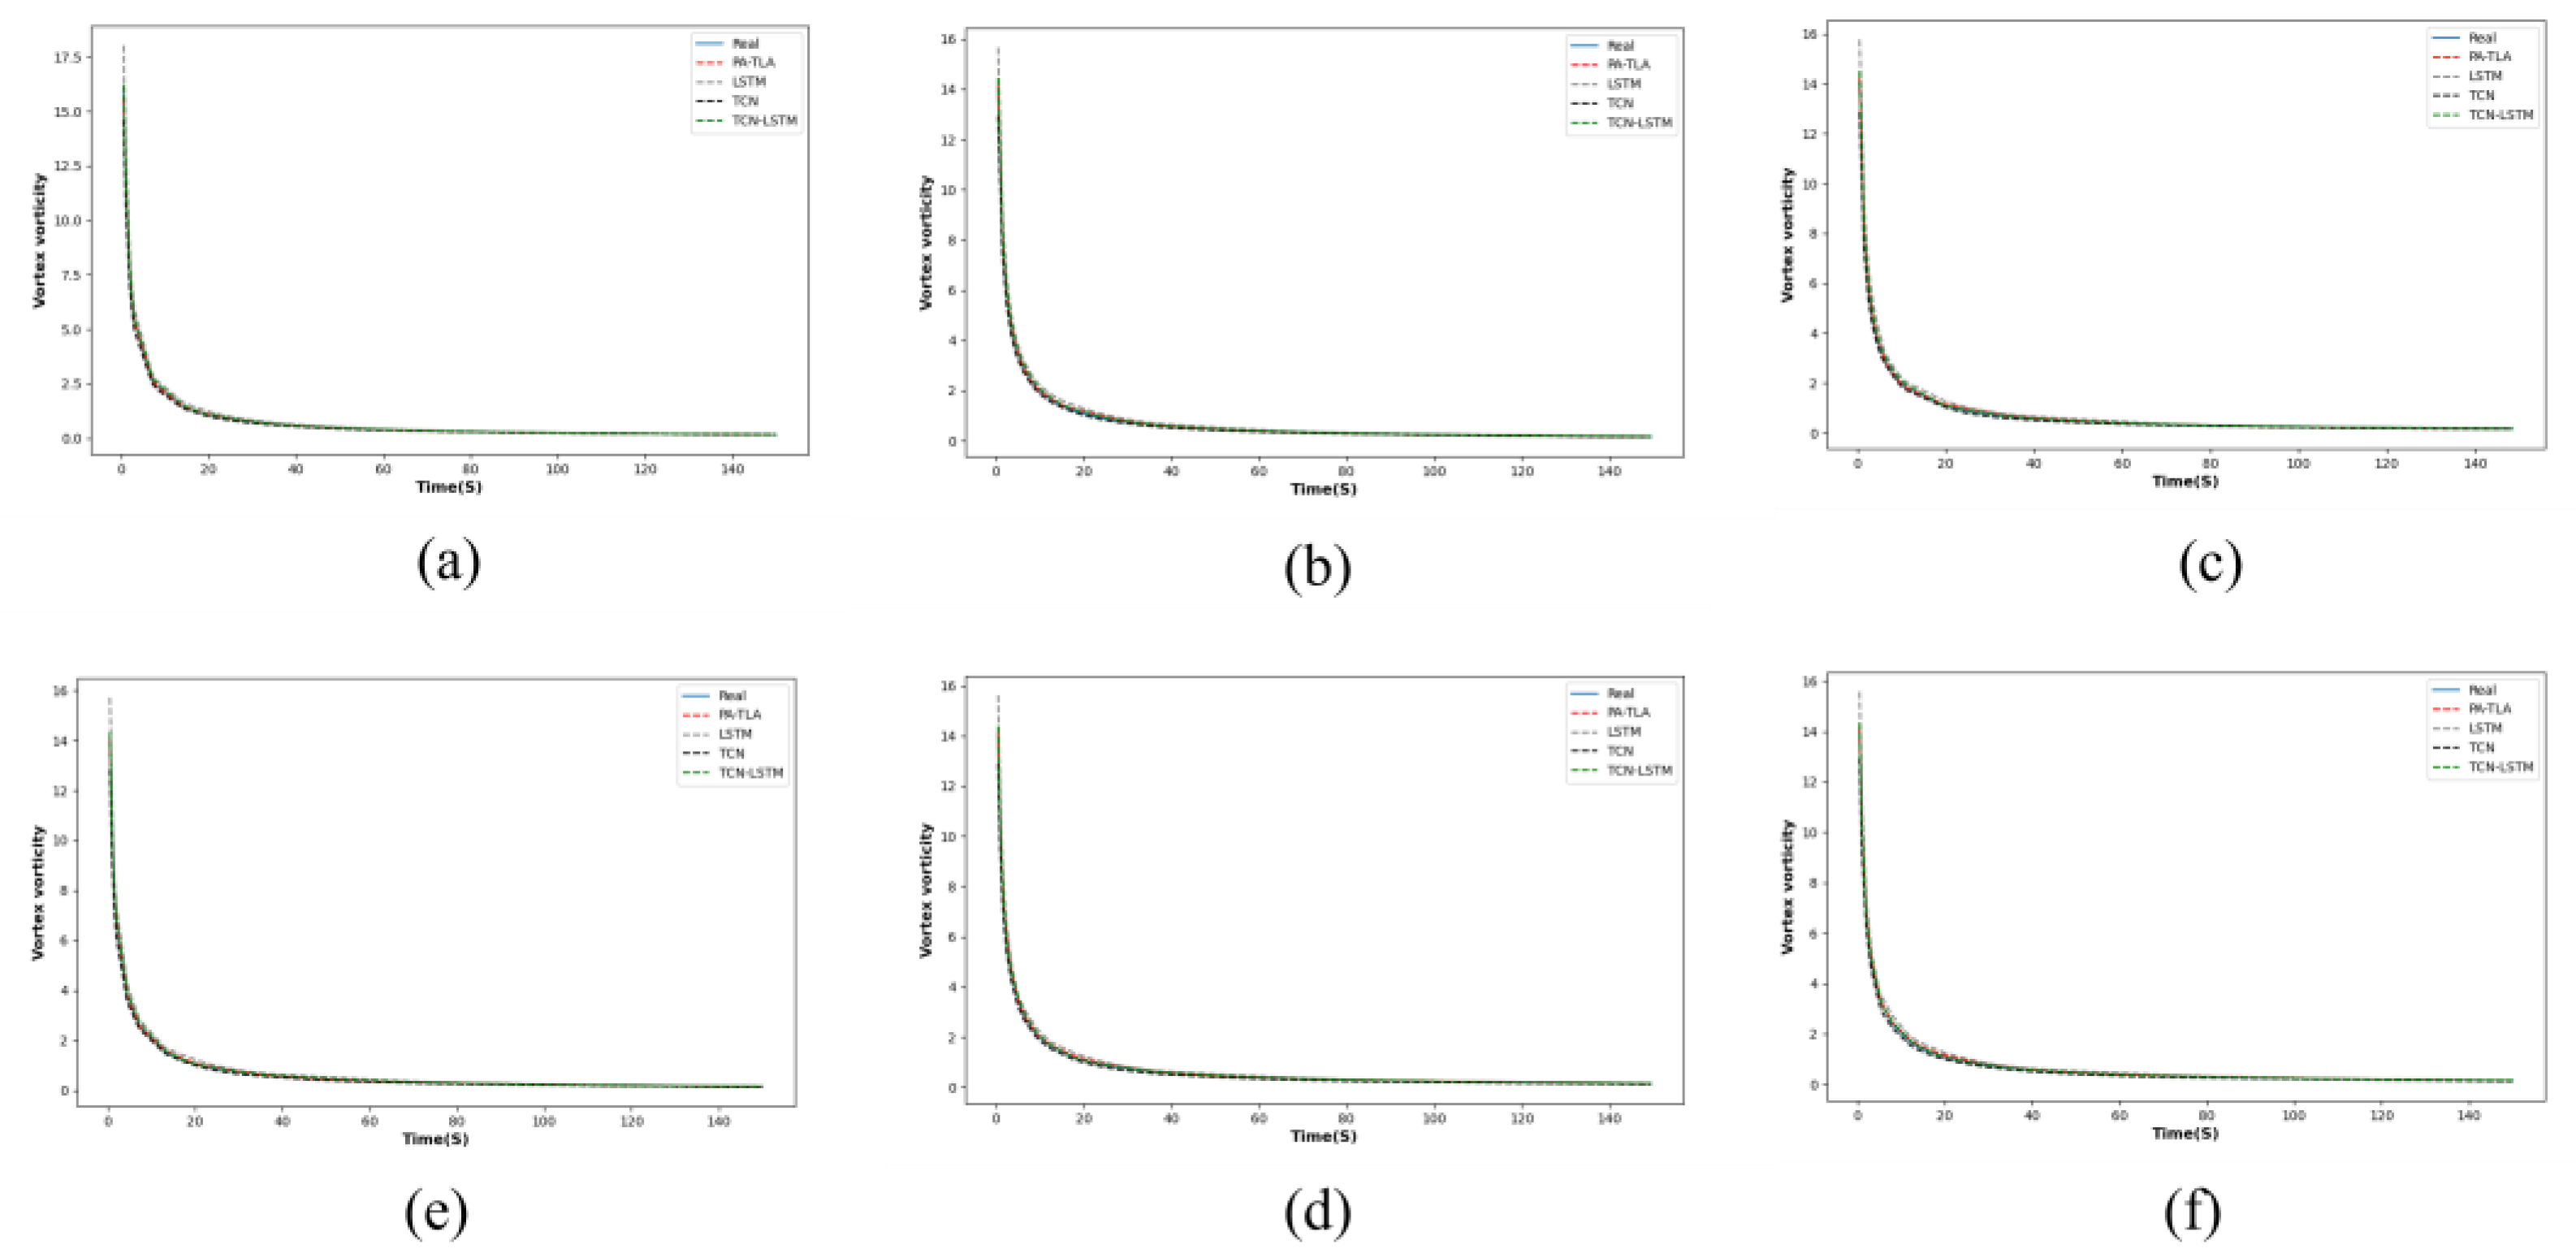
- Using PA-TLA to predict the circulation, Q criterion, and vorticity of wake vortices at different initial heights outperforms both the LSTM and TCN in various predictive indicators. Compared to traditional CFD methods, this model improves computational efficiency by approximately 40 times.
- (2).
- Different initial heights have a certain impact on the evolution of wake vortices. The circulation of aircraft wake vortices continuously decays, and at heights of 10m-50m, affected by ground effect, the higher the altitude, the faster the decay rate. Additionally, the vortex core position initially sinks briefly before showing an upward trend. The ground effect induces an increase in the distance between two vortices, developing towards isolated vortex stages and weakening the mutual induction forces between them. From 50m-300m, as the ground effect weakens, the circulation declines in almost the same trend, and the vortex core position continues to drop.
- (3).
- This study provides important insights for the research of paired approach wake separation. The proposed model effectively reduces the computational time for aircraft wake evolution characteristics. This research enables a more detailed exploration of safe wake intervals for paired aircraft at different altitudes. Our study only considered the characteristics of aircraft wake evolution during the approach phase under calm wind conditions and constructed a preliminary data prediction using PA-TLA. In the future, more scenarios will be added, such as different aircraft types, side winds, headwinds, temperature, humidity conditions for aircraft wake evolution characteristics, and calculating the safe wake intervals for different aircraft combinations, establishing a wake evolution characteristic database for rapid prediction of wake safe intervals.
Author Contributions
Funding
Data Availability Statement
Conflicts of Interest
References
- Lauer, N.; Yeo, D.W.; Snyder, D.A.; Paley, D.A. Tip-Vortex Localization for Cross-Stream Position Control of a Multi-Hole Probe Relative to a Stationary Wing in a Free-Jet Wind Tunnel. In Proceedings of the AIAA Guidance, Navigation, and Control Conference; American Institute of Aeronautics and Astronautics: Reston, Virginia, January 5 2017. [CrossRef]
- Gerz, T.; Holzäpfel, F.; Darracq, D. Commercial Aircraft Wake Vortices. Progress in Aerospace Sciences 2002, 38, 181–208. [Google Scholar] [CrossRef]
- De Visscher, I.; Bricteux, L.; Winckelmans, G. Aircraft Vortices in Stably Stratified and Weakly Turbulent Atmospheres: Simulation and Modeling. AIAA Journal 2013, 51, 551–566. [Google Scholar] [CrossRef]
- Tang, Z.-G.; Zhu, L.-Y.; Xiang, X.-H.; et al. Several research progress and prospects of intelligent aerodynamics. Chinese Journal of Aerodynamics 2023, 41, 1–35. [Google Scholar]
- Zheng, T.-Y.; Wang, S.-Y.; Wang, G.-X.; Deng, X.-G. High-Order Natural Transition Simulation Method Based on Deep Residual Network. Acta Physica Sinica 2020, 69, 204701. [Google Scholar] [CrossRef]
- Wu, L.; Cui, B.; Xiao, Z. Artificial Neural Network-Based One-Equation Model for Simulation of Laminar-Turbulent Transitional Flow. Theoretical and Applied Mechanics Letters 2023, 13, 100387. [Google Scholar] [CrossRef]
- Carpenter, M.; Hartfield, R.; Burkhalter, J. A Comprehensive Approach to Cataloging Missile Aerodynamic Performance Using Surrogate Modeling Techniques and Statistical Learning. In Proceedings of the 29th AIAA Applied Aerodynamics Conference; American Institute of Aeronautics and Astronautics: Reston, Virigina, June 27 2011. [CrossRef]
- Balla, K.; Sevilla, R.; Hassan, O.; Morgan, K. An Application of Neural Networks to the Prediction of Aerodynamic Coefficients of Aerofoils and Wings. Applied Mathematical Modelling 2021, 96, 456–479. [Google Scholar] [CrossRef]
- Wang, Z.; Xiao, D.; Fang, F.; Govindan, R.; Pain, C.C.; Guo, Y. Model Identification of Reduced Order Fluid Dynamics Systems Using Deep Learning. International Journal for Numerical Methods in Fluids 2017, 86, 255–268. [Google Scholar] [CrossRef]
- Luo, H.; Pan, W.; Wang, Y.; Luo, Y. A330-300 Wake Encounter by ARJ21 Aircraft. Aerospace 2024, 11, 144. [Google Scholar] [CrossRef]
- Xu, Y.; Sha, Y.; Wang, C.; Cao, W.; Wei, Y. Comparative Studies of Predictive Models for Unsteady Flow Fields Based on Deep Learning and Proper Orthogonal Decomposition. Ocean Engineering 2023, 272, 113935. [Google Scholar] [CrossRef]
- He, X.; Zhao, R.; Gao, H.; Yuan, C.; Wang, J. Prediction of Aircraft Wake Vortices under Various Crosswind Velocities Based on Convolutional Neural Networks. Sustainability 2023, 15, 13383. [Google Scholar] [CrossRef]
- Rojas, J.I.; Melgosa, M.; Prats, X. Sensitivity Analysis of Maximum Circulation of Wake Vortex Encountered by En-Route Aircraft. Aerospace 2021, 8, 194. [Google Scholar] [CrossRef]
- Holzäpfel, F.; Steen, M. Aircraft Wake-Vortex Evolution in Ground Proximity: Analysis and Parameterization. In Proceedings of the 44th AIAA Aerospace Sciences Meeting and Exhibit; American Institute of Aeronautics and Astronautics: Reston, Virigina, January 9 2006. [CrossRef]
- Holzäpfel, F. Probabilistic Two-Phase Wake Vortex Decay and Transport Model. Journal of Aircraft 2003, 40, 323–331. [Google Scholar] [CrossRef]
- Sekine, K.; Kato, F.; Kageyama, K.; Itoh, E. Data-Driven Simulation for Evaluating the Impact of Lower Arrival Aircraft Separation on Available Airspace and Runway Capacity at Tokyo International Airport. Aerospace 2021, 8, 165. [Google Scholar] [CrossRef]
- Gerz, T.; Holzäpfel, F.; Darracq, D. Commercial Aircraft Wake Vortices. Progress in Aerospace Sciences 2002, 38, 181–208. [Google Scholar] [CrossRef]
- Crow, S. Stability Theory for a Pair of Trailing Vortices. In Proceedings of the 8th Aerospace Sciences Meeting; American Institute of Aeronautics and Astronautics: Reston, Virigina, January 19 1970. [CrossRef]
- Holzäpfel, F.; Hofbauer, T.; Darracq, D.; Moet, H.; Garnier, F.; Gago, C.F. Analysis of Wake Vortex Decay Mechanisms in the Atmosphere. Aerospace Science and Technology 2003, 7, 263–275. [Google Scholar] [CrossRef]
- Han, J.; Lin, Y.-L.; Arya, S.; Proctor, F. Large Eddy Simulation of Aircraft Wake Vortices in a Homogeneous Atmospheric Turbulence-Vortex Decay and Descent. In Proceedings of the 37th Aerospace Sciences Meeting and Exhibit; American Institute of Aeronautics and Astronautics: Reston, Virigina, January 11 1999. [CrossRef]
- Holzäpfel, F.; Gerz, T.; Baumann, R. The Turbulent Decay of Trailing Vortex Pairs in Stably Stratified Environments. Aerospace Science and Technology 2001, 5, 95–108. [Google Scholar] [CrossRef]
- 2017, 30, 1866–1876. [CrossRef]
- Harvey, J.K.; Perry, F.J. Flowfield Produced by Trailing Vortices in the Vicinity of the Ground. AIAA Journal 1971, 9, 1659–1660. [Google Scholar] [CrossRef]
- Harris, D.M.; Williamson, C.H.K. Instability of Secondary Vortices Generated by a Vortex Pair in Ground Effect. Journal of Fluid Mechanics 2012, 700, 148–186. [Google Scholar] [CrossRef]
- Breitsamter, C. Wake Vortex Characteristics of Transport Aircraft. Progress in Aerospace Sciences 2011, 47, 89–134. [Google Scholar] [CrossRef]
- Holzäpfel, F.; Gerz, T.; Köpp, F.; Stumpf, E.; Harris, M.; Young, R.I.; Dolfi-Bouteyre, A. Strategies for Circulation Evaluation of Aircraft Wake Vortices Measured by Lidar. Journal of Atmospheric and Oceanic Technology 2003, 20, 1183–1195. [Google Scholar] [CrossRef]
- Rojas, J.I.; Melgosa, M.; Prats, X. Sensitivity Analysis of Maximum Circulation of Wake Vortex Encountered by En-Route Aircraft. Aerospace 2021, 8, 194. [Google Scholar] [CrossRef]
- Hirsch, C. Numerical Simulation of Inviscid Flows. In Numerical Computation of Internal and External Flows; Elsevier, 2007; pp. 545–597. [Google Scholar]
- Luo, H.; Pan, W.; Wang, Y.; Luo, Y. A330-300 Wake Encounter by ARJ21 Aircraft. Aerospace 2024, 11, 144. [Google Scholar] [CrossRef]
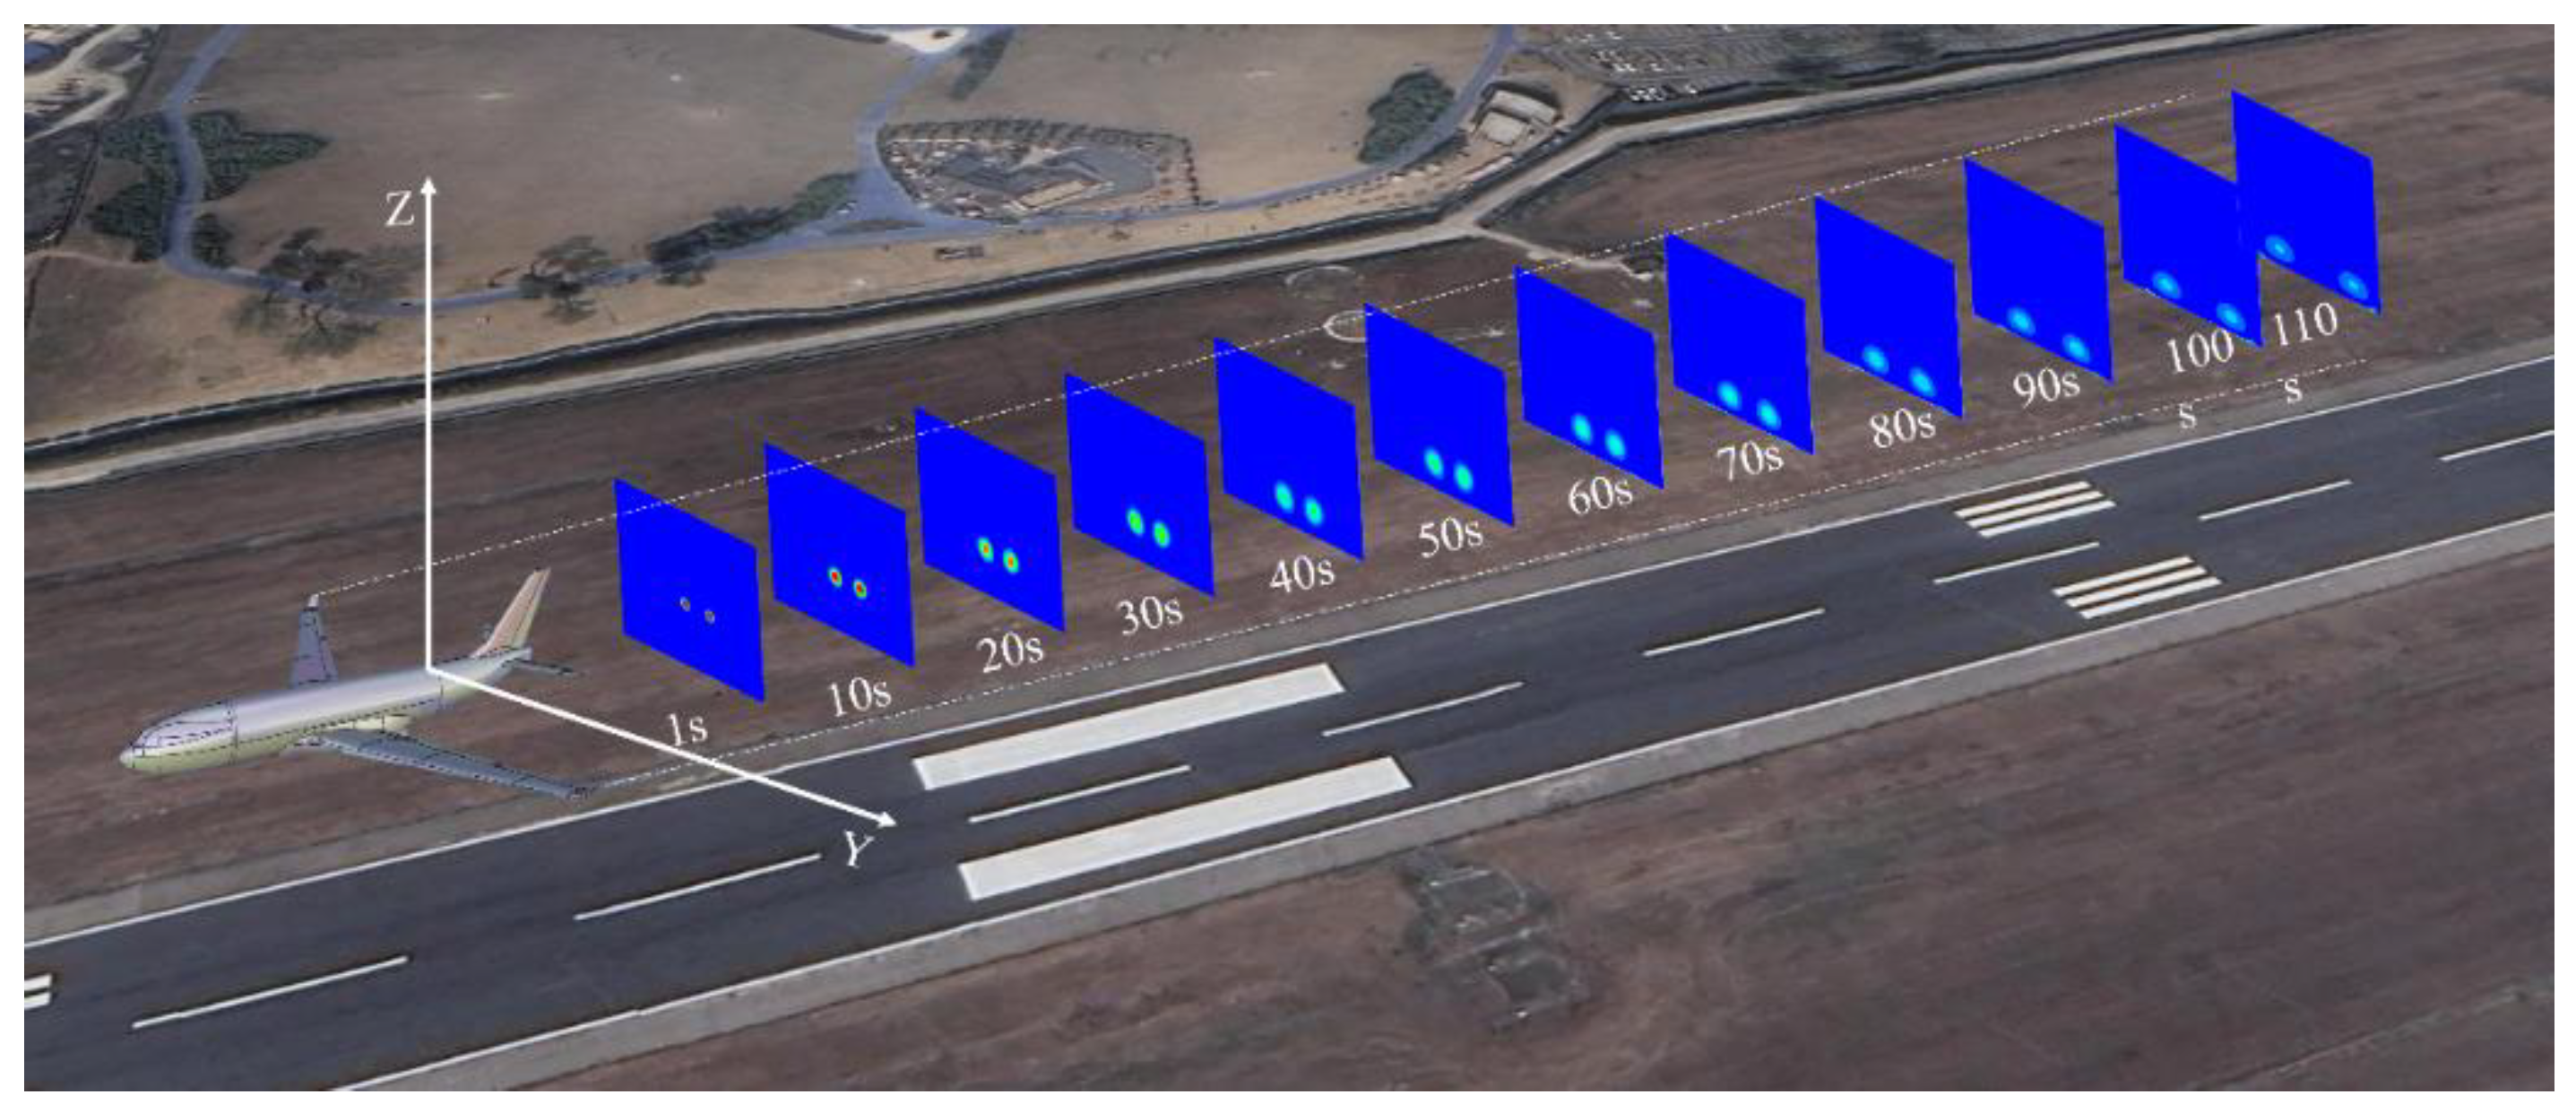
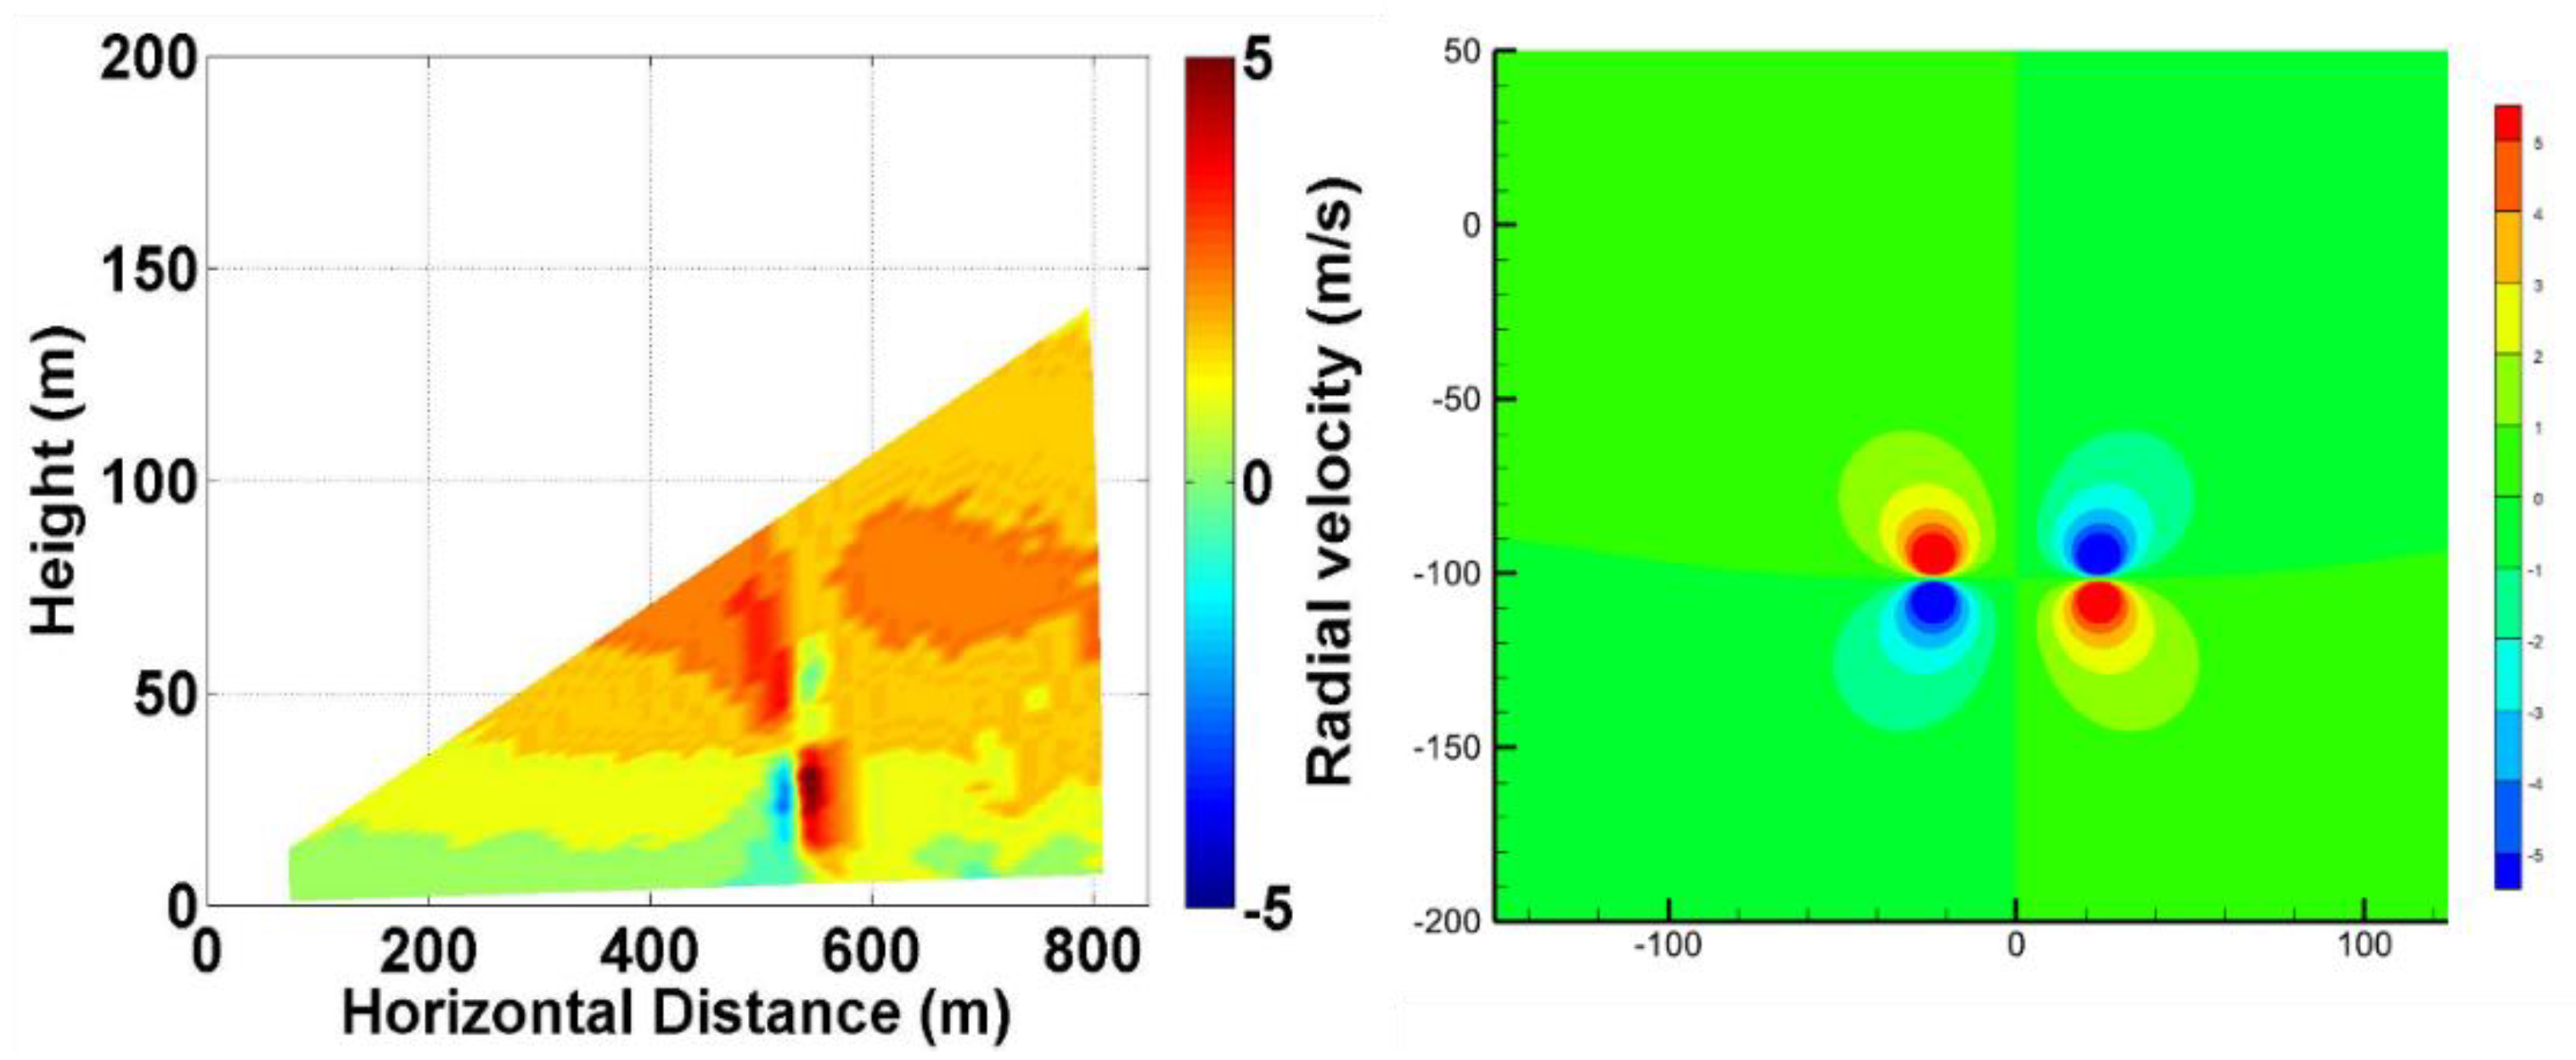
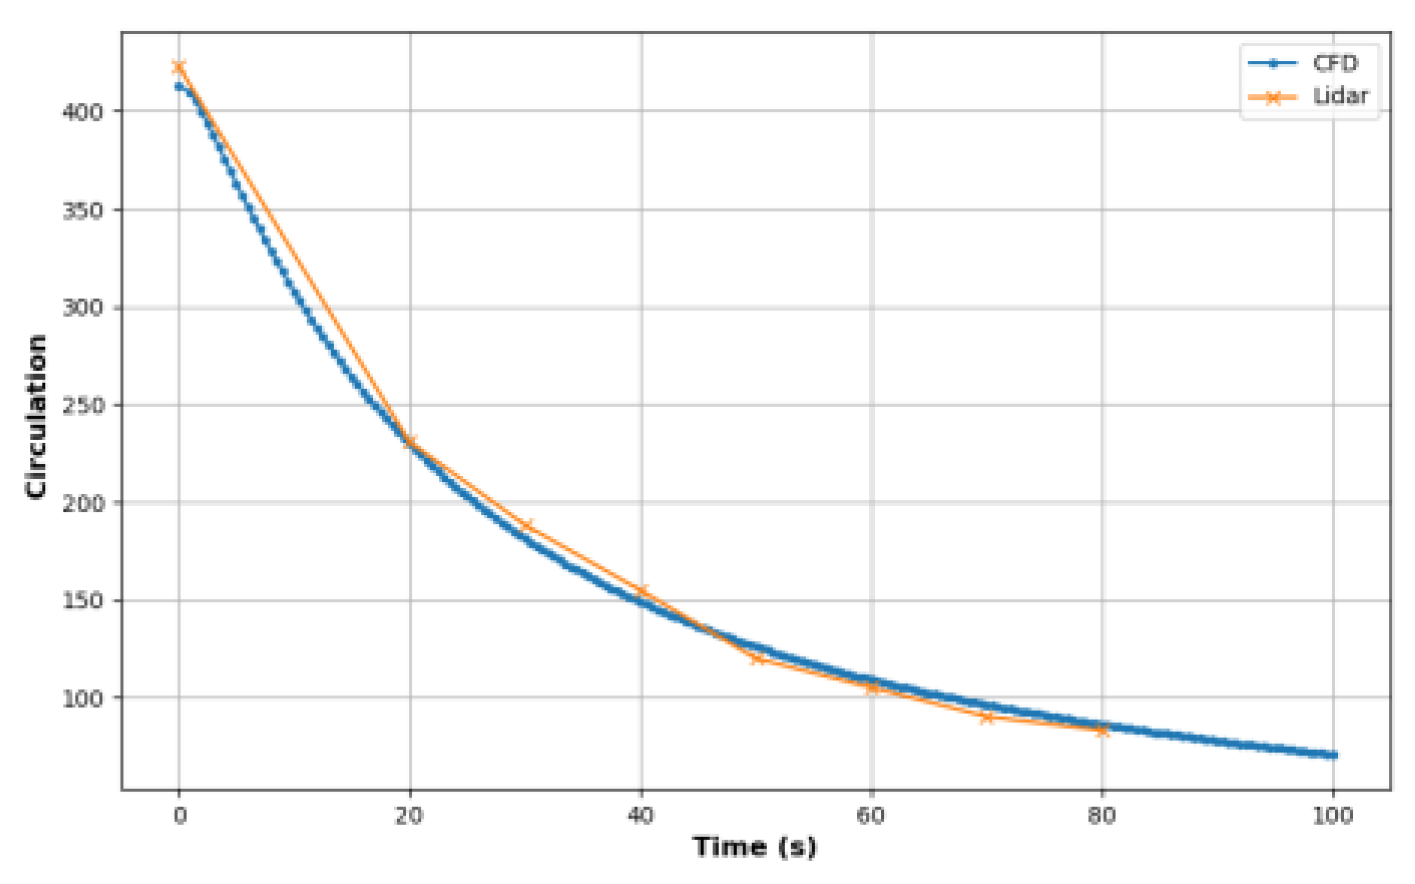
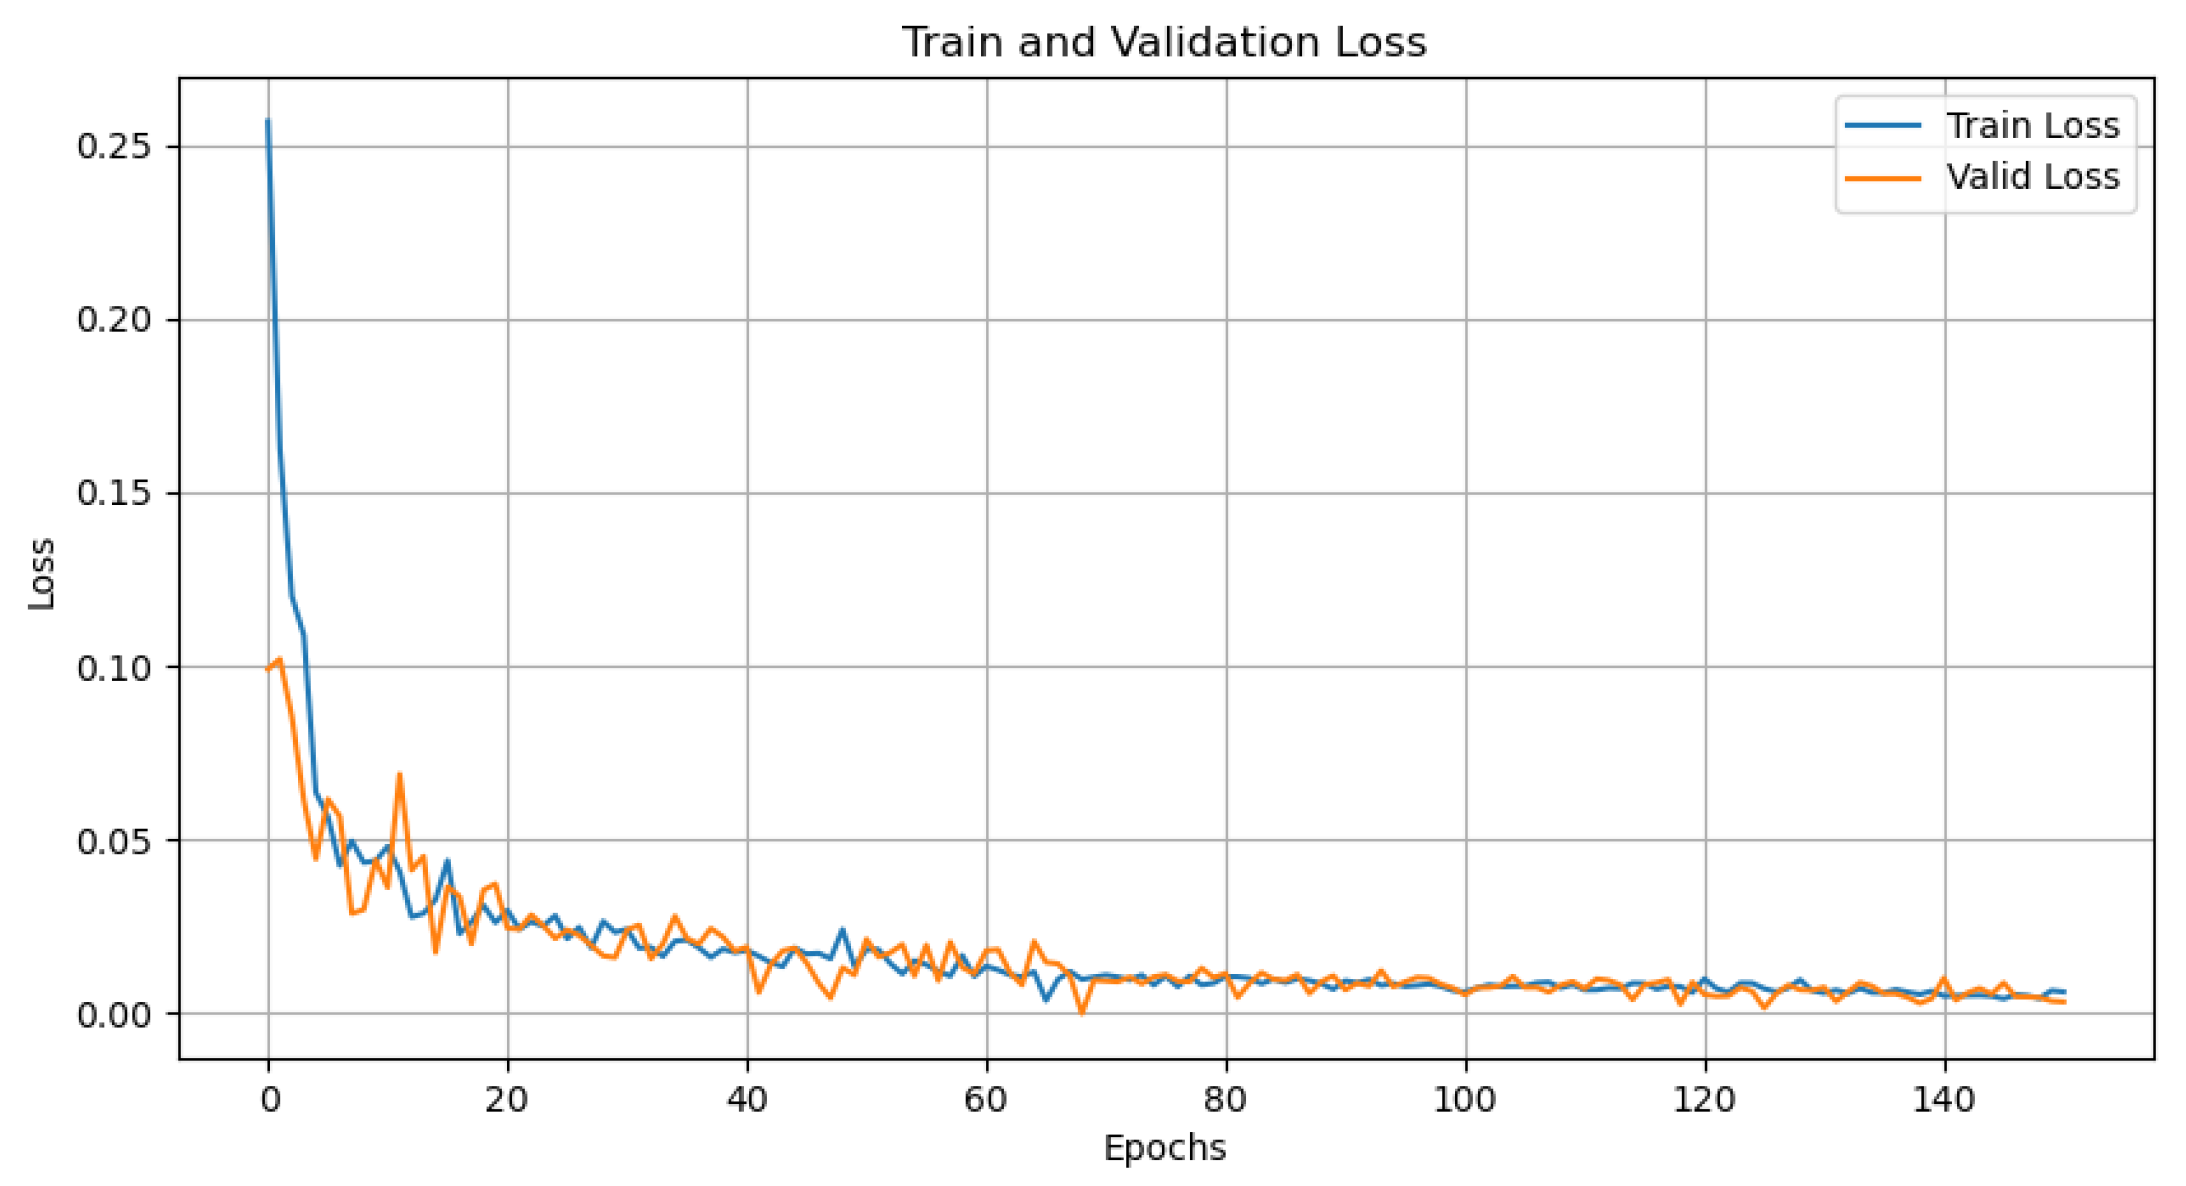
| Environmental Parameter | |
| Ambient Temperature | 20 °C |
| Atmospheric Pressure | 1 atm |
| Air Density | 1.225 kg/m3 |
| Aircraft Parameters | |
| Wingspan | 60.3 m |
| Maximum Landing Weight | 182000 kg |
| Speed | 72 m/s |
| Initial Vortex Circulation | 427 m2/s |
| Vortex Core Radius | 3 m ≈ 0.052 B |
| Initial Vortex Spacing | 47.36 m ≈ B∗Pi/4 |
| Characteristic Speed | 1.436 m/s |
| Characteristic Duration | 33 s |
| Feature | Model | MSE | MAE | RMSE | R² |
| Q Criterion | TCN LSTM TCN-LSTM PA-TLA |
0.239 | 0.086 | 0.149 | 97.891 |
| 0.274 | 0.091 | 0.189 | 97.147 | ||
| 0.205 | 0.073 | 0.134 | 98.712 | ||
| 0.191 | 0.066 | 0.129 | 99.161 | ||
| Vorticity | TCN LSTM TCN-LSTM PA-TLA |
0.109 | 0.123 | 0.331 | 97.163 |
| 0.113 | 0.136 | 0.335 | 96.934 | ||
| 0.085 | 0.096 | 0.267 | 97.934 | ||
| 0.079 | 0.088 | 0.252 | 98.256 | ||
| Circulation | TCN LSTM TCN-LSTM PA-TLA |
12.749 | 2.968 | 4.192 | 96.736 |
| 13.141 | 3.352 | 4.753 | 96.356 | ||
| 10.356 | 2.105 | 3.206 | 97.846 | ||
| 9.682 | 1.956 | 3.075 | 98.158 |
Disclaimer/Publisher’s Note: The statements, opinions and data contained in all publications are solely those of the individual author(s) and contributor(s) and not of MDPI and/or the editor(s). MDPI and/or the editor(s) disclaim responsibility for any injury to people or property resulting from any ideas, methods, instructions or products referred to in the content. |
© 2024 by the authors. Licensee MDPI, Basel, Switzerland. This article is an open access article distributed under the terms and conditions of the Creative Commons Attribution (CC BY) license (http://creativecommons.org/licenses/by/4.0/).


