Preprint
Article

Outer Hair Cell Motor Protein, Prestin, Is Not a Reliable Serological Biomarker for Mouse Cochlear Damage

Altmetrics

Downloads

113

Views

69

Comments

0

A peer-reviewed article of this preprint also exists.

Submitted:

11 May 2024

Posted:

13 May 2024

You are already at the latest version

Alerts
Abstract
The motor protein Prestin found in the outer hair cells (OHCs) of the inner ear is responsible for producing high sensitivity and sharp frequency selectivity for mammalian hearing. Some studies have suggested that Prestin could serve as a serological biomarker for cochlear damage since OHCs are highly vulnerable to damage from various sources of insults. However, the reported data are inconsistent and lack appropriate negative controls. To investigate this further, we measured Prestin quantities in the bloodstream using ELISA kits from different companies. Wildtype (WT) mice were exposed to different ototoxic treatments, including noise exposure and ototoxic reagents that kill OHCs rapidly. Prestin-knockout (KO) mice were used as a negative control. Our data show that some ELISA kits were not able to detect Prestin specifically. The ELISA kit that could detect Prestin protein from cochlear homogenates failed to detect Prestin in the bloodstream despite significant damage to OHCs in cochleae. Furthermore, the optical densities of samples, which correlate to Prestin quantities, were significantly influenced by hemolysis in the samples. In conclusion, Prestin from OHCs is not a sensitive and reliable serological biomarker for detecting cochlear damage in mice.
Keywords: 
Subject: Biology and Life Sciences  -   Biology and Biotechnology

1. Introduction

Hearing loss is an incredibly debilitating, life-altering disorder. Noise, age, and ototoxic drugs such as antibiotics and cancer drugs put stress on the cochlea, leading to hearing loss. According to the World Health Organization (WHO), by 2050, over 700 million people worldwide will be affected by hearing loss [1]. Unfortunately, no effective and reliable method for monitoring and detecting cochlear stress exists. Most importantly, it is impossible to identify cochlear stress before irreversible tissue damage and hearing loss have already occurred. Therefore, exploring the potential of cochlear stress biomarkers is an area of interest for researchers and clinicians. It may provide valuable insights into the pathology of cochlear damage and inform the development of more effective diagnostic and therapeutic interventions.
Mammalian hearing relies on outer hair cells (OHCs) electromotility to achieve high sensitivity and sharp frequency selectivity. In 2000, we identified prestin, a member of the anion transport family called SLC26A5, as the molecular basis for OHC’s electromotility [2]. By changing its conformation between short and extended states, Prestin subserves OHC motility when switching between depolarized and hyperpolarized conditions [3,4,5,6,7,8]. Several lines of evidence showed that the lateral membrane of OHCs is primarily occupied by Prestin. OHCs from prestin-knockout (KO) mice lose their somatic electromotility, resulting in 50 dB hearing loss in prestin-KO mice [9,10,11]. OHCs without Prestin proteins are also 40% shorter than the WT-OHCs [12]. Since OHCs are highly vulnerable to various insults, OHC-specific proteins are considered an excellent choice for revealing biomarkers that are useful in detecting cochlear stress and damage. By using a sandwich enzyme-linked immunosorbent assay (ELISA), Prestin was detected in the bloodstream of humans [13,14,15], rats [16,17], guinea pigs [18,19], and mice [20]. Several reports suggested that Prestin in the bloodstream could be used as a biomarker for hearing loss such as idiopathic sudden sensorineural hearing loss [13,14,15,21,22], noise-induced hearing loss [16,17,23,24,25], sensory hearing loss [26,27,28], age-related hearing loss [29], ototoxic regents induced hearing loss, such as HPβCD [30] and cisplatin [18,19,20,31], and also hearing loss observed in various diseases like Meniere’s Disease and Vestibular Migraine [32], COVID-19 [33], lead poison [34], and even surgical related damage [21]. However, the data reported in several studies lack proper negative controls and show inconsistency [13,14]. Furthermore, Prestin is also reported to be present in the myocardium of hearts [35], raising doubts about whether the Prestin detected in the bloodstream is solely derived from OHCs. To investigate whether Prestin is a serological biomarker for cochlear damage or stress, cochlear homogenates from WT mice and prestin-KO mice [9] were used as positive and negative controls, respectively. These mice were also exposed to various ototoxic stimulations to cause cochlear stress, including noise exposure and ototoxic chemical treatment. HPβCD rapidly kills OHCs [36,37] and releases Prestin into extracellular space. The serums and cochleae from WT and prestin-KO mice were collected at different time points after HPβCD injection or noise exposure. Prestin concentrations in the bloodstream and cochleae were measured using mouse Prestin ELISA kits purchased from three different companies, and cochleae were also used for anatomic analysis. Our collected data suggest that Prestin from OHCs is not a sensitive and reliable serological biomarker for detecting cochlear damage.

2. Results

2.1. Confirm the Positive and Negative Control Samples for Prestin-ELISA: Prestin is Expressed in OHCs from WT but not from Prestin-KO Mice

The prestin-KO mouse model was created by removing the 3–7 exons of prestin, which encode the 245 N-terminal amino acids of Prestin, including the ATG start code. Multiple laboratories, including ours, have studied the prestin-KO mice and confirmed that Prestin is responsible for OHC’s electromotility [9,12]. Prestin has 744 amino acids in total. To ensure that no Prestin fragment was synthesized in OHCs from prestin-KO mice, we performed immunofluorescence using antibodies against both the N- and C-terminal of Prestin. Each anti-Prestin antibody was tested in at least two prestin-KO mice along with cochlear samples from WT mice (WT n = 2, KO n =2). As shown in Figure 1, Prestin was detected in OHCs derived from WT mice, not in OHCs from prestin-KO mice using anti-N-mPrestin. Similar staining patterns were also observed using anti-C-mPrestin (data not shown). The immunofluorescent data, using antibodies against both the N-terminal and C-terminal Prestin, confirmed that Prestin was expressed in WT but not in OHCs from prestin-KO mice. Thus, cochlear homogenates from prestin-KO and WT mice cochleae were used as negative and positive controls to verify Prestin-ELISA kits' specificity.

2.2. Test Sensitivities and Specificity of Different Prestin-ELISA Kits

We purchased three Prestin-ELISA kits from LSBio, Abbexa, and MyBioSource (MBS). All of these kits are sandwich ELISA. As shown in Figure 2A, Prestin is captured and detected by two layers of anti-Prestin antibodies (capture and detection antibody) that bind to different Prestin sites. Sandwich ELISA is known to have higher specificity and sensitivity than original ELISA as it involves using two antibodies with different epitopes. The detection ranges of these three kits are 78-5000 pg/ml for LSbio and Abbexa, and 7.8 pg-500 pg/ml for MBS.
We collect cochleae around P16 (postnatal 16 days) to make cochlear homogenates because prestin-KO starts to lose OHCs around P21 [12]. Equal amounts of cochlear homogenate from WT and prestin-KO WT were used for ELISA. The sample’s optical density (OD450-570), which correlates to Prestin levels, was measured along with different amounts of Prestin proteins used to make a standard curve. If the OD450-570 of samples fell in the detective range, the OD450-570 570 numeric was covered to Prestin concentrations based on standard curves generated along with each measurement. As shown in Figure 2B, the results obtained from these three kits were quite different despite all of them detecting significantly different Prestin levels between WT and prestin-KO homogenates. For the LSBio kit, significant amounts of Prestin proteins were detected in prestin-KO cochlear homogenate samples despite no Prestin being present in prestin-KO samples. The average Prestin concentration for prestin-KO and WT were 681 pg/ml and 1034 pg/ml, respectively. This data suggests that the LSBio kit detects a significant amount of non-specific signals. For the Abbexa kit, all OD450-570 numeric from samples were below the detectable range (78 pg/ml) regardless of whether cochlear homogenates were from WT or prestin-KO mice, suggesting that the Abbexa kit is less sensitive than others. For the MBS kit, OD450-570 of prestin-KO samples were above the lowest limitation (7.8 pg/ml), suggesting non-specific signals detection by the MBS kit similar to that observed in the LSBio kit case. However, OD450-570 of WT samples were over the highest detectable range (500 pg/ml), seven times more than that of prestin-KO samples. Because OD450-570 numeric obtained from Abbexa and MBS kits fell outside the standard curves' detectable range, Prestin quantities were expressed as OD450-570 instead of protein concentrations like that in the LSBio kit case. As shown in Figure 2B, the MBS kit has a better signal-to-non-specific noise ratio than the other two Prestin-ELISA kits. Collectedly, our ELISA data showed the variation performed by different Prestin-ELISA kits in detecting Prestin proteins, indicating the importance of verifying the specificity of Prestin kits.

2.3. Establish an OHC Damage Mouse Model to Test whether Prestin from Cochleae can be Detected in the Bloodstream

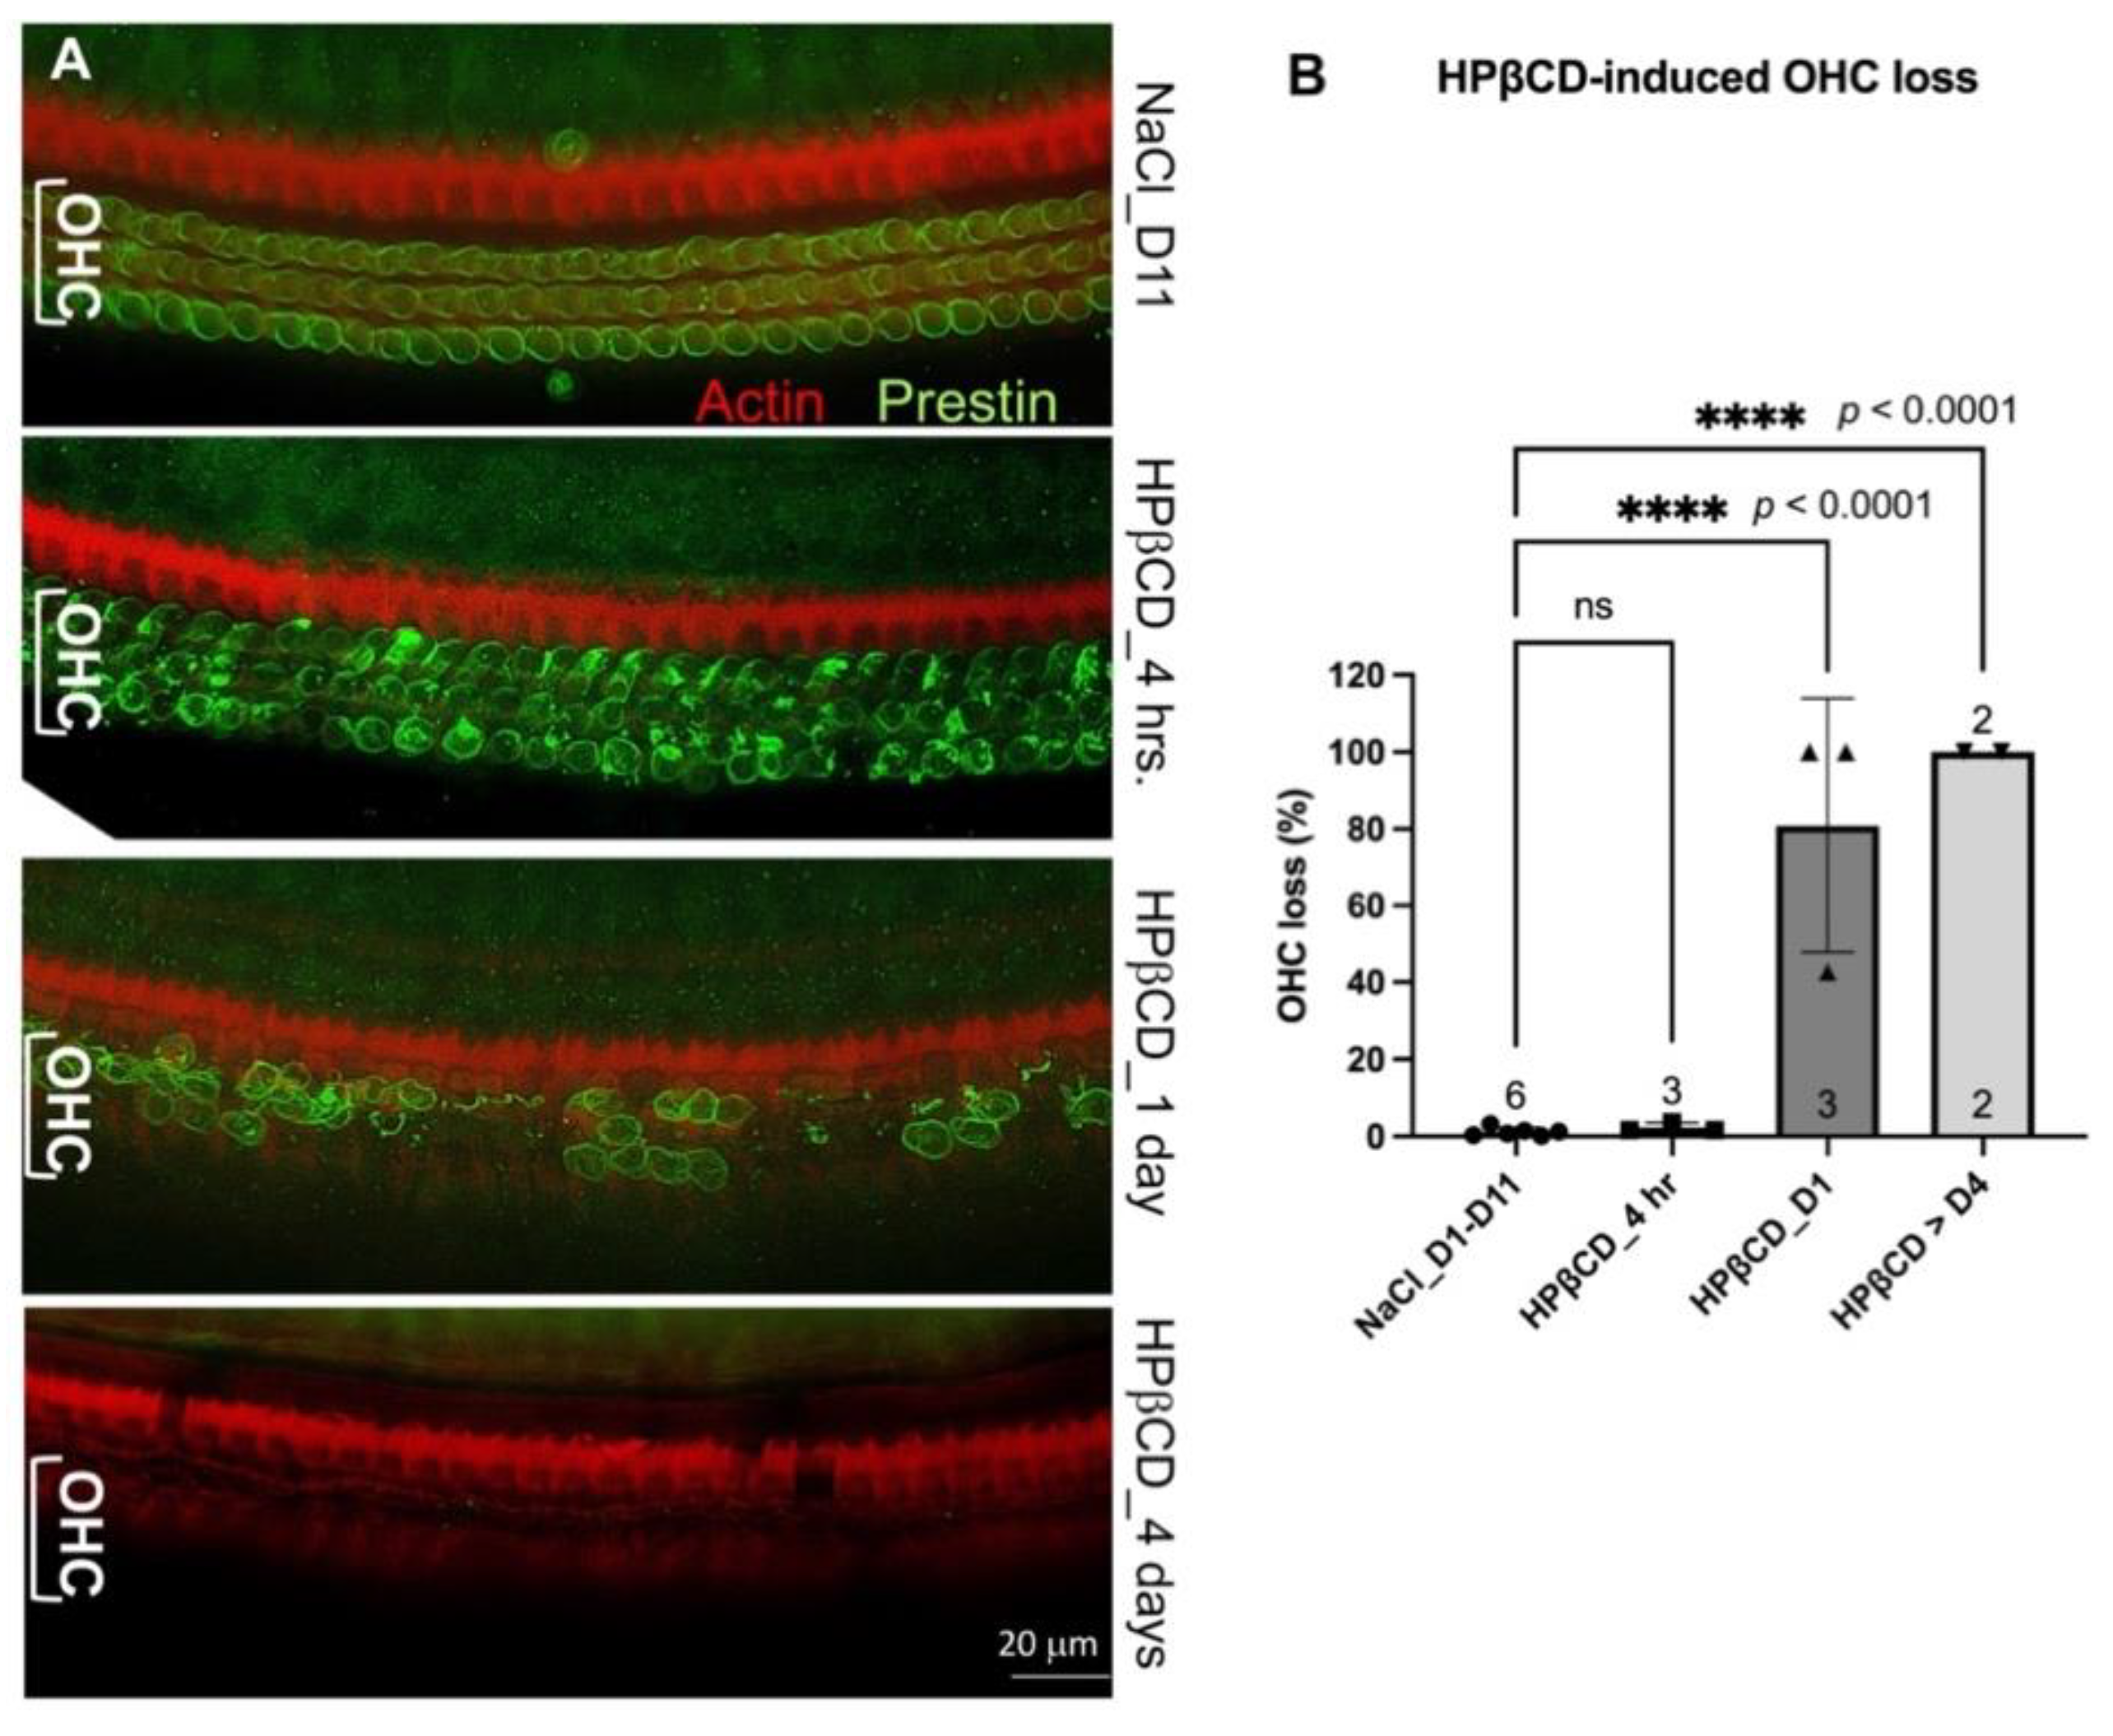
The ability of the Prestin protein to pass the ‘blood-labyrinth barrier’ and ‘leak’ into the vascular system is a crucial aspect of its potential as a serological biomarker for cochlear stress or damage. Prestin, a glycosylated membrane-bound protein with a molecular weight of 81.4 KD, forms dimers or tetramers embedded in the plasma membrane of the OHCs [38]. It remains unknown (1) whether extracellular Prestin proteins released from the OHCs in the cochlea could pass the ‘blood-labyrinth barrier’ and enter the bloodstream, (2) how long these native Prestin proteins from OHCs can present in the bloodstream before they are degraded or excluded from the body. To answer these questions, we injected WT with HPβCD to release Prestin from OHCs. HPβCD is a cholesterol chelator that extracts cholesterol from plasma membranes. Because the plasma membranes of OHCs are enriched with Prestin-bound cholesterol [36], we and others have discovered that HPβCD can rapidly rupture the OHC plasma membrane [36,37,39,40,41]. Thus, WT mice were injected with 8000 mg/kg of HPβCD or an equal amount of 0.9% NaCl solvent, as we described before [36,37]. We collected cochleae from mice that were injected with either HPβCD or control saline within 3-4 hrs (4 hr), one day (D1), four days (D4), seven days (D7), and eleven days (D11), respectively. We performed immunostaining of the full length of the collected cochleae. Because artifacts caused by fixation, dissection, and immunostaining were more severe at the base and apex, we counted the OHC loss in the regions involving segment 3, which corresponds to frequency ranges of 19.1-36.5 kHz [42]. As expected, there was minimal OHC loss in mice injected with 0.9% NaCl, regardless of the time when the cochleae were collected, ranging from D1 to D11 (n = 6) (Figure 3B). As shown in Figure 3, OHCs from 0.9% NaCl-injected mice showed green staining circles with uniform intensity, indicating that Prestin was evenly distributed in the lateral membrane of OHCs. In contrast, within 3-4 hrs of HPβCD injection, OHCs exhibited uneven green circles with aggregate clots in the cytoplasm, indicating OHC deterioration but no significant OHC loss at this stage. As described in our previous study [36,37], significant OHC loss was observed just one day after WT mice were injected with HPβCD (n = 3, p < 0.0001). From day 4, no OHCs were observed in the middle region of OHCs, and some IHC loss was also observed (n = 2, p < 0.0001). These collected data confirm that a single high-dose administration of HPβCD resulted in mass OHC death in WT mice, but OHC loss was not observed in WT control mice treated with saline. Thus, HPβCD-treated mice were used as a model of damaged OHC/cochlea, as there were sufficient ‘released’ Prestin proteins in the cochlea of HPβCD-treated mice ready to pass the ‘blood-labyrinth barrier’ and “leak” into the bloodstream.

2.4. Prestin Levels Show No Undetectable Difference in the Bloodstream of WT and Prestin-KO Mice Regardless of whether OHCs were Stressed or Damaged

To test whether Prestin released from damaged OHCs can be detected in the bloodstream, both WT and prestin-KO mice were injected with HPβCD or control solvent 0.9% NaCl, with prestin-KO mice serving as a negative control for WT. Cochlear samples were collected and immunostained with phalloidin and Myosin 7A, which label inner hair cells (IHCs) and OHCs. NaCl-injected mice have minimal OHC loss, as demonstrated in Figure 3, while WT mice injected with HPβCD exhibited mass OHC loss (Figure 4 A, C), exceeding that in prestin-KO mice injected with HPβCD (Figure 4 B, D). This observation is consistent with our previous data, confirming the Prestin-dependency of OHCs' susceptibility to cholesterol chelator HPβCD [36]. Despite significant OHC loss or damage, Prestin concentrations in the serums from HPβCD-treated WT mice did not differ significantly from prestin-KO mice (no Prestin) or WT mice treated with NaCl control (no OHC loss) or no treatment at all. As shown in Figure 4, the Abbexa kit has lower sensitivity than other kits, and the OD450-570 of all samples was lower than the detective limitation. The average Prestin concentrations, measured by LSBio, for HPβCD-treated WT and prestin-KO, were similar: 2306 pg/ml for WT and 2200 pg/ml for prestin-KO samples, respectively. Since the MBS kit is the best one available, this kit was used to measure Prestin concentrations in the serums collected from different conditions, including no treatment, one day and seven days after NaCl or HPβCD-treated WT and prestin-KO mice. However, no significant difference between WT and prestin-KO mice was found in all conditions regardless of their treatments or the time at which the samples were collected. These data led us to suspect whether Prestin could pass the ‘blood-labyrinth barrier’ and ‘leak’ into the vascular system.
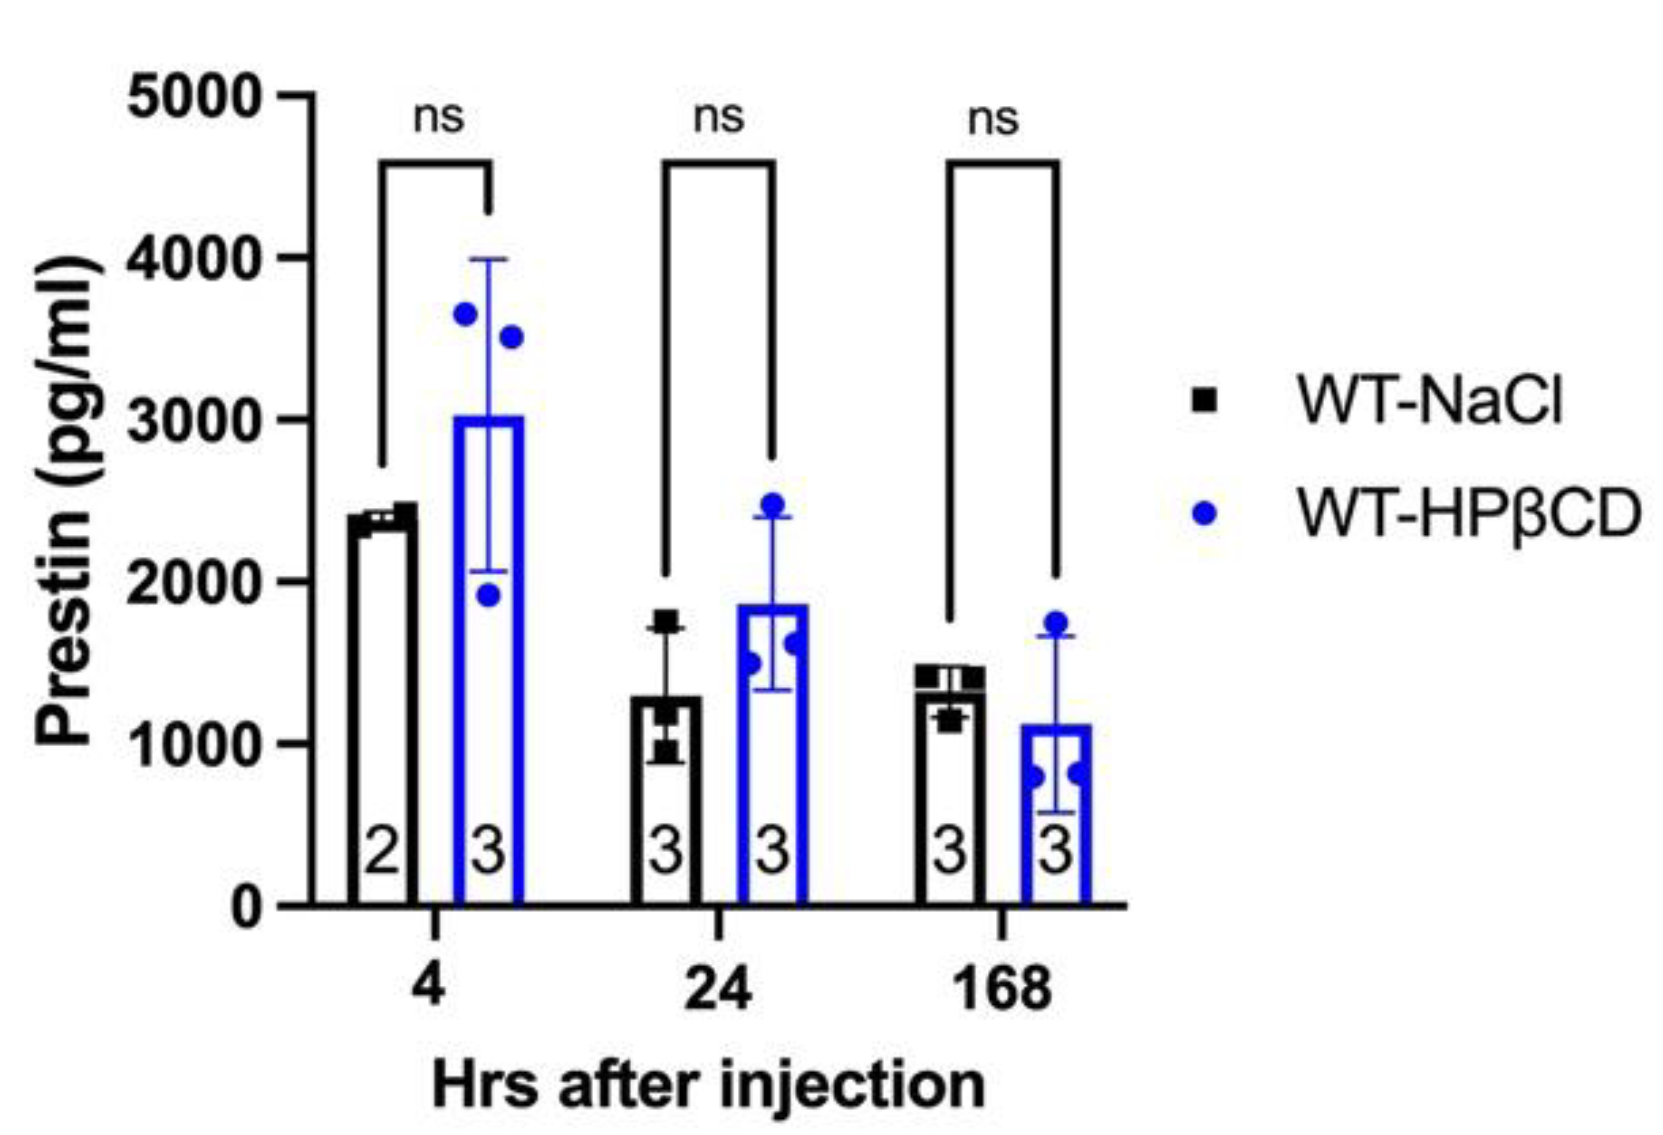
To investigate the possibility of Prestin leakage into the bloodstream and subsequent degradation before ELISA measurement, we followed a rigorous timeline to collect serum samples from WT mice injected with HPβCD: (1) 4 hr group, 3-4 hours after injection when the OHCs were under stress but not yet dead, (2) 24 hrs group, one day after injection when there was a significant loss of OHCs but some were still present, and (3) 168 hrs group, four days after injection when there were no OHCs left. To ensure consistency, littermates were used for HPβCD or NaCl injection in the same group. We measured Prestin concentrations in the serums using the MBS kit, which has the best signal-to-noise ratio (Figure 2). As illustrated in Figure 5, there was no significant difference in Prestin concentrations in the serums regardless of the type or timing of the injection. The levels of Prestin in WT serums did not indicate the levels of OHC stress (HPβCD treated for 3-4 hours), OHC loss (HPβCD treated for 24-168 hours), or unstressed OHC (NaCl-treated) as shown in Figure 3. Collectively, our data showed that Prestin is not a sensitive and reliable serological biomarker for mouse OHC damage.

2.5. The Severities of Hemolysis Influence Prestin Quantification Measured by ELISA

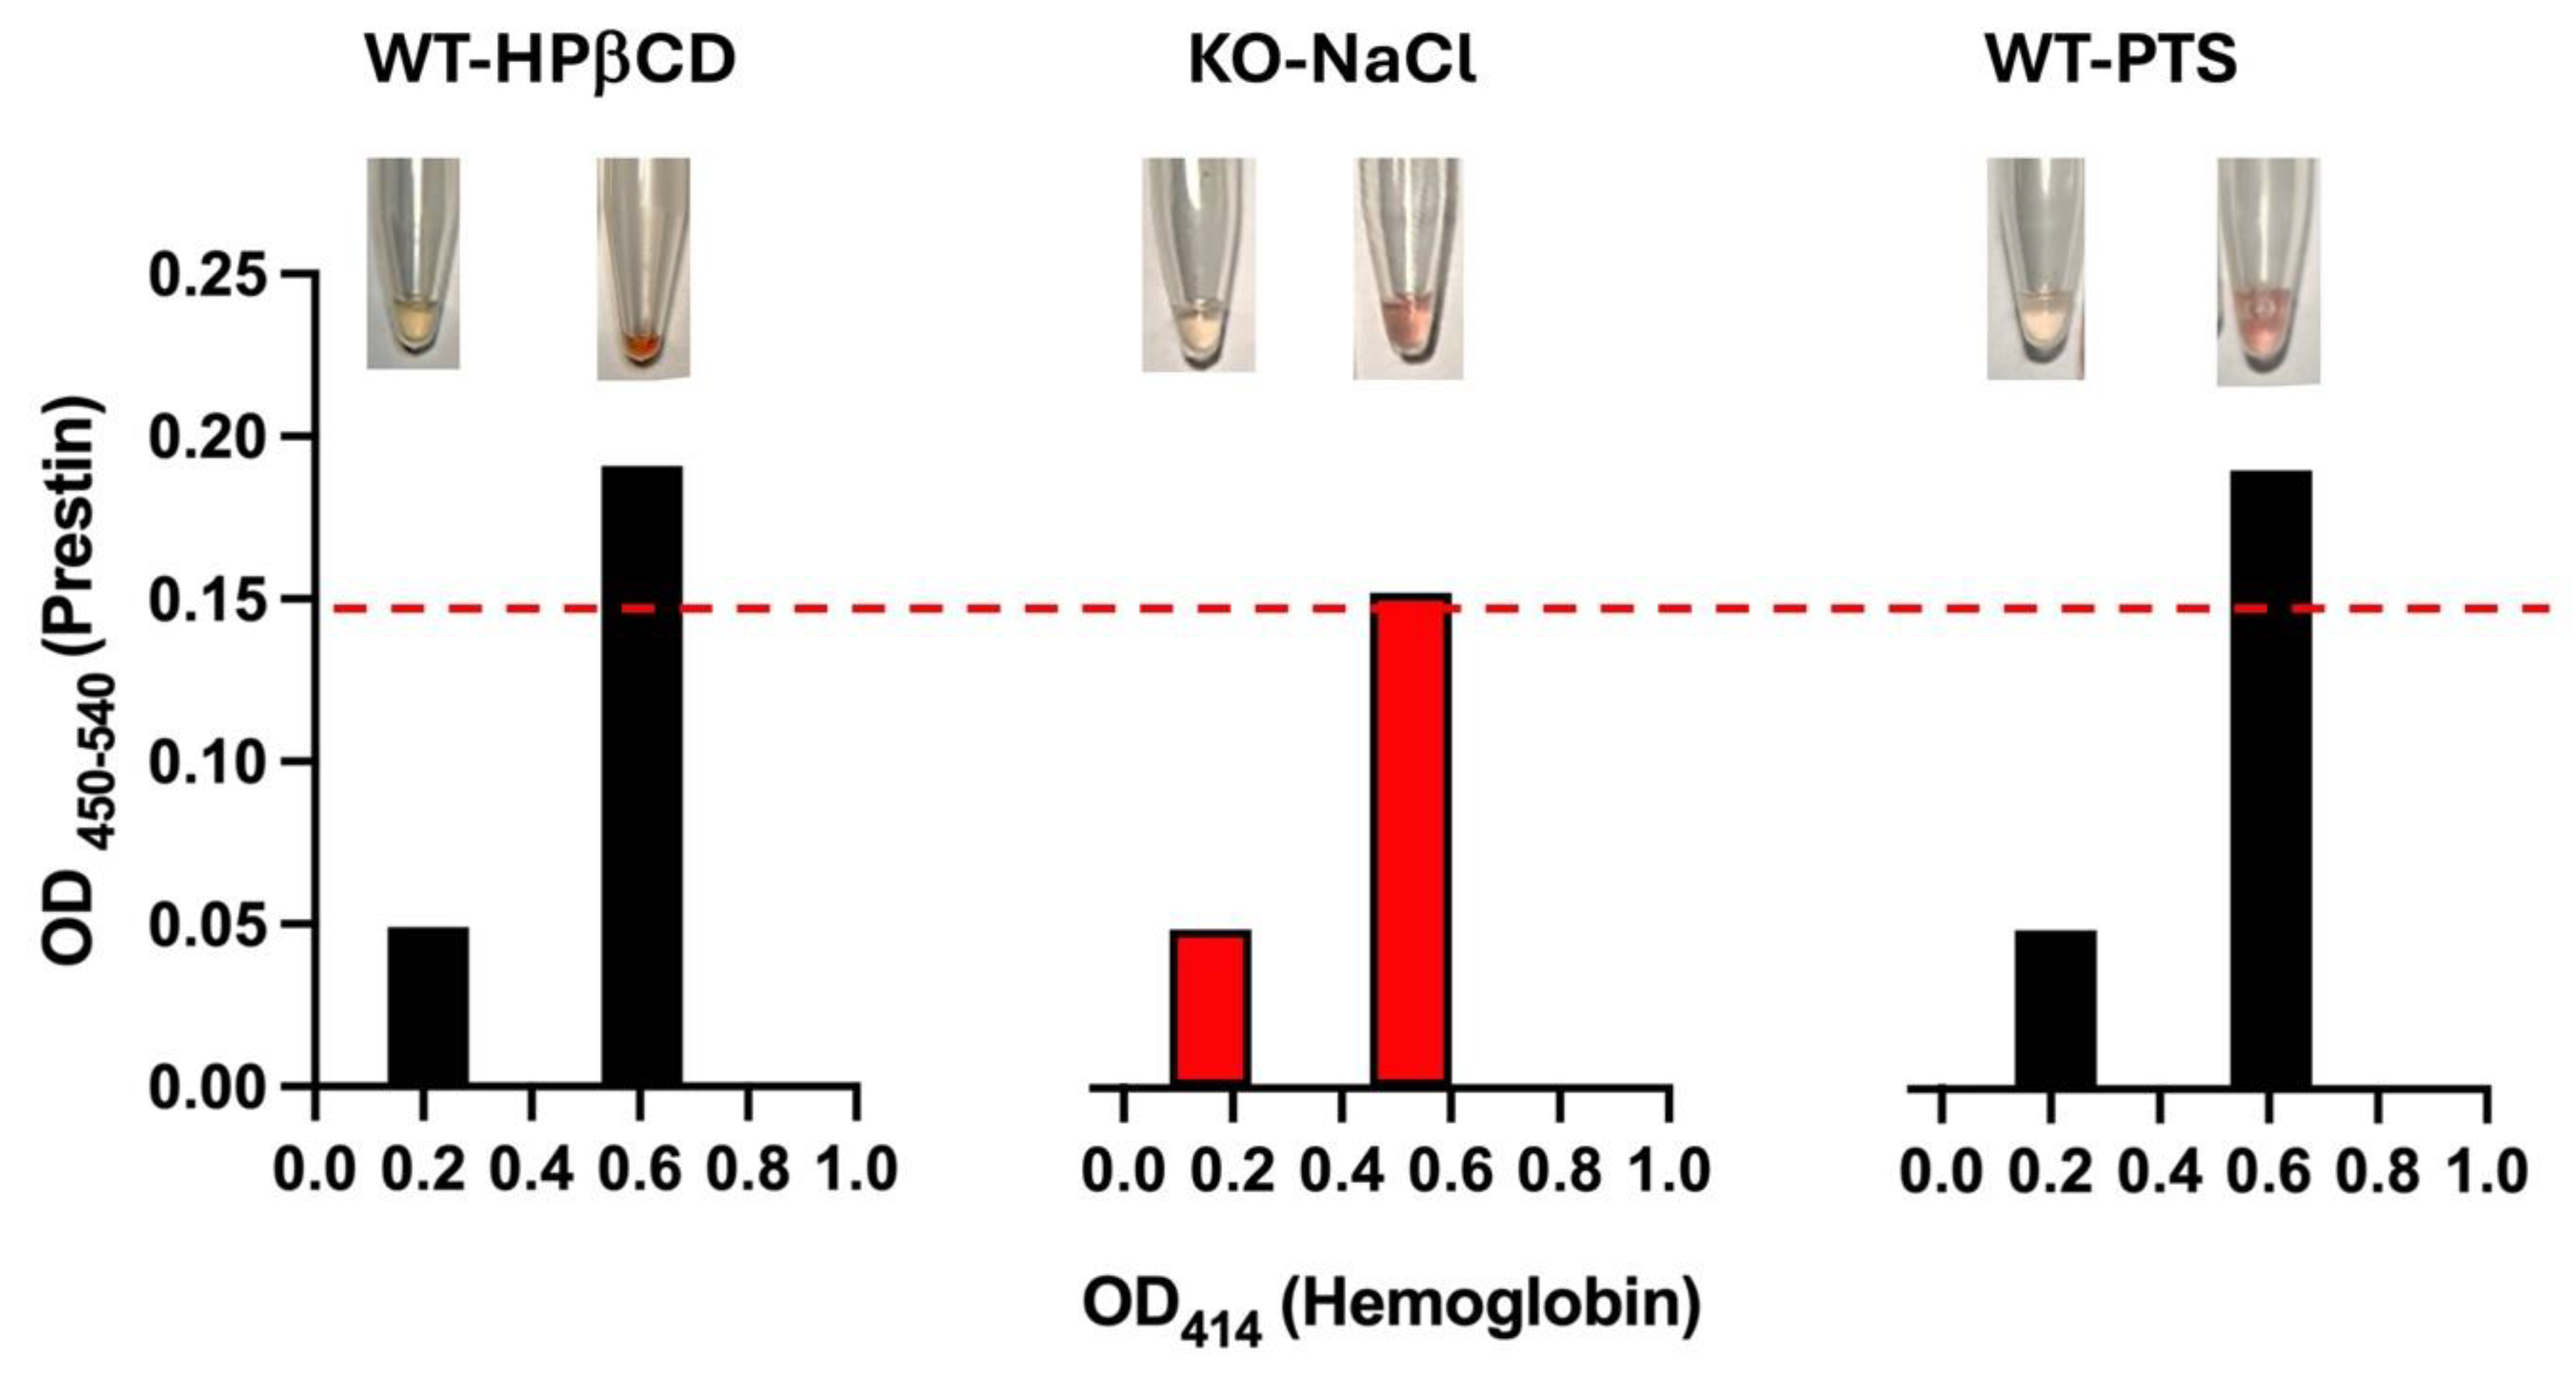
Several studies have shown that Prestin concentrations in the blood of humans, rats, and guinea pigs change significantly after exposure to loud noise [16,17,23,24,25]. In our study, we conducted similar experiments in WT mice. WT mice were exposed to bandlimited (8-16 kHz) noise for 2 hrs at 110 dB SPL, which led to permanent hearing loss (PTS). Serum samples were collected to measure Prestin concentrations using the MBS kit. In contrast to other studies, no significant differences in Prestin concentrations in the serums were found before and after noise exposure (data not shown). However, we discovered that mouse red blood cells were fragile and could easily rupture under physical pressure. To test whether hemolysis may affect ELISA results, we collected two tubes of serums from the same mouse - one with hemolysis and one without. Hemolysis serums were red/pink, and hemoglobin levels measured by absorbance at 414 nm were >0.5. An elevated OD414 is correlated with increased free oxyhemoglobin from hemolysis. Figure 6 showed three examples: WT mice exposed to loud noise, injected with HPβCD, or a negative control mouse, prestin-KO. As shown in Figure 6, serums with hemolysis have 2-3 times more OD readings than those without hemolysis (absorbance at 414 nm was 0.2) despite the fact that two samples were collected from the same animal. In other words, increased hemolysis elevated measured Prestin concentrations even for the negative control serums derived from prestin-KO mouse, suggesting that the Prestin-ELISA can detect non-specific proteins released from red cells unrelated to Prestin. These data indicate that the severities of hemolysis significantly increase the non-specifical binding of Prestin antibodies and influence Prestin concentrations measured by the Prestin-ELISA.

3. Discussion

In this study, we investigated whether OHCs’ motor protein, Prestin, could be used as a serum biomarker for cochlear damage. We addressed this question through a three-step experimental design. First, we confirmed that Prestin is not expressed in OHCs from prestin-KO mice (Figure 1). Therefore, prestin-KO mouse was used as a negative control. Second, we verified the specificity of three Prestin-ELISA kits using cochlear homogenates derived from WT and prestin-KO mice (Figure 2). The specificity and sensitivity vary among these kits. Even the best kit, the MBS kit, has some false positive issues. Finally, we tested whether Prestin could be detected in serums after cochlear stress/damage (Figure 3, Figure 4 and Figure 5). All kits failed to specifically detect Prestin signals in the serum in comparison to serums from prestin-KO mice. Prestin levels in the serum did not significantly change regardless of whether OHCs were under stress, unstressed, or dead. Furthermore, we found that Prestin concentrations measured by these ELISA kits are significantly affected by the quality of the collected serum (Figure 6). Our data analysis leads us to conclude that Prestin is not a sensitive and reliable serological biomarker for mouse OHC damage.
Based on our data, we cannot determine whether Prestin proteins pass the ‘blood-labyrinth barrier’ and ‘leak’ into the vascular system because all Prestin-ELISA kits we tested failed to detect Prestin specifically in the serum samples. The Abbexa kit was unable to detect Prestin at all. Although the other two could detect Prestin in cochlear homogenate, they also detect significant nonspecific signals. The situation worsened when serum samples showed hemolysis. Prestin has 744 aa (81.4 KD) with 14 transmembrane domains. It is buried in the lipid membrane as a dimer or a tetramer, weighing 160 KD or 320 KD. These oligomers are not a minor subject. Whether Prestin can pass the ‘blood-labyrinth barrier’ remains a crucial question for its application as a serological biomarker for cochlear stress.
OHCs are one of the most vulnerable components in the cochlea. Therefore, OHC proteins are considered a good choice as biomarkers for cochlear damage. There are several reasons why Prestin is standard out as the potential biomarker. First, it was believed to be the unique protein only expressed in OHCs before Prestin was found also expressed in the myocardium of hearts in 2021 [35]. Second, Prestin is the most abundant membrane protein of OHCs. In this study, we found that the commercially available mouse Prestin-ELISA kits cannot specifically detect Prestin in mouse serum samples. It is unclear whether Prestin-ELISA kits used for other animals and humans have the same specificity issue. The outstanding question is whether Prestin is a potentially good biomarker for OHC stress/damage if ELISA’s specificity improves. It is generally believed that the Prestin protein turnover rate is rather slow. The Prestin-enriched lateral membrane renders membrane proteins virtually immobile, making it rare, if any, for OHCs to perform endocytosis/exocytosis from the lateral membrane [43]. There are few Prestin particles present in the cytoplasm after P16, as demonstrated by immunogold labeling electron microscopy [44]. Immunostaining for Prestin can only detect Prestin staining in the cytoplasm around the P5-P9 stage, presumably reflecting its production during development. These collected data suggest that Prestin proteins are unlikely to be released into the bloodstream continually due to the proteomic recycling processes as there is little free Prestin present in OHCs cytoplasm to begin with. Based on recent Cryo-EM data, Prestin forms dimers [4,5,6,7,8]. Each OHC is believed to have ~ 107 11-nm particles that are presumable made of Prestin dimers, meaning that each OHC has ~2 × 10⁷ Prestin molecules [45]. There are about 2000 OHCs in each cochlea [46]. Thus, a total of 4 × 10¹⁰ (2000 × 2 × 107) of Prestin molecules, equal to 6.6 × 10⁻¹⁴ mole of Prestin in each cochlea (1 mole has 6.02 × 10²³ molecules). Assuming all Prestin molecules in both cochleae release from OHCs and all of them freely enter the bloodstream without any degradation or exclusion, and an adult mouse has about 2 ml of blood, we then would expect the concentration of Prestin to be 6.6 × 10⁻¹¹ M, which is not even past the detective limitation of the best Prestin-ELISA kit, 7.8 pg/ml, i.e., 9 × 10⁻¹⁰ M (the MW of Prestin is 81.4 KD). Therefore, despite being the most abundant membrane protein in OHCs, Prestin molecules occupy only a minimal fragment in the bloodstream compared to the overall blood volume in animals or humans. Moreover, Prestin is also expressed in cardiomyocytes. It remains to be investigated whether Prestin from OHCs is a reliable and excellent serological biomarker for damaged OHCs.

4. Materials and Methods

4.1. Animal

All experimental procedures were conducted in accordance with the Guide for the Care and Use of Laboratory Animals by the NIH and were approved by Northwestern University’s Institutional Animal Care and Use Committee. Details on the generation and characterization of prestin-KO were described elsewhere [9]. To minimize age-related OHC loss commonly found in mice on the C57BL/6 background, adult WT and prestin-KO mice are on the FVB background, which was generated by backcrossing the original mouse model (129/C57BL/6 background) [9] to the FVB strain for more than ten generations, and are then maintained for several years without refreshing the background. The FVB strain is known to have excellent high-frequency hearing well into adulthood [47]. Genotyping was outsourced to Transnetyx (Cordova, TN). Both males and females were tested in all experiments.

4.2. Cochlear Stress Treatment

HPbCD treatment: HPβCD (Sigma, H107) was dissolved in 0.9% NaCl injection USP (Baxter, Deerfield, IL). HPβCD and vehicle control (0.9% NaCl) solution were passed through a 0.22 mm syringe filter (Millipore) for sterilization before injecting to animals. Each adult WT and prestin-KO mice were injected at a dose of 8000 mg per kg body weight of HPβCD or equivalent vehicle control subcutaneously, as described previously [36,37]. Both male and female mice were used. Cochleae and blood samples were collected at four hours (hrs), one day, or 4-11 days later for immunofluorescence and ELISA.
Noise exposure: Male and female WT mice were exposed to bandlimited (8-16 kHz) noise for 2 hrs at 110 dB SPL (re 20 µPa), which led to permanent hearing loss (PTS) [48]. Serums and cochlear samples were collected 2-4 hrs after noise exposure for immunofluorescence and ELISA.

4.3. Prestin and Hemoglobin Measurement

Serums were collected from clotted blood. Because mouse red blood cells were fragile and easily ruptured under physical pressure that caused hemolysis, we collected free-flow blood from depictured bodies without using any physical pressure or mechanical force. Briefly, after collecting the whole blood from decapitated bodies of euthanized animals, allow the blood to clot by leaving it undisturbed at room temperature for 30 minutes. Blood samples were centrifuged for 15 minutes at 1000g. The samples were stored in a −80 °C refrigerator until the time of assay. Prestin concentration was measured using Mouse Prestin (SLC26A5) ELISA Kit from (1) MyBioSource Inc (MBS, MBS286559, San Diego, California), LSBio (LS-F65693-1, Shirley, MA), Abbexa (abx544297, Sugar Land, TX). All the ELISAs were performed according to each manufacturer's protocol. 20 ml serum samples were mixed with the Sample Diluent provided by the manufacturers and placed in wells of Prestin assay microplates. The microplates were washed by an automatic microplate washer (Agilent BioTek 405 TS). The optical density in the wells of the ELISA microplate was measured at 450 nm and 540 or 570 nm using BioTek Synergy 2. Since hemolysis may influence ELISA data, hemoglobin's absorbance at 414 nm was measured using a spectrophotometer, as reported previously [49].

4.4. Immunofluorescence

Mice were euthanized, and their cochleae were dissected out and fixed with 4% paraformaldehyde. After decalcification using 10% EDTA in PBS for 2-3 days, the tectorial membrane was removed, as we described previously [42]. A full-length cochlear surface preparation was then dissected out in PBS and cut into five pieces at specific locations for immune staining, following the instructions from the video published online by the Massachusetts Eye and Ear Infirmary (https://vimeo.com/144531710). The whole mount samples were blocked at room temperature for one hour in a blocking solution: Tris-buffered saline (TBS) containing 5% goat serum and 0.2% saponin. Samples were incubated with the following primary antibodies at 4 °C overnight: Myosin 7A (1:50, Santa Cruz, sc-74516), N-terminal of mouse Prestin (anti-N-mPrestin) and C-terminal mouse Prestin (anti-C-mPrestin) rabbit antibodies [50,51] (1:1000). The next day, samples were then washed in PBS and incubated with appropriate fluorophore-conjugated secondary antibodies for two hrs at room temperature. The secondary antibodies included goat anti-rabbit Alexa 488 at 1:500 (Thermo Fisher Scientific 32-2700, AB_143165) and goat anti-mouse IgG2b Alexa 647 at 1:500 (Thermo Fisher Scientific AB_143165). Alexa 546-conjugated phalloidin (Thermo Fisher Scientific, A22283) was also used to stain actin as described before [36,37]. Stained cochlear sections were mounted onto slides using Dako fluorescent mounting medium (Agilent). Images were captured on a Keyence BZ-X800 microscope or Nikon A1R confocal microscope with Plan Fluor 10X, Plan Apo 20X, and a Plan Apo 60X oil objective (Nikon) was used. Basilar membrane length was measured using ImageJ, and the numbers of remaining OHCs were determined. A mouse cochlear place-frequency map [52] was used to determine the corresponding frequencies.

4.5. Cochlear Lysate

Cochleae were dissected out of WT and prestin-KO mice separately. The collected cochleae were homogenized using pellet pestles (Konts, 749520-000) in a lysis buffer containing TBS (Tris-Buffered Saline, pH 8.0) containing 2 mM DDM (n-Dodecyl-Beta-Maltoside), 2 mM DTT (Dithiothreitol), 1 mM PMSF (phenylmethylsulfonyl fluoride), 1:50 protease inhibitor mixture (Sigma P8340). The samples were subjected to low-speed centrifugation (800× g for 5 min) to separate the bony structures. The supernatants were then sonicated, incubated on ice for 10 minutes, and centrifuged at 18,000× g for 10 minutes to remove cell fragments. The collected supernatant was stored at -80 °C for ELISA later.

4.6. Statistical Analysis

Statistical analysis s was performed using GraphPad Prism 10 software. ELISA data were presented as the mean ± SD (standard deviations), and statistical analyses were performed using ordinary one-way ANOVA, followed by Tukey’s multiple parisons test or unpaired Student’s t-test (two tails). p < 0.05 was considered to be statistically significant. The coefficient of variation (CV%) is the standard deviation divided by the mean (CV% = SD/mean). Sample data with intra-plate variation coefficients larger than 15% were unacceptable for analysis.

5. Conclusion

Prestin concentrations measured by ELISA kits are significantly affected by the quality of the collected serum. Prestin from OHCs is not a sensitive and reliable serological biomarker for detecting mouse cochlear damage.

Author Contributions

J.Z. designed and performed some of the experiments and analyzed the data. Y.Z. and R.J.F performed some of the experiments. X.T. helped to design some of the experiments. J.Z. wrote the manuscript with input from all other authors.

Funding

This work was supported by the Hugh Knowles Leadership Fund Award, R56DC020542, and HT94252310730 to JZ, and NIH R01DC019434-01 to XT. Imaging was conducted at the Northwestern University Center for Advanced Microscopy, which is supported by NCI CCSG P30 CA060553 and NIH 1S10OD016342-01.

Data Availability Statement

All data, including the original images, will be made available upon request to the corresponding author.

Acknowledgments

We thank Drs. Homma and Takahashi of Northwestern University for providing prestin-KO mice, and Drs. Simmons and Yang of Baylor University for providing blood samples.

Conflicts of Interest

No conflicts of interest for all authors.

References

  1. World Health Organization. World report on hearing: executive summary; World Health Organization: Geneva, 2021. [Google Scholar]
  2. Zheng, J.; et al. Prestin is the motor protein of cochlear outer hair cells. Nature 2000, 405, 149–155. [Google Scholar] [CrossRef] [PubMed]
  3. Dallos, P.; et al. Prestin-based outer hair cell motility is necessary for mammalian cochlear amplification. Neuron 2008, 58, 333–339. [Google Scholar] [CrossRef] [PubMed]
  4. Ge, J.; et al. Molecular mechanism of prestin electromotive signal amplification. Cell 2021, 184, 4669–4679.e13. [Google Scholar] [CrossRef] [PubMed]
  5. Butan, C.; et al. Single particle cryo-EM structure of the outer hair cell motor protein prestin. bioRxiv 2021. [Google Scholar] [CrossRef]
  6. Bavi, N.; et al. Cryo-EM Structures of Prestin and the Molecular Basis of Outer Hair Cell Electromotility. bioRxiv 2021. [Google Scholar] [CrossRef]
  7. Futamata, H.; et al. Cryo-EM structures of thermostabilized prestin provide mechanistic insights underlying outer hair cell electromotility. Nature Communications 2022, 13, 6208. [Google Scholar] [CrossRef] [PubMed]
  8. Kuwabara, M.F.; et al. Elevator-like movements of prestin mediate outer hair cell electromotility. Nature Communications 2023, 14, 7145. [Google Scholar] [CrossRef] [PubMed]
  9. Liberman, M.C.; et al. Prestin is required for electromotility of the outer hair cell and for the cochlear amplifier. Nature 2002, 419, 300–304. [Google Scholar] [CrossRef] [PubMed]
  10. Cheatham, M.A.; et al. Cochlear function in Prestin knockout mice. J Physiol 2004, 560 Pt 3, 821–830. [Google Scholar] [CrossRef] [PubMed]
  11. Cheatham, M.A.; et al. Evaluation of an independent prestin mouse model derived from the 129S1 strain. Audiology and Neuro-Otology 2007, 12, 378–390. [Google Scholar] [CrossRef] [PubMed]
  12. Cheatham, M.A.; et al. Prestin-Dependence of Outer Hair Cell Survival and Partial Rescue of Outer Hair Cell Loss in Prestin(V499G/Y501H) Knockin Mice. Plos One 2015, 10. [Google Scholar] [CrossRef]
  13. Sun, C.; et al. A Preliminary Report on the Investigation of Prestin as a Biomarker for Idiopathic Sudden Sensorineural Hearing Loss. Ear, Nose & Throat Journal 2020, 99, 528–531. [Google Scholar] [CrossRef]
  14. Tovi, H.; et al. Prestin autoantibodies screening in idiopathic sudden sensorineural hearing loss. Eur Ann Otorhinolaryngol Head Neck Dis 2019, 136, 99–101. [Google Scholar] [CrossRef] [PubMed]
  15. Saadat, F.; Jalali, M.M.; Akbari, M. Assessment of prestin level changes as an inner-ear biomarker in patients with idiopathic sudden sensorineural hearing loss. J Laryngol Otol 2022, 136, 1039–1043. [Google Scholar] [CrossRef] [PubMed]
  16. Parham, K.; Dyhrfjeld-Johnsen, J. Outer Hair Cell Molecular Protein, Prestin, as a Serum Biomarker for Hearing Loss: Proof of Concept. Otol Neurotol 2016, 37, 1217–1222. [Google Scholar] [CrossRef]
  17. Parham, K.; et al. Noise-induced trauma produces a temporal pattern of change in blood levels of the outer hair cell biomarker prestin. Hear Res 2019, 371, 98–104. [Google Scholar] [CrossRef] [PubMed]
  18. Naples, J.; et al. Prestin as an Otologic Biomarker of Cisplatin Ototoxicity in a Guinea Pig Model. Otolaryngol Head Neck Surg 2018, 158, 541–546. [Google Scholar] [CrossRef]
  19. Liba, B.; et al. Changes in Serum Prestin Concentration After Exposure to Cisplatin. Otol Neurotol 2017, 38, e501–e505. [Google Scholar] [CrossRef] [PubMed]
  20. Generotti, C.; et al. Subclinical diagnosis of cisplatin-induced ototoxicity with biomarkers. Scientific Reports 2022, 12, 18032. [Google Scholar] [CrossRef]
  21. Yilmazer, A.B.; et al. Evaluation of inner ear damage by mastoid drilling with measurement of serum prestin (SLC26A5) levels. Brazilian Journal of Otorhinolaryngology 2023, 101380. [Google Scholar] [CrossRef]
  22. Santosa, A.; et al. Potential diagnostic biomarkers for early detection of idiopathic sensorineural hearing loss in type 2 diabetes mellitus patients. Indonesia Journal of Biomedical Science 2022, 16, 37–42. [Google Scholar] [CrossRef]
  23. Parker, A.; Parham, K.; Skoe, E. Noise exposure levels predict blood levels of the inner ear protein prestin. Sci Rep 2022, 12, 1154. [Google Scholar] [CrossRef]
  24. Parker, A.; Parham, K.; Skoe, E. Reliability of Serological Prestin Levels in Humans and its Relation to Otoacoustic Emissions, a Functional Measure of Outer Hair Cells. Ear Hear 2021, 42, 1151–1162. [Google Scholar] [CrossRef] [PubMed]
  25. Gonzalez-Gonzalez, S.; Cazevieille, C. N-Acetylcysteine Treatment Reduces Noise-Induced Hearing Loss in Guinea Pig. Journal of Community and Preventive Medicine 2020, 3, 1. [Google Scholar] [CrossRef]
  26. Emre, S.; et al. Can prestin level be a biomarker for determining sensorineural hearing loss? Auris Nasus Larynx 2022, 49, 368–373. [Google Scholar] [CrossRef] [PubMed]
  27. Asli, R.H.; et al. Evaluation of the relationship between prestin serum biomarker and sensorineural hearing loss: a case-control study. Eur Arch Otorhinolaryngol 2023, 280, 1147–1153. [Google Scholar] [CrossRef] [PubMed]
  28. Solis-Angeles, S.; et al. Prestin and otolin-1 proteins in the hearing loss of adults chronically exposed to lead. Toxicology and Applied Pharmacology 2021, 426, 115651. [Google Scholar] [CrossRef] [PubMed]
  29. Parker, A.; Parham, K.; Skoe, E. Age-related declines to serum prestin levels in humans. Hear Res 2022, 426, 108640. [Google Scholar] [CrossRef] [PubMed]
  30. Harrison, M.S.; et al. Automated Western Blot Analysis of Ototoxin-Induced Prestin Burst in the Blood after Cyclodextrin Exposure. Otology & Neurotology 2023, 44. [Google Scholar] [CrossRef]
  31. Jalali, M.M.; Saedi, H.S.; Saadat, F. Effect of cisplatin chemotherapy on the inner ear function and serum prestin concentration. European Archives of Oto-Rhino-Laryngology 2022, 279, 2783–2789. [Google Scholar] [CrossRef] [PubMed]
  32. Naples, J.G.; et al. Evaluating the Role of Otologic Biomarkers to Differentiate Meniere’s Disease and Vestibular Migraine. Ear and Hearing 2022, 43. [Google Scholar] [CrossRef]
  33. Turan, M.; et al. Blood prestin levels in COVID-19 patients. Journal of the Chinese Medical Association 2023, 86, 571–576. [Google Scholar] [CrossRef]
  34. SOLIS-ANGELES, S.; et al. Evaluation of serum prestin as a new potential biomarker for hearing damage due to lead exposure in population from Tlaxcala, Mexico. ISEE Conference Abstracts 2020 2020. [Google Scholar] [CrossRef]
  35. Zhang, X.D.; et al. Prestin amplifies cardiac motor functions. Cell Rep 2021, 35, 109097. [Google Scholar] [CrossRef] [PubMed]
  36. Takahashi, S.; et al. Susceptibility of outer hair cells to cholesterol chelator 2-hydroxypropyl-beta-cyclodextrine is prestin-dependent. Scientific Reports 2016, 6. [Google Scholar] [CrossRef] [PubMed]
  37. Zhou, Y.; et al. The susceptibility of cochlear outer hair cells to cyclodextrin is not related to their electromotile activity. Acta Neuropathologica Communications 2018, 6, 98. [Google Scholar] [CrossRef] [PubMed]
  38. Zheng, J.; et al. Analysis of the oligomeric structure of the motor protein prestin. Journal of Biological Chemistry 2006, 281, 19916–19924. [Google Scholar] [CrossRef] [PubMed]
  39. Crumling, M.A.; et al. Hearing loss and hair cell death in mice given the cholesterol-chelating agent hydroxypropyl-beta-cyclodextrin. PLoS One 2012, 7, e53280. [Google Scholar] [CrossRef] [PubMed]
  40. King, K.; Zalewski, C.; Farhat, N.; Keener, L.A.; Hoa, M.; Bianconi, S.; Porter, F.D.; Brewer, C.C. HPβCD Therapy in Humans with NPC1 Disease: Audiological Outcomes. Abstract of 38th Meeting of the Assoc. Res. Otolaryngol. Baltimore, Maryland, 2015.
  41. Cronin, S.; et al. Hearing Loss and Otopathology Following Systemic and Intracerebroventricular Delivery of 2-Hydroxypropyl-Beta-Cyclodextrin. J Assoc Res Otolaryngol 2015, 16, 599–611. [Google Scholar] [CrossRef] [PubMed]
  42. Tan, X.; et al. Systemic application of honokiol prevents cisplatin ototoxicity without compromising its antitumor effect. American journal of cancer research 2020, 10, 4416–4434. [Google Scholar]
  43. Yamashita, T.; et al. Outer Hair Cell Lateral Wall Structure Constrains the Mobility of Plasma Membrane Proteins. PLoS Genet 2015, 11, e1005500. [Google Scholar] [CrossRef] [PubMed]
  44. Mahendrasingam, S.; et al. The ultrastructural distribution of prestin in outer hair cells: a post-embedding immunogold investigation of low-frequency and high-frequency regions of the rat cochlea. European Journal of Neuroscience 2010, 31, 1595–1605. [Google Scholar] [CrossRef]
  45. Ashmore, J. Biophysics of the cochlea - biomechanics and ion channelopathies. Br Med Bull 2002, 63, 59–72. [Google Scholar] [CrossRef]
  46. Ehret, G.; Frankenreiter, M. Quantitative analysis of cochlear structures in the house mouse in relation to mechanisms of acoustical information processing. Journal of comparative physiology 1977, 122, 65–85. [Google Scholar] [CrossRef]
  47. Zheng, Q.Y.; Johnson, K.R.; Erway, L.C. Assessment of hearing in 80 inbred strains of mice by ABR threshold analyses. Hear Res 1999, 130, 94–107. [Google Scholar] [CrossRef] [PubMed]
  48. Dépreux, F.; et al. Statins protect mice from high-decibel noise-induced hearing loss. Biomedicine & Pharmacotherapy 2023, 163, 114674. [Google Scholar] [CrossRef]
  49. Kirschner, M.B.; et al. Haemolysis during Sample Preparation Alters microRNA Content of Plasma. PLOS ONE 2011, 6, e24145. [Google Scholar] [CrossRef] [PubMed]
  50. Zheng, J.; et al. The C-terminus of prestin influences nonlinear capacitance and plasma membrane targeting. J Cell Sci 2005, 118 Pt 13, 2987–2996. [Google Scholar] [CrossRef] [PubMed]
  51. Matsuda, K.; et al. N-linked glycosylation sites of the motor protein prestin: effects on membrane targeting and electrophysiological function. J Neurochem 2004, 89, 928–938. [Google Scholar] [CrossRef]
  52. Muller, M.; et al. A physiological place-frequency map of the cochlea in the CBA/J mouse. Hear Res 2005, 202, 63–73. [Google Scholar] [CrossRef]
Figure 1. Representative confocal images show Prestin expression patterns in whole-mount preparation of WT (A, C) and prestin-KO (B, D) cochleae. Antibodies include anti-N-mPrestin (green) and anti-Myosin 7A (red). C and D are enlarged images of the boxed regions in A-B, showing OHCs in both samples. A'-D' and A"-D" were individual channels for Prestin and Myosin 7A staining. Bar: A-B: 100 mm, C-D: 20 mm.
Preprints 106284 g001
Figure 2. A. The principle of a Sandwich ELISA. B. Prestin levels in cochlear homogenates of WT and prestin-KO mice were measured by three Prestin-ELISA kits. The LSBio kit detected Prestin in both WT and prestin-KO cochlear homogenates. The average Prestin concentration: prestin-KO samples, 681 pg/ml; WT samples: 1034 pg/ml. The Abbexa kit was not sensitive enough to detect Prestin because their OD450-570 numeric for both WT and prestin-KO samples were below the detectable range, indicated by a red dashed line (78 pg/ml). OD450-570, measured by the MBS kit, has the biggest difference between WT and prestin-KO samples. Two red dashed lines indicate the detectable range for the MBS kit: 7.8 - 500 pg/ml. The numbers of samples, p, and means ± SD are shown.
Preprints 106284 g002
Figure 3. A. Representative immunostaining images showing OHC loss in WT mice treated with HPβCD at different time points. Anti-N-mPrestin (green) and phalloidin (red) were used to stain samples. B. A histogram showing the average OHC loss in the middle turns of WT cochleae (frequency range: 19.1-36.5 kHz). The numbers of samples and means ± SD are shown. D: day. hr: hour. Bar: 20 mm.****: p < 0.0001, ns: not significant.
Preprints 106284 g003
Figure 4. A-D. Representative confocal images show OHC loss in mice one day later after HPβCD injection. OHC loss in WT apical region (A, C) exceeds that in prestin-KO mice (B, D). Anti-Myosin 7A (green) and phalloidin (red) were used to stain IHCs and OHCs. C and D are enlarged images of the boxed regions in A-B, showing OHCs in both samples. A'-D' and A"-D" were individual channels for actin and Myosin 7A staining. Bar: A-B: 100 mm, C-D: 20 mm. E-G. Prestin levels were measured by three Prestin-ELISA kits. WT and prestin-KO mice were injected with either HPβCD, NaCl, or no injection at all (no treatment). Serum samples were collected 1 day or 7 days later for ELSIA using the LSBio kit (E), the Abbexa kit (F), and the MBS kit (G). The red dashed line shows the detectable limit for the Abbexa kit (78 pg/ml). The numbers of samples and means ± SD are shown. ns: not significant.
Preprints 106284 g004
Figure 5. Prestin levels in serum samples of WT injected with HPβCD or 0.9%NaCl. The serums were collected at different time points after WT mice were injected with HPβCD or 0.9%NaCl. Prestin concentrations were measured using a mouse Prestin-ELISA kit made by MBS. The number of samples and the means ± SD are shown. ns: not significant.
Preprints 106284 g005
Figure 6. Prestin concentrations measured by the Prestin-ELISA kit made by MBS are significantly altered by hemolysis. Hemolysis was determined by visual inspection (see pictures on the top) and absorbance at 414 nm (below). WT and prestin-KO mice were treated with HPβCD, NaCl, or noise (PTS). Two serum samples from each mouse – one with low and another one with high hemoglobin. Even though these two serum samples were collected from the same mouse, Prestin concentrations were only detected in the samples with high hemoglobin but not in the ones with low hemoglobin. The red dashed line shows the detectable limit for the MBS kit (7.8 pg/ml).
Preprints 106284 g006
Disclaimer/Publisher’s Note: The statements, opinions and data contained in all publications are solely those of the individual author(s) and contributor(s) and not of MDPI and/or the editor(s). MDPI and/or the editor(s) disclaim responsibility for any injury to people or property resulting from any ideas, methods, instructions or products referred to in the content.
Copyright: This open access article is published under a Creative Commons CC BY 4.0 license, which permit the free download, distribution, and reuse, provided that the author and preprint are cited in any reuse.
Prerpints.org logo

Preprints.org is a free preprint server supported by MDPI in Basel, Switzerland.

Subscribe

© 2024 MDPI (Basel, Switzerland) unless otherwise stated