Submitted:
13 May 2024
Posted:
13 May 2024
You are already at the latest version
Abstract
Keywords:
1. Introduction
- Employ resizing techniques to TFRs to improve sorting performance.
- Use of Boruta feature selector to narrow down the features to the most important ones.
- Perform nested cross validation (nCV) approach that combines cross-validation with an additional model selection process.
- Comparison of the classification performance of machine learning algorithms such as Decision Trees (DTs), K-Nearest Neighbors (KNN), Random Forest (RF) and Suport Vector Machine (SVM).
2. Materials and Methods
2.1. Dataset
2.2. Proposed Methodology
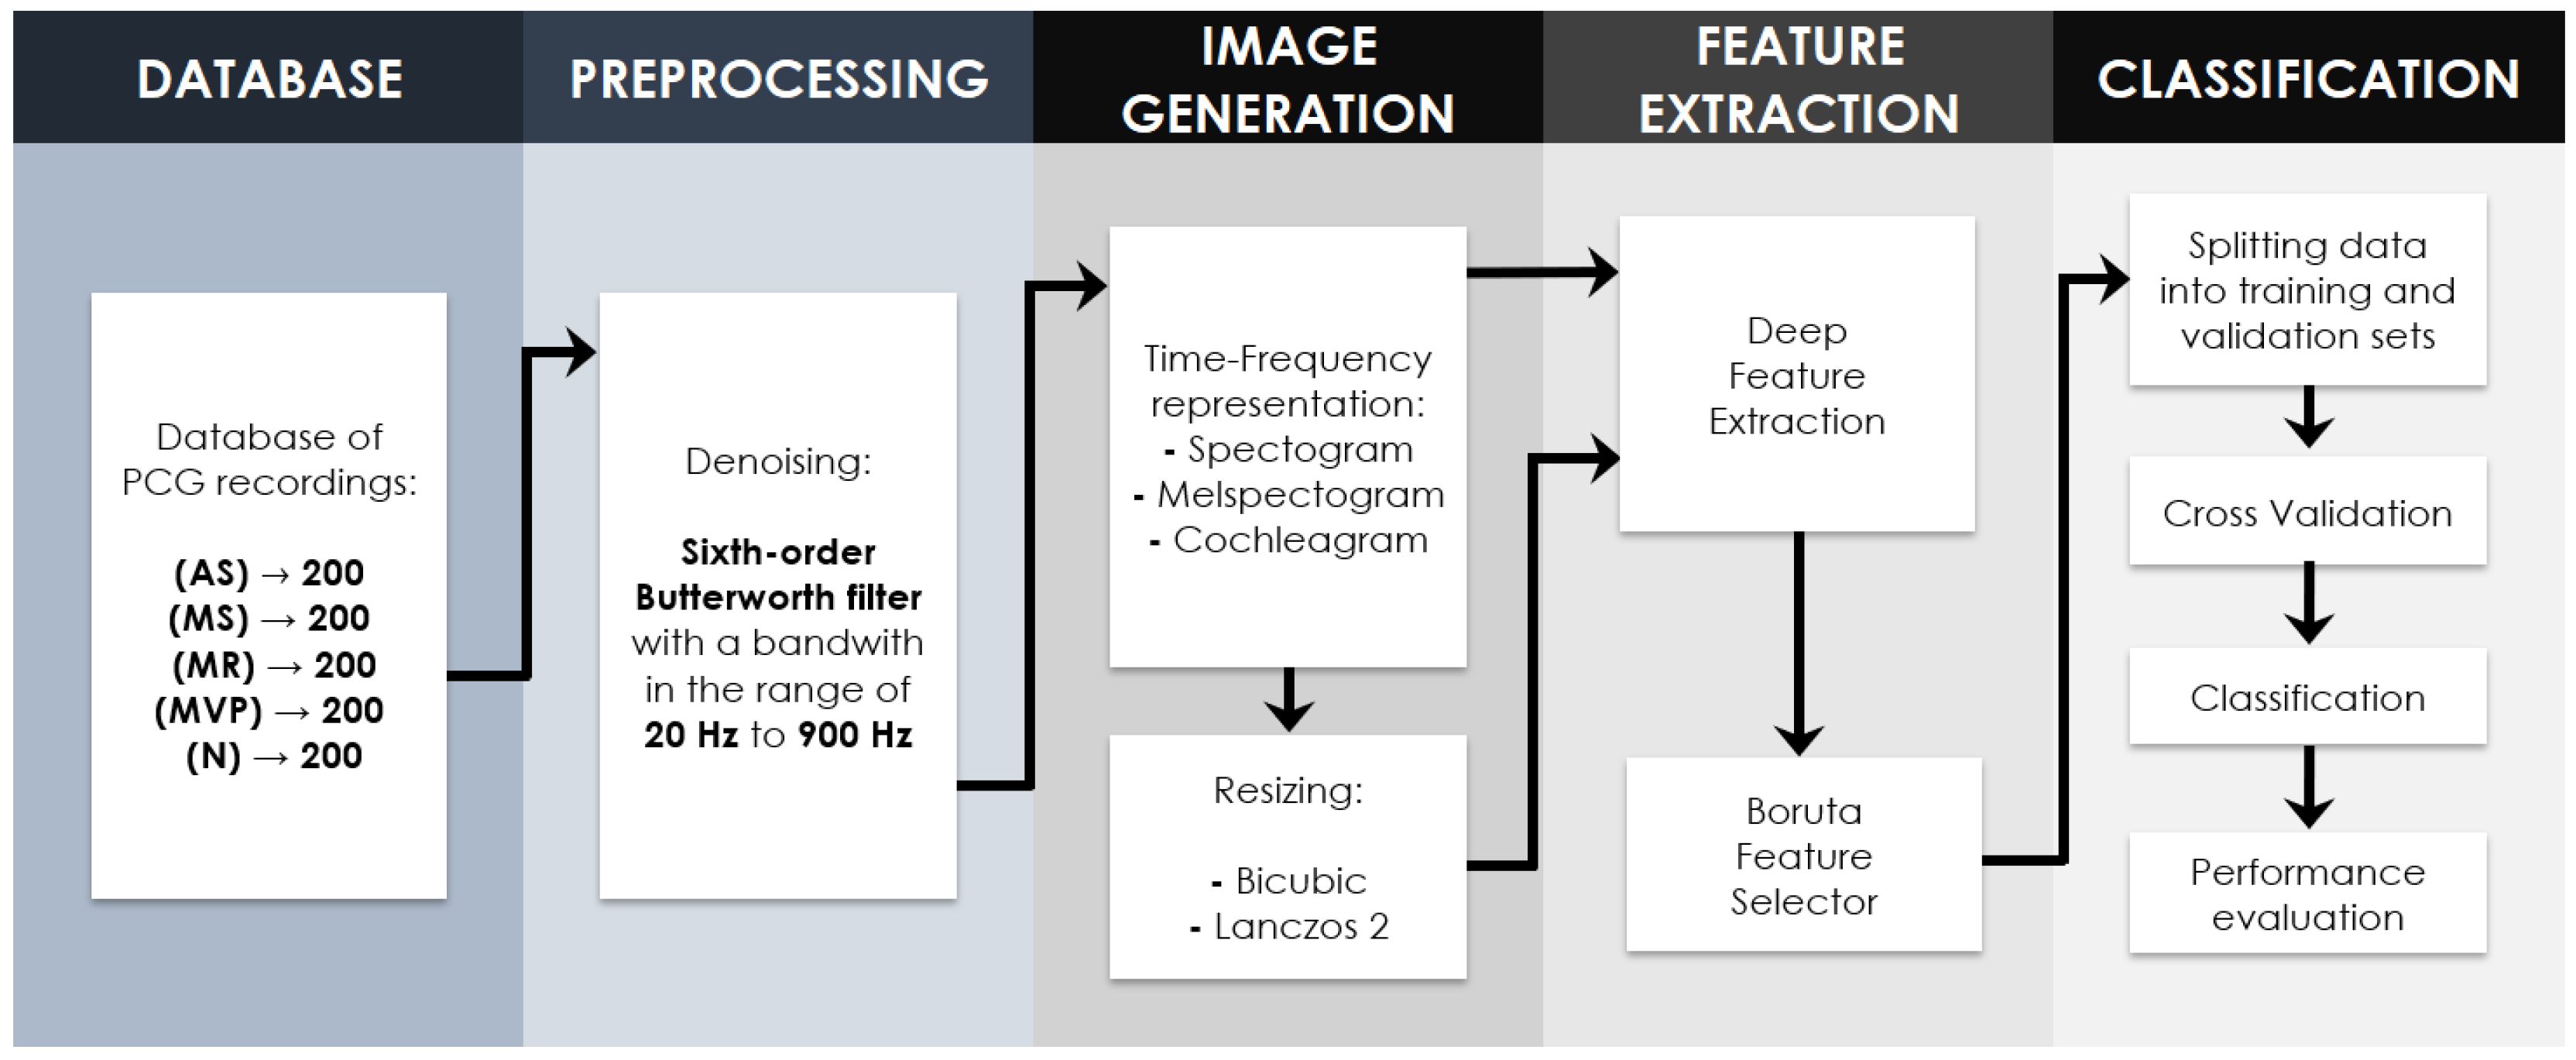
2.2.1. Signal Preprocessing
2.3. Time-Frequency Representations
2.3.1. Spectrogram
2.3.2. Mel-Spectogram
2.3.3. Cochleagram
2.4. Resizing Image Techniques
2.4.1. Bicubic
2.4.2. Lanczos
2.4.3. Deep Feature Extraction
2.4.4. Boruta Feature Selection Algorithm
2.4.5. Nested Cross Validation
2.4.6. Classifiers
2.4.7. Perfomance Evaluation Metrics
3. Results
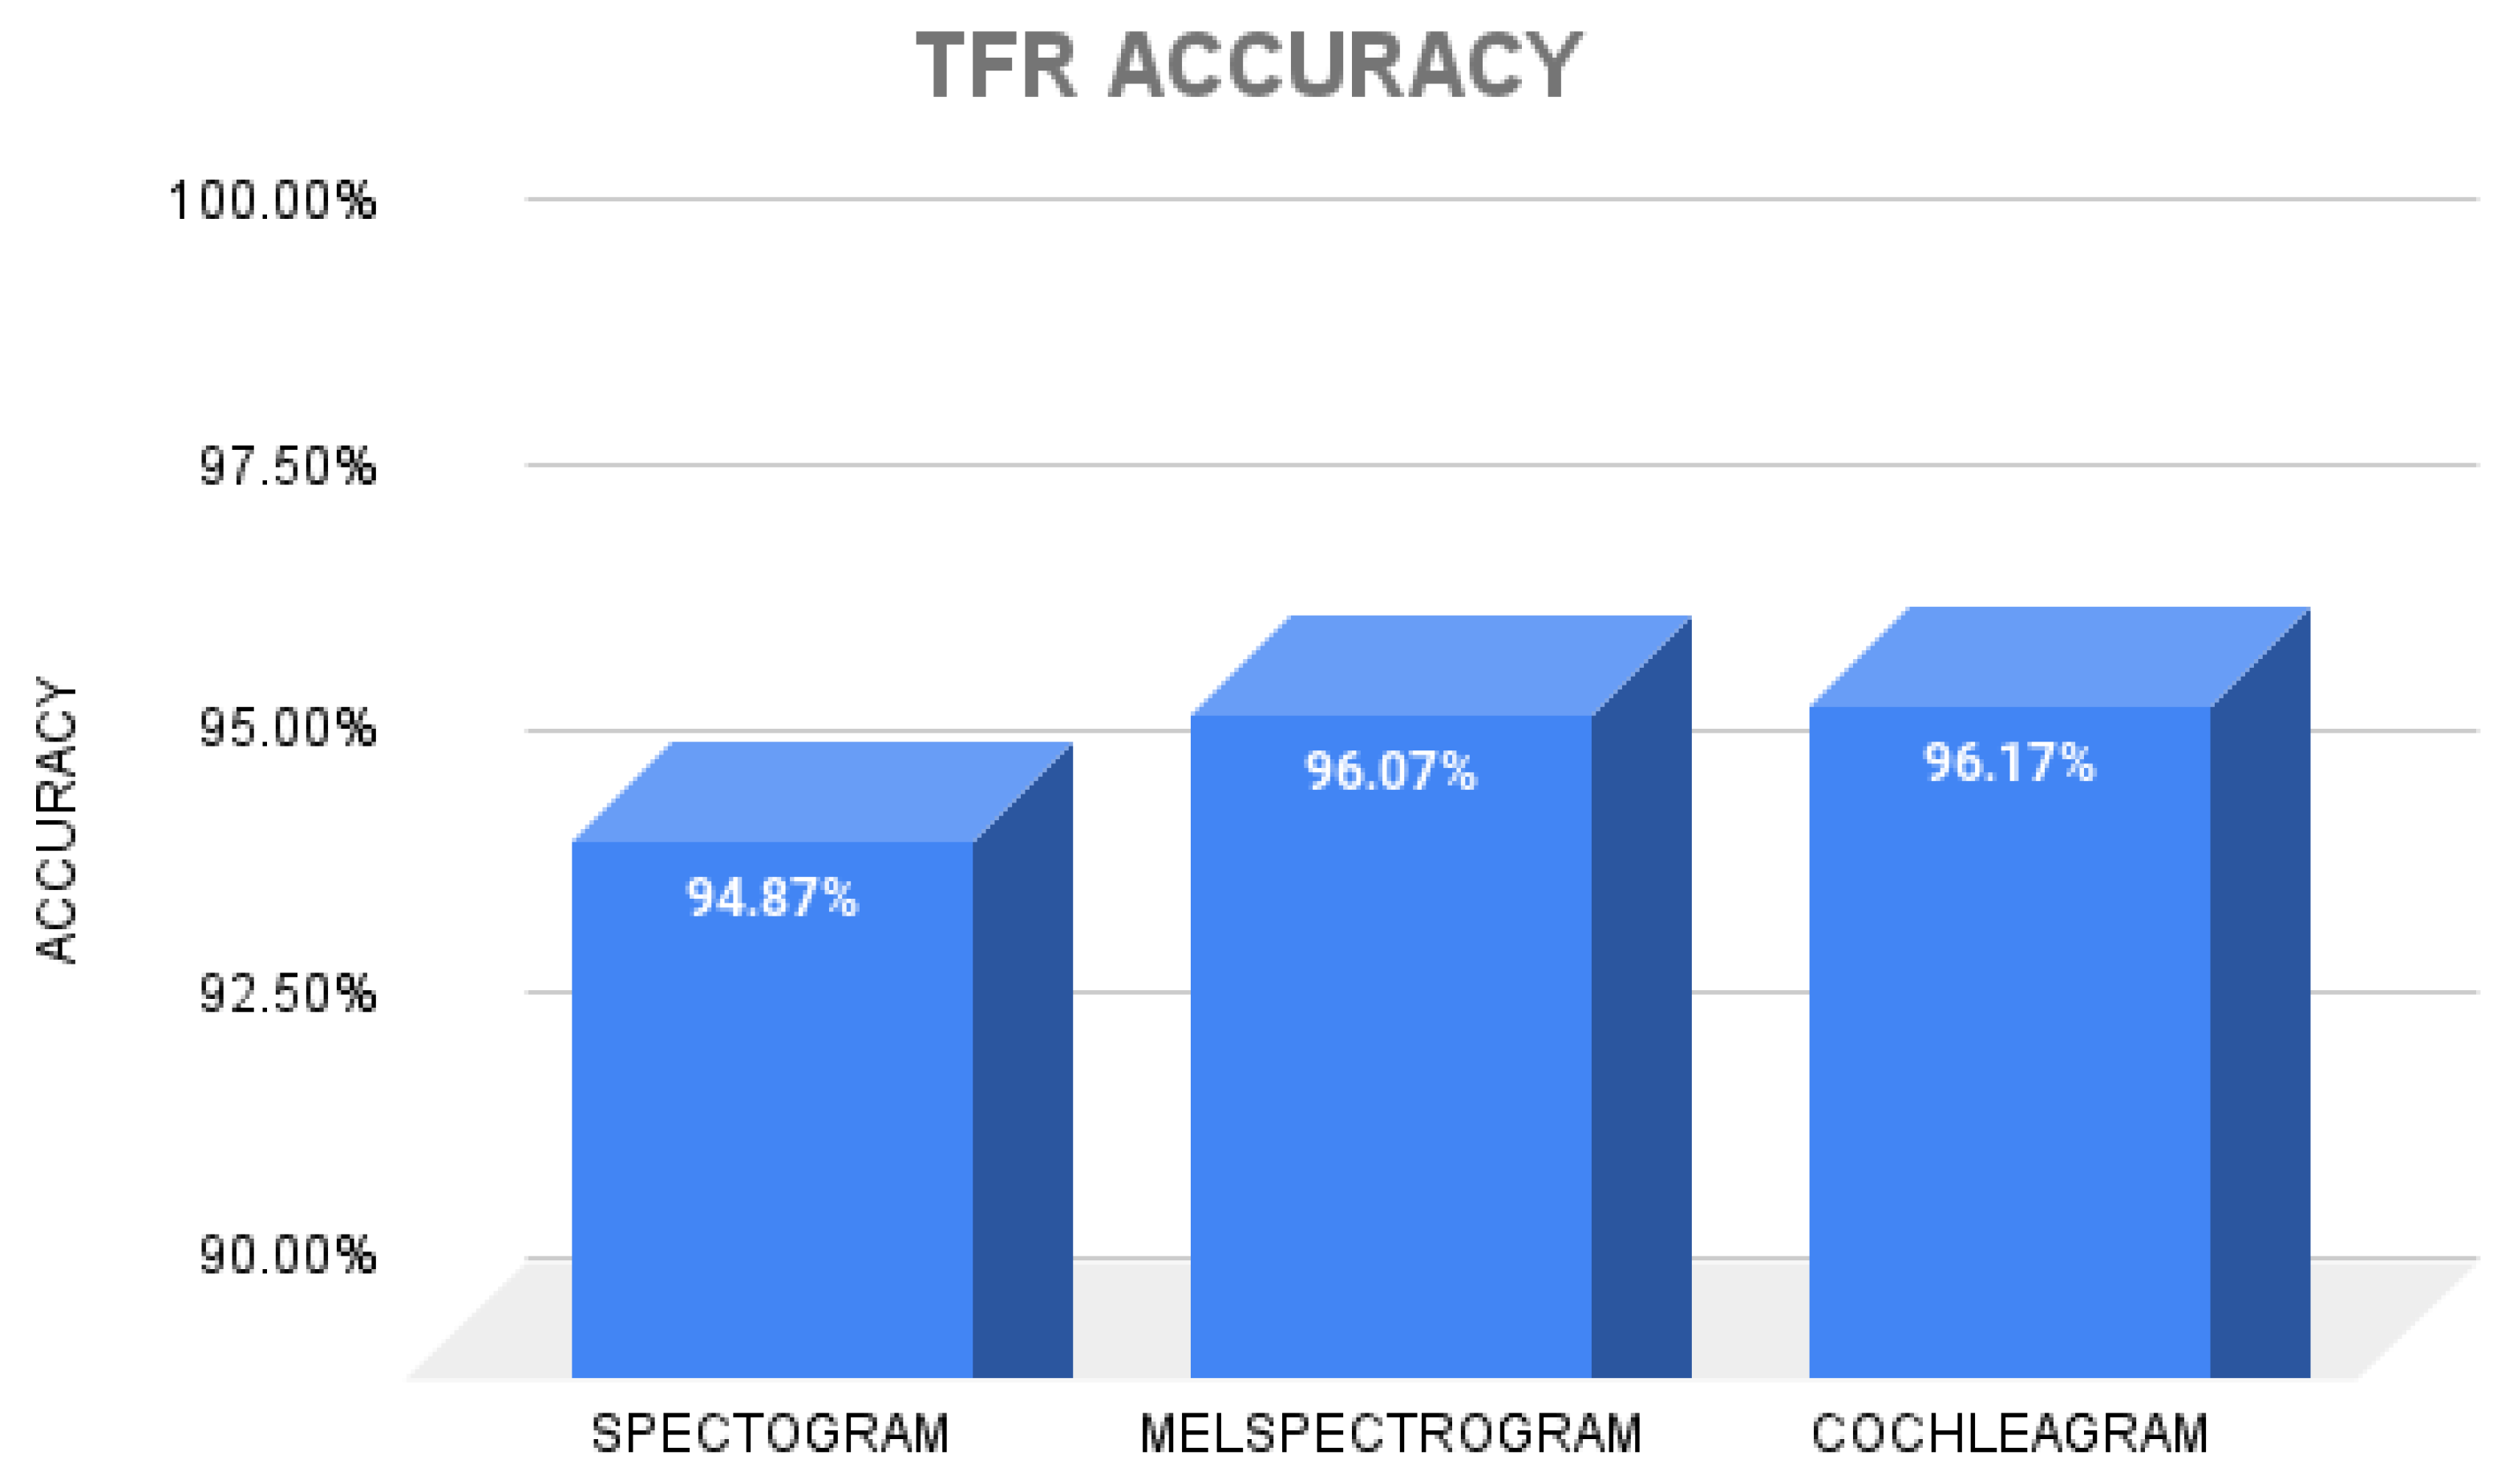
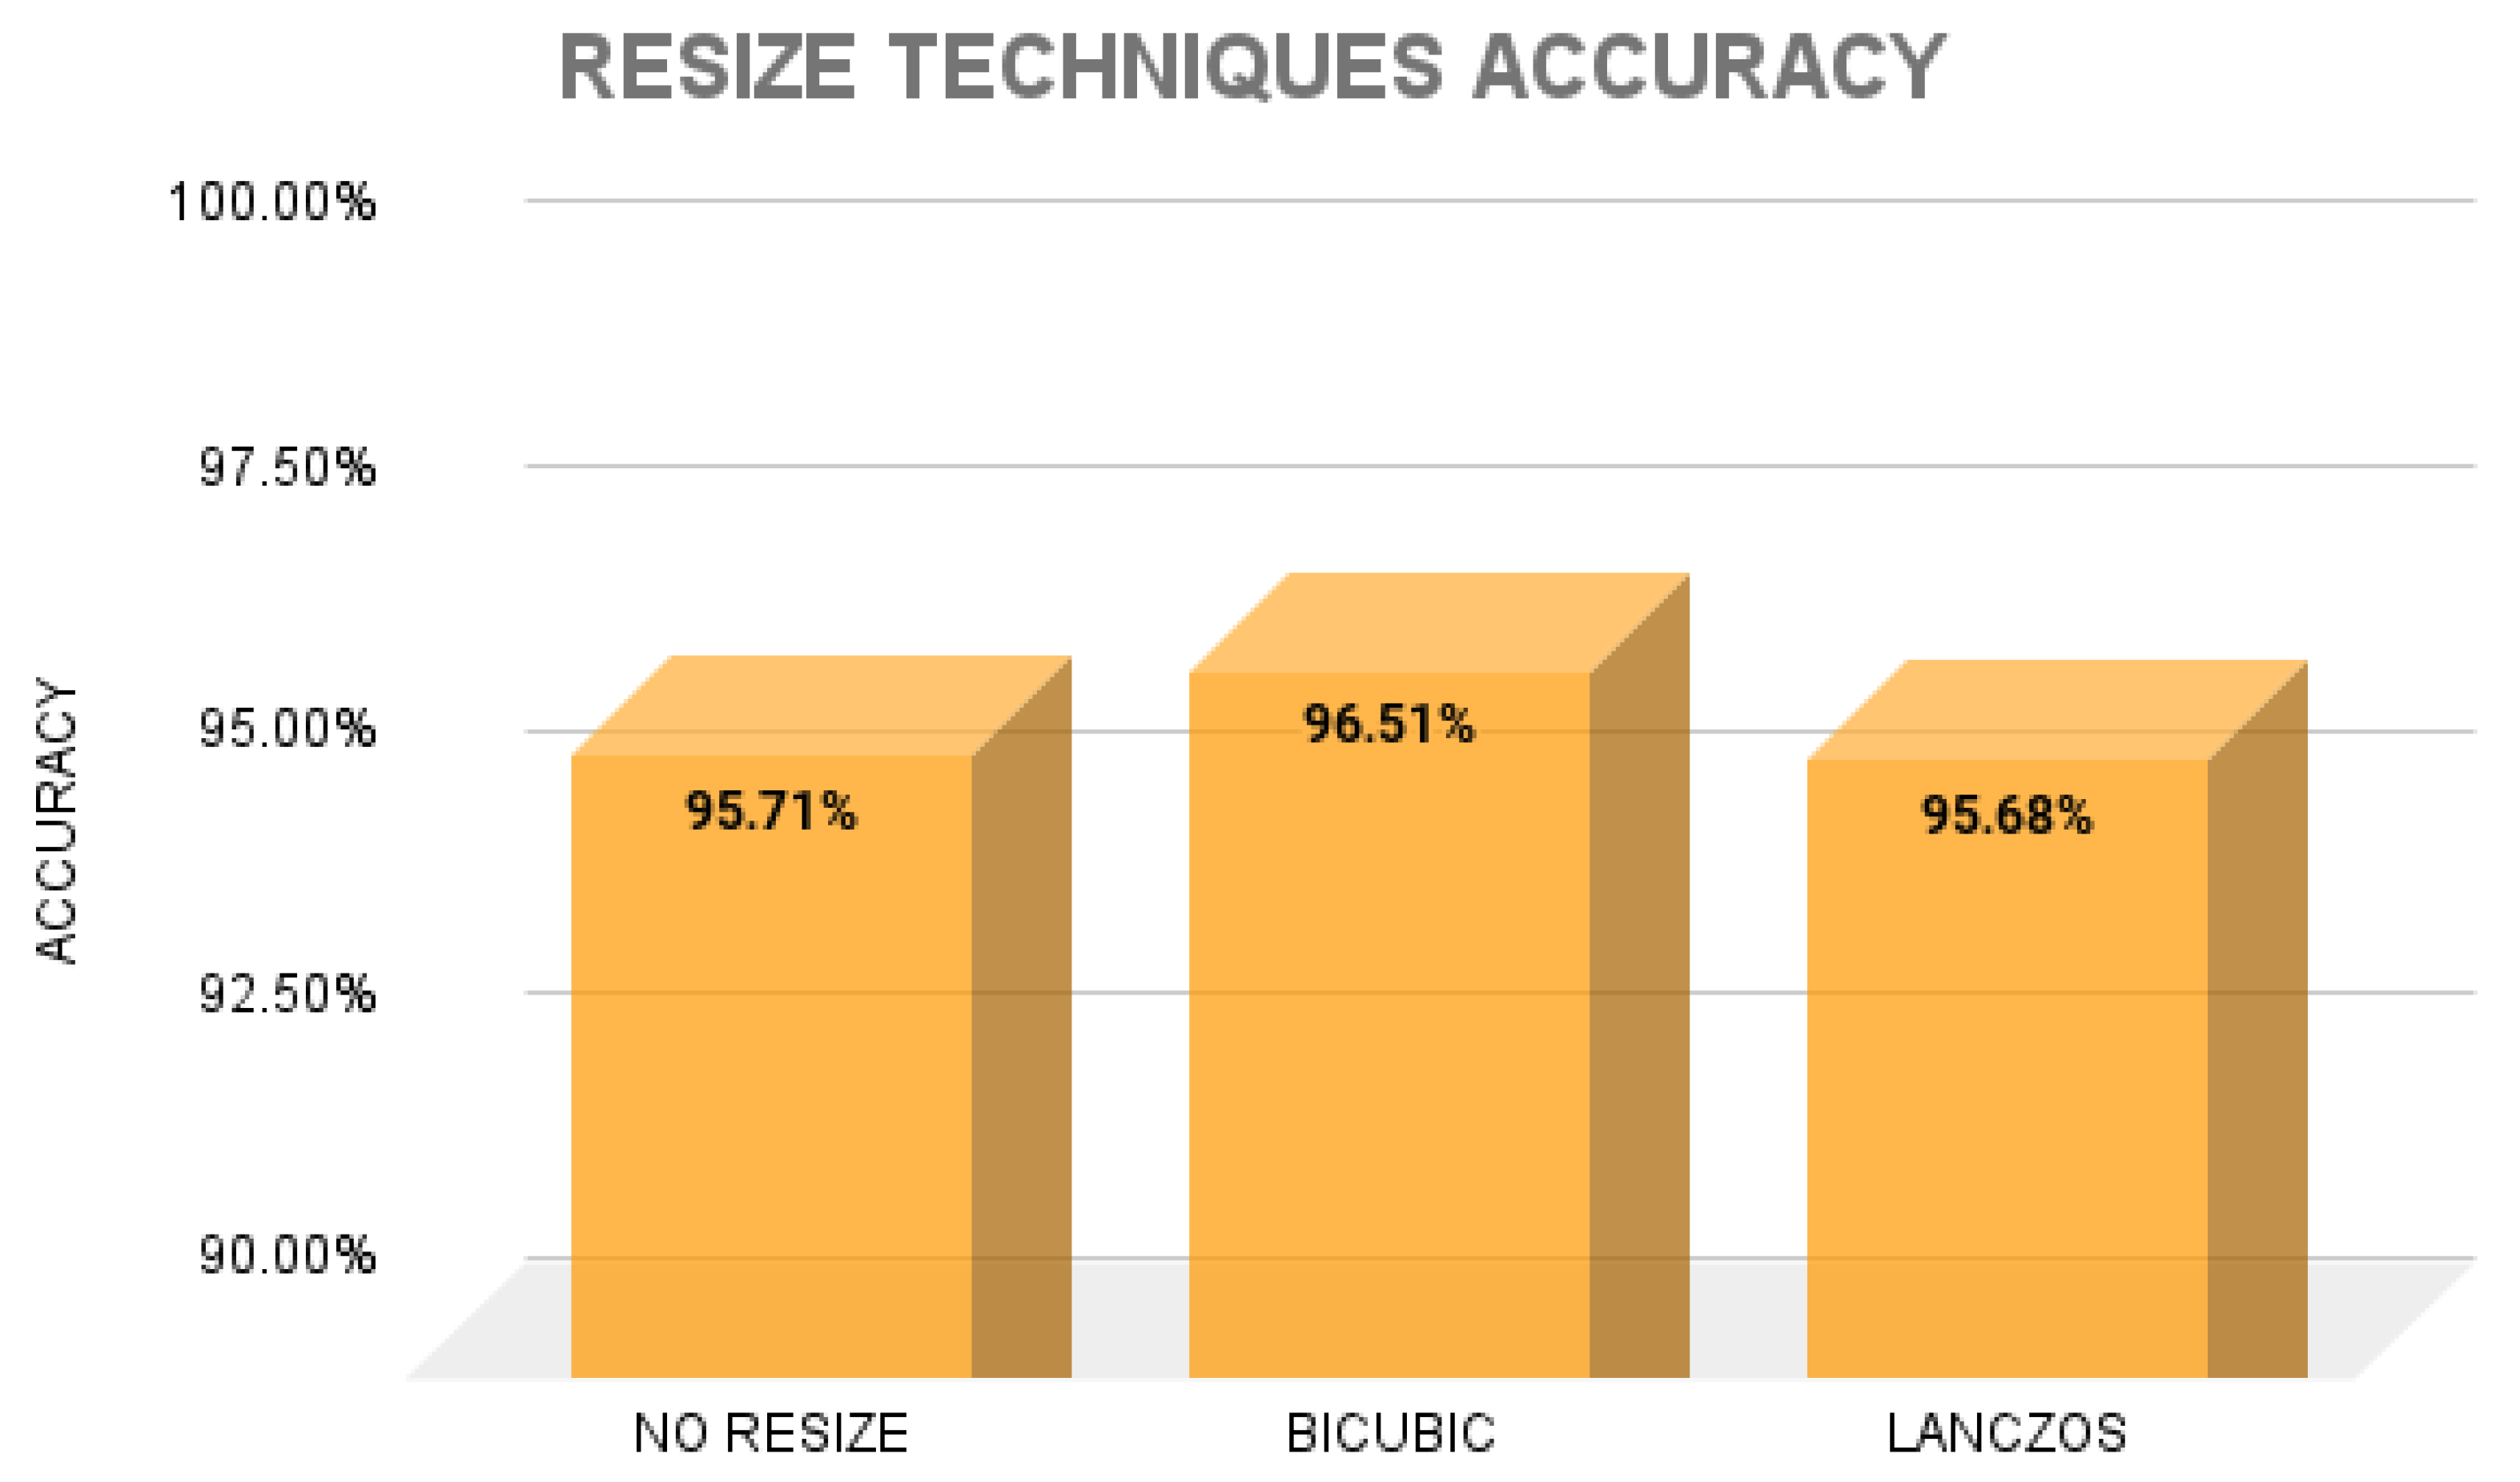
4. Discussion
5. Conclusions
Author Contributions
Acknowledgments
Conflicts of Interest
Abbreviations
| CVD | Cardiovascular disorders |
| VHD | Valvular heart diseases |
| PCG | Phonocardiogram |
| AS | Aortic stenosis |
| MI | Mitral regurgitation |
| MS | Mitral stenosis |
| MVP | Mitral valve prolapse |
| MCC | Matthews Correlation Coefficient |
References
- Coffey, S.; Roberts-Thomson, R.; Brown, A.; Carapetis, J.; Chen, M.; Enriquez-Sarano, M.; Zühlke, L.; Prendergast, B.D. Global epidemiology of valvular heart disease. Nature Reviews Cardiology 2021, 18, 853–864. [Google Scholar] [CrossRef]
- Milne-Ives, M.; de Cock, C.; Lim, E.; Shehadeh, M.H.; de Pennington, N.; Mole, G.; Normando, E.; Meinert, E. The Effectiveness of Artificial Intelligence Conversational Agents in Health Care: Systematic Review. Journal of Medical Internet Research 2020, 22, e20346. [Google Scholar] [CrossRef] [PubMed]
- Domenech, B.; Pomar, J.L.; Prat-González, S.; Vidal, B.; López-Soto, A.; Castella, M.; Sitges, M. Valvular heart disease epidemics. The Journal of heart valve disease 2016, 25, 1–7. [Google Scholar] [PubMed]
- Aluru, J.S.; Barsouk, A.; Saginala, K.; Rawla, P.; Barsouk, A. Valvular Heart Disease Epidemiology. Medical Sciences 2022, 10. [Google Scholar] [CrossRef] [PubMed]
- Sharan, R.V.; Moir, T.J. Time-Frequency Image Resizing Using Interpolation for Acoustic Event Recognition with Convolutional Neural Networks. 2019 IEEE International Conference on Signals and Systems (ICSigSys), 2019, pp. 8–11.
- Zhou, J.; Lee, S.; Liu, Y.; Chan, J.S.K.; Li, G.; Wong, W.T.; Jeevaratnam, K.; Cheng, S.H.; Liu, T.; Tse, G.; Zhang, Q. Predicting Stroke and Mortality in Mitral Regurgitation: A Machine Learning Approach. Current Problems in Cardiology 2023, 48, 101464. [Google Scholar] [CrossRef] [PubMed]
- Shvartz, V.; Sokolskaya, M.; Petrosyan, A.; Ispiryan, A.; Donakanyan, S.; Bockeria, L.; Bockeria, O. Predictors of Mortality Following Aortic Valve Replacement in Aortic Stenosis Patients. Pathophysiology: The Official Journal of the International Society for Pathophysiology 2022, 29, 106–117. [Google Scholar] [CrossRef] [PubMed]
- Ghosh, S.K.; Ponnalagu, R.; Tripathy, R.; Acharya, U.R. Automated detection of heart valve diseases using chirplet transform and multiclass composite classifier with PCG signals. Computers in biology and medicine 2020, 118, 103632. [Google Scholar] [CrossRef] [PubMed]
- Maknickas, V.; Maknickas, A. Recognition of normal–abnormal phonocardiographic signals using deep convolutional neural networks and mel-frequency spectral coefficients. Physiological measurement 2017, 38, 1671. [Google Scholar] [CrossRef] [PubMed]
- Demir, F.; Şengür, A.; Bajaj, V.; Polat, K. Towards the classification of heart sounds based on convolutional deep neural network. Health information science and systems 2019, 7, 1–9. [Google Scholar] [CrossRef]
- Sharan, R.V.; Moir, T.J. Acoustic event recognition using cochleagram image and convolutional neural networks. Applied Acoustics 2019, 148, 62–66. [Google Scholar] [CrossRef]
- Das, S.; Pal, S.; Mitra, M. Deep learning approach of murmur detection using Cochleagram. Biomedical Signal Processing and Control 2022, 77, 103747. [Google Scholar] [CrossRef]
- Mutlu, A.Y. Detection of epileptic dysfunctions in EEG signals using Hilbert vibration decomposition. Biomedical Signal Processing and Control 2018, 40, 33–40. [Google Scholar] [CrossRef]
- Netto, A.N.; Abraham, L. Detection and Classification of Cardiovascular Disease from Phonocardiogram using Deep Learning Models. 2021 Second International Conference on Electronics and Sustainable Communication Systems (ICESC), 2021, pp. 1646–1651.
- Arslan, Ö. Automated detection of heart valve disorders with time-frequency and deep features on PCG signals. Biomedical Signal Processing and Control 2022, 78, 103929. [Google Scholar] [CrossRef]
- Moraes, T.; Amorim, P.; Da Silva, J.V.; Pedrini, H. Medical image interpolation based on 3D Lanczos filtering. Computer Methods in Biomechanics and Biomedical Engineering: Imaging & Visualization 2020, 8, 294–300. [Google Scholar]
- Hu, Q.; Hu, J.; Yu, X.; Liu, Y. Automatic heart sound classification using one dimension deep neural network. Security, Privacy, and Anonymity in Computation, Communication, and Storage: SpaCCS 2020 International Workshops, Nanjing, China, December 18-20, 2020, Proceedings 13. Springer, 2021, pp. 200–208.
- Varghees, V.N.; Ramachandran, K. A novel heart sound activity detection framework for automated heart sound analysis. Biomedical Signal Processing and Control 2014, 13, 174–188. [Google Scholar] [CrossRef]
- Nogueira, D.M.; Ferreira, C.A.; Gomes, E.F.; Jorge, A.M. Classifying heart sounds using images of motifs, MFCC and temporal features. Journal of medical systems 2019, 43, 168. [Google Scholar] [CrossRef] [PubMed]
- Ibarra-Hernández, R.F.; Bertin, N.; Alonso-Arévalo, M.A.; Guillén-Ramírez, H.A. A benchmark of heart sound classification systems based on sparse decompositions. 14th International Symposium on Medical Information Processing and Analysis. SPIE, 2018, Vol. 10975, pp. 26–38.
- Khan, K.N.; Khan, F.A.; Abid, A.; Olmez, T.; Dokur, Z.; Khandakar, A.; Chowdhury, M.E.; Khan, M.S. Deep learning based classification of unsegmented phonocardiogram spectrograms leveraging transfer learning. Physiological measurement 2021, 42, 095003. [Google Scholar] [CrossRef] [PubMed]
- Yaseen.; Son, G.Y.; Kwon, S. Classification of heart sound signal using multiple features. Applied Sciences 2018, 8, 2344. [CrossRef]
- Abbas, Q.; Hussain, A.; Baig, A.R. Automatic detection and classification of cardiovascular disorders using phonocardiogram and convolutional vision transformers. diagnostics 2022, 12, 3109. [Google Scholar] [CrossRef]
- Arslan, Ö.; Karhan, M. Effect of Hilbert-Huang transform on classification of PCG signals using machine learning. Journal of King Saud University-Computer and Information Sciences 2022, 34, 9915–9925. [Google Scholar] [CrossRef]
- Adiban, M.; BabaAli, B.; Shehnepoor, S. Statistical feature embedding for heart sound classification. Journal of Electrical Engineering 2019, 70, 259–272. [Google Scholar] [CrossRef]
- Baghel, N.; Dutta, M.K.; Burget, R. Automatic diagnosis of multiple cardiac diseases from PCG signals using convolutional neural network. Computer Methods and Programs in Biomedicine 2020, 197, 105750. [Google Scholar] [CrossRef]
- Alkhodari, M.; Fraiwan, L. Convolutional and recurrent neural networks for the detection of valvular heart diseases in phonocardiogram recordings. Computer Methods and Programs in Biomedicine 2021, 200, 105940. [Google Scholar] [CrossRef]
- Khan, M.U.; Samer, S.; Alshehri, M.D.; Baloch, N.K.; Khan, H.; Hussain, F.; Kim, S.W.; Zikria, Y.B. Artificial neural network-based cardiovascular disease prediction using spectral features. Computers and Electrical Engineering 2022, 101, 108094. [Google Scholar] [CrossRef]
- Jabari, M.; Rezaee, K.; Zakeri, M. Fusing handcrafted and deep features for multi-class cardiac diagnostic decision support model based on heart sound signals. Journal of Ambient Intelligence and Humanized Computing 2023, 14, 2873–2885. [Google Scholar] [CrossRef]
- Supo, E.; Galdos, J.; Rendulich, J.; Sulla, E. ; others. PRD as an indicator proposal in the evaluation of ECG signal acquisition prototypes in real patients. 2022 IEEE ANDESCON. IEEE, 2022, pp. 1–4.
- Sulla, T.R.; Talavera, S.J.; Supo, C.E.; Montoya, A.A. Non-invasive glucose monitor based on electric bioimpedance using AFE4300. 2019 IEEE XXVI International Conference on Electronics, Electrical Engineering and Computing (INTERCON). IEEE, 2019, pp. 1–3.
- Talavera, J.R.; Mendoza, E.A.S.; Dávila, N.M.; Supo, E. ; others. Implementation of a real-time 60 Hz interference cancellation algorithm for ECG signals based on ARM cortex M4 and ADS1298. 2017 IEEE XXIV International Conference on Electronics, Electrical Engineering and Computing (INTERCON). IEEE, 2017, pp. 1–4.
- Huisa, C.M.; Elvis Supo, C.; Edward Figueroa, T.; Rendulich, J.; Sulla-Espinoza, E. PCG Heart Sounds Quality Classification Using Neural Networks and SMOTE Tomek Links for the Think Health Project. Proceedings of Data Analytics and Management: ICDAM 2022; Springer; 2023; pp. 803–811. [Google Scholar]
- Ismail, S.; Ismail, B.; Siddiqi, I.; Akram, U. PCG classification through spectrogram using transfer learning. Biomedical Signal Processing and Control 2023, 79, 104075. [Google Scholar] [CrossRef]
- Leo, J.; Loong, C.; Subari, K.S.; Abdullah, N.M.K.; Ahmad, N.; Besar, R. Comparison of MFCC and Cepstral Coefficients as a Feature Set for PCG Biometric Systems. World Academy of Science, Engineering and Technology, International Journal of Medical, Health, Biomedical, Bioengineering and Pharmaceutical Engineering 2010, 4, 335–339. [Google Scholar]
- Das, S.; Pal, S.; Mitra, M. Deep learning approach of murmur detection using Cochleagram. Biomedical Signal Processing and Control 2022, 77, 103747. [Google Scholar] [CrossRef]
- Triwijoyo, B.; Adil, A. Analysis of Medical Image Resizing Using Bicubic Interpolation Algorithm. Jurnal Ilmu Komputer 2021, 14, 20–29. [Google Scholar] [CrossRef]
- Bentbib, A.; El Guide, M.; Jbilou, K.; Reichel, L. A global Lanczos method for image restoration. Journal of Computational and Applied Mathematics 2016, 300, 233–244. [Google Scholar] [CrossRef]
- Qiao, Q.; Yunusa-Kaltungo, A.; Edwards, R.E. Developing a machine learning based building energy consumption prediction approach using limited data: Boruta feature selection and empirical mode decomposition. Energy Reports 2023, 9, 3643–3660. [Google Scholar] [CrossRef]
- Kumar, S.S.; Shaikh, T. Empirical evaluation of the performance of feature selection approaches on random forest. 2017 international conference on computer and applications (ICCA). IEEE, 2017, pp. 227–231.
- Kursa, M.B.; Rudnicki, W.R. Feature selection with the Boruta package. Journal of statistical software 2010, 36, 1–13. [Google Scholar] [CrossRef]
- Parvandeh, S.; Yeh, H.W.; Paulus, M.P.; McKinney, B.A. Consensus features nested cross-validation. Bioinformatics 2020, 36, 3093–3098. [Google Scholar] [CrossRef] [PubMed]
- Safavian, S.R.; Landgrebe, D. A survey of decision tree classifier methodology. IEEE transactions on systems, man, and cybernetics 1991, 21, 660–674. [Google Scholar] [CrossRef]
- Sun, S.; Huang, R. An adaptive k-nearest neighbor algorithm. 2010 seventh international conference on fuzzy systems and knowledge discovery. IEEE, 2010, Vol. 1, pp. 91–94.
- Biau, G.; Scornet, E. A random forest guided tour. Test 2016, 25, 197–227. [Google Scholar] [CrossRef]
- Lau, K.; Wu, Q. Online training of support vector classifier. Pattern Recognition 2003, 36, 1913–1920. [Google Scholar] [CrossRef]
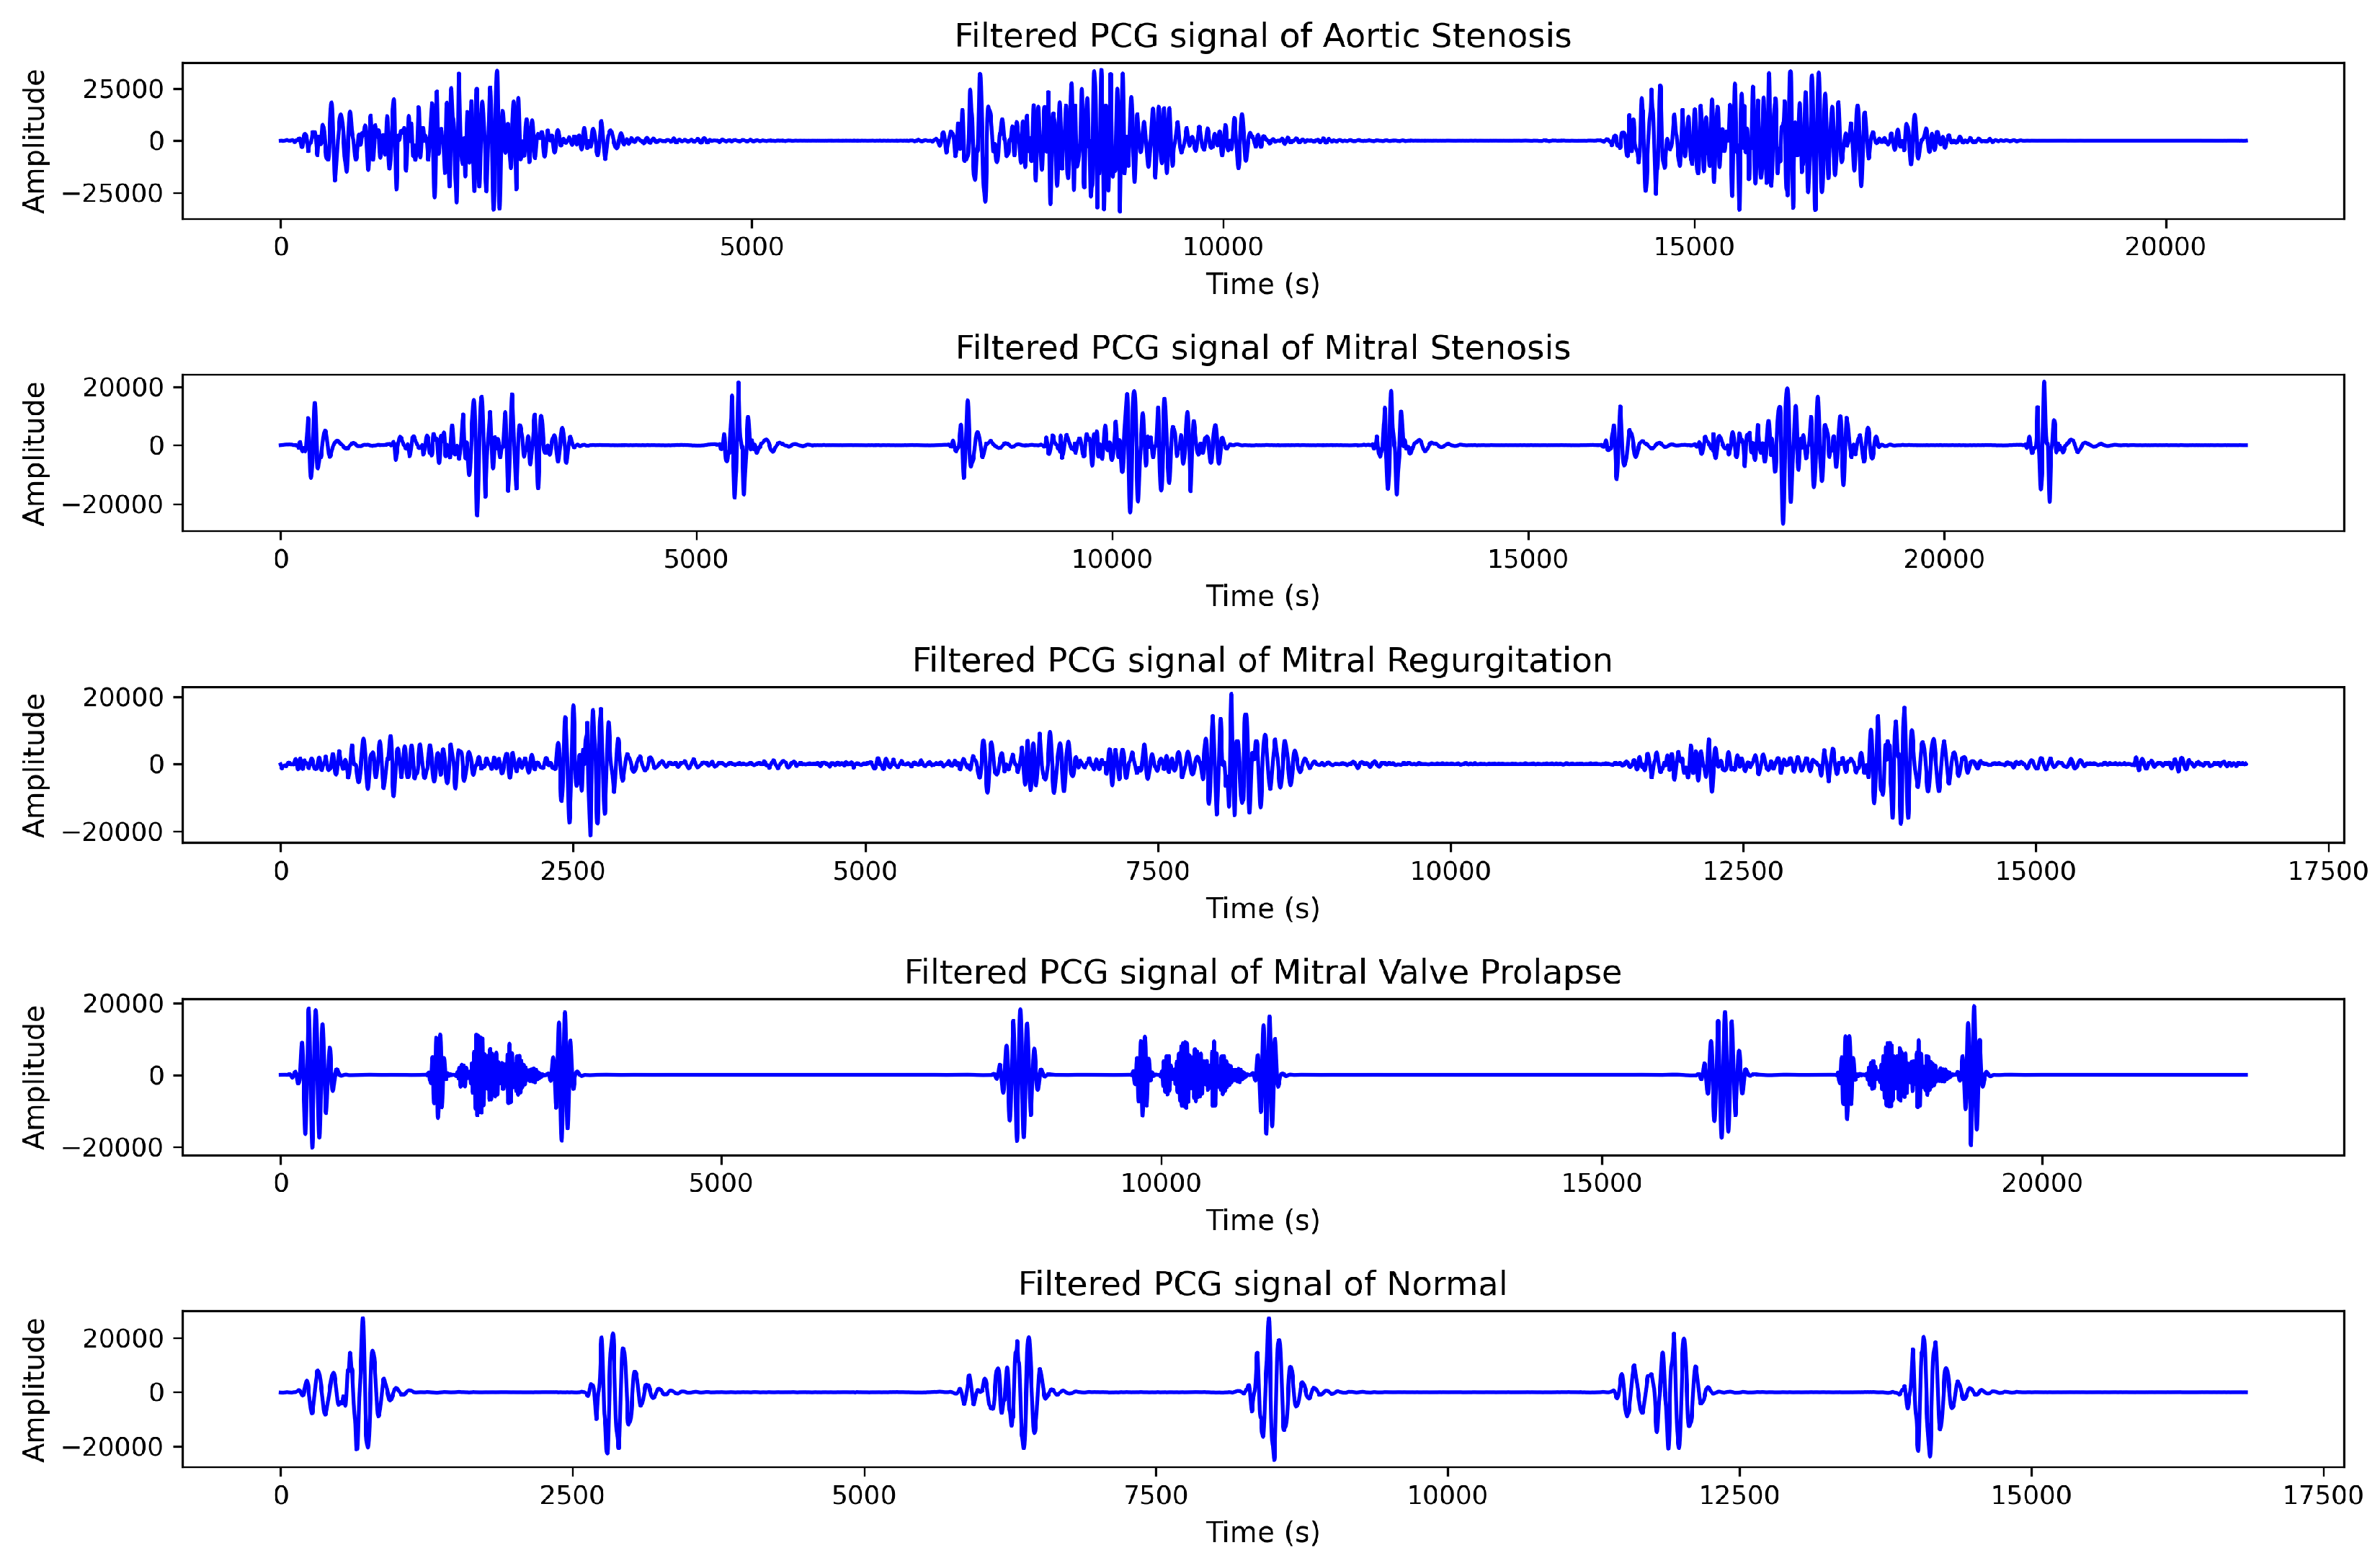
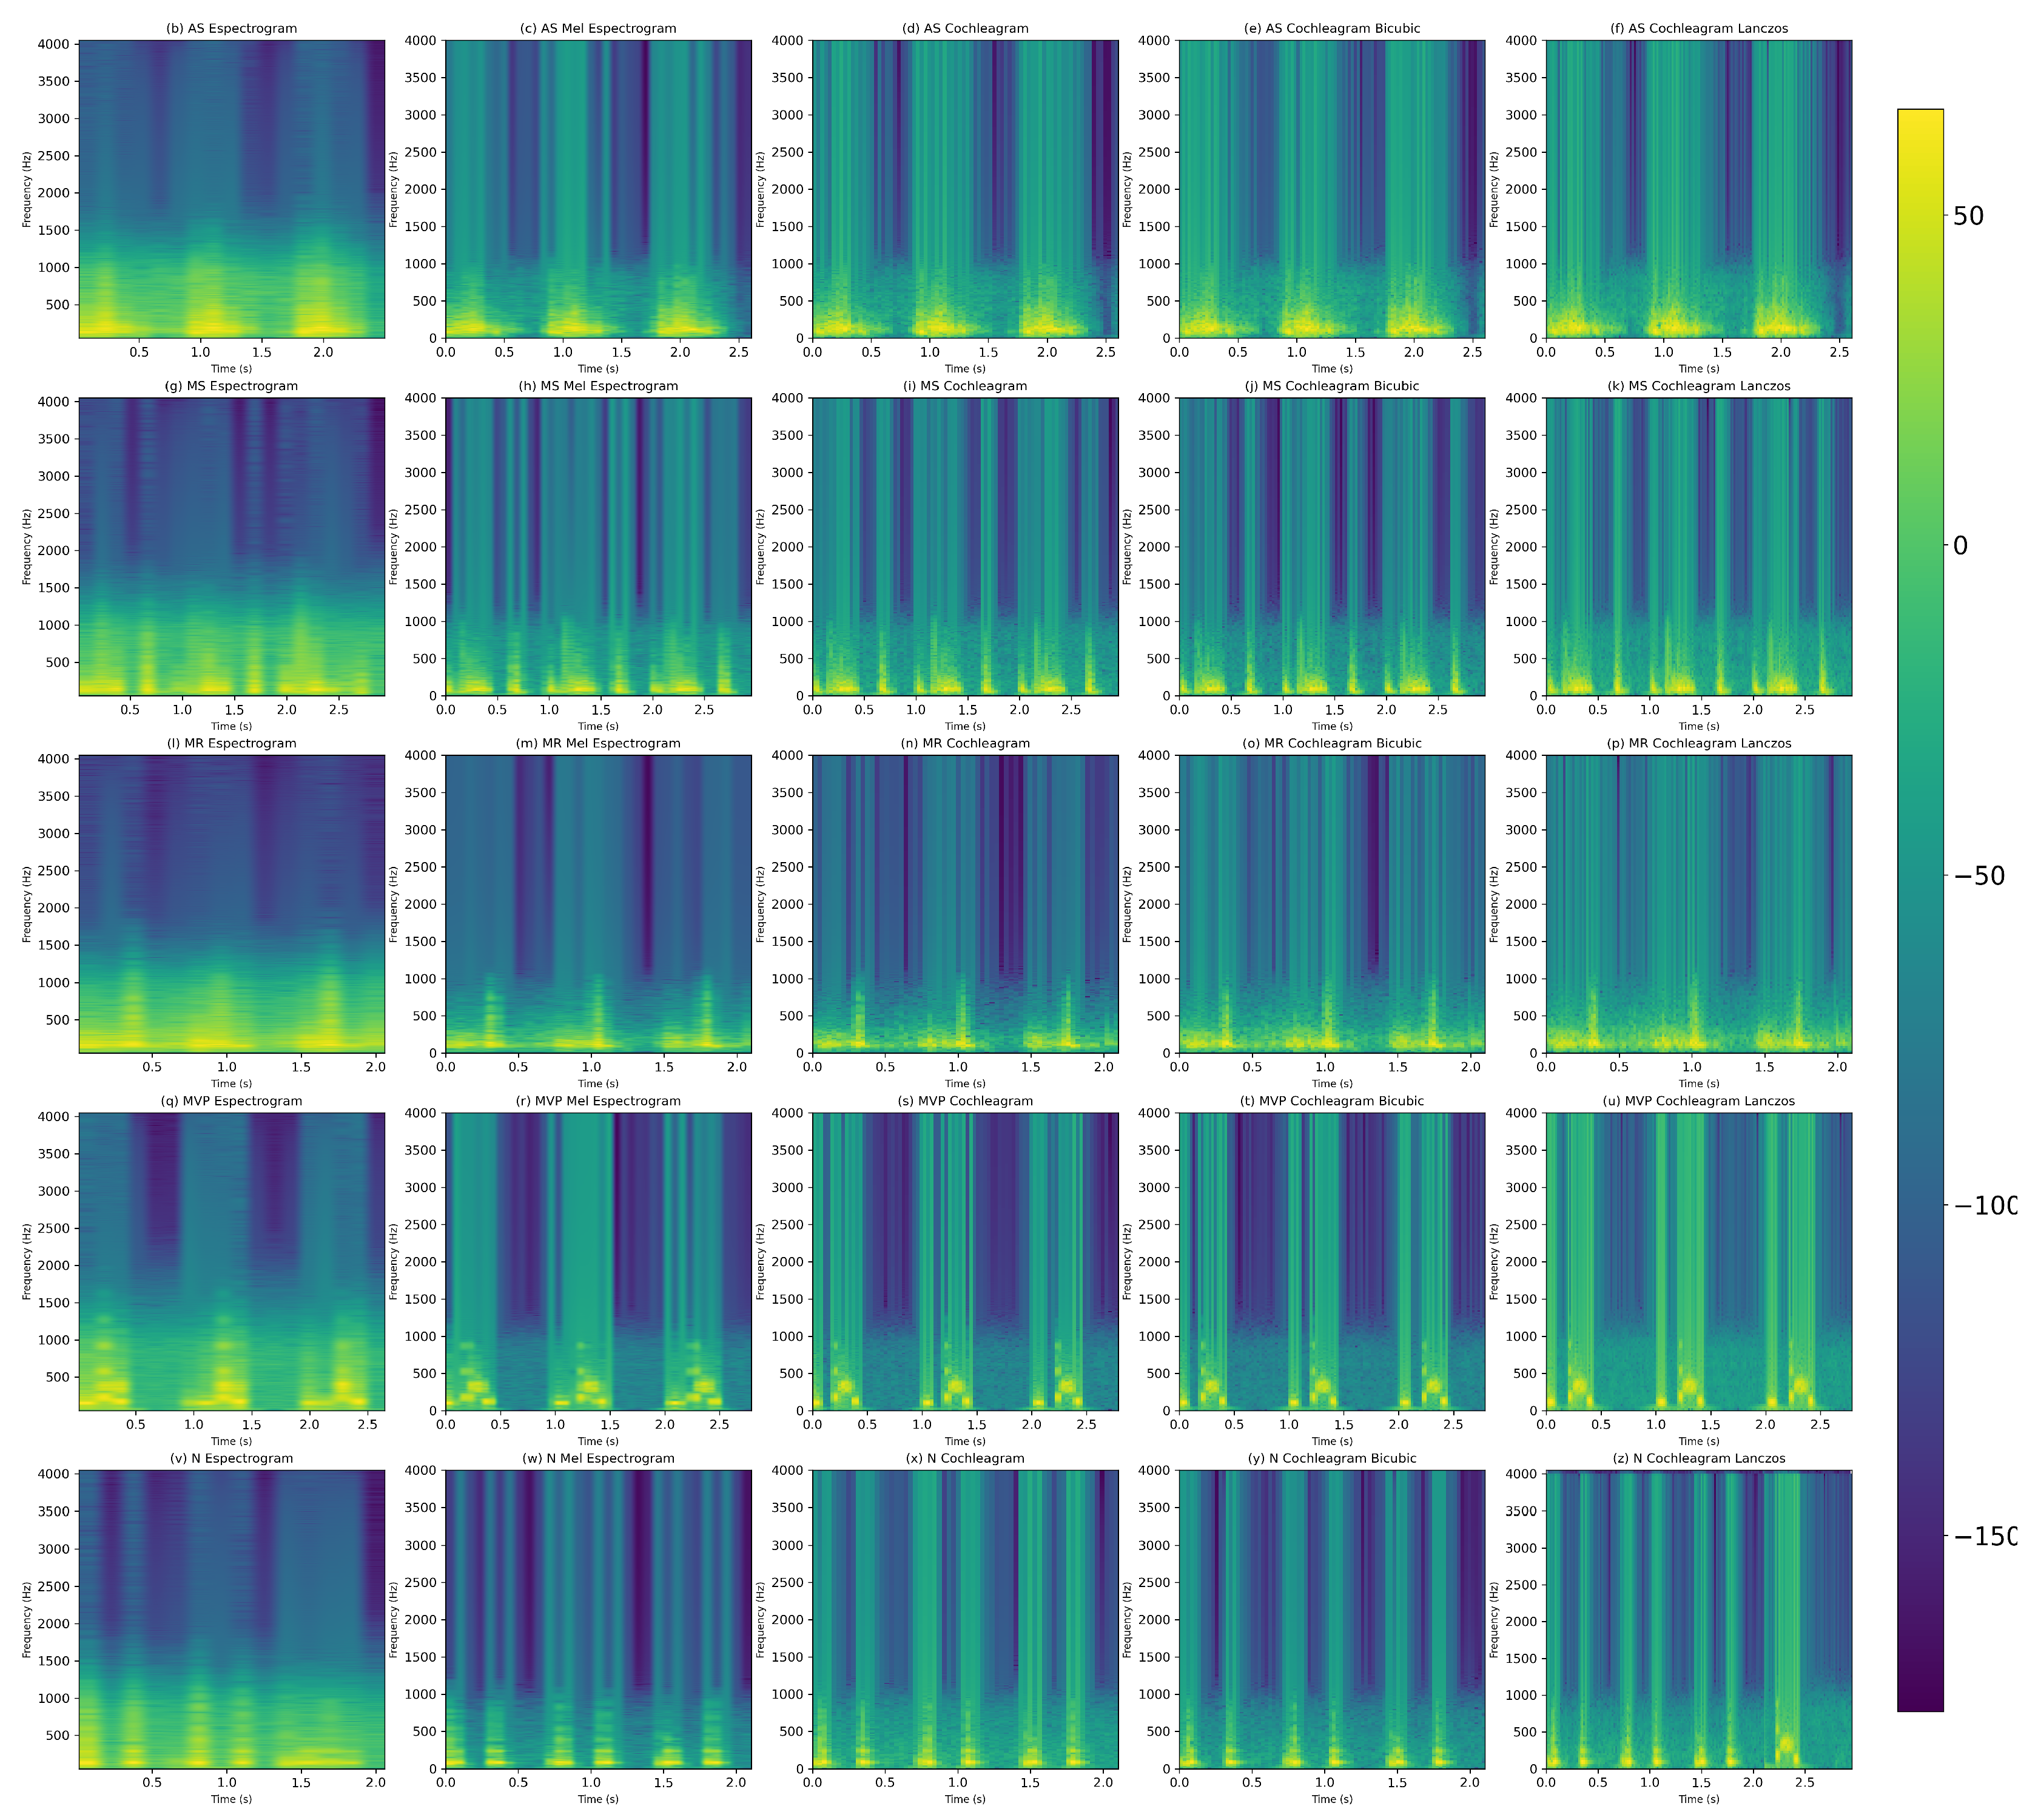


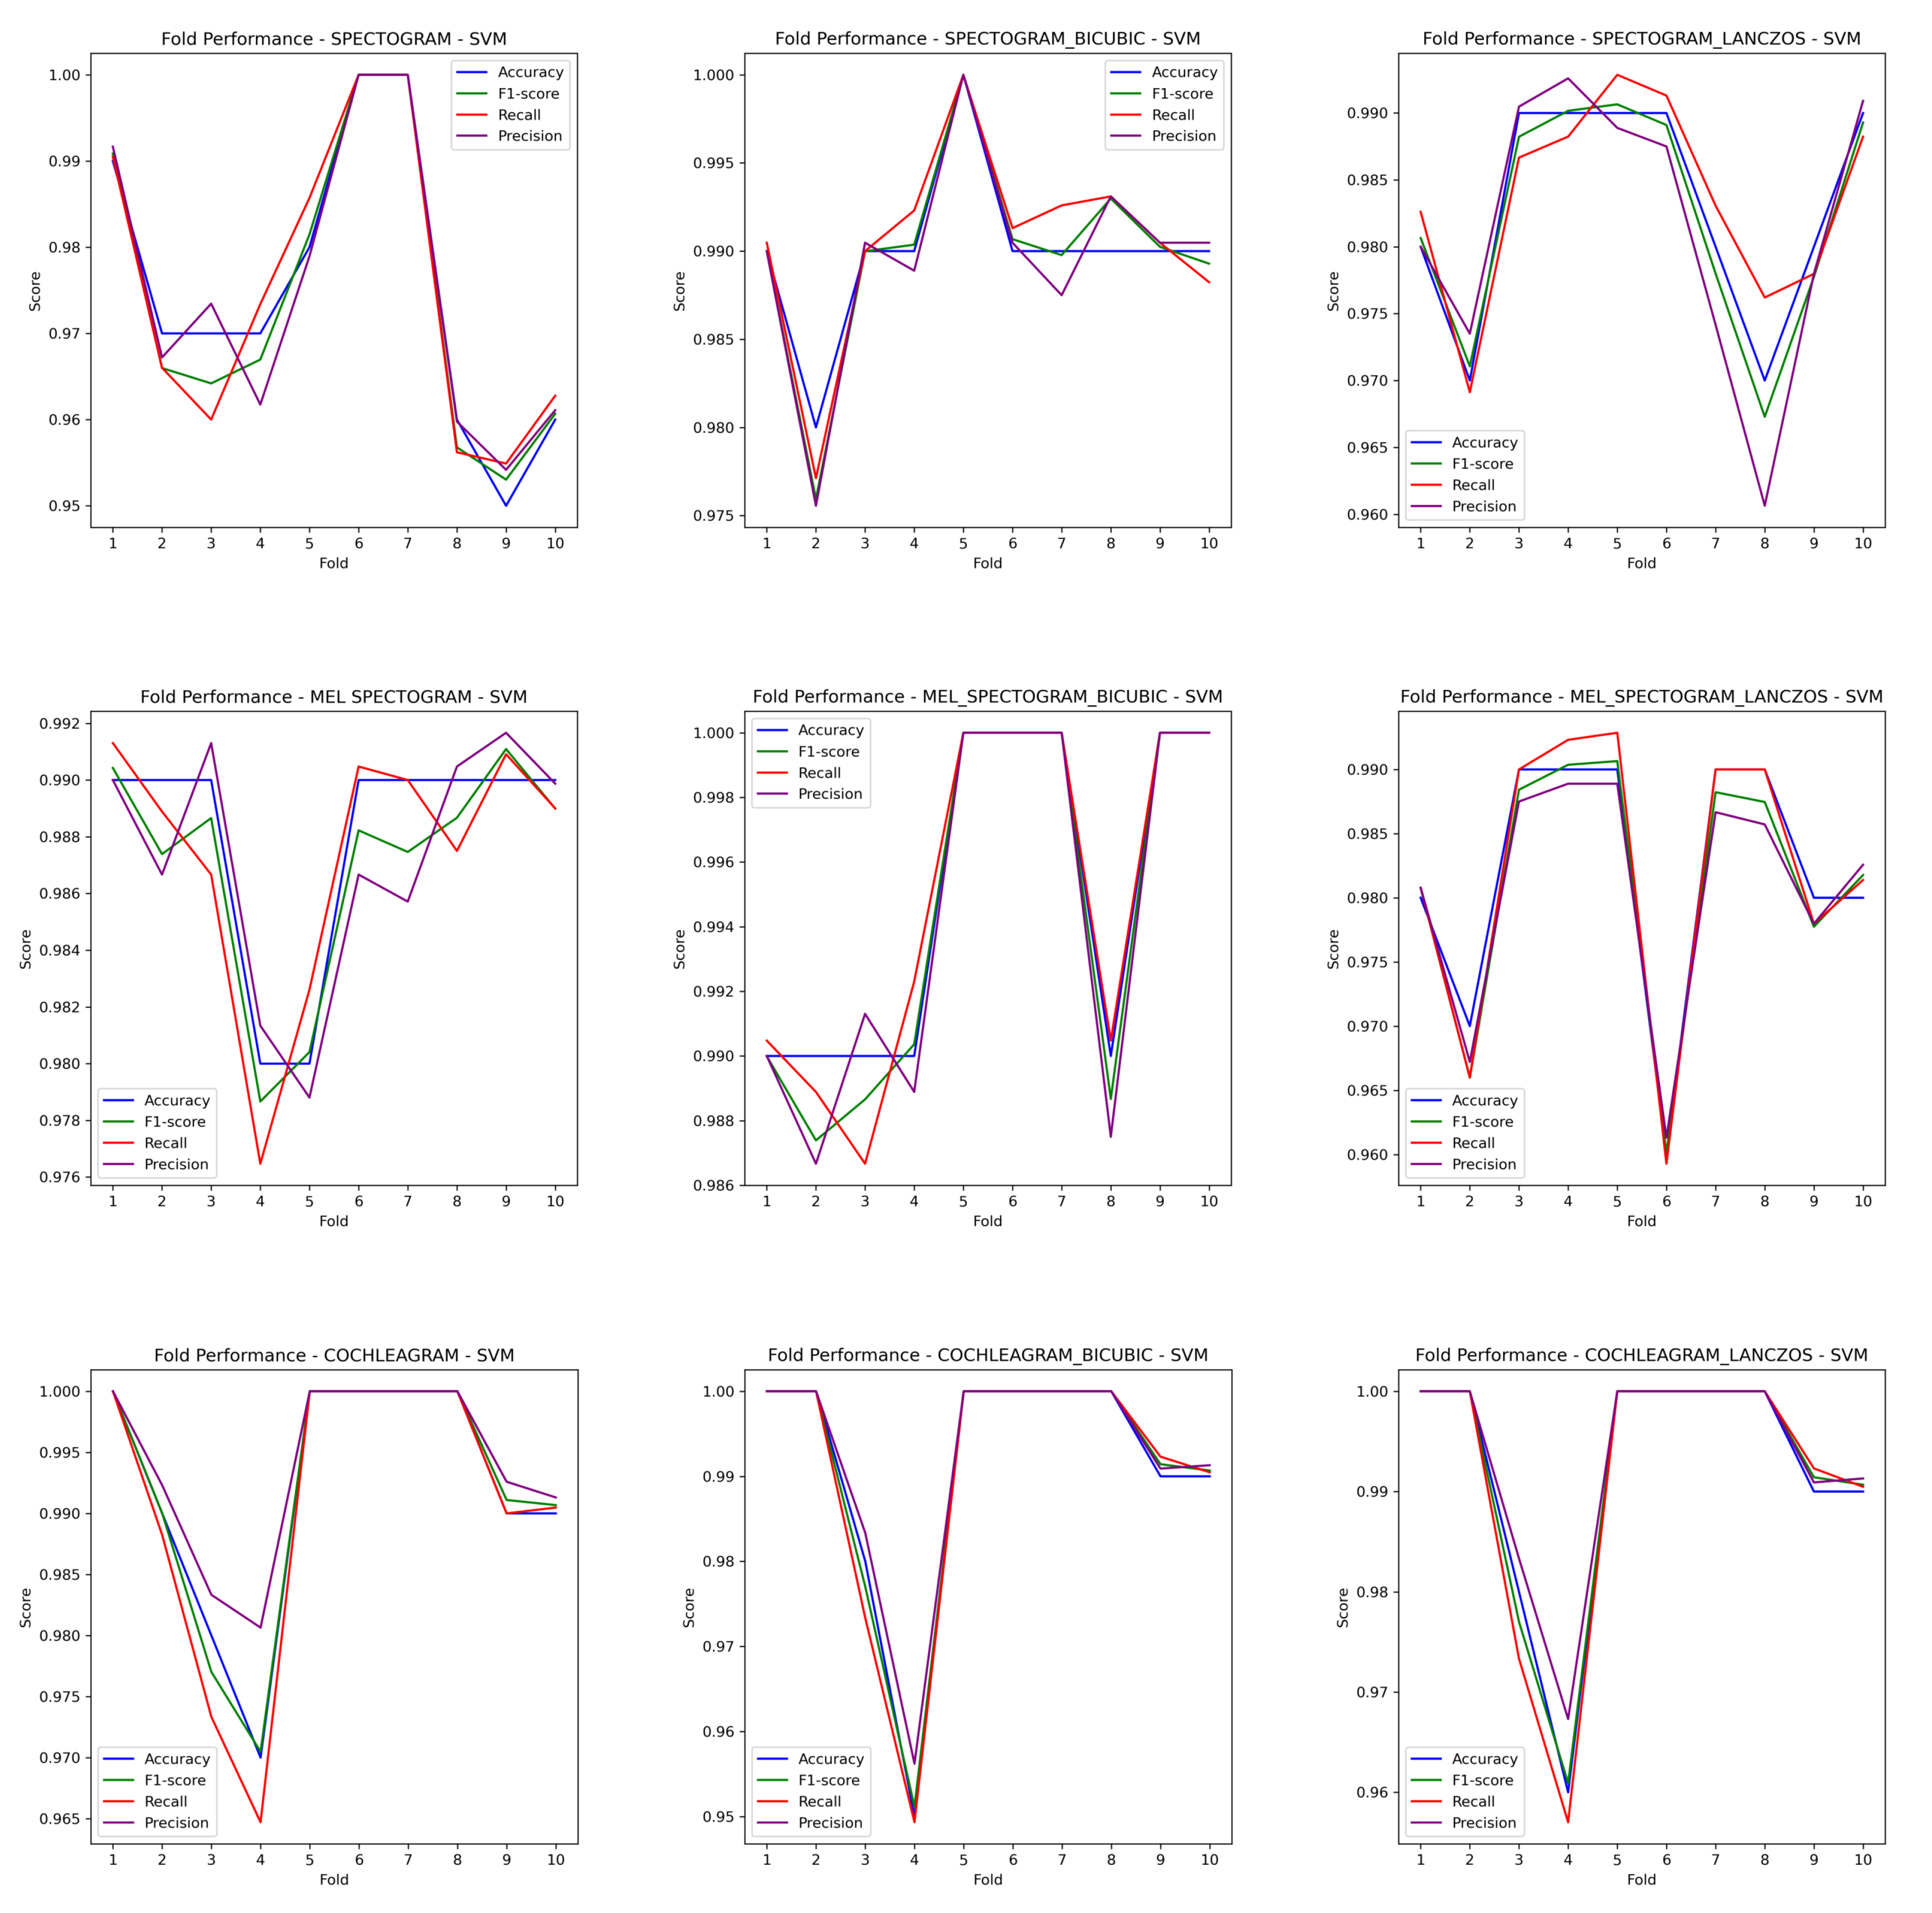
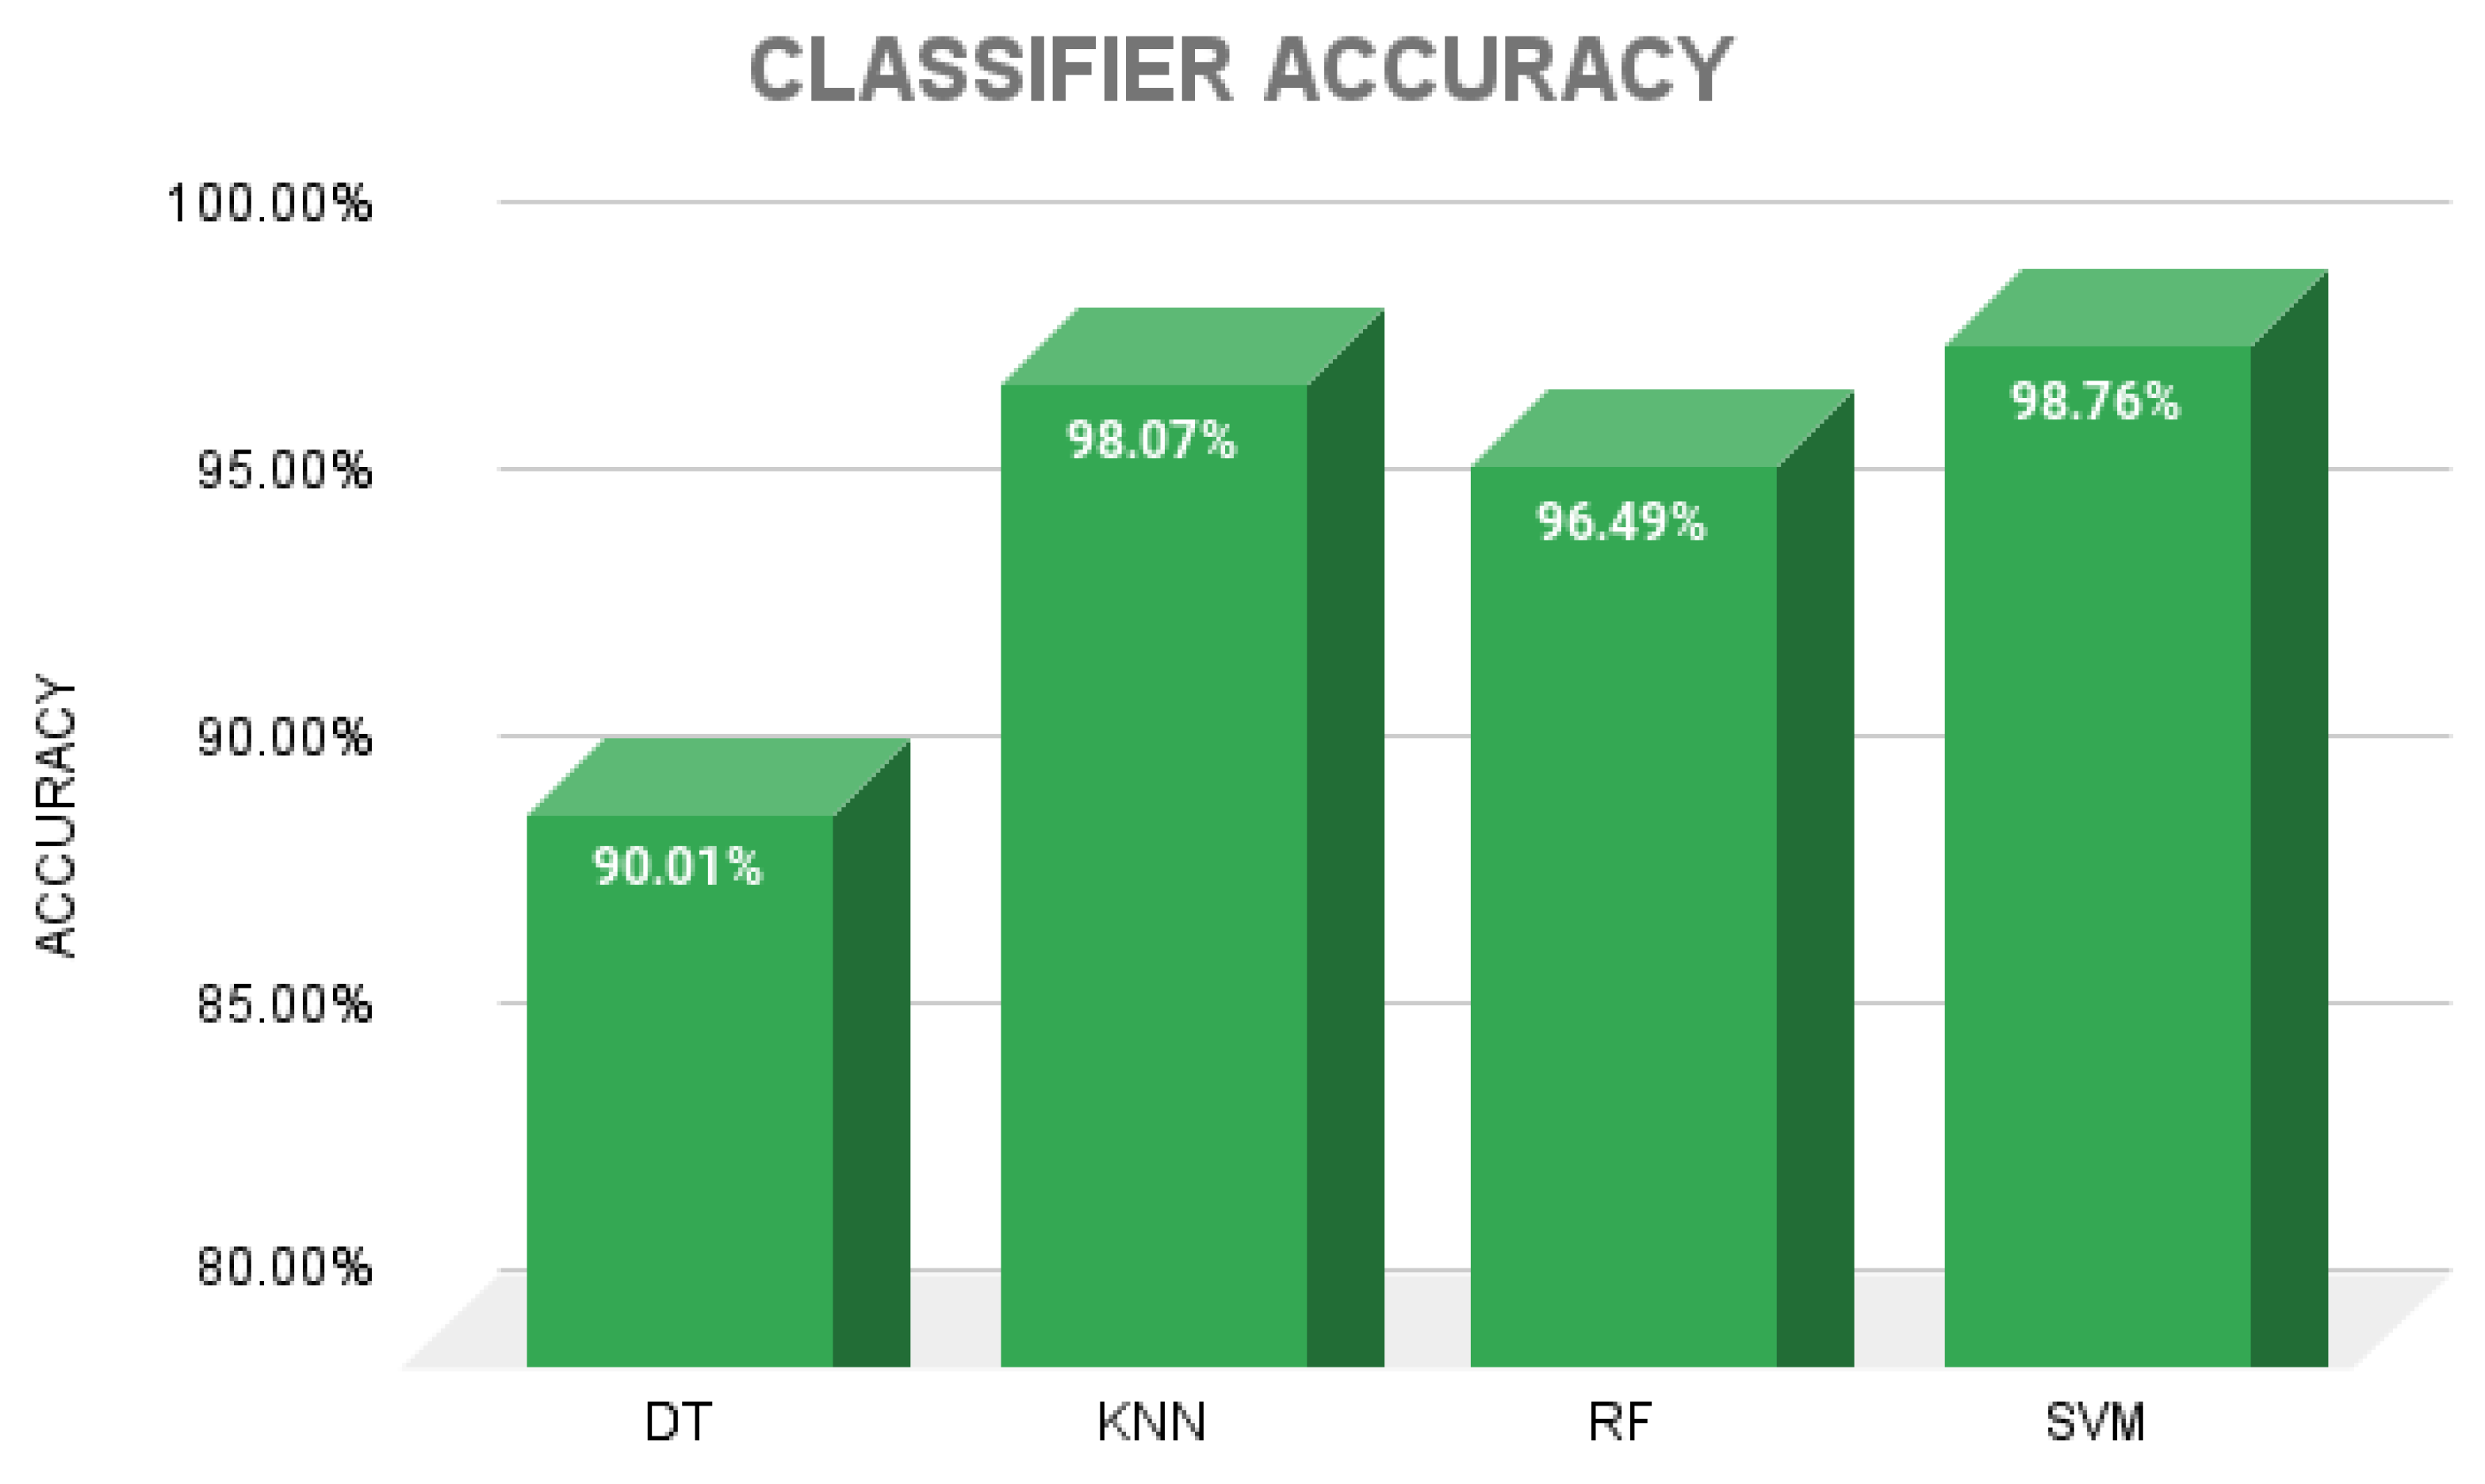
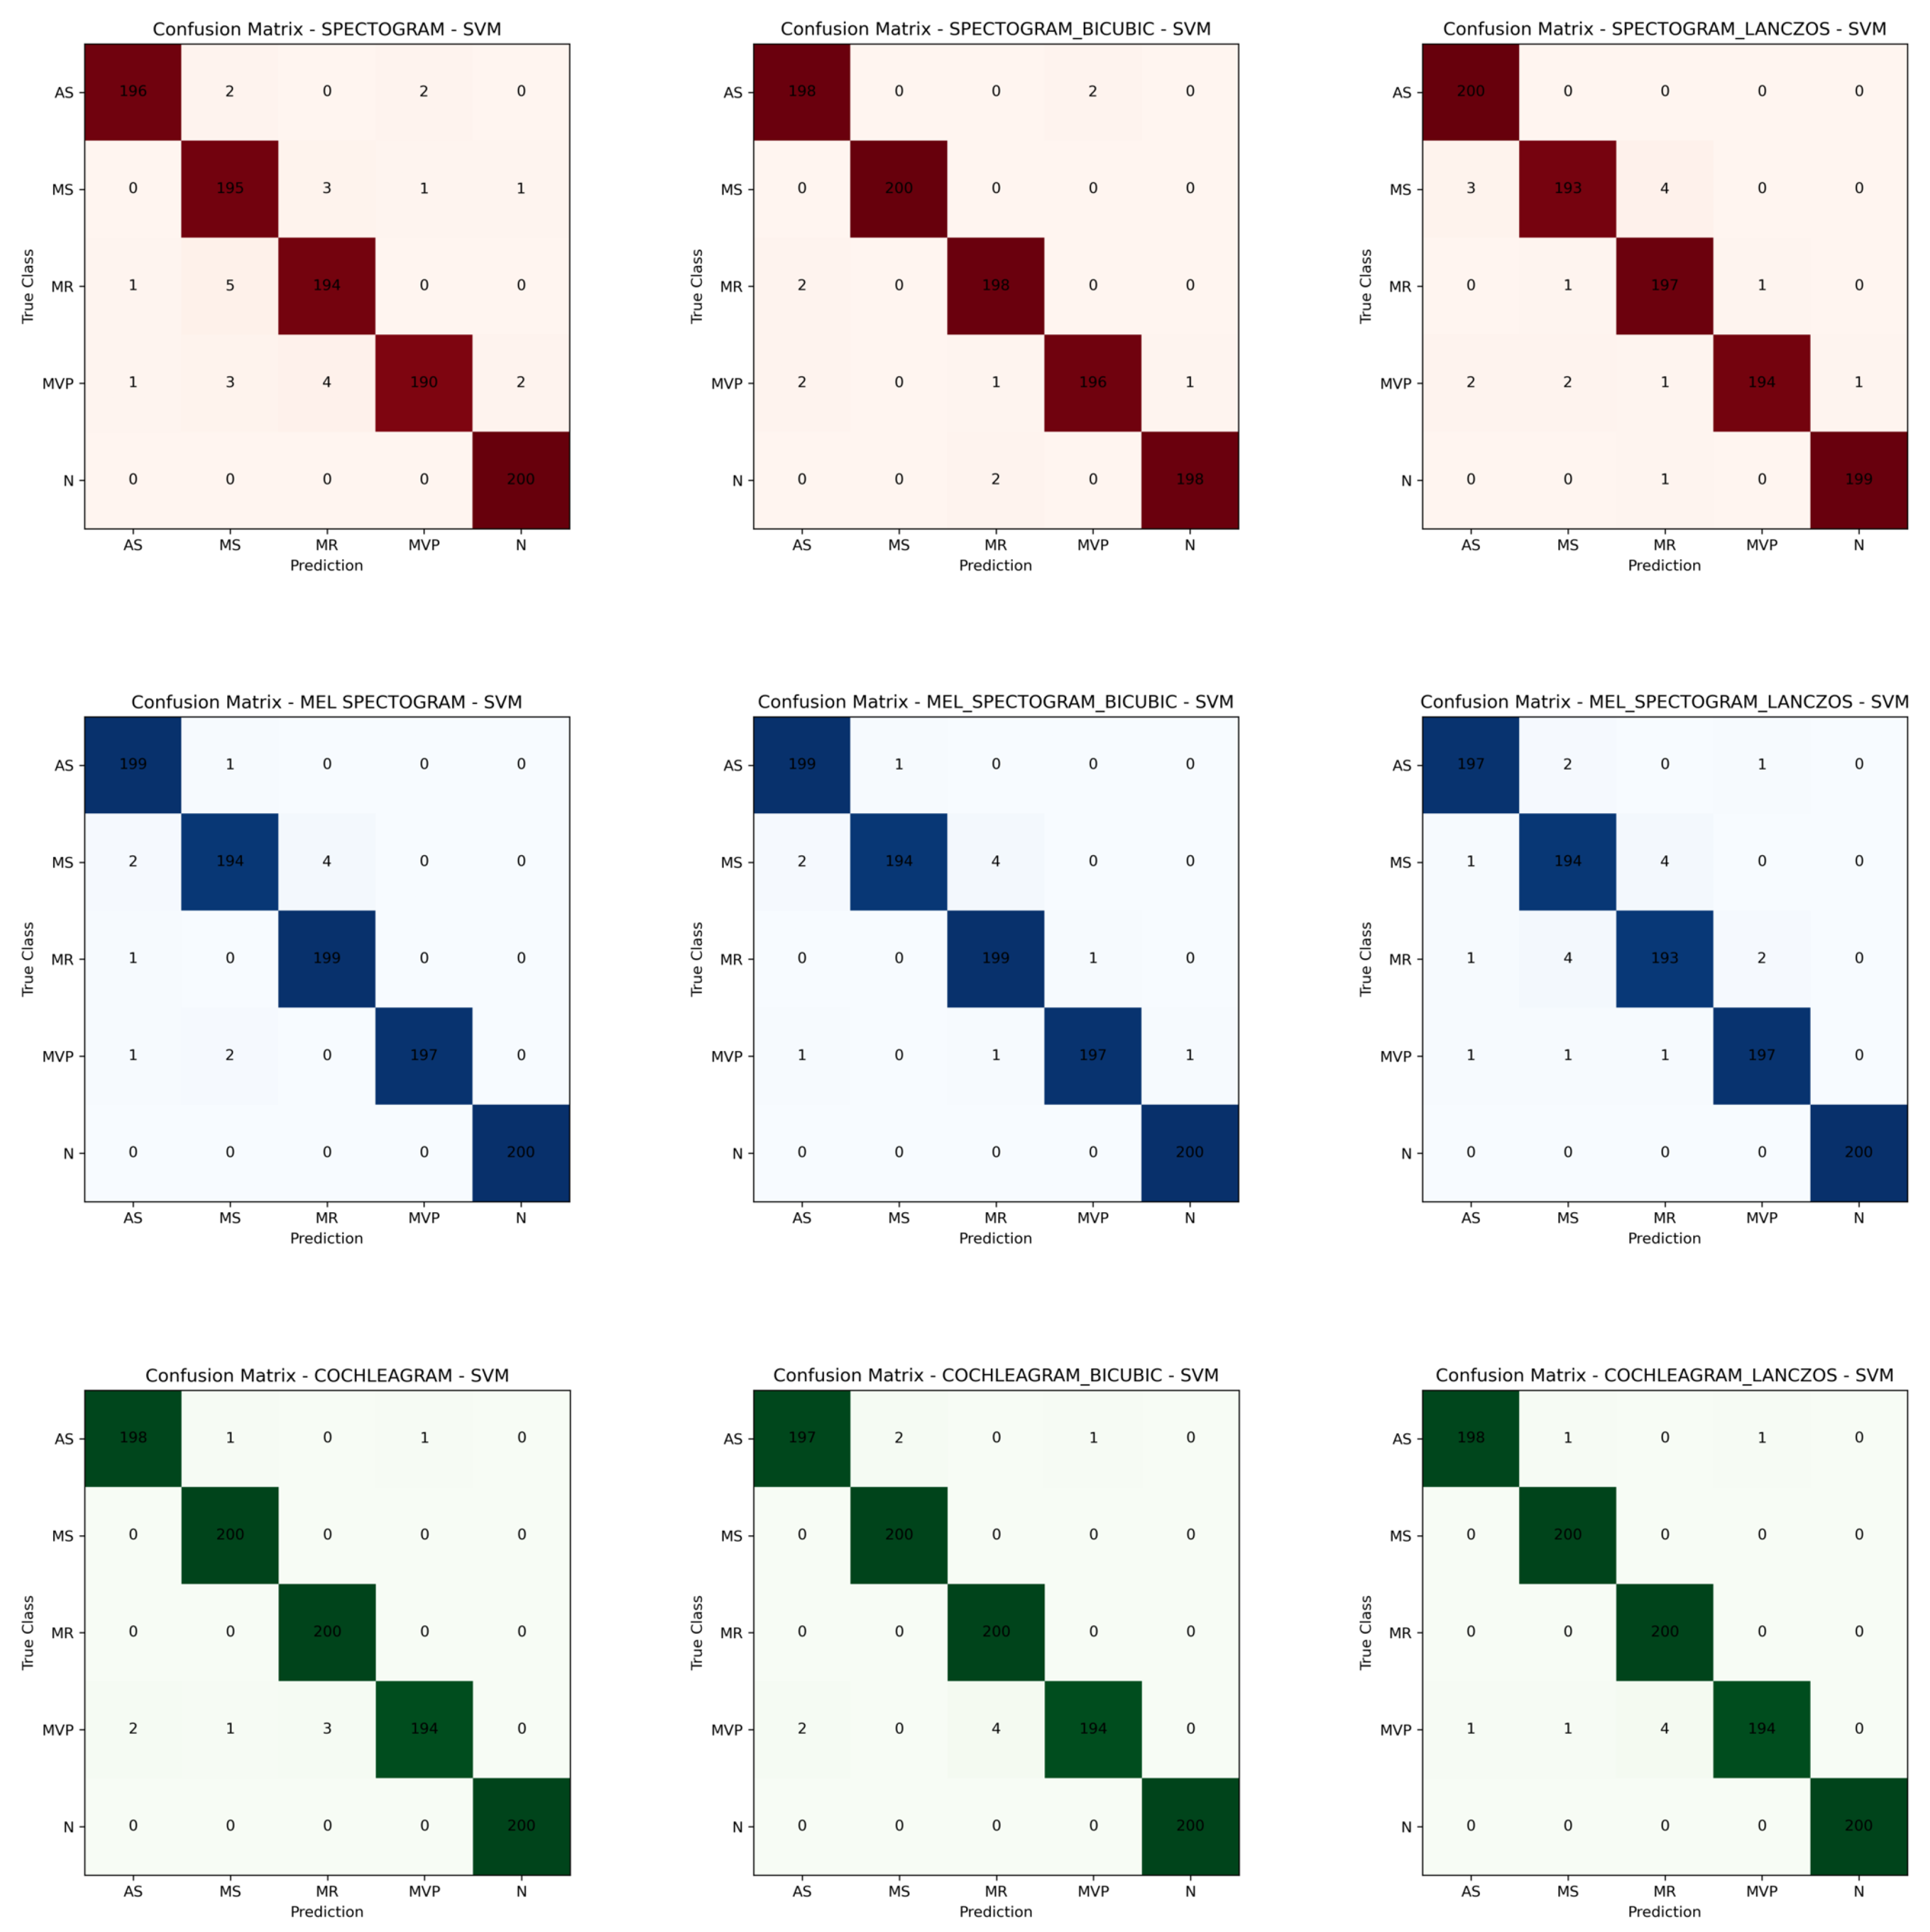
| Valve Heart Disease | Files (wav.) amount | Sample Frequency (Hz) |
|---|---|---|
| Aortic Stenosis (AS) | 200 | 8000 |
| Mitral Regurgitation (MR) | 200 | 8000 |
| Mitral Stenosis (MS) | 200 | 8000 |
| Mitral Valve Prolapse (MVP) | 200 | 8000 |
| Normal (N) | 200 | 8000 |
| TFRs | Resize technique | Confirmed | Tentative | Rejected |
|---|---|---|---|---|
| Spectogram | - | 1028 | 272 | 2796 |
| Spectogram | Bicubic | 1031 | 154 | 2911 |
| Spectogram | Lanczos | 959 | 198 | 2939 |
| Mel-spectogram | - | 1007 | 394 | 2695 |
| Mel-spectogram | Bicubic | 936 | 337 | 2823 |
| Mel-spectogram | Lanczos | 980 | 300 | 2816 |
| Cochleagram | - | 1130 | 400 | 2566 |
| Cochleagram | Bicubic | 1142 | 398 | 2556 |
| Cochleagram | Lanczos | 1124 | 410 | 2562 |
| Methods/Algorithm | Performances (%) for confirmed features | ||||
|---|---|---|---|---|---|
| Pre | Rec | F1 | MCC | Acc | |
| Spec/DT | 86.36 | 86.30 | 86.31 | 82.88 | 86.20 |
| Spec/KNN | 96.71 | 96.70 | 96.70 | 95.87 | 96.70 |
| Spec/RF | 94.95 | 94.90 | 94.88 | 93.64 | 94.90 |
| Spec/SVM | 97.51 | 97.50 | 97.49 | 96.88 | 97.50 |
| Mel/DT | 91.50 | 91.50 | 91.47 | 89.39 | 91.50 |
| Mel/KNN | 97.95 | 97.90 | 97.89 | 97.39 | 97.90 |
| Mel/RF | 95.55 | 95.55 | 95.47 | 94.40 | 95.50 |
| Mel/SVM | 98.90 | 98.90 | 98.89 | 98.62 | 98.90 |
| Coch/DT | 91.04 | 91.00 | 91.01 | 88.75 | 91.00 |
| Coch/KNN | 98.61 | 98.60 | 98.59 | 98.25 | 98.60 |
| Coch/RF | 97.52 | 97.50 | 97.49 | 96.88 | 97.50 |
| Coch/SVM | 99.20 | 99.20 | 99.19 | 99.00 | 99.20 |
| Methods/Algorithm | Performances (%) for confirmed features | ||||
|---|---|---|---|---|---|
| Pre | Rec | F1 | MCC | Acc | |
| Spec+Bic/DT | 91.59 | 91.60 | 91.59 | 89.50 | 91.60 |
| Spec+Bic/KNN | 98.90 | 98.90 | 98.89 | 98.62 | 98.90 |
| Spec+Bic/RF | 97.80 | 97.80 | 97.79 | 97.25 | 97.80 |
| Spec+Bic/SVM | 99.00 | 99.00 | 99.00 | 98.75 | 99.00 |
| Mel+Bic/DT | 93.83 | 93.70 | 93.72 | 92.14 | 93.70 |
| Mel+Bic/KNN | 99.30 | 99.30 | 99.29 | 99.12 | 99.30 |
| Mel+Bic/RF | 97.39 | 97.40 | 97.39 | 96.75 | 97.40 |
| Mel+Bic/SVM | 99.40 | 99.40 | 99.39 | 99.25 | 99.40 |
| Coch+Bic/DT | 91.81 | 91.80 | 91.80 | 89.75 | 91.80 |
| Coch+Bic/KNN | 98.51 | 98.50 | 98.49 | 98.13 | 98.50 |
| Coch+Bic/RF | 97.40 | 97.40 | 97.39 | 96.75 | 97.40 |
| Coch+Bic/SVM | 99.10 | 99.10 | 99.09 | 99.00 | 99.10 |
| Methods/Algorithm | Performances (%) for confirmed features | ||||
|---|---|---|---|---|---|
| Pre | Rec | F1 | MCC | Acc | |
| Spec+Lz/DT | 85.55 | 85.60 | 85.56 | 82.00 | 85.60 |
| Spec+Lz/KNN | 96.80 | 96.80 | 96.79 | 96.00 | 96.80 |
| Spec+Lz/RF | 95.09 | 95.10 | 95.06 | 93.88 | 95.10 |
| Spec+Lz/SVM | 98.31 | 98.30 | 98.29 | 97.87 | 98.30 |
| Mel+Lz/DT | 88.98 | 88.91 | 88.9 | 86.13 | 88.90 |
| Mel+Lz/KNN | 97.40 | 97.40 | 97.41 | 96.75 | 97.40 |
| Mel+Lz/RF | 95.48 | 95.50 | 95.48 | 94.37 | 95.50 |
| Mel+Lz/SVM | 98.20 | 98.20 | 98.19 | 97.75 | 98.20 |
| Coch+Lz/DT | 90.77 | 90.60 | 90.64 | 88.27 | 90.60 |
| Coch+Lz/KNN | 98.52 | 98.50 | 98.49 | 98.13 | 98.50 |
| Coch+Lz/RF | 97.31 | 97.30 | 97.29 | 96.63 | 97.30 |
| Coch+Lz/SVM | 99.20 | 99.20 | 99.19 | 99.00 | 99.20 |
Disclaimer/Publisher’s Note: The statements, opinions and data contained in all publications are solely those of the individual author(s) and contributor(s) and not of MDPI and/or the editor(s). MDPI and/or the editor(s) disclaim responsibility for any injury to people or property resulting from any ideas, methods, instructions or products referred to in the content. |
© 2024 by the authors. Licensee MDPI, Basel, Switzerland. This article is an open access article distributed under the terms and conditions of the Creative Commons Attribution (CC BY) license (http://creativecommons.org/licenses/by/4.0/).


