1. Introduction
Since passion fruit (
Passiflora edulis) has significant edible, medicinal, and ornamental value, it is widely grown in tropical and subtropical regions worldwide. Many consumers relish its egg-shaped fruit due to its unique flavor, rich aroma, acid pulp, and yellow juice [
1]. Owing to the abundance of alkaloids, flavonoids, and other physiologically active components found in passion fruit, and extracts derived from its leaves, fruits, peels, and seeds have therapeutic properties that include anti-inflammatory, soothing, antioxidant, and anticancer characteristics [
2]. Because most passion fruit varieties have large floral organs, bright coronal filaments, a rich fragrance, and lush branches and leaves, they are used as ornamental plants for flower racks due to their ornamental value [
3]. Identifying and characterizing important gene families in passion fruit might help boost the growth of the world's agricultural economy.
Transcription factors (TFs) are major elements of the genetic foundation for phenotypic evolution. TCP proteins (TCPs) are a class of plant-specific TFs, that was first identified and designated as
TEOSINTE BRANCHED 1 (
TB1) in
Zea mays [
4],
PROLIFERATING CELL FACTORS 1 and
2 (
PCF1 and
PCF2) in rice [
5],
CYCLOIDEA (
CYC) in
Antirrhinum majus [
6]. TCP domains are defined by an atypical 59-amino acid basic helix-loop-helix motif structural feature and are not related to the DNA-binding bHLH domain. Based on TCP domains, this class of proteins is partitioned into Class I (TCP-P or PCF type) and Class II (TCP-C type) [
7]. Class I is distinguished by a four-amino-acid deletion which is a conserved feature. Class II is further divided into CIN clade and CYC clade [
8]. Two duplication events in the CYC clade among the main eudicots led to three subgroups designated as CYC1, 2, and 3 [
9]. The accumulated evidence of research suggested that TCP genes were implicated in many growth-related mechanisms including axillary meristem development, flower and leaf morphology, circadian rhythm regulation, hormone signaling, seed germination, and defense [
10,
11].
Plants are subjected to adverse environmental conditions constantly. A correlation between TCPs and plant response to abiotic stresses has been discovered by researchers [
12]. Knock-down of two rice TCP genes
OsPCF5 and
OsPCF8 resulted in enhanced tolerance to cold stress after chilling treatment [
13]. Still, the other two
TCPs, OsPCF6 and
OsTCP21 exhibited significant cold-induced expression and their knockdown plants exhibited enhanced cold tolerance compared to wild-type plants due to amended reactive oxygen species scavenging [
14].
PCF6 expression in sugarcane seedlings exposed to cold stress for 24 hours was reduced to 50 percent [
15]. Similarly, cassava
TCP gene
MeTCP3a and
MeTCP4 expressions were reduced after their seedlings were treated with 4
0C cold stress [
16]. In transgenic creeping bentgrass four members of the TCP gene family namely
AsPCF5/6/
8/
14 exhibited expressional depression in conjunction with the increased salt and drought tolerance linked with enhanced water retention and leaf wax contents [
17]. Contrarily, overexpression of the rice
OsTCP19 resulted in abnormal development including reduced formation of lateral roots and enhanced abiotic stress tolerance [
18].
ZmTCP14 overexpression under drought conditions led to a significant reduction of drought tolerance, while gene-edited lines of
ZmTCP14 demonstrated enhanced drought tolerance, suggesting it acts as a negative regulator of drought stress [
19].
TCP10 from
Moso bamboo exhibited induced expressions under drought stress and its overexpression in rice and
Arabidopsis enhanced drought tolerance in transgenic plants [
20].
Owing to the development of genome sequencing technologies
TCP gene families have been studied in various modal organisms of agro-botanical importance like cultivated rye [
21], switchgrass [
22], potato [
23], and
Arabidopsis [
24]. As of right now, the passion fruit genome sequence has been made public [
16,
25,
26] offering valuable genome resources for the discovery of related genes. In this work, the genomic and transcriptomic data of diploid passion fruit were utilized to identify the sequences of the TCP TFs family of
P. edulis using bioinformatics techniques and to investigate the function of TCP family genes in response to cold stress. To our knowledge, this is the first report, herein we performed identification of the TCP gene family members in passion fruit through a genome-wide survey, estimated their evolutionary interrelationships, and analyzed their functions employing publicly available RNA-seq datasets in compliance with abiotic stresses and expressional validation of few promising candidate genes. These candidate genes will serve as raw materials for further molecular characterization and stress breeding of passion fruit.
2. Results
2.1. Identification and Phylogeny of TCP Proteins in Passion Fruit
A total of 30
PeTCP genes that encode TCP proteins were identified in the yellow passionfruit genome. The genes were renamed from PeTCP1 to PeTCP30 based on their ascending order of chromosomal locations (
Table 1). Furthermore, 10 and 24
PeTCP genes were identified from GWHAZTM00000000 (Purple type) and GWHANWG00000000 genome assemblies respectively (
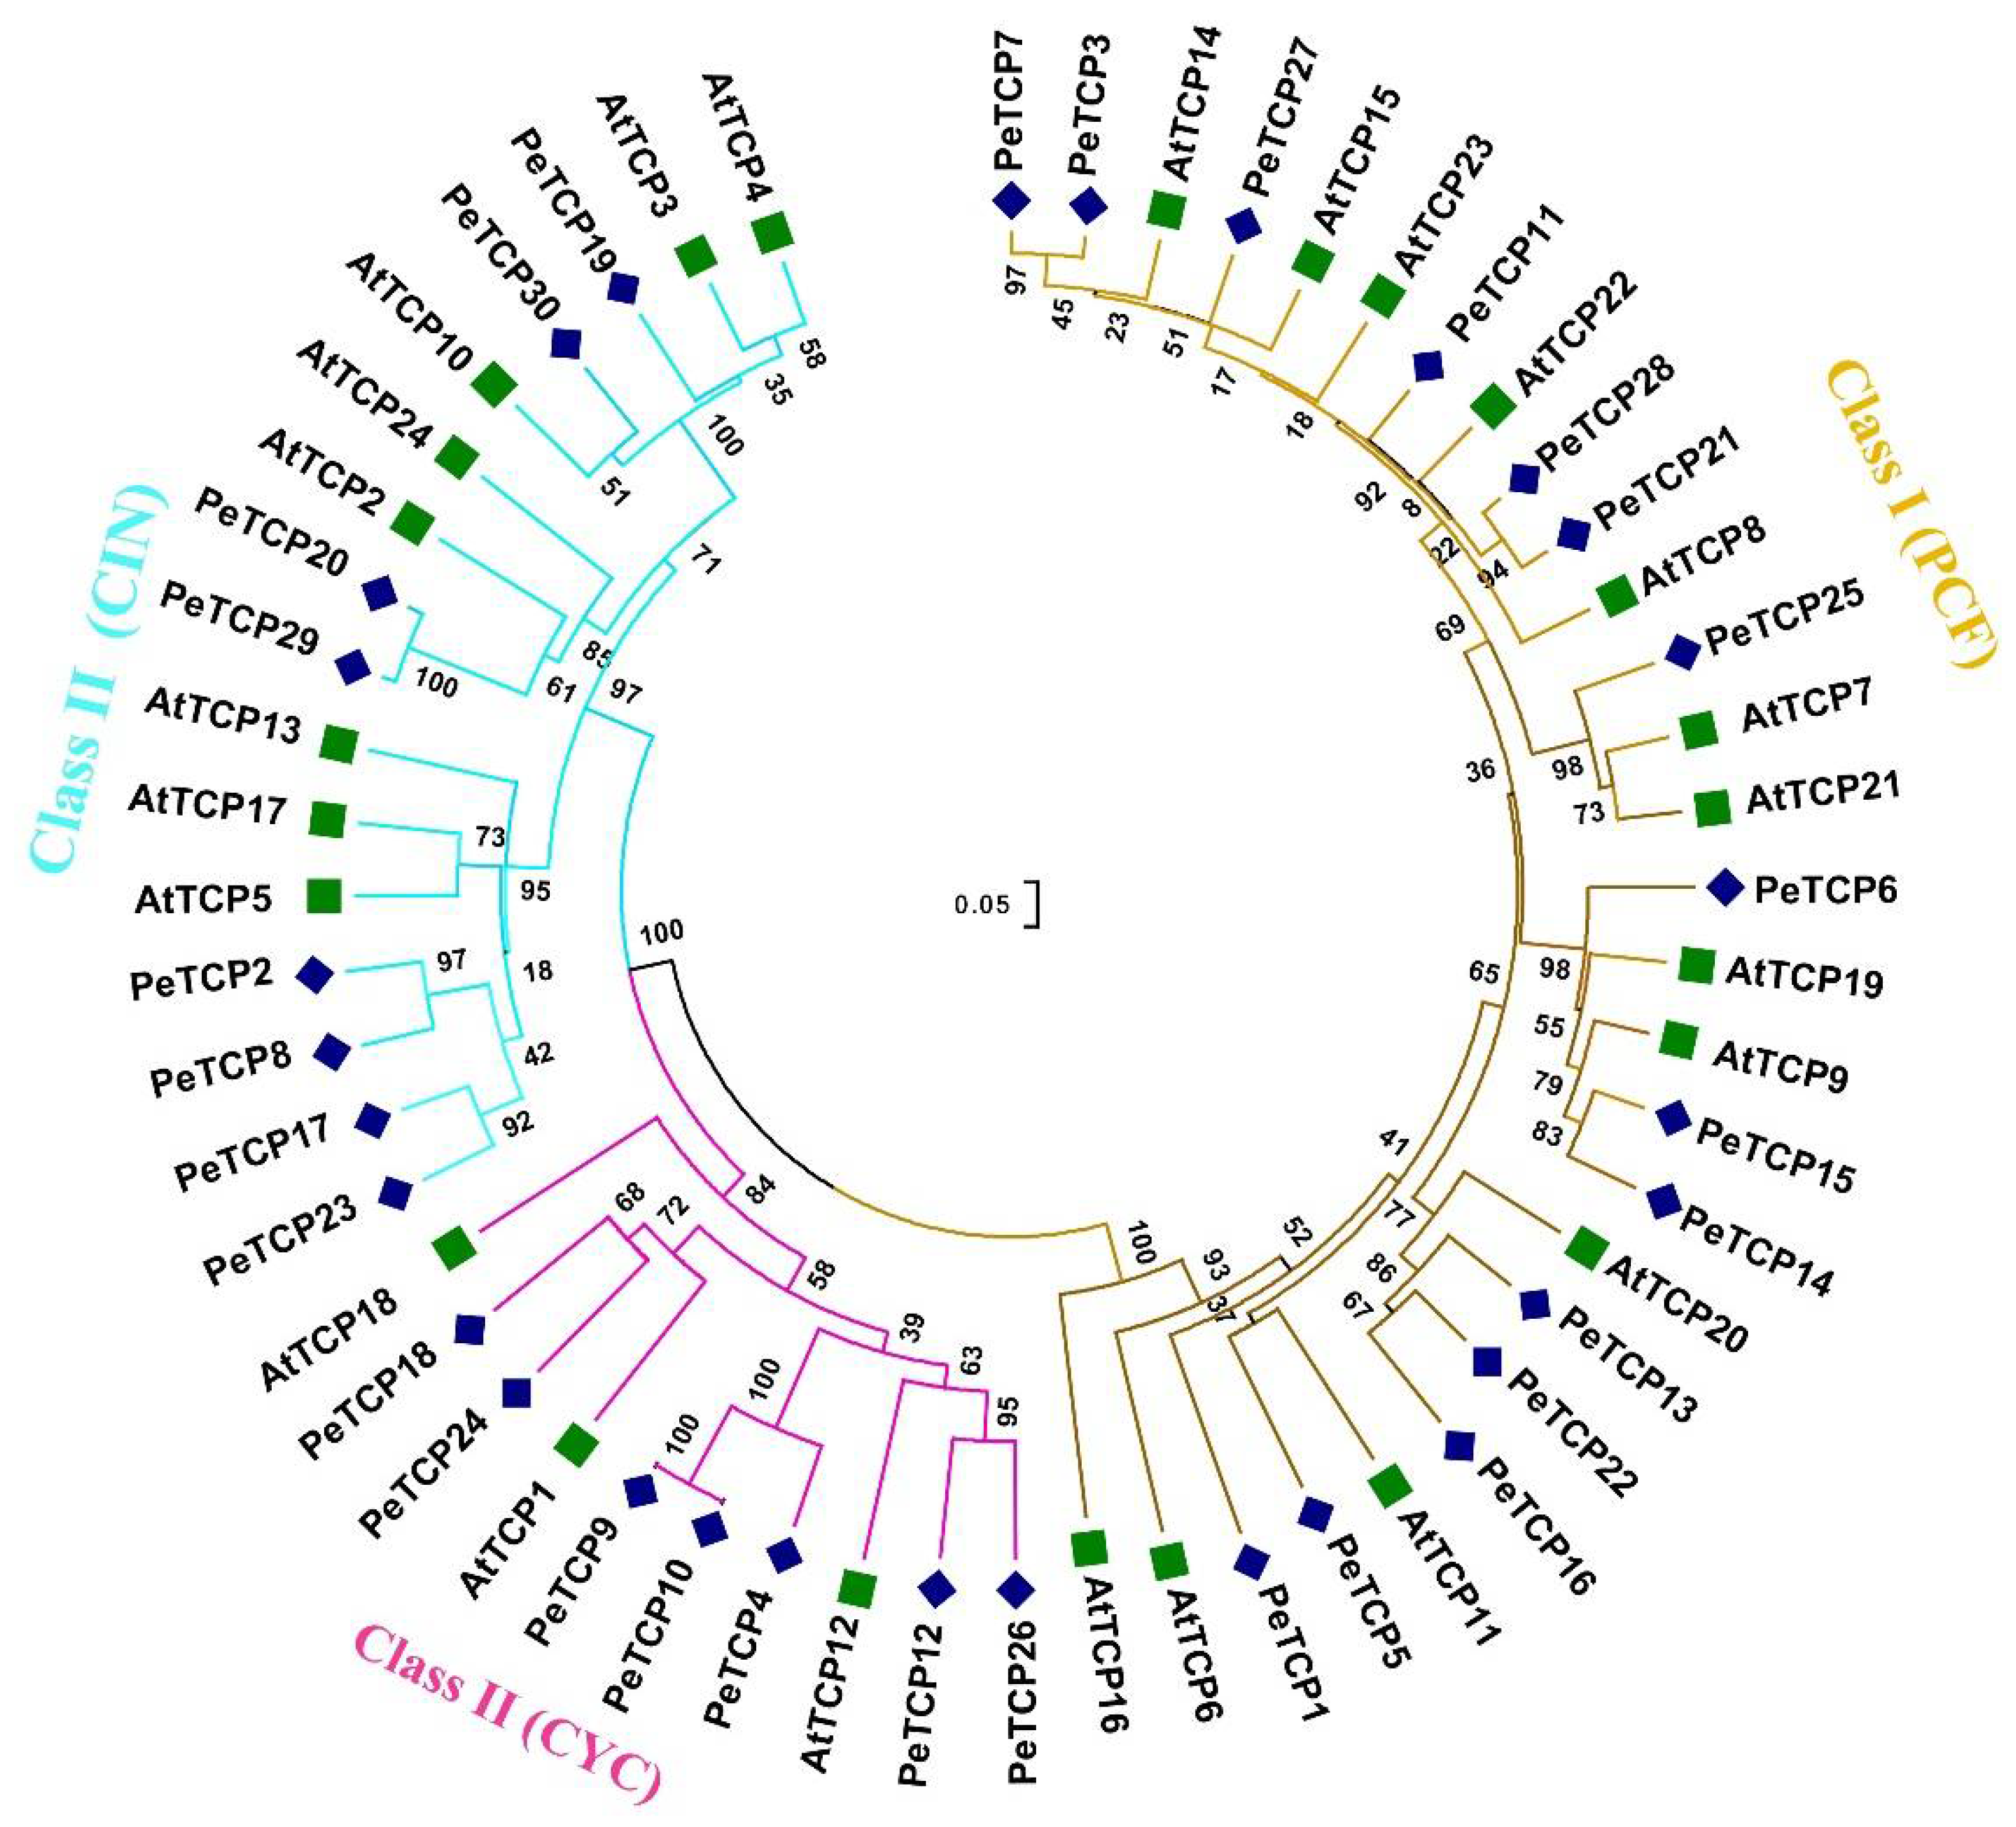
Table S1). To study how all identified 30 TCP proteins are related to each other neighbor-joining phylogenetic tree was constructed along with 24 TCPs of
Arabidopsis (
Figure 1). Passionfruit TCP members were classified into two classes and three subfamilies. Among passion fruit TCP proteins 15 were Class (I) members of the PCF subfamily. The rest of the fifteen PeTCPs of Class (II) were distributed into CIN and CYC subfamilies having eight and seven proteins respectively.
Additionally, we calculated the physiochemical properties of 30 TCP proteins (
Table 1). The amino acids in the proteins encoded by the 30 TCP genes ranged from 164 (PeTCP1) to 759 (PeTCP16), while their molecular weights (MW) varied from 17985.36 Da (PeTCP1) to 83909.83 Da (PeTCP16). Protein isoelectric points (pI) were predicted ranging from 5.61 (PeTCP6) to 8.86 (PeTCP10). Proteins' thermal stability varied little among TCP proteins, with the aliphatic amino index (A.I.) revealing it ranged from 52.83 (PeTCP28) to 86.96 (PeTCP16). All of the TCP proteins had a negative grand average of hydropathicity score (GRAVY), suggesting that they are primarily hydrophilic. Finally, the subcellular localization prediction analysis revealed that except for membrane-localized PeTCP6/15/16 and cytoplasm-localized PeTCP1/3/13/23/26, the rest of TCP proteins were predicted to be localized in the nucleus.
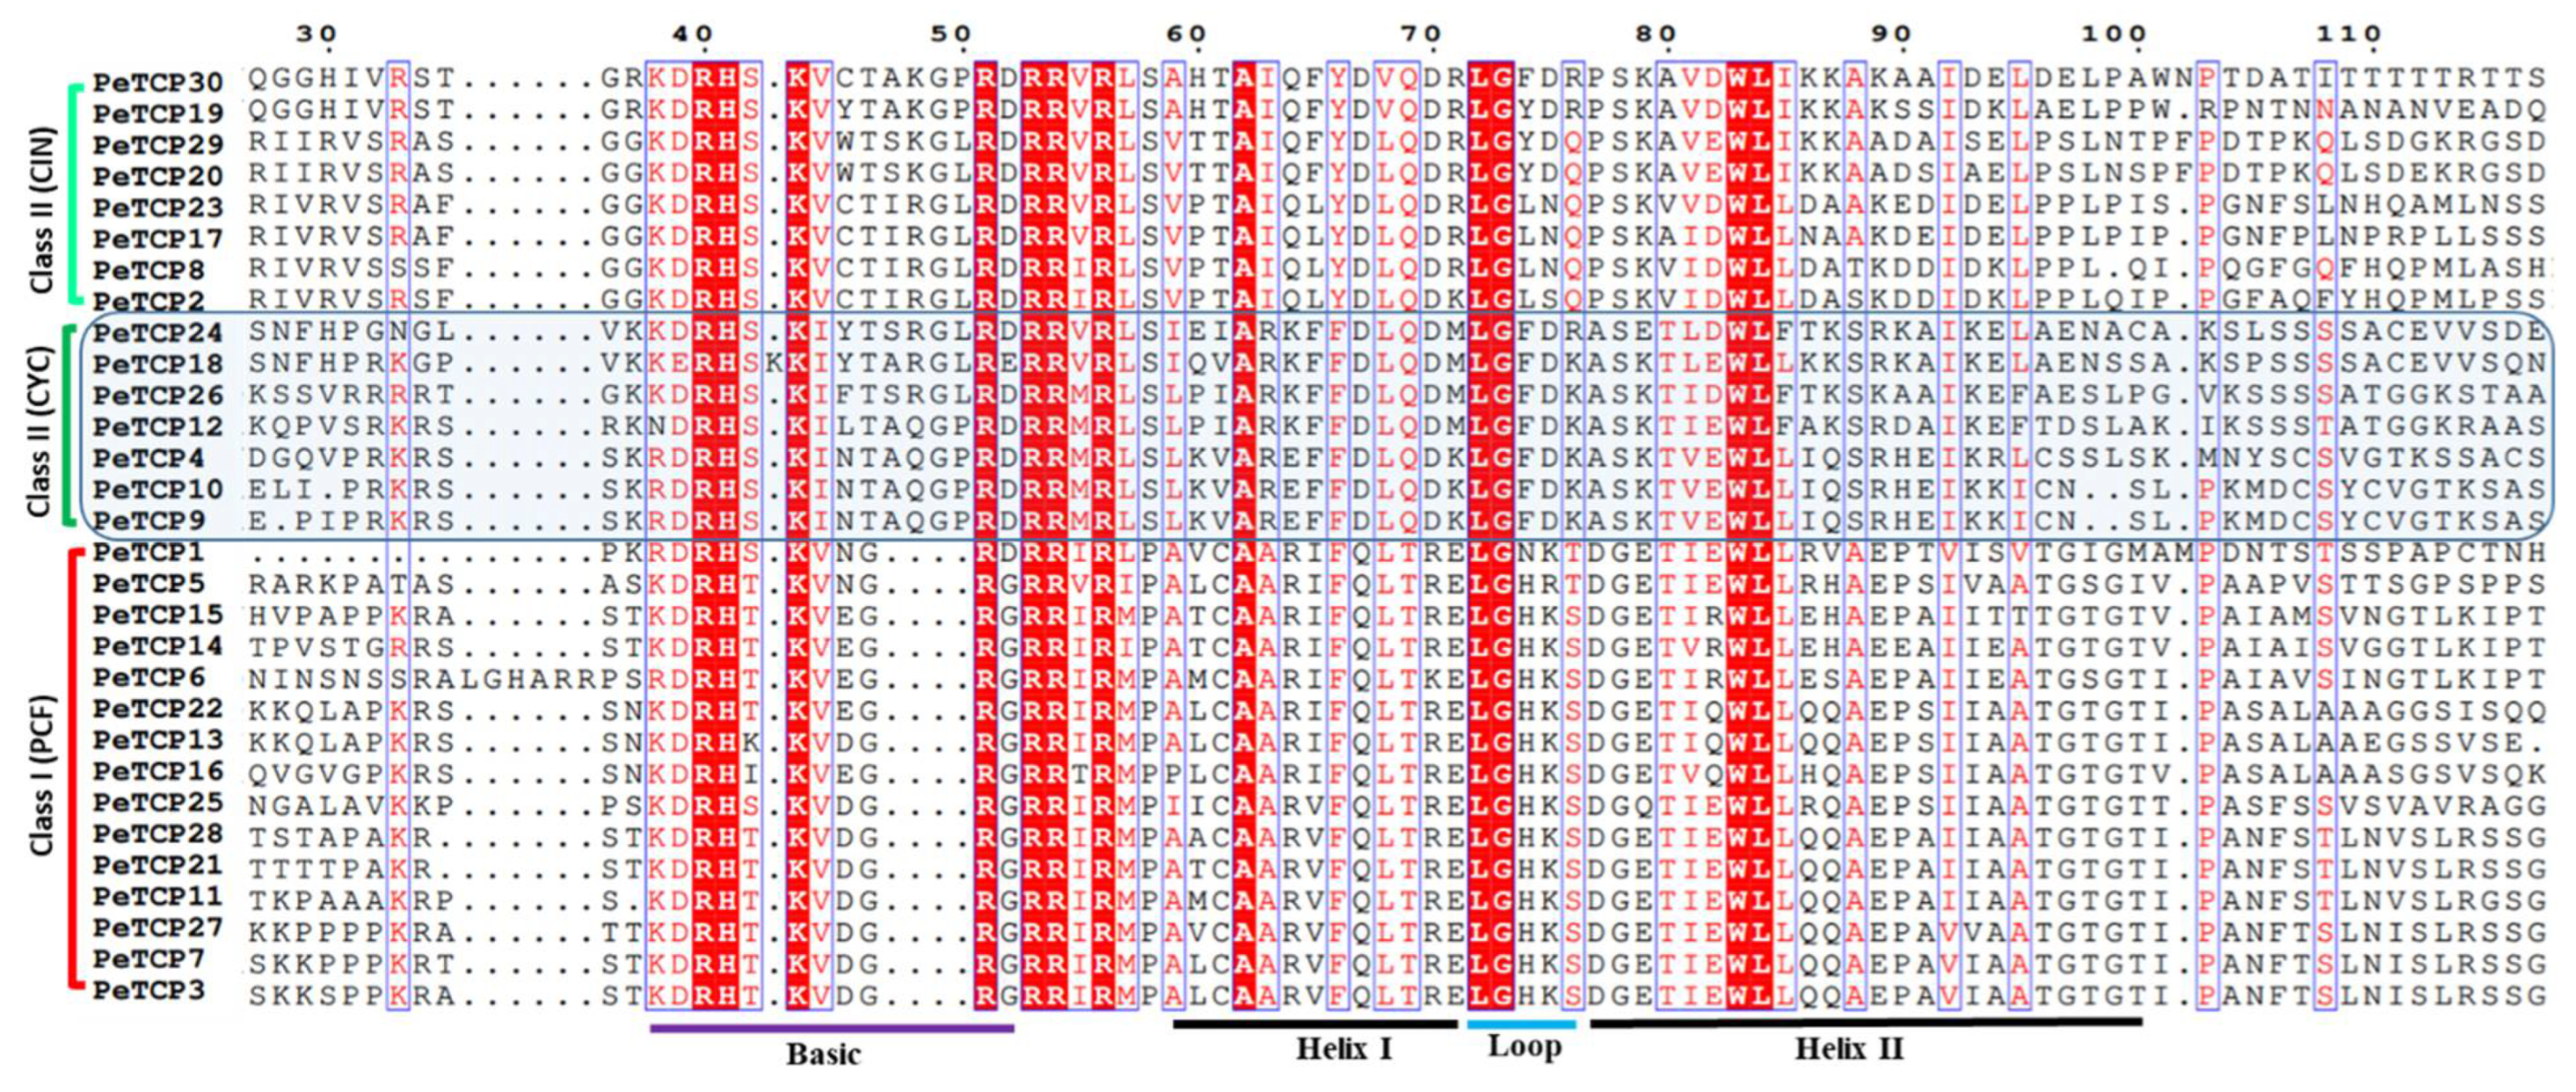
After ascertaining the phylogenetic classification and distribution of TCP proteins in above mentioned three subfamilies we performed the multiple sequence alignment (MSA) of bHLH domains in MEGA-11 software and depicted it through the ESPript online server (
Figure 2). The results indicated that the characteristic 4 amino acid deletions in the basic region led to the diversification of PeTCP into two major phylogenetic classes.
2.2. Gene Structural Analysis and Domain Organization of PeTCP Genes
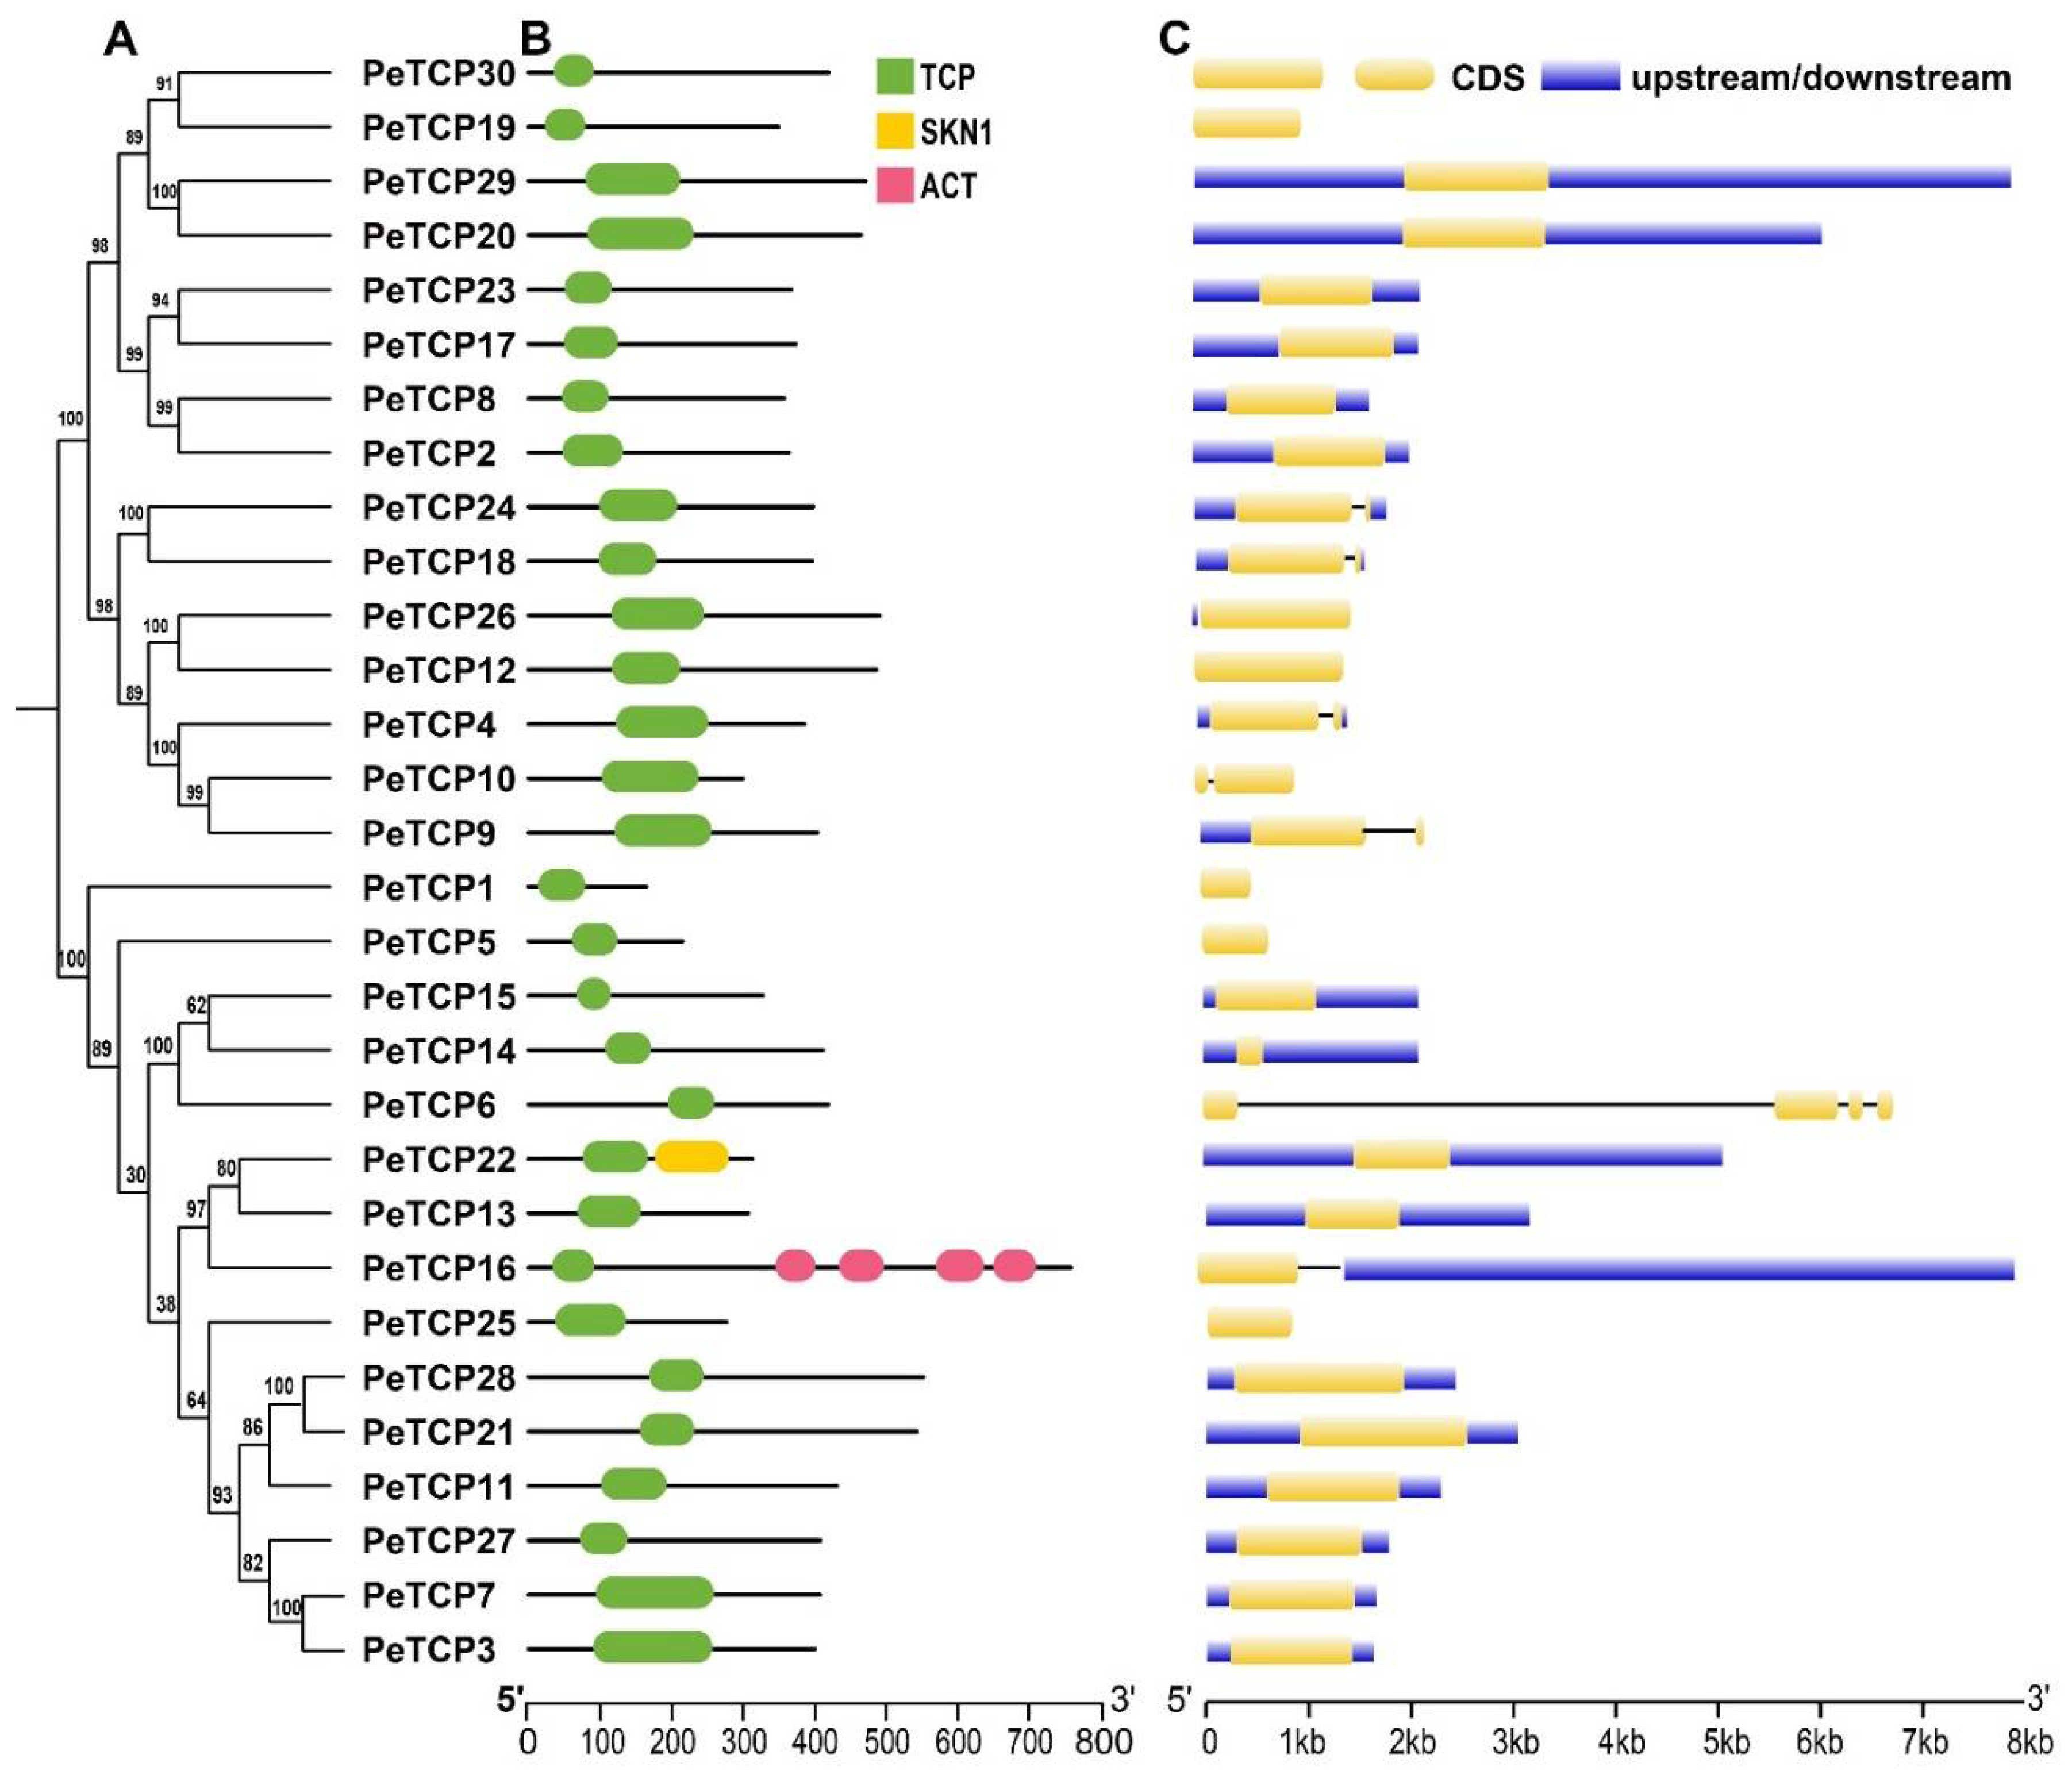
TCP gene family of passion fruit was examined for its conserved domain composition and gene structure features, and their phylogenetic connections were exhibited (Fig. 3 A, B, C). The domain analysis revealed all the TCP proteins possess only TCP domains however two members of Class (I) PeTCP22 and PeTCP16 contained additional domains called SKN1 and ACT respectively (Fig 3A). Gene structure organization depicted PeTCP6 had the highest number of exons (4), whereas five genes of CYC subfamily PeTCP4/9/10/18/24 possessed two exons each (Fig. 3B). The rest of PeTCPs contained only a single exon. Gene structures and domain composition of PeTCP genes clustered in the same subclasses are comparable, suggesting a strong correlation between gene structures and evolutionary relationships among PeTCPs.
2.3. Homology Modeling and 3D Structural Comparisons of PeTCP Proteins
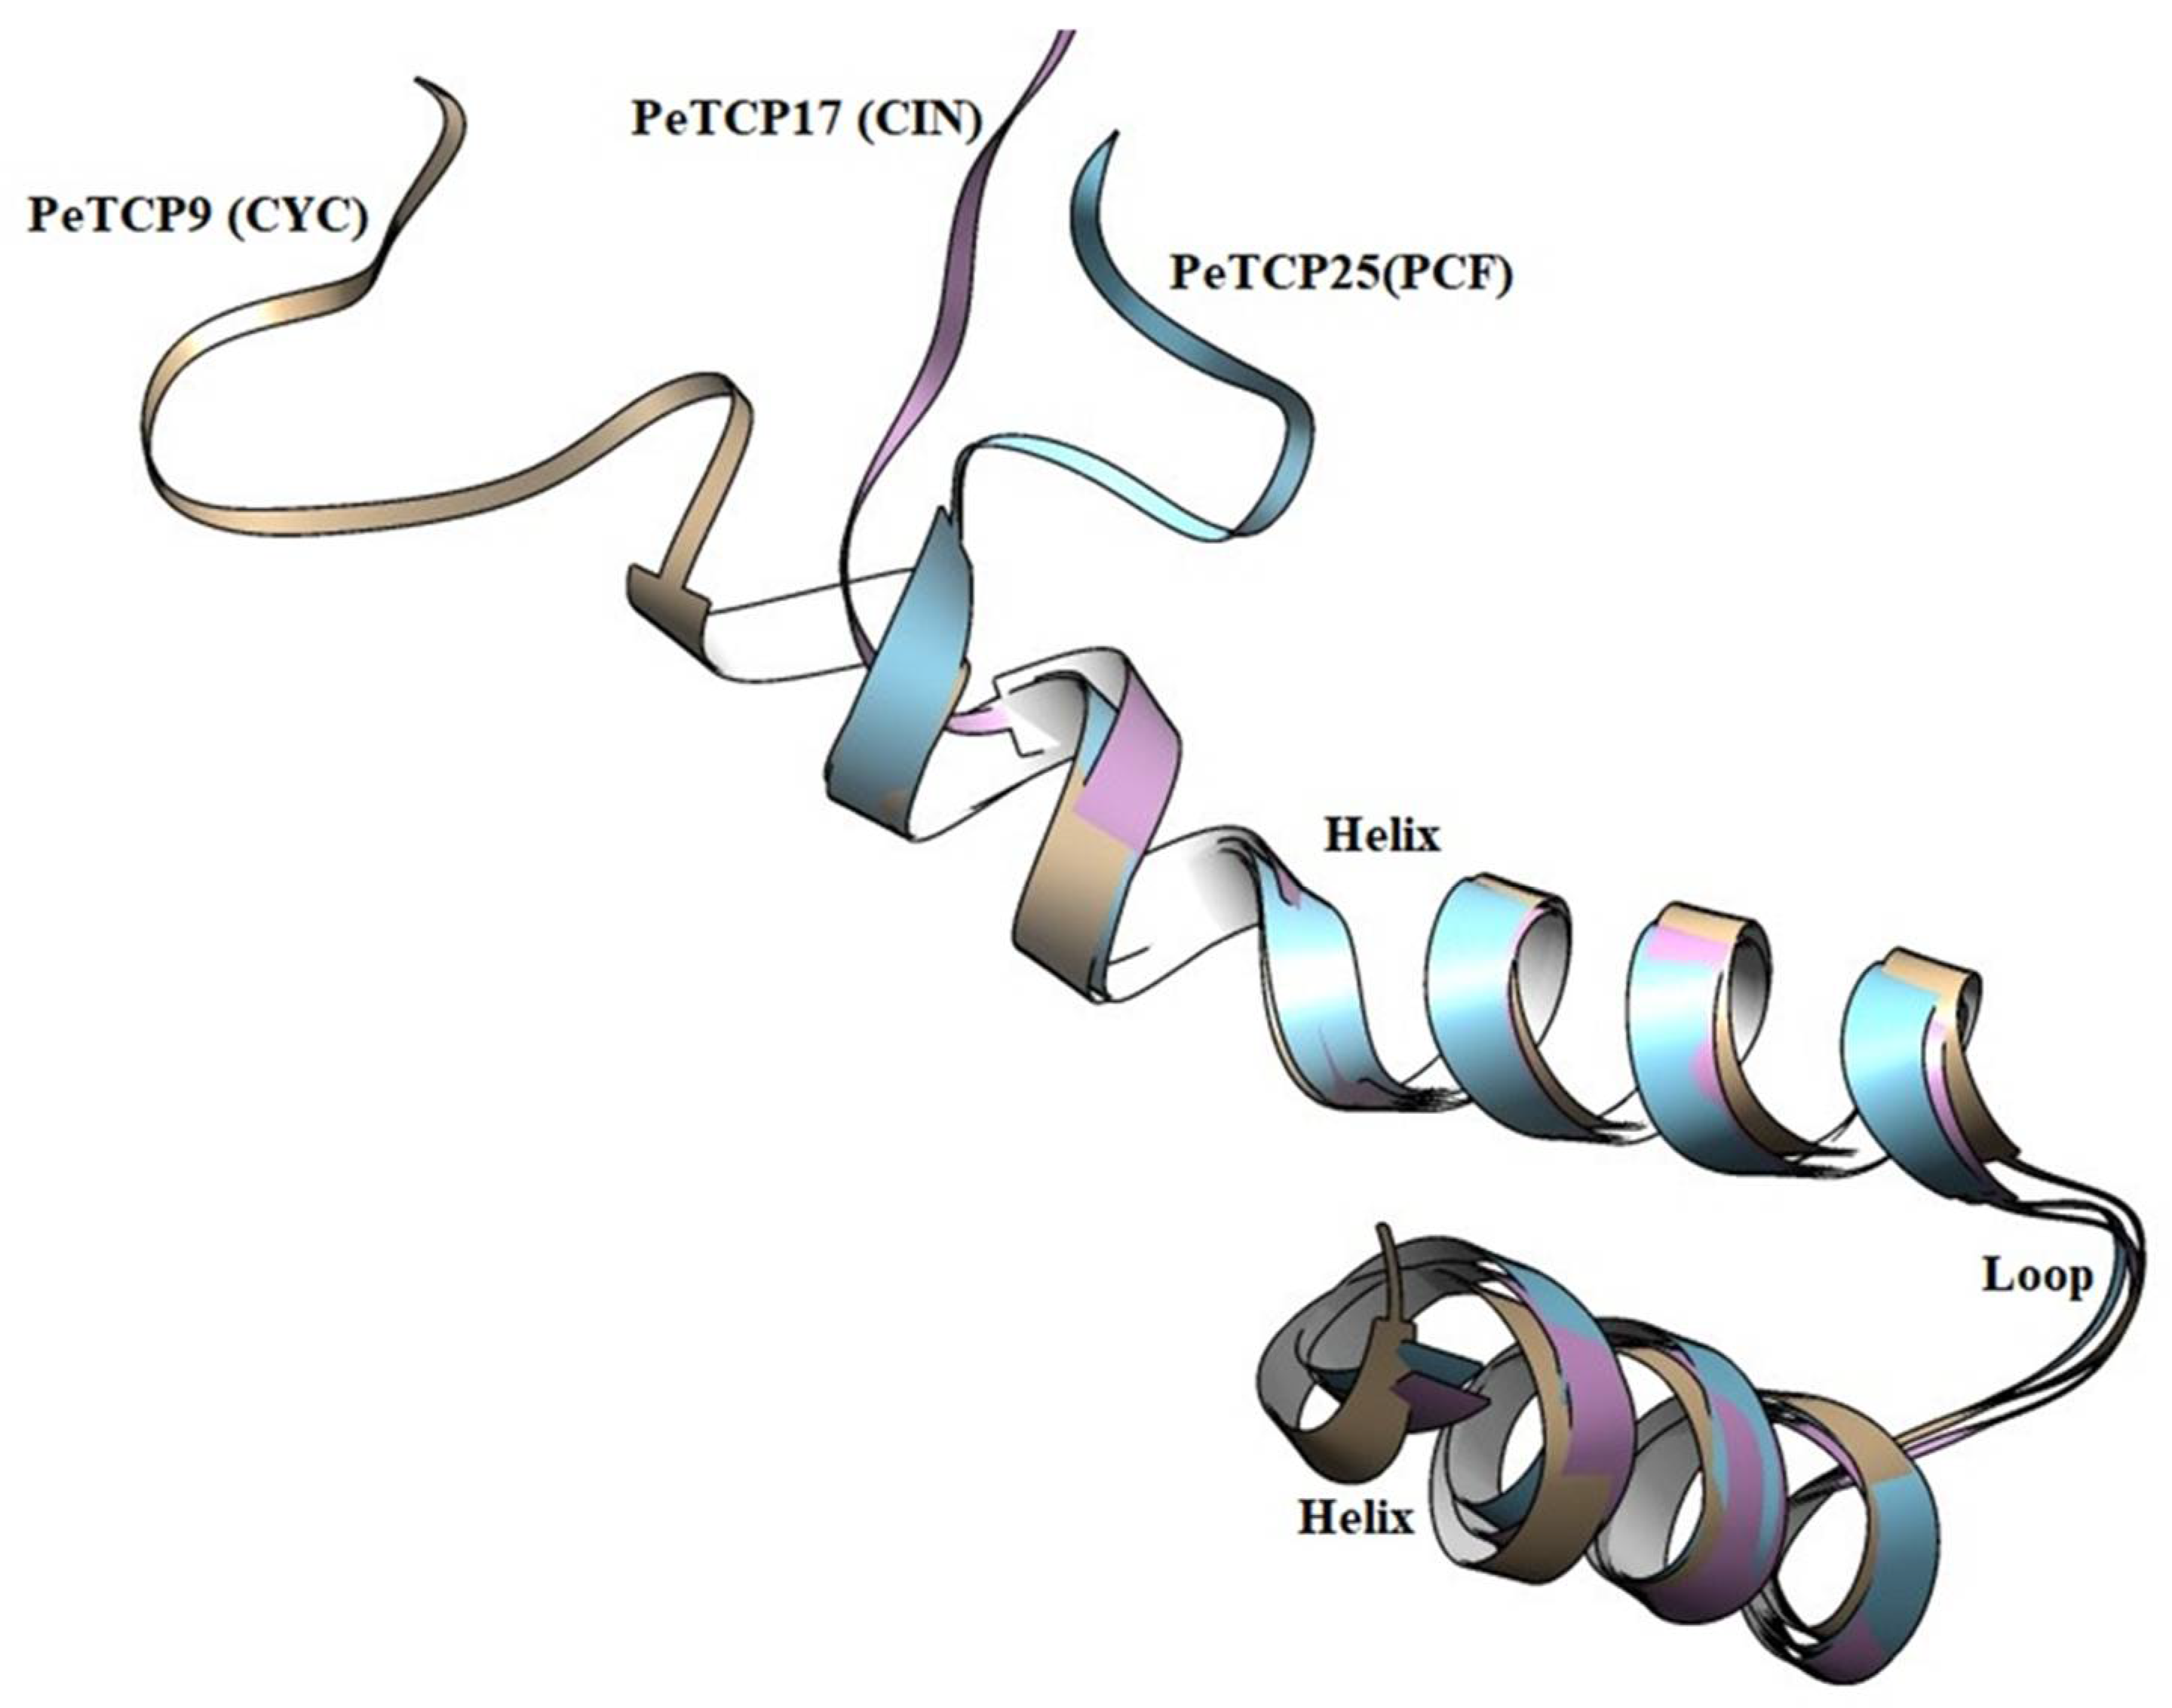
Structural examination of proteins has significant effects on comprehending their functions. We performed the homology modeling of PeTCP9 from CYC, PeTCP16 from CIN, and PeTCP25 from PCF subfamilies (
Figure 4). Each subfamily protein was made up of single chains, consisting of typical DNA binding 59 amino-acid basic helix-loop-helix motif. The first helix was small with 3 turns and highly similar in all three representative proteins along with the loop region suggesting this region is highly conserved. Contrarily the 2
nd helix exhibited structural differences such as PeTCP9 (CYC) had the longest alpha-helix with 7 turns while PeTCP25 (PCF) and PeTCP17 (CIN) possessed 6 and 5 turns respectively. These differences in 2
nd helix length might be attributed to the functional variation of these proteins either through homodimerization with other TCP proteins or DNA-binding. Taken together, these proteins' homology models offer a foundational framework for delving deeper into the molecular roles of TCP proteins.
2.4. Chromosomal Distributions and Gene Duplication Analysis of PeTCPs
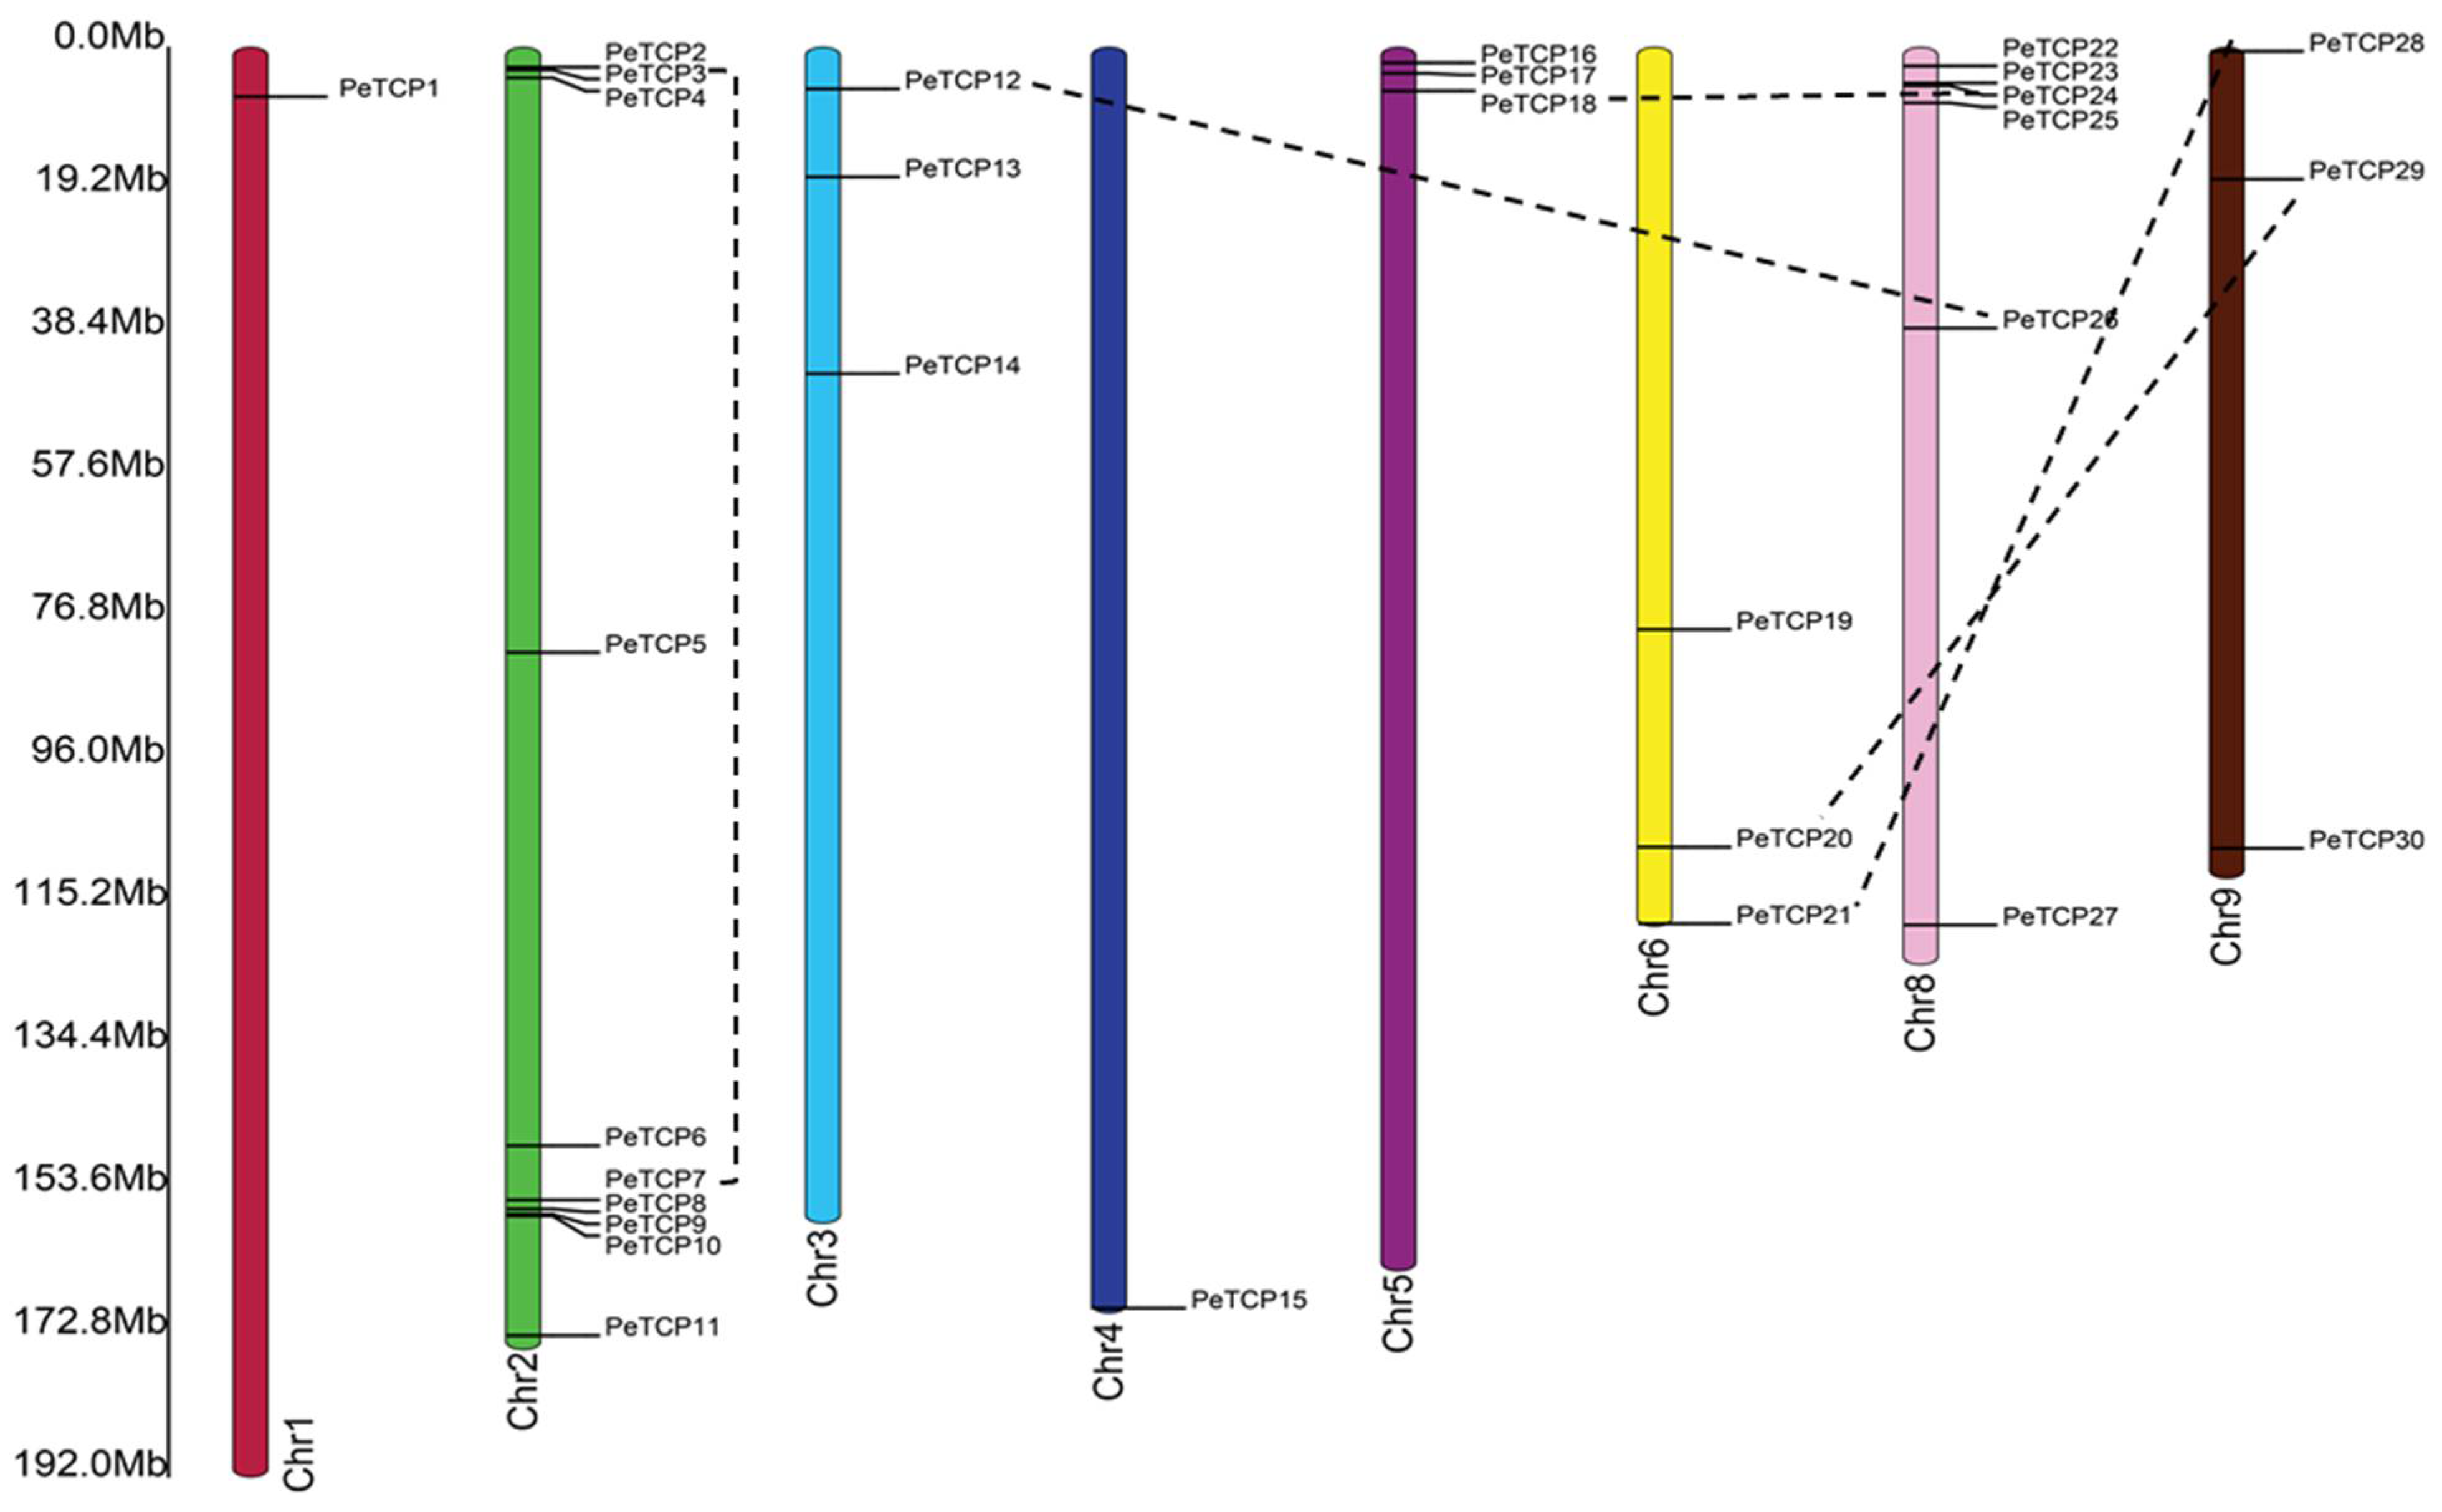
In principle, different gene duplication patterns are assumed as the driving forces for gene family formation and evolution of species. Among all nine passionfruit linkage groups the
PeTCPs were unevenly distributed (Fig. 5). Chromose 2 possessed the highest (10) number of
PeTCPs, followed by chromosome 8 which contained 6 genes. Chromosomes 3, 5, 6, and 9 each had 3
PeTCPs, while chromosomes 1 and 4 each possessed a single gene. Duplicated genes were determined through reciprocal BLAST approaches. The location of duplicated genes on different chromosomes implied that
PeTCPs might have arisen majorly through segmental gene duplications. Substitution ratio Ka/Ks has the functionality to describe evolutionary processes and the nature of selection or selection pressure, therefore we estimated the Ka/Ks ratios for all duplicated
PeTCPs gene pairs (
Table S2). Ka/Ks estimates indicated for all duplicated gene pairs the values were less than 1 which indicated that the TCP gene family might have experienced purifying selection during evolution. It's possible that the purifying selection was crucial in preserving the TCP genes' conserved structure over time.
2.5. Prediction of Cis-Regulatory Elements in PeTCP Promoters
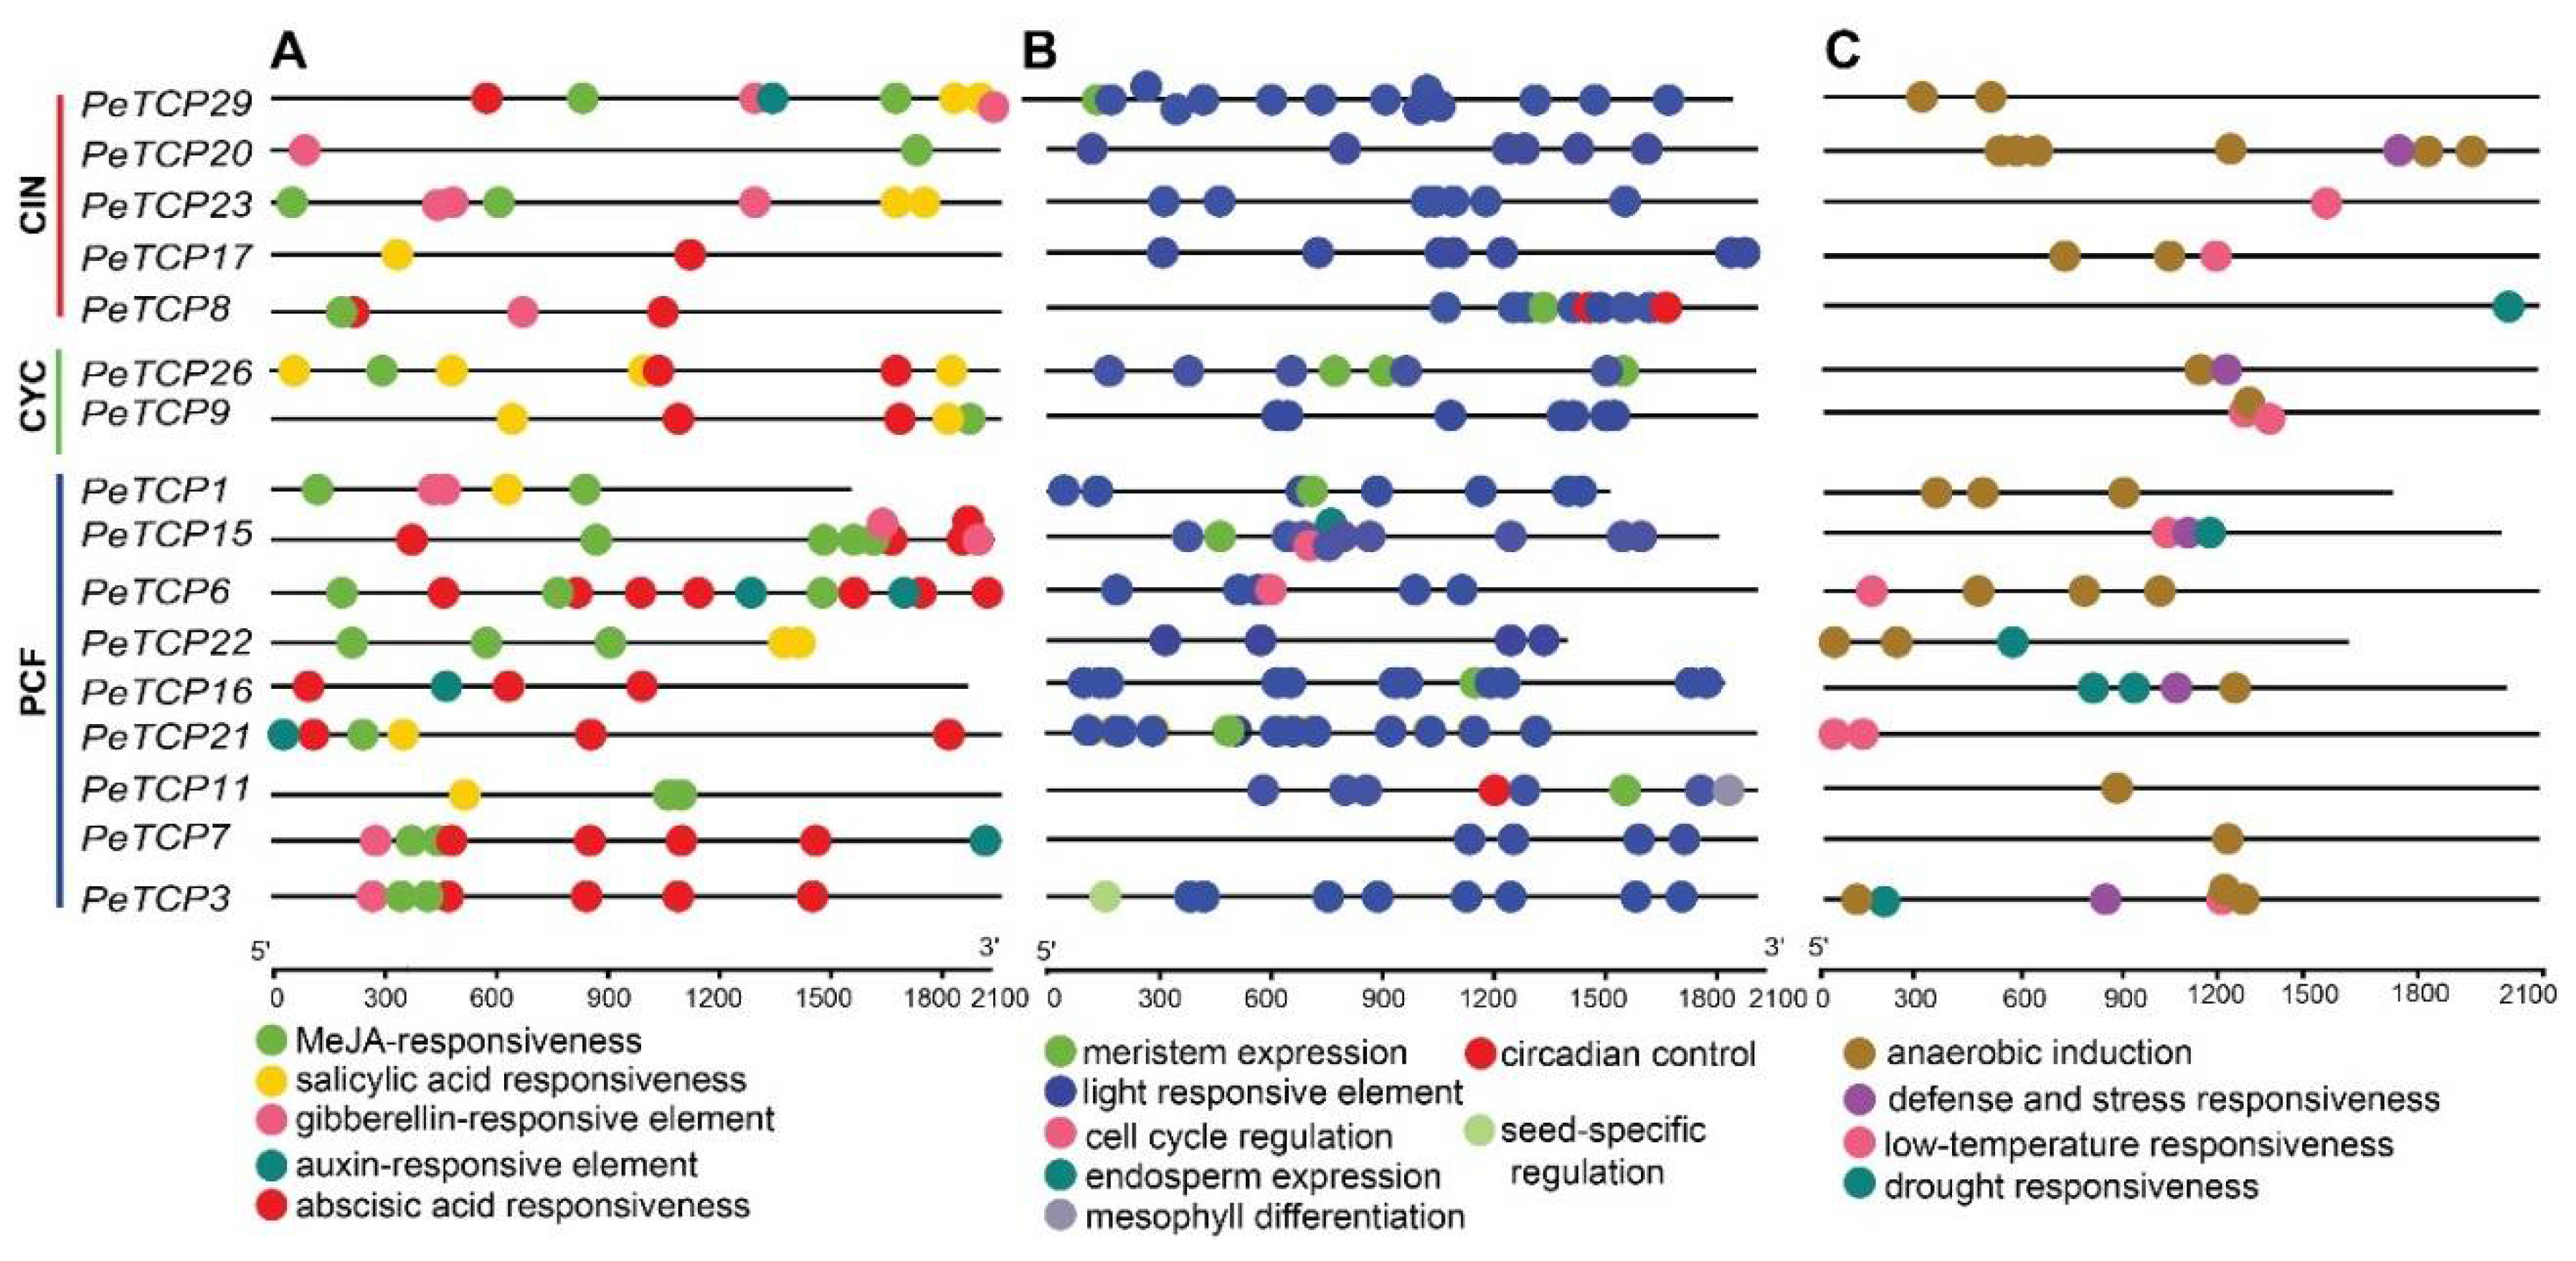
Probable roles of PeTCP genes with the phytohormone responses, growth and development, and abiotic stresses were examined by analyzing the cis-regulatory elements (CREs) inside their promoter regions (Fig. 6). A total of 291 CREs were estimated on 16 PeTCP genes. The predicted 291 CREs could be distributed into 134, 94, and 63 related to growth, hormones, and stress respectively. Among all the genes PeTCP15 had the highest 25 CREs, whereas PeTCP22 possessed the lowest with 13 CREs. Abscisic acid (ABA) responsiveness (ABRE, 33, 35%) and MeJA-responsiveness (CGGTA-motif and TGACG-motif, 27, 28%) were relatively abundant among CREs related to hormonal responsiveness in the promoter regions of PeTCPs (Fig. 6A). On the other hand, CREs associated with salicylic acid (SA) responsiveness (16, 17%), gibberellin (GA)-responsiveness (12, 12.7%), and CREs linked to auxin (IAA)-responsiveness (6, 6.8%) were sporadically distributed. For CREs involved in regulating growth and development (Fig. 6B), such as CAT-box for meristem expression (10, 7.4%), GCN4_motif for endosperm expression (1, 0.73%), RY-element for seed-specific regulation (1, 0.73%), and circadian for circadian control (3, 2.23%), were relatively insufficient compared to the light-responsive elements (116, 86.5%). Regarding CREs associated with stress responsiveness (Fig.6 C), the anaerobic induction ARE (38, 60.3%) was found to be prevalent across all genes. Still, low-temperature responsiveness (9, 14%), defense, and stress responsiveness (10, 15%), and drought responsiveness (6, 9.5%) CREs were relatively unevenly distributed across different genes. In summary, these results indicated that there was significant diversity in both the makeup and quantity of CREs in the promoter regions of PeTCP, indicating that different CREs regulate the expression of TCP genes in passion fruit.
Figure 6.
Cis-regulatory elements (CREs) distribution on the predicted promoter regions of PeTCPs. (A) Hormonal responsiveness. (B) Growth and development related. (C) Stress responsiveness.
Figure 6.
Cis-regulatory elements (CREs) distribution on the predicted promoter regions of PeTCPs. (A) Hormonal responsiveness. (B) Growth and development related. (C) Stress responsiveness.
2.6. Prediction of Putative TCP Genes Targeted by miRNA319
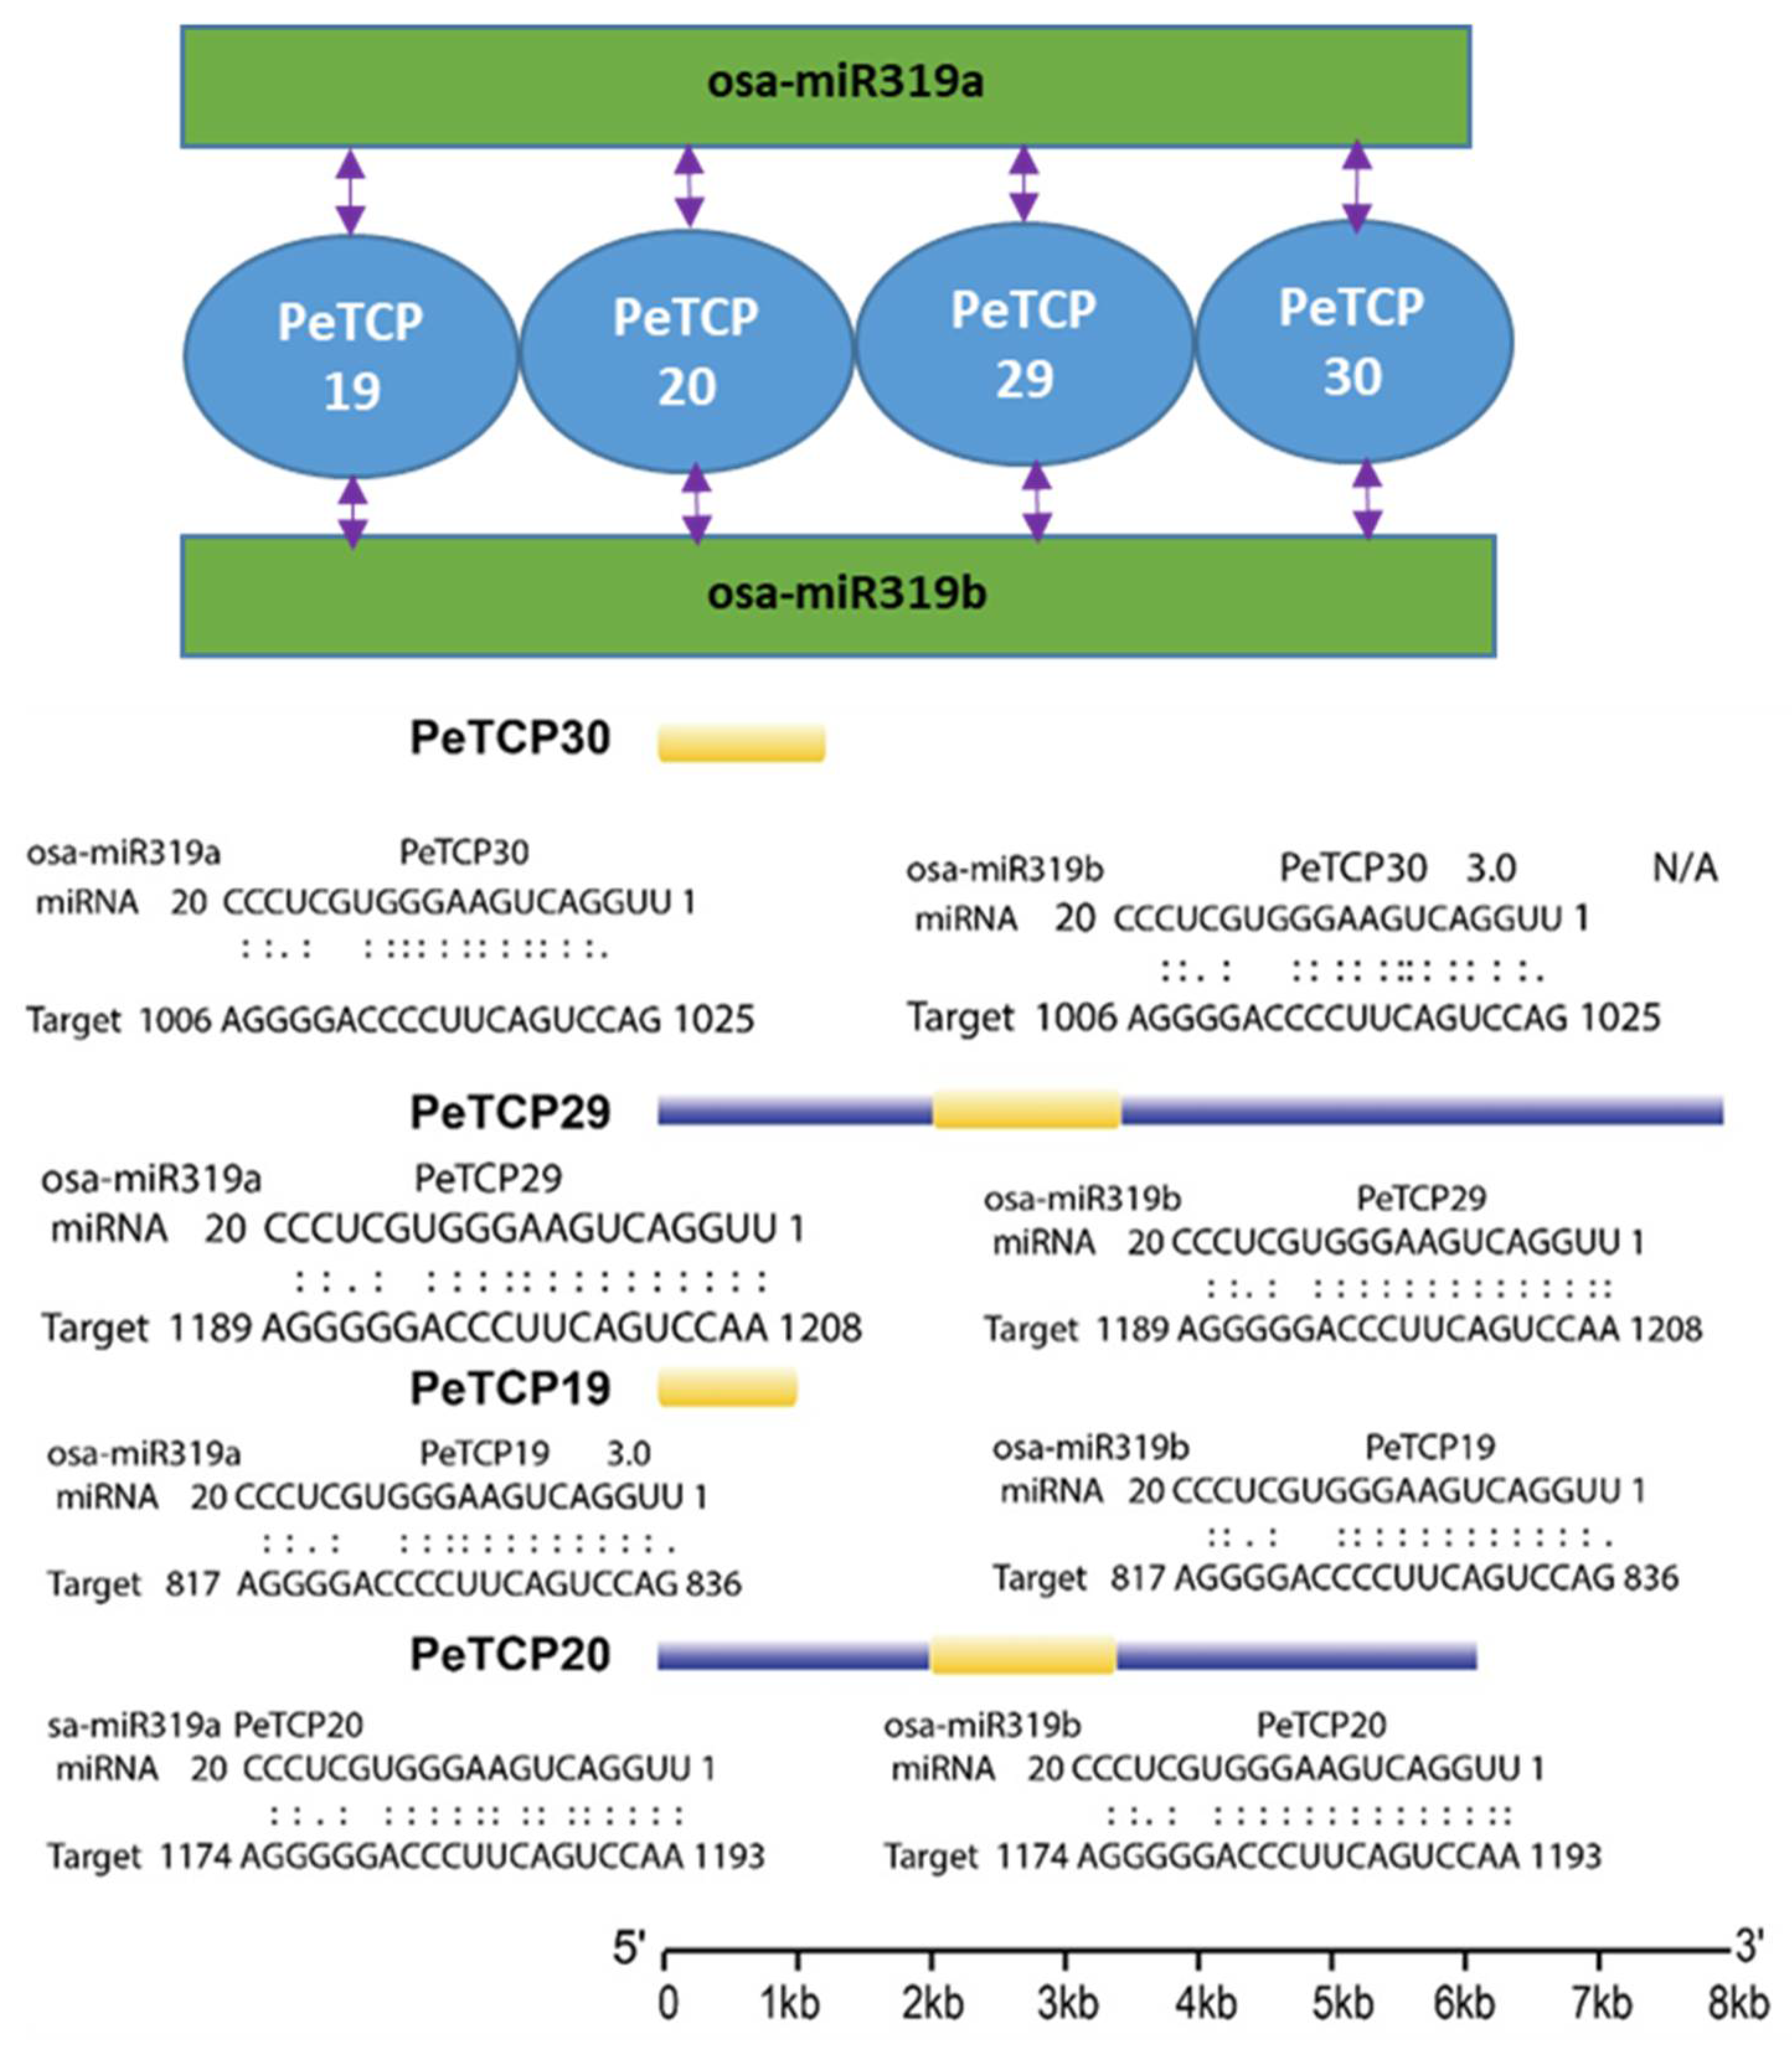
We tested the insilico binding of miRNA319 which is a conserved class of plant cold-stress-related microRNA with TCP genes. Our analysis indicated that both miRNA319a and miRNA319b can bind with
TCP19/20/29/30 genes (
Figure 7). Interestingly all four genes were phylogenetically conserved belonging to the CIN subfamily of Class (II).
2.7. Expression and GO/KEGG Enrichment analysis of TCP genes
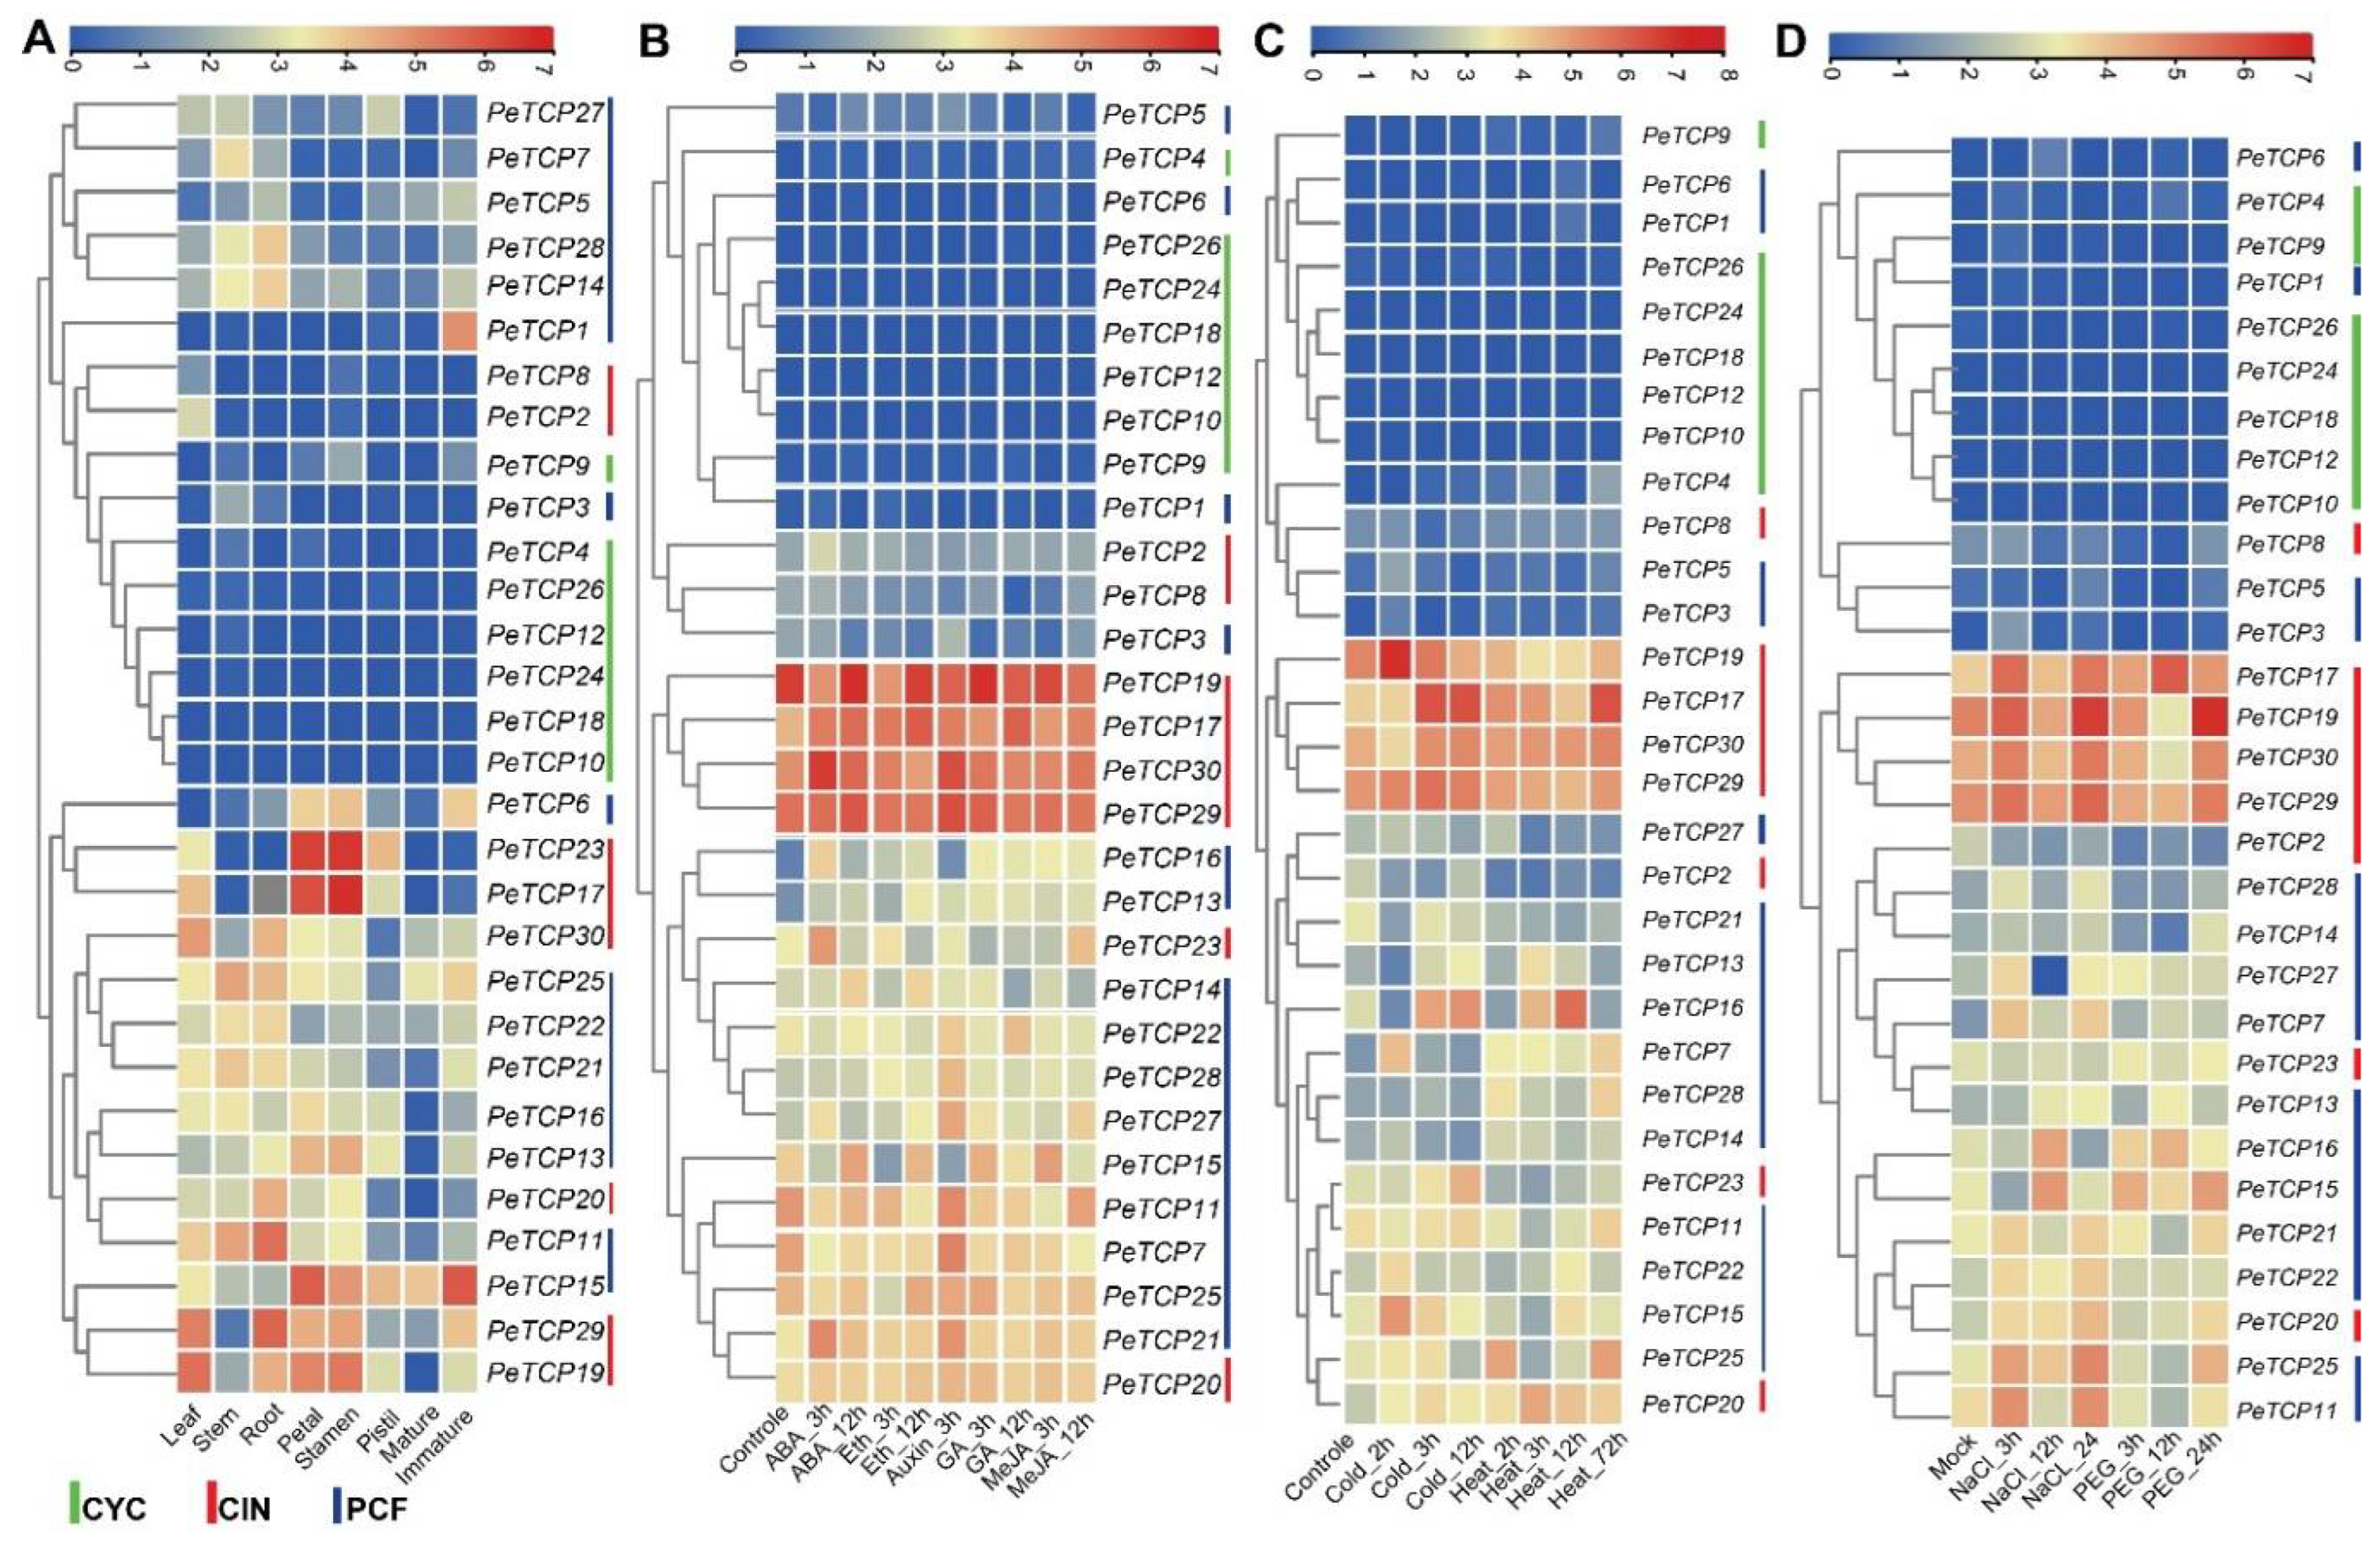
Transcriptomic data was used to characterize the expression profiles of the
PeTCPs genes at different developmental stages to investigate the potential functions of these genes (
Figure 8A,
Table S3). The hierarchical clustering of expression patterns allowed the
PeTCP genes to be sorted into different groups. Different groups of
PeTCP genes had unique patterns of temporal and spatial expressions. The heatmap clustering indicated that
PeTCP17/
23 in petals and stamens,
PeTCP11/
29 in root,
PeTCP19/
29 in leaf, and
PeTCP1/
15 in immature fruit tissue exhibited high preferential gene expressions.
To anticipate potential roles for
TCP genes in hormonal regulation, we examined the expression profile of
TCP genes in response to a range of
Phytohormones, such as ABA, ethylene, GA, Auxin, and MeJA (
Figure 8B,
Table S4). In reaction to ABA's hormonal treatments
PeTCP17/
23/
30/
15/
21 showed instantaneous induction. On ethylene treatments,
PeTCP15/
17 exhibited preferential upregulation. Treatments with auxin resulted in elevated
PeTCP21/
27/
28/
29/
30 gene expression. In reaction to the GA treatment,
PeTCP15/
17/
22 showed induced expressions, while
PeTCP15/
17/
27 exhibited preferential upregulation in response to MeJA treatments.
TCP genes are critical for protecting cells from stress-induced oxidative damage. The expression profiles of the TCP genes of passion fruit under heat, cold (
Figure 8C,
Table S5), salt, and drought stress (
Figure 8D,
Table S6) conditions were also investigated using transcriptome data. Many genes, including
PeTCP15/
16/
17/
19, showed increased gene expressions and responded immediately to the cold treatments.
PeTCP16/
17/
20/
25 exhibited quick accumulation of mRNA transcript in a brief amount of time after being rapidly induced under heat stress, indicating their speedy response to heat stress conditions. Furthermore, elevated gene expression was observed in CIN-type
PeTCP17/
19/
29/
30 and PCF-type
PeTCP11/
15/
16/
25 in response to salt stress. The gene expression of
PeTCP15/
16/
17/
19//
25 increased in response to the drought stress.
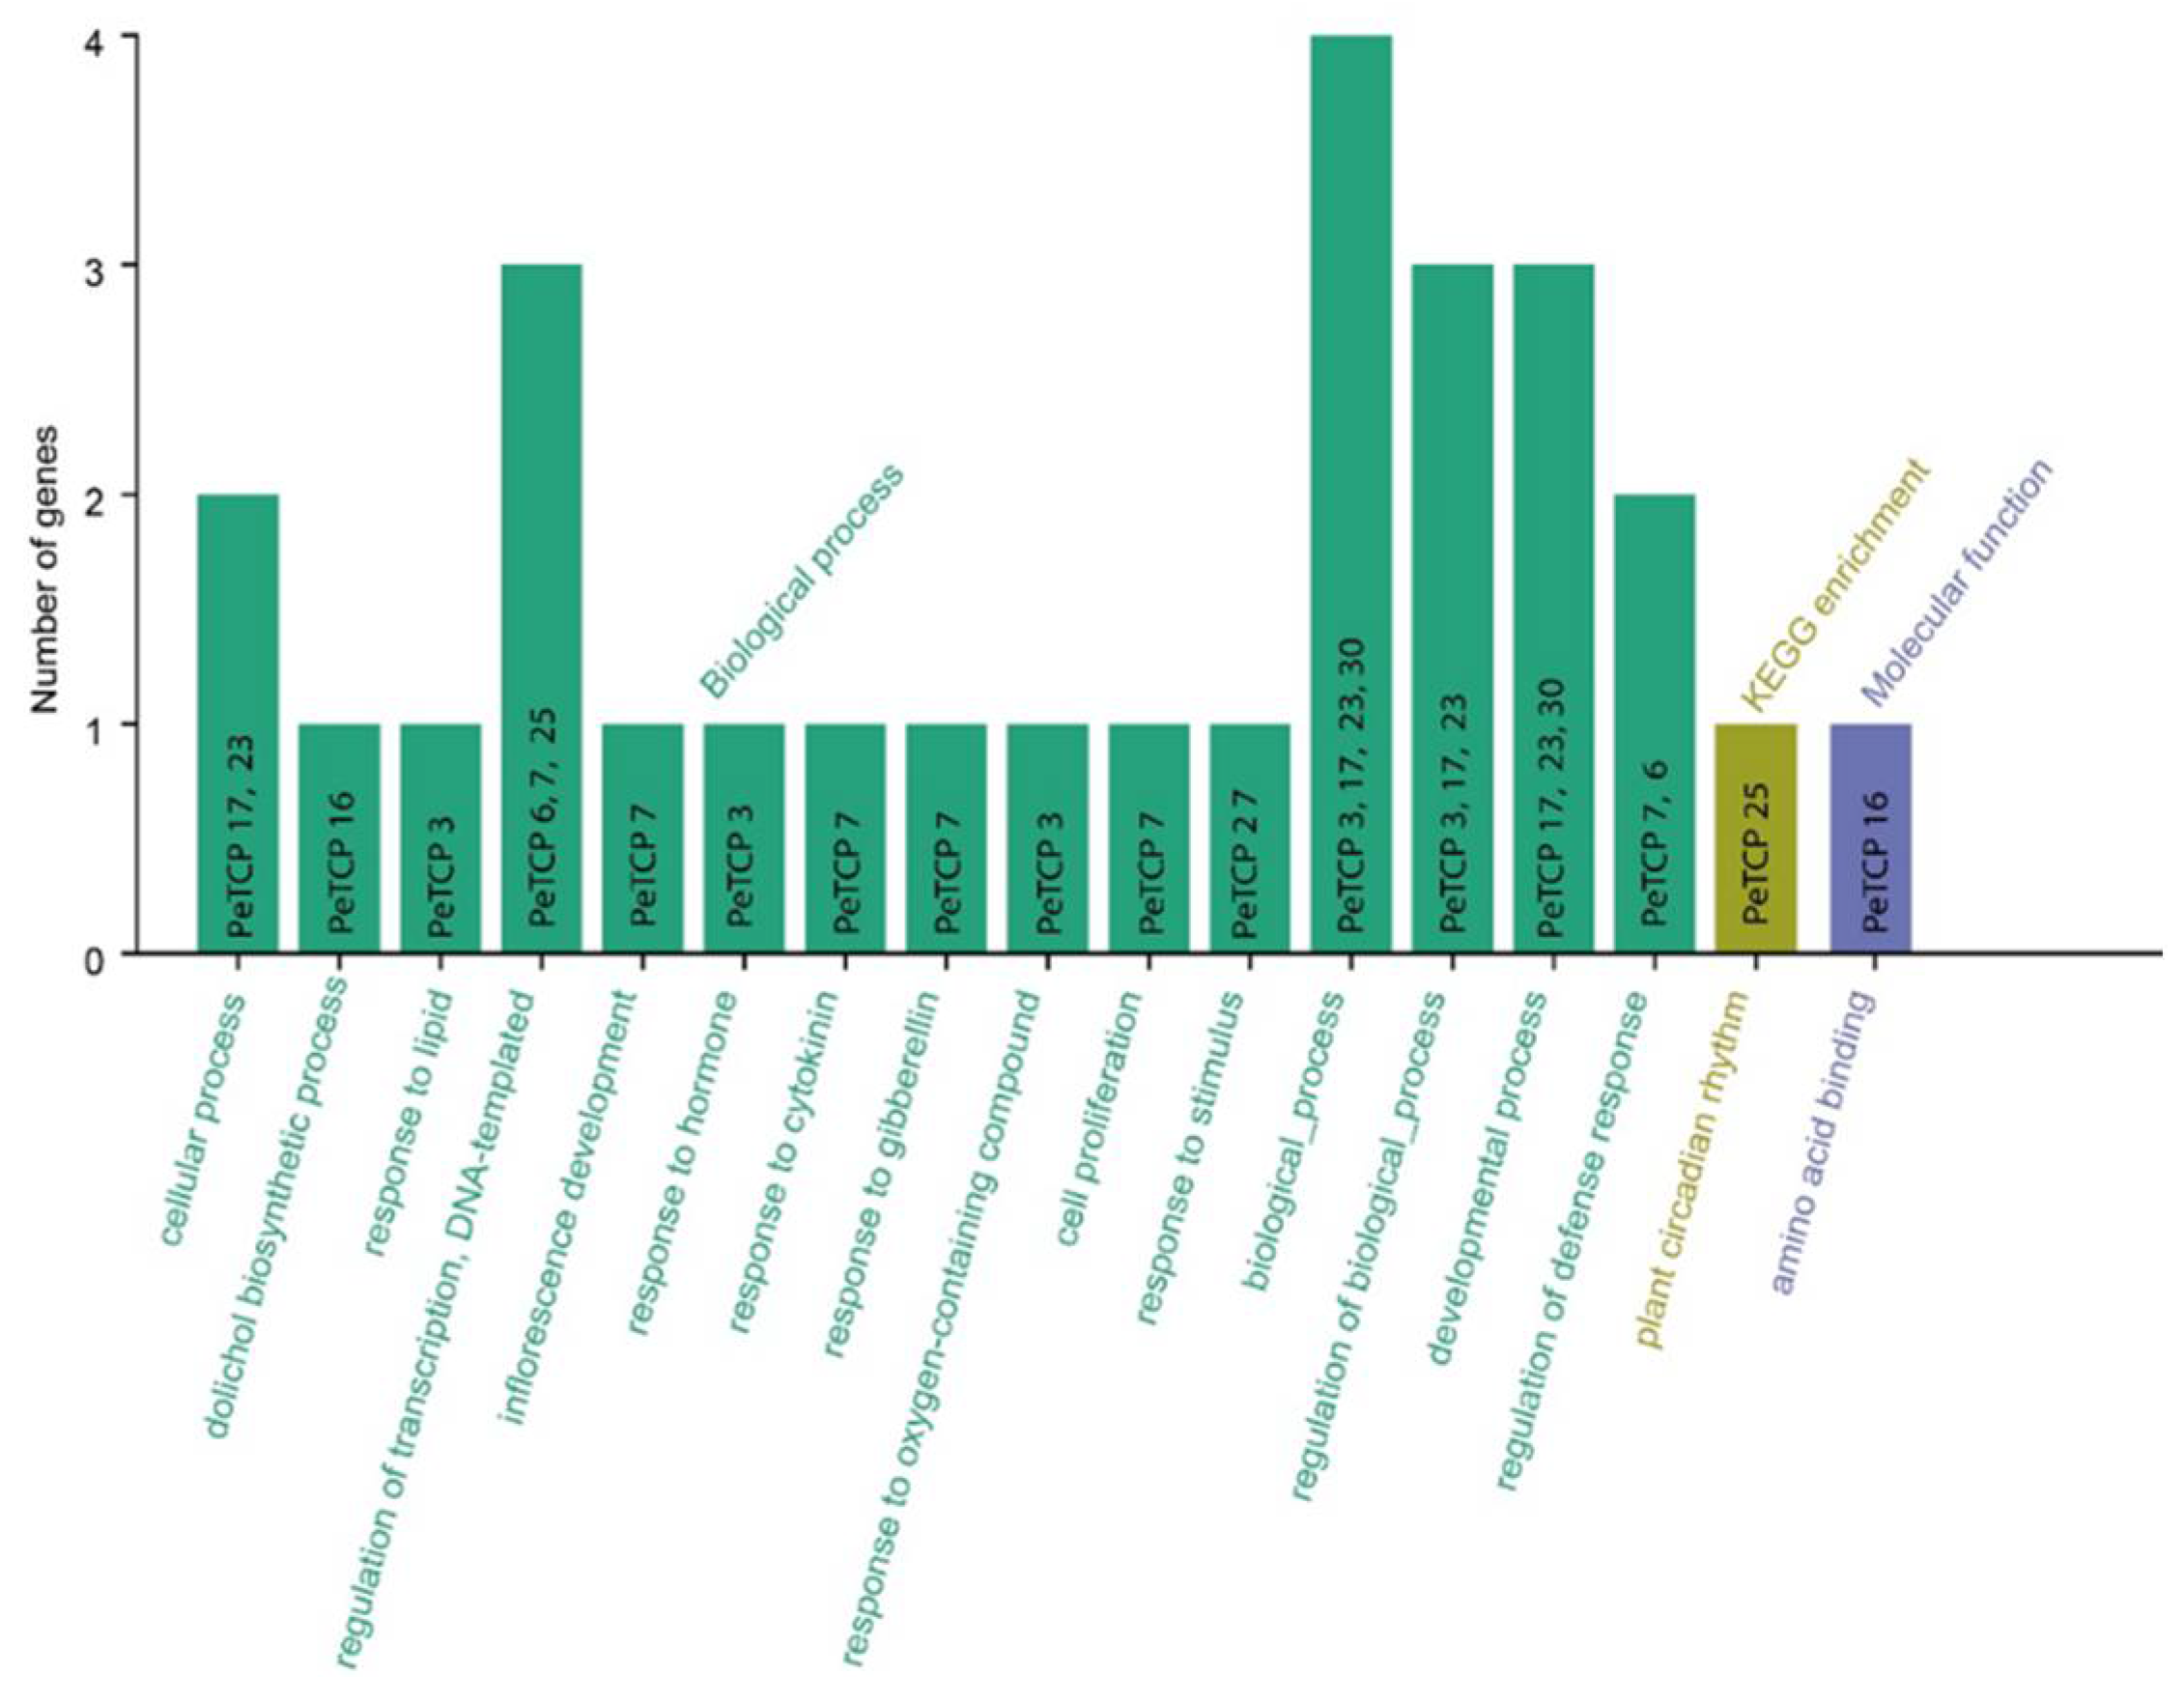
GO and KEGG enrichment analyses of passion fruit were carried out for 30 TCP genes (
Figure 9). The
PeTCPs were majorly enriched with Go terms such as regulation of transcription (
PeTCP7/
25), response to lipids (
PeTCP3) and hormones (
PeTCP7), inflorescence development (
PeTCP7), defense responses (
PeTCP6/7), response to stimulus (
PeTCP27), amino acid binding (
PeTCP16), while only a single gene
PeTCP25 was significantly enriched for KEGG pathways for plant circadian rhythms.
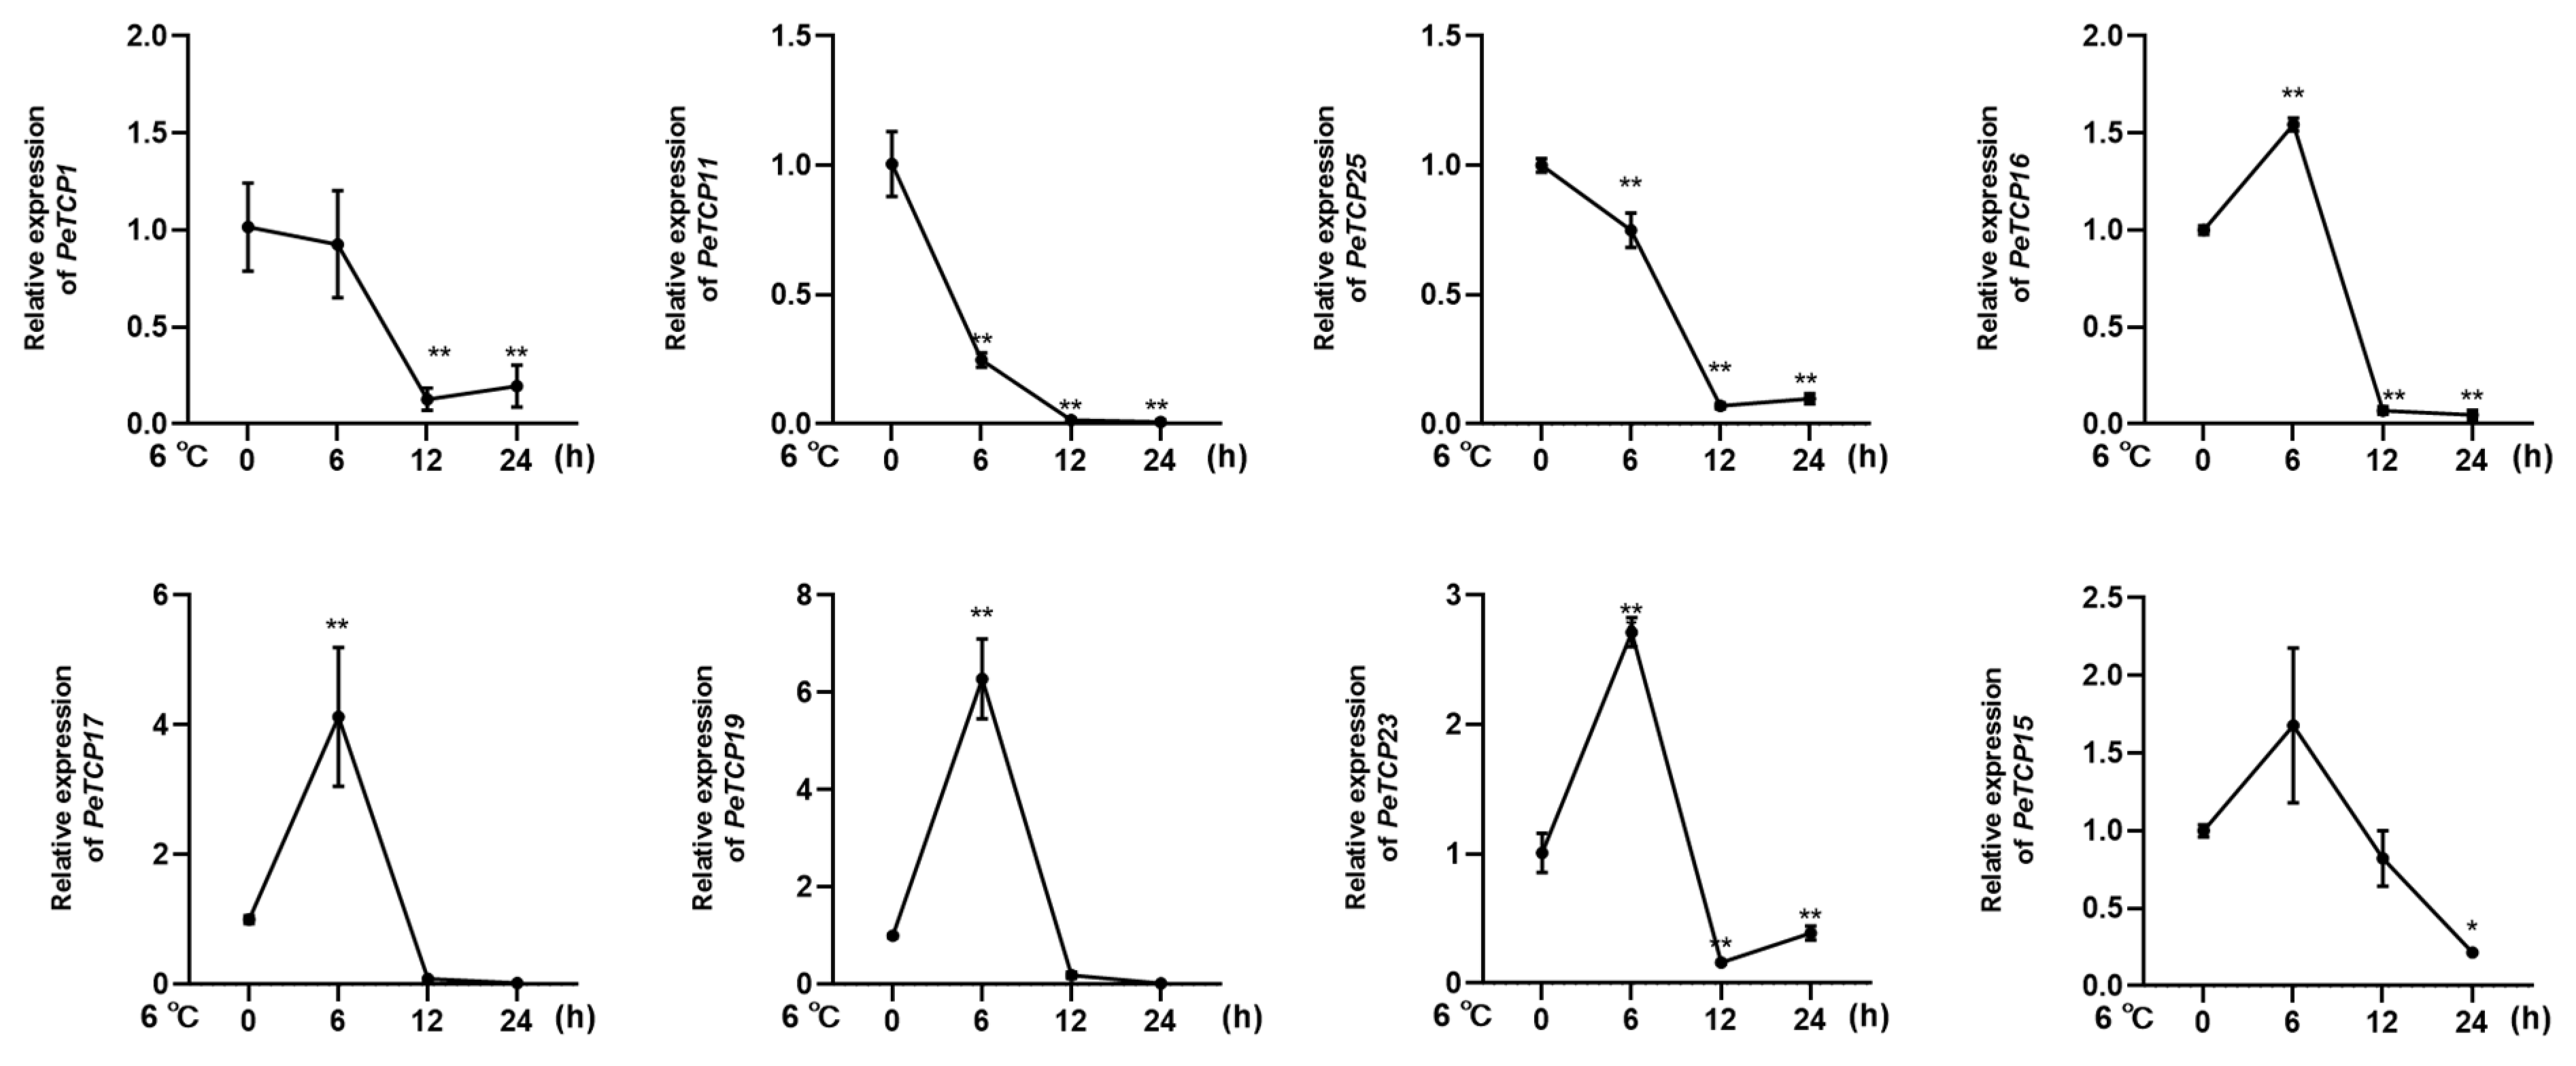
To further assess the expression profiles of the passion fruit TCP genes under cold stress conditions eight notable genes were chosen for qRT-PCR analysis based on their significantly varied expressions from transcriptome results. In conformation to the transcriptomics data, CIN-type
PeTCP19/
17/
23 and PCF-type
PeTCP16 /
15 expressions were significantly increased by application of cold stress treatment at 6hr intervals, declined sharply at 12 hr intervals, and steadied at 24 hr (
Figure 10), suggesting expressional induction of these genes. Contrarily PCF-type
PeTCP25/
1 and CYC-type
PeTCP11 exhibited decreased expressions with subsequent cold treatments compared to controle (
Figure 10). Interestingly among treatment intervals 6 hr interval was the most influential. Taken together these results indicate TCP genes of passionfruit play vital roles in the regulation of cold stress.
3. Discussion
Tropical fruit crops like passion fruit have significant agricultural, commercial, and ornamental value, however, environmental conditions have a big impact on the fruit's growth and development. TCP transcription factors play pivotal roles in growth and development and coping with biotic and abiotic stresses.
In the current study, a sum of 30 members of the TCP transcription factor gene family in the passion fruit genome were identified. Using homologous genes from
Arabidopsis, phylogenetic analysis exhibited TCP gene family divergence into two classes and three subfamilies. The results of the phylogenetic analysis and classification were independently supported by domain architecture, gene exon/intron structure analysis indicated that closely related gene members typically exhibit similar structural characteristics, as observed in other plants like rice [
30] and rye [
21]. We noticed that most of the TCP proteins were located in the nucleus except a few in the cytoplasm. Furthermore, the results of homologous protein modeling the representative proteins of each gene subfamily exhibited divergent 3D structures and distinctive features associated with their varied functions. The structural diversity of these proteins may contribute to the functional diversity of TCP gene subfamilies.
Passion fruit had a slightly higher number of TCP proteins than
Arabidopsis 24 protein members. Among 30 total TCP genes in passion fruit, five pairs of segmental duplication were identified, largely responsible for the expansion of the TCP family. The Ka/Ks ratios of all the duplicated gene pairs were smaller than 1 (
Table S2), suggesting that these gene pairs underwent negative or purifying selection over their evolutionary history. Except for the lowly expressed duplicated pairs
PeTCP18/
24 and
12/26, the other members of duplicated gene pairs exhibited opposite or varied gene expressions, suggesting these genes following duplication might have experienced sub-functionalization or neo-functionalization. In contrast to the model laboratory species such as
Arabidopsis, passion fruit had to adapt to a greater variety of abiotic stressors to flourish during its growth and development. The proliferation of these TCP genes and the variety of roles they play may offer plants additional resilience to a range of adverse conditions, hence improving passion fruit's capacity to adapt to shifting environmental conditions.
In the meantime, 4 genes (
PeTCP19/20/29/30) potentially targeting miRNA319 in passion fruit were identified. Interestingly, all four genes belonged to the CIN subfamily and showed similar expression profiles except
PeTCP20. miR319 is one of the primitive and the most evolutionarily conserved miRNAs in plants [
34]. Growing data indicates that miR319-regulated TCPs (MRTCP) genes play a major role in the development of plants and stress response to the environment [
12]. It appears that miR319 may have conserved roles in the modulation of stress responses in passion fruit as well, as all three of the genes
PeTCP19/29/30 targeted by miR319 were differentially expressed during stress conditions. These findings showed that, by altering the transcriptional level of
TCP genes in passion fruit, the miRNA39 might have significant effects on the modulation of growth/development and stress responses.
Although TCP genes' involvement in growth/development and stress management have been reported in other plant species, studies of the TCP gene family in passion fruit are missing. The functional variety of the TCP genes was identified by analysis of the gene expression of the passion fruit. Some genes showed tissue-specific expression. For instance, PeTCP17/23 exhibited obvious high expressions in petals and stamen tissues, whereas PeTCP29 showed preferential upregulation in leaf and root tissues. Additionally, PeTCP15 exhibited obvious high expressions in petals and immature fruit tissues.
Members of the TCP gene family have been demonstrated to be essential components of multiple hormonal signaling networks in various plant species [
35] and in response to hormonal treatments of ABA,
PeTCP15/
17/
21/
30 genes exhibited immediate induction.
PeTCP15/
17 were up-regulated upon ethylene treatments. Auxin treatments led to increased gene expression of
PeTCP21/
27/
28/
29/
30. Similarly, the snapdragon
CIN gene has been linked to the control of the genes involved in the cytokinin and auxin signaling pathways as well as the formation of lateral organs [
36].
PeTCP15/
22/
17 exhibited expressional induction responding to the GA treatment, meanwhile,
PeTCP15/
17/
27 showed preferential upregulation in response to methyl jasmonate (MeJA) treatments. The altered gene expression levels measured during MeJA treatment in Senna tora exhibited
StTCP11 and
StTCP4.1 and may be implicated in jasmonic acid (JA) response signaling [
37].
Passion fruit's growth and development are extremely susceptible to fluctuations in the climate. The expression of some gene members, such as
PeTCP15/
16/
17/
19, increased rapidly with the cold treatments. It is well documented that the miR319-TCP module regulates cold stress in rice [
13,
14,
30], sugarcane [
15], and cassava [
16]. Similarly,
PeTCP16/
17/
20/
25 were induced quickly under heat stress and showed high transcript accumulation in a short period. Additionally, CIN-type genes
PeTCP17/
19/
29/
30 and PCF-type
PeTCP11/
15/
16/
25 exhibited enhanced mRNA transcripts in response to salt stress. A comparative transcriptome investigation between salt-sensitive and salt-tolerant genotypes of common beans demonstrated salt-responsive expression patterns for
Pvul-TCP1/
11/
13/
22/
27, which are targets of miR319 [
38]. In response to the drought stress,
PeTCP17/
19/
15/
16/
25 showed increased gene expression. Drought treatments induced
ZmTCP42 and ZmTCP32 expressions, and overexpression of
ZmTCP42 in
Arabidopsis resulted in enhanced drought tolerance [
39], however in another study overexpression of
ZmTCP14 showed opposite results [
19] confirming
TCP roles in drought resistance. Interestingly, all the
PeTCPs belonging to the CYC subfamily exhibited low expression across all the samples, while four CIN subfamily genes
PeTCP17/
19/
29/
30 exhibited strong differential expressions in reaction to the stress conditions.
Some of these promising genes such as
PeTCP15/
17/
19/
29/
30 may have significant application potential for the genetic improvement of passion fruit with improved tolerance to abiotic stress because they respond to a variety of stimuli. In their promoter regions, they had a variety of cis-acting elements (CREs) linked to hormonal responses (ABA-responsiveness, MeJA-responsiveness), growth (light responsive element, meristem expression), and stress responses (anaerobic induction, low-temperature responsiveness), which plays a significant role in the transduction of biological information [
31,
32]. In rice, OsTCP19 has a role in modulating drought-induced ABA signaling because of its interaction with OsABI4, which encodes a TF implicated in the transmission of the ABA signaling [
18]. AtTCP14 inhibits ABA signaling by interacting with the DOF6 (DNA binding with one finger) TF, preventing the induction of additional ABA-responsive genes in
Arabidopsis as well as the downstream ABA biosynthesis gene
ABA1 (ABA deficient 1) [
33]. In addition, the co-occurrence of several CREs in the promoter regions of
PeTCP genes may be intimately associated with the functions of these genes in the growth and development of passion fruit in response to various environmental modifications [
40]. Further studies are required to help establish links between
PeTCP genes and stress responses.
Author Contributions
Conceptualization, Munsif Shad, Songguo Wu, Chongjian Ma, Lihua Hu and Lingqiang Wang; Formal analysis, Songguo Wu; Funding acquisition, Chongjian Ma; Investigation, Songguo Wu, Xiaoying Luo, Xiaojin Huang and Yuxin Wu; Methodology, Munsif Shad, Songguo Wu, Xiaojin Huang, Yuxin Wu, Yuhong Zhou and Lingqiang Wang; Project administration, Lihua Hu; Resources, Lihua Hu and Lingqiang Wang; Software, Munsif Shad, Songguo Wu, Yuxin Wu and Yuhong Zhou; Supervision, Lingqiang Wang; Validation, Munsif Shad, Songguo Wu and Xiaoying Luo; Writing – original draft, Munsif Shad; Writing – review & editing, Lingqiang Wang.
Figure 1.
Phylogenetic analysis of TCP gene family proteins among passion fruit and Arabidopsis. The phylogenetic tree was built using MEGA-X software employing the neighbor-joining tree method with 1000 bootstrap replicates. Passion fruit TCP proteins are designated by “Pe” while Arabidopsis proteins are depicted with the “At” prefix.
Figure 2.
Multiple sequence alignment of passion fruit TCP proteins. Sequences were aligned in the MEGA software and sequence alignment was visualized in the ESPript 3.0 web tool.
Figure 2.
Multiple sequence alignment of passion fruit TCP proteins. Sequences were aligned in the MEGA software and sequence alignment was visualized in the ESPript 3.0 web tool.
Figure 3.
TCP protein domain composition and gene structure organization. (A) The phylogenetic tree was generated in MEGA-X software. (B) Domain attributes were downloaded from the NCBI batch CD server. TCP, SKN1, and ACT domains are depicted in green, yellow, and pink respectively. (C) The gene coordinate information was drawn through the TB tool. CDS, introns, and upstream/downstream regions of gene structure are shown in yellow, black, and blue respectively.
Figure 4.
Structural modeling and superimposition of bHLH domains of three representative proteins from each subfamily of PeTCP. PeTCP9 depicted in brown, PeTCP17 shown in magenta, and PeTCP25 exhibited in blue represent CYC, CIN, and PCF subfamilies respectively. Protein 3D modeling was performed using the SWISS-MODEL employing orthologous Arabidopsis TCP proteins as templates. Modeled proteins were visualized and structurally aligned using the Chimera software.
Figure 5.
Distribution of 30 TCP genes on passion fruit genome. The chromosome structures and gene positions were depicted in TB tools employing the genomic information from the Passionfruit Genomics Network database. The scale on the left indicates the chromosome size in Mbps. The colored bars indicate chromosomes, while blue lines with double arrows show the duplicated genes.
Figure 7.
Predicted miRNA319a/b –TCP binding modules.
Figure 7.
Predicted miRNA319a/b –TCP binding modules.
Figure 8.
Heatmaps of TCP gene transcripts expression levels. (A) Different growth stages and tissues. (B) Hormonal treatments. (C) Cold and heat stress conditions. (D) Salt and drought stress.
Figure 8.
Heatmaps of TCP gene transcripts expression levels. (A) Different growth stages and tissues. (B) Hormonal treatments. (C) Cold and heat stress conditions. (D) Salt and drought stress.
Figure 9.
GO annotations and KEGG analysis of TCP gene family. The GO enrichment terms' names are on the X axis while the number of genes belonging to each category is along the Y axis.
Figure 9.
GO annotations and KEGG analysis of TCP gene family. The GO enrichment terms' names are on the X axis while the number of genes belonging to each category is along the Y axis.
Figure 10.
Expression profiles of 8 TCP genes (PeTCP1, 11, 25, 16, 17, 19, 23, 15) in response to the cold stress treatments. Three independent biological replicates' standard deviations of means are represented by error bars. Significant variations of the transcript levels between treatments and blank control (0 h) are indicated by asterisks. (*p < 0.05, **p < 0.01).
Table 1.
Information of TCP family in passion fruit.
Table 1.
Information of TCP family in passion fruit.
| Gene Name |
Gene ID |
Chromosome |
Size (aa) |
MW (Da) |
pI |
A.I. |
Stability |
GRAVY |
Predicted location |
| PeTCP1 |
Pe1g00801 |
LG01 |
164 |
17985.36 |
6.1 |
58.35 |
U |
-0.438 |
Cytoplasm |
| PeTCP2 |
Pe2g00351 |
LG02 |
364 |
40493.27 |
6.31 |
68.32 |
U |
-0.665 |
Nucleus |
| PeTCP3 |
Pe2g00400 |
LG02 |
400 |
42807.17 |
7.91 |
62 |
U |
-0.65 |
Cytoplasm |
| PeTCP4 |
Pe2g00517 |
LG02 |
385 |
43712.73 |
7.21 |
55.53 |
U |
-0.876 |
Nucleus |
| PeTCP5 |
Pe2g01516 |
LG02 |
215 |
23168.9 |
6.71 |
65.95 |
U |
-0.641 |
Nucleus |
| PeTCP6 |
Pe2g02083 |
LG02 |
419 |
45554.9 |
5.61 |
74.99 |
U |
-0.472 |
membrane |
| PeTCP7 |
Pe2g02474 |
LG02 |
407 |
43474.67 |
7.44 |
58.06 |
U |
-0.73 |
Nucleus |
| PeTCP8 |
Pe2g02555 |
LG02 |
357 |
39723.46 |
6.51 |
64.23 |
U |
-0.622 |
Nucleus |
| PeTCP9 |
Pe2g02621 |
LG02 |
404 |
45981.81 |
8.67 |
62.82 |
U |
-0.725 |
Nucleus |
| PeTCP10 |
Pe2g02632 |
LG02 |
299 |
34140.84 |
9.86 |
58.8 |
U |
-0.894 |
Nucleus |
| PeTCP11 |
Pe2g03973 |
LG02 |
431 |
45408.01 |
6.56 |
57.61 |
U |
-0.572 |
Nucleus |
| PeTCP12 |
Pe3g00812 |
LG03 |
486 |
54179.6 |
6.01 |
54.09 |
U |
-0.9 |
Nucleus |
| PeTCP13 |
Pe3g01513 |
LG03 |
307 |
32776.29 |
9.16 |
58.47 |
U |
-0.739 |
Cytoplasm |
| PeTCP14 |
Pe3g01959 |
LG03 |
411 |
42952 |
6.37 |
67.98 |
U |
-0.43 |
Nucleus |
| PeTCP15 |
Pe4g04349 |
LG04 |
327 |
34638.45 |
9.26 |
81.19 |
U |
-0.169 |
Membrane |
| PeTCP16 |
Pe5g00391 |
LG05 |
759 |
83909.83 |
6.34 |
86.96 |
U |
-0.219 |
Chloroplast, membrane |
| PeTCP17 |
Pe5g00587 |
LG05 |
373 |
40572.4 |
6.88 |
77.94 |
U |
-0.489 |
Nucleus |
| PeTCP18 |
Pe5g00665 |
LG05 |
396 |
44016.51 |
9.29 |
64.29 |
U |
-0.685 |
Nucleus |
| PeTCP19 |
Pe6g00604 |
LG06 |
349 |
38377.12 |
6.08 |
57.68 |
U |
-0.718 |
Nucleus |
| PeTCP20 |
Pe6g01133 |
LG06 |
465 |
50516.54 |
8.7 |
60.86 |
U |
-0.808 |
Nucleus |
| PeTCP21 |
Pe6g02163 |
LG06 |
543 |
56938.36 |
6.69 |
53.9 |
U |
-0.702 |
Nucleus |
| PeTCP22 |
Pe8g00389 |
LG08 |
313 |
33367.08 |
7.99 |
62.75 |
U |
-0.718 |
Nucleus |
| PeTCP23 |
Pe8g00755 |
LG08 |
367 |
40359.99 |
8.44 |
68.26 |
U |
-0.6 |
Cytoplasm |
| PeTCP24 |
Pe8g00826 |
LG08 |
397 |
44330.83 |
8.46 |
70 |
U |
-0.626 |
Nucleus |
| PeTCP25 |
Pe8g01074 |
LG08 |
276 |
28139.36 |
9.72 |
70.51 |
U |
0.353 |
Nucleus |
| PeTCP26 |
Pe8g02699 |
LG08 |
491 |
54810.96 |
9.16 |
62 |
U |
-0.754 |
Cytoplasm |
| PeTCP27 |
Pe8g03645 |
LG08 |
408 |
44573.37 |
6.7 |
62.5 |
U |
-0.688 |
Nucleus |
| PeTCP28 |
Pe9g00054 |
LG09 |
552 |
58023.4 |
6.65 |
52.83 |
U |
-0.743 |
Nucleus |
| PeTCP29 |
Pe9g01413 |
LG09 |
471 |
51180.1 |
8.84 |
59.68 |
U |
-0.856 |
Nucleus |
| PeTCP30 |
Pe9g02247 |
LG09 |
420 |
45596.03 |
6.51 |
58.88 |
U |
-0.65 |
Nucleus |
