Preprint
Article

Exploration of Climate Data and Temperature Forecasting using Machine Learning

Altmetrics

Downloads

87

Views

28

Comments

0

This version is not peer-reviewed

Submitted:

13 May 2024

Posted:

14 May 2024

You are already at the latest version

Alerts
Abstract
In this short communication, a concept has been presented to model geographical data to predict future temperature of Tabuk, region. Machine learning has been applied to the weather station data to develop a prediction model. The preliminary results are promising and encouraging and are envisaging to further this research towards the determination of unknown temperature rise in the region. This is important to mention here, that the problem has been formulated as a Regression problem, NOT as a classification problem. Hence, applying Convolutional neural networks is not possible, due to the non-existence of classes or converting the temperature values to classes does not make any sense. Hence, this is defined as a regression problem which achieved encouraging desirable results.
Keywords: 
Subject: Environmental and Earth Sciences  -   Atmospheric Science and Meteorology

1. Introduction

Machine learning is widely used as a tool to predict or estimate unknown values or conditional attributes for an environment given the historical data. This technique has widely used in different technologies e.g. computer vision, robotics, signal processing, biomedical, aerospace and their associated frameworks [1,3,4,6,8,11,12]. Many researchers have used machine learning techniques to predict the future temperature values [2,5,7,9,10].

2. Data Collection and Data Patterns

Meteorological data uploaded here covers 31 years of meteorological information obtained from the Tabuk weather radar station (ID 40375), located at 28° 36’ N, 36° 63’E. The data includes Daily Maximum Temperature (Tmax), Minimum Temperature (Tmin), Temperature (mean), Rainfall (RF), Wind Speed (WS), Relative Humidity (RH), Pressure (Press), and Vapor (V), at the station level.
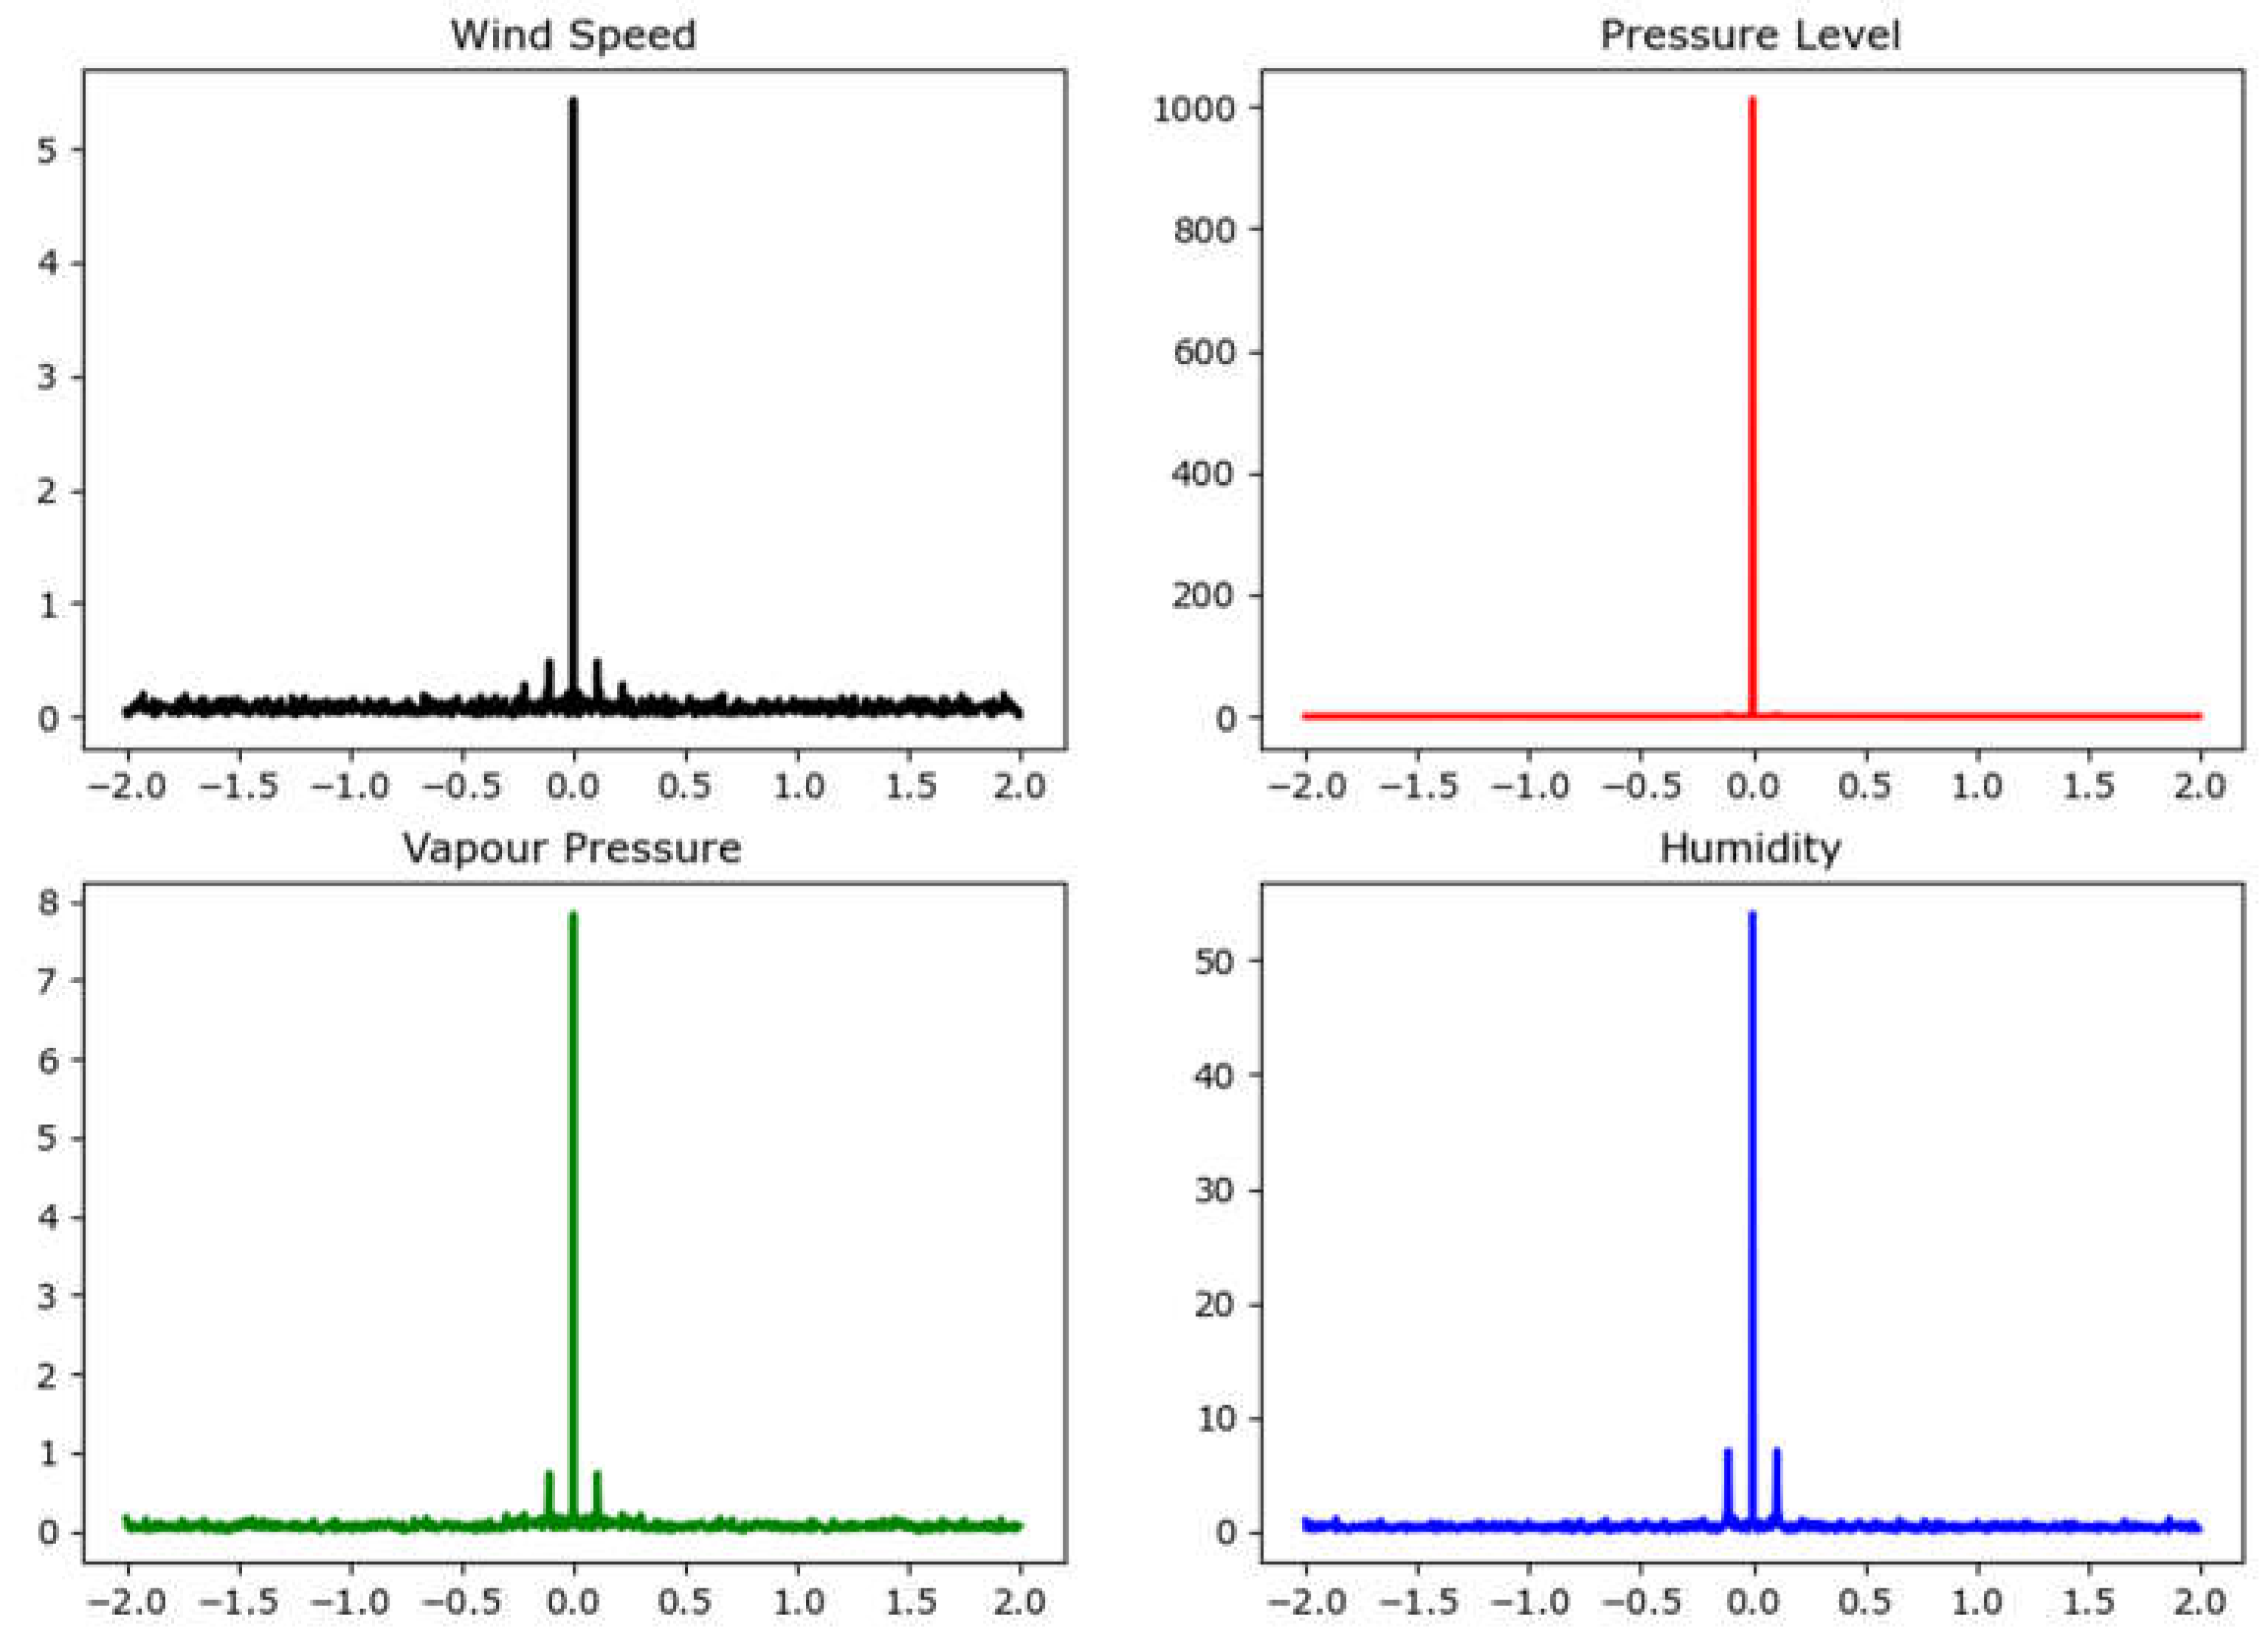
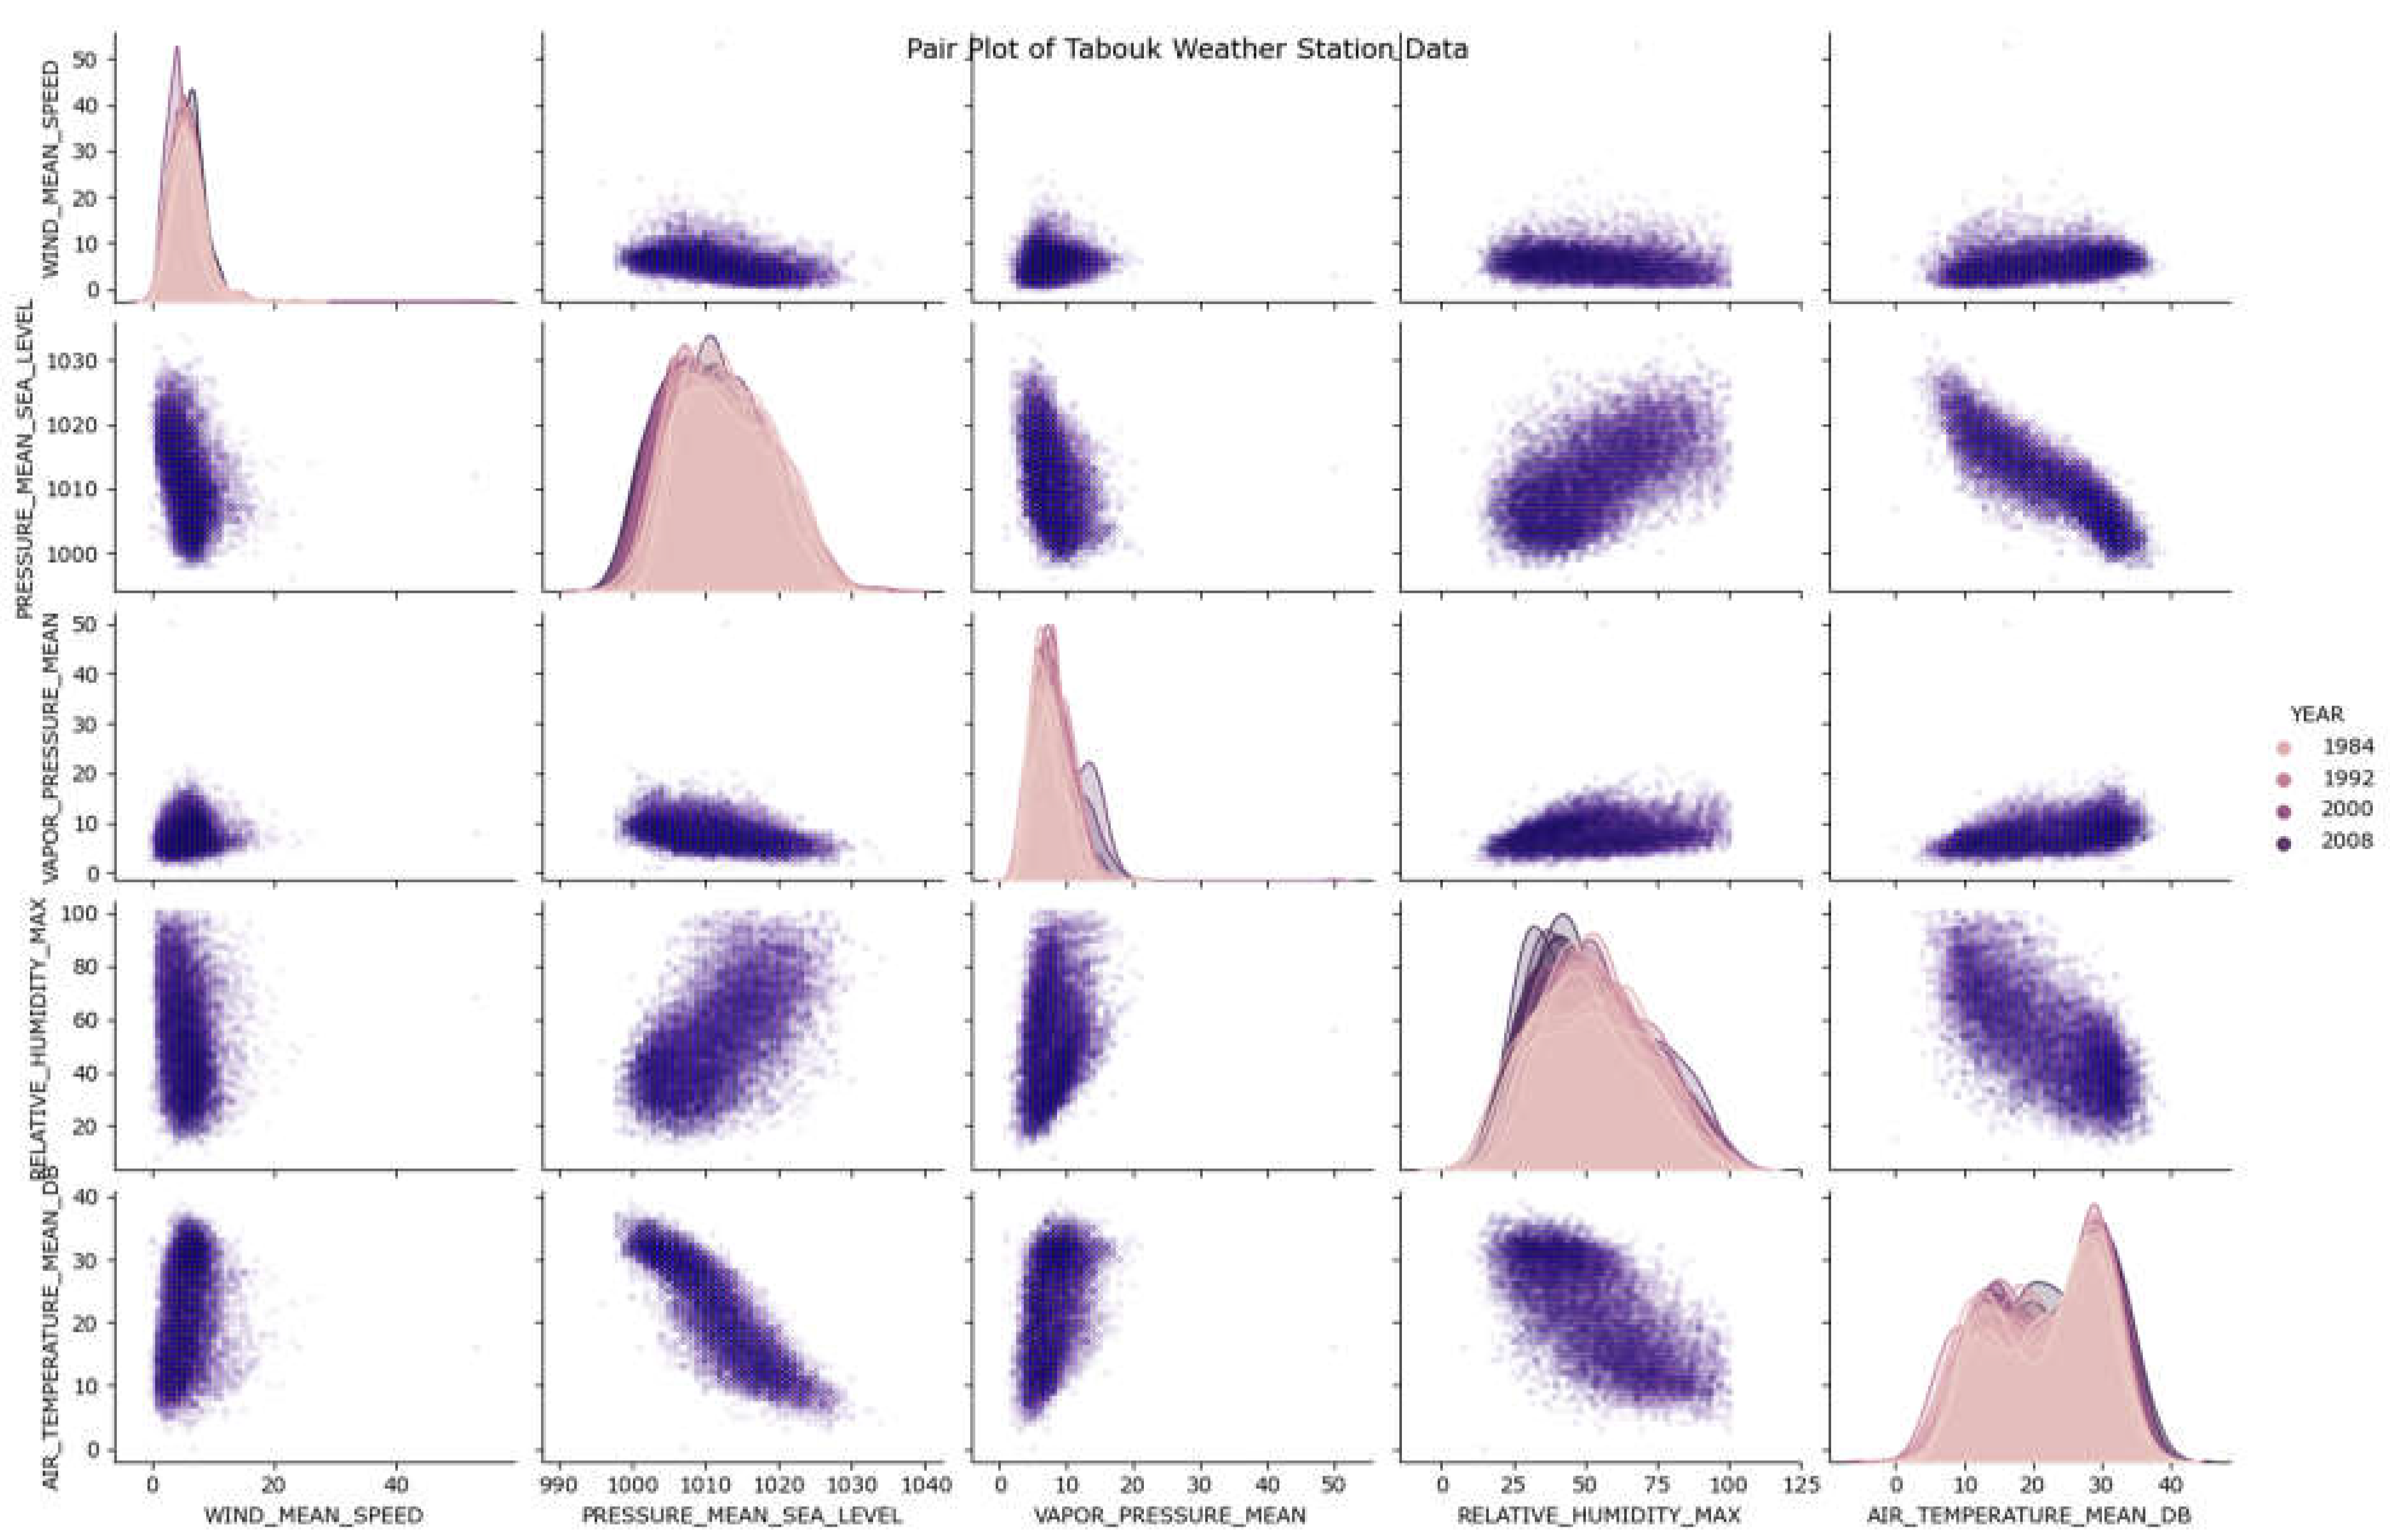
The data was plotted and is shown in the Figure 1. This can be observed in the data that it follows a sinusoidal wave pattern as shown in Figure 1. Moreover, the Fast fourier transformation (FFT) was applied on the data features and a very similar pattern can be seen as shown in Figure 2. To this end, a more subtle verification method was applied using Seaborn Python’s builtin in utility Pair-plot as shown in the Figure 3. Having said that we prepared the data of these four feature sets available from the Tabouk weather station. The idea was to train the temperature values using different machine learning methods, e.g. Decision Trees (DT), K-Nearest neighbours (KNN), Support Vector Machines (SVMs) and other Deep Learning methods like Multi-Linear Perceptron (MLP) or Artificial Neural Network (ANN). The intent of this exercise is to realise that whether the features also vary w.r.t the temperature values and also whether their is a similar pattern which exists among the individual features, too.
In order to verify all these hypothesis we developed different machine learning models, explained in more details in the results section.

3. Results

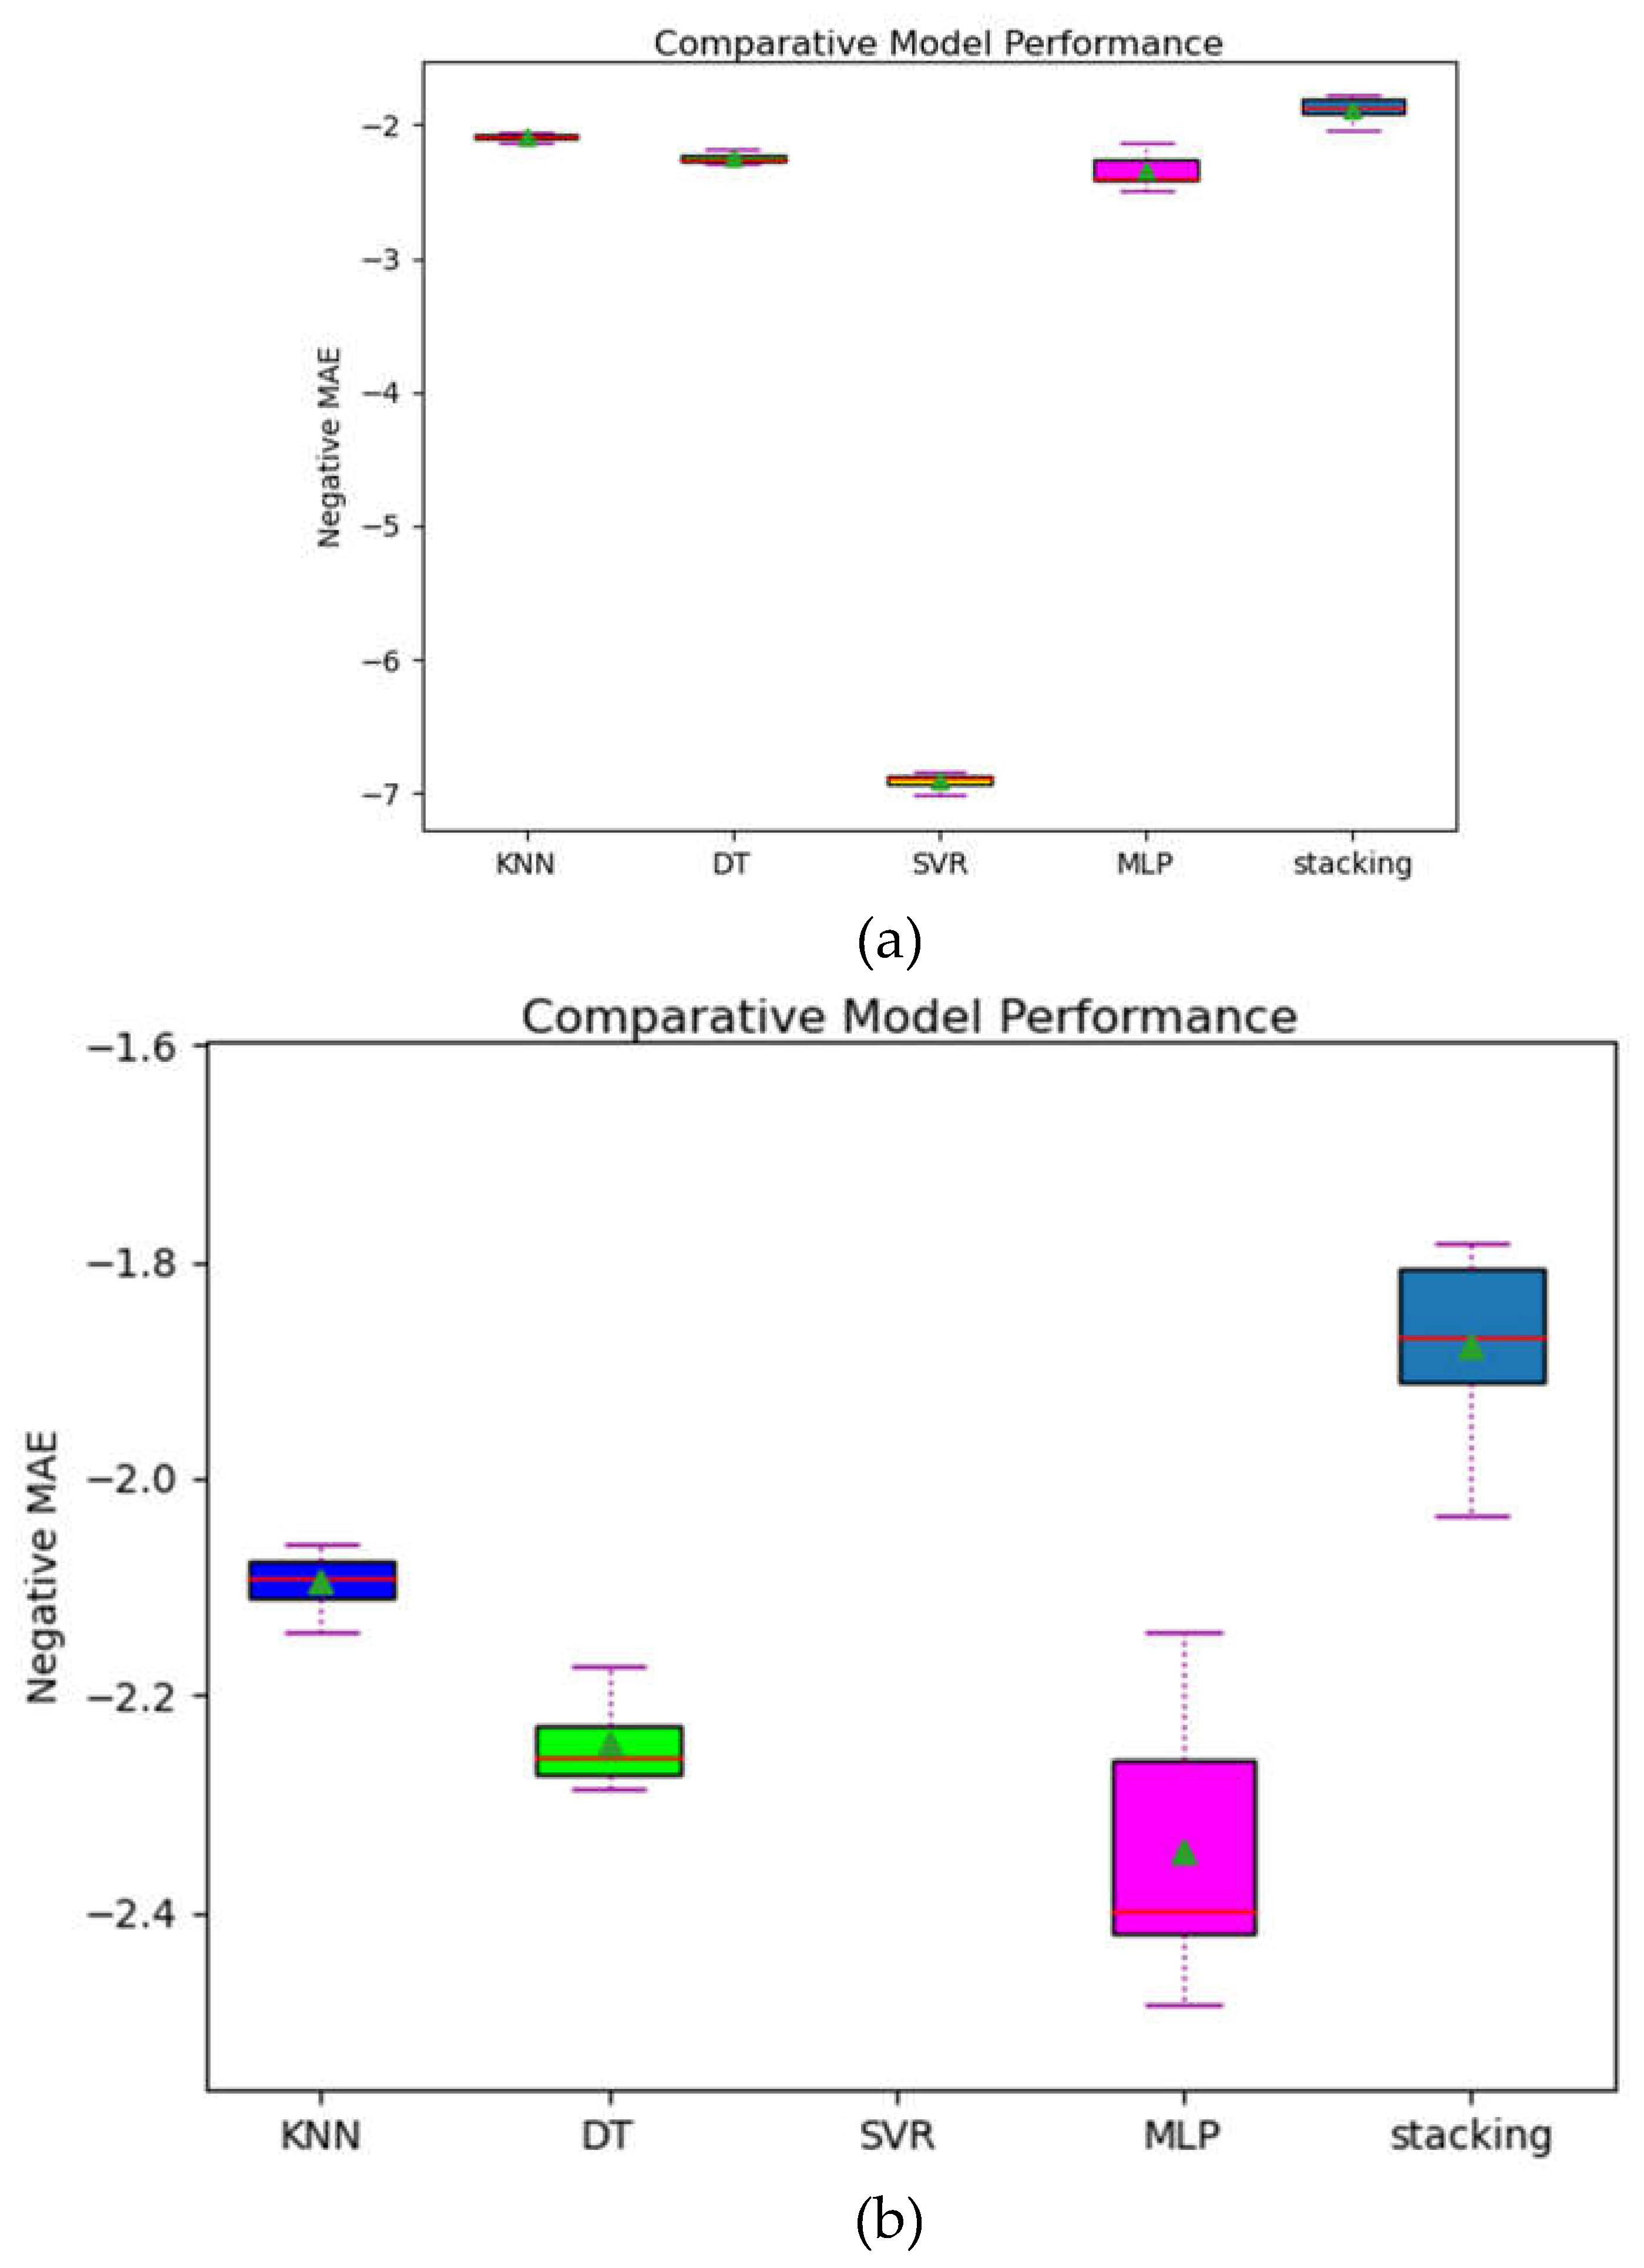
The results are presented after building various machine learning models using different algorithmic techniques, e.g. DT, KNN, SVM and multi-layer perceptron (MLP) which treated the data as a regression problem. The results show that SVM as a regression technique (SVR) for this dataset did not perform well as can be seen in the Figure 4a. The error was chosen as negative mean squared error, hence it can be seen in Figure 4b that together with the stacking algorithm, all the rest of them were within the bounds of -2 to -2.4. Means, the stacking algorithm can be used to predict the future temperature values of Tabuk region.
A need for Climate and Geographical data specific novel machine learning algorithms and human machine interaction systems
These results pose a challenge that there is a need for the development of temperature values specific and their features specific machine learning algorithms. Although, one algorithm on this dataset performed better but what happens when the feature set increases. Classical machine learning algorithms assign weights in a linear way, there is a need for an algorithm which learns the weights and not just simply adds or subtracts them but assign some intelligent weighting system on the features. One of the theories in Psychological sciences has a potential to do this job of assigning weights with reorganizational capabilities, called as Perceptual control theory (PCT) [13,14,15,16,17,18,19]. There is an effort undergoing to develop machine learning systems similar to human control systems and we hope one day better machine learning systems based on perceptual models will be created which will be more accurate and light in memory.
Moreover, with the geographical and climate data being collectable from synthetic aperture radars (SAR) and satellites. There is definitely a need for designing better human machine learnable interfaces. These digital interfaces can help climate and geographical sciences researchers to manipulate and process their data more conveniently [20,21,22,23,24,25,26,27,28,29]. With the advent of virtual reality and augmented reality this would be useful along with machine learning interfaces to facilitate climate sciences researchers.
Figure 4. The results of the dataset. (a) All machine learning algorithms were trained and tested on the real time data. The negative mean squared error was calculated for all the algorithms. (b) A more detailed analysis can be seen, after zooming on the significant boxplots without SVR.
Preprints 106349 g004

Acknowledgments

I am thankful to my mentor and supervisor Associate Prof. Tauseef Gulrez for his help towards the fulfillment of my post Ph.D work, which I used in this paper.

References

  1. Poh, C., Gulrez, T., & Konak, M. (2021, March). Minimal neural networks for real-time online nonlinear system identification. In 2021 IEEE Aerospace Conference (50100) (pp. 1-9). IEEE.
  2. Azari, B. , Hassan, K., Pierce, J., & Ebrahimi, S. Evaluation of machine learning methods application in temperature prediction. Environ Eng 2022, 8, 1–12. [Google Scholar] [CrossRef]
  3. Smith, J. , Gulrez, T., & Konak, M. (2021, January). Deriving optimal control from data using machine learning for force control systems. In AIAC 2021: 19th Australian International Aerospace Congress: 19th Australian International Aerospace Congress (pp. 173-178). Engineers Australia.
  4. Gulrez, T. , & Mansell, W. High Performance on Atari Games Using Perceptual Control Architecture Without Training. Journal of Intelligent & Robotic Systems 2022, 106, 45. [Google Scholar] [CrossRef]
  5. Feigl, M. , Lebiedzinski, K., Herrnegger, M., & Schulz, K. Machine-learning methods for stream water temperature prediction. Hydrology and Earth System Sciences 2021, 25, 2951–2977. [Google Scholar] [CrossRef]
  6. Gulrez, T. Robots Used Today that we Did Not Expect 20 Years Ago (from the Editorial Board Members). Journal of Intelligent & Robotic Systems 2021, 102. [Google Scholar] [CrossRef]
  7. Qu, N. , Liu, Y., Liao, M., Lai, Z., Zhou, F., Cui, P.,... & Zhu, J. Ultra-high temperature ceramics melting temperature prediction via machine learning. Ceramics International 2019, 45, 18551–18555. [Google Scholar] [CrossRef]
  8. Gulrez, T. , & Tognetti, A. A sensorized garment controlled virtual robotic wheelchair. Journal of Intelligent & Robotic Systems 2014, 74, 847–868. [Google Scholar] [CrossRef]
  9. Radhika, Y. , & Shashi, M. Atmospheric temperature prediction using support vector machines. International journal of computer theory and engineering 2009, 1, 55. [Google Scholar] [CrossRef]
  10. Hong, S. , Park, C., & Cho, S. A rail-temperature-prediction model based on machine learning: warning of train-speed restrictions using weather forecasting. Sensors 2021, 21, 4606. [Google Scholar] [CrossRef] [PubMed]
  11. Joanne B. Culpepper, Tauseef Gulrez, "Machine learning approach for extracting radiometric data from RGB images: a preliminary study," Proc. SPIE 12736, Target and Background Signatures IX, 127360G (23 October 2023).
  12. Gulrez, T. , Mansell, W. High Performance on Atari Games Using Perceptual Control Architecture Without Training. J Intell Robot Syst 2022, 106, 45. [Google Scholar] [CrossRef]
  13. Gulrez, T. , & Al-Odienat, A. A New Perspective on Principal Component Analysis using Inverse Covariance. International Arab Journal of Information Technology (IAJIT) 2015, 12. [Google Scholar]
  14. Challa, S. , Gulrez, T., Chaczko, Z., & Paranesha, T. N. (2005, July). Opportunistic information fusion: a new paradigm for next generation networked sensing systems. In 2005 7th international conference on information fusion (Vol. 1, pp. 8–pp). IEEE.
  15. Kavaliauskaitė, D. , Gulrez, T., & Mansell, W. What is the relationship between spontaneous interpersonal synchronization and feeling of connectedness? A study of small groups of students using MIDI percussion instruments. A study of small groups of students using MIDI percussion instruments. Psychology of Music 2023, 03057356231207049. [Google Scholar] [CrossRef]
  16. Marken, R. , Kennaway, R., & Gulrez, T. Behavioral illusions: The snark is a boojum. Theory & Psychology 2022, 32, 491–514. [Google Scholar] [CrossRef]
  17. Gulrez, T., Kekoc, V., Williams, D., Mills, T., Verhagen, V., Ong, J., & Marzocca, P. (2021, January). A physical load metric development for assessment of mixed reality in aircraft inspection tasks. In Proceedings of the19th Australian International Aerospace Congress (AIAC 2021) (pp. 167-172). Engineers Australia.
  18. Gulrez, T., Kekoc, V., Gaurvit, E., Schuhmacher, M., & Mills, T. (2023, March). Machine Learning Enabled Mixed Reality Systems-For Evaluation and Validation of Augmented Experience in Aircraft Maintenance. In Proceedings of the 2023 7th International Conference on Virtual and Augmented Reality Simulations (pp. 77-83).
  19. Gulrez, T., Meziani, S. N., Rog, D., Jones, M., & Hodgson, A. (2016). Can autonomous sensor systems improve the well-being of people living at home with neurodegenerative disorders?. In Cross-Cultural Design: 8th International Conference, CCD 2016, Held as Part of HCI International 2016, Toronto, ON, Canada, July 17-22, 2016, Proceedings 8 (pp. 649-658). Springer International Publishing.
  20. Russo, S., Meziani, S. N., Gulrez, T., Carbonaro, N., & Tognetti, A. (2016). Towards the development of an EIT-based stretchable sensor for multi-touch industrial human-computer interaction systems. In Cross-Cultural Design: 8th International Conference, CCD 2016, Held as Part of HCI International 2016, Toronto, ON, Canada, July 17-22, 2016, Proceedings 8 (pp. 563-573). Springer International Publishing.
  21. Gulrez, T. Do We Need an ‘Interaction Measure’Between Human Body and Robotic Interfaces. Int J Swarm Intel Evol Comput 2015, 4, e110. [Google Scholar] [CrossRef]
  22. Gulrez, T. , & Tognetti, A. A sensorized garment controlled virtual robotic wheelchair. Journal of Intelligent & Robotic Systems 2014, 74, 847–868. [Google Scholar] [CrossRef]
  23. Gulrez, T., Tognetti, A., & De Rossi, D. Sensorized garment augmented 3d pervasive virtual reality system. Pervasive Computing: Innovations in Intelligent Multimedia and Applications. 2010, 97–115. [CrossRef]
  24. Gulrez, T., Kavakli, M., & Tognetti, A. (2008). Robotics and virtual reality: A marriage of two diverse streams of science. In Computational Intelligence in Multimedia Processing: Recent Advances (pp. 99-118). Berlin, Heidelberg: Springer Berlin Heidelberg.
  25. Gulrez, T., & Kavakli, M. (2007, June). Precision position tracking in virtual reality environments using sensor networks. In 2007 IEEE International Symposium on Industrial Electronics (pp. 1997-2003). IEEE.
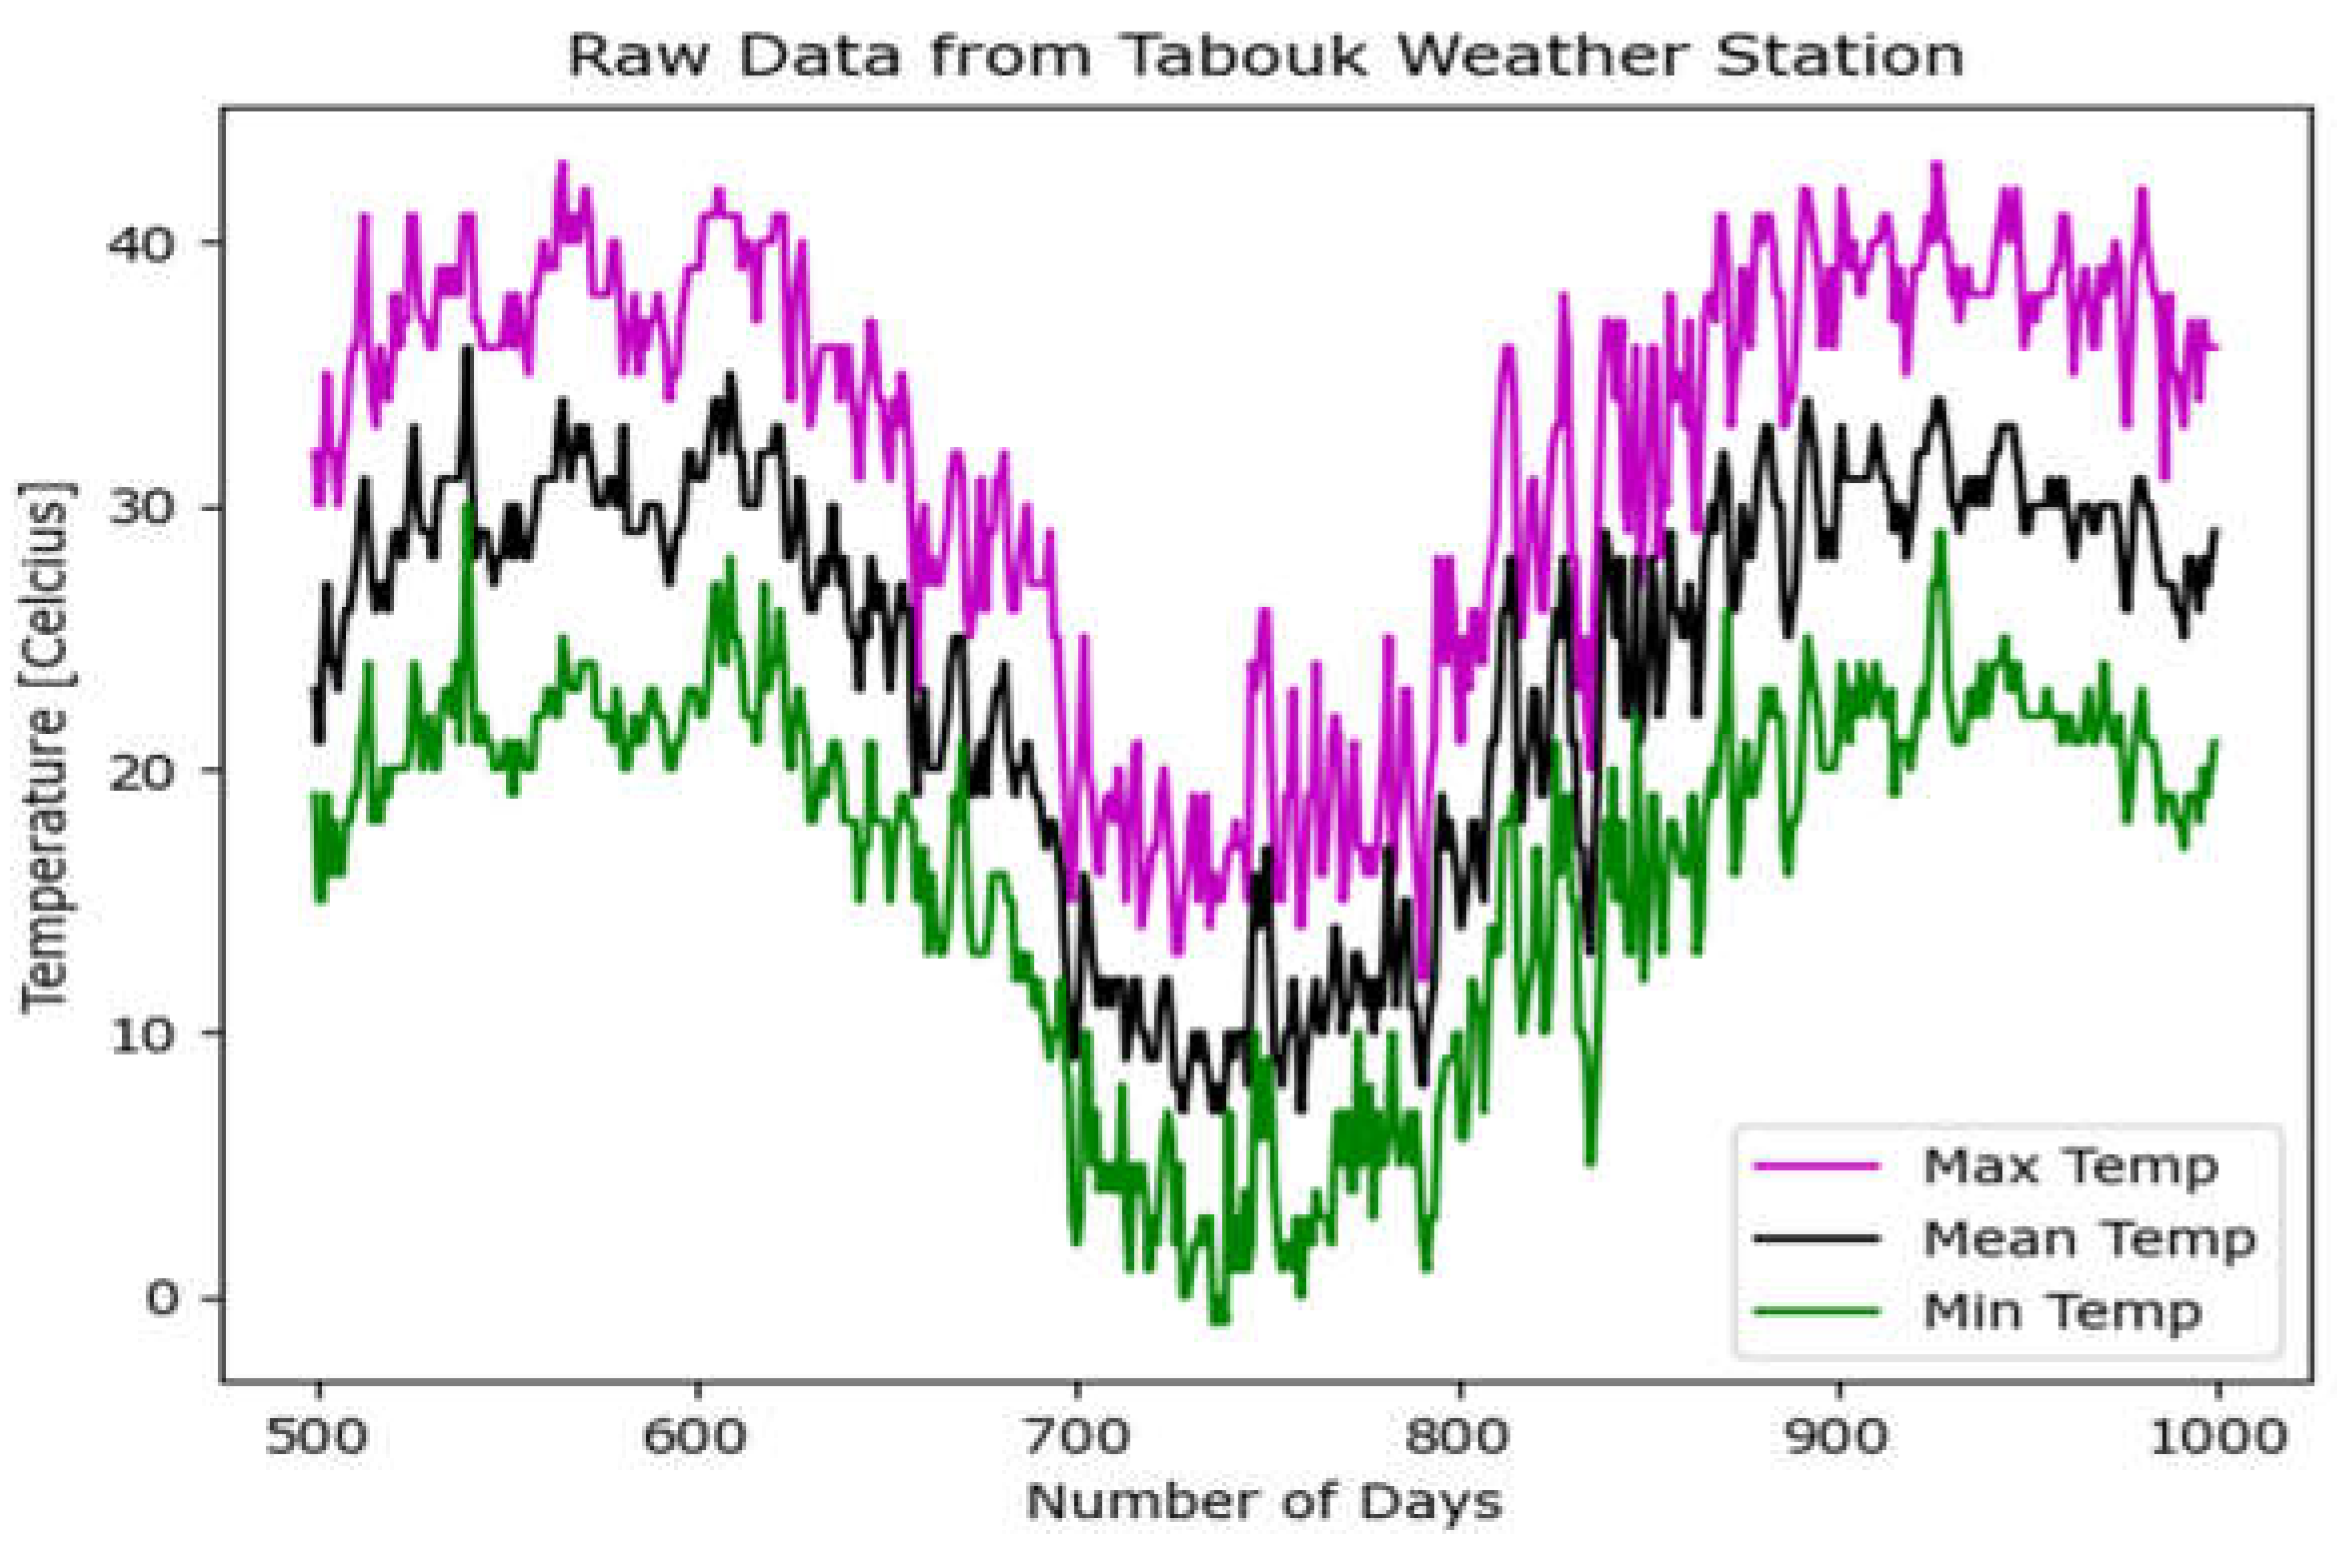
Figure 1. Five hundred days temperature data points. This can be seen that the data follows sinusoidal curve i.e. a sine wave pattern.
Preprints 106349 g001
Figure 2. Fast Fourier transformation (FFT) was applied to individual features of the data.
Preprints 106349 g002
Figure 3. Pair plot of the major features of the temperature data set. The relative kernel density estimation (KDE) was used to find the inter-relation between the features.
Preprints 106349 g003
Disclaimer/Publisher’s Note: The statements, opinions and data contained in all publications are solely those of the individual author(s) and contributor(s) and not of MDPI and/or the editor(s). MDPI and/or the editor(s) disclaim responsibility for any injury to people or property resulting from any ideas, methods, instructions or products referred to in the content.
Copyright: This open access article is published under a Creative Commons CC BY 4.0 license, which permit the free download, distribution, and reuse, provided that the author and preprint are cited in any reuse.
Prerpints.org logo

Preprints.org is a free preprint server supported by MDPI in Basel, Switzerland.

Subscribe

© 2024 MDPI (Basel, Switzerland) unless otherwise stated