Submitted:
14 May 2024
Posted:
14 May 2024
You are already at the latest version
Abstract
Keywords:
1. Introduction
2. Related Work
3. Methodology
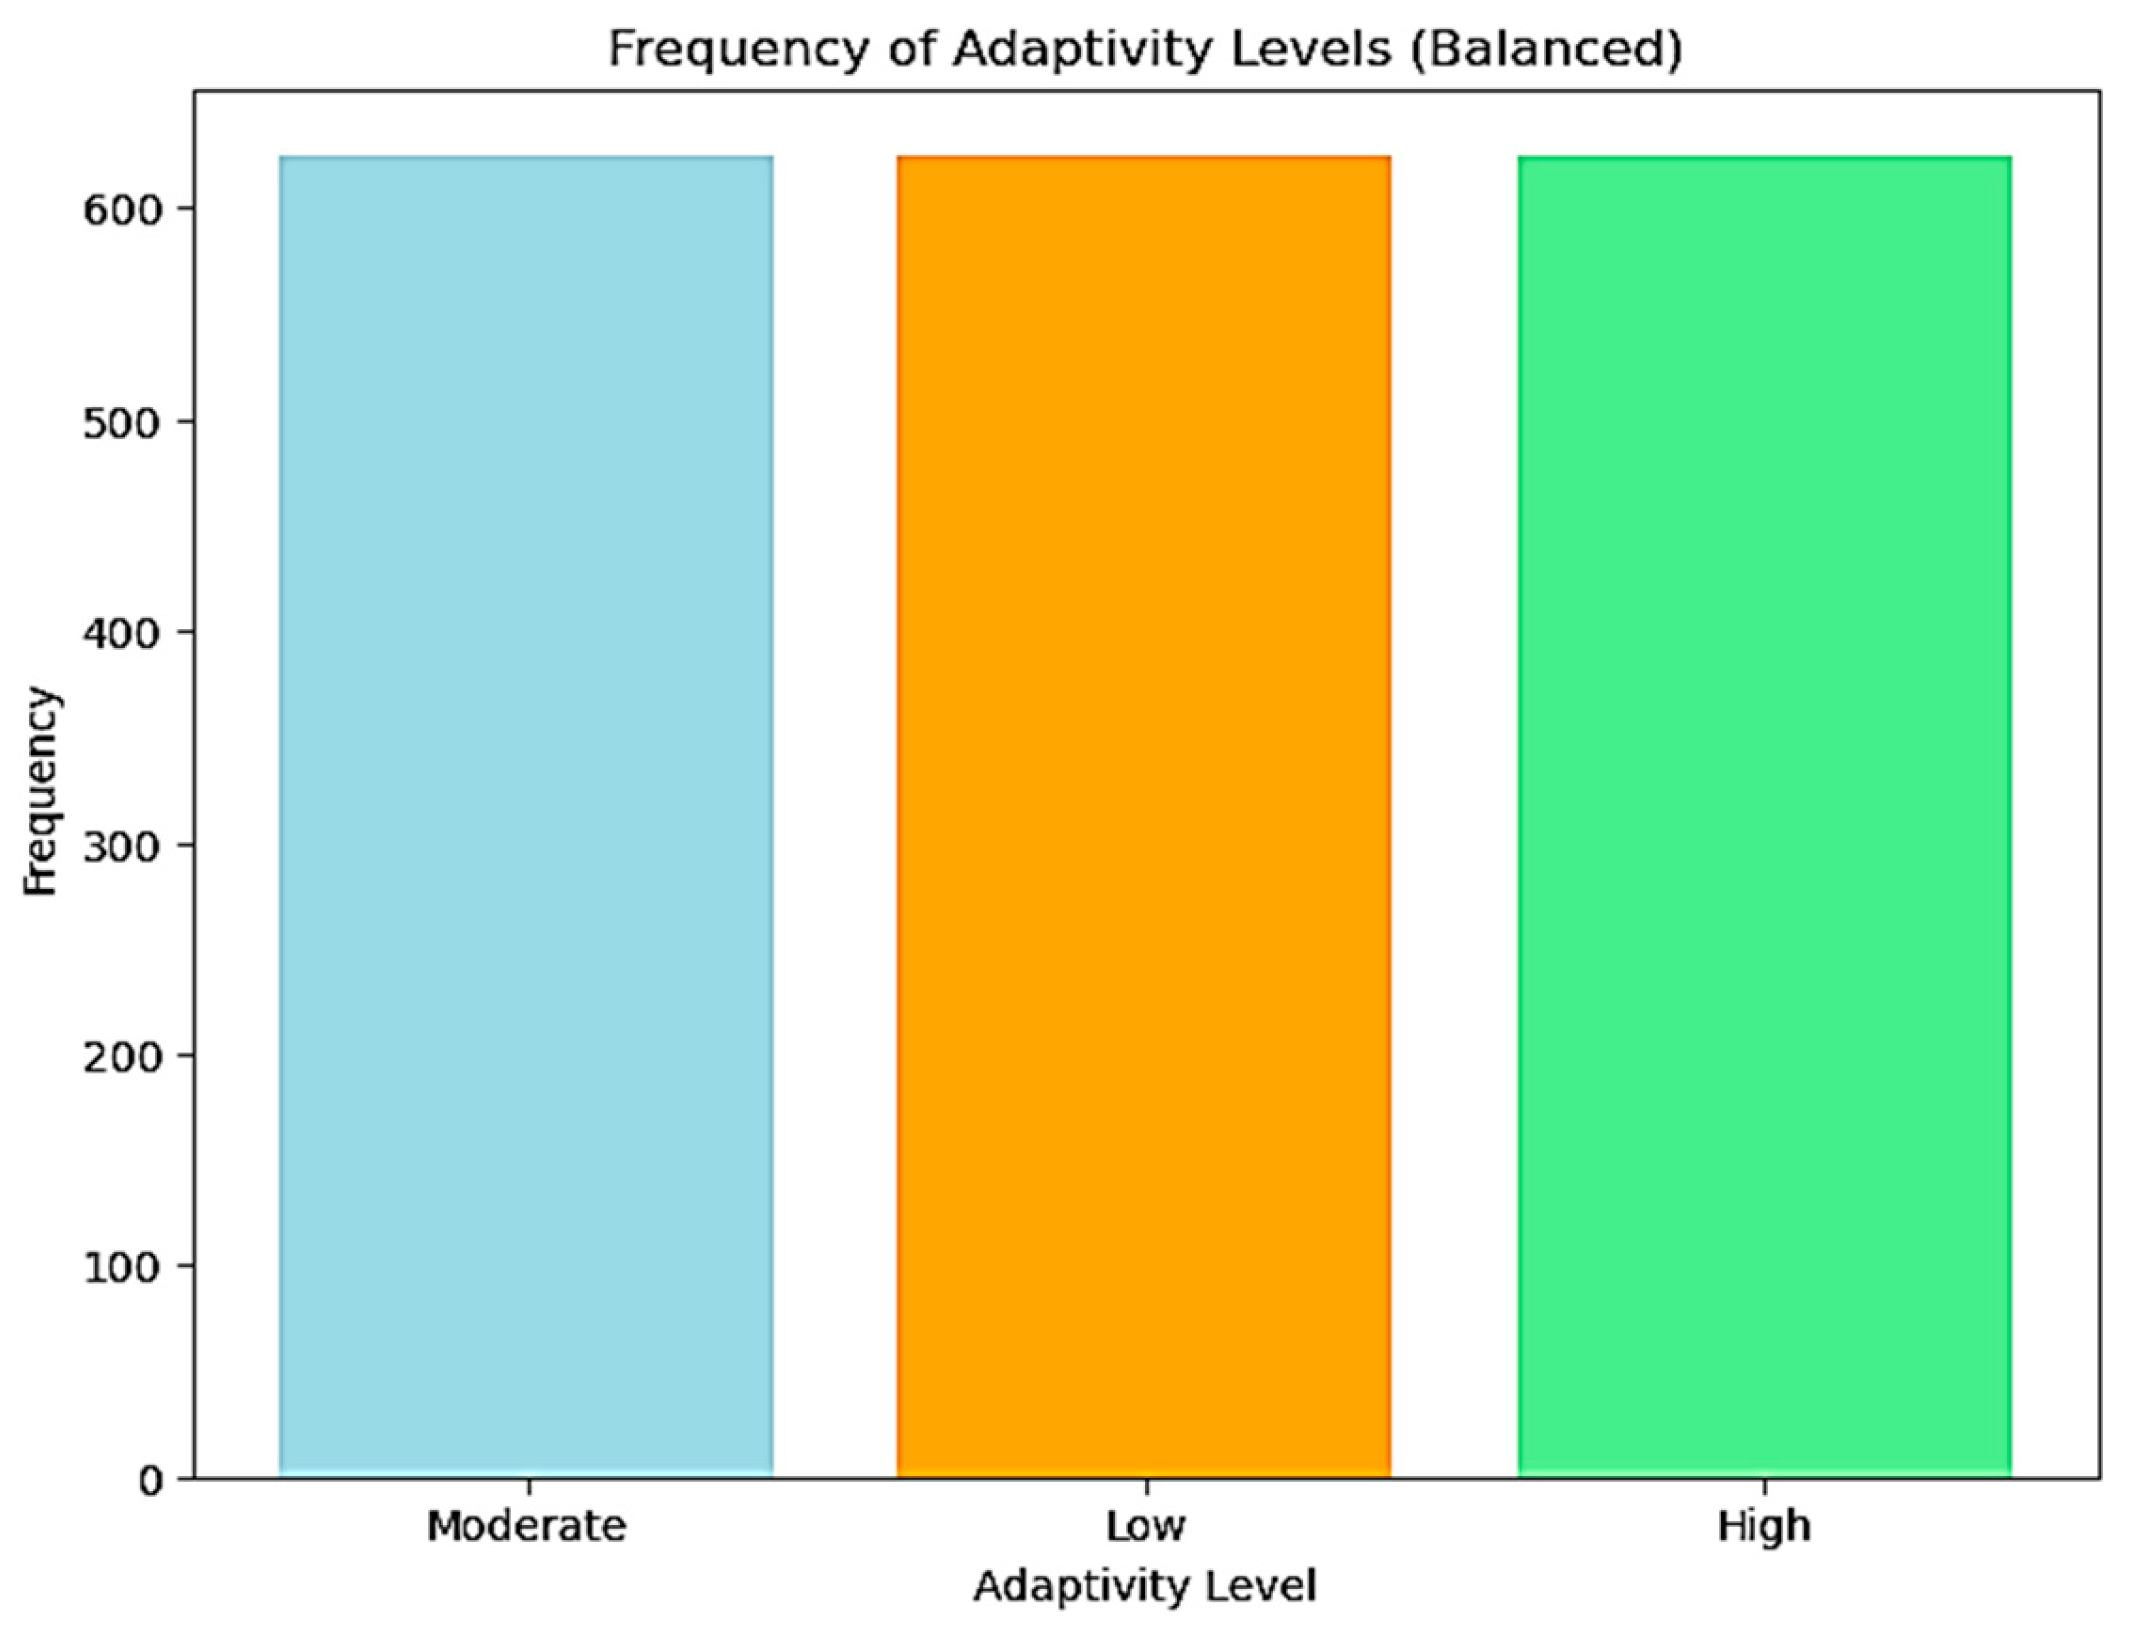
3.1. Dataset
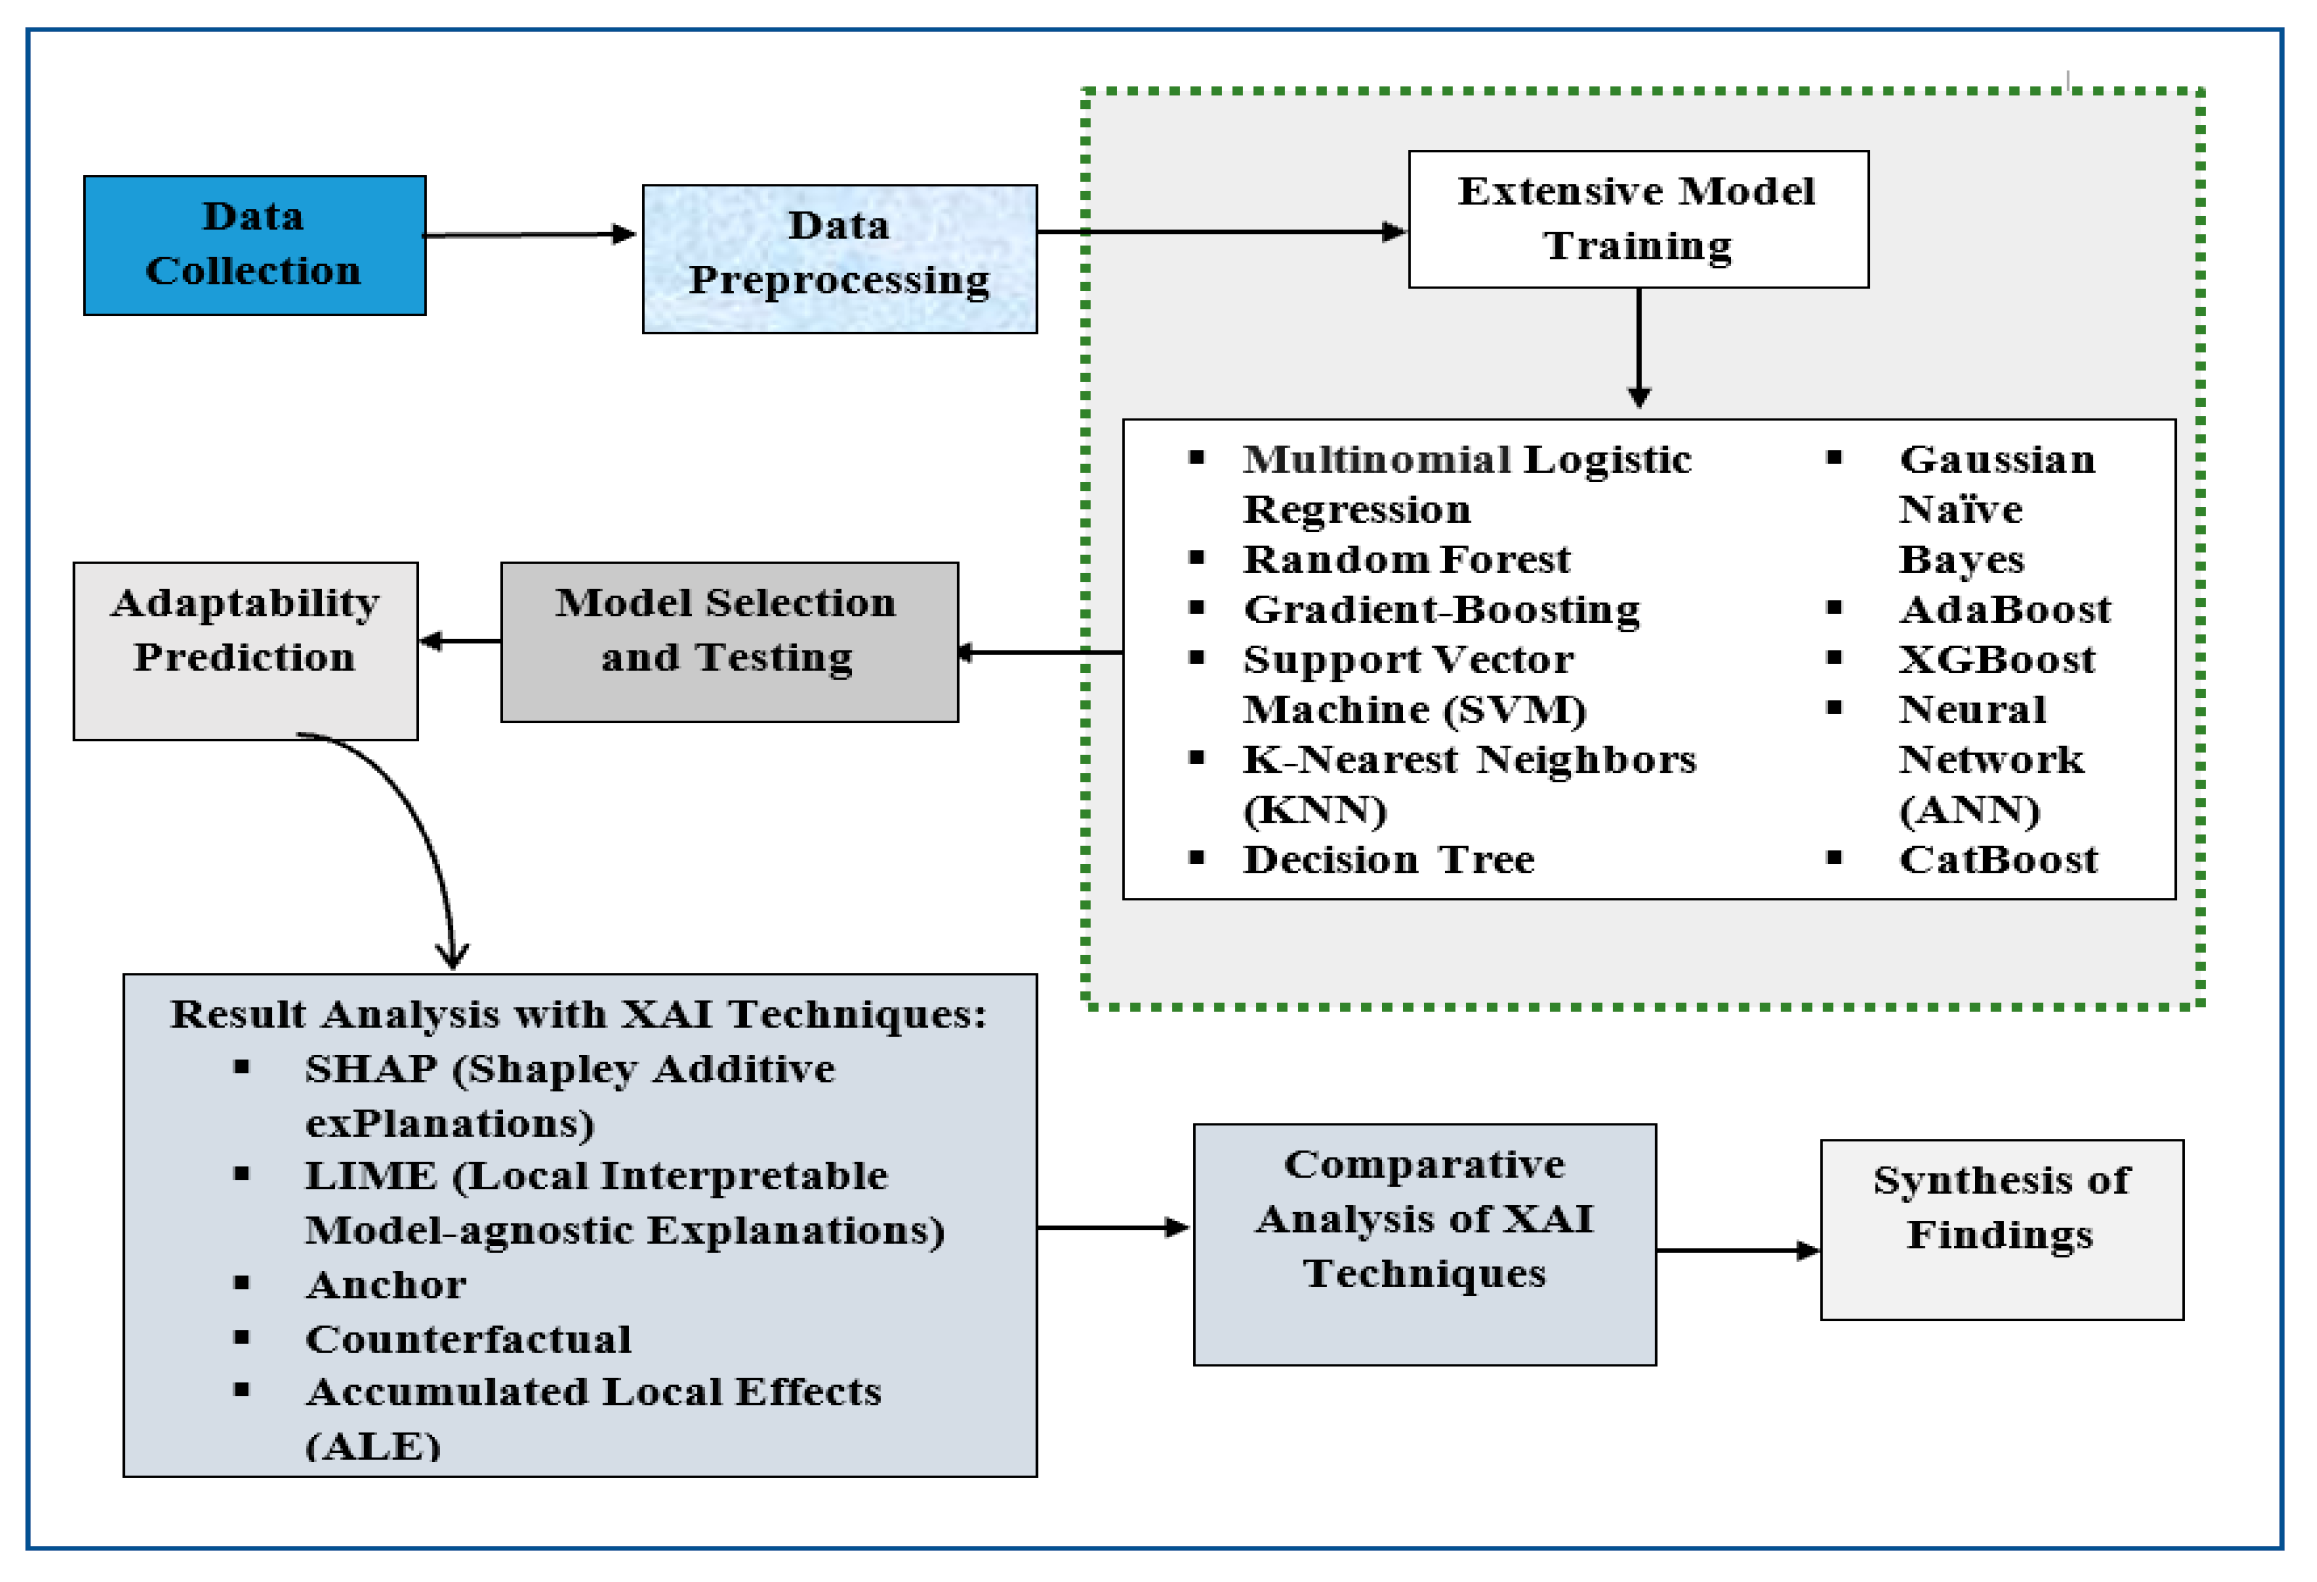
3.2. Research Framework
3.3. Data Preprocessing
3.4. Model Training
3.5. Explainable Artificial Intelligence (xAI) Used
3.5.1. SHAP (Shapley Additive exPlanations)
3.5.2. LIME (Local Interpretable Model-Agnostic Explanations)
3.5.3. Anchor
3.5.4. Accumulated Local Effects (ALE)
- Discretize ‘Class Duration’ into a grid of values.
- For each interval in the grid, compute the difference in the model's prediction as ‘Class Duration’ changes within that interval.
- Accumulate these local effects across the grid to estimate the average effect of ‘Class Duration’ on the model's prediction.
3.5.5. Counterfactual Explanations
4. Results and Discussion
4.1. Experimental Setup
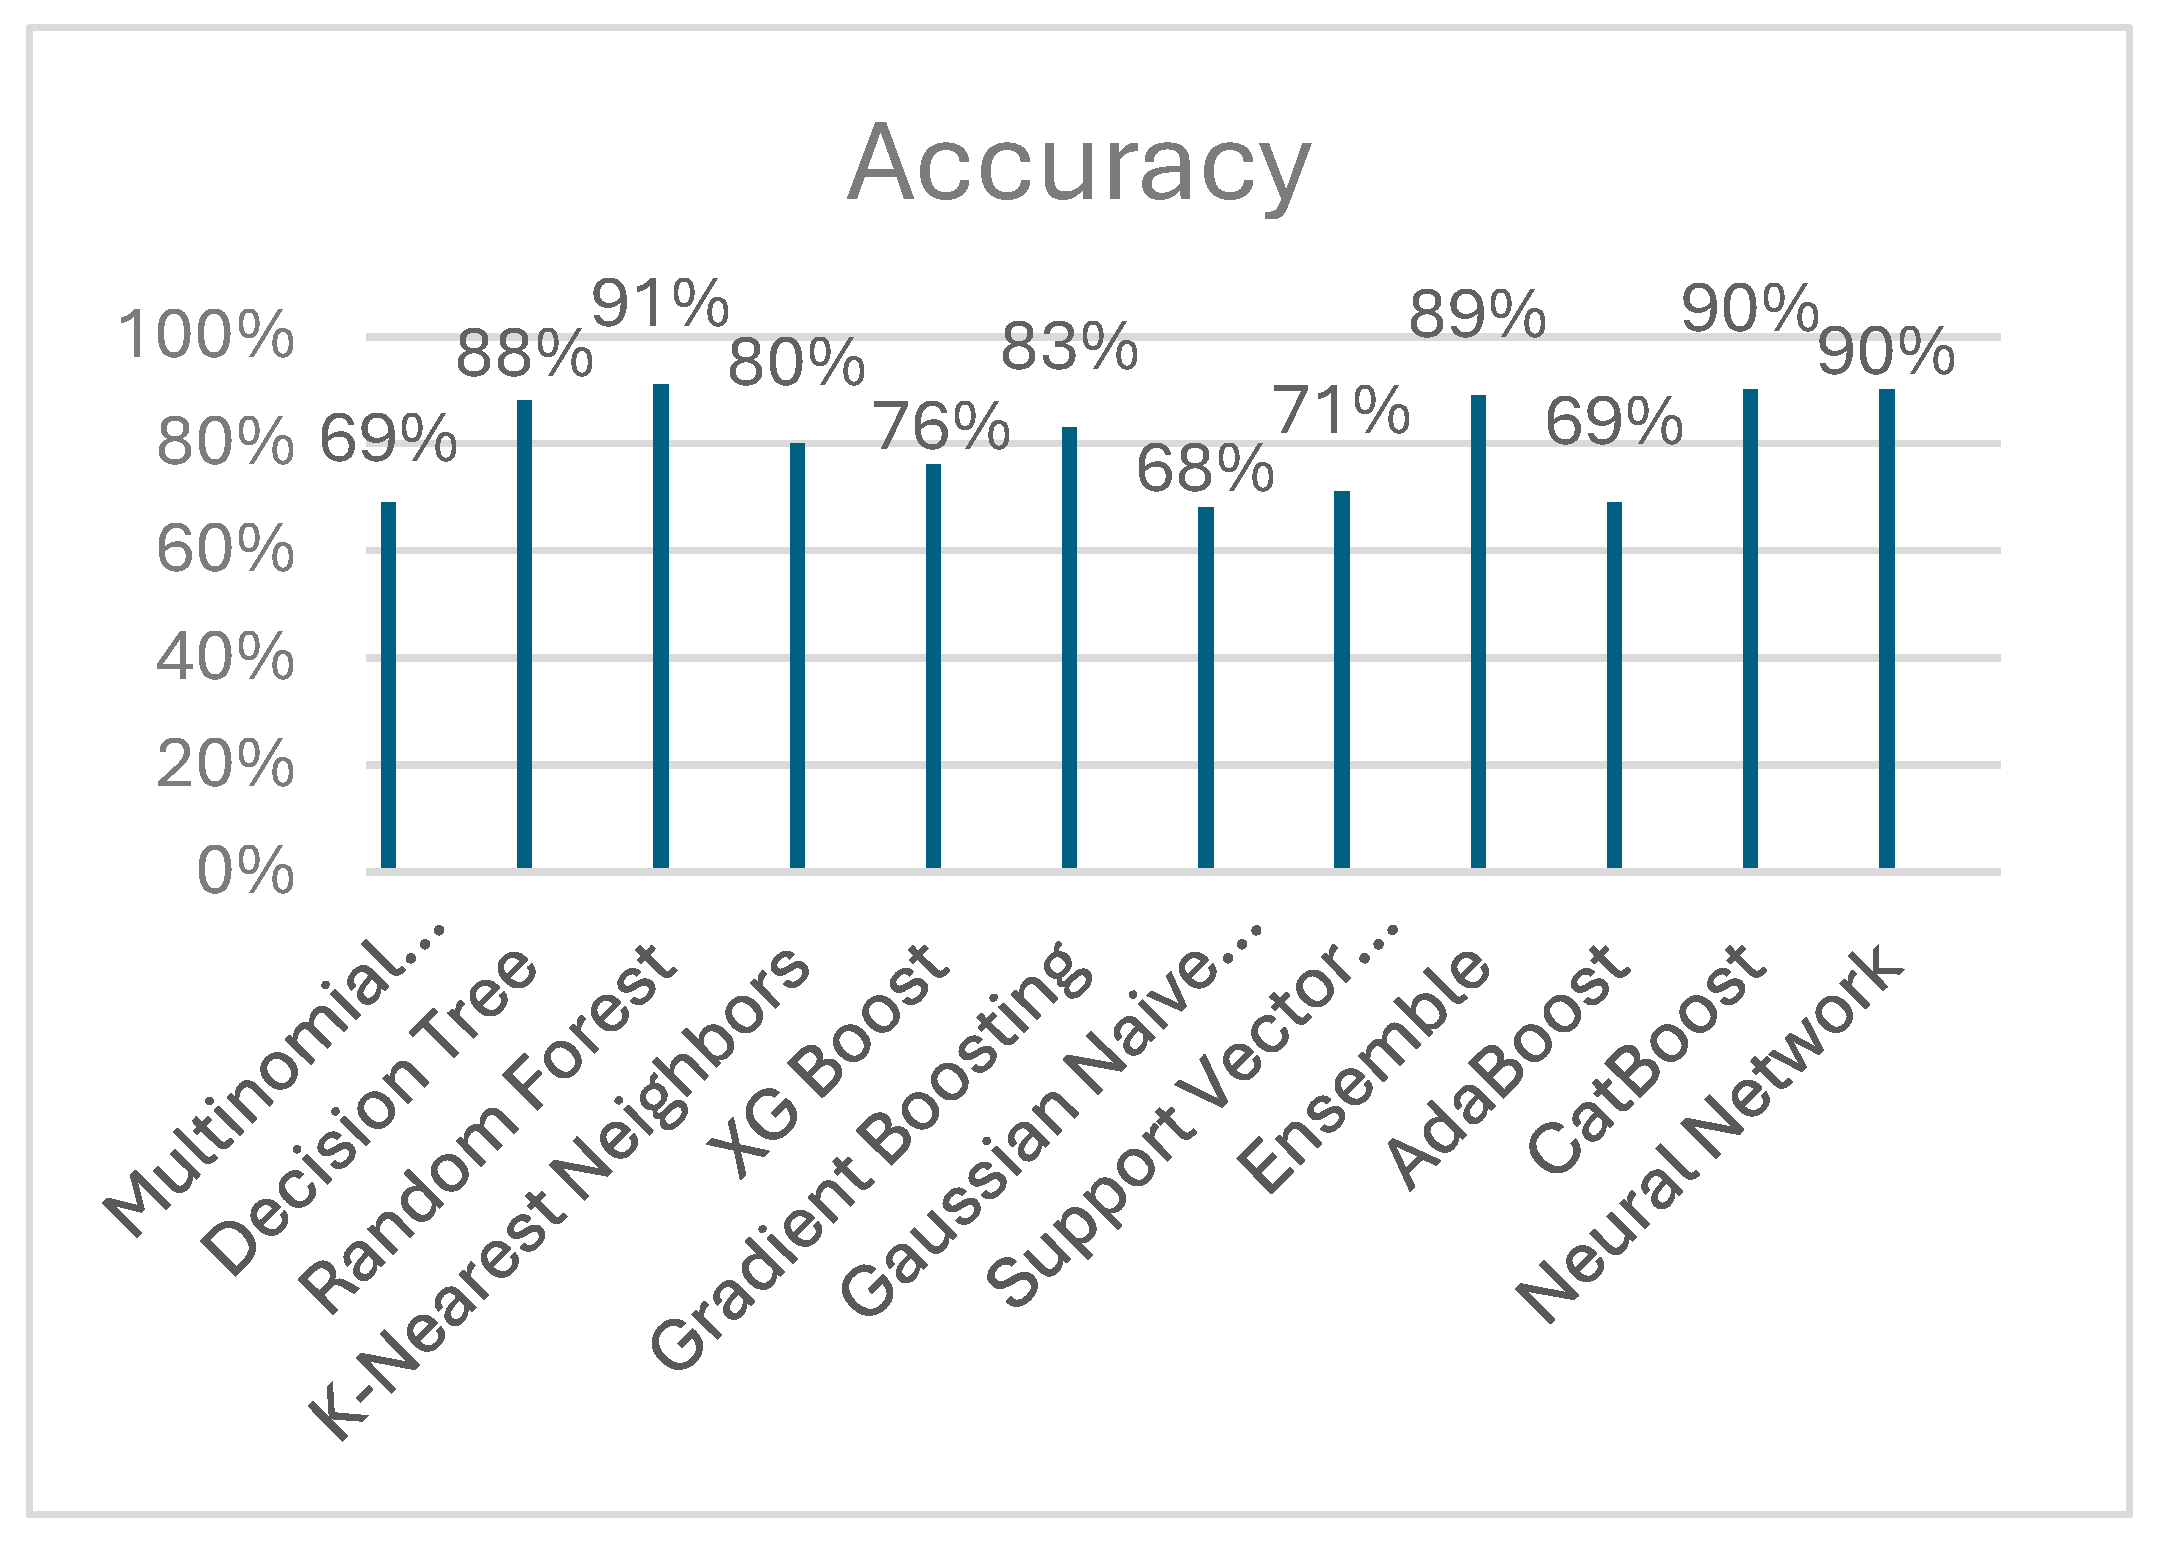
4.2. Model Selection and Prediction
4.3. Result Analysis with XAI Techniques
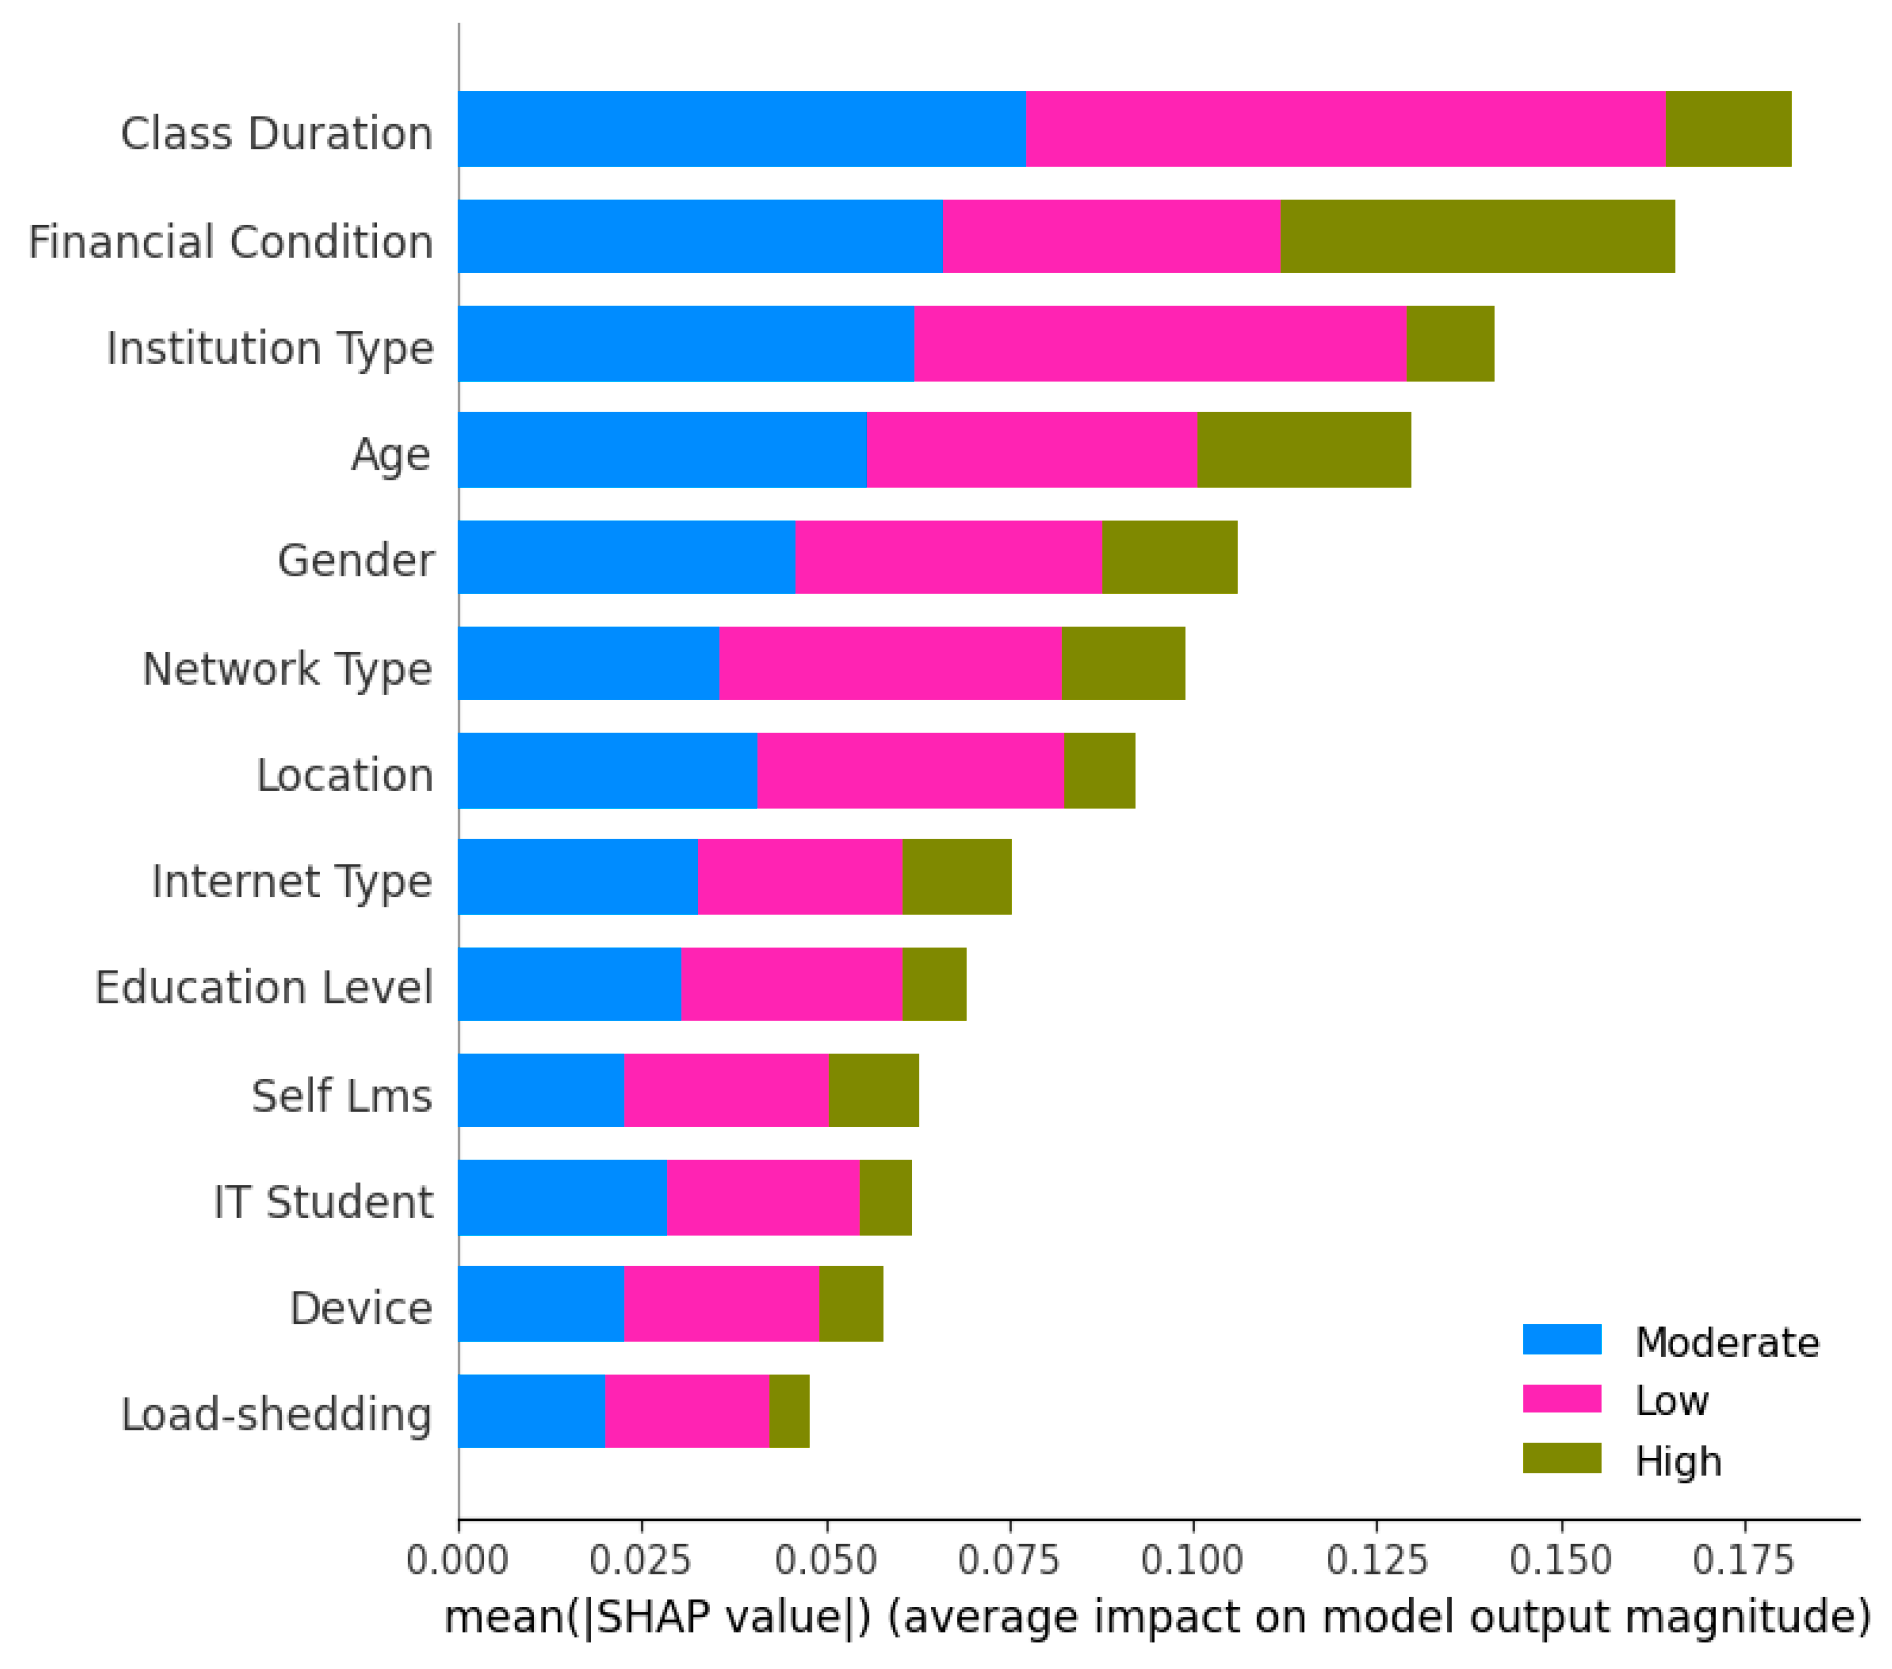
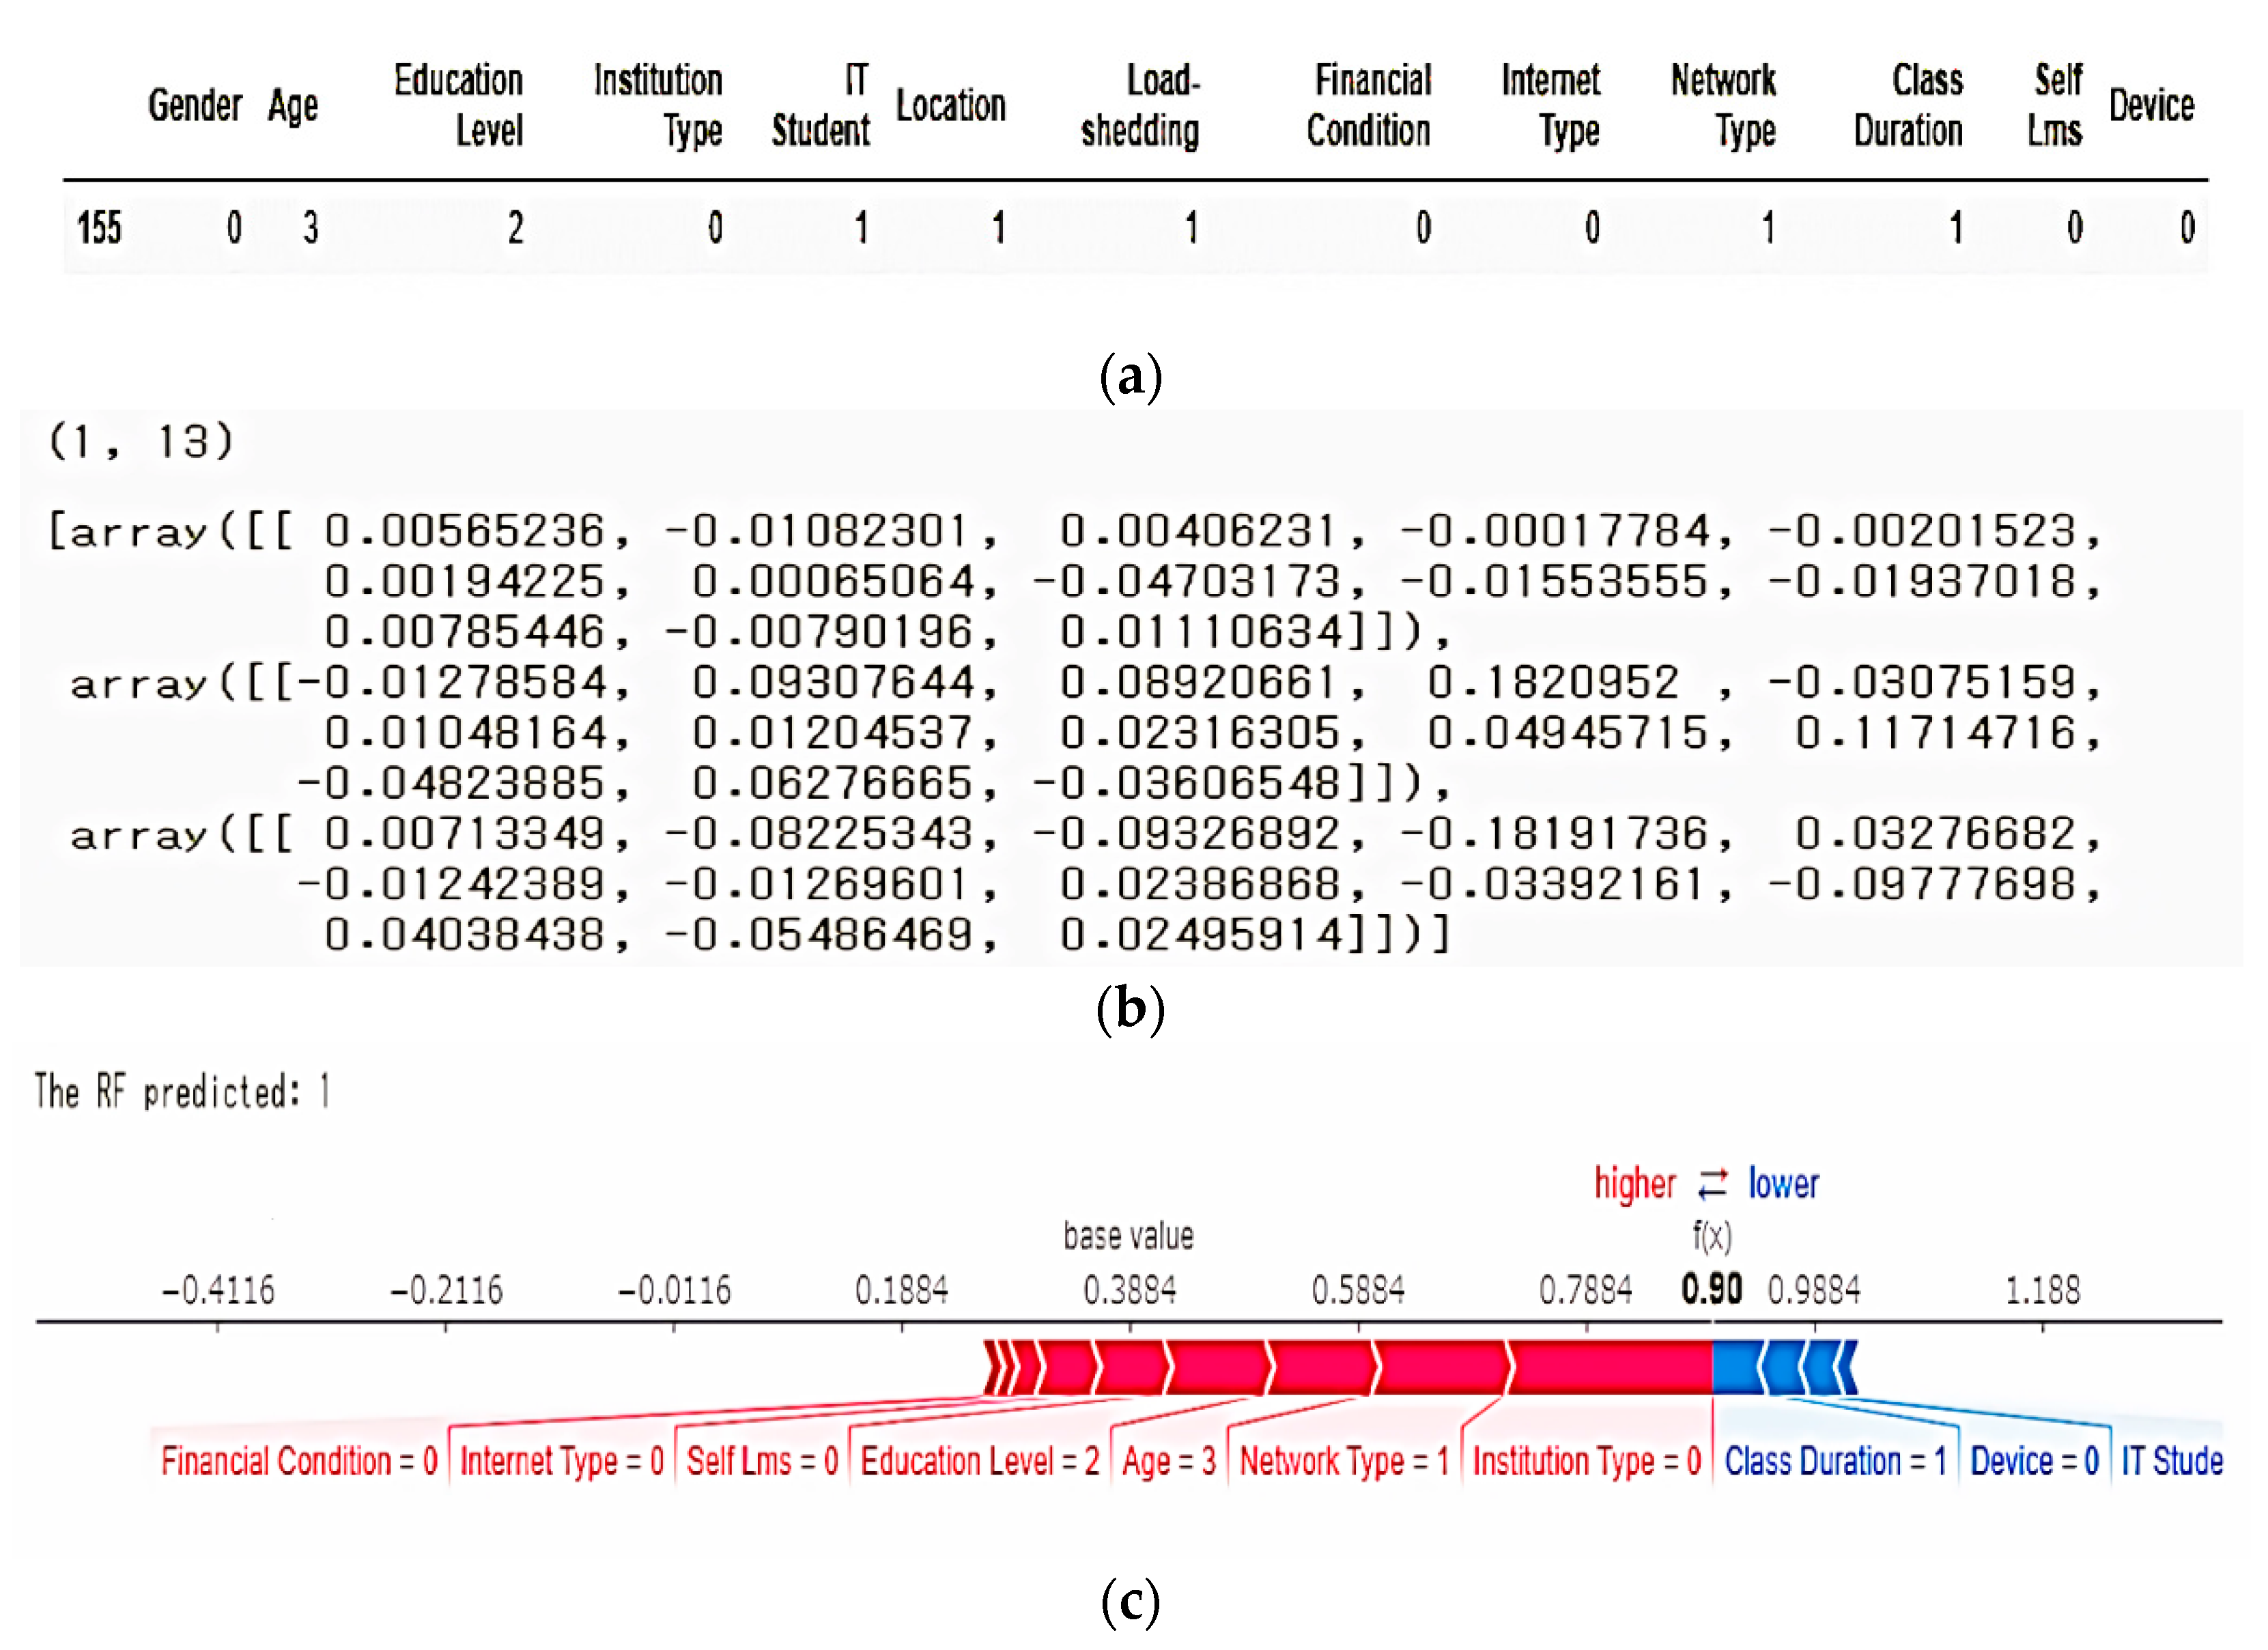
4.3.1. SHAP (Shapley Additive exPlanations)
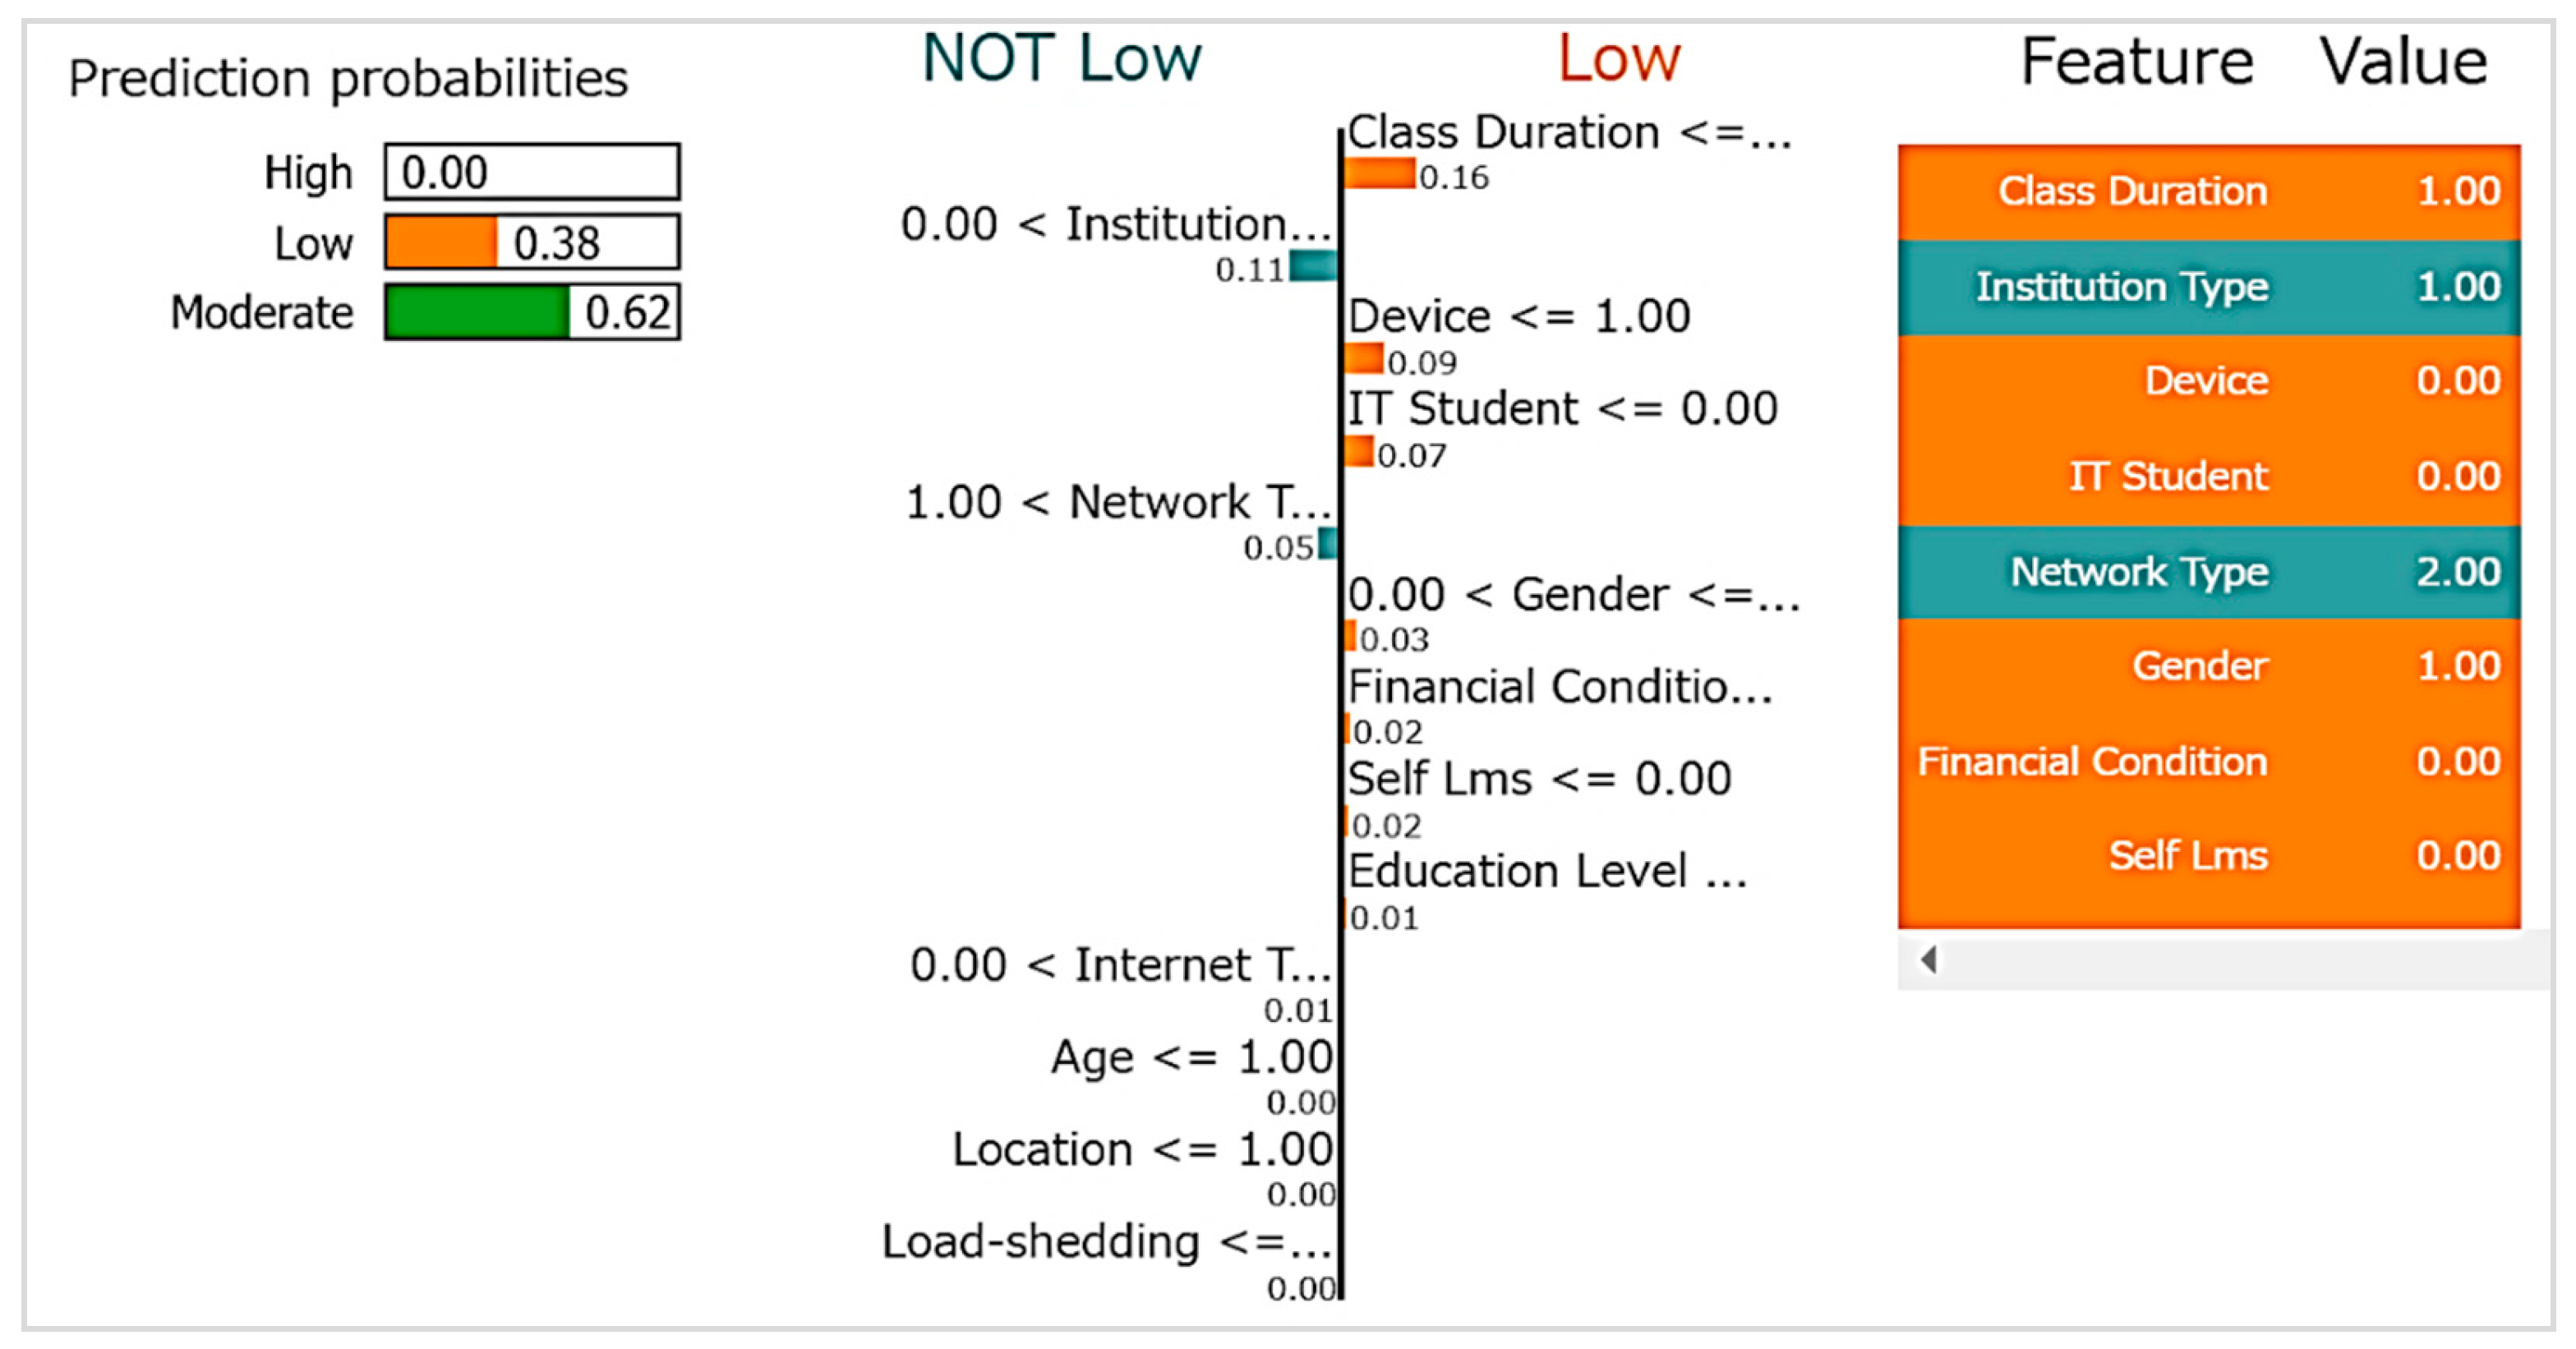
4.3.2. LIME (Local Interpretable Model-Agnostic Explanations
4.3.3. ANCHOR Explanation
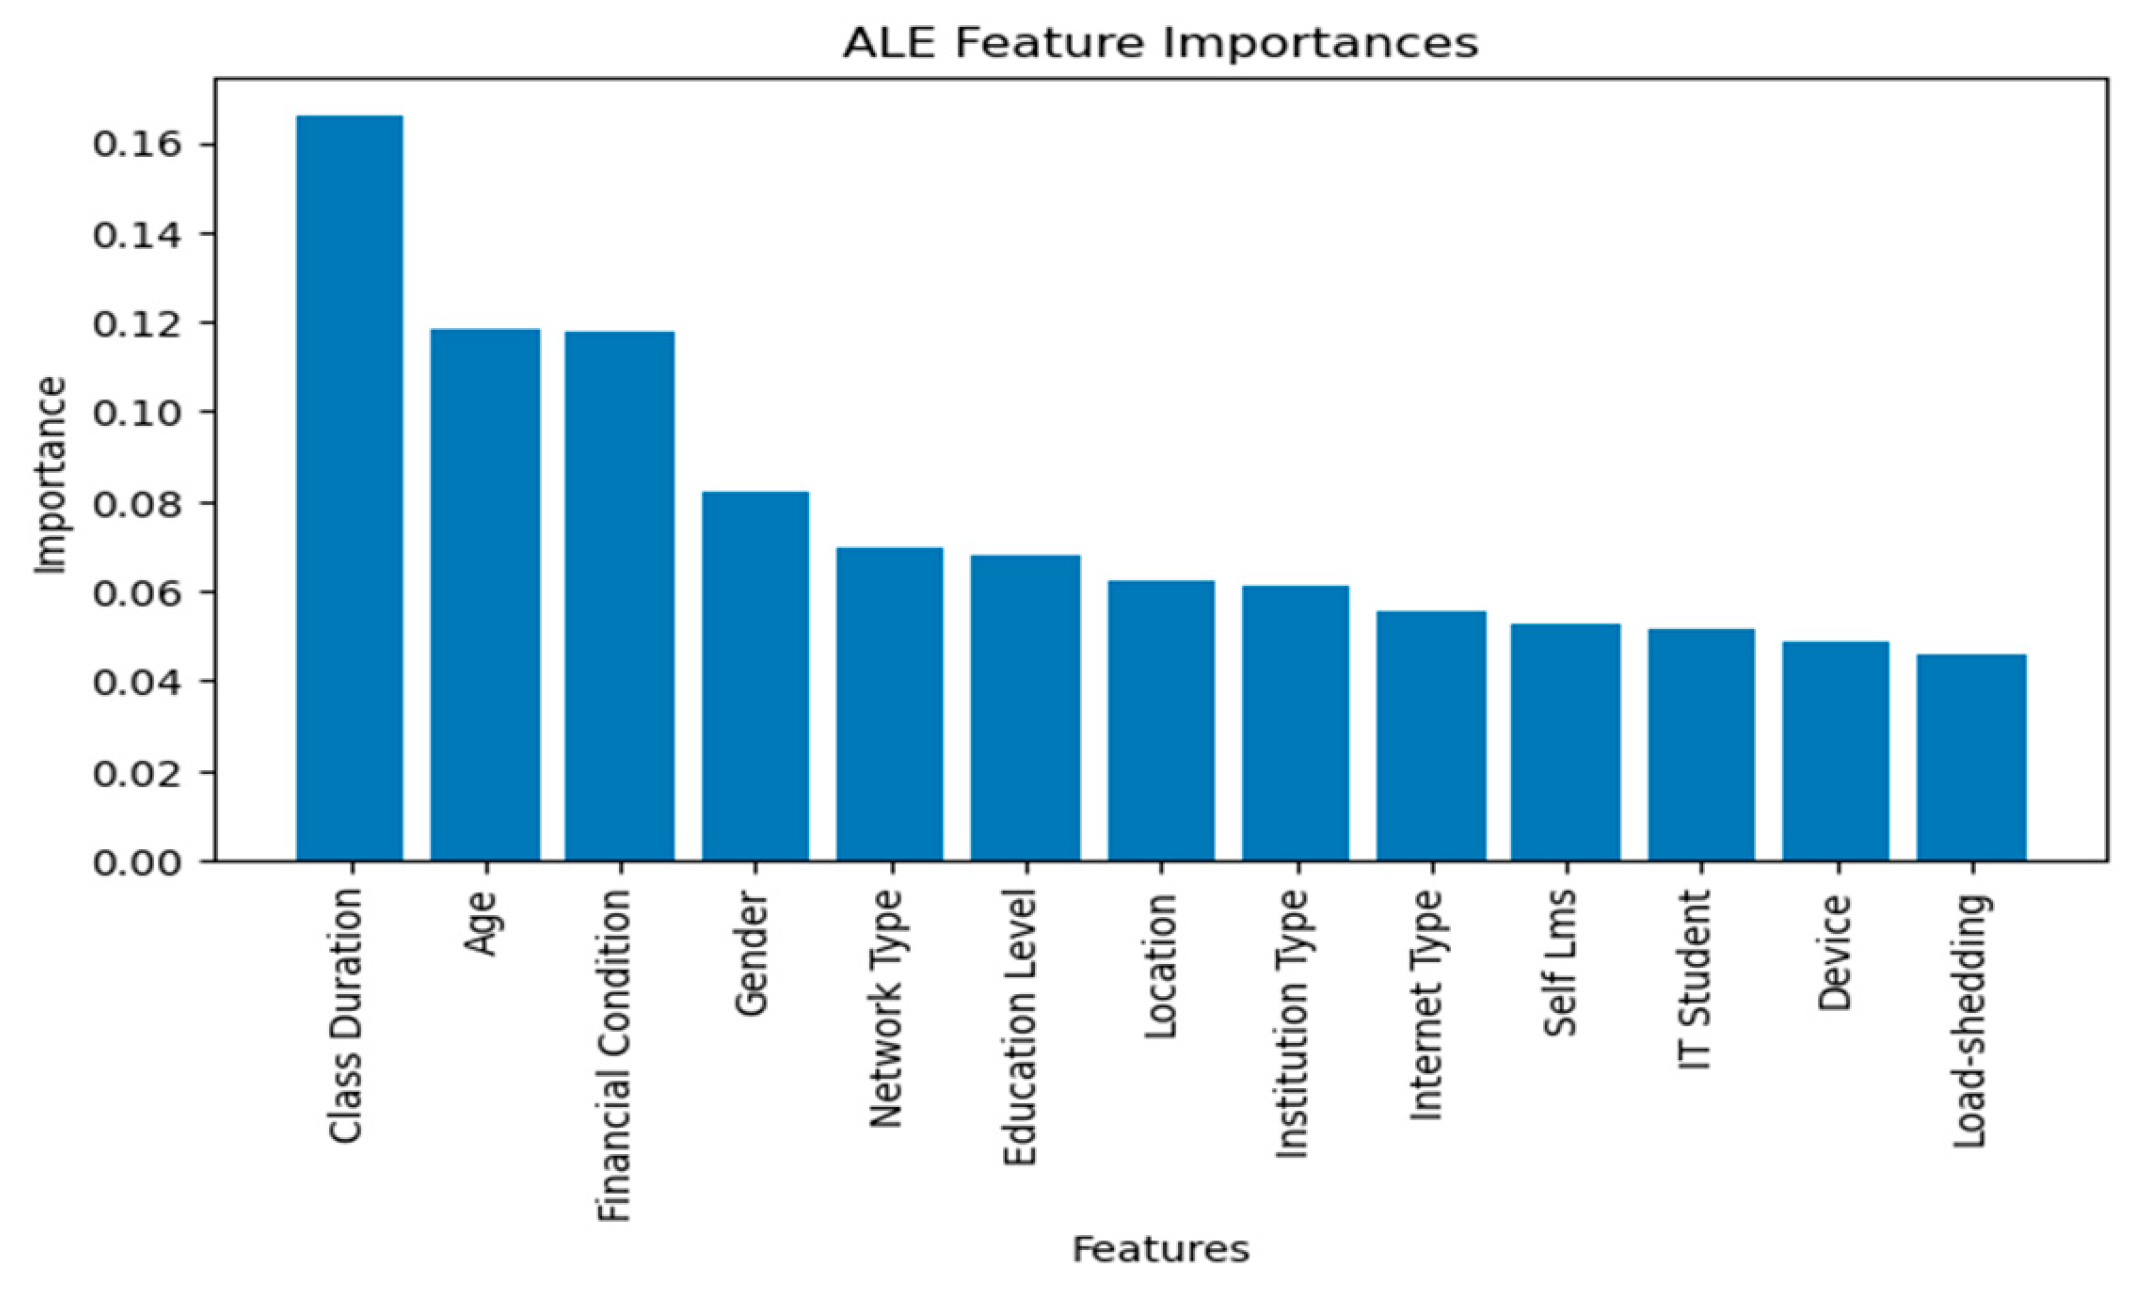
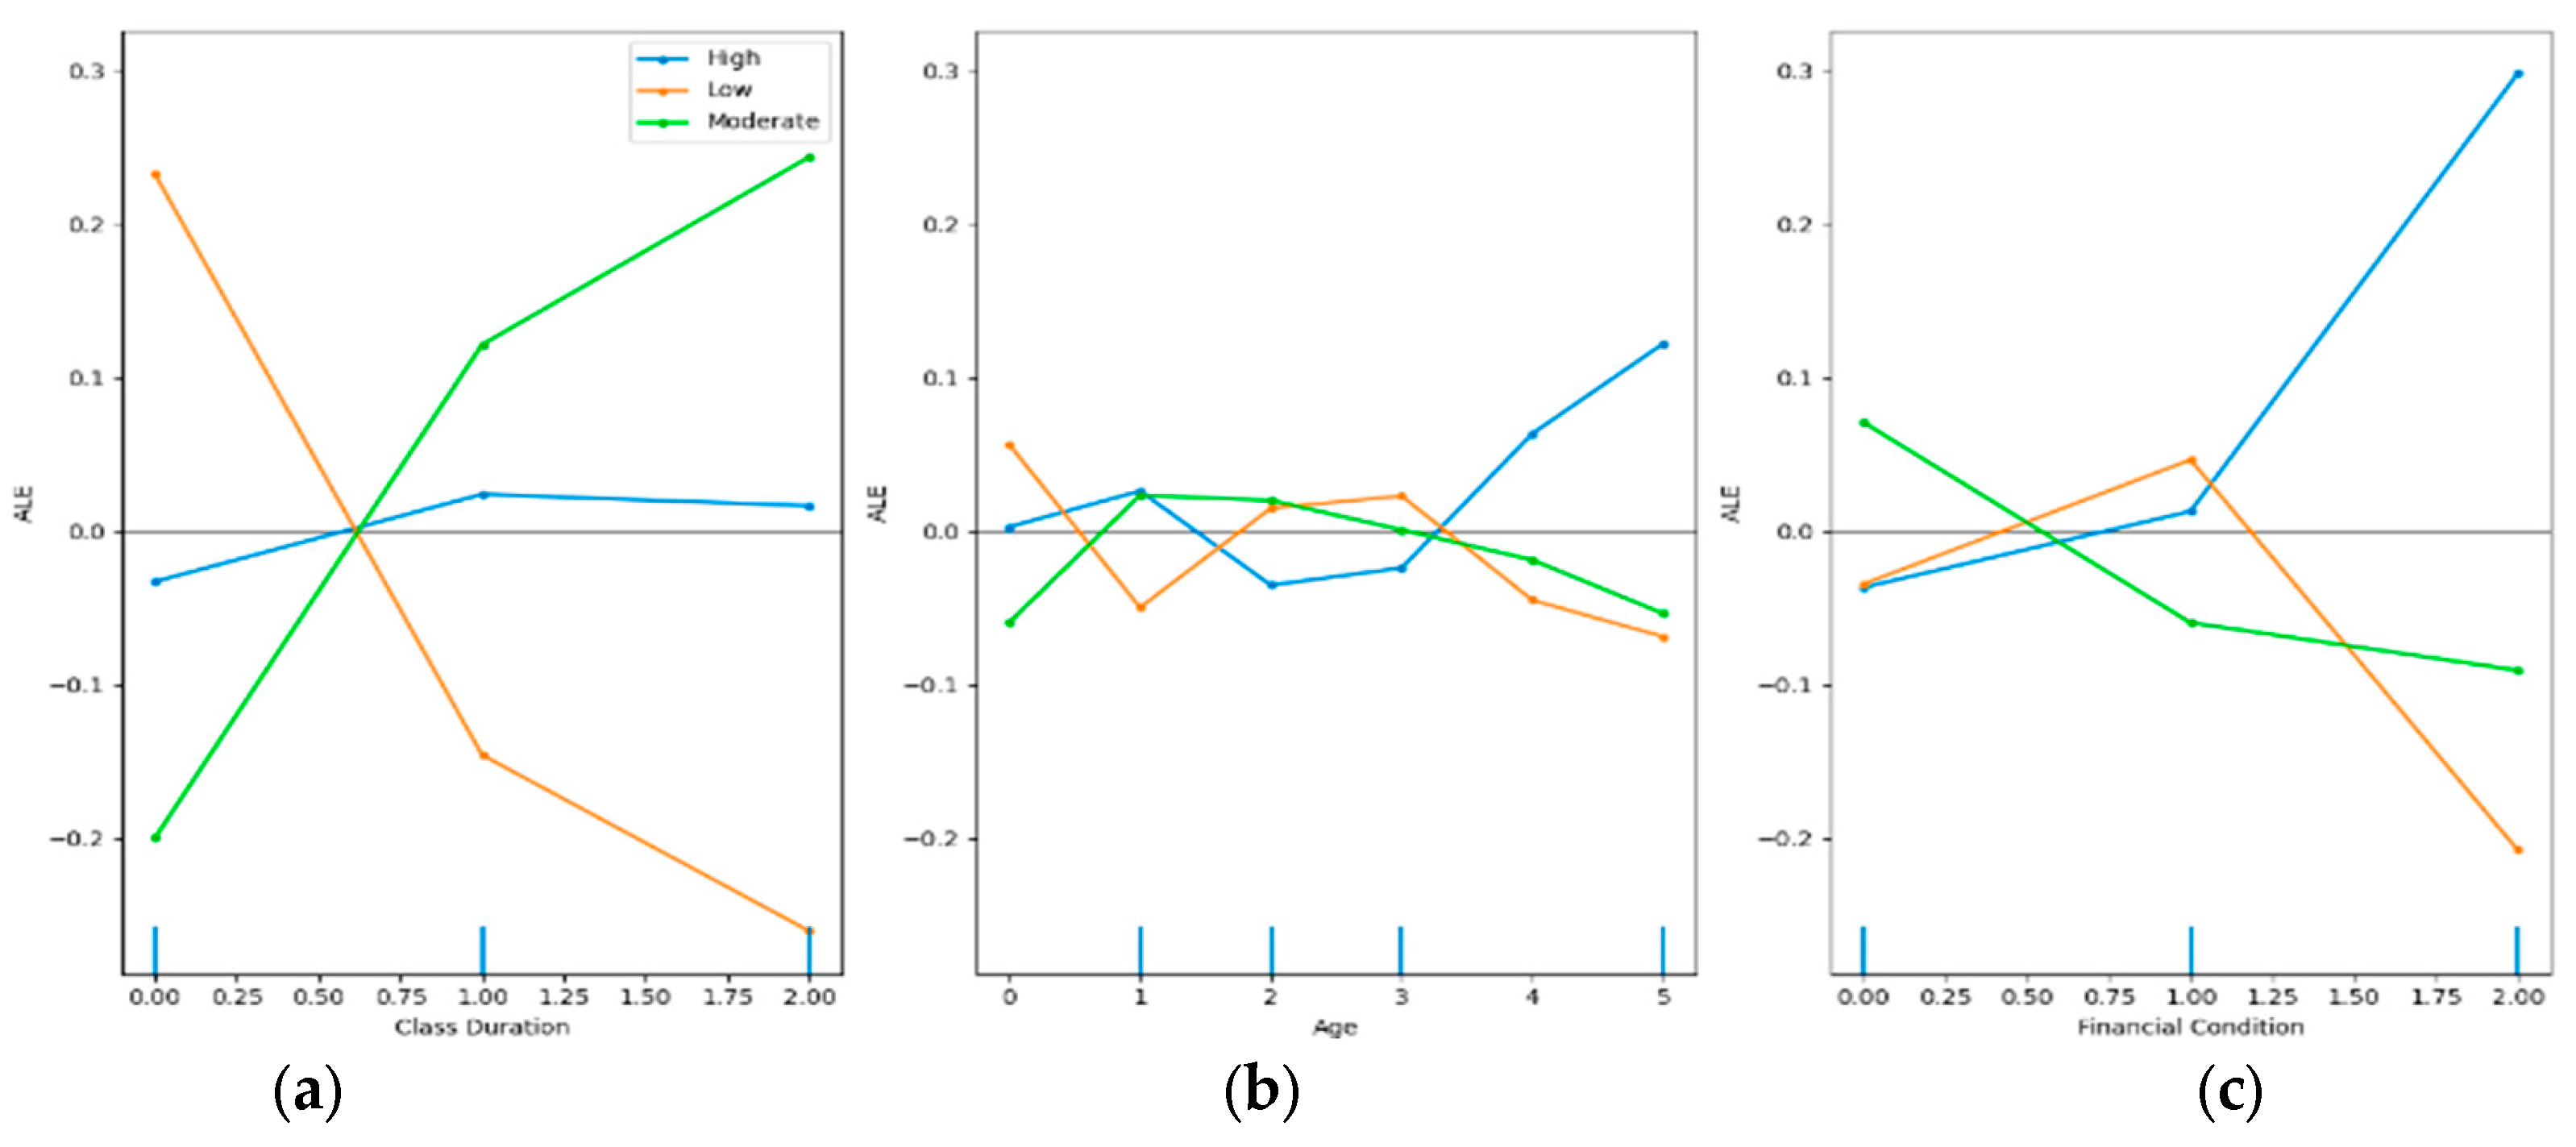
4.3.4. Accumulated Local Effects (ALE) Explanation
4.3.5. Counterfactual Explanation
5. Comparative Analysis of XAI Techniques and Synthesis of Findings
6. Conclusions
References
- Hasan Suzan, M.; Samrin, N.A.; Biswas, A.A.; Pramanik, A. Students’ Adaptability Level Prediction in Online Education Using Machine Learning Approaches. In 2021 12th International Conference on Computing Communication and Networking Technologies (ICCCNT); IEEE: Kharagpur, India, 2021; pp. 1–7. [Google Scholar] [CrossRef]
- Loderer, K.; Rinas, R.; Daumiller, M. Student adaptability, emotions, and achievement: Navigating new academic terrains in a global crisis. Learning and Individual Differences 2021, 90, 102046. [Google Scholar] [CrossRef] [PubMed]
- Peng, H.; Ma, S.; Spector, J.M. Personalized Adaptive Learning: an emerging pedagogical approach enabled by a smart learning environment. In Lecture notes in educational technology; 2019; pp 171–176. [CrossRef]
- Haleem, A.; Javaid, M.; Qadri, M.A.; Suman, R. Understanding the role of digital technologies in education: A review. Sustainable Operations and Computers 2022, 3, 275–285. [Google Scholar] [CrossRef]
- Jang, Y.; Choi, S.; Jung, H.; Kim, H. Practical early prediction of students’ performance using machine learning and eXplainable AI. Education and Information Technologies 2022, 27, 12855–12889. [Google Scholar] [CrossRef]
- Adadi, A.; Berrada, M. Peeking Inside the Black-Box: A survey on Explainable Artificial Intelligence (XAI). IEEE Access 2018, 6, 52138–52160. [Google Scholar] [CrossRef]
- White, G.L. Adaptive Learning Technology Relationship with Student Learning Outcomes. Journal of Information Technology Education 2020, 19, 113–130. [Google Scholar] [CrossRef] [PubMed]
- Liem, G.A.D.; Martin, A.J. Young people’s responses to environmental issues: Exploring the roles of adaptability and personality. Personality and Individual Differences 2015, 79, 91–97. [Google Scholar] [CrossRef]
- Ribeiro, M.T.; Singh, S.; Guestrin, C. “Why Should I Trust You?”: Explaining the Predictions of Any Classifier. In Proceedings of the 22nd ACM SIGKDD International Conference on Knowledge Discovery and Data Mining; ACM: San Francisco California USA, 2016; pp. 1135–1144. [Google Scholar] [CrossRef]
- Lundberg, S.; Lee, S.-I. A Unified Approach to Interpreting Model Predictions. arXiv November 24, 2017. Available online: http://arxiv.org/abs/1705.07874 (accessed on 8 May 2024).
- Ribeiro, M.T.; Singh, S.; Guestrin, C. Anchors: High-Precision Model-Agnostic Explanations. AAAI 2018, 32. [Google Scholar] [CrossRef]
- She, C.; Li, Q.; Jiang, W.; Xing, Q. Learning adaptability facilitates self-regulated learning at school: the chain mediating roles of academic motivation and self-management. Frontiers in Psychology 2023, 14. [Google Scholar] [CrossRef] [PubMed]
- Martin, F.; Chen, Y.; Moore, R.L.; Westine, C.D. Systematic review of adaptive learning research designs, context, strategies, and technologies from 2009 to 2018. Educational Technology Research and Development 2020, 68, 1903–1929. [Google Scholar] [CrossRef]
- Tiwari, R. G.; Jain, A.; Kukreja, V.; Ujjwal, N. Education 4.0: Explainable Machine Learning for Classification of student Adaptability. 2022 International Conference on Data Analytics for Business and Industry (ICDABI) 2022. [CrossRef]
- Adnan, M.; Uddin, I.; Khan, E.; Alharithi, F.S.; Amin, S.; Alzahrani, A.A. Earliest possible global and local interpretation of students’ performance in virtual learning environment by leveraging explainable AI. IEEE Access 2022, 10, 129843–129864. [Google Scholar] [CrossRef]
- Gligorea, I.; Yaseen, M.U.; Cioca, M.; Gorski, H.; Oancea, R. An interpretable framework for an efficient analysis of students’ academic performance. Sustainability 2022, 14, 8885. [Google Scholar] [CrossRef]
- Rao, S.; Mehta, S.; Kulkarni, S.; Dalvi, H.; Katre, N.; Narvekar, M. A Study of LIME and SHAP Model Explainers for Autonomous Disease Predictions. In 2022 IEEE Bombay Section Signature Conference (IBSSC); IEEE, 2022; pp 1–6. [CrossRef]
- Mothilal, R.K.; Sharma, A.; Tan, C. Explaining Machine Learning Classifiers through Diverse Counterfactual Explanations. FAT* 2020 - Proc. 2020 Conf. Fairness, Accountability, Transpar. 2020, 607–617. [CrossRef]
- Van Looveren, A.; Klaise, J. Interpretable Counterfactual Explanations Guided by Prototypes. Lect. Notes Comput. Sci. (including Subser. Lect. Notes Artif. Intell. Lect. Notes Bioinformatics) 2021, 12976 LNAI, 650–665. [CrossRef]
- Wachter, S.; Mittelstadt, B.; Russell, C. Counterfactual Explanations Without Opening the Black Box: Automated Decisions and the GDPR. SSRN Electron. J. 2017, 1–52. [Google Scholar] [CrossRef]
- Suzan, M.M.H.; Samrin, N.A. Students Adaptability Level in Online Education. Www.Kaggle.Com. https://www.kaggle.com/datasets/mdmahmudulhasansuzan/students-adaptability-level-in-online-education.
- Lundberg, S.M.; Erion, G.G.; Lee, S. Consistent Individualized Feature Attribution for Tree Ensembles. 2018, 18.
- Pereira, F.D.; Fonseca, S.C.; Oliveira, E.H.T.; Cristea, A.I.; Bellhauser, H.; Rodrigues, L.; Oliveira, D.B.F.; Isotani, S.; Carvalho, L.S.G. Explaining Individual and Collective Programming Students’ Behaviour by Interpreting a Black-Box Predictive Model. IEEE Access 2021, 117097–117119. [Google Scholar] [CrossRef]
- Christoph Molnar. Interpretable Machine Learning: A Guide for Making Black Box Models Explainable (2nd Ed.), 2nd ed.; 2022.
- Shrikumar, A.; Greenside, P.; Kundaje, A. Learning Important Features Through Propagating Activation Differences. 2017.
- García-Magariño, I.; Muttukrishnan, R.; Lloret, J. Human-Centric AI for Trustworthy IoT Systems with Explainable Multilayer Perceptrons. IEEE Access 2019, 7, 125562–125574. [Google Scholar] [CrossRef]
- Guidotti, R.; Monreale, A.; Ruggieri, S.; Turini, F.; Pedreschi, D.; Giannotti, F. A Survey Of Methods For Explaining Black Box Models; 2018; pp 1–45.
- Apley, D.W.; Zhu, J. Visualizing the effects of predictor variables in black box supervised learning models. arXiv.org. https://arxiv.org/abs/1612.08468.
- Grath, R.M.; Costabello, L.; Van, C.L.; Sweeney, P.; Kamiab, F.; Shen, Z.; Lecue, F. Interpretable credit application predictions with counterfactual explanations. arXiv.org. https://arxiv.org/abs/1811.05245.
- Tanyel, T.; Ayvaz, S.; Keserci, B. Beyond known reality: exploiting counterfactual explanations for medical research. arXiv (Cornell University) 2023. [CrossRef]

| Variable | Count | Unique | Top | Freq |
|---|---|---|---|---|
| Gender | 1205 | 2 | Boy | 603 |
| Age | 1205 | 6 | 21-25 | 374 |
| Education Level | 1205 | 3 | School | 530 |
| Institution Type | 1205 | 2 | Non-Government | 623 |
| IT Student | 1205 | 2 | No | 501 |
| Location | 1205 | 2 | Yes | 135 |
| Load-shedding | 1200 | 2 | Low | 1004 |
| Financial Condition | 1206 | 3 | Mid | 676 |
| Internet Type | 1205 | 2 | Mobile | 655 |
| Network Type | 1205 | 3 | 4G | 775 |
| Class Duration | 1205 | 3 | 1-3 | 840 |
| Self Lms | 1205 | 2 | No | 955 |
| Device | 1205 | 3 | Mobile | 1013 |
| Adaptivity Level | 1205 | 3 | Moderate | 625 |
| S/N | Model | Parameters | Values |
|---|---|---|---|
| 1 | Multinomial Logistic Regression |
MaximumIterations(max_iter) multi_class |
1000 auto |
| 2 | Decision Tree | max_depth min_samples_leaf min_samples_split criterion splitter max_features |
range (1, 20, 2) range (1, 100, 5) range (2, 10) gini and entropy best and random sqrt |
| 3 | Random Forest | random_state | 0 |
| 4 | K-Nearest Neighbors | n_neighbors | 5 |
| 5 | XG Boost | max_depth learning_rate n_estimators |
5 0.01 200 |
| 6 | Gradient Boosting | n_estimators random_state |
100 42 |
| 7 | Gaussian Naive Bayes | Gaussian Naive Bayes | Normal no special setup |
| 8 | Support Vector Machine (SVM) | Kernel Regularization Parameter (C) Random State |
Linear 1.0 42 |
| 9 | Ensemble | Random Forest Classifier random_state Gradient Boosting Classifier random_state Logistic Regression max_iter random_state Ensemble method used |
42 42 1500 42 voting |
| 10 | AdaBoost | Base Classifier max_depth n_estimators random_state |
Decision Tree 1 50 42 |
| 11 | CatBoost | Iterations Depth learning_rate verbose random_state early_stopping_rounds |
1500 6 0.1 200 42 50 |
| 12 | Neural Network | Input Layer Activation Function First Hidden Layer: Units Second Hidden Layer Units Third Hidden Layer Units Output Layer Units Activation Function |
X_train_stand ReLU 64 32 16 3 Softmax |
| Actual | Model | Class Name | Predicted | ||
| High | Low | Moderate | |||
| Multinomial Logistic Regression | High | 11 | 5 | 7 | |
| Low | 1 | 57 | 45 | ||
| Moderate | 3 | 14 | 98 | ||
| Decision Tree | High | 15 | 0 | 8 | |
| Low | 2 | 95 | 6 | ||
| Moderate | 1 | 7 | 107 | ||
| Random Forest | High | 15 | 0 | 8 | |
| Low | 2 | 97 | 4 | ||
| Moderate | 0 | 7 | 108 | ||
| K-Nearest Neighbors | High | 10 | 1 | 12 | |
| Low | 1 | 89 | 13 | ||
| Moderate | 2 | 19 | 94 | ||
| XG Boost | High | 12 | 0 | 11 | |
| Low | 3 | 67 | 33 | ||
| Moderate | 2 | 8 | 105 | ||
| Gradient Boosting | High | 13 | 0 | 10 | |
| Low | 2 | 87 | 14 | ||
| Moderate | 0 | 14 | 101 | ||
| Gaussian Naive Bayes | High | 13 | 3 | 7 | |
| Low | 2 | 62 | 39 | ||
| Moderate | 6 | 20 | 89 | ||
| Support Vector Machine (SVM) | High | 13 | 1 | 9 | |
| Low | 3 | 57 | 43 | ||
| Moderate | 4 | 9 | 102 | ||
| Ensemble | High | 12 | 1 | 10 | |
| Low | 0 | 92 | 11 | ||
| Moderate | 0 | 4 | 111 | ||
| AdaBoost | High | 8 | 3 | 12 | |
| Low | 2 | 69 | 32 | ||
| Moderate | 3 | 22 | 90 | ||
| CatBoost | High | 15 | 0 | 8 | |
| Low | 2 | 95 | 6 | ||
| Moderate | 0 | 8 | 107 | ||
| Neural Network | High | 15 | 0 | 8 | |
| Low | 2 | 93 | 8 | ||
| Moderate | 0 | 7 | 108 | ||
| Model | Class Name |
Precision | Recall | F1-score |
|---|---|---|---|---|
| Multinomial Logistic Regression | High | 0.73 | 0.48 | 0.58 |
| Low | 0.75 | 0.55 | 0.64 | |
| Moderate | 0.65 | 0.85 | 0.74 | |
| Decision Tree | High | 0.88 | 0.65 | 0.75 |
| Low | 0.88 | 0.92 | 0.90 | |
| Moderate | 0.88 | 0.89 | 0.88 | |
| Random Forest | High | 0.88 | 0.65 | 0.75 |
| Low | 0.93 | 0.94 | 0.94 | |
| Moderate | 0.90 | 0.94 | 0.92 | |
| K-Nearest Neighbors | High | 0.77 | 0.43 | 0.56 |
| Low | 0.82 | 0.86 | 0.84 | |
| Moderate | 0.79 | 0.82 | 0.80 | |
| XG Boost | High | 0.71 | 0.52 | 0.60 |
| Low | 0.89 | 0.65 | 0.75 | |
| Moderate | 0.70 | 0.91 | 0.80 | |
| Gradient Boosting | High | 0.87 | 0.57 | 0.68 |
| Low | 0.86 | 0.84 | 0.85 | |
| Moderate | 0.81 | 0.88 | 0.84 | |
| Gaussian Naive Bayes | High | 0.62 | 0.57 | 0.59 |
| Low | 0.73 | 0.60 | 0.66 | |
| Moderate | 0.66 | 0.77 | 0.71 | |
| Support Vector Machine (SVM) | High | 0.65 | 0.57 | 0.60 |
| Low | 0.85 | 0.55 | 0.67 | |
| Moderate | 0.66 | 0.89 | 0.76 | |
| Ensemble | High | 1.0 | 0.52 | 0.69 |
| Low | 0.95 | 0.89 | 0.92 | |
| Moderate | 0.84 | 0.97 | 0.90 | |
| AdaBoost | High | 0.62 | 0.35 | 0.44 |
| Low | 0.73 | 0.67 | 0.70 | |
| Moderate | 0.67 | 0.78 | 0.72 | |
| CatBoost | High | 0.88 | 0.65 | 0.75 |
| Low | 0.92 | 0.92 | 0.92 | |
| Moderate | 0.88 | 0.93 | 0.91 | |
| Neural Network | High | 0.88 | 0.65 | 0.75 |
| Low | 0.93 | 0.90 | 0.92 | |
| Moderate | 0.87 | 0.94 | 0.90 |
| Anchor Explanation Condition | |
|---|---|
| Feature | Condition |
| Institution Type | >1.00 |
| Age | <=1.00 |
| Gender | >0.00 |
| Financial Condition | <=1.00 |
| Precision | 0.9732360097323601 |
| Coverage | 0.0888 |
| Predicted Class | Moderate |
Disclaimer/Publisher’s Note: The statements, opinions and data contained in all publications are solely those of the individual author(s) and contributor(s) and not of MDPI and/or the editor(s). MDPI and/or the editor(s) disclaim responsibility for any injury to people or property resulting from any ideas, methods, instructions or products referred to in the content. |
© 2024 by the authors. Licensee MDPI, Basel, Switzerland. This article is an open access article distributed under the terms and conditions of the Creative Commons Attribution (CC BY) license (http://creativecommons.org/licenses/by/4.0/).


