1. Introduction
Multiple challenges of population growth, such as congestion, terrible traffic, energy shortages, pollution, limited residential areas, rising unemployment, aging infrastructure, inadequate health care, and educational barriers, have reduced people’s quality of life (Mu, Peivi, & Haershan, 2022). Due to the increase in population and excessive extraction and consumption of resources especially in the electricity generation and transportation sectors (Battula, Vuddanti, & Salkuti, 2023). traditional patterns of resource and energy consumption are not responsive to human needs. It is predicted that the amount of energy consumption in America and Europe will increase by 50% and 40% respectively by the end of 2030. Additionally, China and India are expected to reach three times the average global energy consumption, leading to a doubling of the world’s total energy consumption (Isikveren, 2010). On the other hand, along with the increase in resource consumption and greenhouse gas emissions (Aryai & Goldsworthy, 2024; Battula, Vuddanti, & Salkuti, 2023) climate change (Mansouri, et al., 2021), energy supply security, and rising fuel prices (Calama-Gonzalez, Escandon, Suarez, Alonso, & Leon-Rodriguez, 2024) have prompted policies and actions aimed at improving global energy management. (Obringer & Nateghi, 2021).
In today’s world, residential energy consumption is increasing rapidly due to modern lifestyles and home appliances. Even in green houses, electricity has a large contribution to the cost of energy consumption and emissions of pollutants, especially carbon footprints (Jamshidi, Ghiasi, Mehrandezh, & Wang, 2024). A recent report indicates that 30% of the total electrical energy is consumed by the residential sector (Setlhaolo & Xia, 2015) (Shakouri & Kazemi, 2017). Therefore, one solution to manage energy consumption in residential houses is to make houses smart (Lee, et al., 2024; Apanavičienė & Shahrabani, 2023). Despite the relatively small number and size of smart homes compared to other homes, they have significant potential to implement energy policies. In smart homes, residents can choose how to use energy according to their needs and interests (Kinhekar, Padhy, Li, & Gupta, 2016; Dorahaki, Rashidinejad , Fatemi Ardestani, Abdollahi, & Salehizadeh, 2022) enabling them to engage in Home Energy Management (HEM), which is a critical requirement for today’s and future world (Lokeshgupta & Sivasubramani, 2019).
Home Energy Management Systems (HEMS) are considered integral elements. Technology and automation can be applied as tools to manage energy consumption, in collaboration with demand response programs in smart homes (Tostado-Véliz, Gurung , & Jurado, 2022), to reduce energy bills and prevent waste. Through daily or weekly planning for various household appliances that can be controlled, actions can be taken (Mansouri, et al., 2021). Furthermore, improving energy efficiency in houses reduces the amount of carbon and greenhouse gas emissions (Lezama, Soares, Canizes, & Vale, 2020) (Simões, Manaia, & Simões, 2021), leading to increased satisfaction and well-being among households. Therefore, Demand Side Management (DSM) techniques are fundamental for smart constructions to control the excessive energy consumption. The benefits of DSM can be enhanced by implementing smart energy storage systems such as energy storage batteries (Mansouri, et al., 2021) (Naeem Iqbal & Kim, 2022) ( Kumar, et al., 2021) ( Iqbal, Ahmad, & Kim, 2021) (Akkasaligar, Biradar, & Pujari, 2019).The presence of these energy storage sources allows households to take advantage of energy rates during off-peak and peak hours, in addition to creating emergency energy reserves, effectively reducing energy costs.
To achieve a higher level of quality of life and well-being for society while responsibly utilizing resources and improving environmental conditions, leveraging information and communication technologies (ICT) such as sensors, the Internet of Things (IoT), and artificial intelligence (AI) is proposed to enhance services and increase energy consumption efficiency (Duygan, Fischer, P¨arli, & Ingolad, 2022) (Said & Tolba, 2021). The Internet of Things represents a cutting-edge development with significant potential for implementing smart applications. One of its key applications is optimizing resource usage, particularly energy consumption (Naeem Iqbal & Kim, 2022) (Singh, et al., 2021) (Mukta, Rahman, Asyhari, & Alam Bhuiyan, 2020) (Lv, Hu, & Lv, 2020). The Internet of Things can serve as a predictive optimization management mechanism to reduce energy consumption in smart residential buildings. Fortunately, the widespread adoption of IoT technologies has facilitated the development of various smart functions, including energy management (Naeem Iqbal & Kim, 2022) ( Kumar, et al., 2021) (Ahmad & Kim, 2021) (Singh, et al., 2021) (Mukta, Rahman, Asyhari, & Alam Bhuiyan, 2020). The integration of distributed energy systems through the advantageous functionalities of ICT and IoT greatly contributes to enhancing energy management efficiency (Ikram, Ullah, Datta, Islam, & Ahmad, 2024).
Smart energy management systems offer consumers updated information on usage, peak-time costs, outage reports, and consumption pattern management (Ali Khan & Abbasi, 2018). They also enable remote meter management. Additionally, energy-producing and distributing companies implement dynamic pricing policies to regulate consumers’ energy consumption behaviors. These pricing policies can include various types such as peak-hour pricing, off-peak and mid-load pricing, time-of-use pricing (ToU), incremental pricing based on consumption, and daily pricing, among others. To effectively manage energy demand, it is essential to leverage demand management programs and intelligent equipment capable of utilizing these programs. Residential house equipment can be categorized into three areas based on their inherent performance attributes: non-switchable appliances (NSAs), time-of-use appliances (TSAs), and switchable electrical appliances (PSAs). NSAs, such as televisions, fans, lights, and refrigerators, exhibit consistent power consumption patterns aligned with consumer needs. They are not optimal for high-volume constant electricity scheduling due to varying power consumption patterns based on consumer requirements. TSAs, such as dishwashers and washing machines, also have consistent electricity consumption patterns but can be adjusted based on optimal energy consumption times. PSAs, such as water pumps and electric vehicles, have defined minimum and maximum operating requirements based on daily residential consumer needs. Therefore, TSAs and PSAs are the most suitable equipment categories for residential energy management (Lokeshgupta & Sivasubramani, 2019). This research aims to develop a dynamic program capable of accommodating operational constraints such as equipment usage states while respecting household preferences. It seeks to determine to what extent the proposed model can manage household energy consumption costs and how well it aligns with household consumption culture and preferences. The objective is to optimize energy usage and costs while aligning with the unique needs and preferences of residential consumers.
This research is structured into five sections. The introduction, which comprises the first part, provides an overview of household energy consumption and scheduling definitions. The 2 section delves into a literature review, discussing the research background and identifying gaps in current studies. In the 3, a case study is detailed, including time tariffs and the types of equipment studied, followed by an outline of the research methodology
. Section 4 presents the proposed research model, outlining parameters, variables, limitations, and objective functions. The fifth section analyzes decision variables and compares the model’s objective function values with real-world data. Sensitivity analysis is conducted based on optimal variable values, and practical suggestions for improvement are provided. Finally, the section enumerates existing study limitations and proposes avenues for future research.
2. Research Background
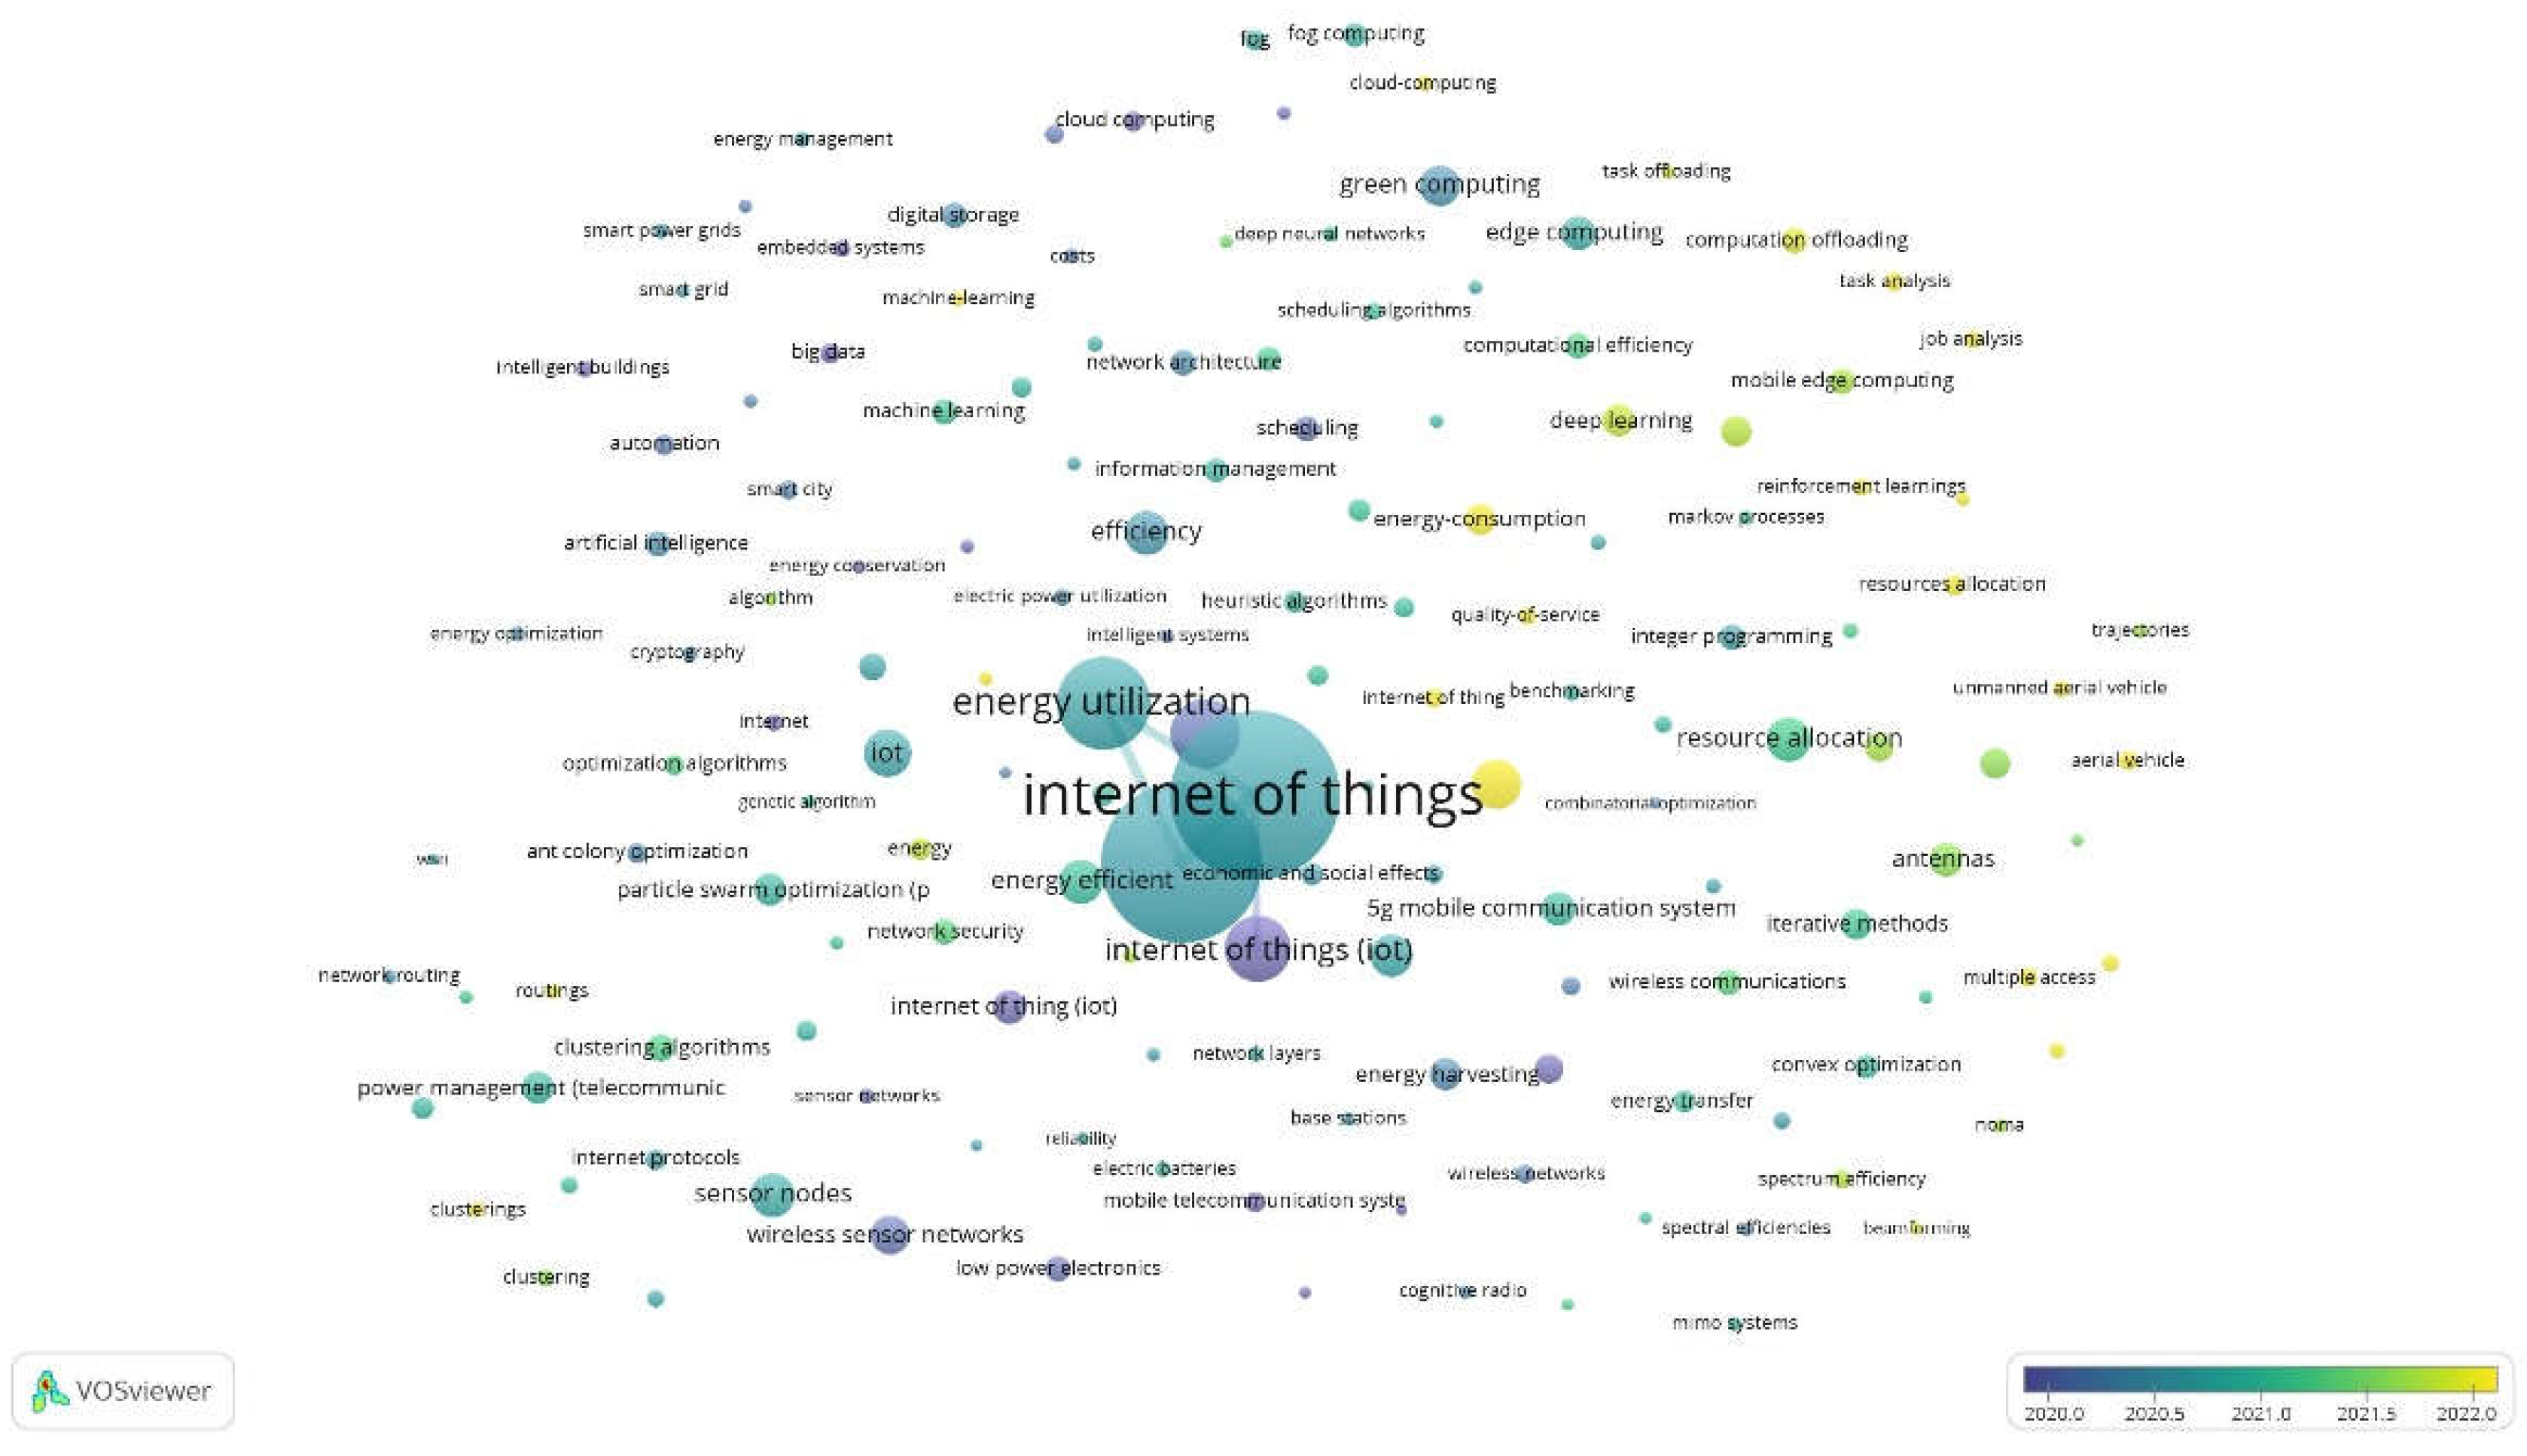
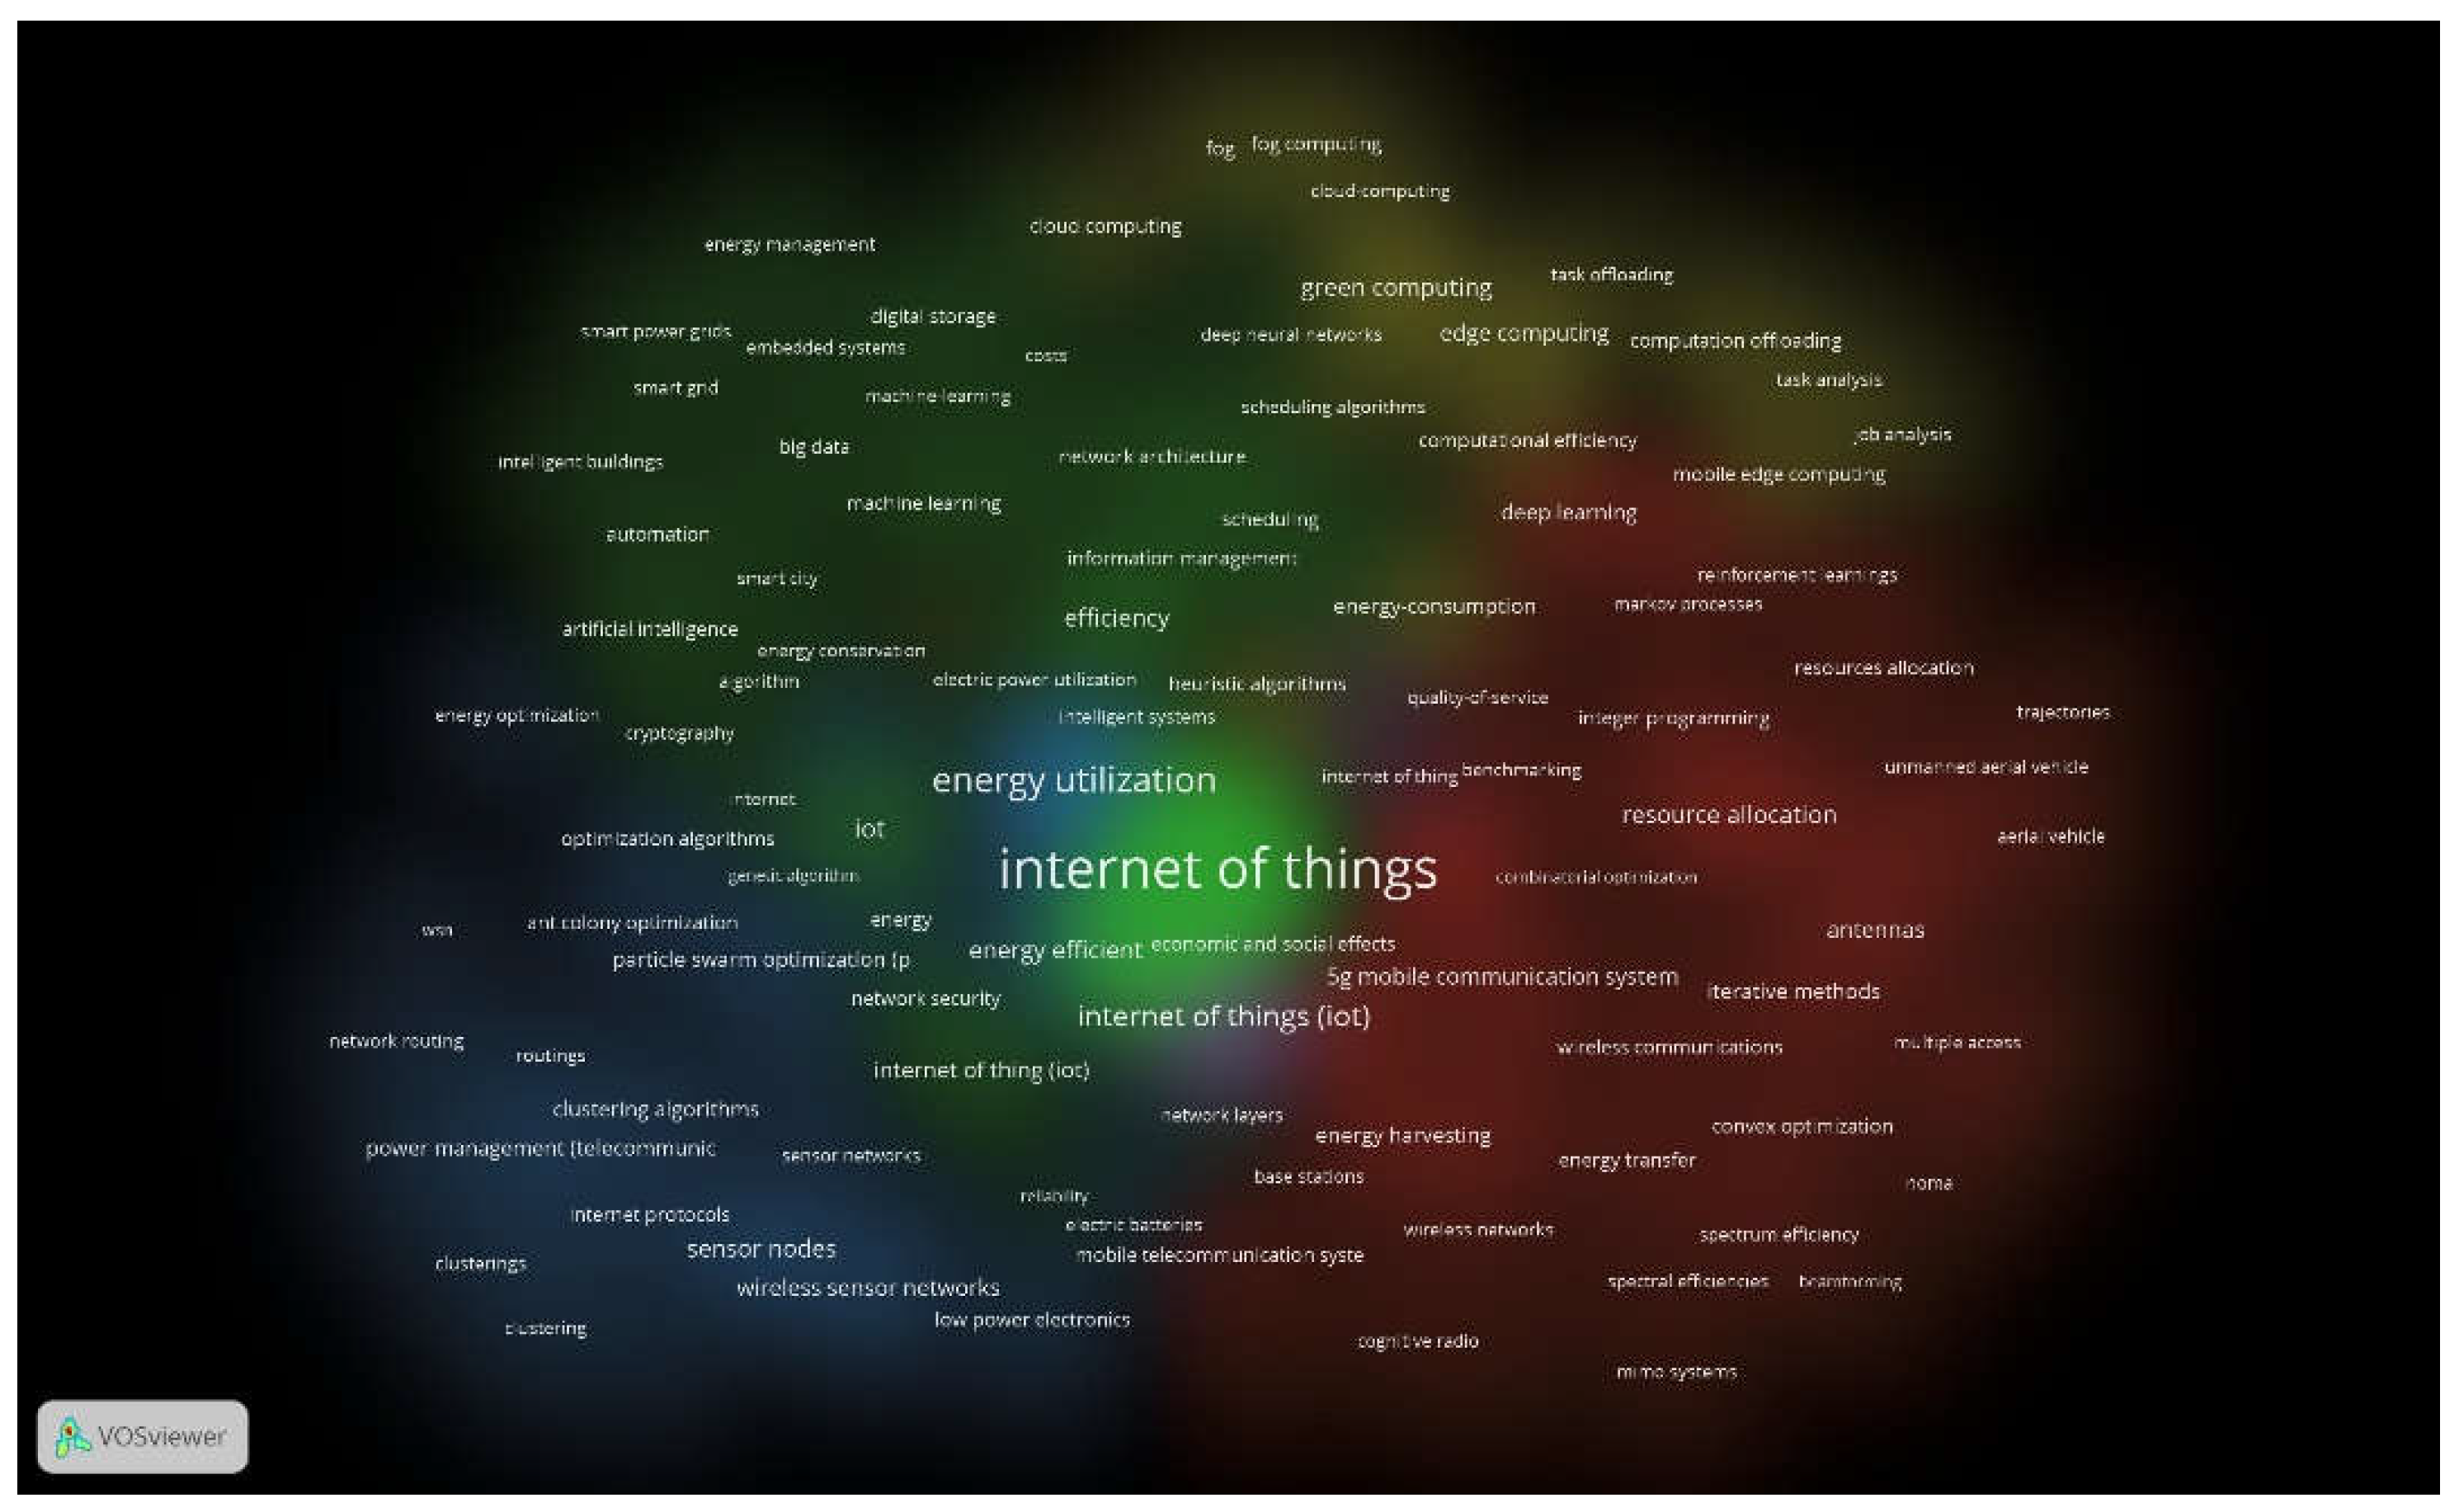
By studying and reviewing research in the field of mixed linear modeling for predicting and presenting energy consumption scheduling programs for residential and smart homes using an Internet of Things approach, we have discovered numerous studies discussing the benefits, outcomes, and implications of IoT in household energy consumption. These include energy industry advancements, energy sharing between local consumers and major producers, efficient energy management, and the development of smart energy networks and homes. Using VOSviewer software and analyzing research from the Scopus scientific database over recent years, this claim is substantiated.
Figure 1 and
Figure 2 visually depict IoT and energy efficiency management alongside other related concepts in this field
.
Despite the existing research in this field, significant research on predictive models of energy consumption using the Internet of Things (IoT) approach remains limited. Below, some key studies in this area are reviewed. (Mehrabani , Mardani, & Ghazizadeh, 2022) proposed an energy management scheme focusing on smart homes. They developed an automated house plan equipped with renewable energy sources and presented an enhanced approach to house energy management in seven scenarios incorporating renewable energy sources, energy storage, and electricity. In another study, referenced as (Giordano, Mastroianni, Scarcello, & Spezzano, 2020), researchers presented an optimal model utilizing the IoT approach for energy exchange within residential energy communities. They emphasized the pivotal role of IoT technology in energy exchange within such communities, as IoT smart objects provide real-time information on energy production and user needs while also serving as actuators to regulate energy distribution and utilization. The researchers introduced an optimization model for energy management within energy communities, considering the entire community as a whole rather than individual customers, with the objective of optimizing energy sharing and balance at the community level. Experimental results conducted on a university campus demonstrated the advantages of this approach, including reduced energy costs and increased energy independence within the society.
Research (Lokeshgupta & Sivasubramani, 2019) introduces a residential Multi-Objective Mixed Integer Linear Programming (MOMILP) technique to address challenges in residential household demand management (DSM). The proposed model is applied to a system with four different types of residential consumers, examining the advantages of batteries across six different layouts. In another study referenced as (Melhem, Grunder, Hammoudan, & Moubayed, 2017) researchers focus on energy optimization and management in smart homes by integrating photovoltaic, wind, and battery storage systems using a mixed integer programming model. This model integrates renewable energy sources such as wind and solar energy, battery storage systems, and networked vehicles. A heuristic technique is employed to facilitate residential energy management, aiming to minimize consumer electricity costs and reduce dependency on the grid. The study achieves global optimal solutions over multiple days, significantly reducing execution time and energy costs. Additionally, (Yi, Verbic, & Chapman, 2021) presents a smart home energy management framework based on Markov decision processes to minimize household electricity costs, including strategies to separate vehicle charging from home energy usage to optimize consumer energy expenses. Another study by (Elham & Shahram, 2015) proposes an automatic and optimal mixed integer programming technique for residential energy consumption, aiming to reduce total electricity and natural gas usage in buildings by scheduling electrical and thermal devices and utilizing wind and vehicle energy systems effectively. In (Dinh & Kim, 2021), researchers evaluate smart home performance with renewable energy sources and energy storage using a multi-objective mixed integer nonlinear programming model, optimizing energy distribution to enhance user comfort. Furthermore, (Amini, Frye, Ili´c, , & Karabaso, 2015) implements a two-stage mixed integer linear programming model to lower residential electricity costs by adjusting load demand through simulation up to one day in advance. (Duman, Erden , Gönül, & Güler, 2022) presents a demand response model based on mixed integer linear programming to increase self-consumption and minimize daily energy bills. Lastly, research (Collotta & Pau, 2015) proposes a smart home energy management system based on a wireless network with Bluetooth, focusing on reducing peak demand and enhancing consumer comfort without directly managing energy production.
(Lu , Guo , & Zeng, 2022) proposed a scheduling model for smart home appliances to reduce peak load and minimize home energy bills. A genetic algorithm was employed to solve the scheduling problem, demonstrating optimal performance in reducing peak load and electricity costs based on simulation results. In ( Hamed & Kazemi, 2017), a multi-objective mixed integer linear programming (MOMILP) technique was utilized for implementing residential demand management, focusing on consumer cost and peak demands as primary objectives. (THB, Dinh , & Kim, 2023) introduced a multi-objective mixed integer linear programming model for managing energy in smart homes, aiming to optimize electricity costs and discomfort index. This smart home concept incorporates vehicle-to-home and home-to-network capabilities. Researches ( Sou, Weimer, Sandberg, & Johansson, 2011) (Hubert & Grijalva,, 2012) developed single-objective mixed integer linear programming (MILP) models for household consumption management. In ( Ratnam, Weller, & Kellett, 2015), a scheduling algorithm based on linear programming (LP) was proposed for smart home residents, aiming to maximize operational savings (Chen, Duan, Cai, Liu, & Hu, 2011) presented an intelligent energy management system to coordinate power generation from distributed sources and energy storage in a microgrid, incorporating a prediction model capable of forecasting hourly electricity generation. Research (Guan, Xu, & Jia, 2010) focuses on planning and scheduling energy resources to achieve significant energy cost savings within a 24-hour period. Lastly, in (Tazvinga, Zhu, & Xia, 2015), an optimal energy management model for household energy consumption was proposed.
By reviewing the research literature in this field, few studies have utilized comprehensive optimization methods for optimal energy management in residential houses over consecutive days (Melhem, Grunder, Hammoudan, & Moubayed, 2017). Therefore, this article aims to present a model that manages electricity, gas, and water energy consumption and demand over a seven-day period, divided into four-hour intervals. The model incorporates equipment with multiple energy uses to predict energy consumption in residential smart homes. The goal is to optimize energy consumption based on time-of-use (TOU) tariffs and comply with social and legal restrictions on household equipment usage, thereby improving efficiency and reducing energy costs. Buildings are significant energy consumers, accounting for over 40% of total global energy consumption and emitting substantial CO2 (Rezaeimozafar, Monaghan, Barrett, & Duffy, 2022). The proposed model in this study offers the following features:
Optimization by considering household equipment and appliances that have multiple energy uses.
Calculation of satisfaction in household energy consumption by considering the distance estimate of the proposed optimal program from the actual choice of the consumer
Considering government and security requirements and obligations in the optimal program proposed for household equipment and appliances (in terms of operation or non-operation in the desired schedule)
Calculation of adjusted λ impact factor as an optimality index between consumption cost and the level of satisfaction of households
3. Case Study
The presented model in the current research aims to investigate the energy consumption patterns of residential houses based on common household appliances found in most homes. There is typically an inverse relationship between the amount of money households spend on energy and their level of satisfaction and well-being derived from it. To conduct this investigation, 80 residential units, comprising 23 apartments and 57 villas in Amol city, Mazandaran province, Iran, were surveyed to assess household consumption patterns. Households were asked to complete a usage plan for their home appliances and equipment based on a provided table compiled by the authors, covering a one-week period. However, 7 families did not provide complete energy consumption information, and 4 families were excluded from the study for not using more than half of their household equipment and appliances for at least 2 days per week. Given the necessity of specific household appliances and equipment for the study, a non-random snowball method was employed to select participating households.
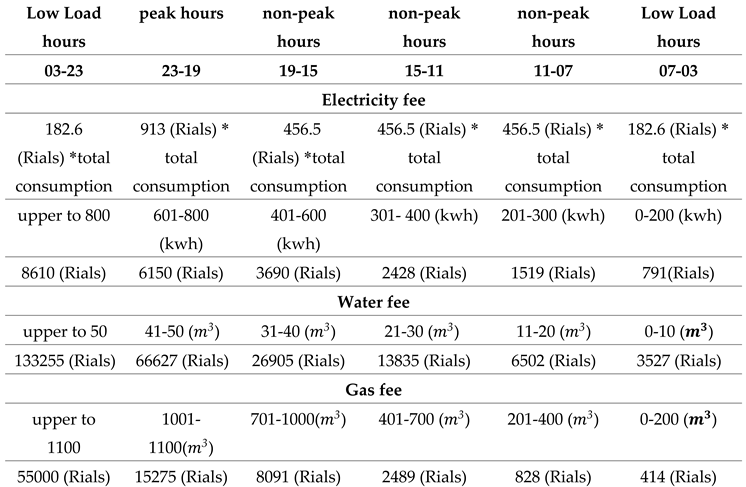
In the current research, electricity cost calculations are based on different consumption hours categorized as peak load, mid-load, and low load. To manage household demand effectively, each 24-hour period is divided into six time categories: ‘23-19’, ‘15-19’, ‘11-15’, ‘07-11’, ‘03-07’, and ‘23-03’
. For energy cost calculations, the peak load period (‘19-23’) and the low-load hours (‘23-03’ and ‘03-07’) are specifically considered, along with intermediate load times. Additionally, the pricing of water is determined based on high consumption subscribers, and the price of gas varies according to climate conditions
. Table 1 and
Table 2 in the research outline the energy price rates and the energy consumption levels of various household equipment types, respectively. In the current research, considering that the calculations related to the cost and price of electricity are calculated based on the type of consumption hours (peak load, mid-load and low load), therefore, in managing household demand, 24 hours a day are divided into 6 time categories
‘23 -19’, ‘15-19’, ‘11-15’, ‘07-11’, ‘03-07’, ‘23-03’ are divided. In order to calculate the energy costs, the time period of
‘19-23’ peak load and the hours of
‘23-23’ and
‘03-07’ of low load and other time intervals of intermediate load are considered. Also, the price of water is based on high consumption subscribers and the price of gas is considered based on climate conditions.
Table 1 and
Table 2 show the energy price rate and the amount of energy consumption of the types of household equipment considered in this research, respectively.
3.1. Research Methodology
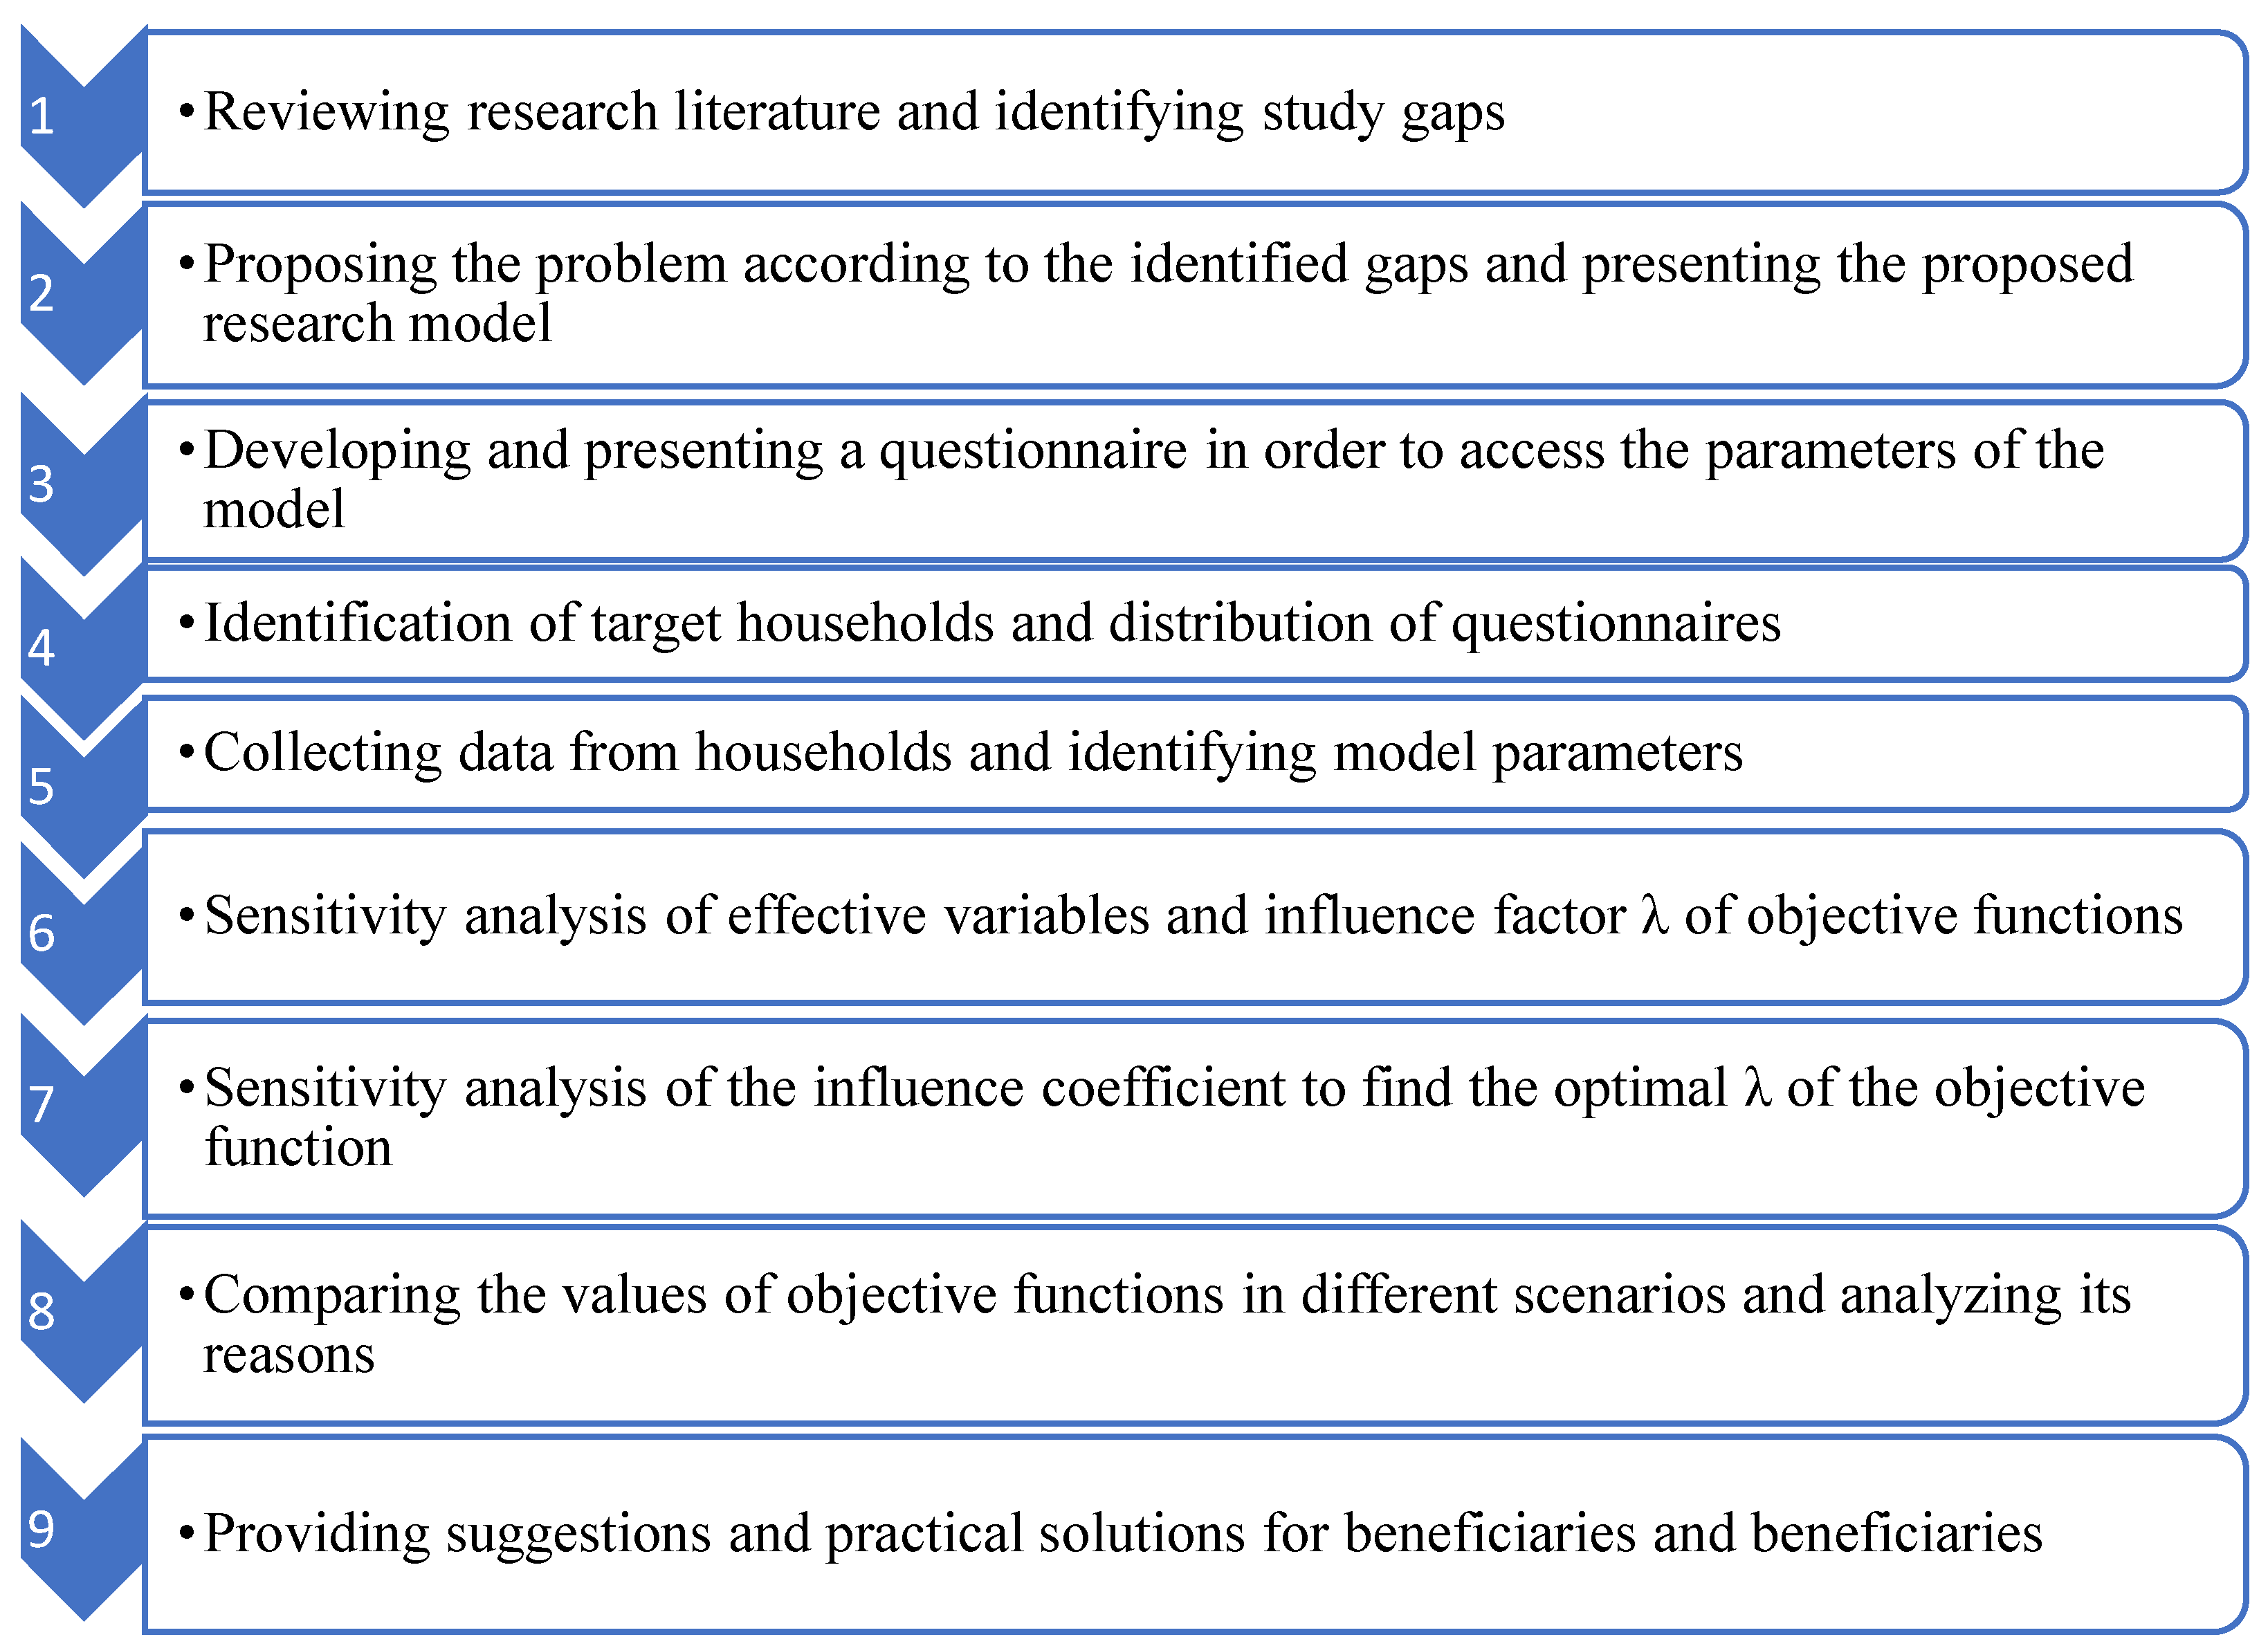
After reviewing the research literature and identifying gaps in previous studies related to energy consumption modeling in households and residential homes, various steps were followed to formulate the model and develop the proposed predictive energy consumption program.
Figure 3 provides a concise overview of the steps taken and implemented in this process
.
4. Modeling
The presented model in this current research aims to investigate the energy consumption culture of residential houses based on the types of household appliances commonly found in most homes. There is typically an inverse relationship between the amount of money households spend on energy and their level of satisfaction and well-being. In simpler terms, higher energy costs often correlate with lower levels of household satisfaction. Therefore, developing models that can effectively manage various types of energy consumption while maximizing household satisfaction is crucial and remains a key concern for policymakers in the energy consumption sector. To address this importance, the proposed model considers household satisfaction and energy costs as objective functions. It is assumed that the building’s central system is equipped with a user interface that allows direct connection of household appliances via technologies like WIFI, RFID, or smart consumption clock systems. Most buildings are equipped with a variety of appliances and comfort equipment that require electricity, water, and gas for operation. For example, the irrigation systems in gardens and larger estates require electrical energy to operate the sprinkler system’s motor and utilize water for irrigation. In central heating units, electric energy is utilized to power the water pump and water circulation system, water is heated using heaters, and gas energy is employed to operate the burner and heat the water. Household appliances such as washing machines, dishwashers, steam irons, and vacuum cleaners also rely on electricity and water to perform their functions. The usage of certain household appliances is influenced by household policies, lifestyle choices, or existing constraints within each home. Therefore, household appliances can be categorized based on the flexibility of their usage policies. The first category consists of appliances with fixed or unchangeable consumption policies, such as refrigerators, TVs, or cooking stoves. The second category includes appliances for which consumption policies can be adjusted based on different times or amounts of usage. In this research, household appliances falling into the second category were investigated. As mentioned earlier, the usage patterns and frequency of these appliances depend on household decision-making policies and living conditions. For example, it may not be feasible to operate an iron during rest hours, whereas the operation of washing machines, dishwashers, or garden irrigation systems can be scheduled during the daytime. Nevertheless, there are some appliances or equipment that must be used at specific times, such as air conditioners and cooling systems during hot hours to ensure household comfort and safety. Additionally, yard lighting is essential for nighttime safety. Furthermore, the proposed consumption forecasting model also accounts for the minimum usage requirements of certain household appliances. For instance, the model considers using a washing machine twice a week, a dishwasher three times a week, or an iron twice a week during available hours. Therefore, the investigated model aims to provide an energy consumption schedule that allows for the optimal use of household appliances based on required usage hours, while minimizing household consumption costs and maximizing consumer satisfaction and security.
Typically, energy consumption varies throughout the year and across different hours of the day and night, with energy rates varying based on peak hours and other limits. Therefore, the model considers peak hours, low load periods, and mid-load times to calculate electricity rates accurately. Similarly, water and gas energy rates are calculated in a tiered manner to ensure that the model’s outputs align closely with real-world conditions, accurately reflecting energy consumption and associated costs. The model also incorporates the use of electric energy storage batteries, water storage tanks, and high-pressure gas capsules with specific capacities. These storage solutions enable energy to be captured during non-peak hours for use during periods of high demand, thereby reducing energy costs and enhancing consumer satisfaction by ensuring availability of stored energy during peak consumption times. The proposed model aims to optimize the timing of household appliance usage and the operation of essential equipment based on minimum required usage frequency and allowable hours to maximize consumer satisfaction and security. It also minimizes the usage of household appliances during periods when overall household consumption is low. The multi-objective mixed integer mathematical model calculates the energy consumption of different households over a one-week period, divided into six time periods of four hours each. It considers ten types of household appliances that utilize electricity, water, and gas in various combinations. The model accounts for limited capacities of tanks and batteries to enhance household satisfaction and reduce energy costs. Furthermore, the model takes into consideration the diverse consumption needs of households, including variations in usage culture, restrictions, and device requirements. These factors are integrated into the objective function to reflect their importance in generating consumer satisfaction. The model’s design ensures that the recommended device usage aligns with consumer expectations and cultural norms. It aims to minimize consumer dissatisfaction by incorporating a diffusion coefficient (λ) in the objective function, which quantifies the level of dissatisfaction resulting from discrepancies between the model’s recommendations and consumer expectations. In summary, the proposed model is designed to optimize energy usage, reduce costs, and enhance consumer satisfaction by efficiently scheduling appliance operations and incorporating storage solutions to manage peak demand periods effectively. It considers the unique characteristics of each household’s consumption patterns and cultural preferences to deliver tailored solutions that align closely with consumer expectations.
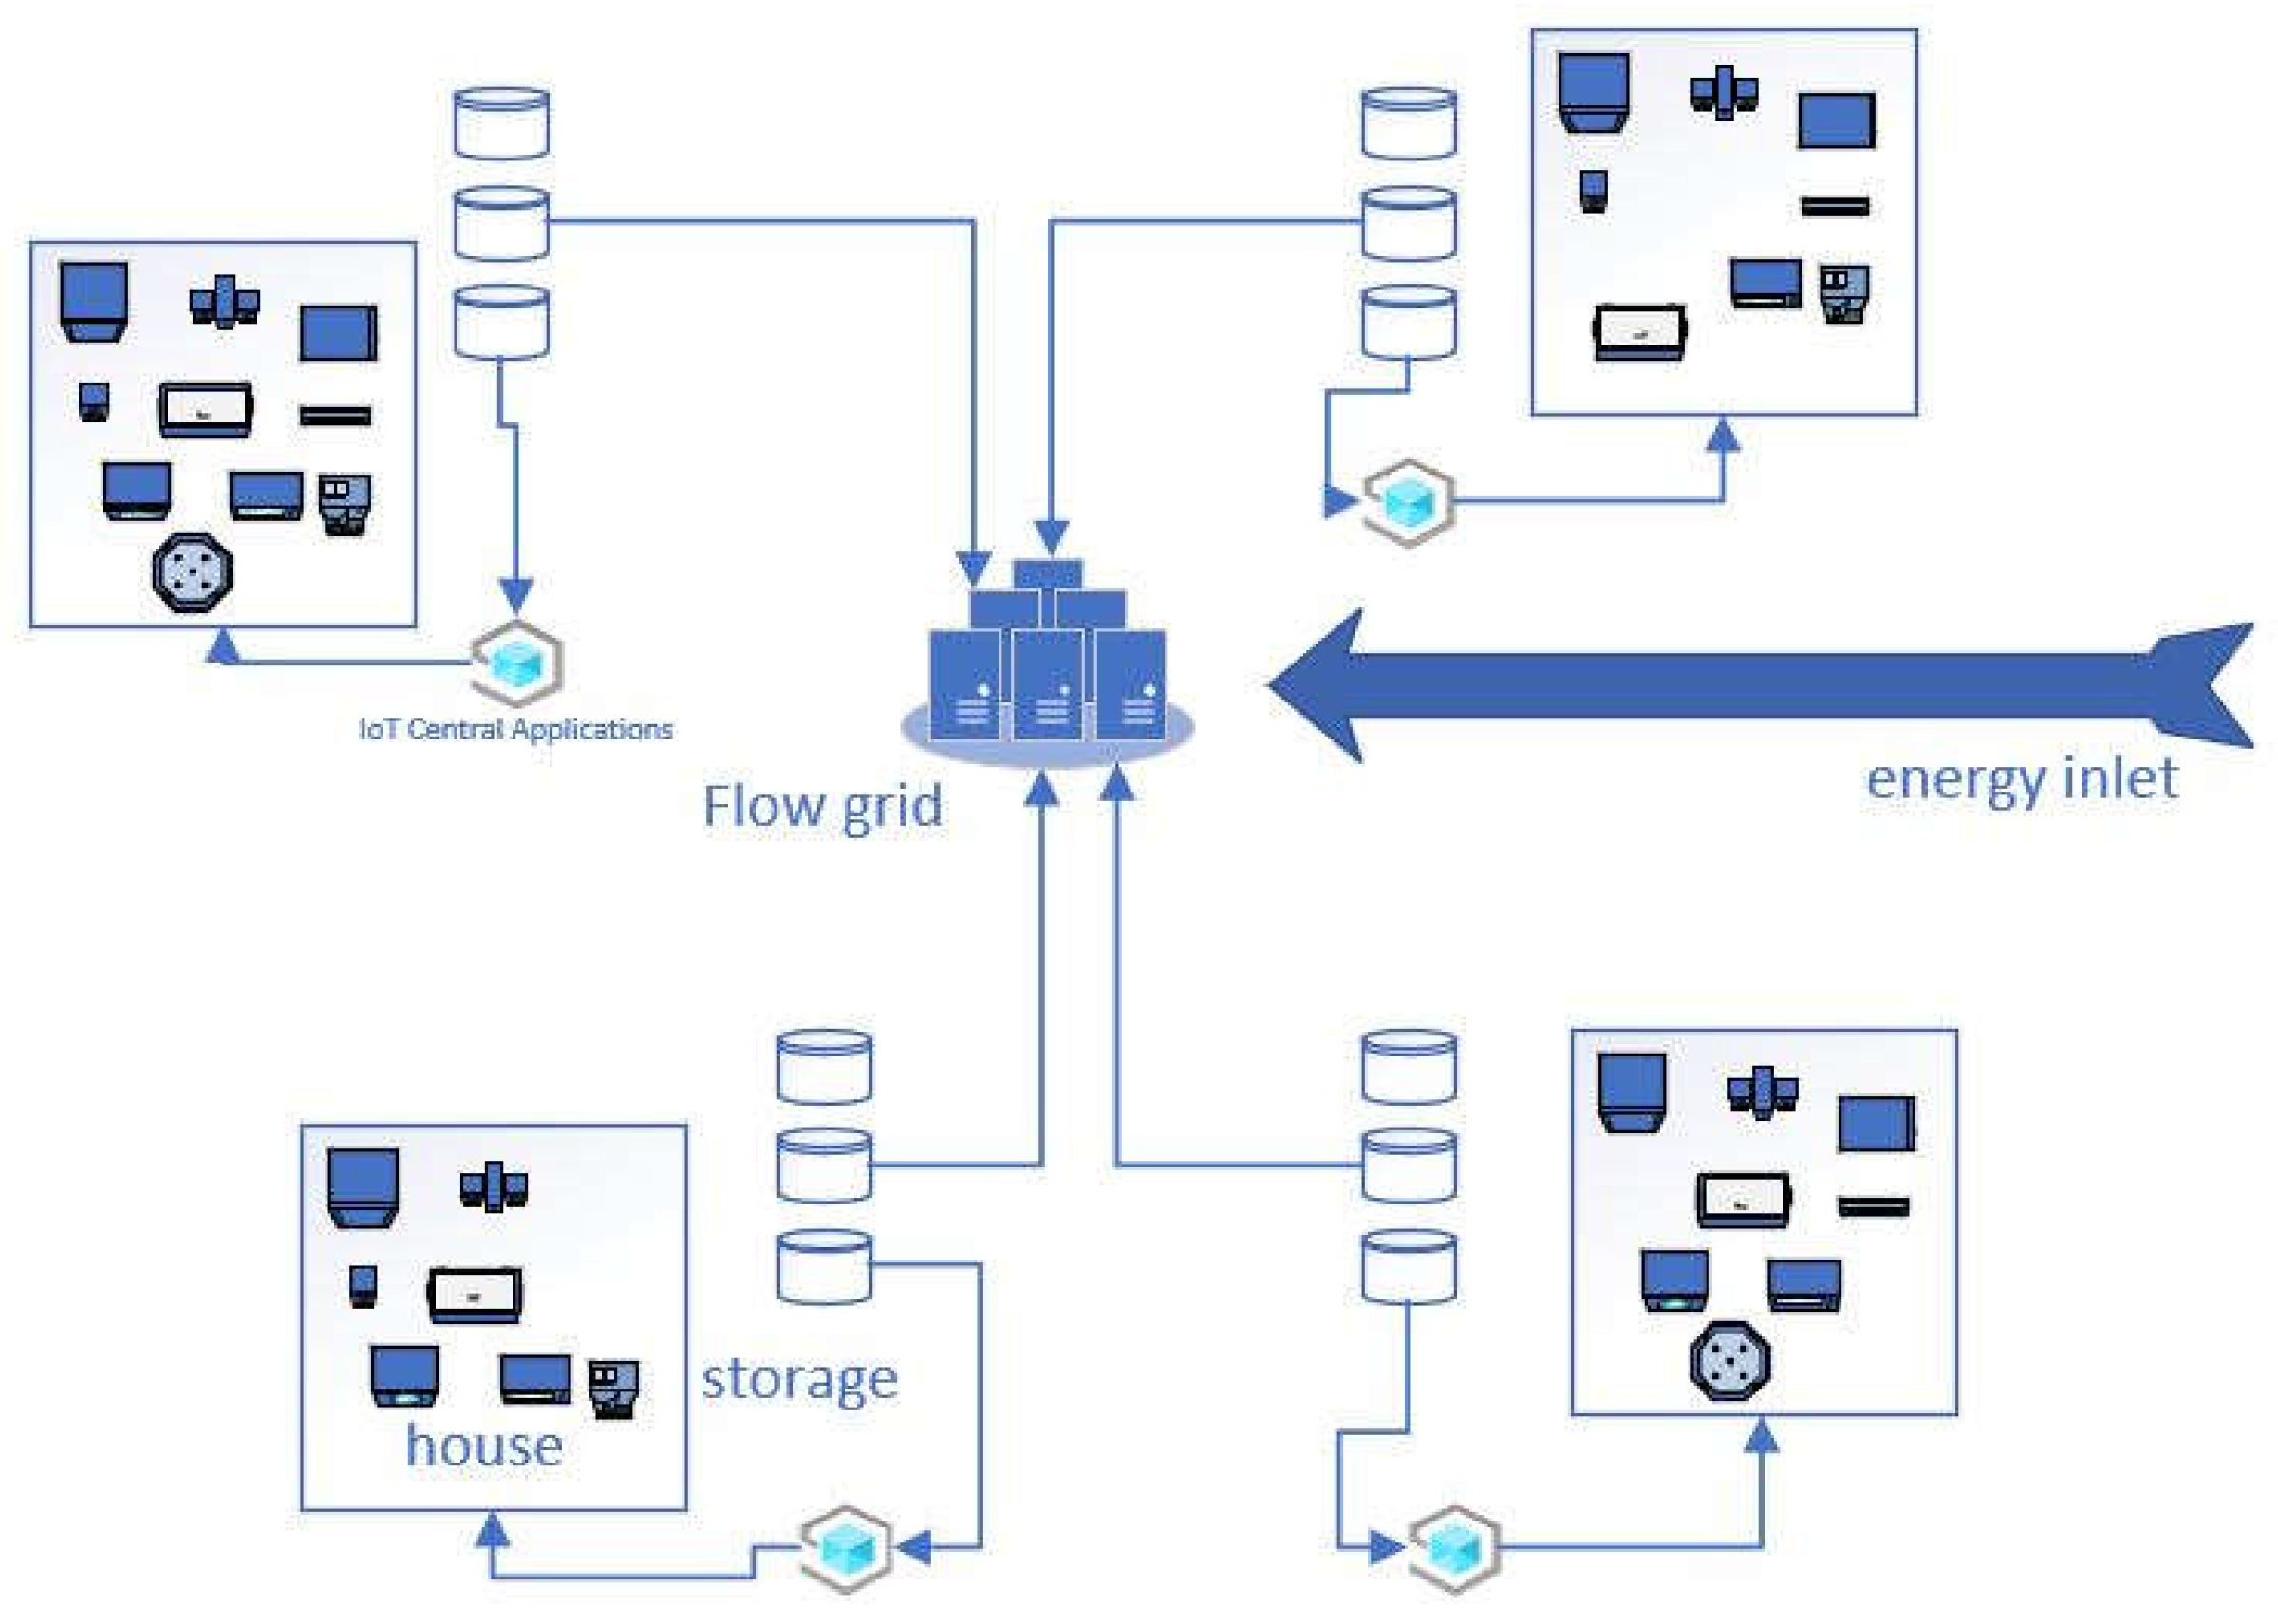
Figure 4 shows a schematic of how energy flows are distributed along with home appliances and energy storage sources.
Table 3,
Table 4 and
Table 5 respectively show the indicators, parameters, and variables of the energy consumption prediction model along with the descriptions of each item.
4.3. Objective and Coefficients Definition
By considering the complex integer linear programming model’s objective function in Equation 1, the objective function is divided into two parts. The first part optimizes the cost of using appliances and equipment, while the second part represents satisfaction derived from deviations in households’ expectations. To maximize and modify the consumption cost function into an incremental function, it is transformed into the cost gap between households’ ideal and optimal states provided by the model. The larger this gap, the lower the energy consumption costs of households will be. Additionally, the objective function for customer satisfaction increases with greater deviation from the optimal situation predicted by the model based on consumer choices, indicating higher consumer dissatisfaction. This satisfaction level and improvement can be calculated by dividing the consumer’s choice cost, expressing the percentage of improvement compared to the initial state
. In the second objective function, the total difference (absolute value in constraint 14) between households allocated in the consumer’s actual schedule versus the optimal state provided by the model, relative to the initial state chosen by consumers based on their habits and lifestyle (initial state), is divided. This function’s output indicates the degree of consumer dissatisfaction with moving away from their initial choice towards the model’s optimal state. The smaller this difference, the closer the function’s value approaches zero; the larger the difference, the closer the value is to 1. Therefore, both objective function values can be normalized to a percentage ranging from 0 to 100 percent
. While cost reduction is pivotal in the model, it aims to enhance consumer satisfaction. Thus, the parameter λ serves as the absorption coefficient for the objective functions. Constraint 15 demonstrates that as λ increases, λ - 1 decreases. An important feature of the proposed model is that it determines the optimal value of λ based on various scenarios, calculating the optimal significance of
and
functions.
4.4. Description of Constraints
The constraints of the model include equations 2 to 12. Constraint 2 guarantees that the devices must have the minimum expected consumption in the specified time interval. Constrant 3 shows the number of devices that are allowed to be turned on in a certain hour. Constrant 4 is for devices that must be off during certain hours of the day and night. If it is necessary to turn off the device, the value -1 is recorded as the limit in the desired parameter .Since the chosen variable is binary, so either the value will be 1 or 0. The value 0 means that the dth device is off, and if the value is 1, it means that the dth device is on. Constrant 5 shows the balance of using urban energy or energy storage tanks for devices in operation at any time and does not allow devices to use both energy sources at the same time and that each device should only be used once at any time. Be turned on. If a device does not have the possibility of using energy storage tanks, the variable is considered 0. Constrant 6 shows that the total amount of household energy consumption is equal to the capacity of charging tanks and household appliances and equipment connected to urban sources.
Constrant 7 shows the tendency to use storage tanks in the
i-th time period. The variable
by choosing values between 0 and 1 indicates what fraction of a 4-hour period the storage tanks will need to be charged. The value of
determines the charging rate of energy storage tanks from the urban energy flow rate and the limits of the possibility of charging. Constrants 8 and 9 show the level of energy storage tanks according to its charging from urban sources and connected devices for consumption and the level of the previous period of the tank. By removing constrant 8-9, the possibility of placing energy storage tanks
will be lost and the variables
will be equal to zero. In this case, the energy storage tank is not considered. Equation 10 guarantees the upper limit of energy storage tanks. Constrants 11 and 12 allocate devices that should be turned on during daily time periods. The value of T is considered as the largest value of the t index, which is equal to 6 in one day and night (each day and night is considered to be 6 4-hour periods). In addition, if each day is added to the previous day, the variable of the same day
is added to the assigned value of the previous day
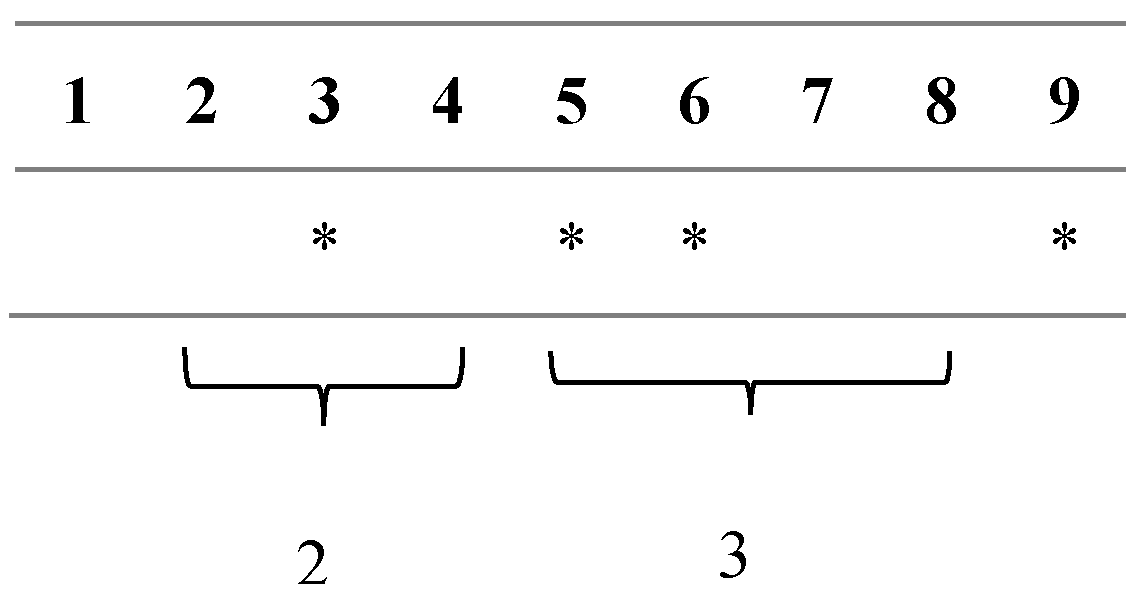
and added to the value of the index t (T) of the previous day. For example, the difference between consumer choice allocation and model choice is shown in the figure. As can be seen, the difference in allocation is 5 units. In
Figure 5, the green cell represents the choice of the consumer and the yellow cell represents the model choice
.
5. Data Analysis & Discussion
4.1. Allocation of Consume
Parametric data, such as the allocation of time for turning on household devices (in 10 categories), were randomly selected in the country of Iran, Mazandaran province, Amol city. The population of the selected households consists of at least 4 people, most of whom use 10 types of household appliances. Since actual consumption data for these appliances in households is necessary, households that were able to complete the relevant time-of-use lists were selected from among various samples and participated in this study
. By solving the presented model with assumed parameters, a portion of the constraints table is displayed in
Table 1. The studied devices include washing machines, dishwashers, garden sprinkler systems, coolers, bathrooms/packages, swimming pools and jacuzzis, rechargeable devices, vacuum cleaners, area lighting, and irons. According to family lifestyles and expert opinions, required periods for turning devices on or off are presented in
Table 6. For example, turning on area lights at night is mandatory, while using irons and vacuum cleaners is prohibited during sleep and rest (from 11:00 PM to 7:00 AM). The letter “Y” indicates the necessity to turn on the desired device during a specific period, while “N” indicates the need to turn off the device during that period; empty cells indicate the option of using different devices.
According to household consumption preferences,
Table 7 has computed the minimum equipment needs for households.
Table 2 displays the minimum permitted device usage during the weekly period for each household. As per the table, the minimum usage of device 2 for household 1 is “3” time units, for household 3 it is “2” time units, and for household 4 it is “4” time units. Consequently, the total allocation for the minimum use of washing machines in the consumption network is estimated to be 33 time units
.
Figure 6 and
Table 8 show the cost of the tariff for the consumption of each type of energy in the time frames of the day and night. According to the graph, government policies based on the peak consumption time, including 8 am to 6 pm, increase the costs related to the energy consumption tariff of devices during these hours. Also, during the hours of 20:00 to 08:00, due to the lack of peak consumption and out of the culture of domestic use of devices and the government’s favor to use devices in these hours, the consumption tariff reaches the minimum approved amount.
Table 9 shows the cumulation of energy consumption for all consumers in the time intervals of the week.
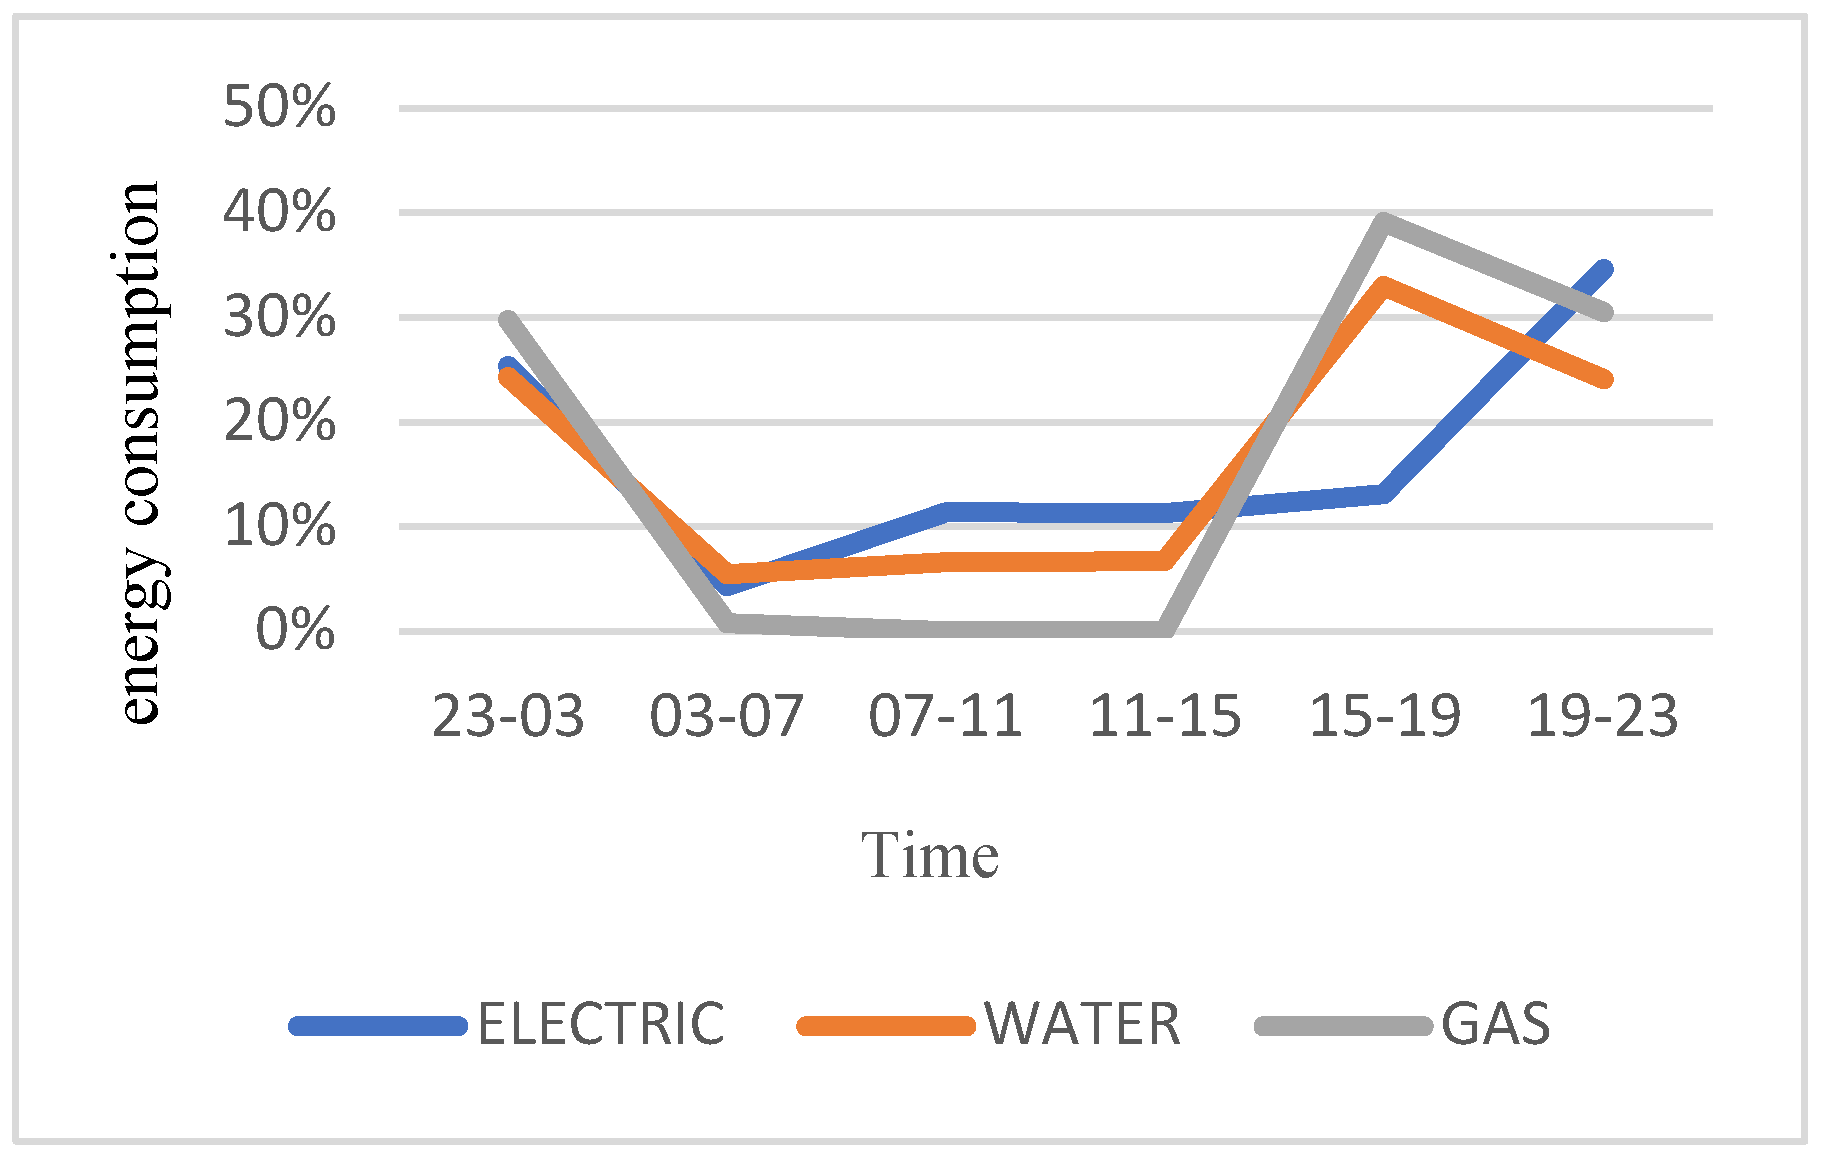
Table 10 shows what share of energy types are used by the consumer in time periods.
Figure 7 shows the aggregation diagram of household energy consumption based on time intervals.
Table 11 shows the cost of energy consumption in each period and the total cost per week under study for households.
Table 12 shows the share of consumption cost in each time period.
Figure 8 shows the related graph in time intervals
.
Since the satisfaction of consumers and households depends on how they choose to use household appliances and devices, the total cost for the entire period under review per week (equivalent to 1,926,944,292 Iranian Rials or 3,211.58 euros) serves as the calculation criterion. The output analysis of the model is based on the cost price
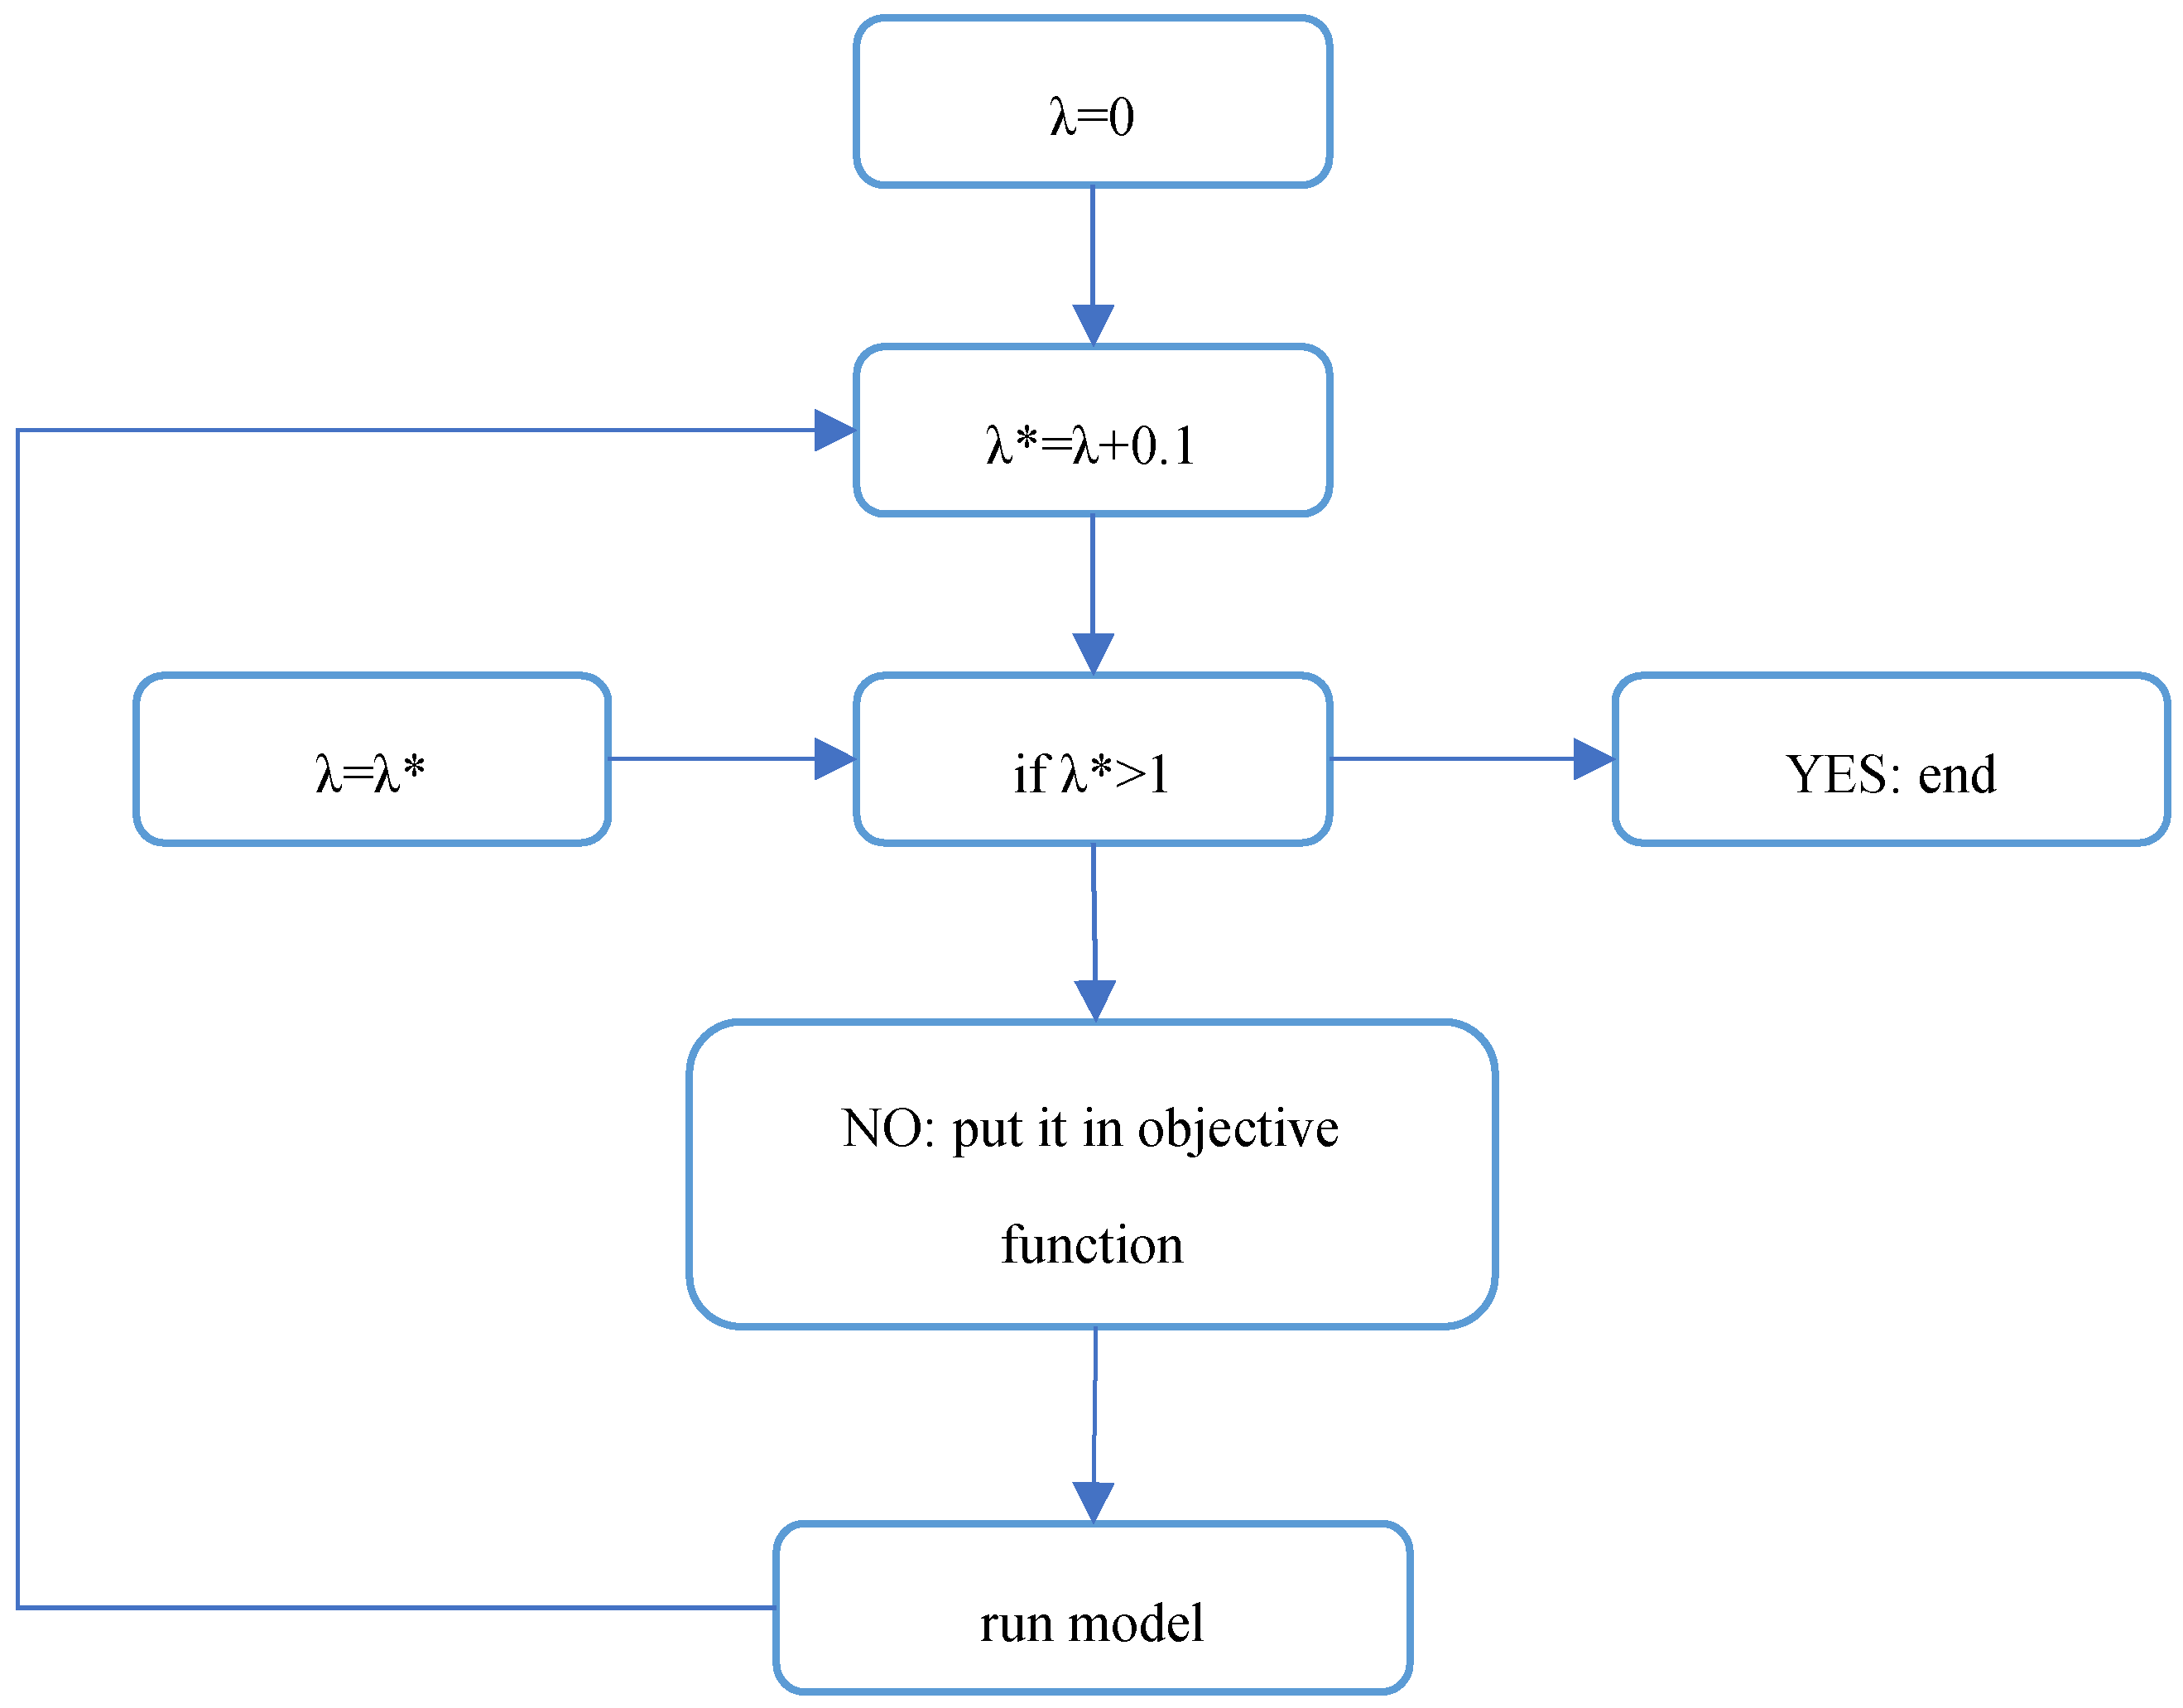
. Figure 9 illustrates the algorithm for calculating values with different λ. If λ=0, then the value of the cost objective function (objective function 1) is 0%, and the satisfaction objective function (objective function 2) is 0% as well. Therefore, any additional cost or deviation from consumer satisfaction will result in the target function exceeding 0%. The criterion λ determines the influence coefficient of the objective functions. As λ changes, the model choices presented also change
. When λ is considered between 0 and 1, the model is solved repeatedly at intervals of 0.1 using different values of λ, and the objective functions are calculated accordingly. Finally, to investigate the relationship between the two objective functions in the optimal state with various λ coefficients, the Monte Carlo diagram has been employed
In the algorithm, the value of λ is incremented numerically by intervals of 0.1 until it reaches or exceeds 1. Each time λ is updated, the model is re-executed, and the objective function is recalculated with the new λ value. The iteration stops if λ exceeds 1.
Table 13 displays the objective function calculations for various λ values, while
Table 14 presents the model solutions obtained with different λ values
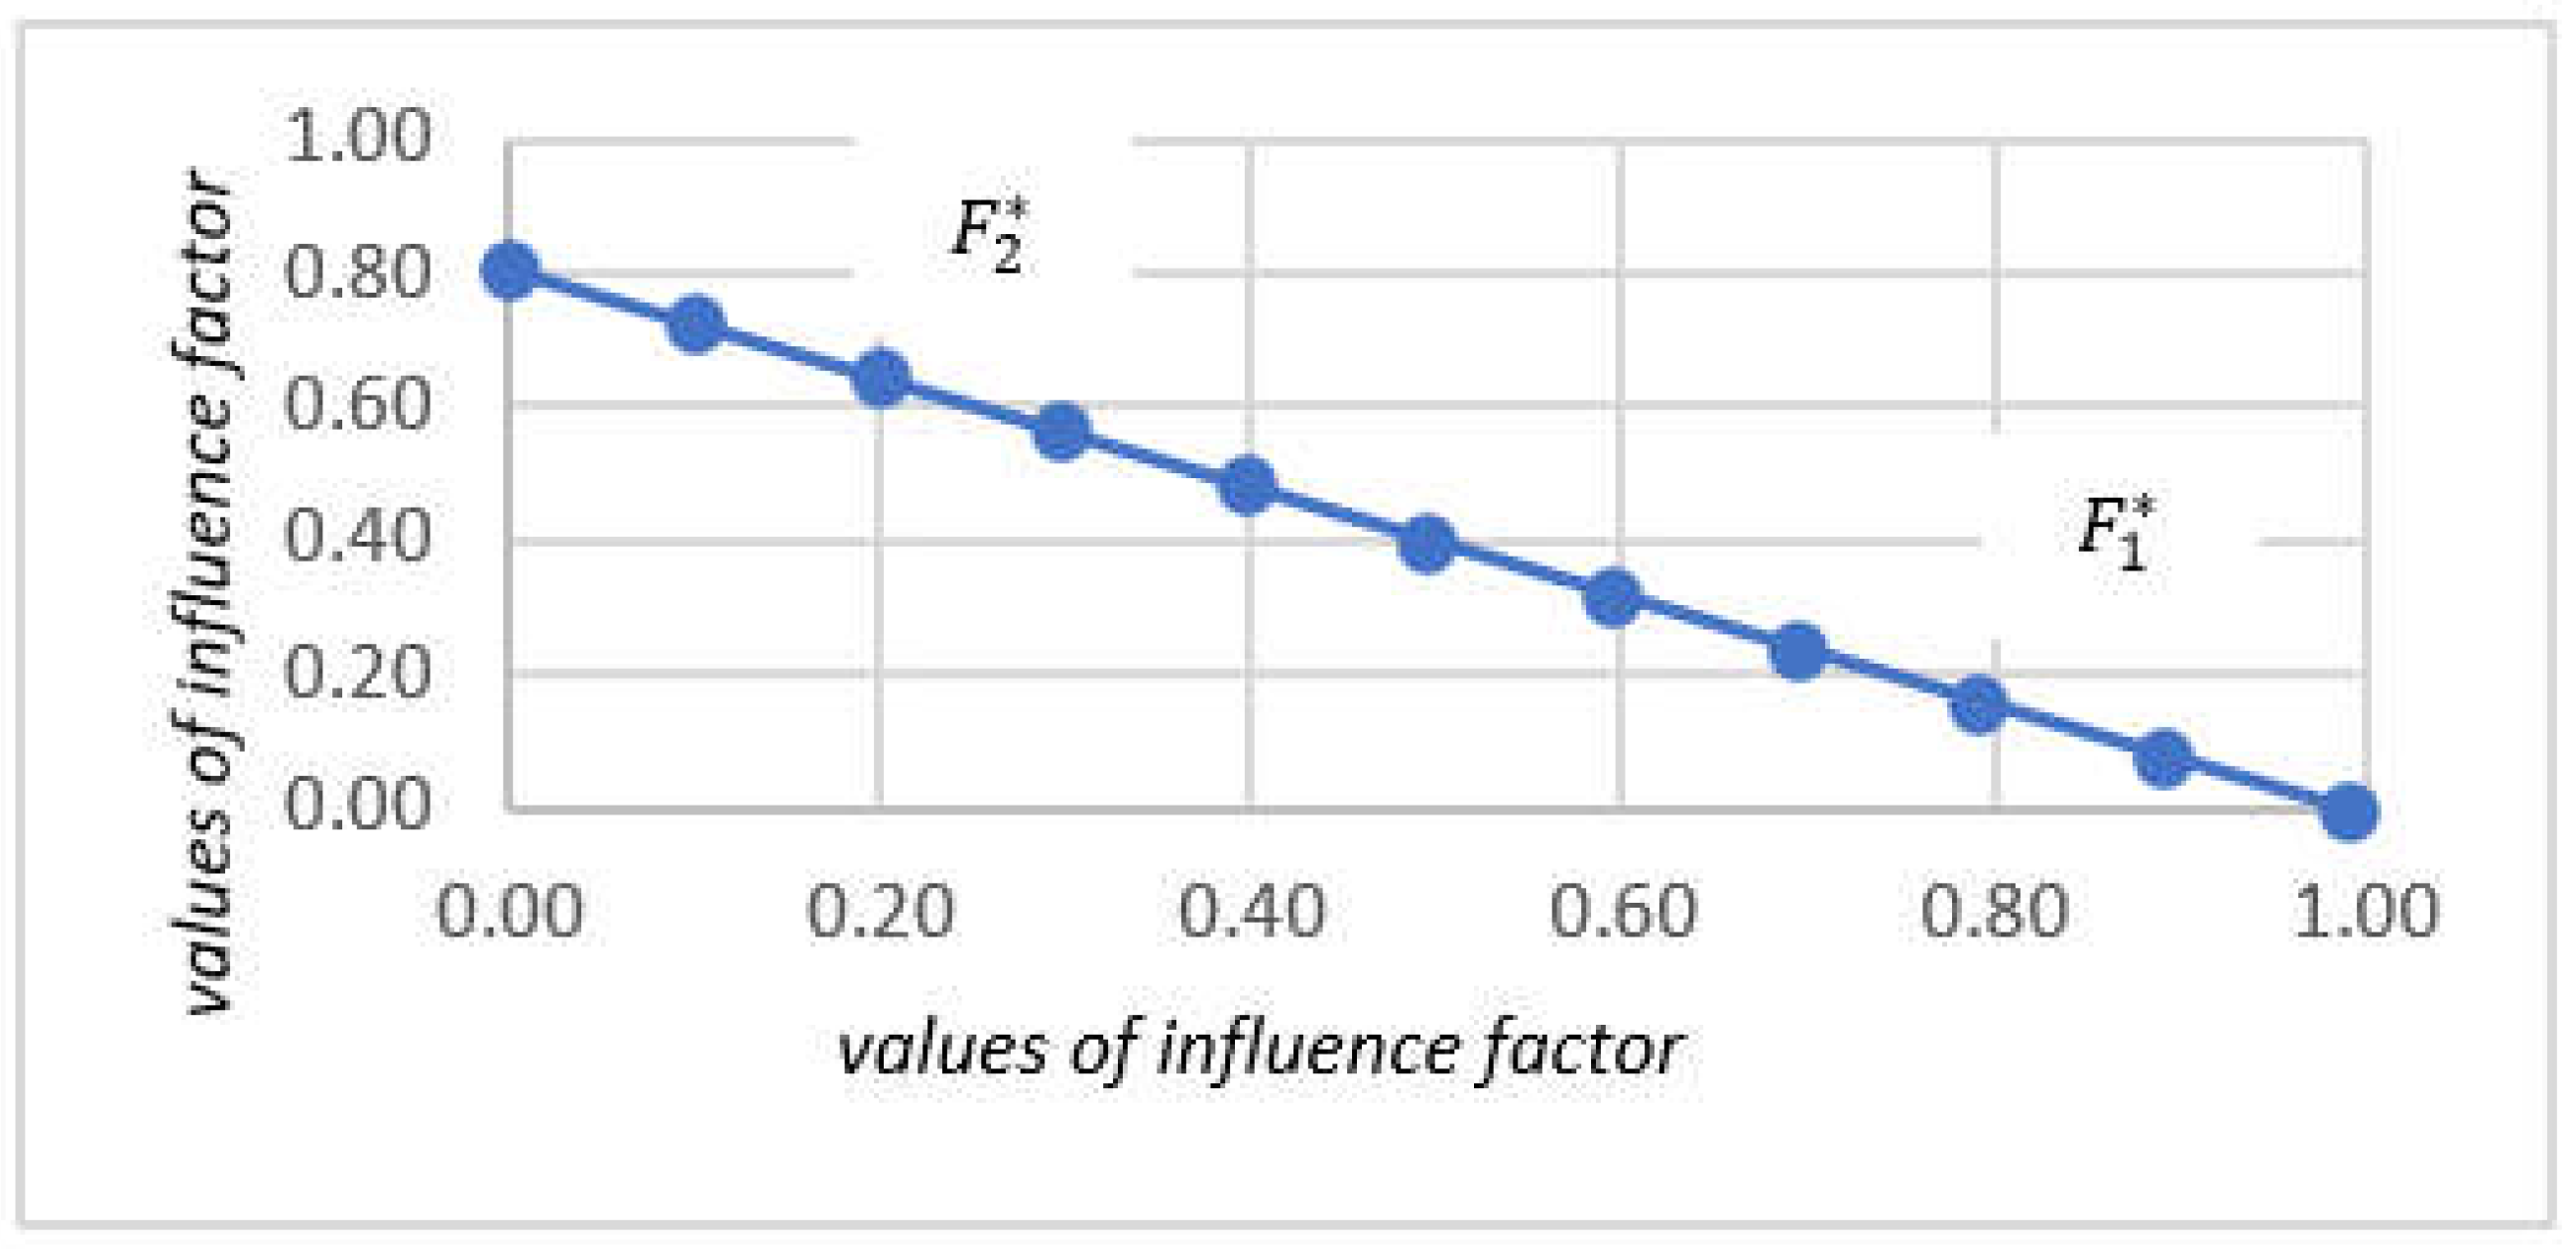
. Figure 10 illustrates that as the influence coefficient (λ) decreases or increases, the objective function value (OFV) deteriorates, signifying a worsening of the optimal solution. This occurs because the two functions,
and
, contradict each other; an increase in one leads to a decrease in the other. Therefore, increasing λ results in higher energy consumption costs (due to device usage) but also increases consumer satisfaction. Conversely, decreasing λ steers the model towards reducing energy costs, albeit at the expense of deviating from consumer habits, leading to decreased consumer satisfaction (or increased dissatisfaction).
Figure 11 shows the objective function values with different λ. According to
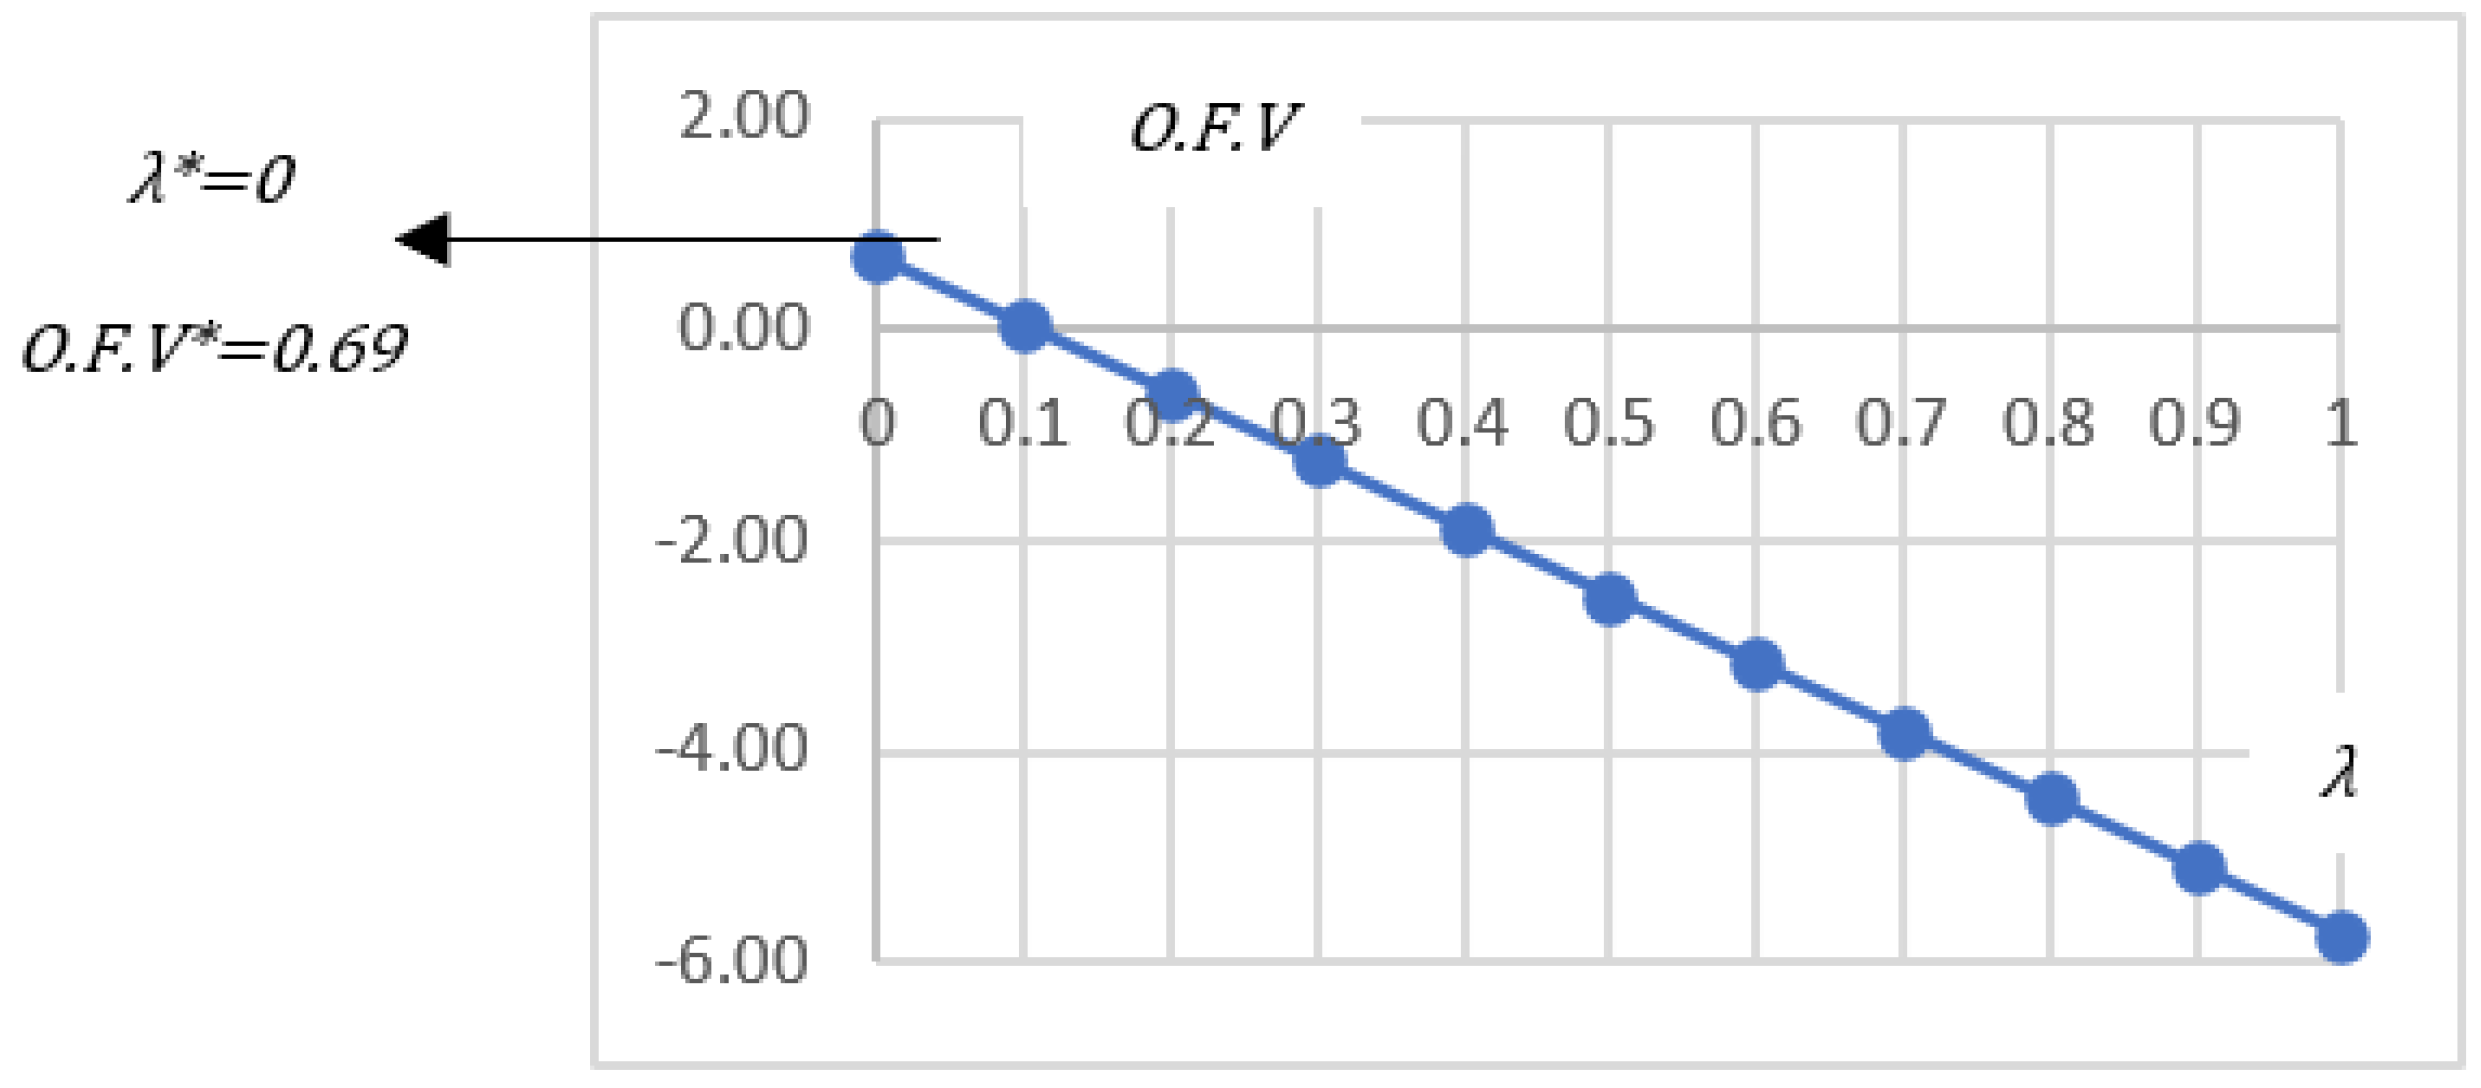
Figure 11, the optimal value of the objective function of OFV* is equal to 0.69. Therefore, the optimal λ introduced by λ* is equal to 0. In
Table 8, the optimal objective function value and λ* are highlighted. Calculating these values means finding the optimal state from the results of two objective functions. By choosing the impact coefficient λ=0, the amount of attention to consumer satisfaction will be 0, while the attention to cost reduction will be equal to 1. In this case, the best possible result will occur. As the value of λ increases, the results of the two approaches decrease
.
The presented model has planned the optimal mode considering energy storage tanks. The inclusion of energy storage tanks has been added as an assumption to the model. In fact, consumers do not use these tanks. Therefore, in the case of optimization without considering energy storage tanks, equations 8, 9 and 10 will be considered zero. Similarly, the value of
is calculated as zero. With the balance of
at zero value, there is no possibility of zero energy when not in use, and each device consumes energy at the same rate over time.
Table 14 shows the comparison of energy consumption cost in three cases. The real state, the state of benefiting from energy storage tanks and the state where there is no storage tank
.
It is shown in
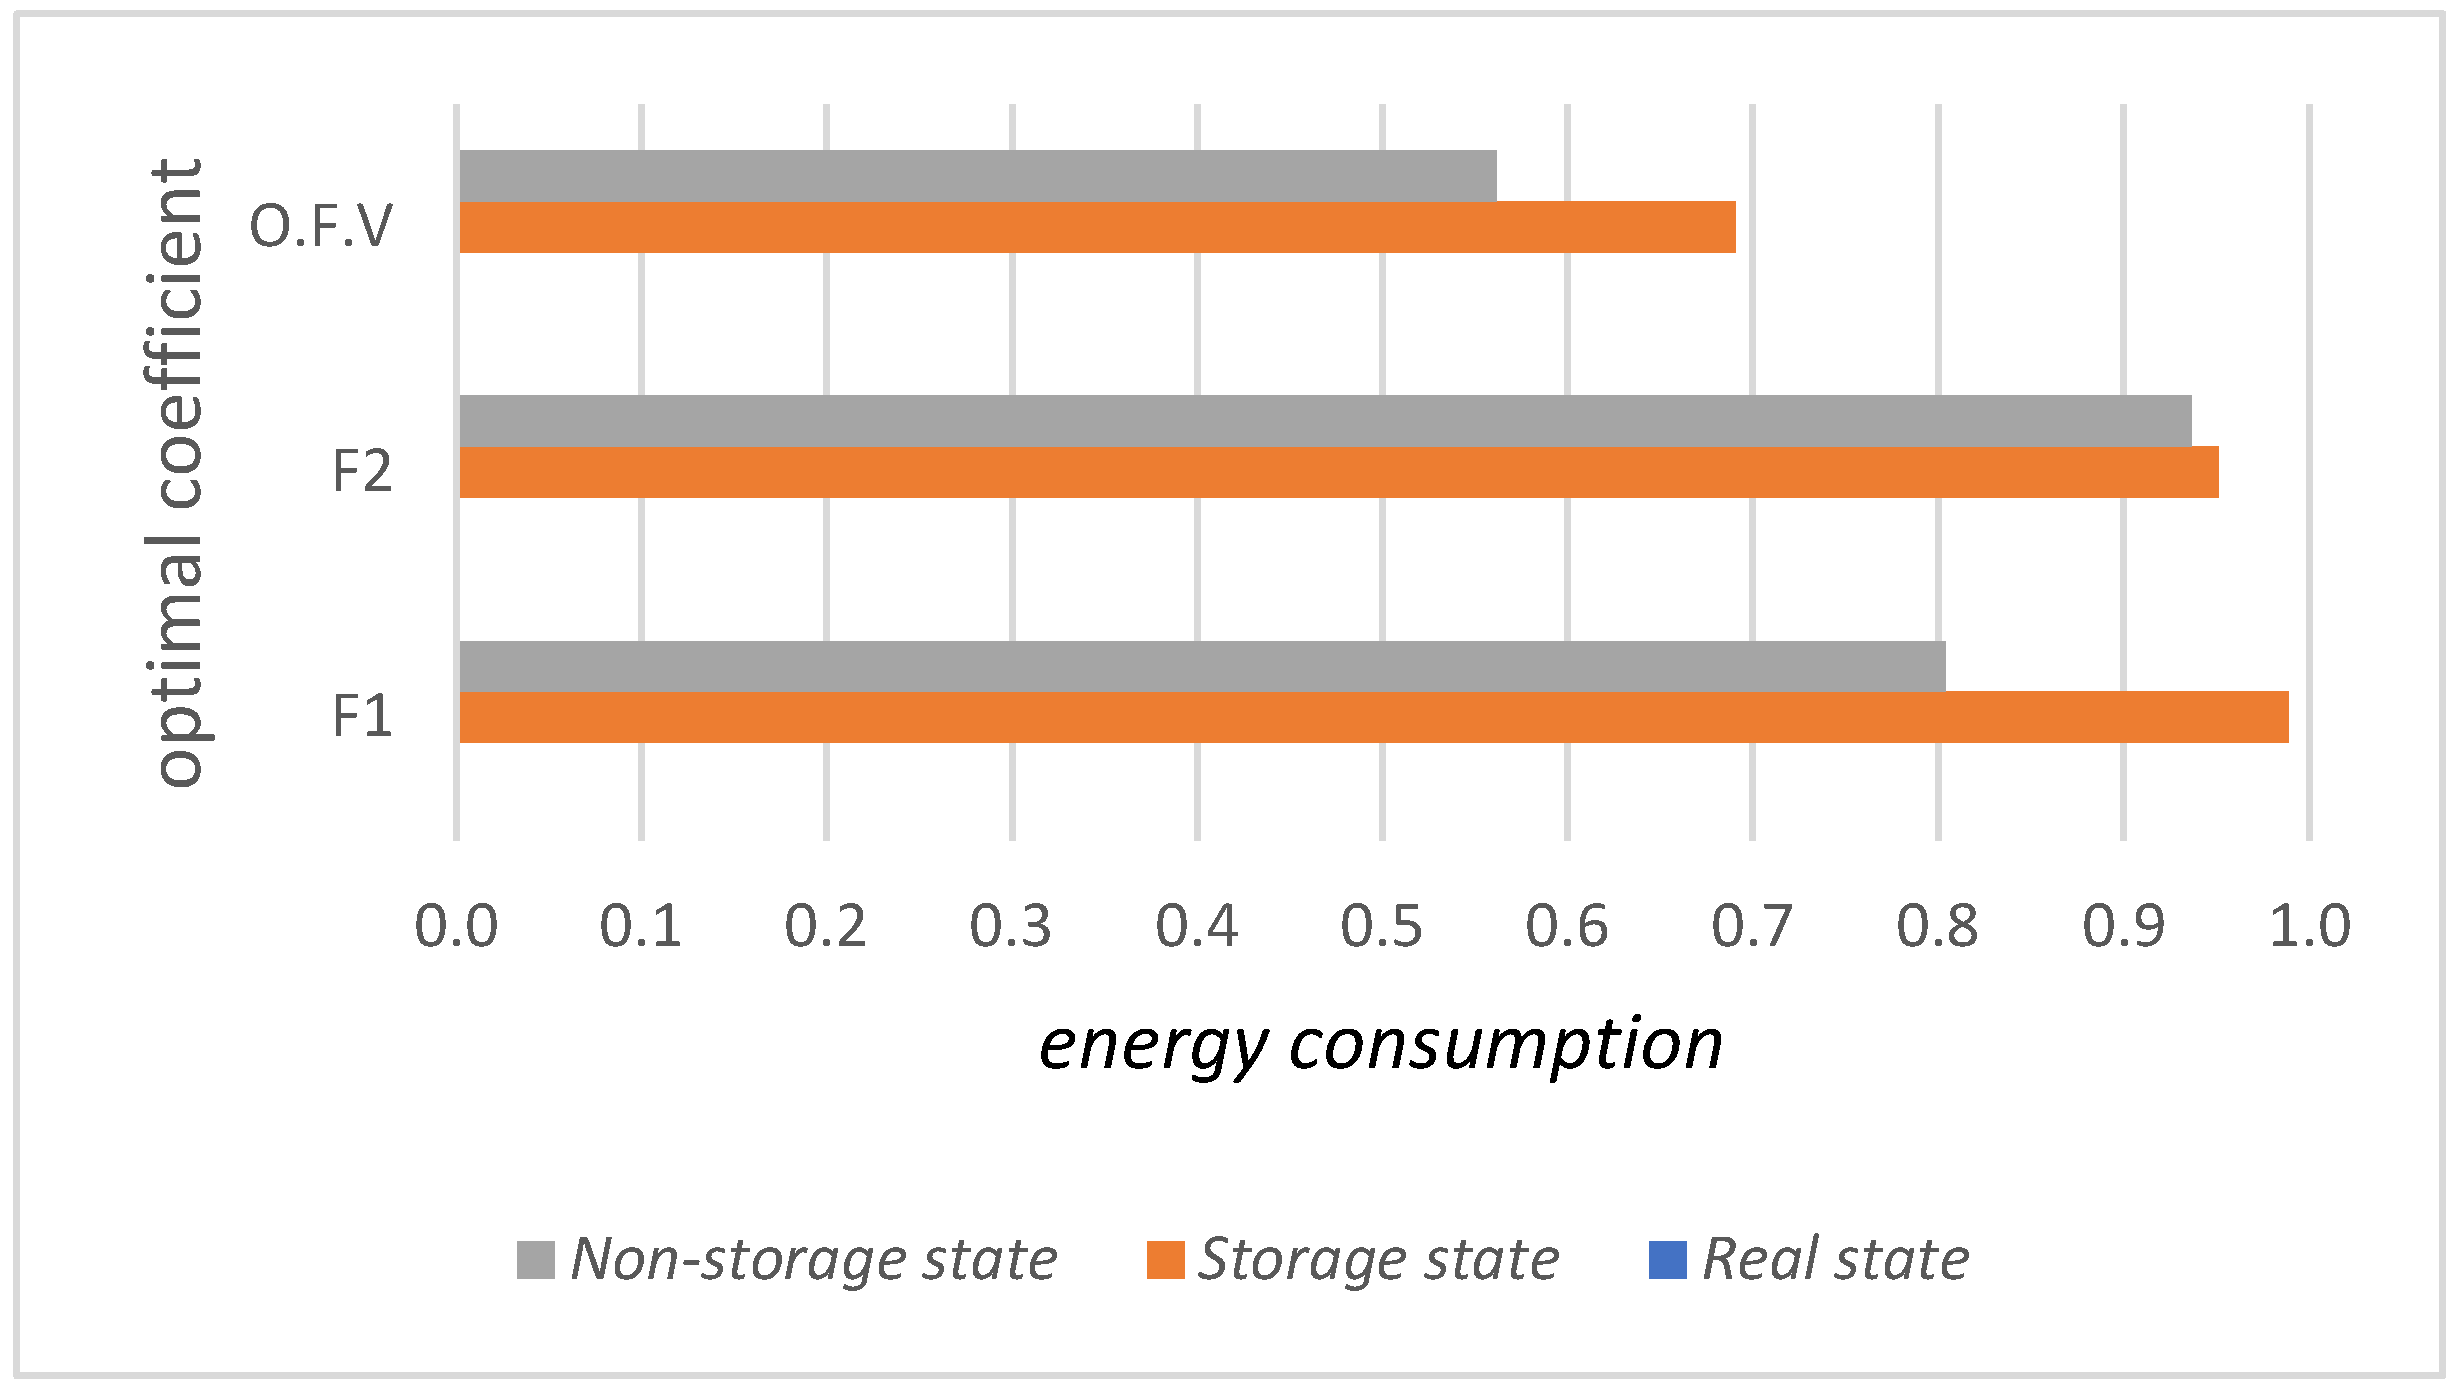
Figure 12 that if there is no access to energy storage tanks, the value of the optimal model will be lower. This means that if there is no storage tank, the value of the objective function of cost reduction
changes from 99% to 80%, the objective function of consumer satisfaction
changes from 95% to 94%. The objective function of
O.F.V* changes from 69% to 56%. Therefore, due to the unavailability of energy storage tanks, the optimal situation will be reduced, resulting in an increase of 56% compared to the actual situation. Considering that the rate of energy consumption of water and gas is considered constant in the case study, by Each device has the possibility of consuming several types of energy together, so the table shows the amount of electricity consumption in three real states, taking into account energy storage tanks and without considering energy storage tanks.
Table 15 shows the comparison of electricity energy consumption in time intervals
.
Since the values in
Table 15 are in kwh unit, for better understanding,
Table 16 shows the share of electricity energy consumption in time periods
.
Table 17 and
Table 18 show the cost of energy consumption and the share of consumption in the above three states
.
As an example of the state of use of the device in time periods, the steam iron device is shown in
Table 19.
As presented in
Table 19, steam iron is set for use in the hours 07:00 to 17:00 due to the increase in the energy consumption tariff between 17:00 and 23:00
.
The requirements of the above model are coded and implemented with GAMS.2018 software. The system requirements were 2 cores of 2.66 processor and 8 GB of RAM. The solution time was 18 seconds according to the dimensions of the problem. Due to the model size and optimal solution time, the exact CPLEX method has been used. Also, the optimal solution has been reached in all stages of problem solving.
6. Conclutions
The current research, utilizing multi-objective mixed integer programming and considering two objectives: reducing energy consumption costs and increasing consumer satisfaction, aims to provide a model that accounts for household consumption culture and common household equipment and supplies. This model aims to generate a weekly consumption plan for households to ensure their satisfaction, assist them financially by reducing energy costs, and align with government policies regarding energy production, distribution, and utilization. Currently, each family uses household appliances and equipment based on their consumption culture and personal preferences, which leads to suboptimal consumption and personalization. This suboptimal behavior poses challenges and problems for future generations and governments. Energy provided to households and society by governments faces social and economic constraints, encompassing various sectors and categorized into peak and non-peak hours to manage access restrictions and ensure fair distribution. Governments employ diverse pricing mechanisms to regulate energy consumption among households and society. These mechanisms vary based on hourly rates, seasonal fluctuations, and geographical distinctions to efficiently manage energy consumption.
The energy sources examined in this research include electricity, water, and gas. The model presented deals with allocating the activation of devices based on customer preferences while adhering to default restrictions (including safety and home lifestyle considerations). To enhance consumer satisfaction in choosing consumption types, two objective functions have been utilized:
- -
Reduce consumption costs by efficiently allocating device usage.
- -
Minimize consumer dissatisfaction resulting from discrepancies between allocation and consumer choice.
The variable λ is introduced as the influence coefficient for these objective functions. According to the calculations, the optimal state of the objective function is presented with λ=0, equivalent to O.F.V*=0.69 (Objective Function Value = 0.69). As depicted in
Figure 5, as λ increases, the objective function deteriorates, indicating that the model moves further away from consumer satisfaction towards optimization. The model introduces energy storage reservoirs as covariates for storing energy levels during peak consumption periods. Recognizing the challenges of implementing reservoirs in practice, the model reallocates devices to households without access to these reservoirs. Despite a significant reduction in the objective function score from mode 1 (access to energy storage tanks) to mode 2 (no access to energy storage tanks) (decreasing from 69% to 56%), there remains room for improvement compared to the current scenario. This improvement amounts to 56%. Finally, by considering default limitations, the study examines the reasons for improvement using a steam iron as an example. This model demonstrates how changes in customer behavior can lead to improved energy cost efficiency. The research suggests that government initiatives aimed at altering consumer behavior to encourage round-the-clock device usage can potentially achieve near-optimal conditions with higher consumer satisfaction.
This study suggests that the impact factor λ, calculated based on initial consumer choices and consumption patterns, is integral to measuring consumer dissatisfaction when households are grouped according to similar preferences. Implementing IoT-equipped devices to facilitate device planning services based on household consumption patterns will play a significant role in controlling and implementing proposed programs. Furthermore, the presence of automatic programs in devices creates a favorable environment for consumers to make instantaneous choices. IoT devices, through their connection and integration with household equipment, enable intelligent programming for device activation and deactivation. This automation capability fosters continuous and gradual changes in household lifestyles, leading to increased satisfaction with optimal energy consumption patterns. Additionally, leveraging IoT technology allows households to receive notifications about consumption plans and device usage schedules. Monitoring current household consumption status and promoting energy consumption awareness through educational systems are suggested strategies that can yield positive outcomes in conjunction with the proposed model’s outputs and recommendations.
The following suggestions for future study are:
References
- Hamed, S., & Kazemi, A. (2017). Multi-objective cost-load optimization for demand side management of a residential area in smart grids. sustainable Cities and Society, 32, 171{180. [CrossRef]
- Iqbal, N., Ahmad, S., & Kim, D. (2021). Health monitoring system for elderly patients using intelligent task mapping mechanism in closed loop healthcare environment. Symmetry., 13(2), 357. [CrossRef]
- Kumar, A., Sharma, S., Goyal, N., Singh, A., Cheng, X., & Singh, P. (2021). Secure and energy-efficient smart building architecture with emerging technology IoT. Comput Commun, Volume 176,207–217. [CrossRef]
- Ratnam, E., Weller, S., & Kellett, C. (2015). Scheduling residential battery storage with solar pv: Assessing the benefits of net metering. Applied Energy 155, 881{891. [CrossRef]
- Sou, K., Weimer, J., Sandberg, H., & Johansson, K. (2011). Scheduling smart home appliances using mixed integer linear programming,. Decision and Control and European Control Conference (CDC-ECC), (p. pp. 5144{5149. [CrossRef]
- Ahmad, S., & Kim, D. (2021). A task orchestration approach for efficient mountainfire detection based on microservice and predictive analysis in iot environment. Intelligent & Fuzzy Systems, 40(3), 5681-5696. [CrossRef]
- Akkasaligar, P., Biradar, S., & Pujari, R. (2019). Internet of things based smart secure home system. International Conference on Intelligent Data Communication Technologies and Internet of Things, (pp. 348–355. [CrossRef]
- Ali Khan, Z., & Abbasi, U. (2018). An energy efficient architecture for IoT based automated smart micro-grid,. Tehnicki vjesnik/Technical Gazette, 25 (5),1472-1477. [CrossRef]
- Amini, M., Frye, J., Ili’c, , M., & Karabaso, O. (2015). “Smart residential energy scheduling utilizing two stage mixed integer linear programming,” in Proc. North Amer. Power Symp. (NAPS),, Oct,pp. 1–6. [CrossRef]
- Apanavičienė, R., & Shahrabani, M. (2023). Key factors affecting smart building integration into smart city: technological aspects. Smart Cities, 6(4), 1832-1857. [CrossRef]
- Aryai, V., & Goldsworthy, M. (2024). Real-time high-resolution modelling of grid carbon emissions intensity. Sustainable Cities and Society, vol.104. 105316. [CrossRef]
- Battula, A., Vuddanti, S., & Salkuti, S. (2023). A day ahead demand schedule strategy for optimal operation of microgrid with uncertainty. Smart Cities, 6(1), 491-509. [CrossRef]
- Calama-Gonzalez, C., Escandon, A., Suarez, R., Alonso, A., & Leon-Rodriguez, A. (2024). Household Energy Vulnerability Evaluation in Southern Spain Through Parametric Energy Simulation Models and Socio-Economic Data. Sustainable Cities and Society, p.105276. [CrossRef]
- Chen, C., Duan, S., Cai, T., Liu, B., & Hu, G. (2011). “Smart energy management system for optimal microgrid economic operation,” IET Renew. Power Generat.,, vol. 5, no. 3, pp. 258–267. [CrossRef]
- Collotta , M., & Pau, G. (2015). “A solution based on bluetooth low energy for smart home energy management. Energies, vol. 8, no. 10,pp. 11916–11938. [CrossRef]
- Dinh, H., & Kim, D. (2021). An Optimal Energy-Saving Home Energy Management Supporting User Comfort and Electricity Selling with Different Prices. IEEE Access, . 9:9235–49. [CrossRef]
- Dorahaki, S., Rashidinejad , M., Fatemi Ardestani, S., Abdollahi, A., & Salehizadeh, M. (2022). A home energy management model considering energy storage and smart flexible appliances: A modified time-driven prospect theory approach. Journal of Energy Storage, vol.48, 104049. [CrossRef]
- Duman, A., Erden , H., Gönül, O., & Güler, Ö. (2022). Optimal sizing of PV-BESS units for home energy management system-equipped households considering day-ahead load scheduling for demand response and self-consumption. Energy and Buildings., 267. [CrossRef]
- Duygan, M., Fischer, M., P¨arli, R., & Ingolad, K. (2022). Where do Smart Cities grow? The spatial and socio-economic configurations of smart city development. Sustainable Cities and society, Volume 77, 103578. [CrossRef]
- Elham, S., & Shahram, J. (2015). Optimal residential appliance scheduling under dynamic pricing scheme via HEMDAS. ” Energy Buildings, vol. 93, pp. 40–49, Apr. [CrossRef]
- Giordano, A., Mastroianni, C., Scarcello, L., & Spezzano, G. (2020). An Optimization Model for Efficient Energy Exchange in Energy Communities. 4th International Workshop on Smart Cities Systems Engineering (IEEE SCE 2020), (p. Paris, France, 30 June-3 July. [CrossRef]
- Guan, X., Xu, Z., & Jia, Q. (2010). “Energy-efficient buildings facilitated by microgrid,. IEEE Trans. Smart Grid, vol. 1, no. 3, pp. 243–252,Dec. [CrossRef]
- Hubert, T., & Grijalva,, S. (2012). Modeling for residential electricity optimization in dynamic pricing environments. IEEE Transactions on Smart Grid 3, 4) (2012) 2224{2231. [CrossRef]
- Ikram, A., Ullah, A., Datta, D., Islam, A., & Ahmad, T. (2024). Optimizing energy consumption in smart homes: Load scheduling approaches. IET Power Electronics. [CrossRef]
- Isikveren, M. (2010). Smart grids. Sci. Chronicles Mag, vol. 18, pp. 1–7.
- Jamshidi, F., Ghiasi, M., Mehrandezh, M., & Wang, Z. (2024). Optimizing Energy Consumption in Agricultural Greenhouses: A Smart Energy Management Approach. smart cities, 7(2), 859-879. [CrossRef]
- Kinhekar, N., Padhy, N., Li, F., & Gupta, H. (2016). Utility oriented demand side management using smart ac and micro dc grid cooperative. Transactions on Power Systems, 31 (2). [CrossRef]
- Lee, S., Hong, T., Le, M., Medina, L., Xu, Y., Robinson, A., & Piette, M. (2024). Assessment of Energy and Thermal Resilience Performance to Inform Climate Mitigation of Multifamily Buildings in Disadvantaged Communities. Sustainable Cities and Society, 105319. [CrossRef]
- Lezama, F., Soares, J., Canizes, B., & Vale, Z. (2020). Flexibility management model of home appliances to support DSO requests in smart grids. Sustainable Cities and Society, vol.55. [CrossRef]
- Lokeshgupta, B., & Sivasubramani, S. (2019). Multi-objective home energy management with battery energy storage systems. Sustainable Cities and Society, 47,101458. [CrossRef]
- Lu , Q., Guo , Q., & Zeng, W. (2022). Optimization scheduling of home appliances in smart home: A model based on a niche technology with sharing mechanism. Electrical Power and Energy Systems, 141. [CrossRef]
- Lv, Z., Hu, B., & Lv, H. (2020). Infrastructure monitoring and operation for smart cities based on IoT system. IEEE Transation industrial information, vol. 16 (3), 1957–1962. [CrossRef]
- Mansouri, S., Ahmarinejad, A., Nematbakhsh, E., Javadi, M., Jordehi, A., & Catalao, J. (2021). Energy management in microgrids including smart homes: A multi-objective approach. Sustainable Cities and Society, 69. [CrossRef]
- Mehrabani , A., Mardani, H., & Ghazizadeh, M. (2022). Optimal Energy Management in Smart Home Considering Renewable Energies, Electric Vehicle, and Demand-Side Management. 9th Iranian Conference on Renewable Energy and Distributed Generation, ICREDG 2022. [CrossRef]
- Melhem, F., Grunder, O., Hammoudan, Z., & Moubayed, Z. (2017). Optimization and Energy Management in Smart Home Considering Photovoltaic, Wind, and Battery Storage System With Integration of Electric Vehicles. CANADIAN JOURNAL OF ELECTRICAL AND COMPUTER ENGINEERING, VOL. 40, NO. 2, SPRING. [CrossRef]
- Mu, R., Peivi, W., & Haershan, M. (2022). What organizational conditions, in combination, drive technology enactment in government-led smart city projects. Forecast. Soc. Change, Volume 174, 121220. [CrossRef]
- Mukta, M., Rahman, M., Asyhari, A., & Alam Bhuiyan, M. (2020). IoT for energy efficient green highway lighting systems: challenges and issues. Network Computer Application, VOL.158, 102575. [CrossRef]
- Naeem Iqbal, I., & Kim, D. (2022). IoT task management mechanism based on predictive optimization for efficient energy consumption in smart residential buildings. Energy Build, 13(2), 357. [CrossRef]
- Obringer, R., & Nateghi, R. (2021). What makes a city ‘smart’in the Anthropocene? A critical review of smart cities under climate change. Sustainable Cities and Society, 75. [CrossRef]
- Rezaeimozafar, M., Monaghan, R., Barrett, E., & Duffy, M. (2022). A review of behind-the-meter energy storage systems in smart grids, Renew. Sustainable Energy Reveiw, 164 112573. [CrossRef]
- Said, O., & Tolba, A. (2021). Accurate performance prediction of IoT communication systems for smart cities: an efficient deep learning based solution. Sustainable Cities and Society, 69, 102830. [CrossRef]
- Setlhaolo, D., & Xia, X. (2015). Optimal scheduling of household appliances with a battery storage system and coordination. Energy and Buildings, Vol.94,pp.61-94. [CrossRef]
- Shakouri, H., & Kazemi, A. (2017). Multi-objective cost-load optimization for demand side management of a residential area in smart grids. Sustainable cities and society, Vol.32,pp.171-180. [CrossRef]
- Simões, N., Manaia, M., & Simões, I. (2021). Energy performance of solar and Trombe walls in Mediterranean climates. Energy, vol.234.121197. [CrossRef]
- Singh, R., Sharma, R., Akram, V., Gehlot, A., Buddhi, D., & Malik, P. (2021). Highway 4.0: digitalization of highways for vulnerable road safety development with intelligent IoT sensors and machine learning. Safty science, Volume 143, 105407. [CrossRef]
- Tazvinga, H., Zhu, B., & Xia, X. (2015). “Optimal power flow management for distributed energy resources with batteries. Energy Convers Manage, vol. 102, pp. 104–118. [CrossRef]
- THB, H., Dinh , H., & Kim, D. (2023). Multi-objective framework for a home energy management system with the integration of solar energy and an electric vehicle using an augmented ε-constraint method and lexicographic optimization. Sustainable Cities and Society., 88. [CrossRef]
- Tostado-Véliz, M., Gurung , S., & Jurado, F. (2022). Efficient solution of many-objective Home Energy Management systems. Electrical Power and Energy Systems, vol.136,107666. [CrossRef]
- Yi, Y., Verbic, G., & Chapman, A. (2021). Optimal Energy Management Strategy for Smart Home with Electric Vehicle. IEEE Madrid PowerTech, PowerTech 2021 - Conference Proceedings. Madrid. [CrossRef]
Figure 1.
Intensity of common research keywords of the last 5 years in the field of household energy consumption.
Figure 1.
Intensity of common research keywords of the last 5 years in the field of household energy consumption.
Figure 2.
Cluster diagram of common research keywords of the last 5 years in the field of household energy consumption.
Figure 2.
Cluster diagram of common research keywords of the last 5 years in the field of household energy consumption.
Figure 3.
Research steps.
Figure 3.
Research steps.
Figure 4.
Map of how energy flows are distributed along with home appliances and energy storage sources.
Figure 4.
Map of how energy flows are distributed along with home appliances and energy storage sources.
Figure 5.
Difference between model allocation and actual consumer choice.
Figure 5.
Difference between model allocation and actual consumer choice.
Figure 6.
tariff for the cost of electric energy consumption in time periods.
Figure 6.
tariff for the cost of electric energy consumption in time periods.
Figure 7.
the consumption share of each type of energy in the time periods chosen by the customer.
Figure 7.
the consumption share of each type of energy in the time periods chosen by the customer.
Figure 8.
share of energy consumption cost based on consumers’ choices in each time period.
Figure 8.
share of energy consumption cost based on consumers’ choices in each time period.
Figure 9.
model execution algorithm with different values of λ.
Figure 9.
model execution algorithm with different values of λ.
Figure 10.
Comparison of values of influence factor λ for functions and .
Figure 10.
Comparison of values of influence factor λ for functions and .
Figure 11.
The optimal value of the objective function O.F.V* in λ*.
Figure 11.
The optimal value of the objective function O.F.V* in λ*.
Figure 12.
Comparison of energy consumption cost values in the objective functions along with the optimal coefficient λ for three modes.
Figure 12.
Comparison of energy consumption cost values in the objective functions along with the optimal coefficient λ for three modes.
Table 1.
Tariff of energy price based on 2022 (Rials).
Table 1.
Tariff of energy price based on 2022 (Rials).
Table 2.
Types of household appliances and their energy consumption.
Table 2.
Types of household appliances and their energy consumption.
| household appliances |
Electricity consumption (kwh) |
|
|
remark |
| Washing Machine |
2,500 |
45 lit |
---- |
|
| Dish Washer |
2,000 |
25 lit |
---- |
|
| Vaccum Cleaner |
10 |
---- |
----- |
|
| water pump |
800 |
12.4 lit/m |
---- |
1 hp |
| Air Conditioner 24000 |
1,500 |
---- |
---- |
|
| Package 24000 |
137 |
7 lit/m |
2.95 () |
|
| Steam Iron |
1,000 |
200 cc |
---- |
|
| Clothes dryer |
3,000 |
---- |
---- |
|
| Rechargeable vacuum cleaner |
20 |
--- |
---- |
The time required for charging in normal mode is 8 hours |
| Rechargeable lawn mower |
24 |
---- |
---- |
The time required for charging in normal mode is 8 hours |
| Area lighting |
300 |
---- |
---- |
|
| Pool (2*4*6) |
|
7 lit/m |
|
|
| Jacuzzi |
250 |
22 lit/day |
---- |
Capacity = 2 people |
Table 3.
Indexes of the proposed mixed integer multiobjective model.
Table 3.
Indexes of the proposed mixed integer multiobjective model.
| # |
index |
Description |
Value |
| 1 |
n |
day and night index |
3 |
| 2 |
t |
index of time periods |
6 |
| 3 |
i |
household index |
4 |
| 4 |
d |
devices index |
7 |
| 5 |
f |
energy type index |
3 |
Table 4.
Parameters of the proposed mixed integer multiobjective model.
Table 4.
Parameters of the proposed mixed integer multiobjective model.
| # |
Parameter |
Description |
Value |
| 1 |
|
Consumer choice in turning on devices at any time |
0-1 |
| 2 |
|
the cost of each request unit of each type of energy based on peak and non-peak times |
10-100 |
| 3 |
|
commitment the status of the device being turned off or on in a certain period of time |
0-1 |
| 4 |
|
commitment to minimum consumption of each type of device in time periods for each household |
5-24 |
| 5 |
|
the consumption of each type of energy of each device when it is turned on in each time period |
0-95 |
| 6 |
|
limiting the level of energy storage tanks |
1000 |
| 7 |
BigM |
Big value |
1,000,000 |
| 8 |
λ |
The impact factor of customer choice desirability |
0-1 |
| 9 |
|
Energy transfer coefficient to the storage tank per unit time |
|
Table 5.
Variables of the proposed mixed integer multi-objective model.
Table 5.
Variables of the proposed mixed integer multi-objective model.
| # |
Variable |
Description |
| 1 |
|
Energy consumption objective function |
| 2 |
|
The objective function of consumer satisfaction |
| 3 |
|
request any type of energy from the government in any period of time for any consumer |
| 4 |
|
binary variable of the status of the devices in each time period in the optimal program |
| 5 |
|
binary variable of the status of the devices in each time period if it is connect to city enrgy |
| 6 |
|
binary variable of the status of the devices in each time period if it is connected to battery and storage tank and consumed by it |
| 7 |
|
the level of energy storage tanks of each type and in each time period for each household |
| 8 |
|
Time gaps between consumer satisfaction and cost-optimal program |
| 9 |
|
Energy consumption of energy storage tanks (like battery) in every day, every period and every household |
| 10 |
|
Decimal variable bounded between 0-1 to show the charge status of energy storage tanks in time periods |
Table 6.
restrictions on turning on or off devices by household.
Table 6.
restrictions on turning on or off devices by household.
| Device Name |
23-03 |
03-07 |
07-11 |
11-15 |
15-19 |
19-23 |
| Cloth Washer |
|
|
|
|
|
|
| Dish Washer |
|
|
|
|
|
|
| Garden Watering System |
|
|
|
|
|
|
| Air Conditioner |
|
|
|
|
|
|
| Bathroom / Package |
|
N |
N |
N |
|
|
| Jacuzzi & Pool |
|
|
|
|
|
|
| Chargable Device |
|
|
|
|
|
|
| vaccum Cleaner |
N |
N |
|
|
|
|
| area lighting |
Y |
Y |
|
|
|
Y |
| Steam Iron |
N |
N |
|
|
|
|
Table 7.
The minimum allowed consumption of devices by time period.
Table 7.
The minimum allowed consumption of devices by time period.
| Device Name |
i1 |
i2 |
i3 |
i4 |
i5 |
i6 |
i7 |
i8 |
i9 |
i10 |
Sum |
| Cloth Washer |
6 |
7 |
4 |
4 |
8 |
7 |
6 |
8 |
7 |
7 |
64 |
| Dish Washer |
3 |
3 |
2 |
4 |
6 |
1 |
4 |
5 |
3 |
2 |
33 |
| Garden Watering System |
3 |
5 |
3 |
0 |
3 |
2 |
2 |
0 |
1 |
0 |
19 |
| Air Conditioner |
28 |
33 |
30 |
29 |
27 |
22 |
15 |
17 |
15 |
8 |
224 |
| Bathroom / Package |
21 |
21 |
11 |
12 |
16 |
16 |
12 |
11 |
9 |
9 |
138 |
| Jacuzzi & Pool |
5 |
5 |
7 |
0 |
21 |
5 |
8 |
7 |
6 |
6 |
70 |
| Chargable Device |
21 |
23 |
17 |
15 |
6 |
11 |
7 |
16 |
10 |
7 |
133 |
Table 8.
tariff for the cost of energy consumption in time periods.
Table 8.
tariff for the cost of energy consumption in time periods.
| |
23-03 |
03-07 |
07-11 |
11-15 |
15-19 |
19-23 |
| ELECTRIC |
183 |
183 |
457 |
457 |
457 |
913 |
| WATER |
7,910 |
7,910 |
7,910 |
7,910 |
7,910 |
7,910 |
| GAS |
9,887 |
9,887 |
9,887 |
9,887 |
9,887 |
9,887 |
Table 9.
consumption of any type of energy in time periods chosen by the customer.
Table 9.
consumption of any type of energy in time periods chosen by the customer.
| ENERGY |
23-03 |
03-07 |
07-11 |
11-15 |
15-19 |
19-23 |
SUM |
| ELECTRIC |
133,197 |
115,017 |
119,370 |
118,570 |
137,618 |
182,494 |
806,266 |
| WATER |
44,170 |
9,963 |
12,048 |
12,206 |
60,081 |
43,864 |
182,332 |
| GAS |
121 |
3 |
0 |
0 |
159 |
124 |
407 |
Table 10.
the consumption share of each type of energy in the time periods chosen by the customer.
Table 10.
the consumption share of each type of energy in the time periods chosen by the customer.
| ENERGY |
23-03 |
03-07 |
07-11 |
11-15 |
15-19 |
19-23 |
| ELECTRIC |
17% |
14% |
15% |
15% |
17% |
23% |
| WATER |
24% |
5% |
7% |
7% |
33% |
24% |
| GAS |
30% |
1% |
0% |
0% |
39% |
30% |
Table 11.
the cost of energy consumption based on the choice of consumers in each time period.
Table 11.
the cost of energy consumption based on the choice of consumers in each time period.
| ENERGY |
23-03 |
03-07 |
07-11 |
11-15 |
15-19 |
19-23 |
SUM |
| ELECTRIC |
121,608,861 |
21,002,104 |
54,492,405 |
54,127,205 |
62,822,617 |
166,617,022 |
480,670,214 |
| WATER |
349,386,282 |
78,808,912 |
95,302,844 |
96,547,878 |
475,240,710 |
346,962,658 |
1,442,249,284 |
| GAS |
1,195,772 |
29,165 |
0 |
0 |
1,574,919 |
1,224,937 |
4,024,794 |
| SUM |
472,190,915 |
99,840,181 |
149,795,249 |
150,675,083 |
539,638,246 |
514,804,617 |
1,926,944,292 |
Table 12.
share of energy consumption cost based on consumers’ choices in each time period.
Table 12.
share of energy consumption cost based on consumers’ choices in each time period.
| ENERGY |
23-03 |
03-07 |
07-11 |
11-15 |
15-19 |
19-23 |
| ELECTRIC |
25% |
4% |
11% |
11% |
13% |
35% |
| WATER |
24% |
5% |
7% |
7% |
33% |
24% |
| GAS |
30% |
1% |
0% |
0% |
39% |
30% |
Table 13.
Comparison of values of influence factor λ for functions and .
Table 13.
Comparison of values of influence factor λ for functions and .
| # |
λ |
|
|
O.F.V |
- |
λ |
|
|
O.F.V |
| 1 |
0 |
0.99 |
0.00 |
0.69 |
7 |
0.6 |
0.40 |
0.48 |
-0.48 |
| 2 |
0.1 |
0.89 |
0.08 |
-0.07 |
8 |
0.7 |
0.30 |
0.56 |
-0.56 |
| 3 |
0.2 |
0.79 |
0.16 |
-0.15 |
9 |
0.8 |
0.20 |
0.64 |
-0.64 |
| 4 |
0.3 |
0.69 |
0.24 |
-0.23 |
10 |
0.9 |
0.10 |
0.72 |
-0.72 |
| 5 |
0.4 |
0.59 |
0.32 |
-0.31 |
11 |
1 |
0.00 |
0.80 |
-0.80 |
| 6 |
0.5 |
0.49 |
0.40 |
-0.39 |
|
|
|
|
|
Table 14.
Comparison of energy consumption cost values in the objective functions along with the optimal coefficient λ for three modes.
Table 14.
Comparison of energy consumption cost values in the objective functions along with the optimal coefficient λ for three modes.
| |
|
|
O.F.V* |
| Real state |
0.00 |
0.00 |
0.00 |
| Storage state |
0.99 |
0.95 |
0.69 |
| Non-storage state |
0.80 |
0.94 |
0.56 |
Table 15.
Comparison of electricity consumption (kwh) in different time periods for three modes.
Table 15.
Comparison of electricity consumption (kwh) in different time periods for three modes.
| |
23-03 |
03-07 |
07-11 |
11-14 |
14-17 |
17-23 |
| Tariff rate |
182.6 |
182.6 |
456.5 |
456.5 |
456.5 |
913 |
| Real state |
133,197 |
115,017 |
119,370 |
118,570 |
137,618 |
182,494 |
| Storage state |
64,501 |
354,757 |
104,815 |
120,940 |
104,815 |
56,439 |
| Non-storage state |
72,564 |
298,318 |
129,003 |
112,877 |
112,877 |
80,627 |
Table 16.
Comparison of the percentage of electrical energy consumption (kwh) in different time periods for three modes.
Table 16.
Comparison of the percentage of electrical energy consumption (kwh) in different time periods for three modes.
| |
23-03 |
03-07 |
07-11 |
11-14 |
14-17 |
17-23 |
| Tariff rate |
182.6 |
182.6 |
456.5 |
456.5 |
456.5 |
913 |
| Real state |
17% |
14% |
15% |
15% |
17% |
23% |
| Storage state |
2% |
1% |
1% |
32% |
22% |
42% |
| Non-storage state |
13% |
2% |
1% |
33% |
18% |
33% |
Table 17.
Comparison of the cost of electricity consumption in different time periods for three modes.
Table 17.
Comparison of the cost of electricity consumption in different time periods for three modes.
| |
23-03 |
03-07 |
07-11 |
11-14 |
14-17 |
17-23 |
Sum (Rial) |
Improve |
| Real state |
4.7E+08 |
1.0E+08 |
1.5E+08 |
1.5E+08 |
5.4E+08 |
5.1E+08 |
1.9E+09 |
- |
| Storage state |
7.7E+07 |
8.4E+07 |
6.3E+07 |
4.3E+08 |
5.9E+08 |
5.3E+08 |
1.8E+09 |
8% |
| Non-storage state |
8.9E+07 |
8.1E+07 |
7.5E+07 |
5.2E+08 |
4.9E+08 |
5.5E+08 |
1.8E+09 |
6% |
Table 18.
Comparison of the percentage of electricity energy consumption cost in different time periods for three modes.
Table 18.
Comparison of the percentage of electricity energy consumption cost in different time periods for three modes.
| |
23-03 |
03-07 |
07-11 |
11-14 |
14-17 |
17-23 |
| Real state |
25% |
5% |
8% |
8% |
28% |
27% |
| Storage state |
4% |
5% |
4% |
24% |
33% |
30% |
| Non-storage state |
5% |
4% |
4% |
29% |
27% |
30% |
Table 19.
Comparison of the number of active appliances and equipment in different time periods for three modes.
Table 19.
Comparison of the number of active appliances and equipment in different time periods for three modes.
| |
23-03 |
03-07 |
07-11 |
11-14 |
14-17 |
17-23 |
| Real state |
0 |
0 |
22 |
10 |
11 |
14 |
| Model |
0 |
0 |
19 |
21 |
17 |
0 |
|
Disclaimer/Publisher’s Note: The statements, opinions and data contained in all publications are solely those of the individual author(s) and contributor(s) and not of MDPI and/or the editor(s). MDPI and/or the editor(s) disclaim responsibility for any injury to people or property resulting from any ideas, methods, instructions or products referred to in the content. |
© 2024 by the authors. Licensee MDPI, Basel, Switzerland. This article is an open access article distributed under the terms and conditions of the Creative Commons Attribution (CC BY) license (http://creativecommons.org/licenses/by/4.0/).
