Submitted:
13 May 2024
Posted:
17 May 2024
You are already at the latest version
Abstract
Keywords:
1. Introduction
2. Material and Methods
2.1. Measurements
2.2. The Numerical Model
3. The Emission Flux
4. Results
4.1. Wind Field Calculations
4.2. Spatial Discrepancies in Air Flow Patterns
4.3. Sea-Spray Dynamics
5. Discussion and Conclusions
Author Contributions
Funding
Conflicts of Interest
Abbreviations
| MDPI | Multidisciplinary Digital Publishing Institute |
| DOAJ | Directory of open access journals |
| TLA | Three letter acronym |
| LD | Linear dichroism |
References
- Charlson, R.J.; Schwartz, S.E.; Hales, J.M.; Cess, R.D.; Coakley, Jr., J.A.; Hansen, J.E.; Hoffman, D.J. Climate forcing by anthropogenic aerosols. Science 1992, 255, 423–430. [CrossRef]
- Andreae, M., Climate effects of changing atmospheric aerosol levels. In World survey of climatology Future climate of the world; Henderson-Sellers, A., Ed.; 1995; Vol. 16, pp. 341–392.
- Jaenicke, R., Physical aspects of atmospheric aerosol. In Aerosols and their climatic effects; Gerbard, H.; Deepak, A., Eds.; 1984; pp. 7–34.
- Yoon, Y.; O’Dowd, C.; Jennings, S.; Lee, S. Statistical characteristics and predictability of particle formation events at Mace Head. J. Geophys. Res. 2006, 111, D13204. [CrossRef]
- Mallet, M.; Roger, J.; Despiau, S.; Dubovik, O.; Putaud, J. Microphysical and optical properties of aerosol particles in urban zone during ESCOMPTE. Atmos. Res. 2003, 69, 73–97.
- Mulcahy, J.; O’Dowd, C.; Jennings, S.; Ceburnis, D. Significant enhancement of aerosol optical depth in marine air under high wind conditions. Geophys Res Lett 2008, 35.
- Lewis, E.; Lewis, R.; Karlstrom, K.; Schwartz, S. Sea salt aerosol production: mechanisms, methods, measurements, and models; Vol. 152, American Geophysical Union, 2004.
- Piazzola, J.; Mihalopoulos, N.; Canepa, E.; Tedeschi, G.; Prati, P.; Zarmpas, P.; Bastianini, M.; Missamou, T.; Cavaleri, L. Characterization of aerosols above the Northern Adriatic Sea: case studies of offshore and onshore wind conditions. Atmos. Environ. 2016, 132, 153–162. [CrossRef]
- Johansson, J.; Salter, M.; Navarro, J.; Leck, C.; Nilsson, E.; Cousins, I. Global transport of perfluoroalkyl acids via sea spray aerosol. Environ Sci: Proc & Impacts 2019, 21, 635–649.
- Gustafsson, M.; Franzen, L. Dry deposition and concentration of marine aerosols in a coastal area; SW Sweden. Atmos. Environ. 1996, 30, 977–989. [CrossRef]
- Farrell, E. Atmospheric deposition in maritime environments and its impact on terrestrial ecosystems. Water Air Soil Pollut. 1995, 1, 1573–2932.
- Monahan, E.; Spiel, D.; Davidson, K., A model of marine aerosol generation via whitecaps and wave disruption. In Oceanic Whitecaps; Monahan, E.; McNiocaill, G., Eds.; D. Reidel, Norwell, Mass., 1986; pp. 167–174174.
- Blanchard, D.C. The Ejection of Drops from the Sea and Their Enrichment with Bacteria and Other Materials: A Review. Estuaries 1989, 12, 127–137.
- Spiel, D.E. Formation and production of sea spray aerosol. Journal of Aerosol Science 1996, 27, S65–S66.
- Van Eijk, A.; Kusmierczyk-Michulec, J.; Francius, M.; Tedeschi, G.; Piazzola, J.; Meritt, D.; Fontana, J. Sea-spray aerosol particles generated in the surf zone. J. Geophys. Res. 2011, 116, D19210. [Google Scholar] [CrossRef]
- O’Dowd, C.D.; de Leeuw, G. Marine aerosol production: a review of the current knowledge. Phil. Trans. R. Soc. A 2007, 365, 1753–1774. [Google Scholar] [CrossRef] [PubMed]
- Andreas, E. Sea spray and the turbulent air-sea heat fluxes. J. Geophys. Res. 1992, 97, 11429–11441. [Google Scholar] [CrossRef]
- Emanuel, K. Tropical Cyclone Activity Downscaled from NOAA-CIRES Reanalysis; 1908–1958. Journal of Advances in Modeling Earth Systems 2010, 2, 1942–2466. [Google Scholar] [CrossRef]
- Tsyro, S.; Aas, W.; Soares, J.; Sofiev, M.; Berge, H.; Spindler, G. Modelling of sea salt concentrations over Europe: key uncertainties and comparison with observations. Atmos. Chem. Phys. 2011, 11, 10367–10388. [Google Scholar] [CrossRef]
- Chen, Y.; Cheng, Y.; Ma, N.; Wolke, R.; Nordmann, S.; Schüttauf, S.; Ran, L.; Wehner, B.; Birmili, W.; Gon, H.; others. Sea salt emission, transport and influence on size-segregated nitrate simulation: a case study in northwestern europe by WRF-Chem. Atmos. Chem. Phys. 2016, 16, 12081–12097. [Google Scholar] [CrossRef]
- Neumann, D.; Matthias, V.; Bieser, J.; Aulinger, A.; Quante, M. A comparison of sea salt emission parameterizations in northwestern europe using a chemistry transport model setup. Atmos. Chem. Phys. 2016, 16, 9905–9933. [Google Scholar] [CrossRef]
- Lafon, C.; Piazzola, J.; Le Calve, O.; Forget, P.; Despiau, S. Analysis of the variations of the whitecap fraction as measured in a coastal zone during the FETCH experiment. Boundary Layer Meteorology 2004, 111, 339–360. [Google Scholar] [CrossRef]
- Parent, P.; Laffon, C.; Trillaud, V.; Grauby, O.; Ferry, D. Physicochemical Characterization of Aerosols in the Coastal Zone: Evidence of Persistent Carbon Soot in the Marine Atmospheric Boundary Layer (MABL) Background. Atmosphere 2023, 14, 291. [Google Scholar] [CrossRef]
- Liu, F.; Peng, L.; Dai, S.; Bi, X.; Shi, M. Size-Segregated Characteristics of Organic Carbon (OC) and Elemental Carbon (EC) in Marine Aerosol in the Northeastern South China Sea. Atmosphere 2023, 14, 661. [Google Scholar] [CrossRef]
- Piazzola, J.; Bruch, W.; Desnues, C.; Parent, P.; Yohia, C.; Canepa, E. Influence of Meteorological Conditions and Aerosol Properties on the COVID-19 Contamination of the Population in Coastal and Continental Areas in France: Study of Offshore and Onshore Winds. Atmosphere 2021, 12, 523. [Google Scholar] [CrossRef]
- Stifanese, R.; Canepa, E.; Traverso, P. Corrosion of 316L Stainless Steel used for Building Applications in Marine–Urban Atmospheres: A Case Study from Genoa, Italy. Journal of Architectural Engineering 2022, 28. [Google Scholar] [CrossRef]
- Jeon, D.; Jung, J.; Park, J.; Min, J.; Oh, J.E.; Moon, J.; Lee, J.S.; Yoon, S. Predicting airborne chloride deposition in marine bridge structures using an artificial neural network model. Construction and Building Materials 2022, 337, 127623. [Google Scholar] [CrossRef]
- Bruch, W.; Piazzola, J.; Branger, H.; Luneau, C.; Bourras, D.; Tedeschi, G.; van Eijk, A. Spray Production Dependence on Wind and Wave Combinations: A Tunnel Study. Boundary-Layer Meteorology 2021. [CrossRef]
- Bruch, W.; Yohia, C.; Tulet, P.; Limoges, A.; Sutherland, P.; van Eijk, A.; Missamou, T.; Piazzola, J. Atmospheric Sea Spray Modeling in the North-East Atlantic Ocean Using Tunnel-Derived Generation Functions and the SUMOS Cruise Data Set. J. Geophys. Res. 2023, 128. [Google Scholar] [CrossRef]
- Lac, C.; others. Overview of the Meso-NH model version 5.4 and its applications. Geosci. Model Dev. 2018, 11, 1929–1969.
- Honnert, R.; Masson, V.; Lac, C. A Theoretical Analysis of Mixing Length for Atmospheric Models From Micro to Large Scales. Front. Earth Sci. 2021, 8. [Google Scholar] [CrossRef]
- Laussac, S.; Piazzola, J.; Tedeschi, G.; Yohia, C.; Canepa, E.; Rizza, U.; Van Eijk, A. Development of a fetch dependent sea-spray source function using aerosol concentration measurements in the north-western Mediterranean. Atmos. Environ. 2018, 193, 177–189. [Google Scholar] [CrossRef]
- Hsu, S. A mechanism for the increase of wind stress (drag) coefficient with wind speed over water surfaces: A parametric model. J. Phys. Oceanogr. 1986, 16, 144–150. [Google Scholar] [CrossRef]
- Piazzola, J.; Despiau, S. Contribution of marine aerosols in the particle size distributions observed in Mediterranean coastal zone. Atm. Environ. 1997, 31, 2991–3009. [Google Scholar] [CrossRef]
- Brockmann, J. Sampling and transport of aerosols; Van Nostrand Reinhold: NY, USA, 1993; pp. 77–111. [Google Scholar]
- Frick, G.; Hoppel, W. Airship measurements of ship’s exhaust plumes and their effect on marine boundary layer clouds. J Atmos Sci. 2000, 57, 2625–2648. [Google Scholar] [CrossRef]
- Savelyev, I.; Anguelova, M.; Frick, G.; Dowgiallo, D.; Hwang, P.; Caffrey, P.; Bobak, J. On direct passive microwave remote sensing of sea spray aerosol production. Atmos Chem Phys. 2014, 14, 11611. [Google Scholar] [CrossRef]
- Limoges, A.; Yohia, C.; Rodier, Q.; van Eijk, A.; Piazzola, J. High-resolution modeling of the spatiotemporal variations in aerosol extinction in a complex coastal area. Environmental Effects on Light Propagation and Adaptive Systems VI; SPIE Remote Sensing, , 2023; Vol. 12731, p. 127310C. [CrossRef]
- Lunet, T.; Lac, C.; Auguste, F.; Visentin, F.; Masson, V.; Escobar, J. Combination of WENO and Explicit Runge–Kutta Methods for Wind Transport in the Meso-NH Model. Monthly Weather Review 2017, 145, 3817–3838. [Google Scholar] [CrossRef]
- Farr, T.G.; Rosen, P.A.; Caro, E.; Crippen, R.; Duren, R.; Hensley, S.; Kobrick, M.; Paller, M.; Rodriguez, E.; Roth, L.; others. The Shuttle Radar Topography Mission. Reviews of Geophysics 2007, 45, RG2004. [Google Scholar] [CrossRef]
- Redelsperger, J.; Sommeria, G. Method of representing the turbulence associated with precipitations in a three-dimensional model of cloud convection. Boundary Layer Meteorol. 1982, 24, 231–252. [Google Scholar] [CrossRef]
- Redelsperger, J.; Sommeria, G. Three-dimensional simulation of a convective storm: sensitivity studies on subgrid parameterization and spatial resolution. J. Atmos. Sci. 1986, 43, 2619–2635. [Google Scholar] [CrossRef]
- Cuxart, J.; Bougeault, P.; Redelsperger, J. A turbulence scheme allowing for mesoscale and large-eddy simulations. Q. J. R. Meteorol. Soc. 2000, 126, 1–30. [Google Scholar] [CrossRef]
- Cheng, Y.; Canuto, V.M.; Howard, A.M. An improved model for the turbulent PBL. Journal of the Atmospheric Sciences 2002, 59, 1550–1565. [Google Scholar]
- Bougeault, P.; Lacarrere, P. Parameterization of Orography-Induced Turbulence in a Mesobeta–Scale Model. Monthly Weather Review 1989, 117, 1872–1890. [Google Scholar] [CrossRef]
- Ovadnevaite, J.; de Leeuw, G.; Ceburnis, D.; Monahan, C.; Partanen, A.I.; Korhonen, H. A sea spray aerosol flux parameterization encapsulating wave state. Atmospheric Chemistry and Physics 2014, 14, 1837–1852. [Google Scholar] [CrossRef]
- Cox, C.; Munk, W. Measurement of the roughness of the sea surface from photographs of the sun’s glitter. Josa 1954, 44, 838–850. [Google Scholar] [CrossRef]
- Bréon, F.; Henriot, N. Spaceborne observations of ocean glint reflectance and modeling of wave slope distributions. J. Geophys Res. 2006, 111. [Google Scholar] [CrossRef]
- Lenain, L.; Statom, N.; Melville, W. Airborne measurements of surface wind and slope statistics over the ocean. J. Phys. Oceanogr. 2019, 49, 2799–2814. [Google Scholar] [CrossRef]
- Bentamy, A.; Croize-Fillon, D.; Perigaud, C. Characterization of ASCAT measurements based on buoy and QuikSCAT wind vector observations. Ocean Sci. 2008, 4, 265–274. [Google Scholar] [CrossRef]
- Ricard, D.; Lac, C.; Riette, S.; Legrand, R.; Mary, A. Kinetic energy spectra characteristics of two convection-permitting limited-area models AROME and Meso-NH. Q. J. R. Meteorol. Soc. 2013, 139, 1327–1341. [Google Scholar] [CrossRef]
- Rodier, Q.; Masson, V.; Couvreux, F.; Paci, A. Evaluation of a Buoyancy and Shear Based Mixing Length for a Turbulence Scheme. Front. Earth Sci. 2017, 5, 65. [Google Scholar] [CrossRef]
- Van Eijk, A.; De Leeuw, G. Modeling aerosol particle size distributions over the North sea. J. Geophys. Res. 1992, 97, 14417–14429. [Google Scholar] [CrossRef]
- Lafon, C.; Piazzola, J.; Le Calve, O.; Forget, P.; Despiau, S. Analysis of the variations of the whitecap fraction as measured in a coastal zone during the FETCH experiment. Boundary Layer Meteorology 2004, 111, 339–360. [Google Scholar] [CrossRef]
- Canepa, E.; Irwin, J. Evaluation of air pollution models. In Air Quality Modeling – Theories, Methodologies, Computational Techniques, and Available Databases and Software; Zannetti, P., Ed.; The EnviroComp Institute and Air & Waste Management Association, 2005; Vol. II – Advanced Topics, pp. 503–556.
- Yu, W.; Nakakita, E.; Kim, S.; Yamaguchi, K. Assessment of Ensemble Flood Forecasting with Numerical Weather Prediction by considering Spatial Shift of Rainfall Fields. KSCE Journal of Civil Engineering 2018, 22, 3686–3696. [Google Scholar] [CrossRef]
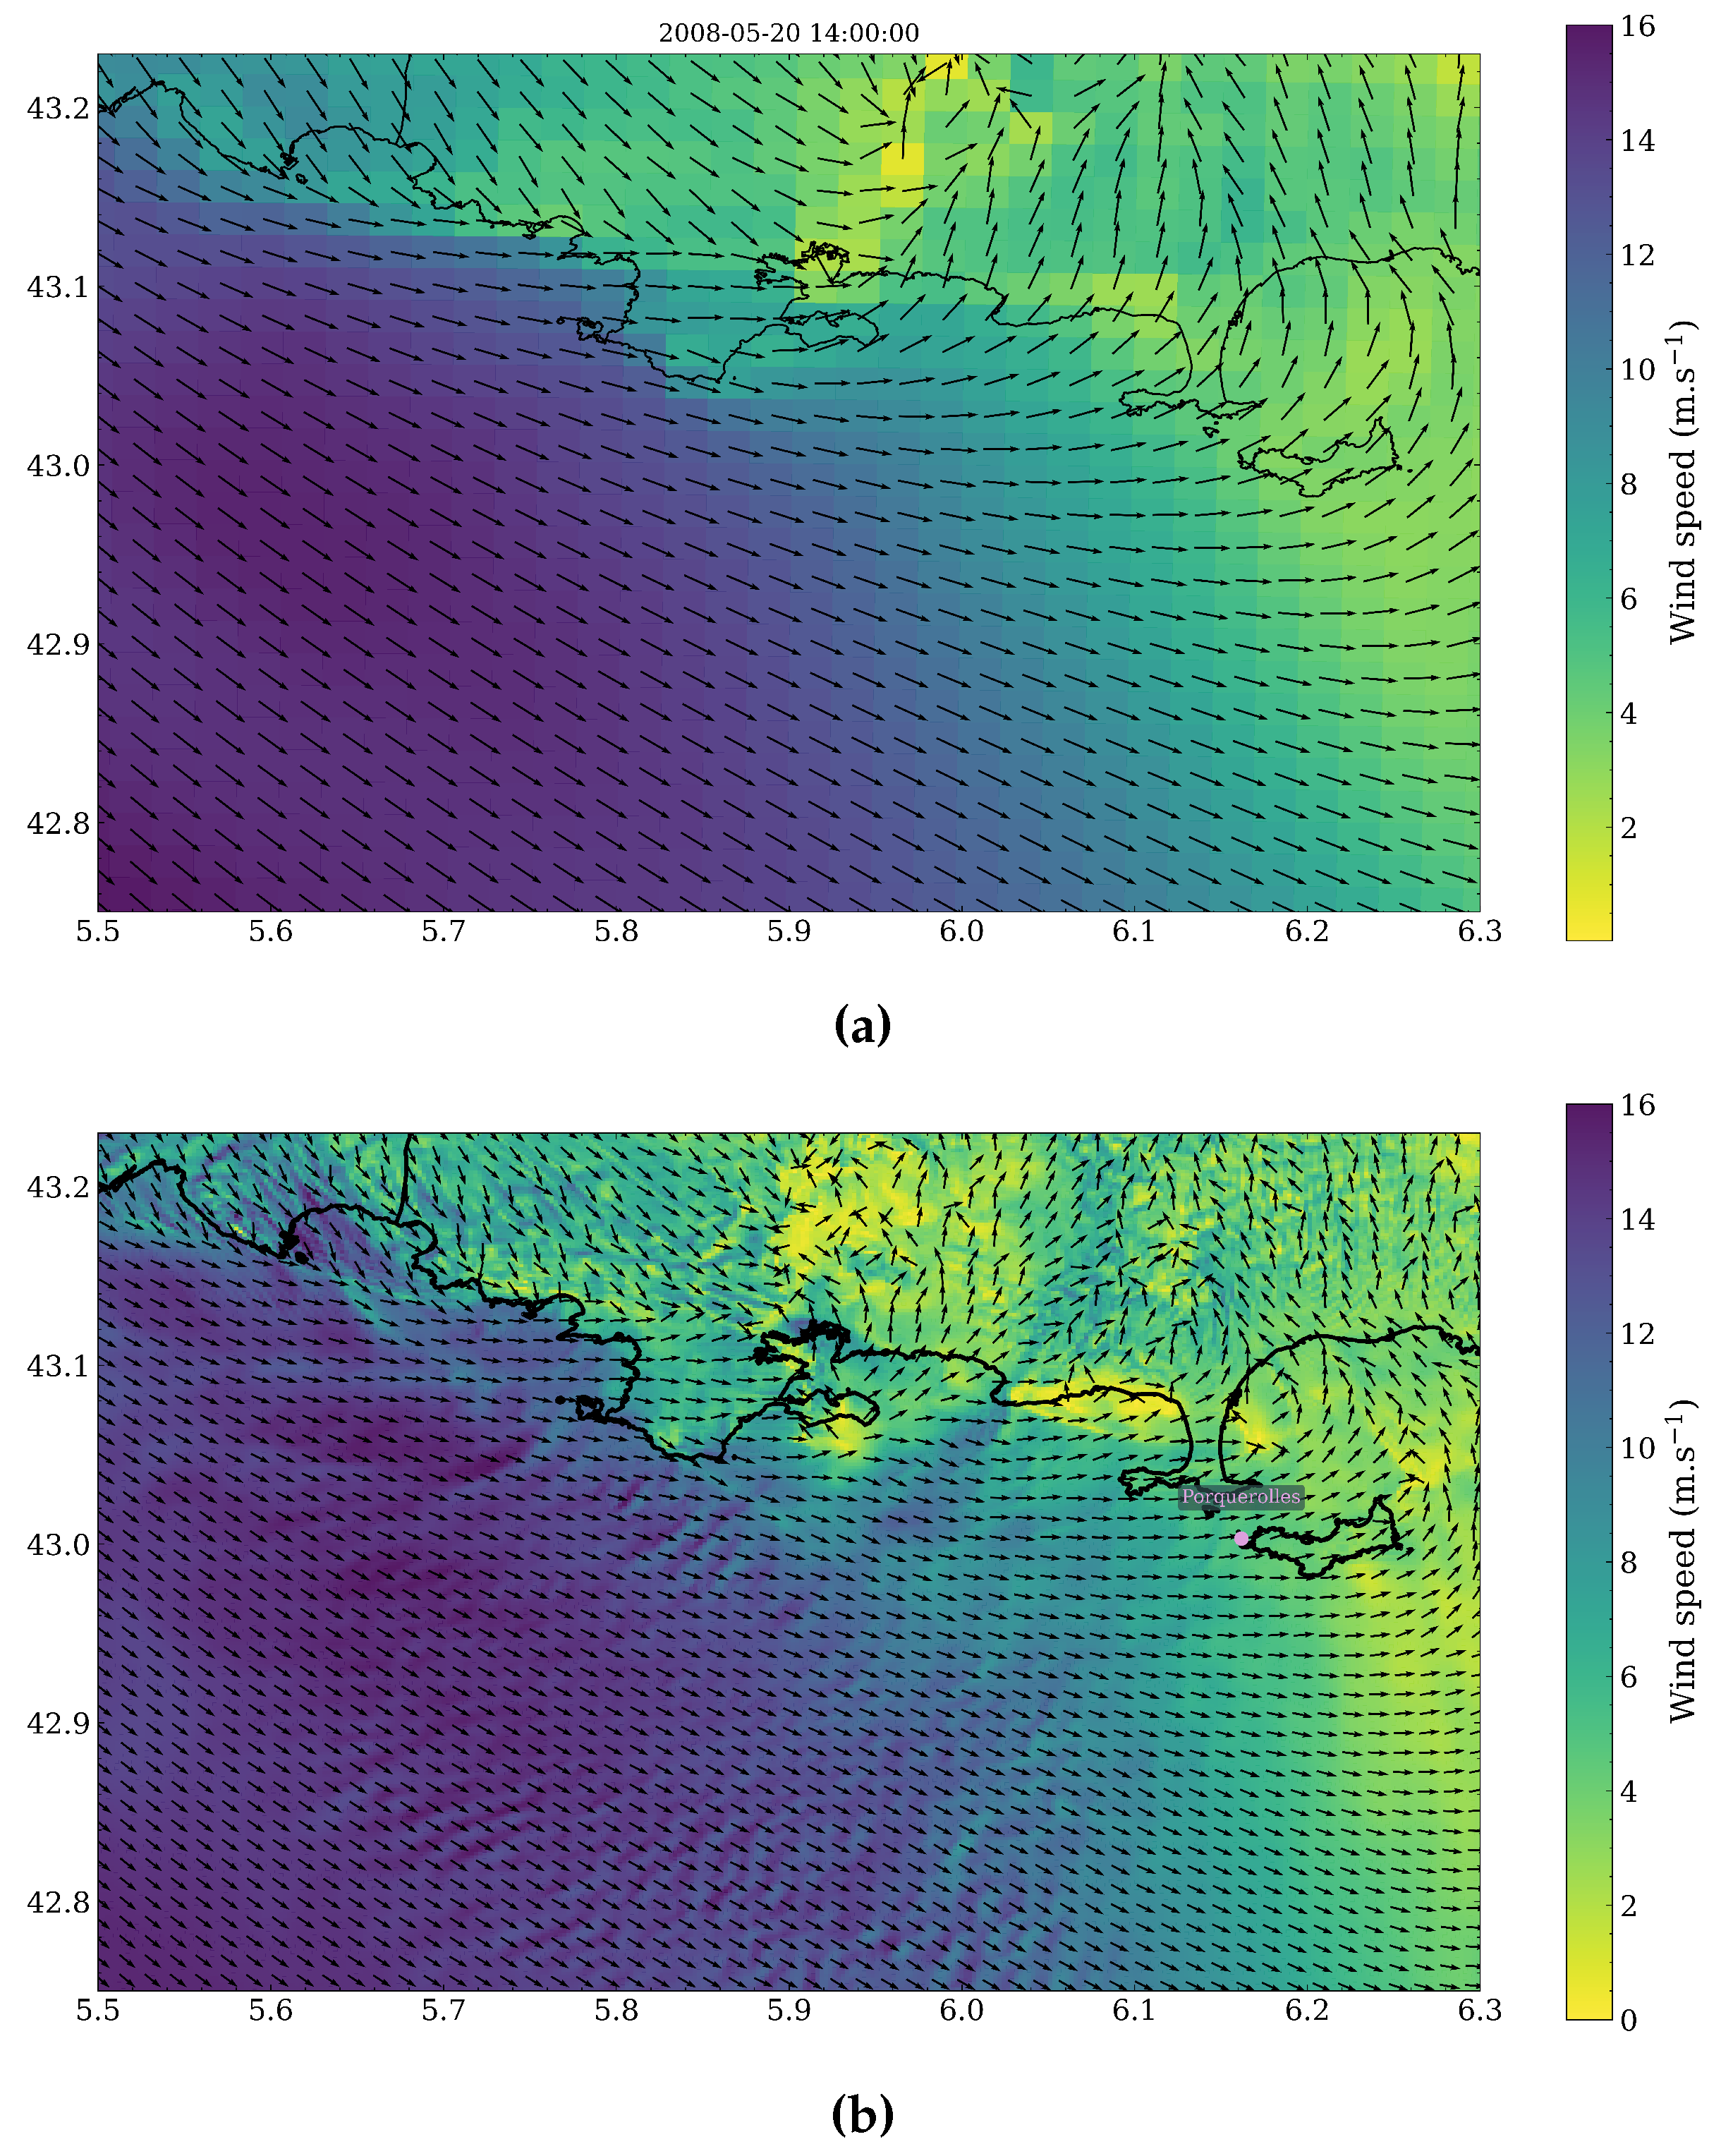
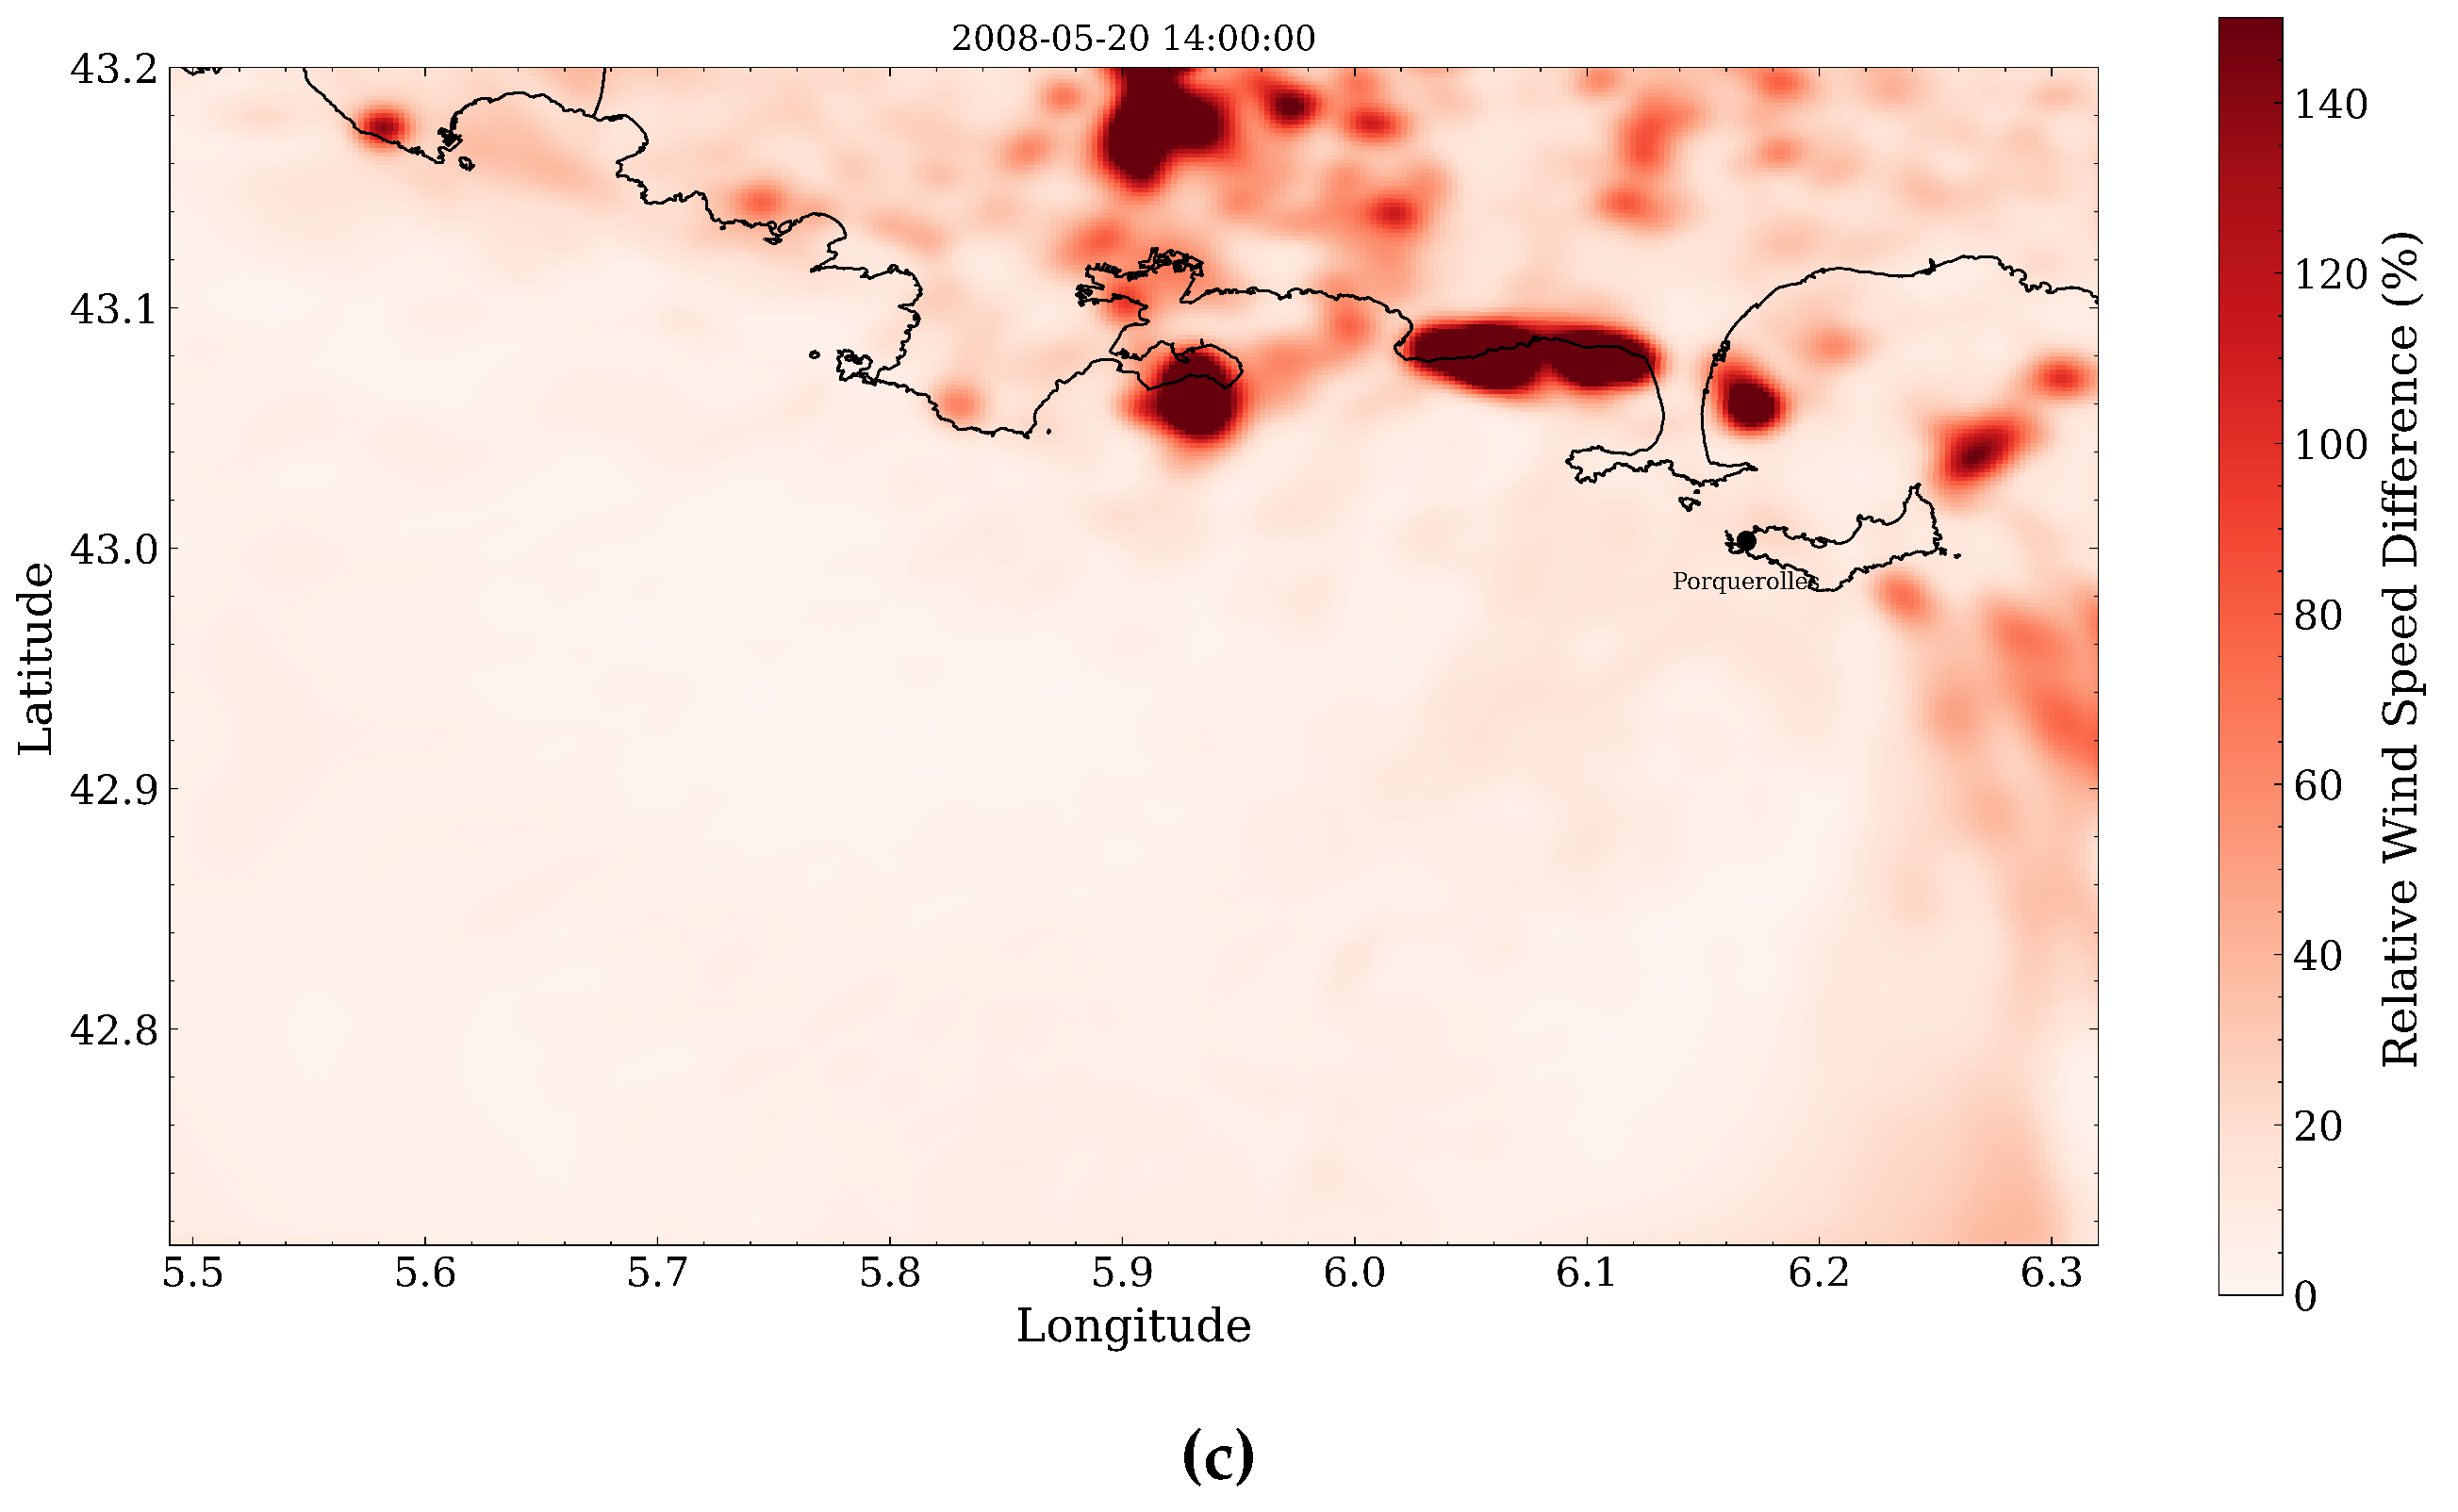
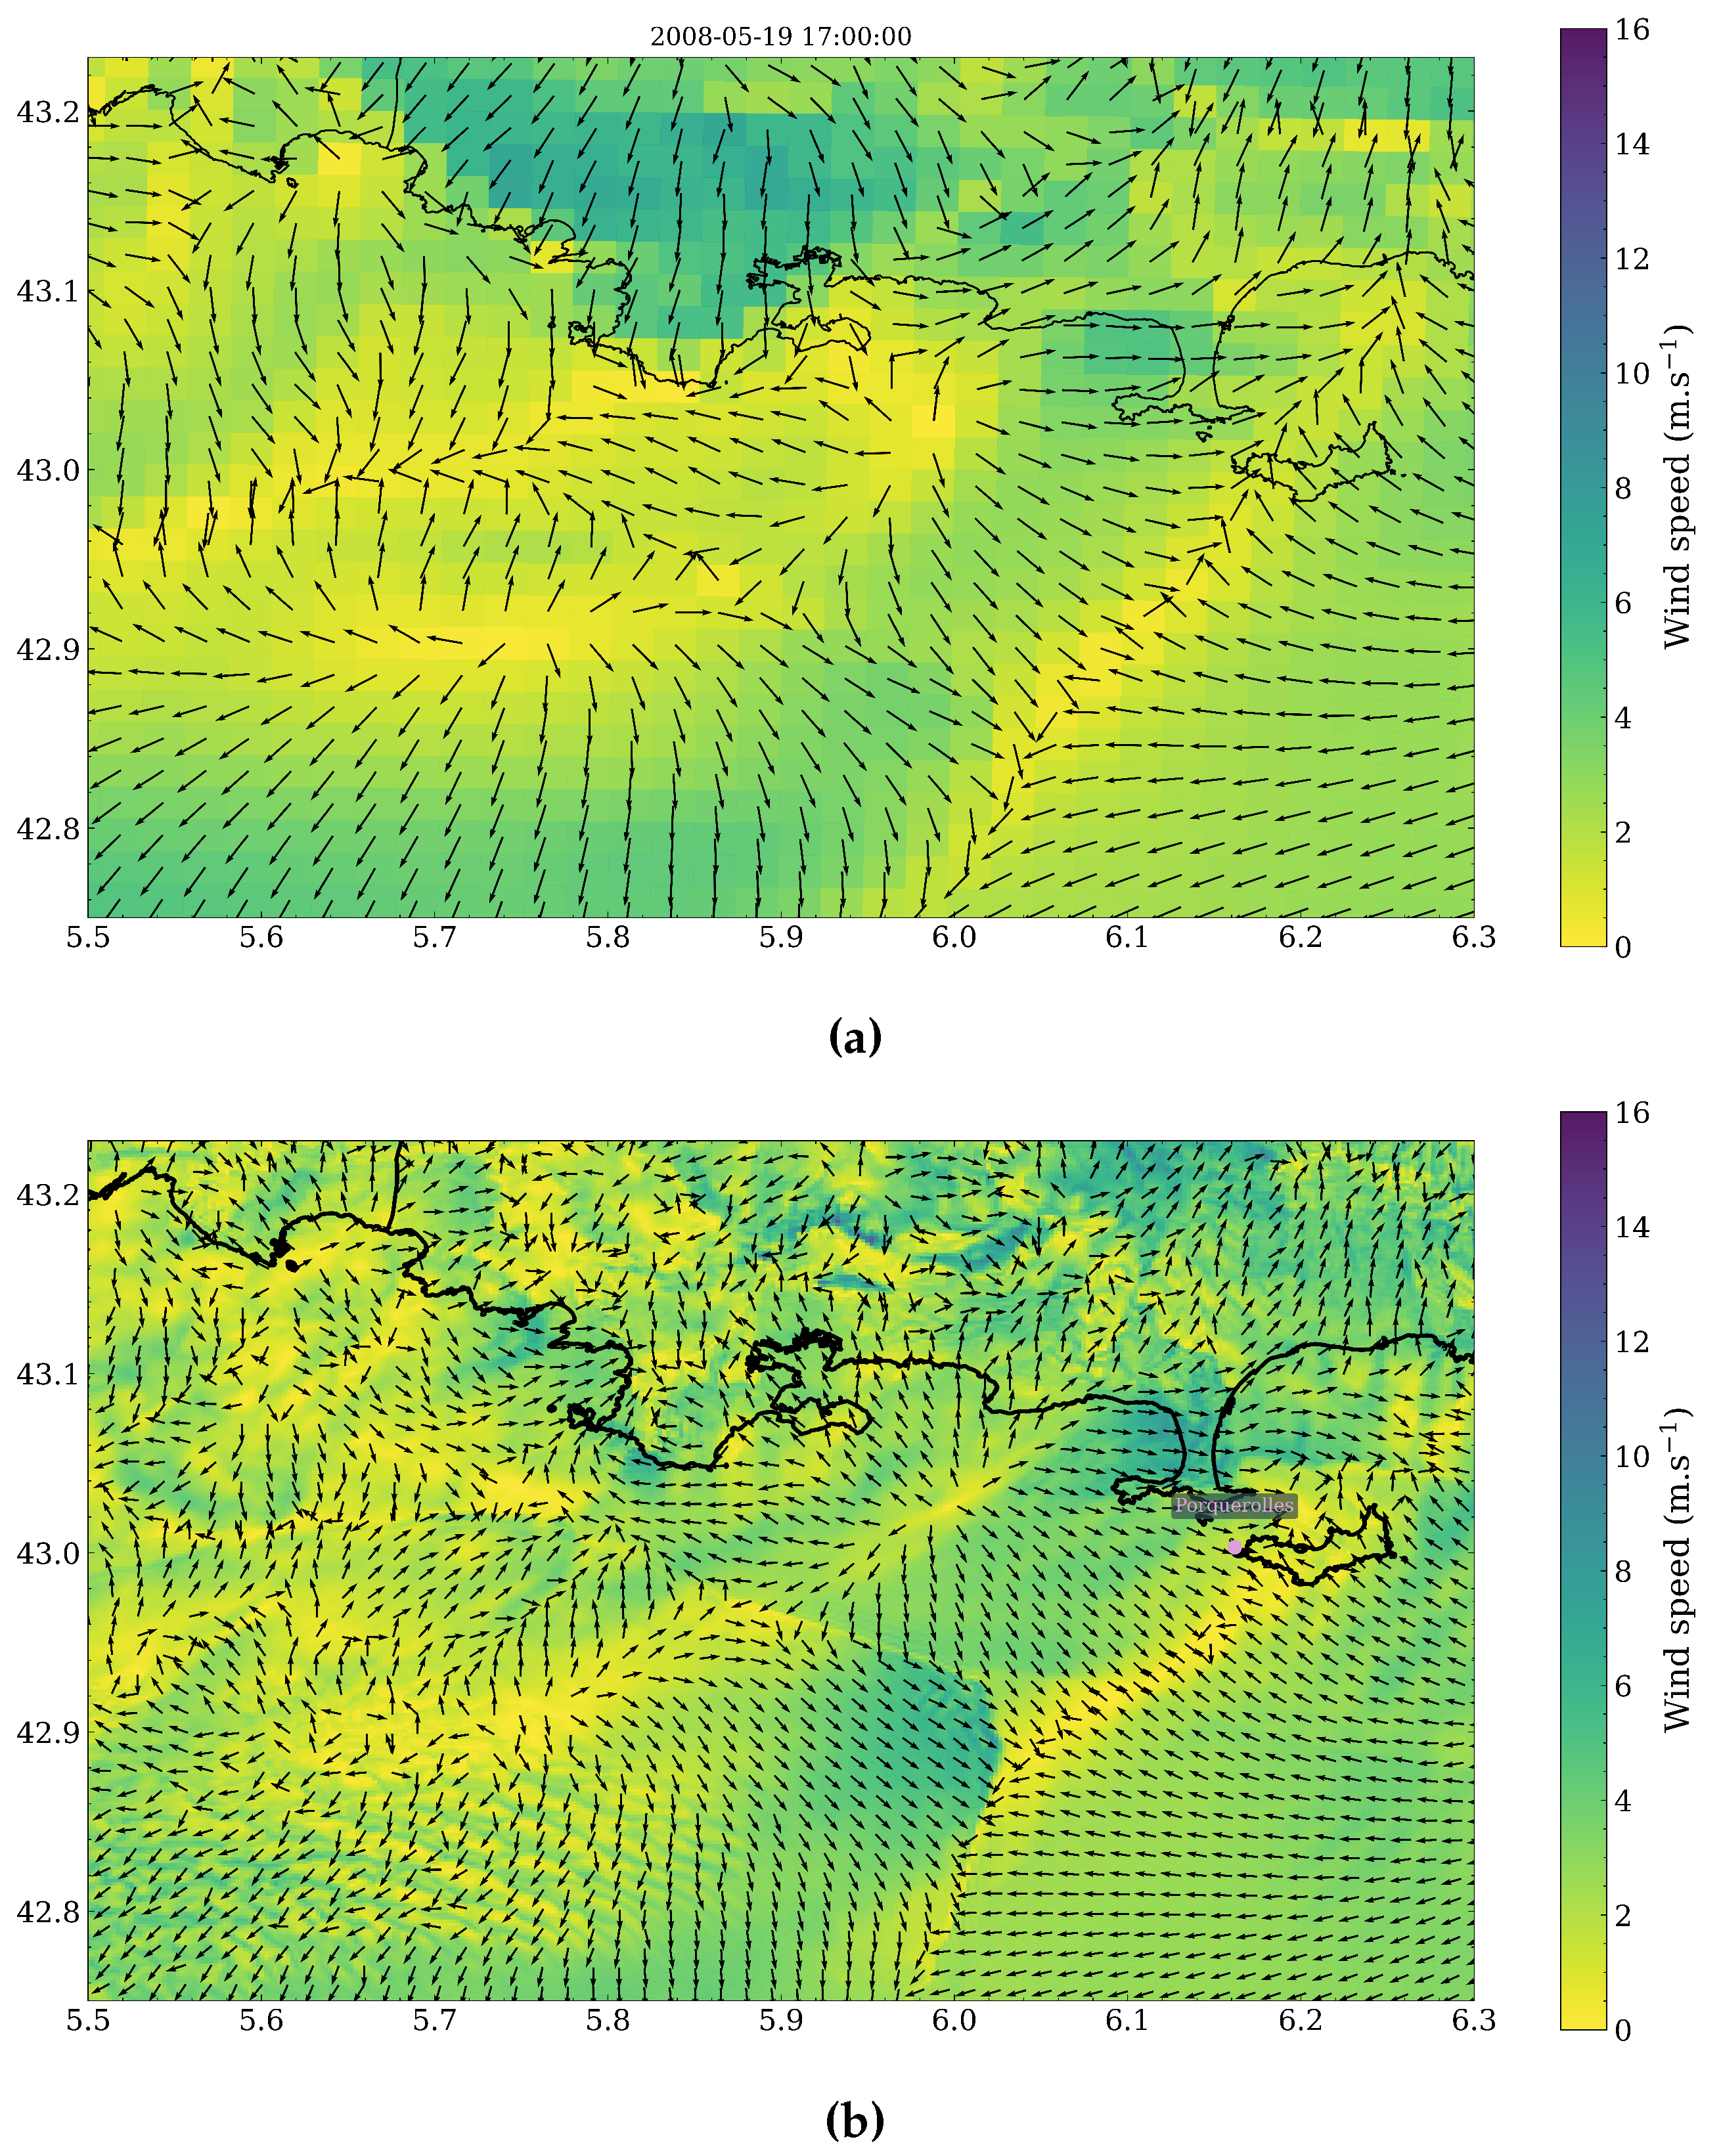
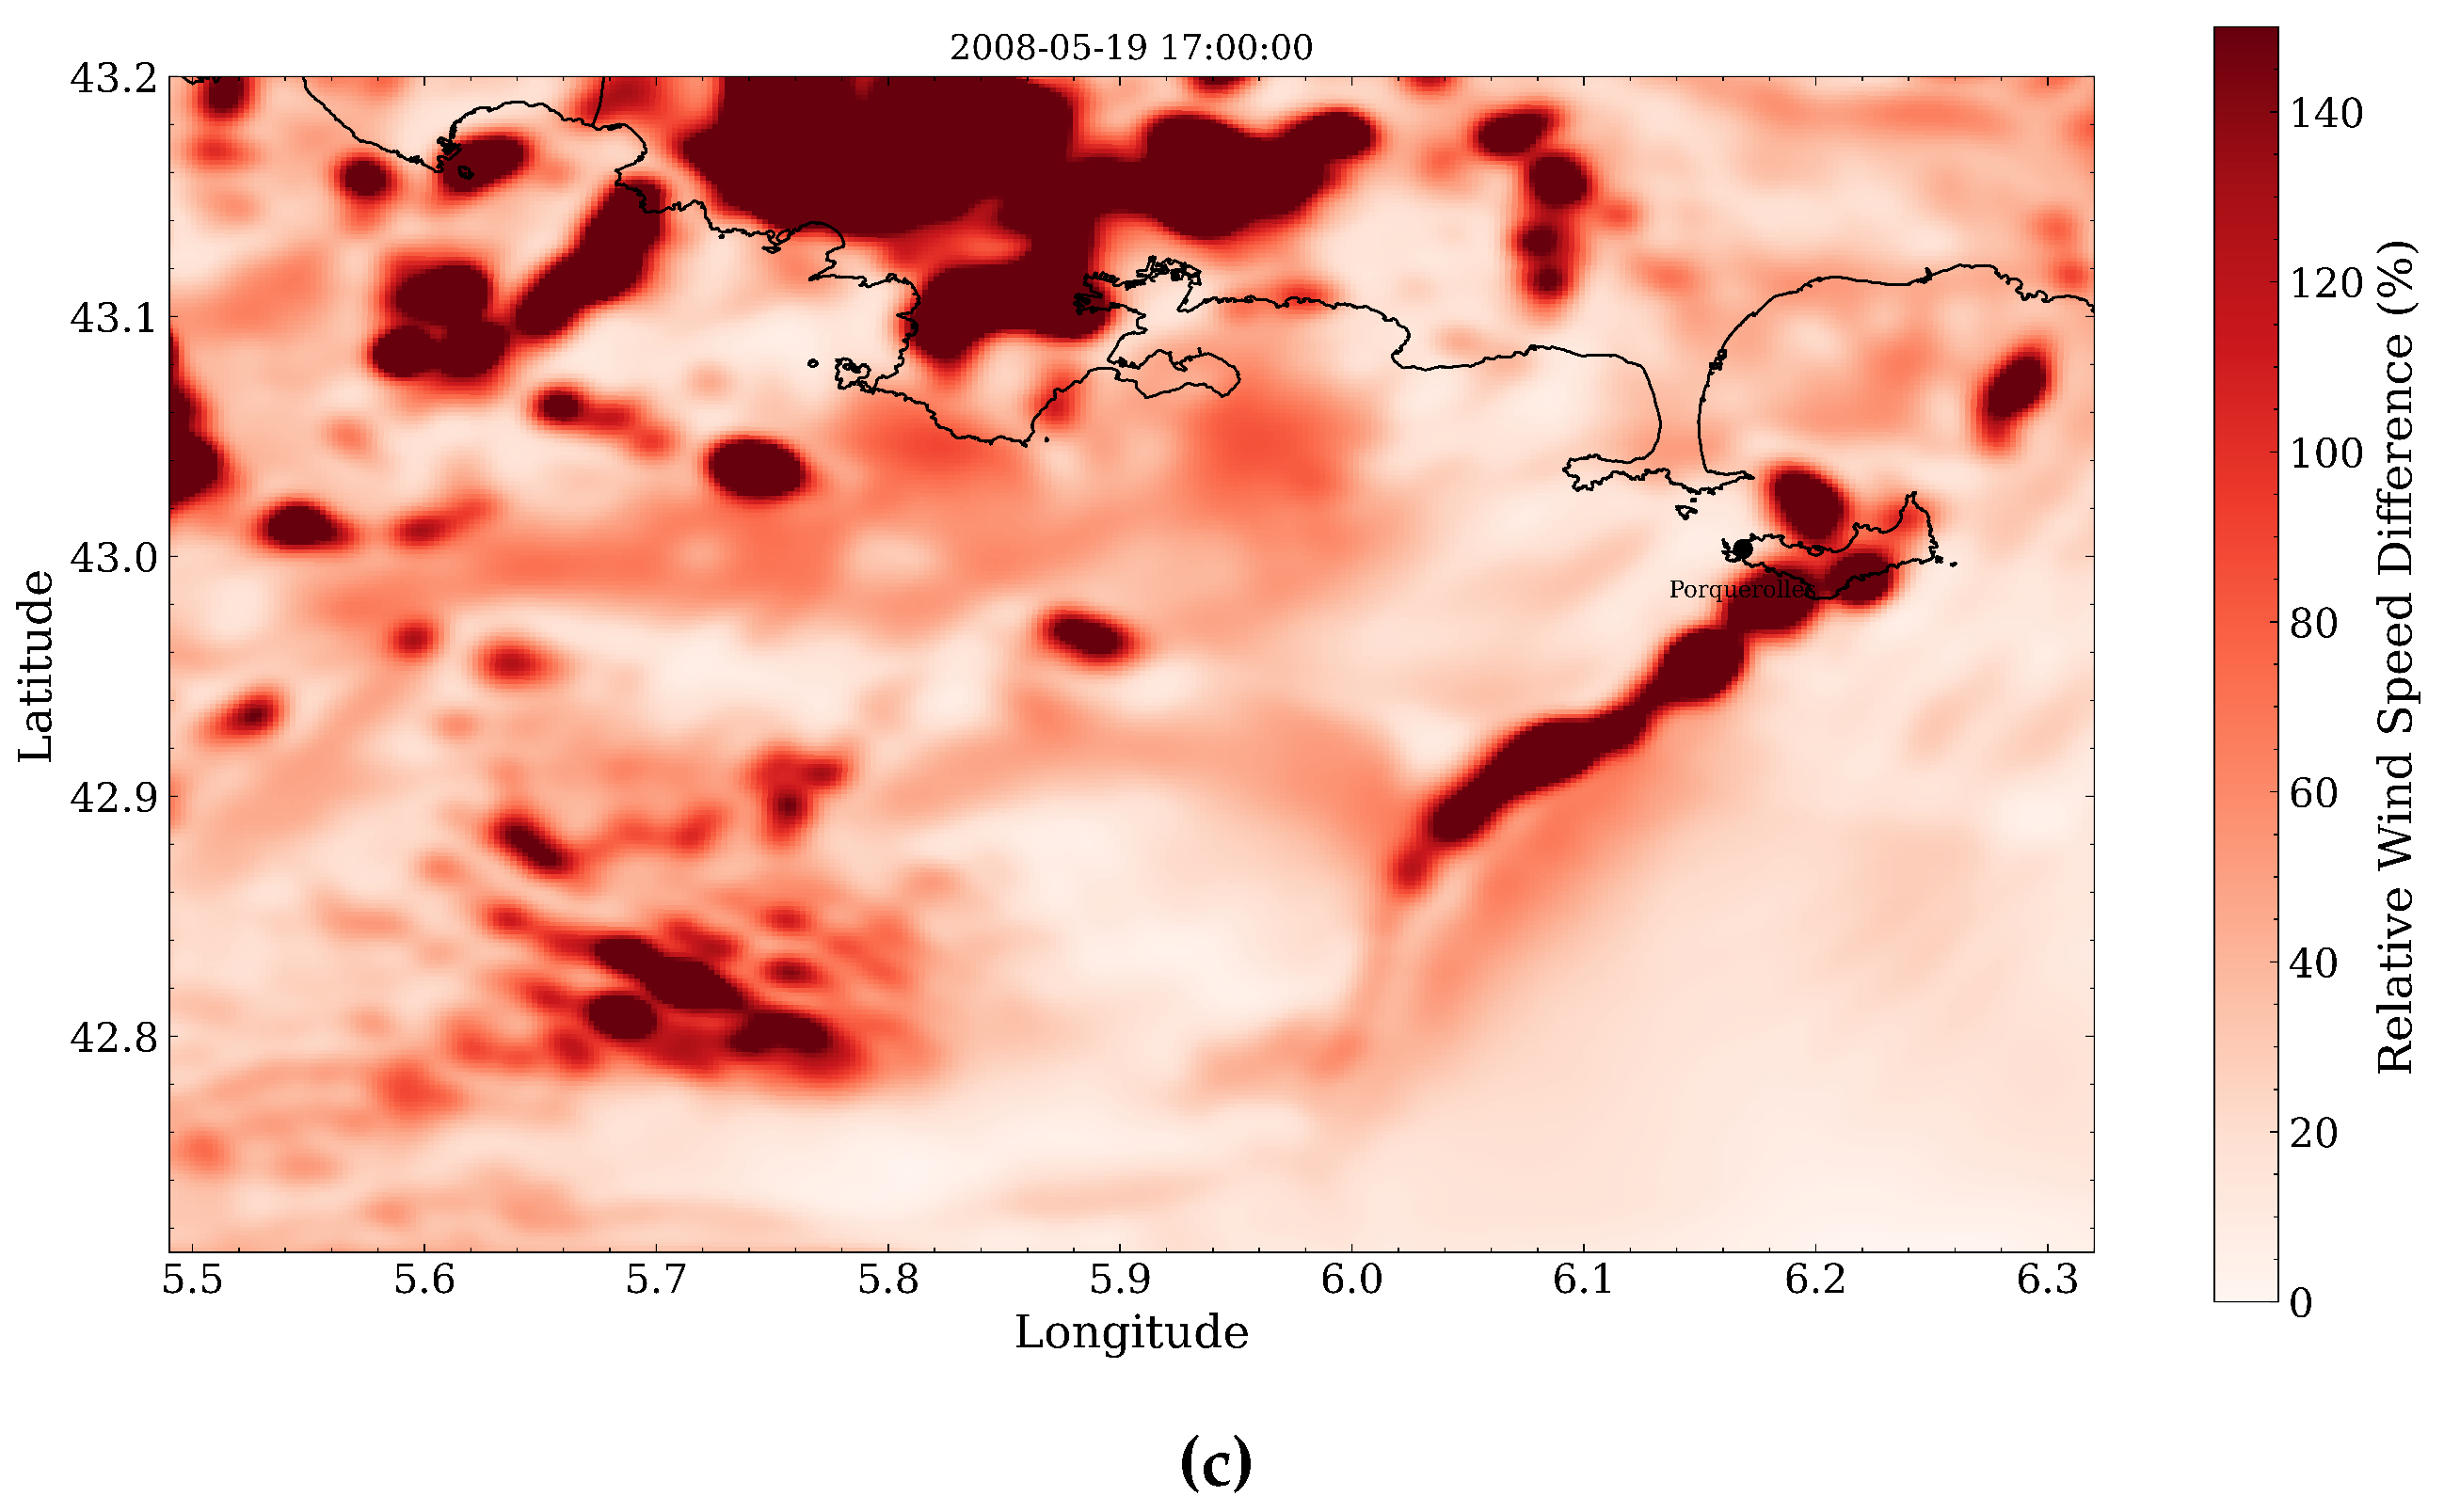
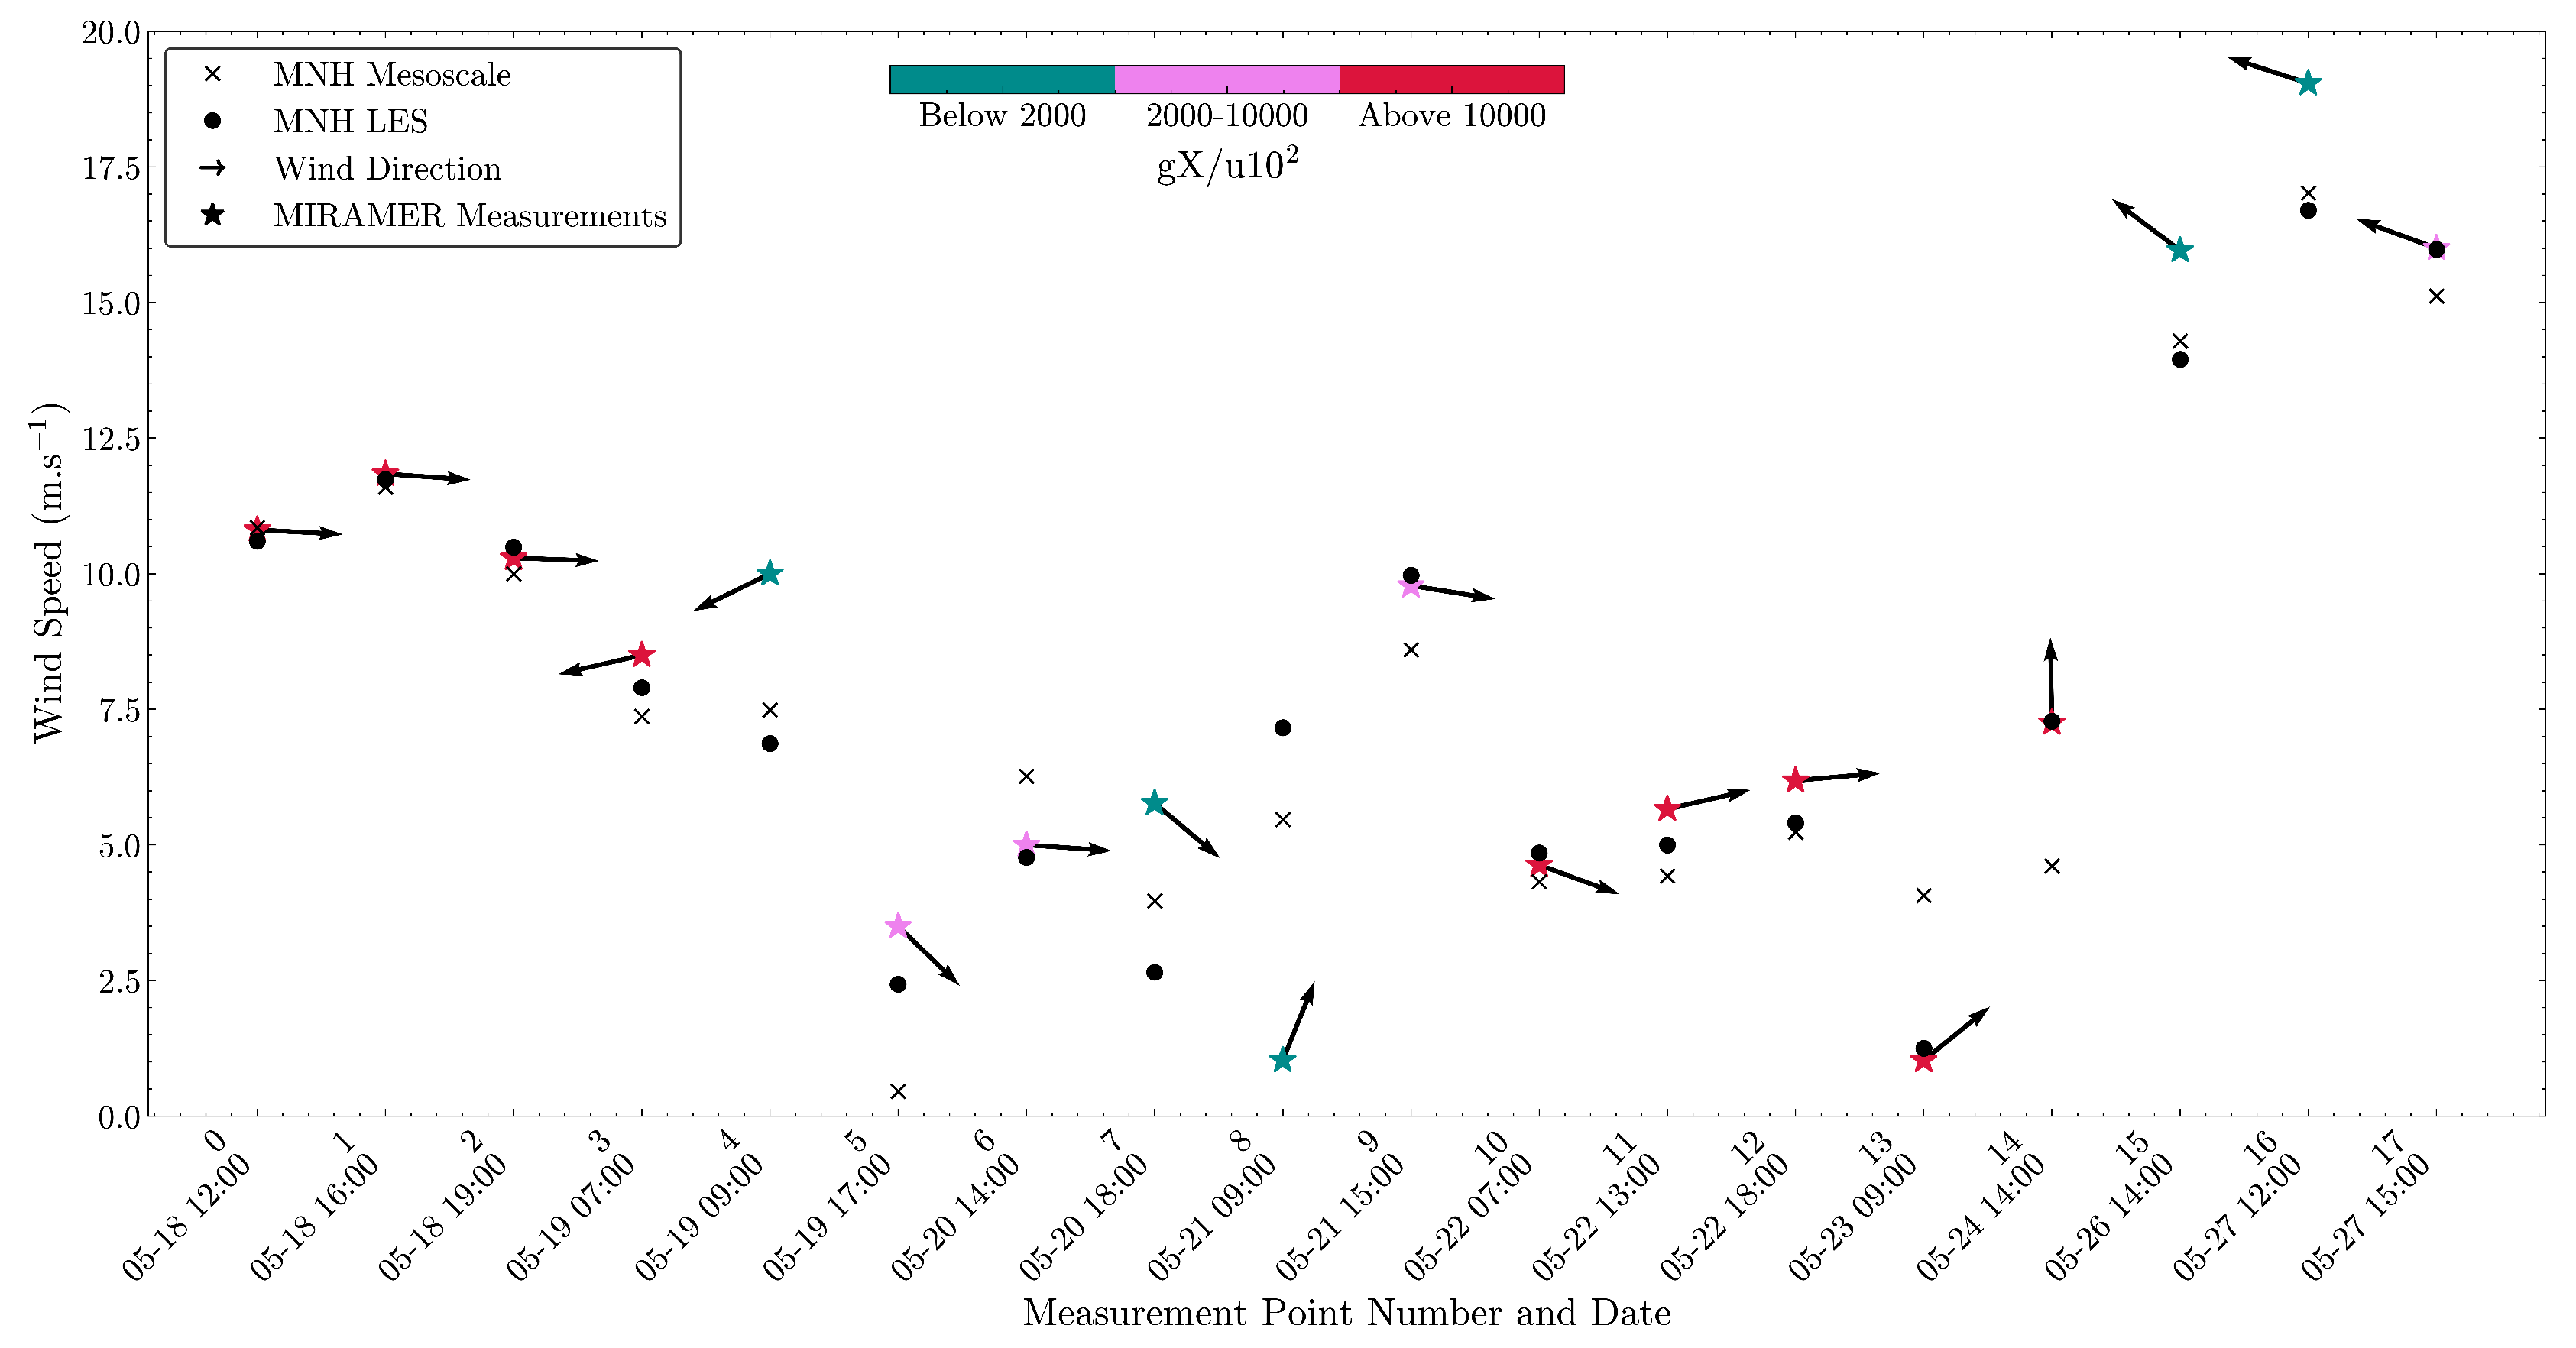
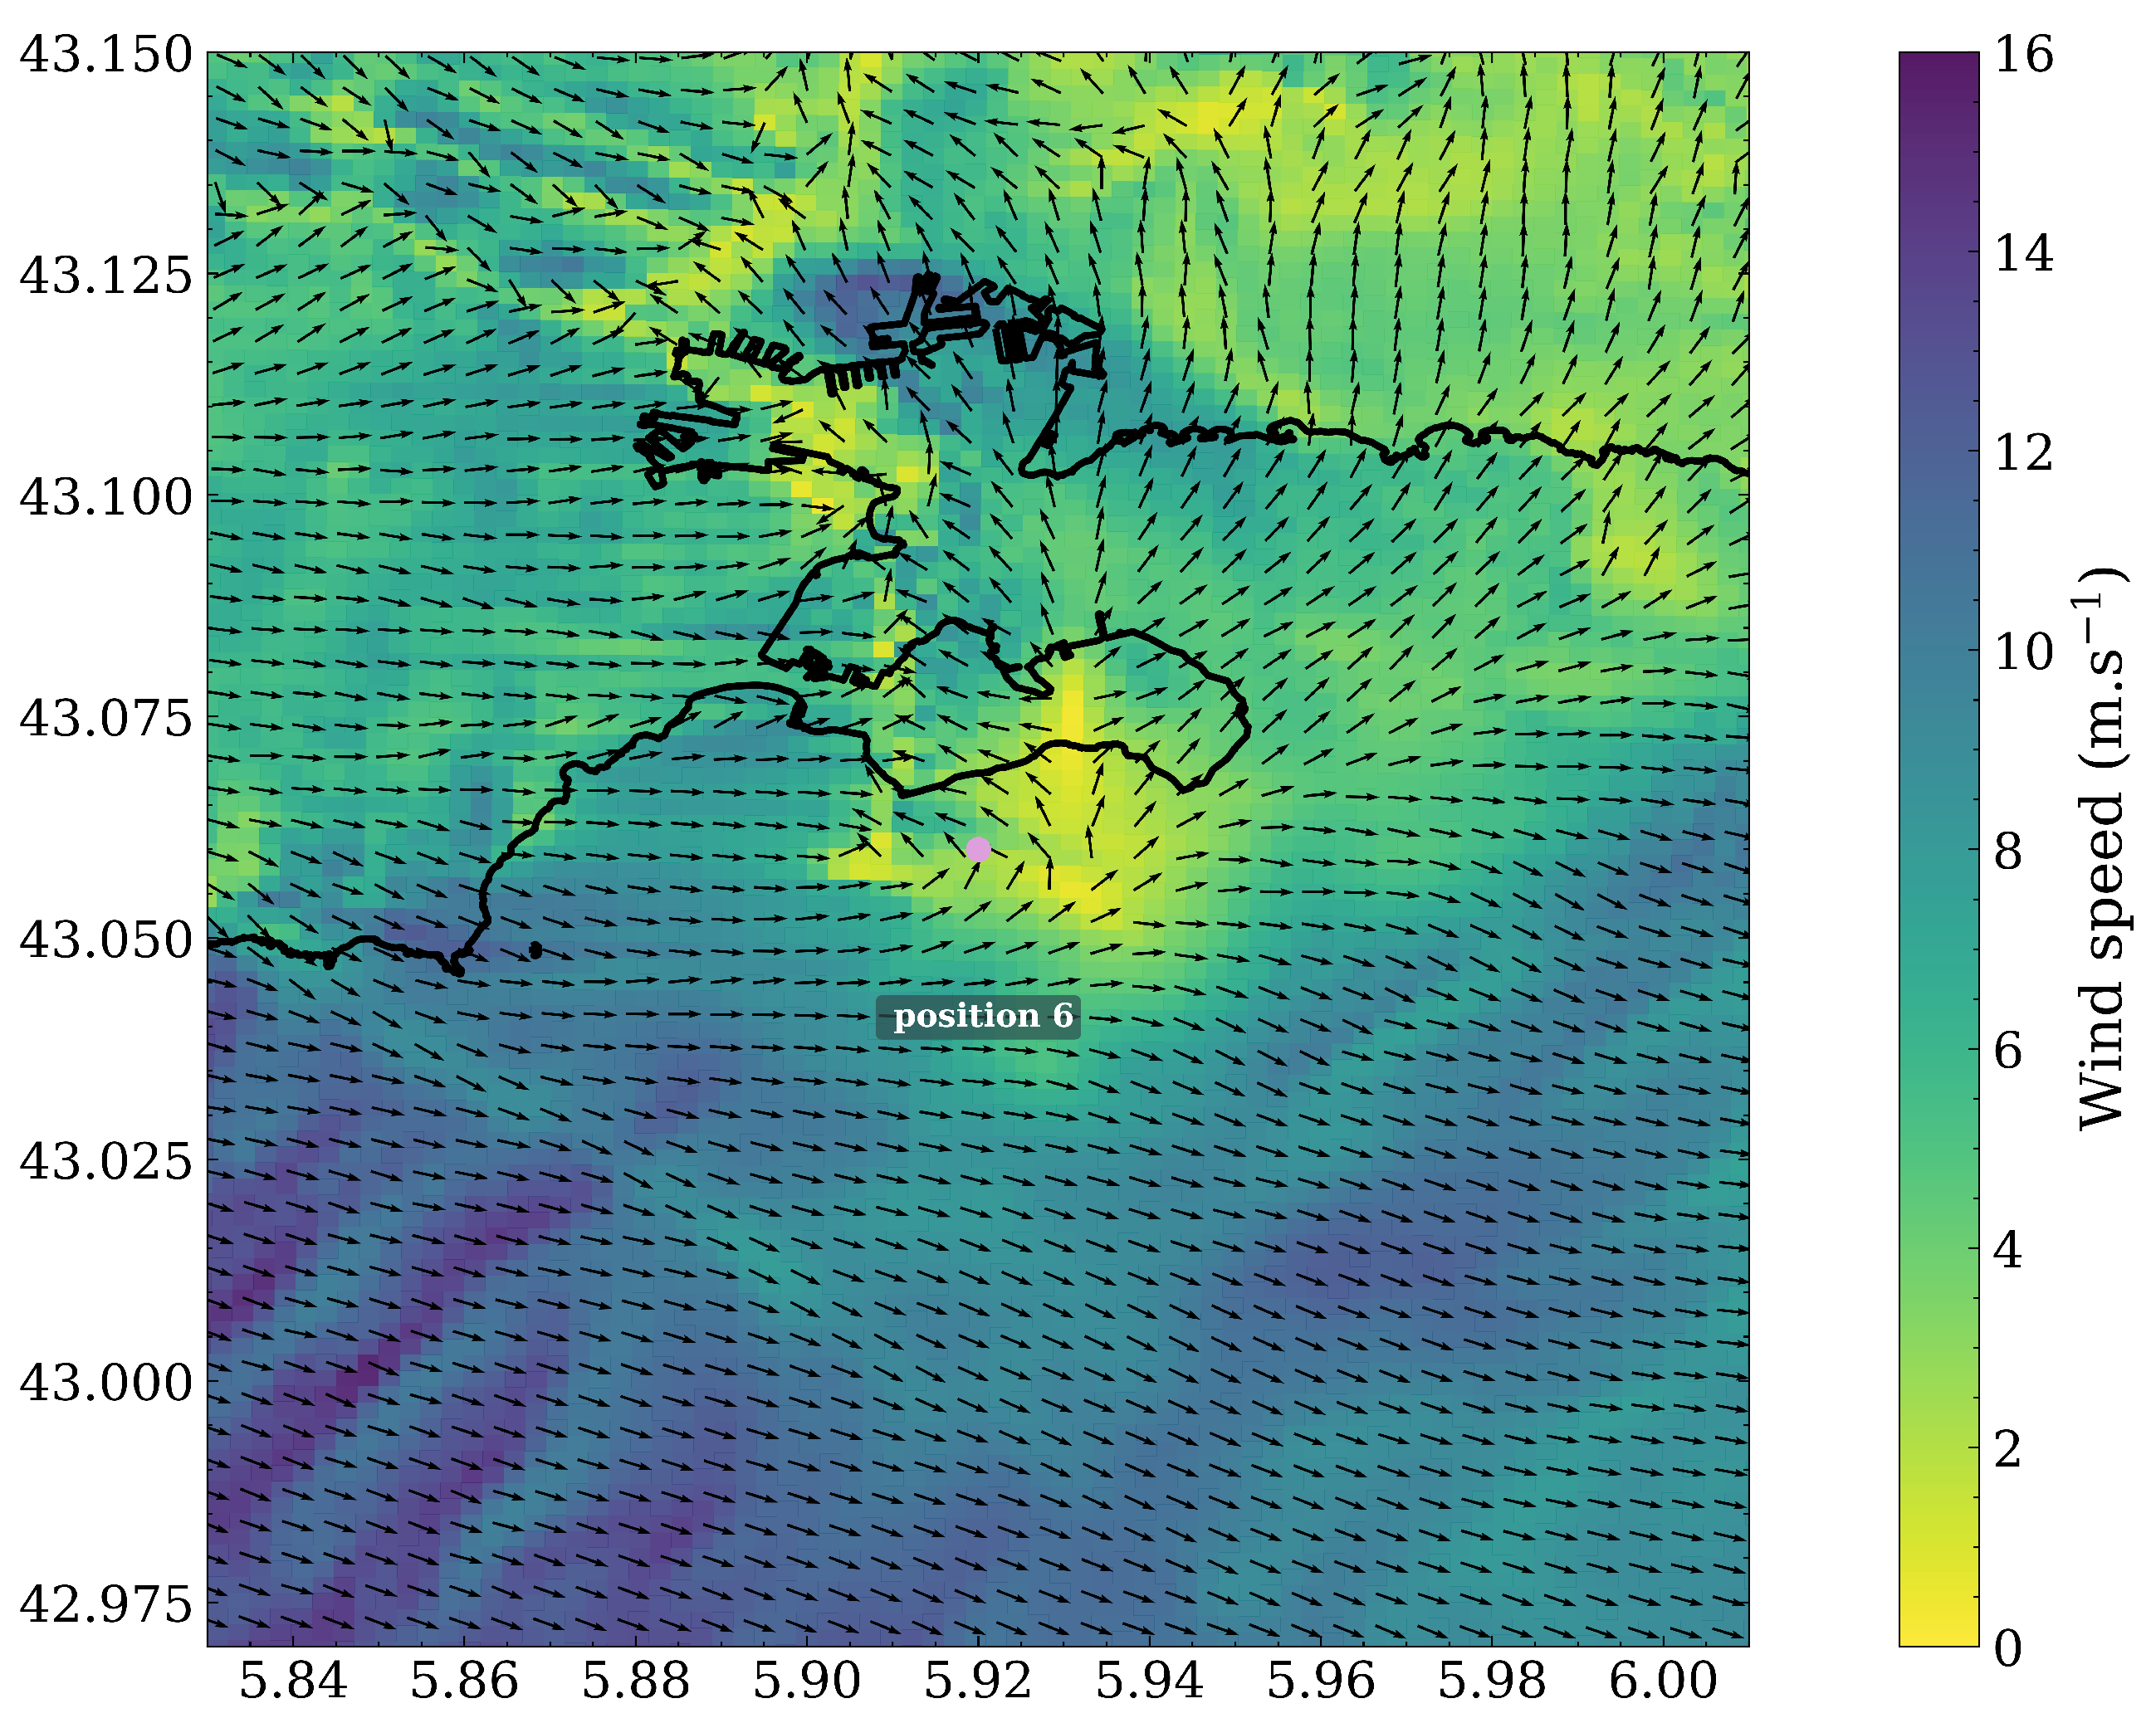
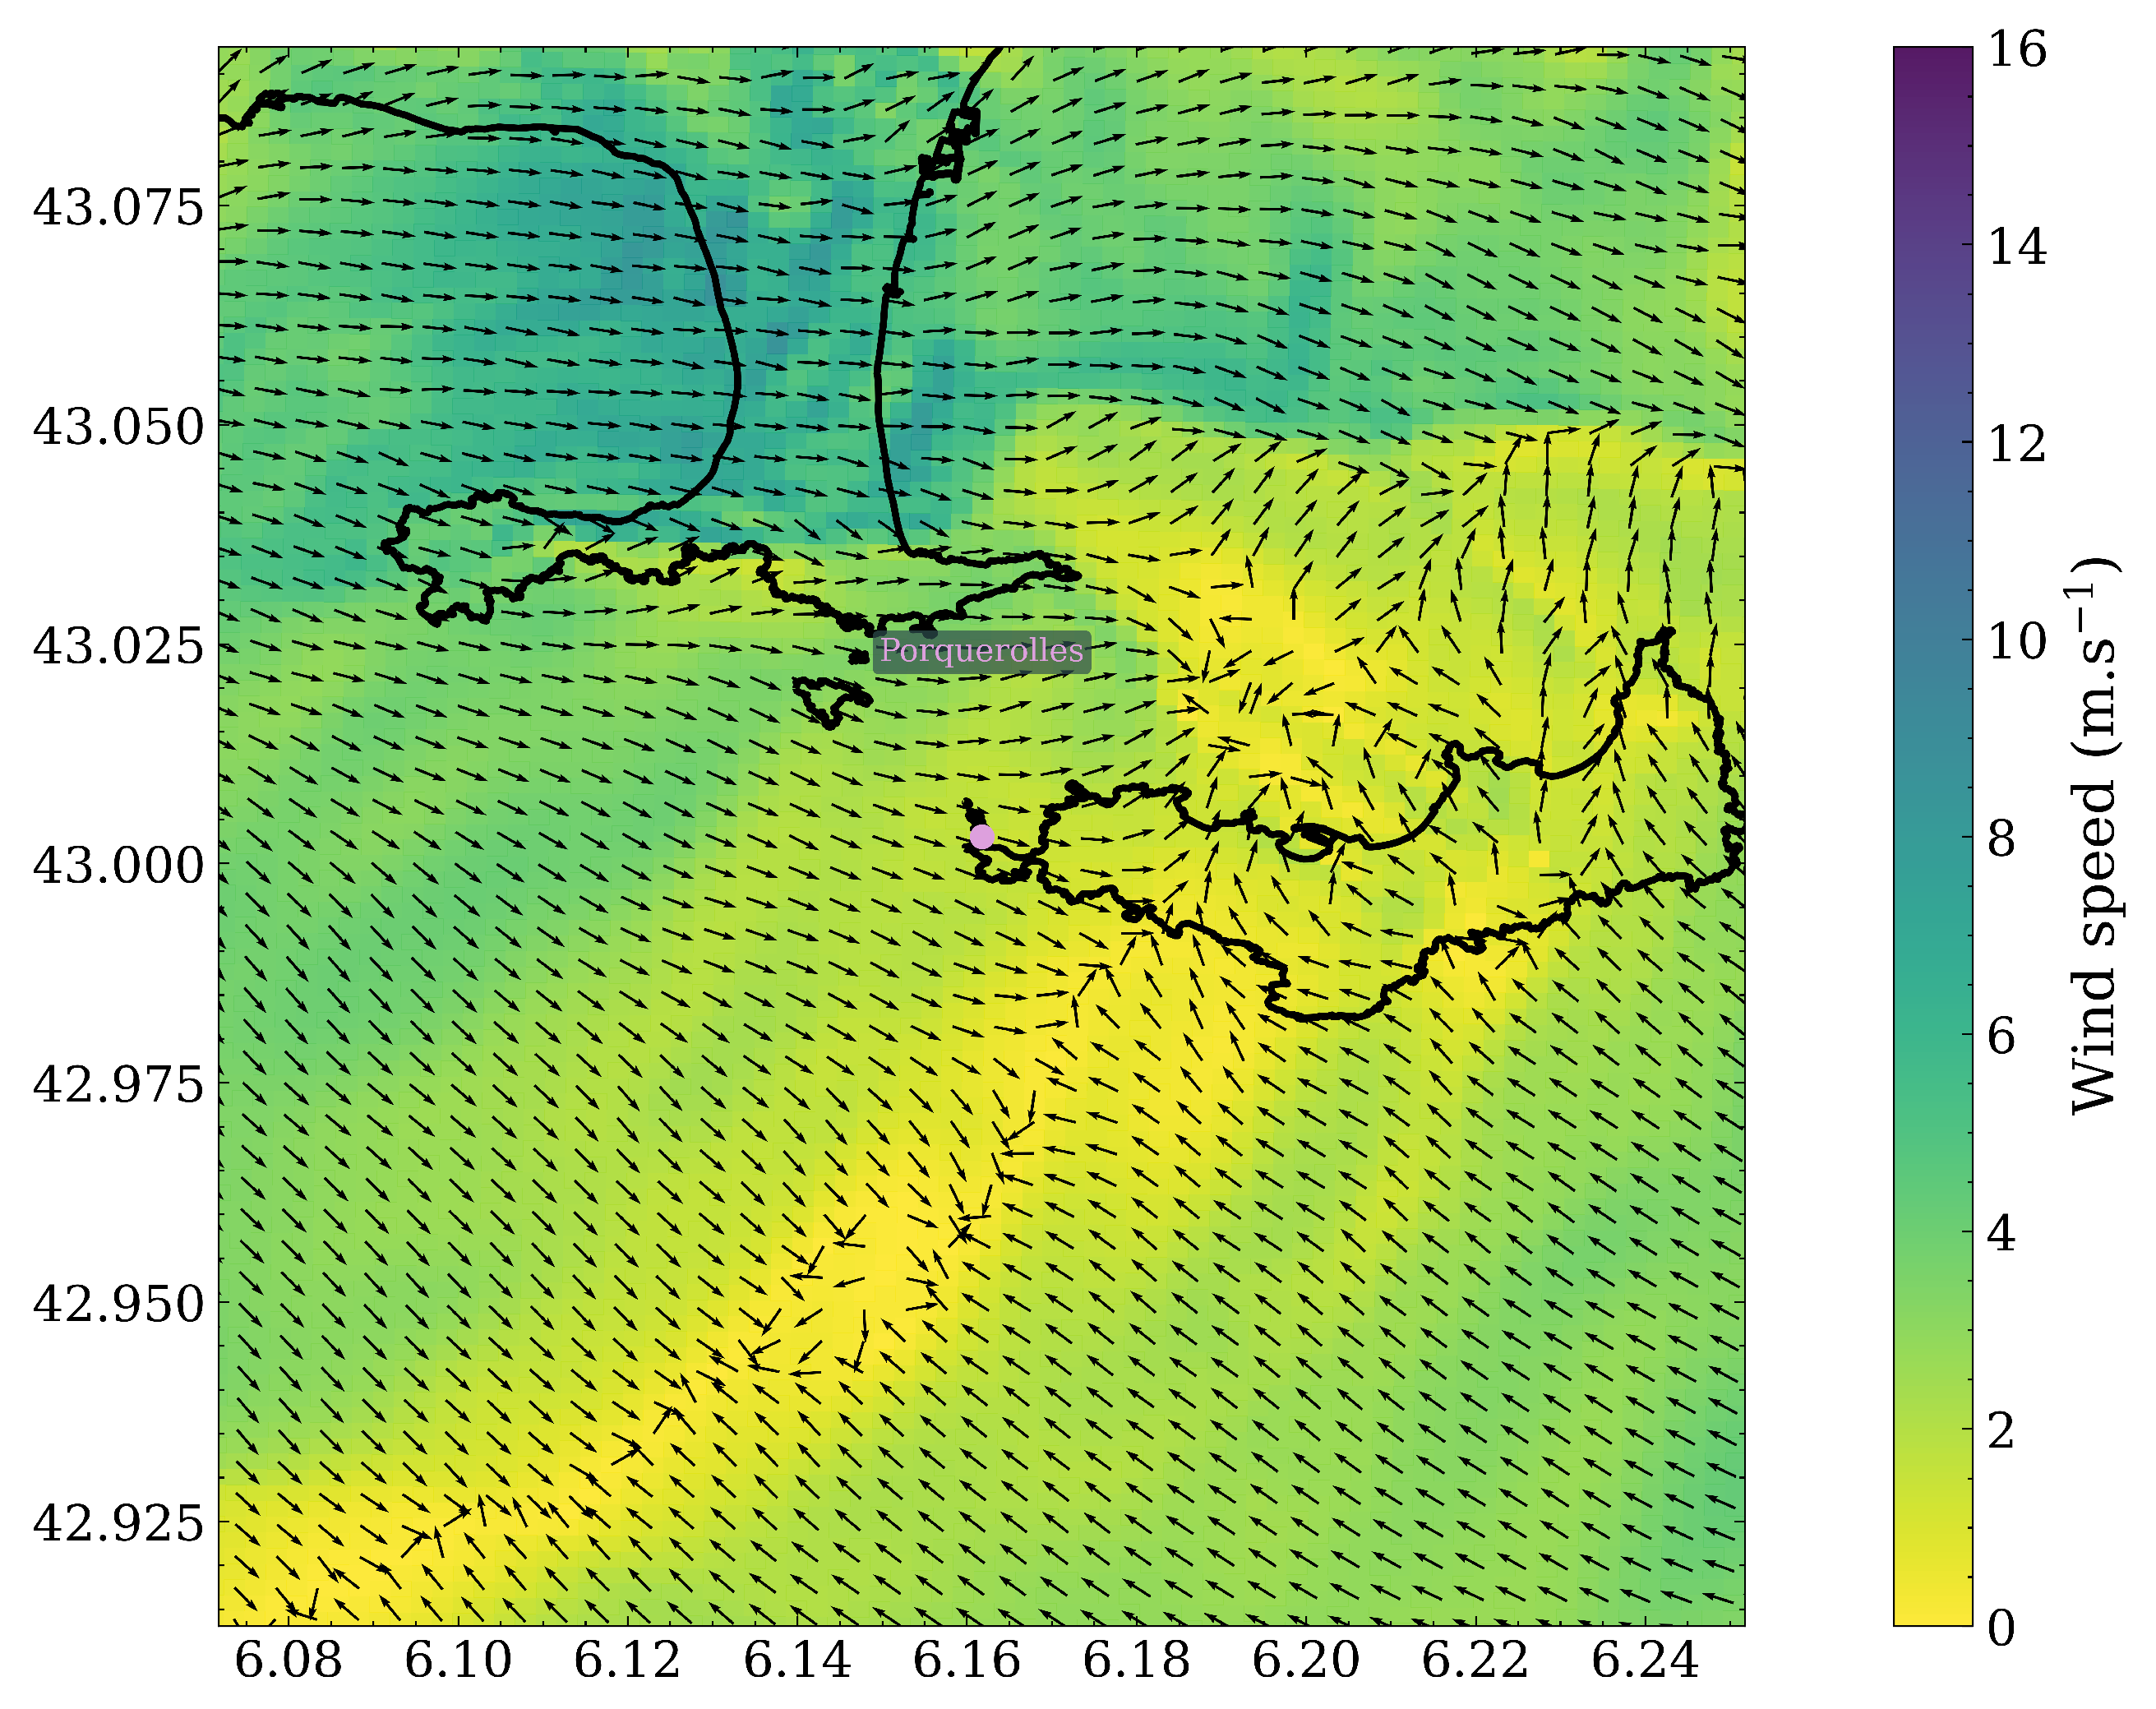
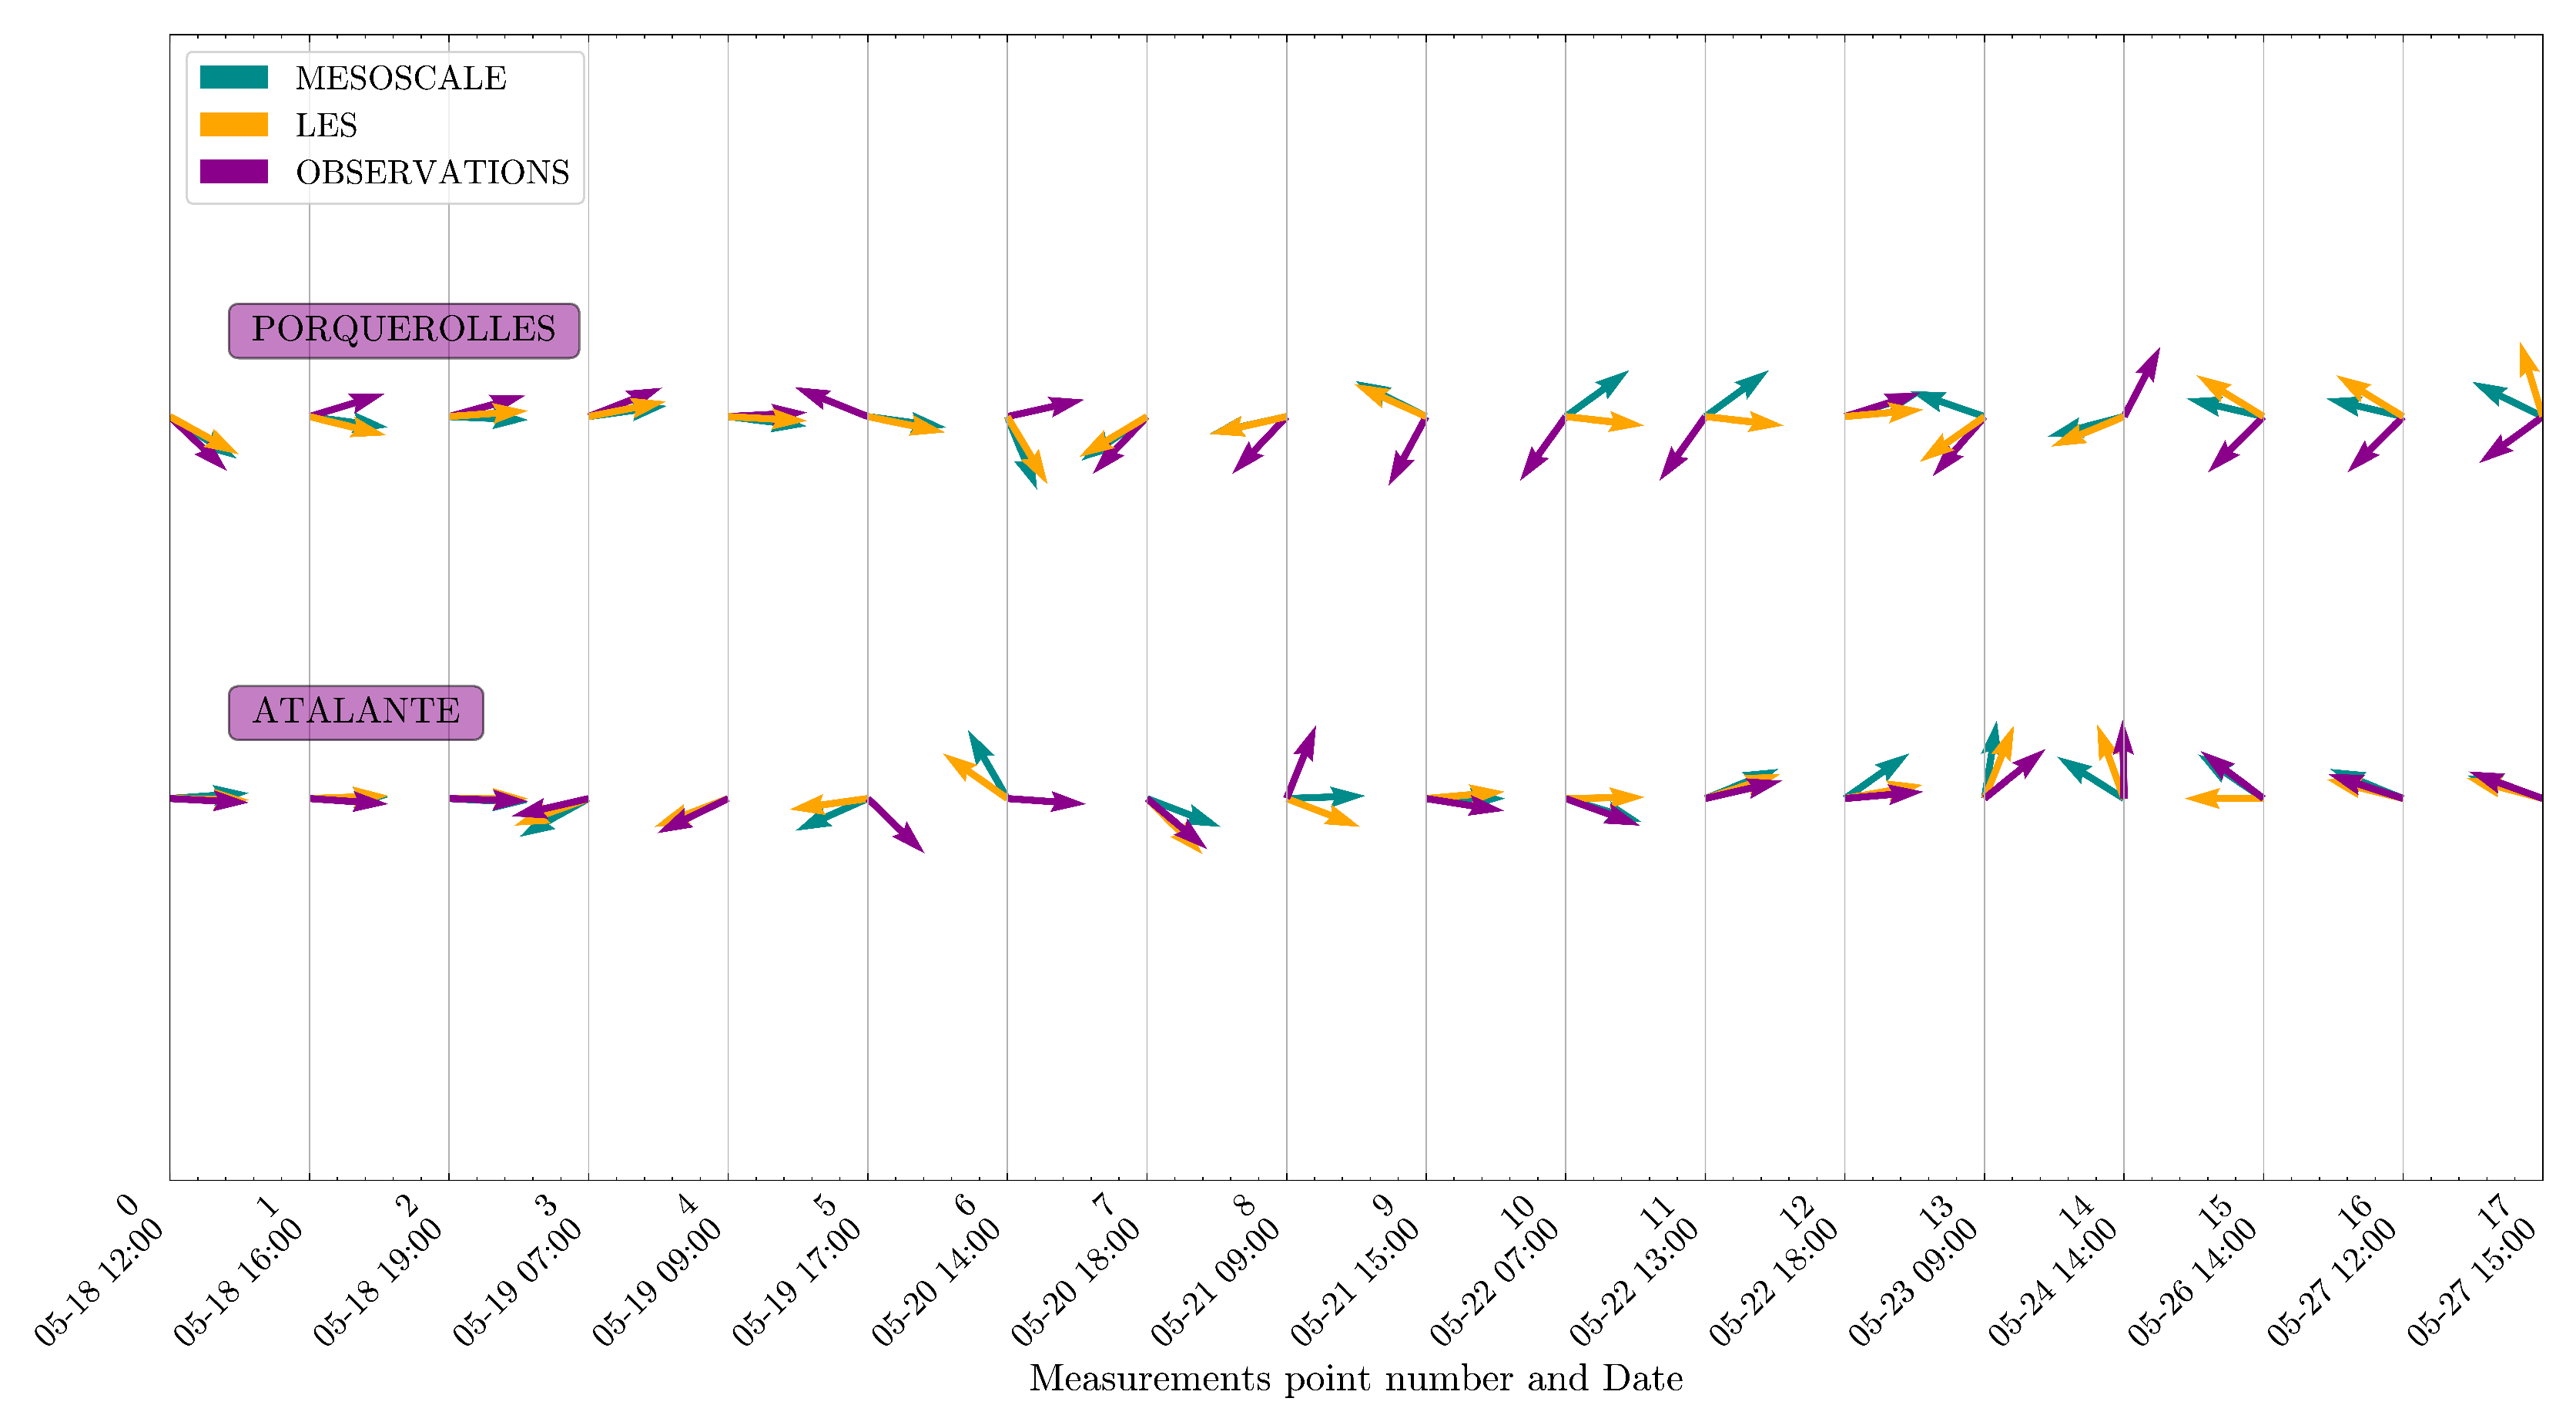
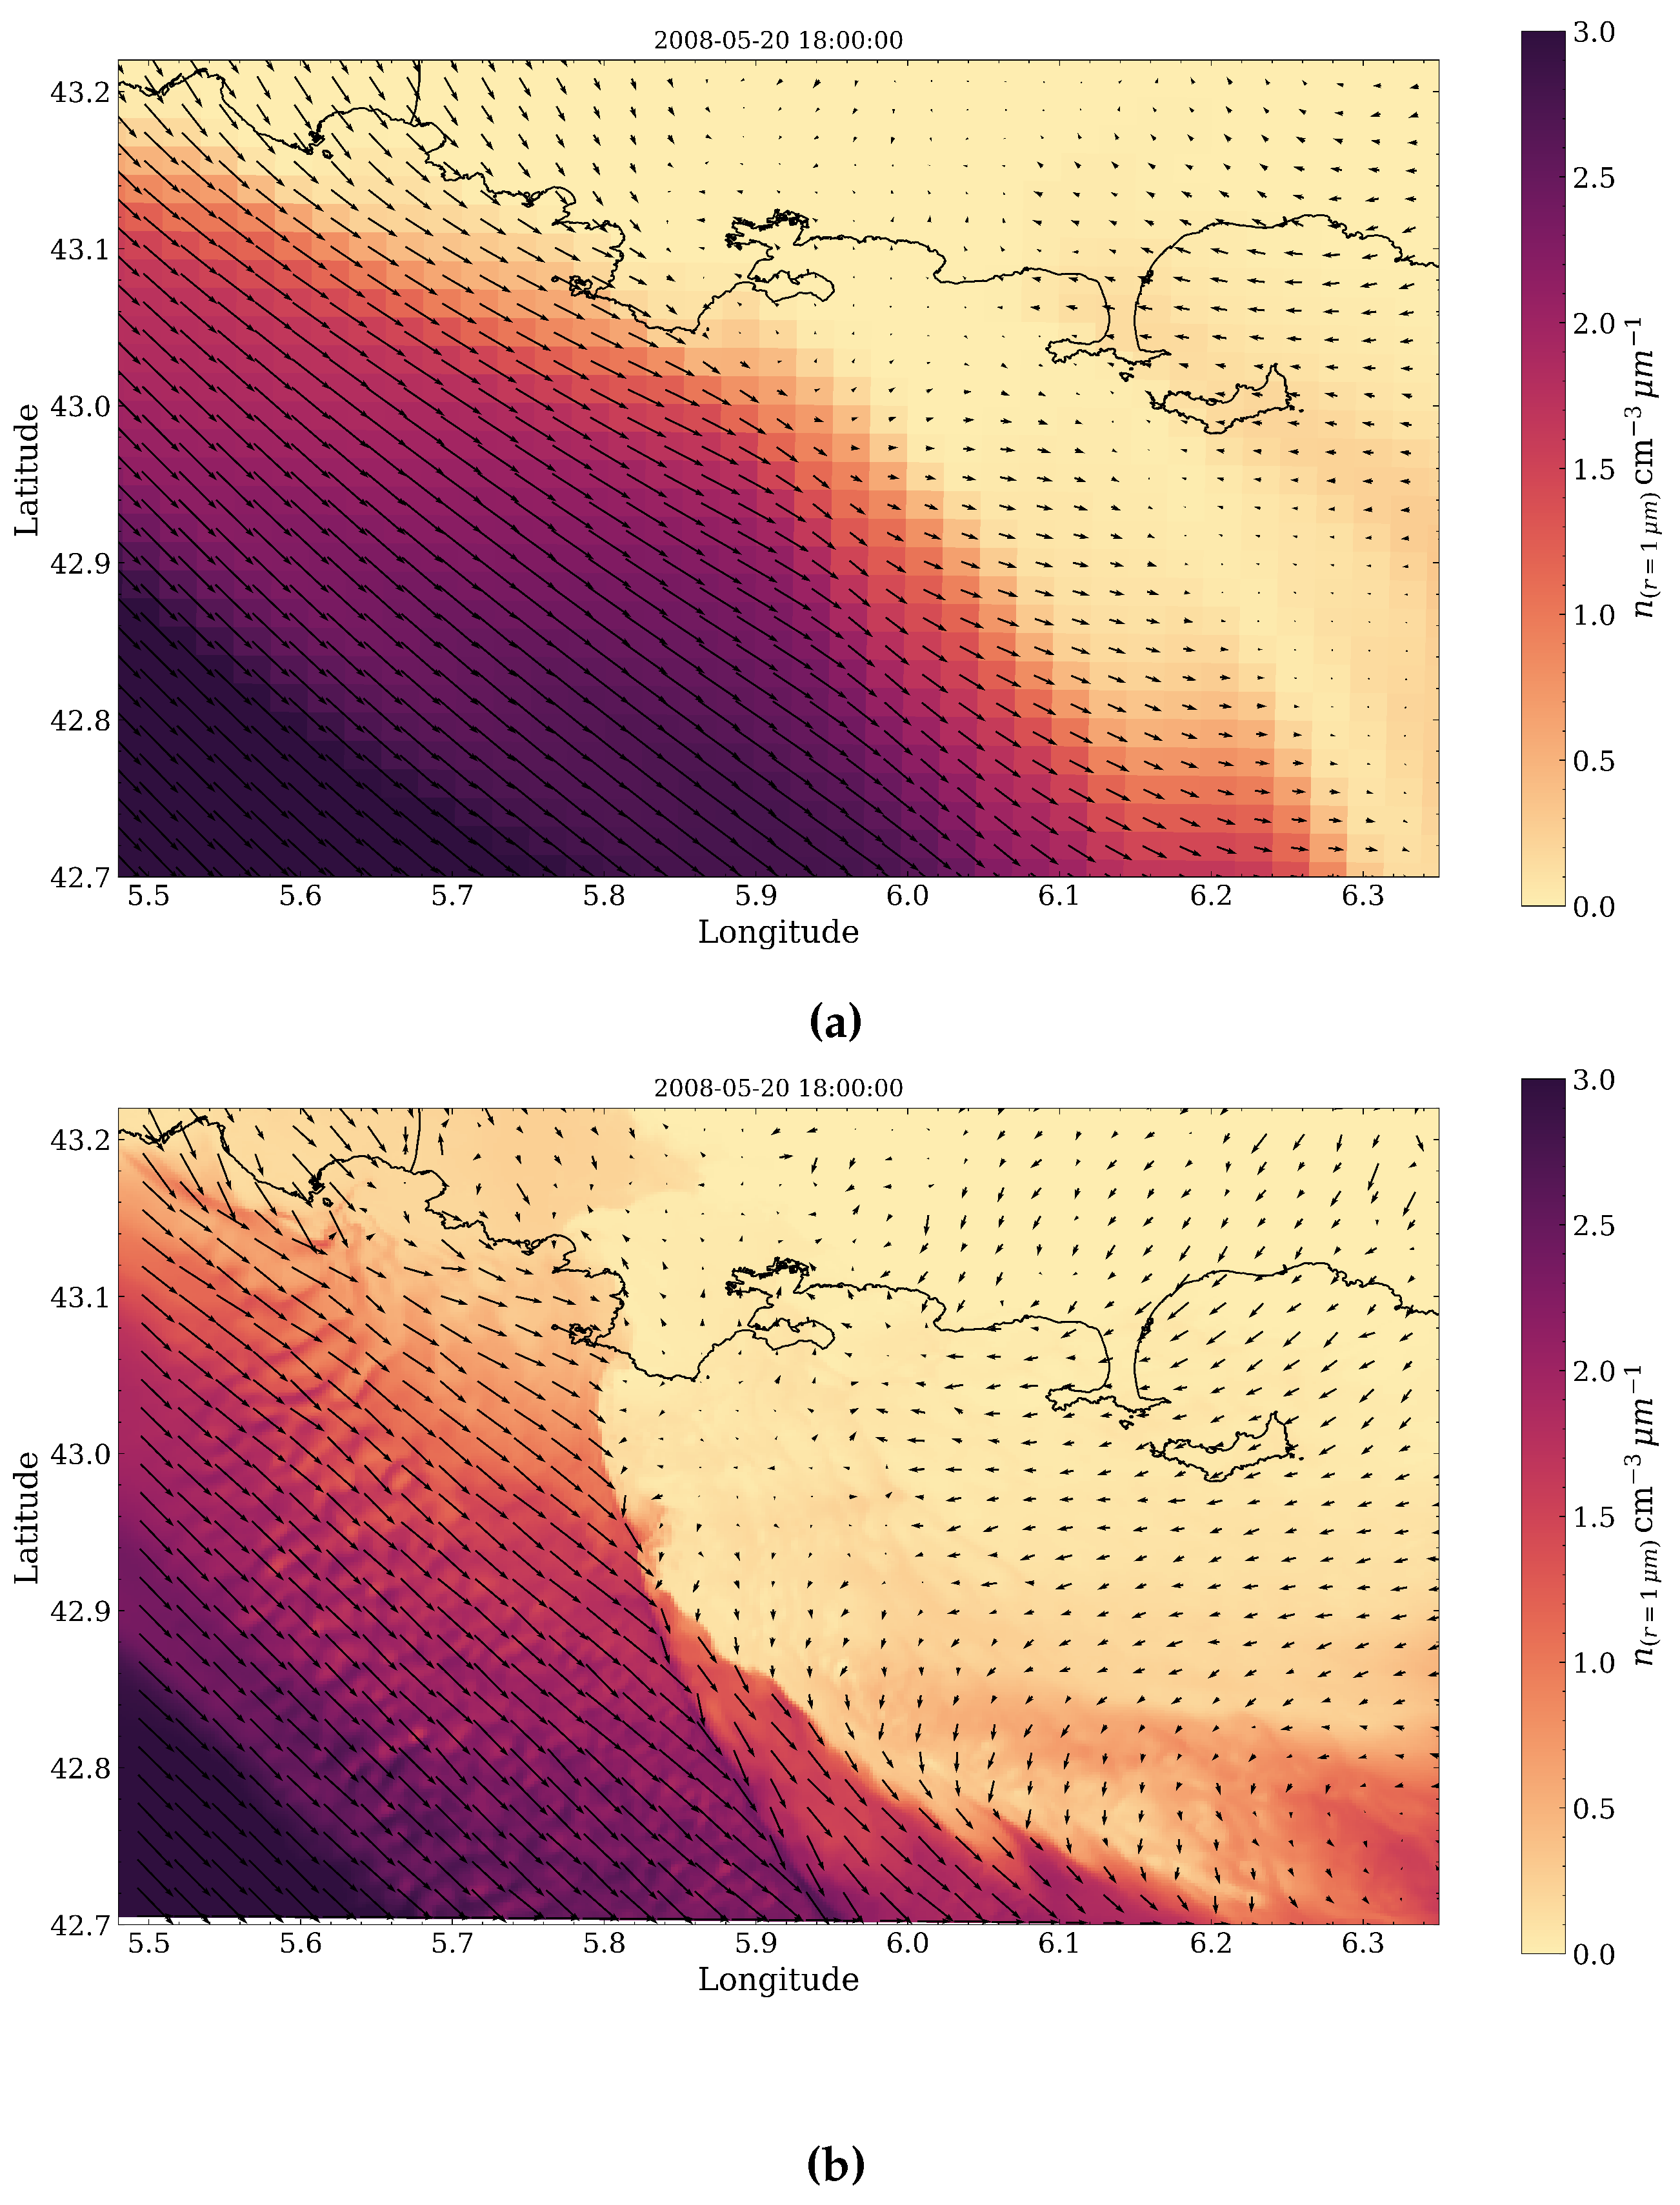
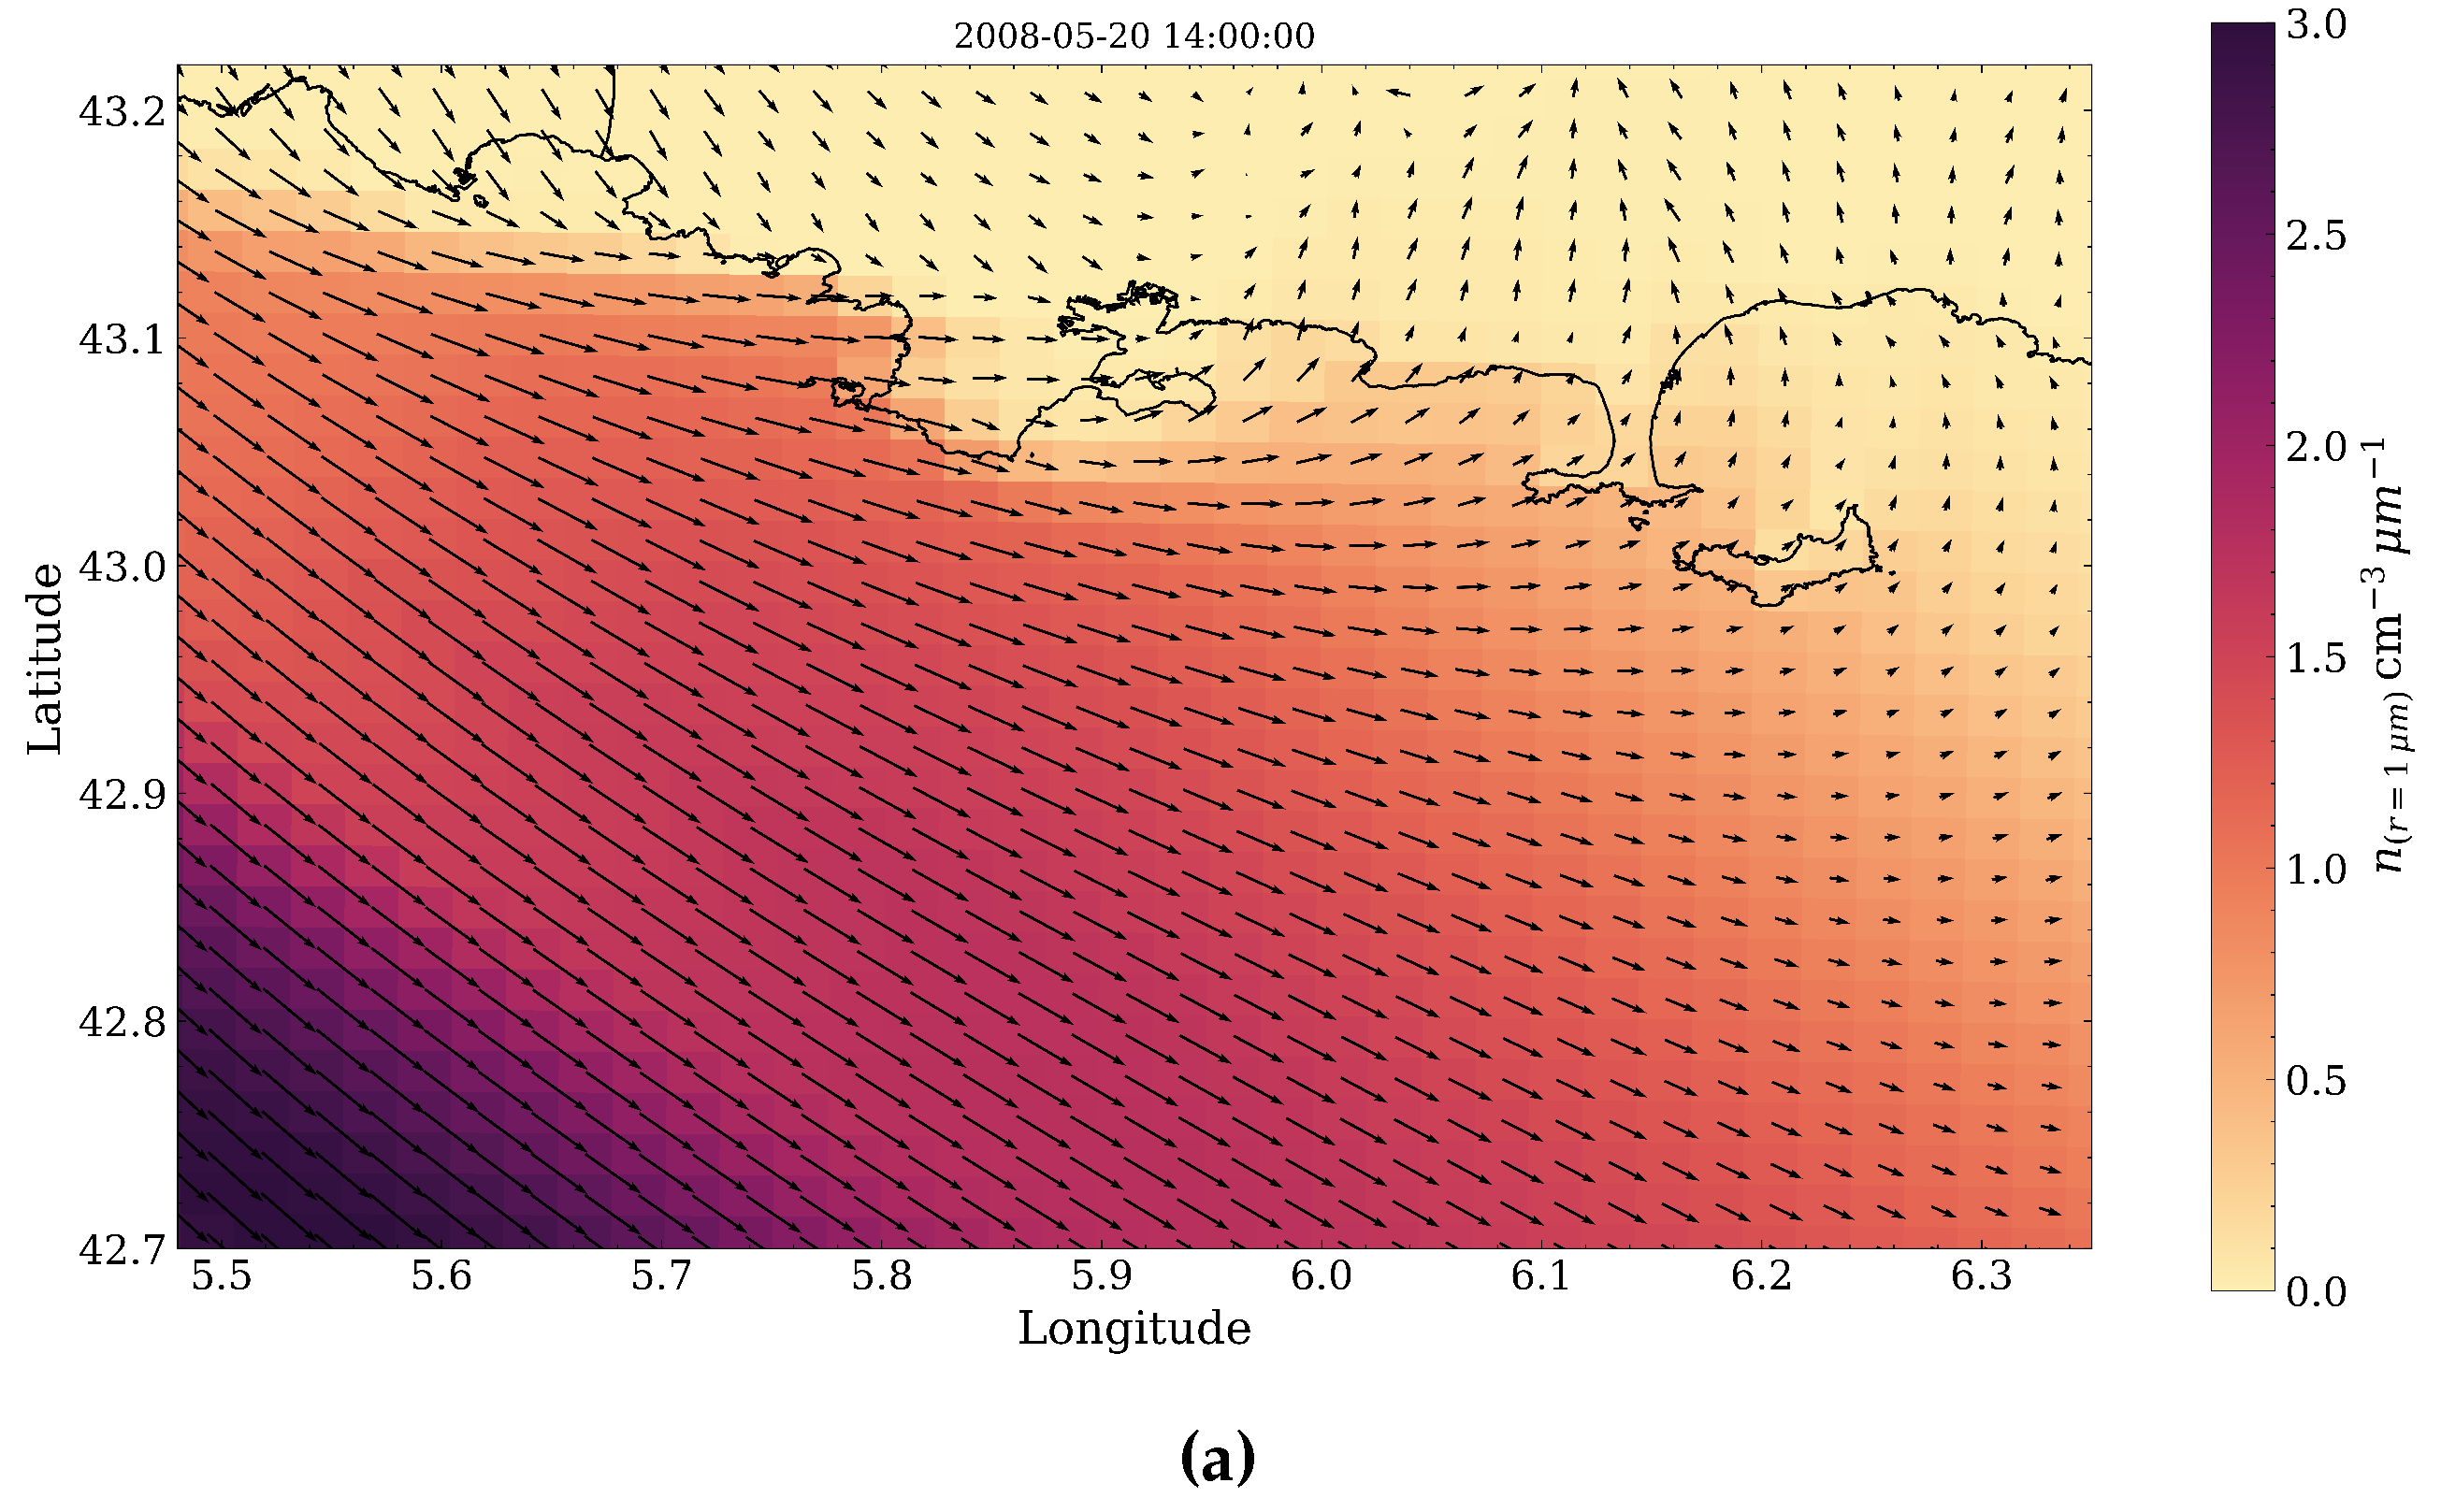
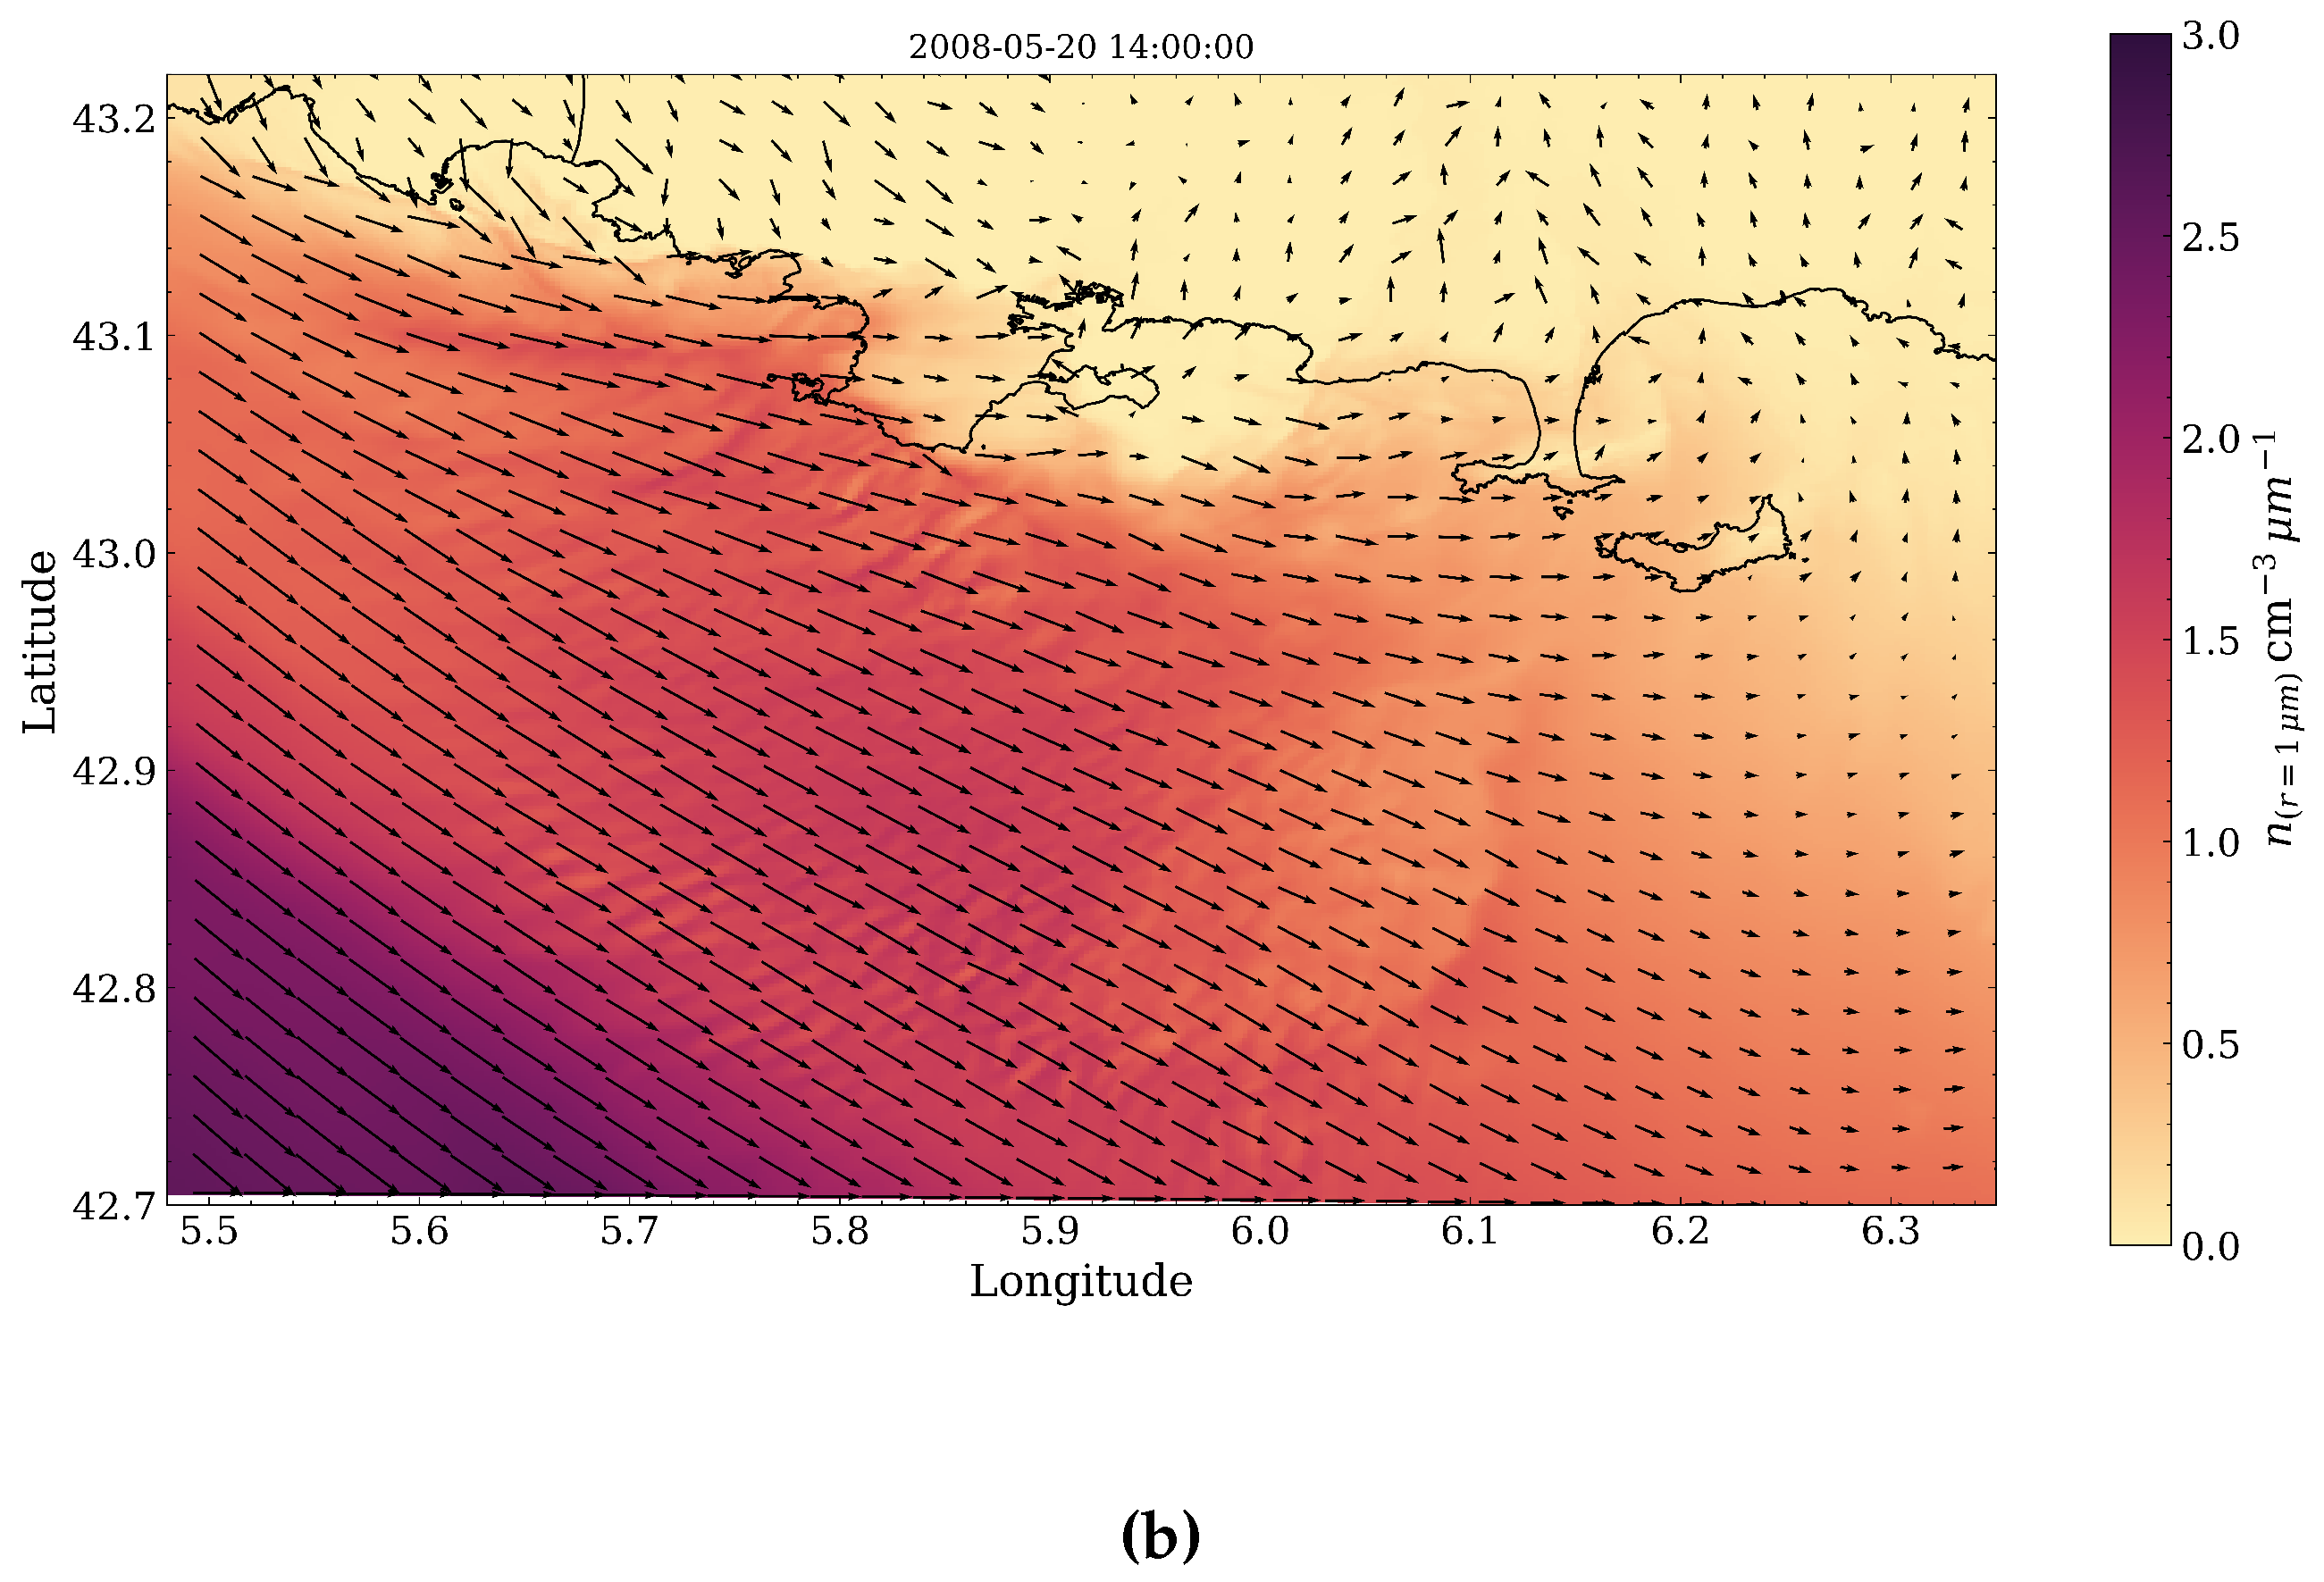
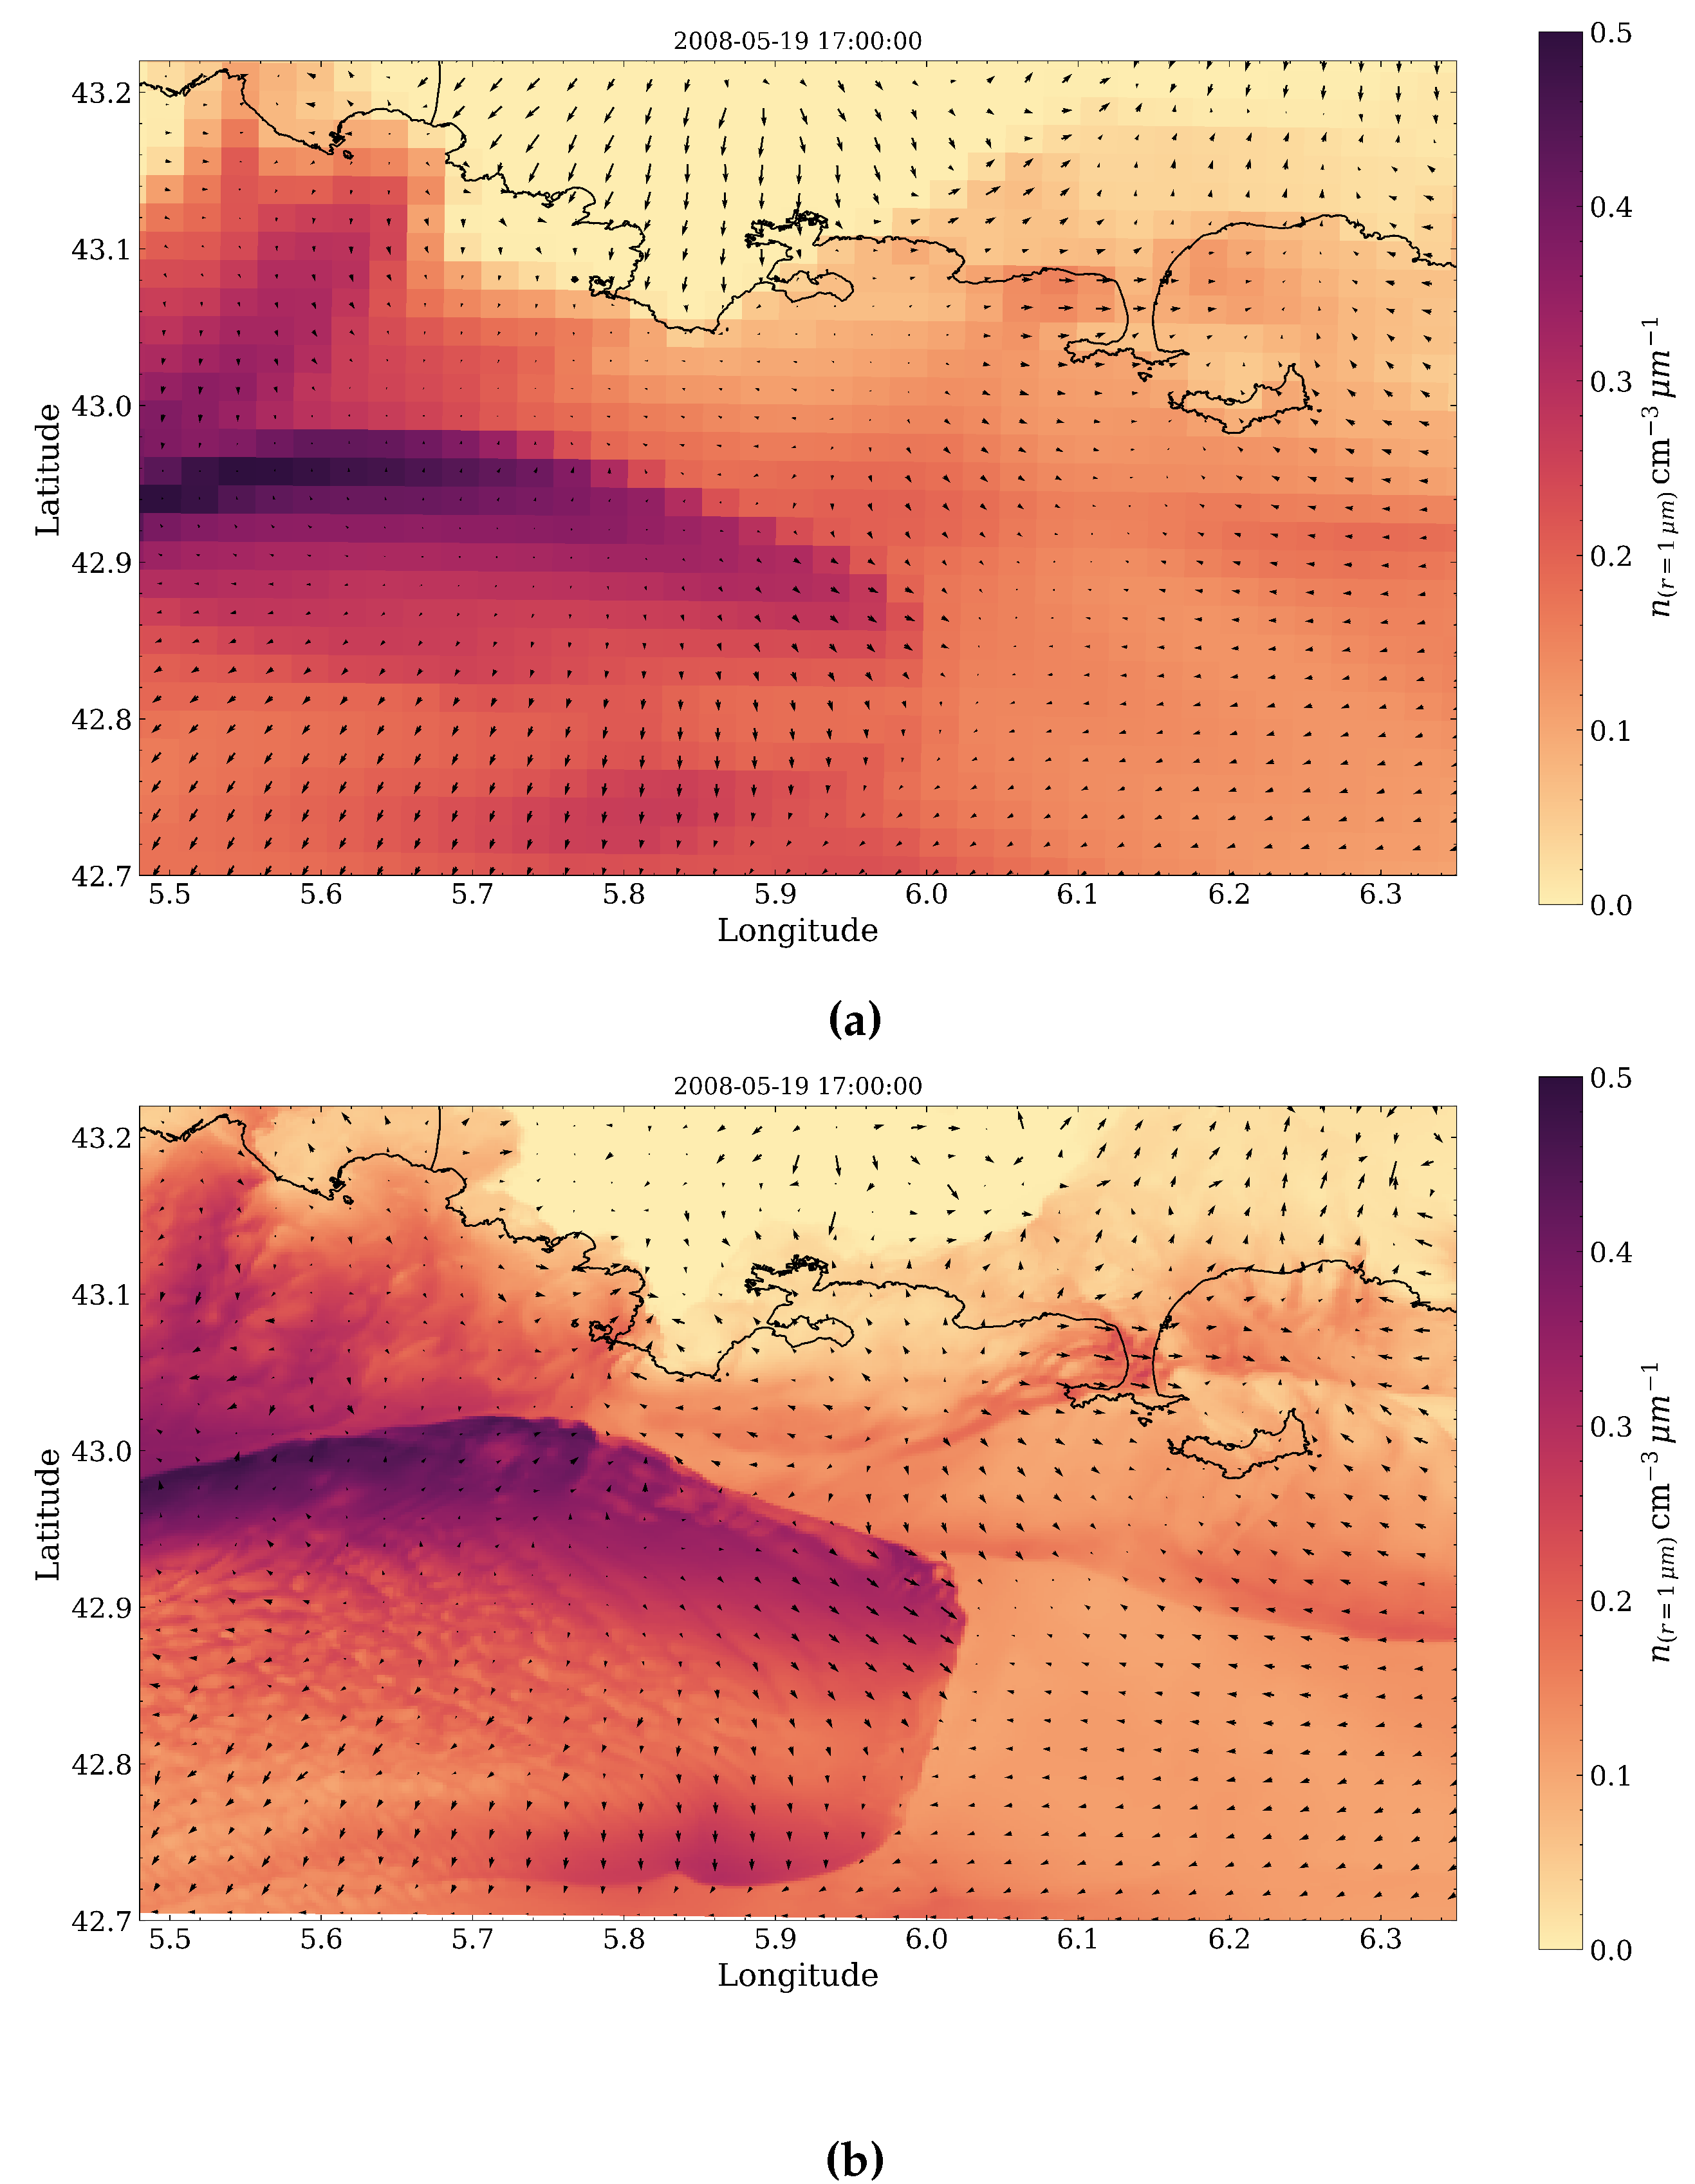
| Domain | Grid Points | Approximate Size (km) |
|---|---|---|
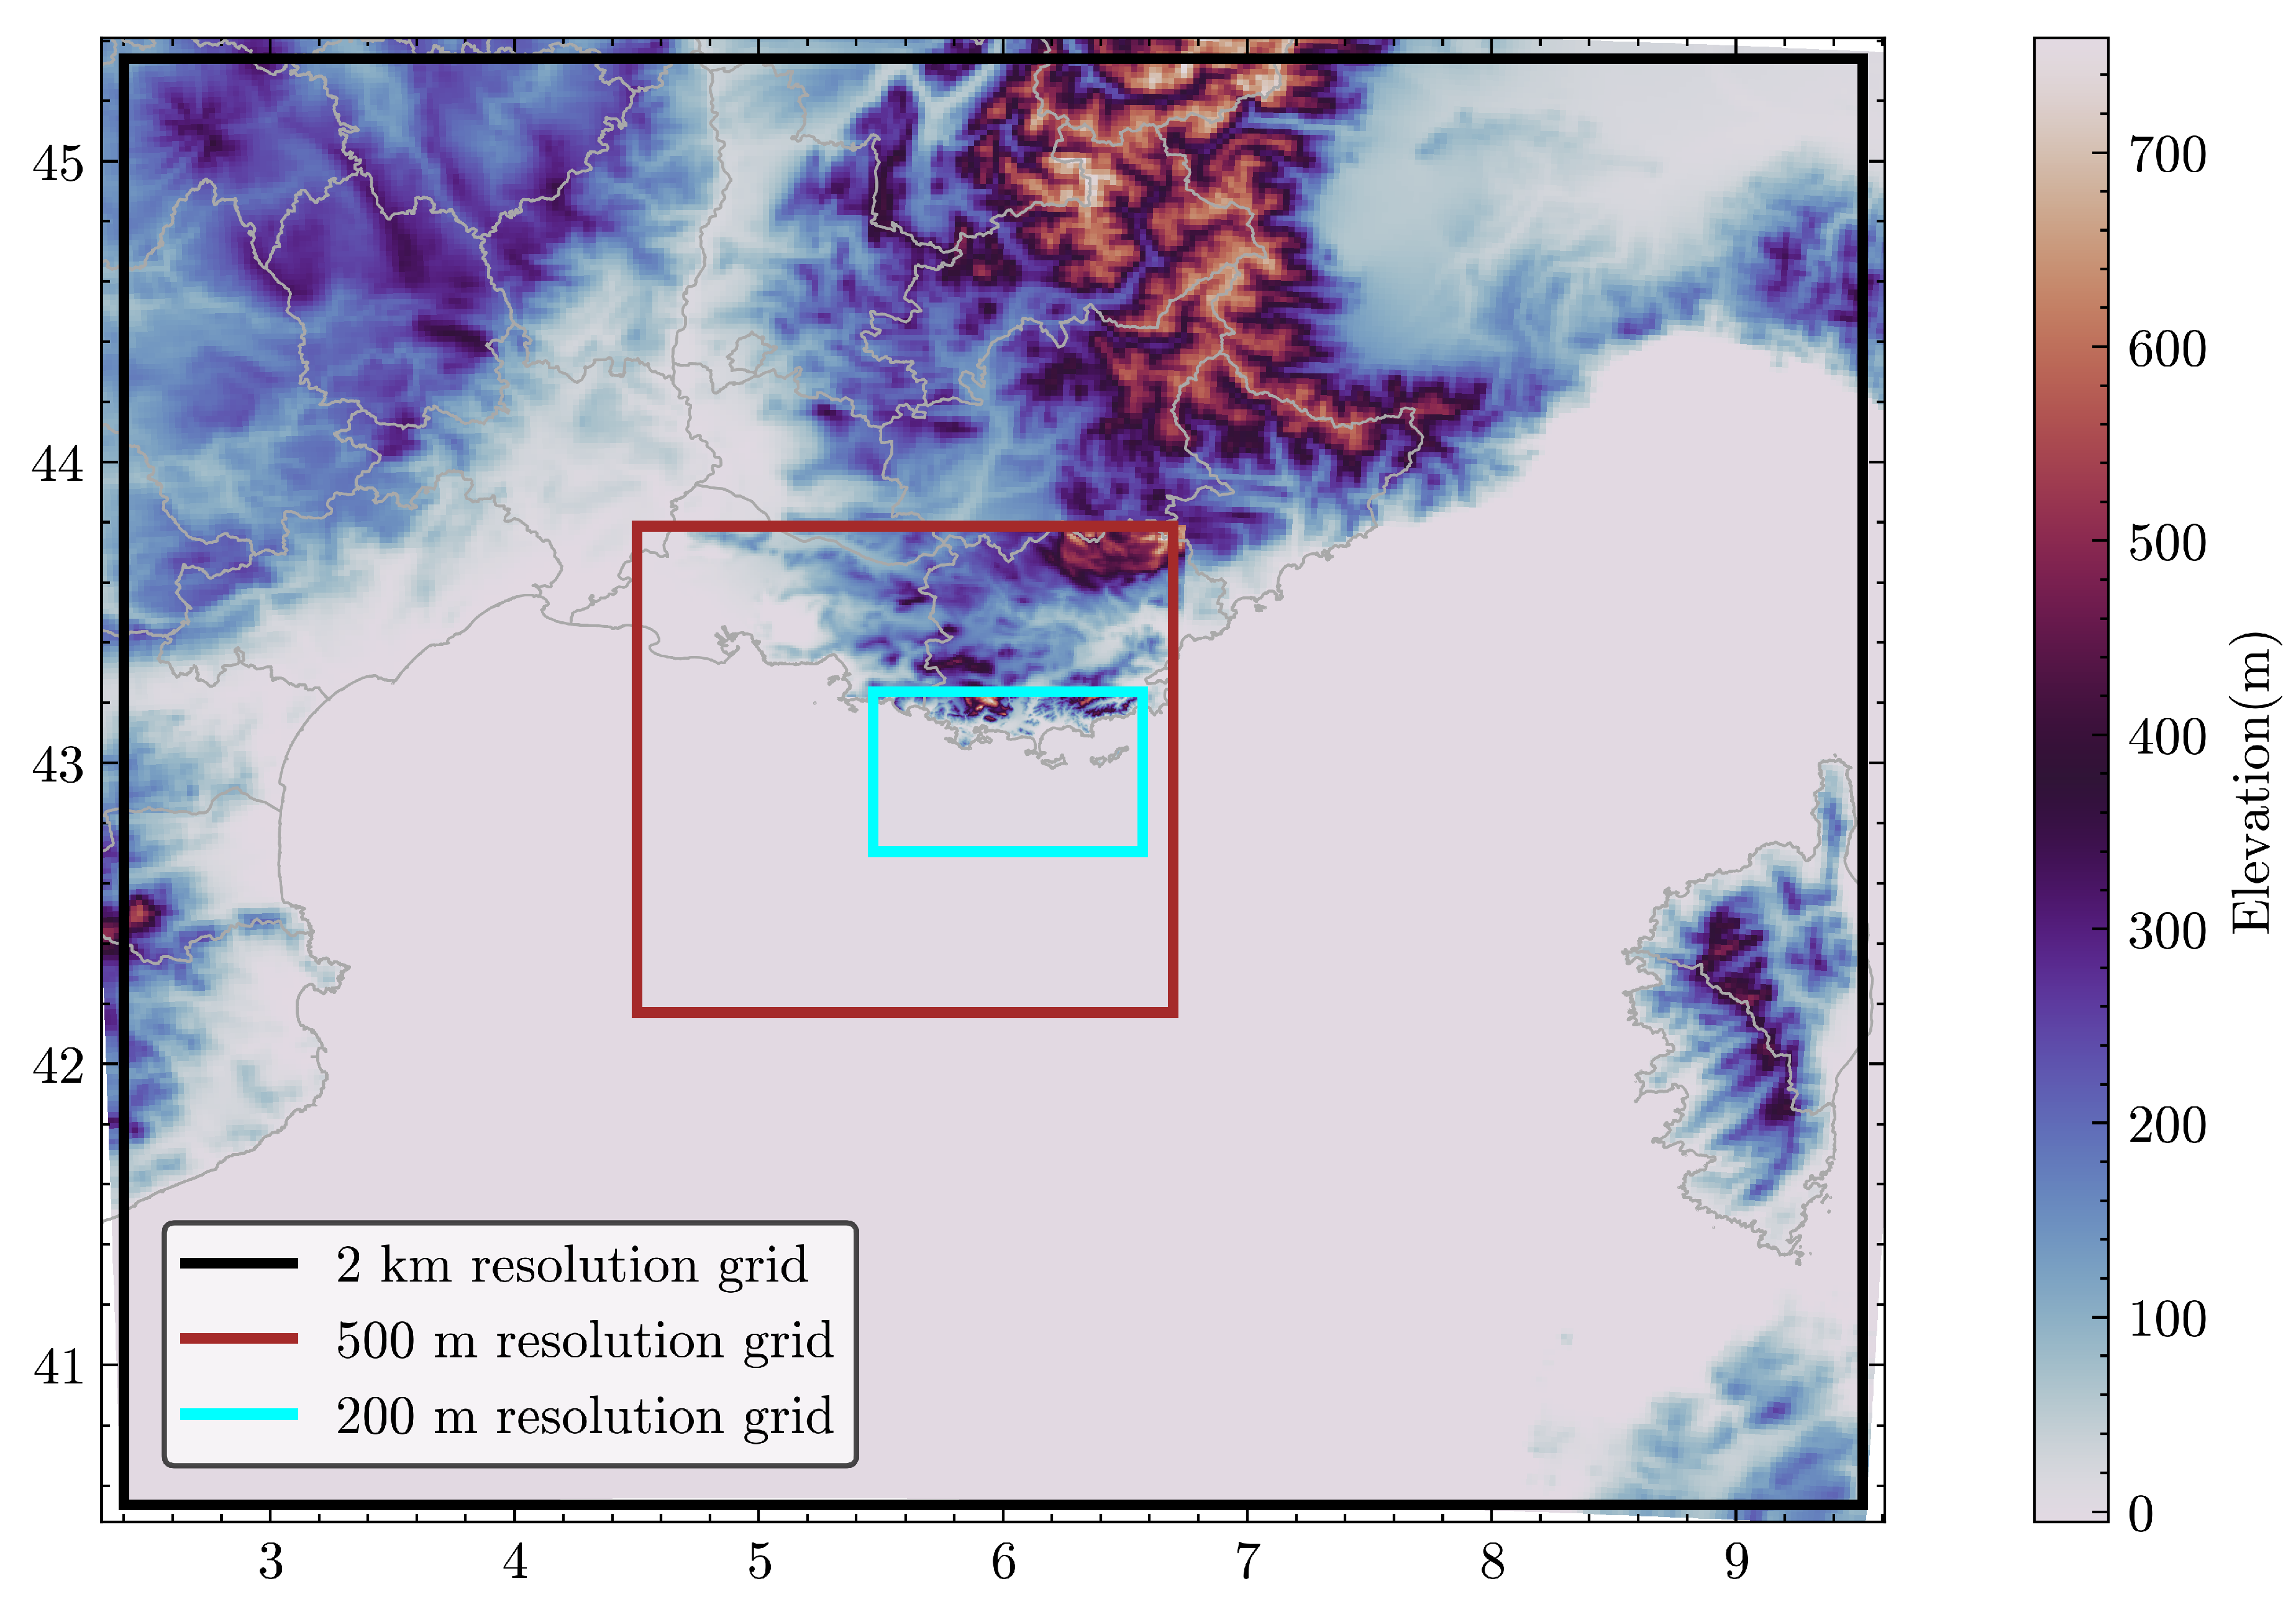
| 2 km resolution grid | 302 x 272 | 1108 x 928 |
| 500 m resolution grid | 182 x 182 | 586 x 478 |
| 200 m resolution grid (LES) | 452 x 302 | 91 x 60 |
| i | |||
|---|---|---|---|
| 1 | 2.1 | 2.5 | |
| 2 | 7 | 7 | |
| 3 | 12 | 25 |
Disclaimer/Publisher’s Note: The statements, opinions and data contained in all publications are solely those of the individual author(s) and contributor(s) and not of MDPI and/or the editor(s). MDPI and/or the editor(s) disclaim responsibility for any injury to people or property resulting from any ideas, methods, instructions or products referred to in the content. |
© 2024 by the authors. Licensee MDPI, Basel, Switzerland. This article is an open access article distributed under the terms and conditions of the Creative Commons Attribution (CC BY) license (http://creativecommons.org/licenses/by/4.0/).


