Preprint
Article

Methylmercury Intoxication Affects Epididymal White Adipose Tissue and Liver Function in Young ApoE Knockout Mice

Altmetrics

Downloads

126

Views

86

Comments

0

Submitted:

14 May 2024

Posted:

15 May 2024

You are already at the latest version

Alerts
Abstract
Methylmercury (MeHg) intoxication is a global health concern. Although MeHg neurotoxicity is well-recognized, less is known about MeHg's effects on metabolism. In this study, we evaluated MeHg intoxication (20mg/L in drinking water for 20 days) effects on liver and epididymal white fat (EWF) in young ApoE knockout (ko) and wild-type mice. The former is well-known to show spontaneous dyslipidemia. Hg levels in hair, liver, and EWF were measured to assess the degree of MeHg exposure. We also evaluated body weight gain, plasma triglycerides, total cholesterol levels, and liver injury by assessing steatosis score, AST, ALT, SOD, and TBAR levels. To evaluate EWF, we analyzed mean wet weight and adipocyte diameter, plasma leptin levels and metabolomics. Hg levels were markedly higher among intoxicated mice. ApoE ko mice showed higher Hg in the hair but lower levels in the liver and EWF than wild-type controls. Among wild-type mice, MeHg compromised weight gain and increased liver TBAR levels compared to non-challenged controls. Among non-intoxicated mice, ApoE deficiency significantly increased triglyceride, total cholesterol, and liver transaminases with reduced EWF wet weight, hepatic SOD, and plasma leptin levels. MeHg accumulation together with ApoE deficiency elevated total cholesterol, triglycerides, hepatic transaminases, and TBARS. We found distinct EWF metabolite activity in different scenarios of ApoE deficiency and MeHg intoxication, highlighting increased cardiovascular risk especially when both challenges occur. Further studies are required to elucidate the underlying mechanisms involved in these effects and the target nutritional interventions in most need to ameliorate them.
Keywords: 
Subject: Biology and Life Sciences  -   Toxicology

1. Introduction

Mercury (Hg) can be found in three most common forms in the environment: elemental, inorganic, and organic compounds, such as methylmercury [1]. Artisanal mining activity is a primary source of Hg contamination, using Hg to separate gold from other materials during mining [2]. This activity leads to the accumulation of Hg in riverbeds, ultimately forming the highly toxic methylmercury (MeHg) compound [3]. Natural and anthropogenic environmental disasters can drastically increase the exposure of human populations to MeHg poisoning [3], representing a worrisome health issue and a global concern [4,5].
Consumed MeHg is rapidly absorbed by the body, widely distributed in tissues, and slowly excreted [6]. Once consumed, MeHg easily crosses cellular barriers, including the placental and blood-brain barriers, with rapid access to the fetus and the central nervous system (CNS), respectively [7]. Heavy metal intoxication affects the CNS possibly contributing to obesity and its consequences [5].
Some metabolic consequences of pollution in humans may be attributed to chronic heavy metal exposure, with direct actions on adipose tissue, interfering with adipocyte signaling and releasing adipokines, a class of molecules associated with a plethora of biological functions [8]. Chronic MeHg toxicity can also disrupt the adipose tissue but its effects on fat metabolism are not well understood [9,10].
Apolipoprotein E (ApoE) is a very important apolipoprotein involved in lipid metabolism. ApoE participates in the homeostatic control of plasma and tissue lipid contents, playing a critical role in the cholesterol liver clearance [11]. ApoE is mainly synthesized in hepatocytes and plays several immune system-modulating roles, affecting the development of inflammation-related chronic diseases [12,13].
In this study, we evaluated the effects of MeHg intoxication (20mg/L in drinking water for 20 days) on the structural and functional alterations of the epididymal white adipose tissue (EWF) in ApoE knockout (ko) mice that show systemic ApoE deficiency and spontaneous dyslipidemia. ApoE ko mice have been used as an experimental cardiovascular disease and atherosclerosis model [14], even at a young age [15]. The findings of this study may shed light on novel nutritional interventions to reduce the impact of MeHg intoxication by improving the adipose tissue metabolism in dyslipidemic individuals.

2. Materials and Methods

2.1. Experimental Design

Ninety-seven C57BL6J young male mice aged 41 days and weighing 25-30 g were obtained from the production vivarium of the Experimental Biology Core/University of Fortaleza (Unifor/NuBEx). Four groups were assigned: 1) wild-type controls, 2) MeHg-intoxicated wild-type mice, 3) ApoE ko controls, and 4) MeHg intoxicated ApoE ko mice. All mice were housed in microisolators in temperature and humidity-control ventilators and received food and water ad libitum. The Animal Care and Use Committee from the University of Fortaleza approved all protocols (nº 2073110618/2018).

2.2. MeHg Chronic Intoxication

Experimental mice were intoxicated by 20mg of MeHg/L (MeHg chloride, Sigma Aldrich, St. Louis, MI, USA) in drinking water for 20 days, according to Andersen and Andersen [16].The MeHg solution was changed weekly. To prevent cross-contamination of MeHg in the vivarium, intoxicated mice were housed in a separate room. According to international guidelines, caution was taken for animal and experimenter safety and proper chemical waste discharge.

2.3. Measuring the Concentration of Hg in Hair, Liver, and Epididymal White Fat

Dorsal skin hair/fur, liver, and epididymal white adipose tissue samples were harvested for total elemental mercury measurements using the Direct Mercury Analyzer (DMA-80, Milestone, Sorisole, BG, Italy), as previously described by Windmoller et al., 2017. Liver and adipose tissue samples were lyophilized before analyses. Results are expressed as mg/kg for hair and liver measurements and µg/kg for epididymal white adipose tissue.

2.4. Body Weight Gain

To address whether MeHg intoxication could be obesogenic, we assess body weight changes by monitoring both the weekly body weight gain adjusted by the initial weight (%) and the delta body weight gain (g), which is the difference between final body weight (D61) and initial body weight (baseline) at the start of the MeHg challenge.

2.5. Evaluation of Dyslipidemia

To assess whether chronic MeHg intoxication could lead to dyslipidemia, blood samples were harvested through the retro-orbital plexus and centrifuged for 10 min at 3500 rpm. Plasma was obtained to determine the concentration of total cholesterol and triglycerides. Plasma total cholesterol and triglyceride levels were determined by a semi-automatic analyzer (LabQuest, Labtest, Brazil) using diagnostic kits (Labtest, Brazil). Results are expressed as mg/dL.

2.6. Evaluation of MeHg Liver Toxicity

2.6.1. Liver Function

To evaluate MeHg-induced liver dysfunction, we measured AST and ALT levels using standard diagnostic kits (Labtest, Brazil) according to the manufacturer's instructions. Results were expressed in AST and ALT as mg/dL.

2.6.2. Oxidative Stress

To measure oxidative stress, we analyze liver superoxide dismutase (SOD) and thiobarbituric acid-reactive substances (TBARS) levels. For SOD measurements, samples were homogenized in phosphate buffer and pyrogallol, and the oxidizing agent MTT (dimethyl thiazole-diphenyltetrazolium bromide) was added. The reaction was determined spectrophotometrically by absorbance at 570 nm. For calculation, we assumed that 1 unit (U) of SOD could prevent the auto-oxidation of 50% of pyrogallol in the standard. The result was expressed in SOD units per mg of protein (U/mg protein). For TBARS assessment, samples were homogenized in ice-cold 1x PBS and centrifuged for 10 min at 12,000 rpm. 500 μL of a solution containing trichloroacetic acid (TCA 15%), thiobarbituric acid (TBA 0.0375%), and hydrochloric acid (HCl 0.25 N) were added to the supernatants (250μL). The samples were kept in a boiling water bath for 15 min and then placed in running water until they cooled down. 750 μL of butyl alcohol was added and mixed. Samples were centrifuged for 10 min at 3,000 rpm at room temperature. 200μL of the supernatant was added to the 96-well plate in duplicate. The absorbance was measured at a wavelength of 535 nm. Results were normalized by the protein concentration in the tissue [17].

2.6.3. Hepatic Steatosis Scoring

Slides were processed, stained in hematoxylin and eosin (H&E), and blindly classified by a pathologist considering steatohepatitis and ballooning scores [18]. The steatohepatitis score was according to the following classification: (0) no conspicuous steatohepatitis, (1) borderline steatohepatitis, (2) detectable steatohepatitis. Ballooning score graduation was: (0) none, (1) few ballooned cells, (2) many ballooned cells/prominent ballooning.

2.7. MeHg Effects on Epididymal White Fat Structure and Function

2.7.1. Epididymal Adipose Tissue Weight and Morphometry

The weight of epididymal adipose tissue was evaluated shortly after mice euthanasia with the aid of an analytical scale (Filizola, SP, Brazil) to assess possible alterations between the studied groups. Results were expressed in mg of wet tissue. After weighing, EWF was fixed in 4% formaldehyde for 1 to 2 days. Following this, samples were embedded in paraffin, sectioned at 5 µm, and stained with hematoxylin/eosin. Adipocyte diameter was assessed in digitalized images using a CX31 Olympus light microscope equipped with a QCapture image analysis software package. The adipocyte diameters were measured from ten random 10x-objective magnification fields per slide. Three slides per animal were analyzed, and non-consecutive slides were taken. For cell diameter measurements after proper calibration, it was used the Image J 1.45 software (National Institutes of Health, Bethesda, MD, USA) was used.

2.8. Leptin Plasma Levels by ELISA Immunoassay

Blood was collected through the retro-orbital plexus, kept in heparin-coated capillary tubes, and centrifuged for 10 min at 3500 rpm. The supernatant was obtained and immediately stored in a -20ºC freezer for later analysis. Samples were analyzed following instructions of R&D standard protocols for the ELISA leptin duo set assay kit.

2.9. Metabolomics Assessment

2.9.1. Sample Preparation

Tissues were weighed, frozen in liquid nitrogen, and macerated in 2 mL tubes, which were submitted to the SIMPLEX protocol (Coman et al., 2016) for extraction and separation of lipids. Initially, 225 mL of ice-cold methanol was added to the tubes. Then, the tubes were vortexed for 20 min and sonicated for 10 min. After homogenization, 750 µL of ice-cold MTBE and 188 µL of 0.1% (m/v) aqueous ammonium acetate solution were added. The tubes were then centrifuged for 15 min at 10,000 g at 4 °C. The upper phases were collected, filtered with 0.22 µm nylon syringe filter, and placed in new 1.5 mL tubes. Subsequently, the solutions in these tubes were dried in a SpeedVac (Concentrator PlusTM, Eppendorf, Hamburg, Germany) at 30 °C for 2 h. After this step, the samples were resuspended in a 60:40 (v/v) acetonitrile (ACN): water solution, vortexed, and centrifuged. The supernatant was transferred to vials with 250 µL inserts.

2.9.2. Liquid Chromatography and Mass Spectrometry Conditions

Chromatographic separation was performed in an ultra-high performance liquid chromatography system (UltiMate™ 3000 RSLCnano system, Thermo Scientific, Waltham, MA, USA). The separation was performed using a Titan C18 2.1 mm x 100 mm x 1.7 μm column from Supelco (Sigma-Aldrich, Darmstadt, Germany). The sample injection volume was set to 5 μL. The temperature was maintained at 40 °C and the separation was carried out at a flow rate of 0.25 mL min-1 under a gradient in which the mobile phases consisted of: (A) 60:40 (v/v) ACN: water and (B) 90:10 (v/v) isopropanol: ACN. For ESI negative and positive modes, 10 mmol L-1 ammonium formate was added to both mobile phases. The gradient for the ESI negative mode analyses started with 40% B for 2 min, increasing to 50% B from 3 to 6 min, 70% B from 6.1 to 8 min. Over the next 2 min, the gradient was maintained at 100% B, then 40% B for 3 min. For ESI positive mode analyses, the gradient stopped at 9-11 min at 100% B.
Detection and acquisition were performed using a Q-Exactive Plus (Thermo Fisher Scientific, Waltham, MA, USA) mass spectrometer employing ESI in positive and negative modes in a full scan range from m/z 100 to 1500, according to the methodology described by Lísa et al. (2011). Briefly, the source temperature was set to 300 °C and the capillary voltage was set to - 3.2 or + 3.5 kV. The Orbitrap mass analyzer was set to 1 scan/s at 70,000 resolution and an injection time of 100 ms. Full MS spectra were acquired for each sample. Data-dependent analysis (DDA) TopN 5 DD-MS2 was used for the acquisition of the MS/MS spectra and performed in one-tenth of the samples. This method consists of detecting the most abundant ion species in the primarily acquired full MS spectra. These 5 ion species are consequently fragmented by higher collision-induced dissociation in the next scan (m/z 200 to 2000 MS/MS scan range) at 17,500 resolution.

2.9.3. Data Processing

The data obtained in raw format were converted to .ABF format, using the Analysis Base File Converter software (https://www.reifycs.com/abfconverter/), to be imported into the MS-DIAL 4.9 software (http://prime.psc.riken.jp/compms/msdial/main.html) to perform pre-processing and alignment. When importing the files, tolerance values for MS1 and MS2 of 0.01 and 0.025 were used, respectively. Furthermore, the retention time ranges from 0 to 14 min, with a mass detection range from 100 to 1500 Da, according to data acquisition constraints. To filter only the relevant ions and reduce the influence of noise, the minimum height of the peaks was defined as 1 x 10⁷. For identification, precise mass tolerance values equal to 0.01 for MS1 and 0.05 for MS2, were used (with a 80% cutoff). After alignment, the data was exported in .txt format, generating a feature table with a combination of retention time and m/z for each molecular feature (MF). The intensity detected in each sample was also evaluated. During exporting, fields with a value equal to zero were filled in with a value equal to 1/10 of the minimum intensity of the peaks in the samples (data completeness), using tools embedded in the software. The identification of the results detected and selected by the configured parameters was carried out using the MS-Finder 3.6 software (http://prime.psc.riken.jp/compms/msfinder/main.html), using the various available databases.
MetaboAnalyst, an online platform available for data analysis in omics approaches (https://www.metaboanalyst.ca/MetaboAnalyst/home.xhtml) was used for multivariate statistical analyses. Having uploaded the matrix to the platform, it was evaluated by the following multivariate methods: Principal Component Analysis (PCA) and supervised techniques (PLS-DA and oPLS-DA). Peak values were normalized using mean values and transformed to log 10. The normalized matrix was evaluated using Hierarchical Cluster Analysis (HCA), carried out using the Ward grouping method with Euclidean distance, and these same parameters were used to generate the heatmaps.

2.10. Statistical Analysis

The GraphPad Prism statistical package was used in all analyses (GraphPad Prism version 10.1, San Diego, CA, USA). Results were expressed as mean  standard error of the mean (SEM). Statistical comparisons and significance were verified using the two-way ANOVA test with Bonferroni post-test. The value of P <0.05 was considered significant.

3. Results

3.1. Hg deposits in Hair, Liver, and EPW Following Chronic MeHg Intoxication

As expected, orally intoxicated wild-type and ApoE ko mice showed significantly higher Hg levels than the respective control groups in all tested samples (p<0.001). Interestingly, intoxicated wild-type mice exhibited significantly lower Hg deposits in the hair than intoxicated mice lacking ApoE, p<0.001 (Figure 1A). Intriguingly, Hg levels were higher in the liver and EPW samples in wild-type MeHg-exposed mice than their ApoE ko counterparts (p<0.05) (Figure 1 B, C).

3.2. Body Weight Gain and Blood Lipids

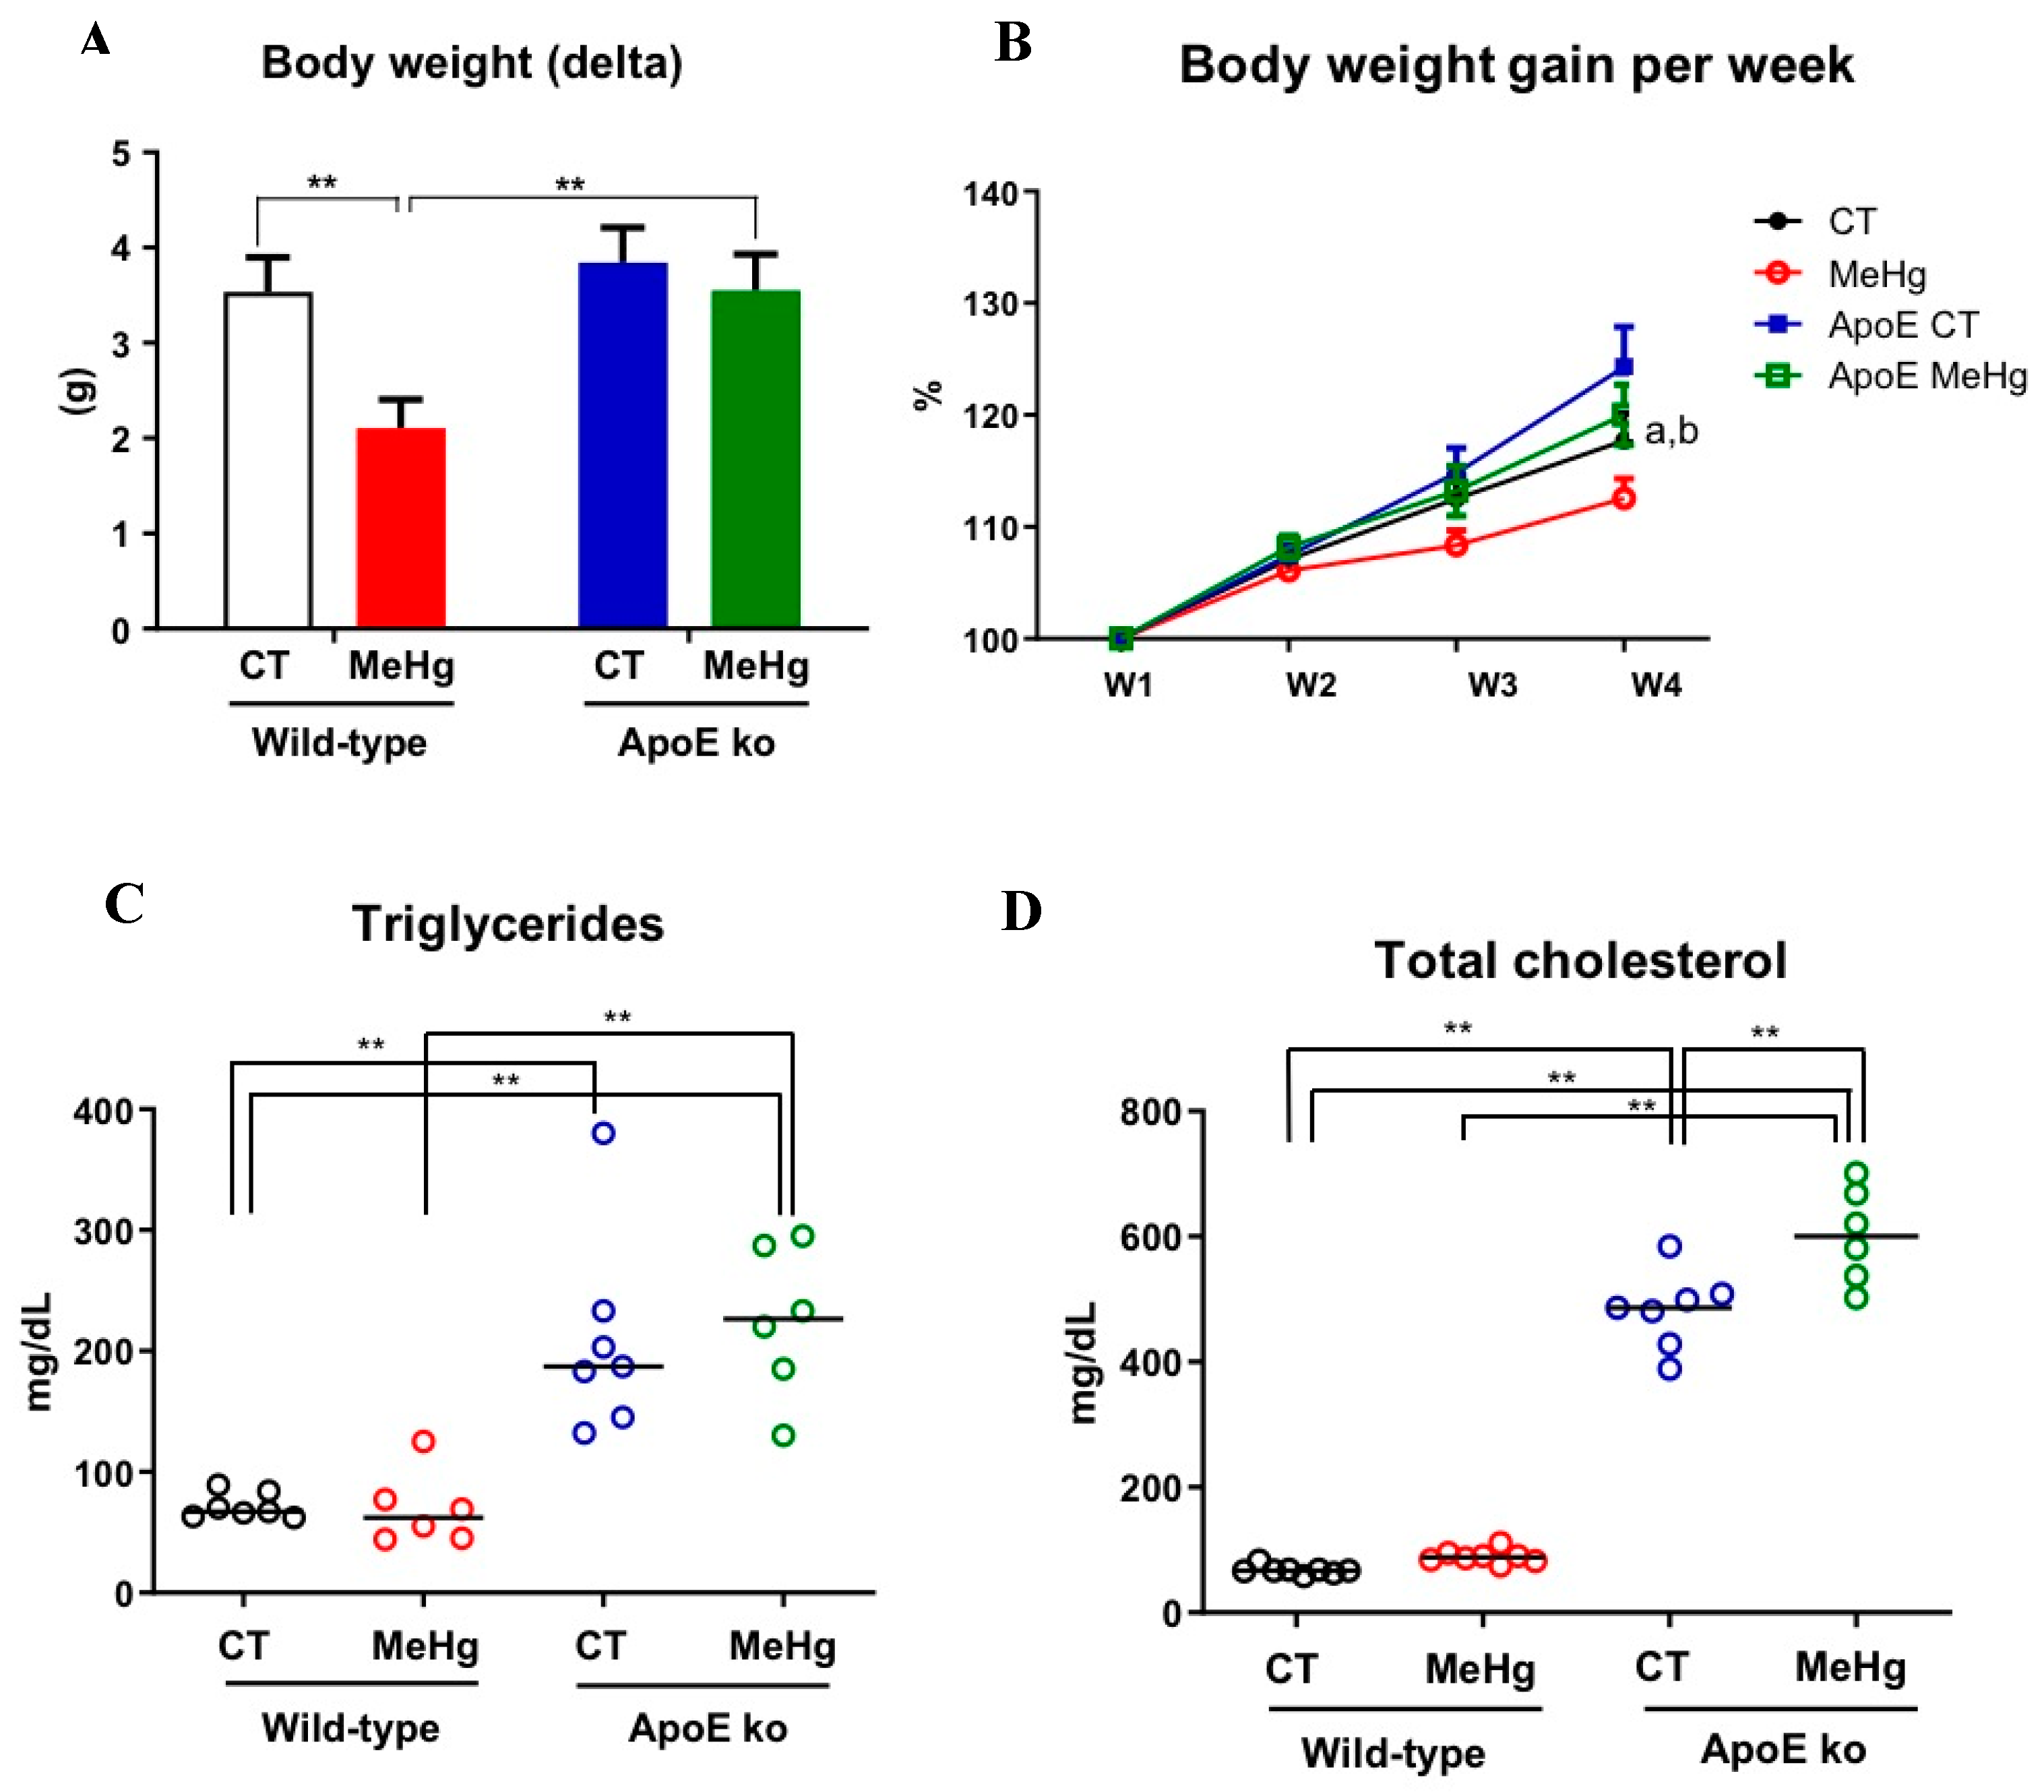
MeHg chronic intoxication induced significantly lower weight gain in wild-type but not among ApoE ko mice, p<0.01. Indeed, MeHg-intoxicated ApoE ko mice showed significantly greater weight gain than intoxicated wild-type counterparts, p<0.01. No statistical significance was found between ApoE ko control versus intoxicated ApoE ko mice, suggesting that ApoE deficiency is the major driver of body weight gain. MeHg chronic exposure was not able to affect weight gain regardless of genetic background (Figure 2 A, B). MeHg intoxication did not affect plasma triglyceride levels in both wild-type and ApoE ko mice compared to non-intoxicated controls. However, our findings indicate that the lack of ApoE was the major driver of the rise in triglyceride levels, regardless of MeHg intoxication (p<0.01) (Figure 2C).
We did not detect significant differences in plasma total cholesterol levels between the control and intoxicated wild-type mice. The ApoE deficiency also significantly increases total cholesterol levels independent of MeHg intoxication (p<0.01). Conversely, ApoE ko mice showed the highest total cholesterol levels following MeHg intoxication (Figure 2D).

3.3. Liver Enzymes

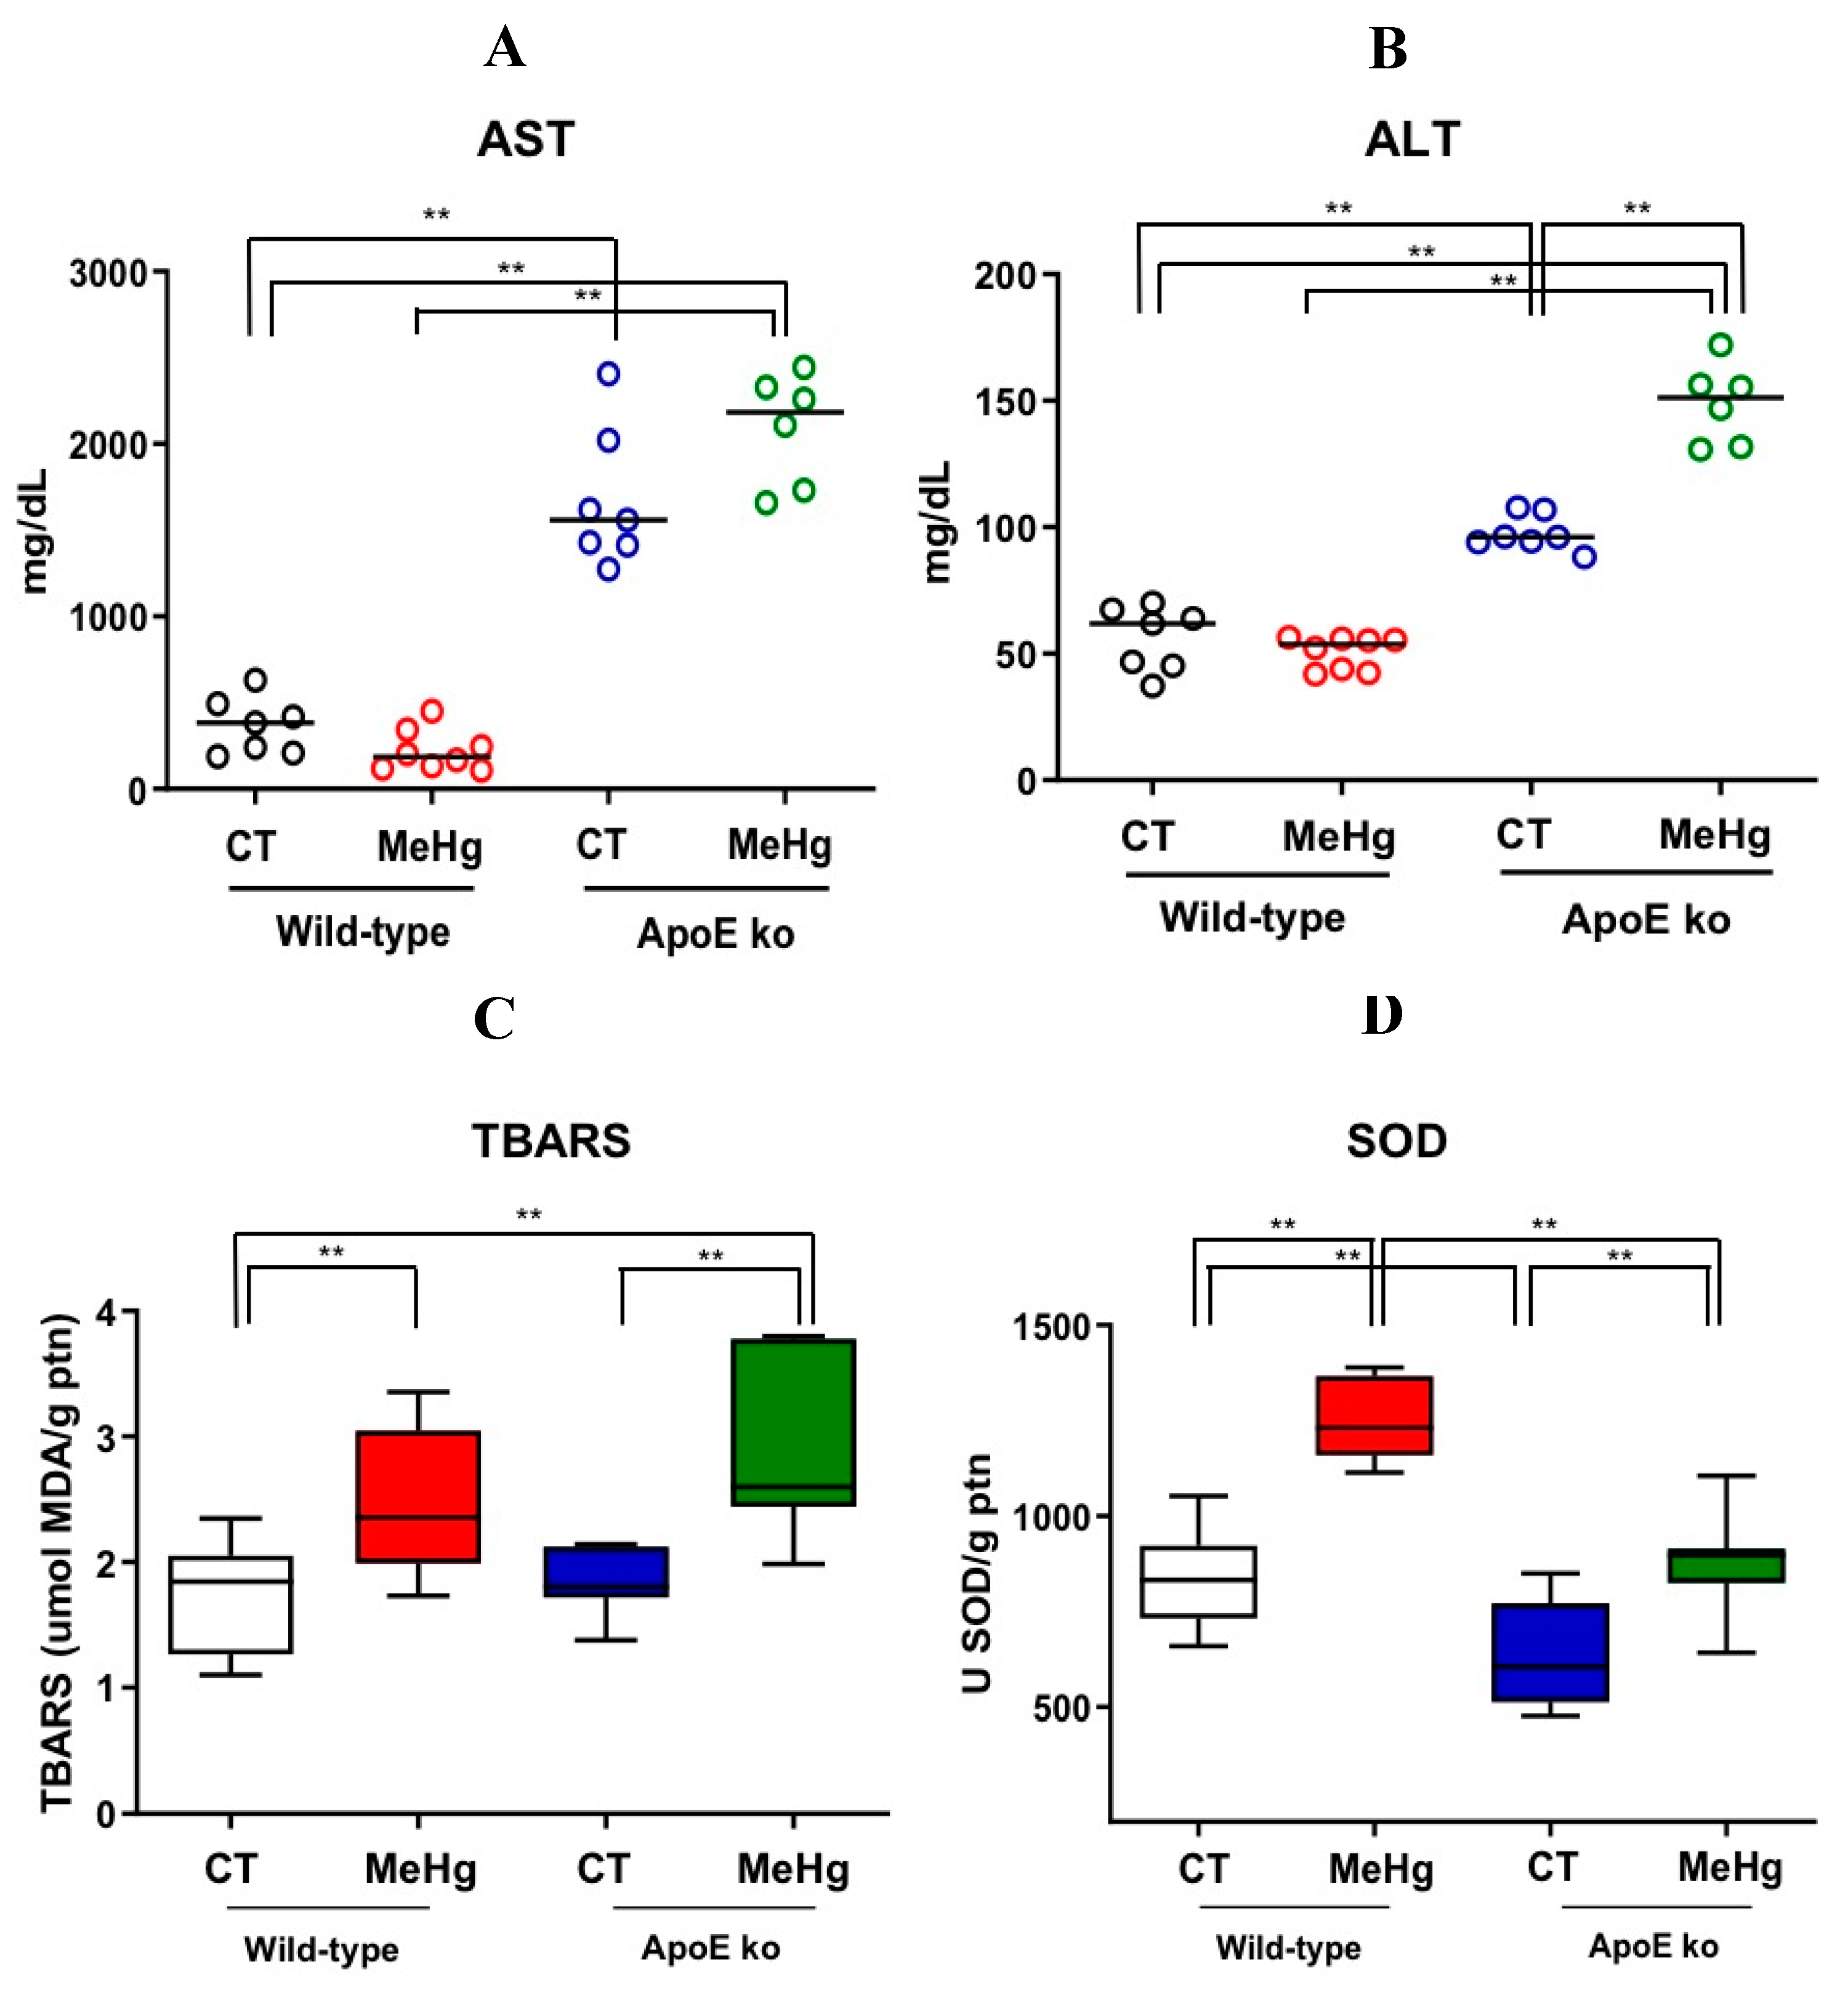
MeHg intoxication did not affect plasma AST levels in both wild-type and ApoE ko mice compared to non-intoxicated controls. However, our findings indicate that the lack of ApoE was the major driver of the rise in AST levels, regardless of MeHg intoxication (p<0.01) (Figure 3A). We did not detect significant differences in plasma ALT levels between the control and intoxicated wild-type mice. The ApoE deficiency also led to a significant increase in ALT levels independent of MeHg intoxication (p<0.01). However, ApoE ko mice showed the highest ALT levels following MeHg intoxication (Figure 3B).

3.4. Oxidative Stress in Liver Tissue

MeHg intoxication has led to significantly higher TBARS and SOD levels in the liver when compared to their respective non-intoxicated controls regardless of genetic background (p<0.01). We found an increase in oxidative stress through TBARS levels in ApoE ko mice intoxicated with MeHg when compared to wild-type control (p<0.01), suggesting synergism between these two conditions (Figure 3C).
ApoE ko intoxicated animals presented lower levels of SOD when compared to wild-type intoxicated animals (p<0.01), indicating that the absence of ApoE could have caused this difference in the presence of MeHg (Figure 3D).

3.5. Hepatic Steatosis

Hepatic steatosis was not found in wild-type mice regardless of MeHg intoxication. ApoE deficiency alone was not sufficient to induce significant hepatic steatosis alteration. However, MeHg intoxication (20 mg/L in drinking water) for 20 days caused a significant increase in hepatic steatosis scores in ApoE deficient mice when compared to ApoE non-intoxicated controls (p>0.05) or wild-type controls mice (p<0.05). Regarding the cell ballooning score, statistical differences were only detected after comparing wild-type controls versus ApoE ko intoxicated groups (Table 1).

3.6. Weight of EWF

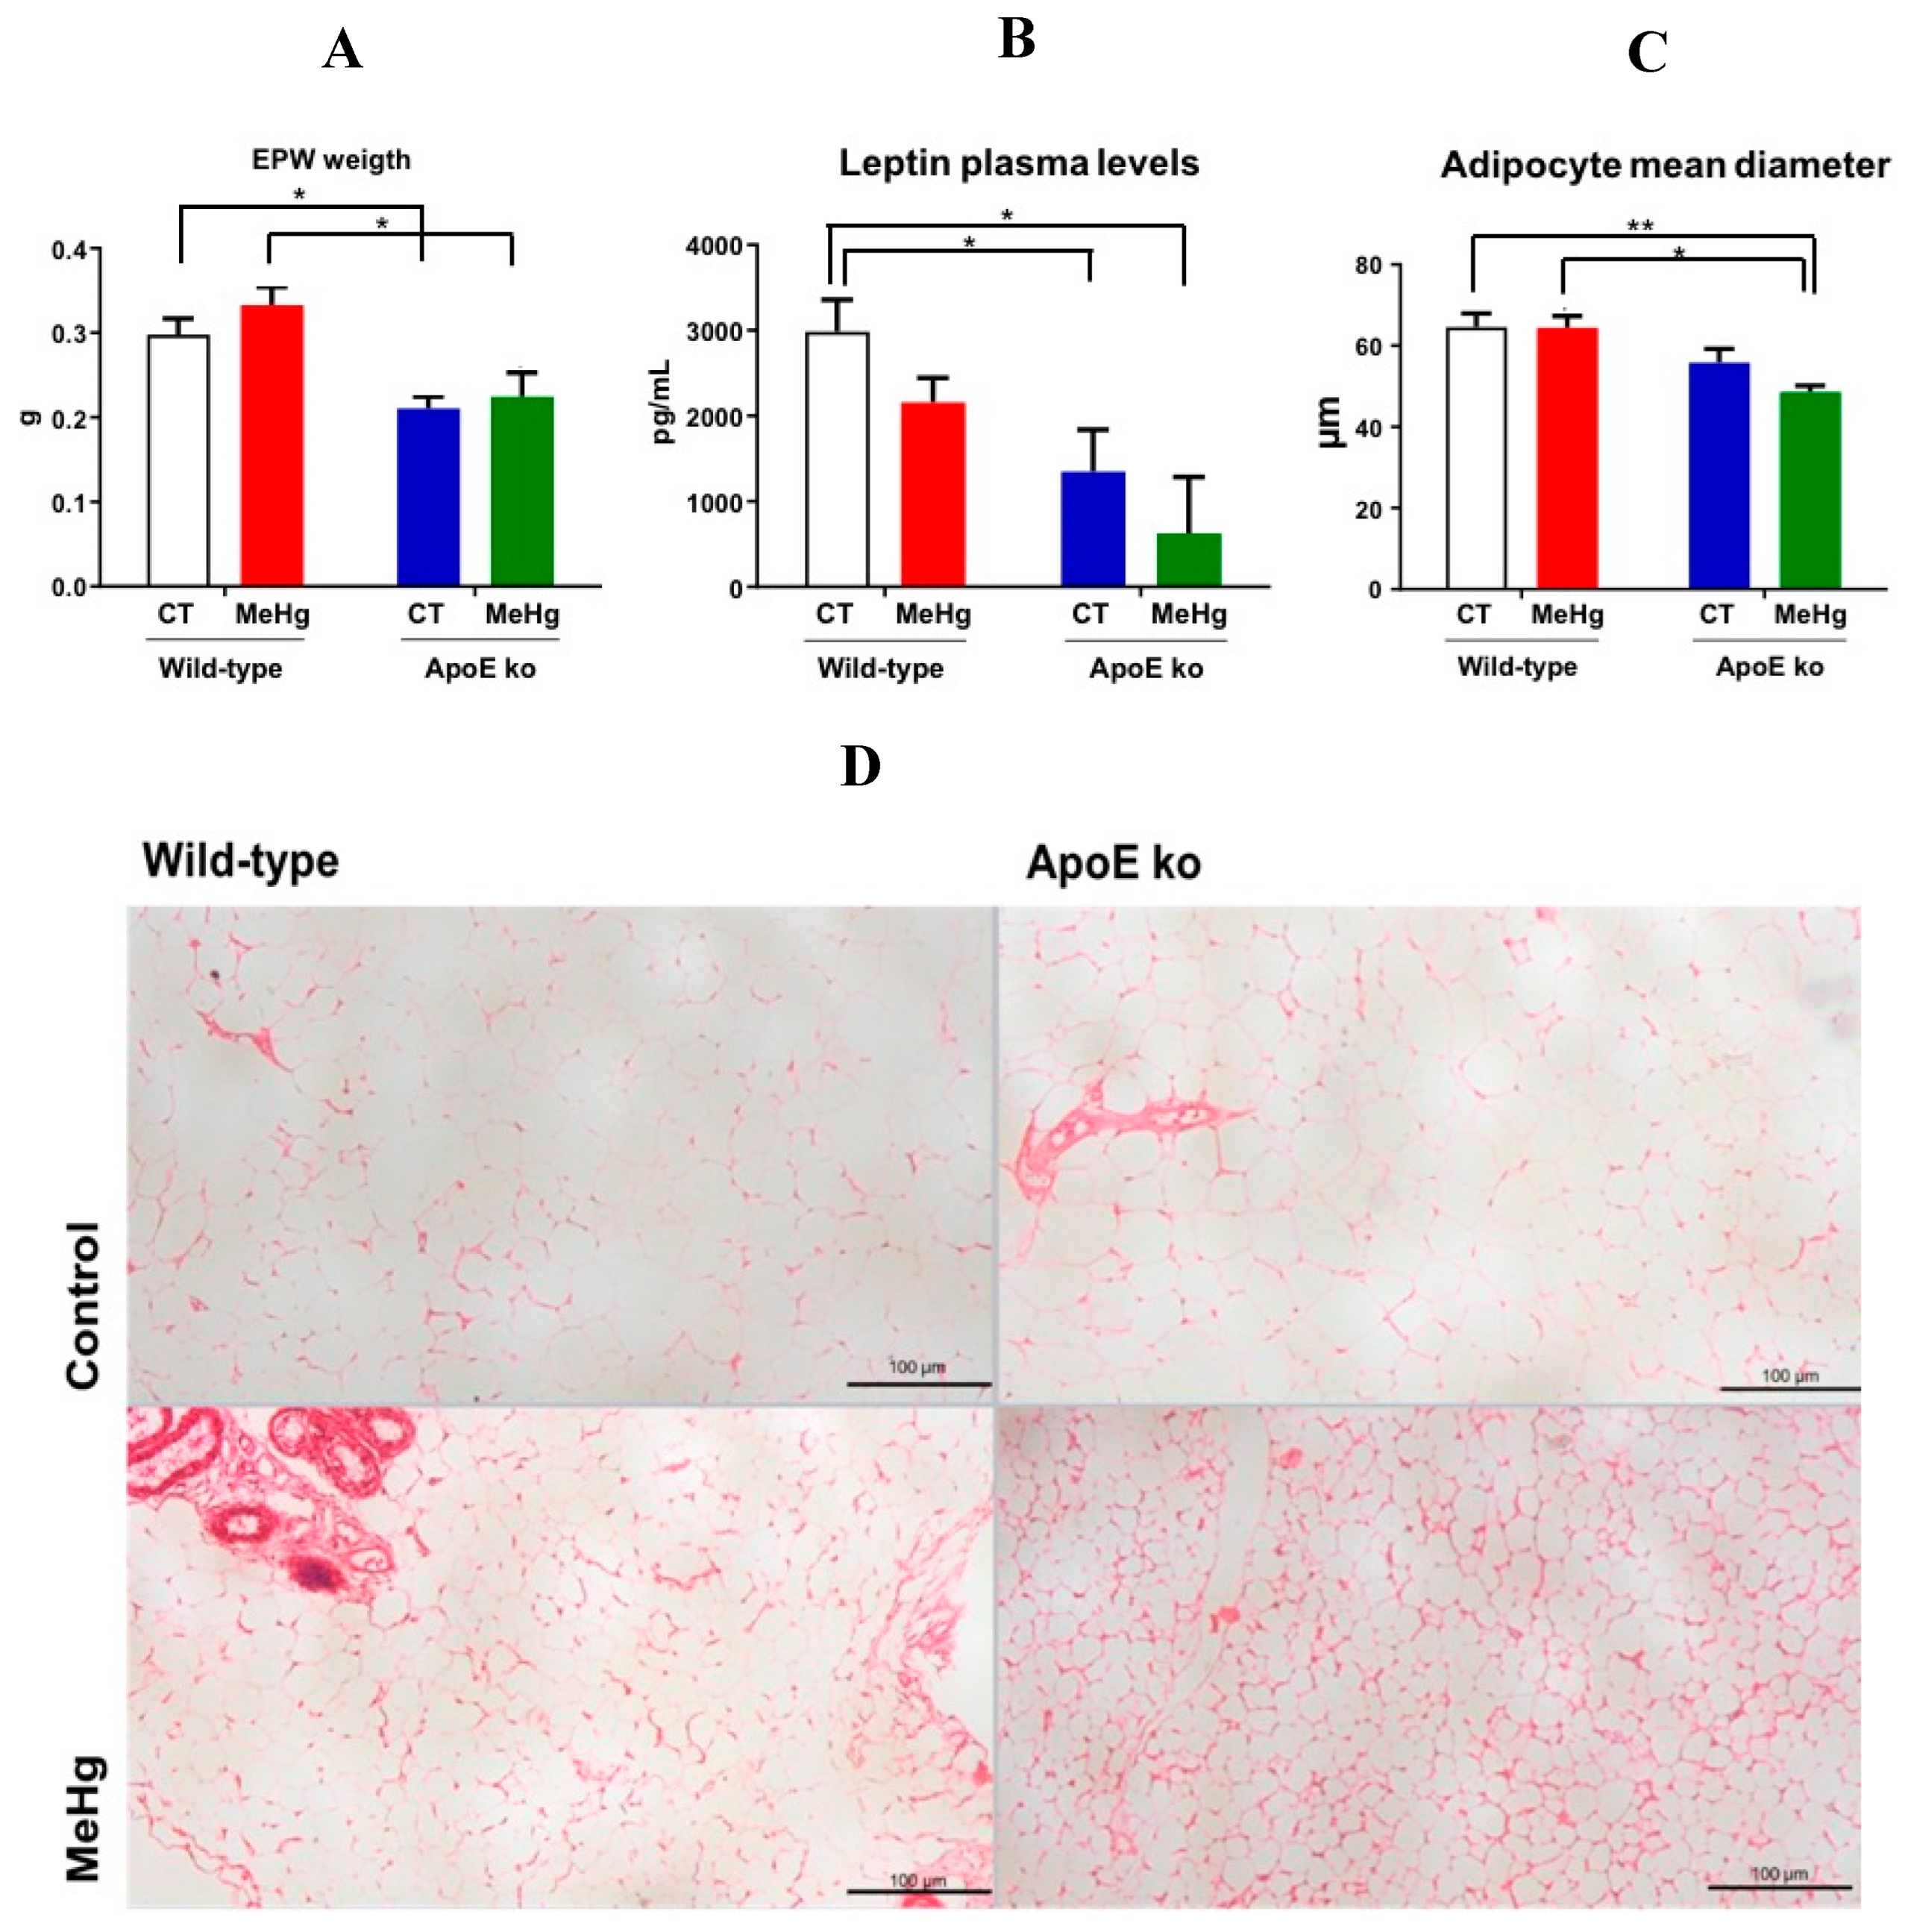
MeHg intoxication did not significantly affect EWF weight in wild-type mice. Interestingly, ApoE ko mice showed reduced EPW weight than the wild-type mice, regardless of experimentally MeHg exposure (p<0.05). Among ApoE knockout mice, no significant differences were observed between controls compared with intoxicated mice, indicating a stronger effect of ApoE deficiency than MeHg intoxication (Figure 4A)

3.7. Plasma Leptin Levels

Non-intoxicated wild-type mice showed significantly higher plasma leptin levels when compared to MeHg-intoxicated and non-intoxicated ApoE ko mice. No statistical difference was observed between wild-type controls versus MeHg-exposed wild-type mice and ApoE ko control vs. ApoE ko intoxicated groups (Figure 4B).

3.8. Morphometry of EPW Adipocytes

Among intoxicated mice, ApoE deficiency was sufficient to reduce the diameter of adipocytes (p<0.05). Intoxicated ApoE ko mice showed the greatest reduction in adipocyte diameter (p<0.01). MeHg intoxication did not cause significant reductions in adipocyte diameter among wild-type mice compared to their respective controls (Figure 4C, D).

3.9. EPW Metabolomics Analysis

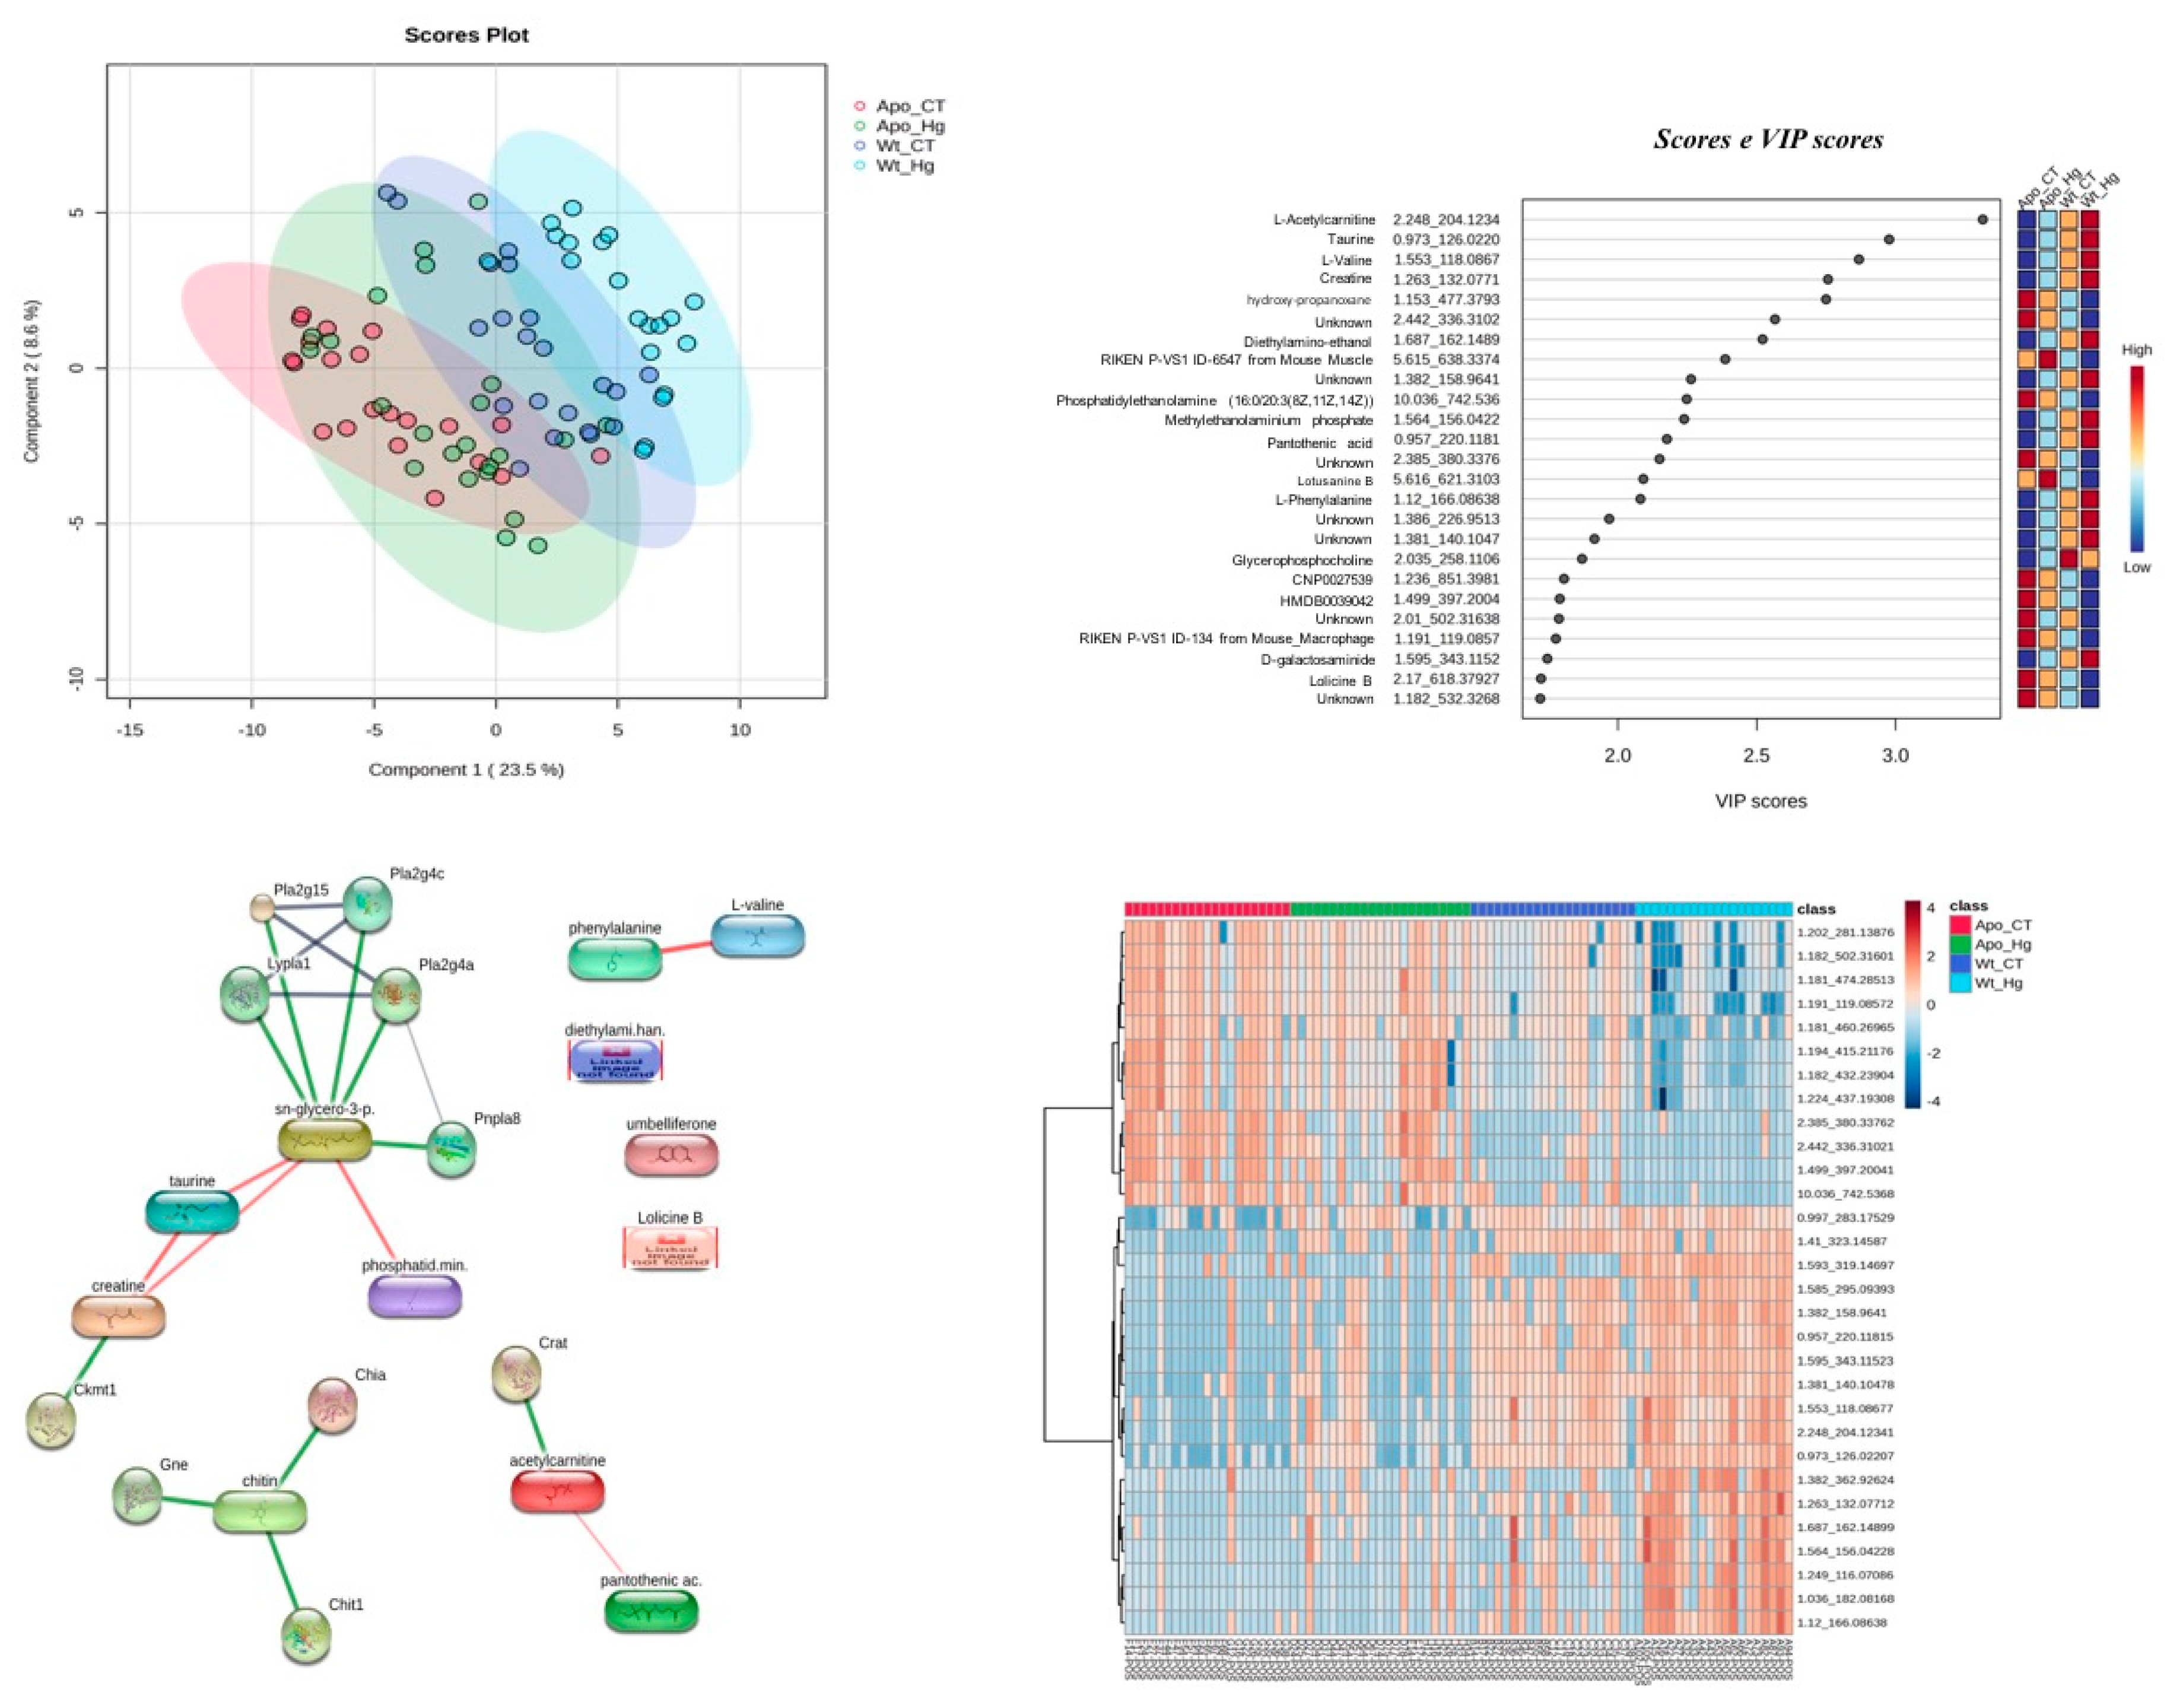
Evaluating all biological scenarios, the multivariate statistics display a good discriminant separation (Q2=0.66) in the partial least squares-discriminant analysis (PLS-DA), with a clearer separation from the APOE-ko mice (ApoE ko CT; ApoE ko MeHg) when compared to the wild-types (WT CT; WT MeHg) (Figure 5A). Variable importance in projection (VIP) scores revealed high score (≥2) for most of the metabolites that were able to discriminate each biological scenario (Figure 5B) and the heatmap shows how these scenarios are clustered related to their molecular features (MFs) intensity. In Figure 5C we can see a clear separation regarding the intensity of these MFs when compared ApoE-ko phenotypes (ApoE ko CT; ApoE ko MeHg) vs. wild-type phenotypes (WT CT; WT MeHg). An interactome map of the VIP metabolites is displayed in Figure 5D, where most of the metabolites, such as glycerophosphocholine, taurine, and creatine, are in the main interactome backbone.
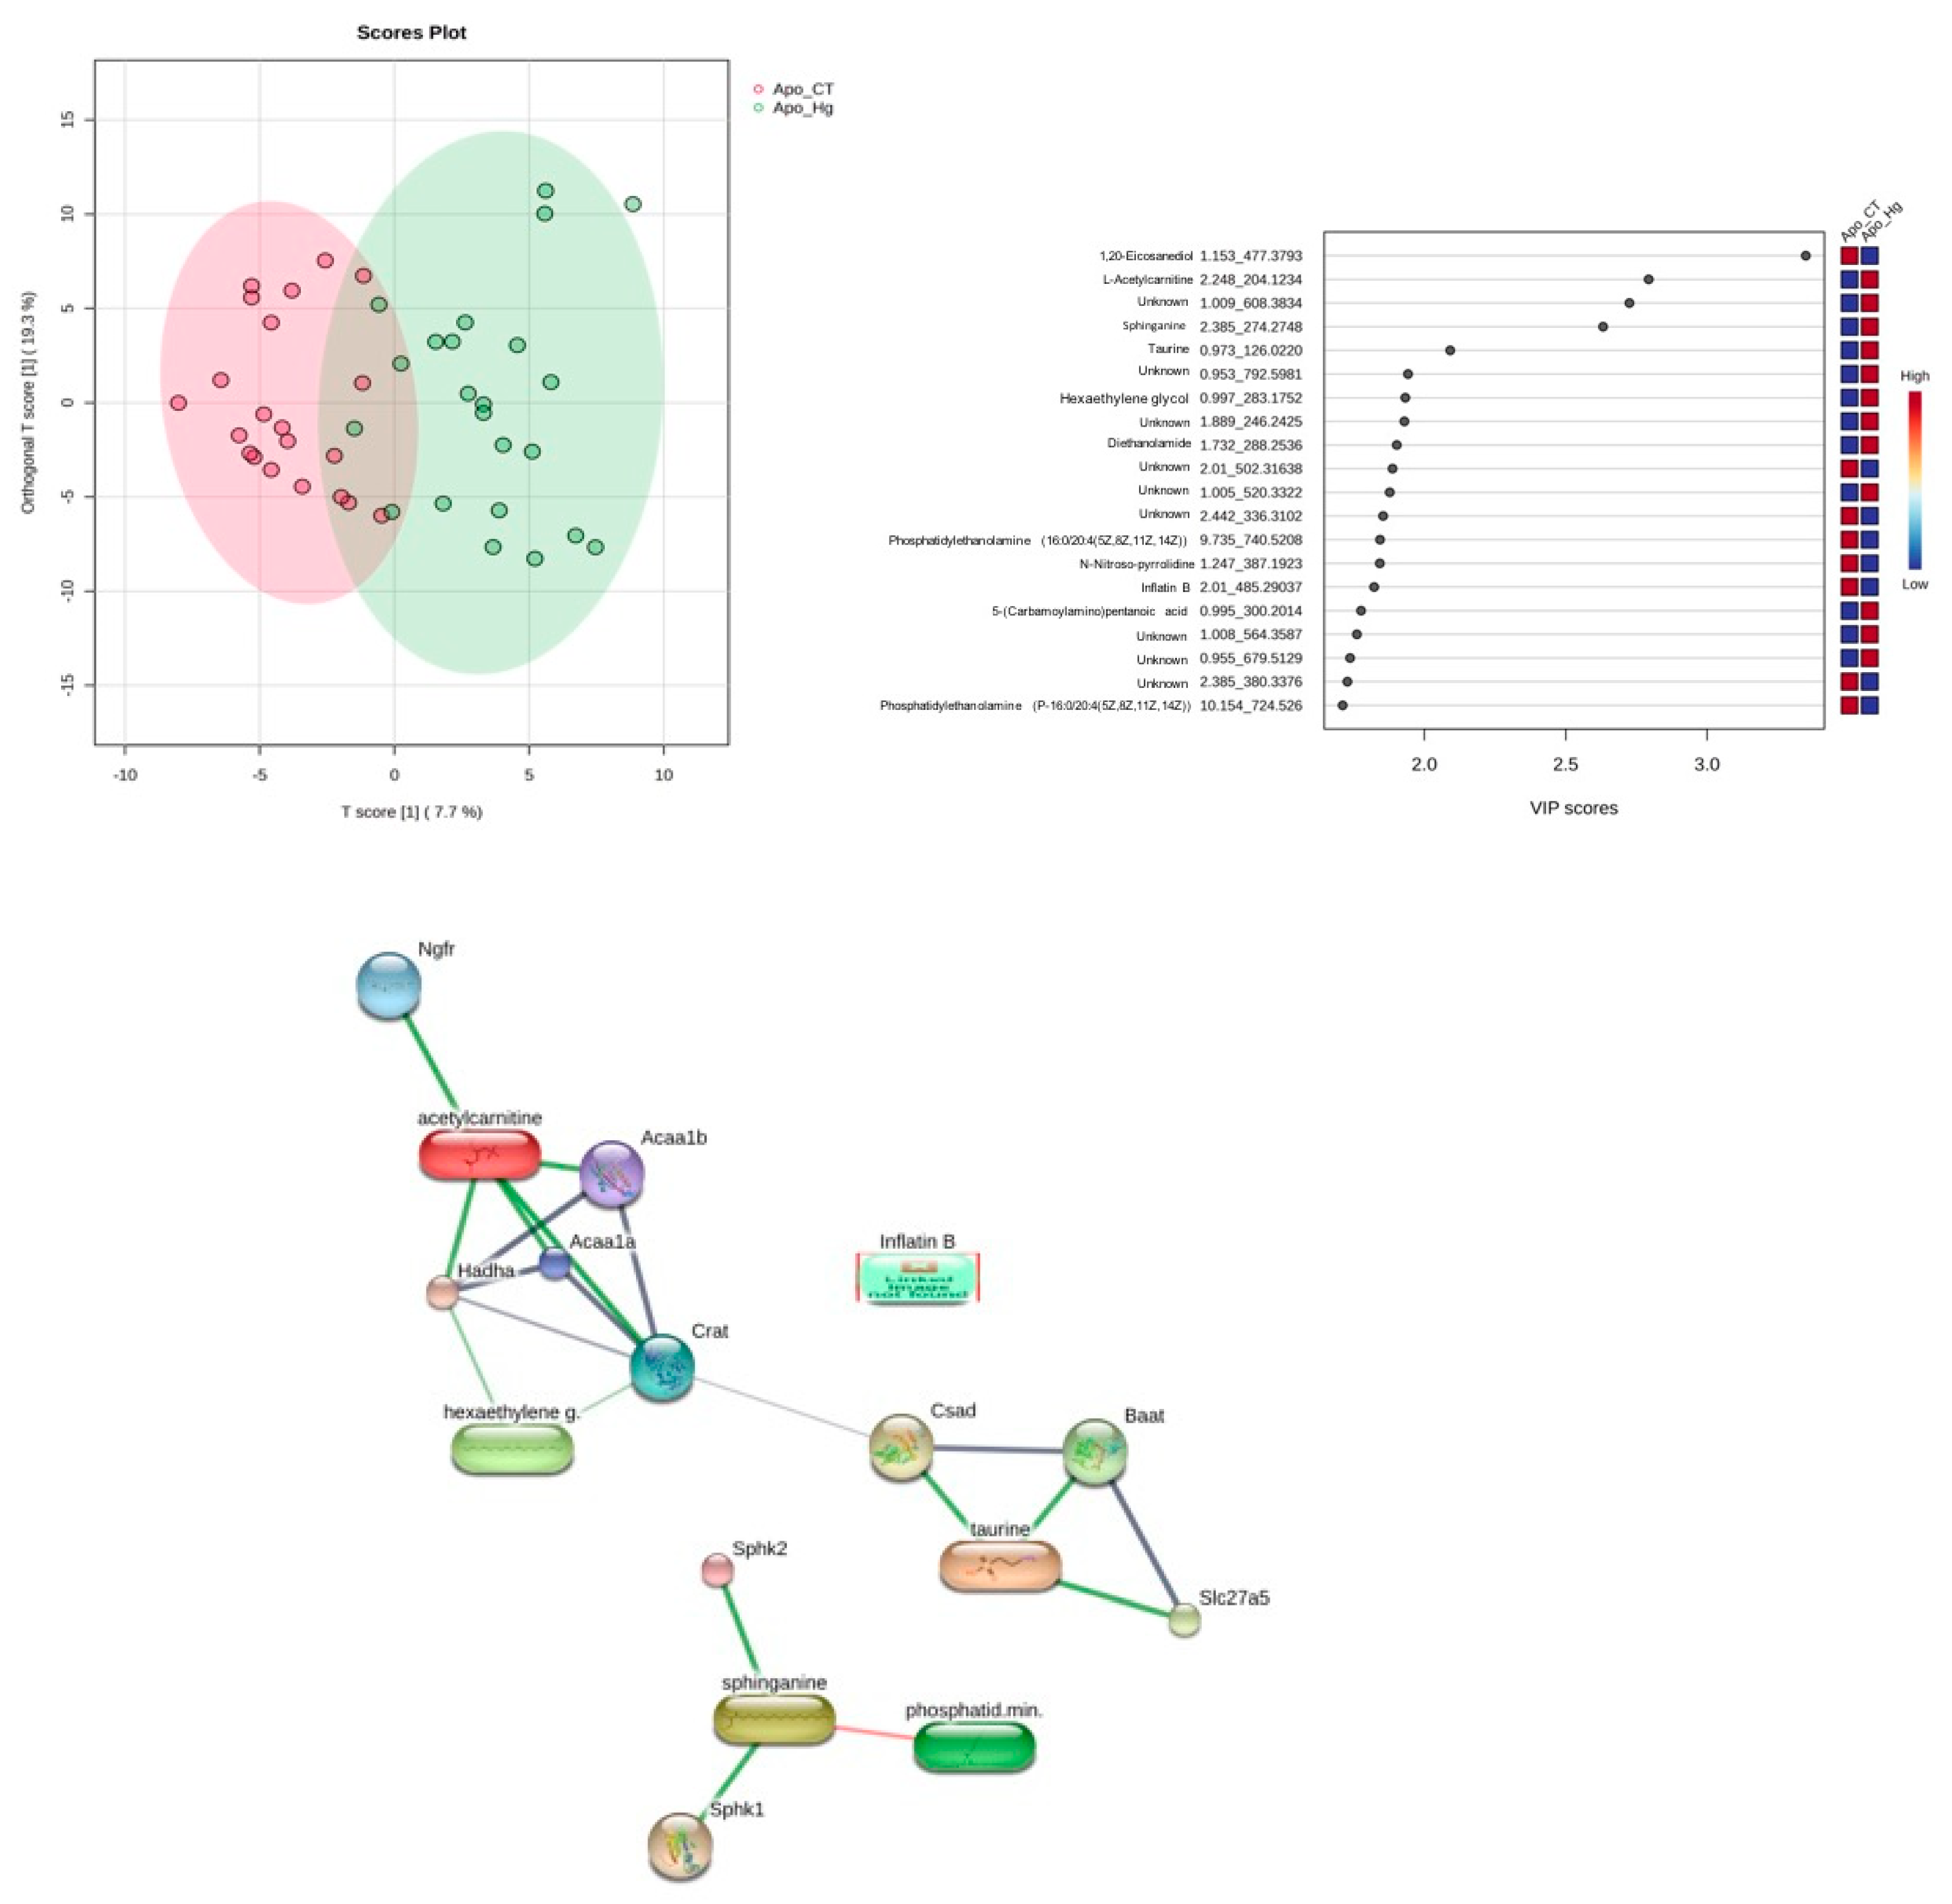
When we analyze the scenario ApoE-ko mice – ApoE ko CT vs. ApoE ko MeHg we observe a low permutation value (p=0.06) in the orthogonal partial least squares-discriminant analysis (oPLS-DA), and the metabolites were able to discriminate the proposed model (Figure 6A). The metabolites L-acetylcarnitine, sphinganine, taurine, hexaethylene glycol, and diethanolamine were more intense in the ApoE ko MeHg scenario with VIP scores ≥2, therefore representing good discriminant features for this phenotype (Figure 6B). An interactome map of the VIP metabolites is displayed in Figure 5C and we can observe that most of the metabolites on the VIP score chart are interacting in the main backbone (Figure 6C).
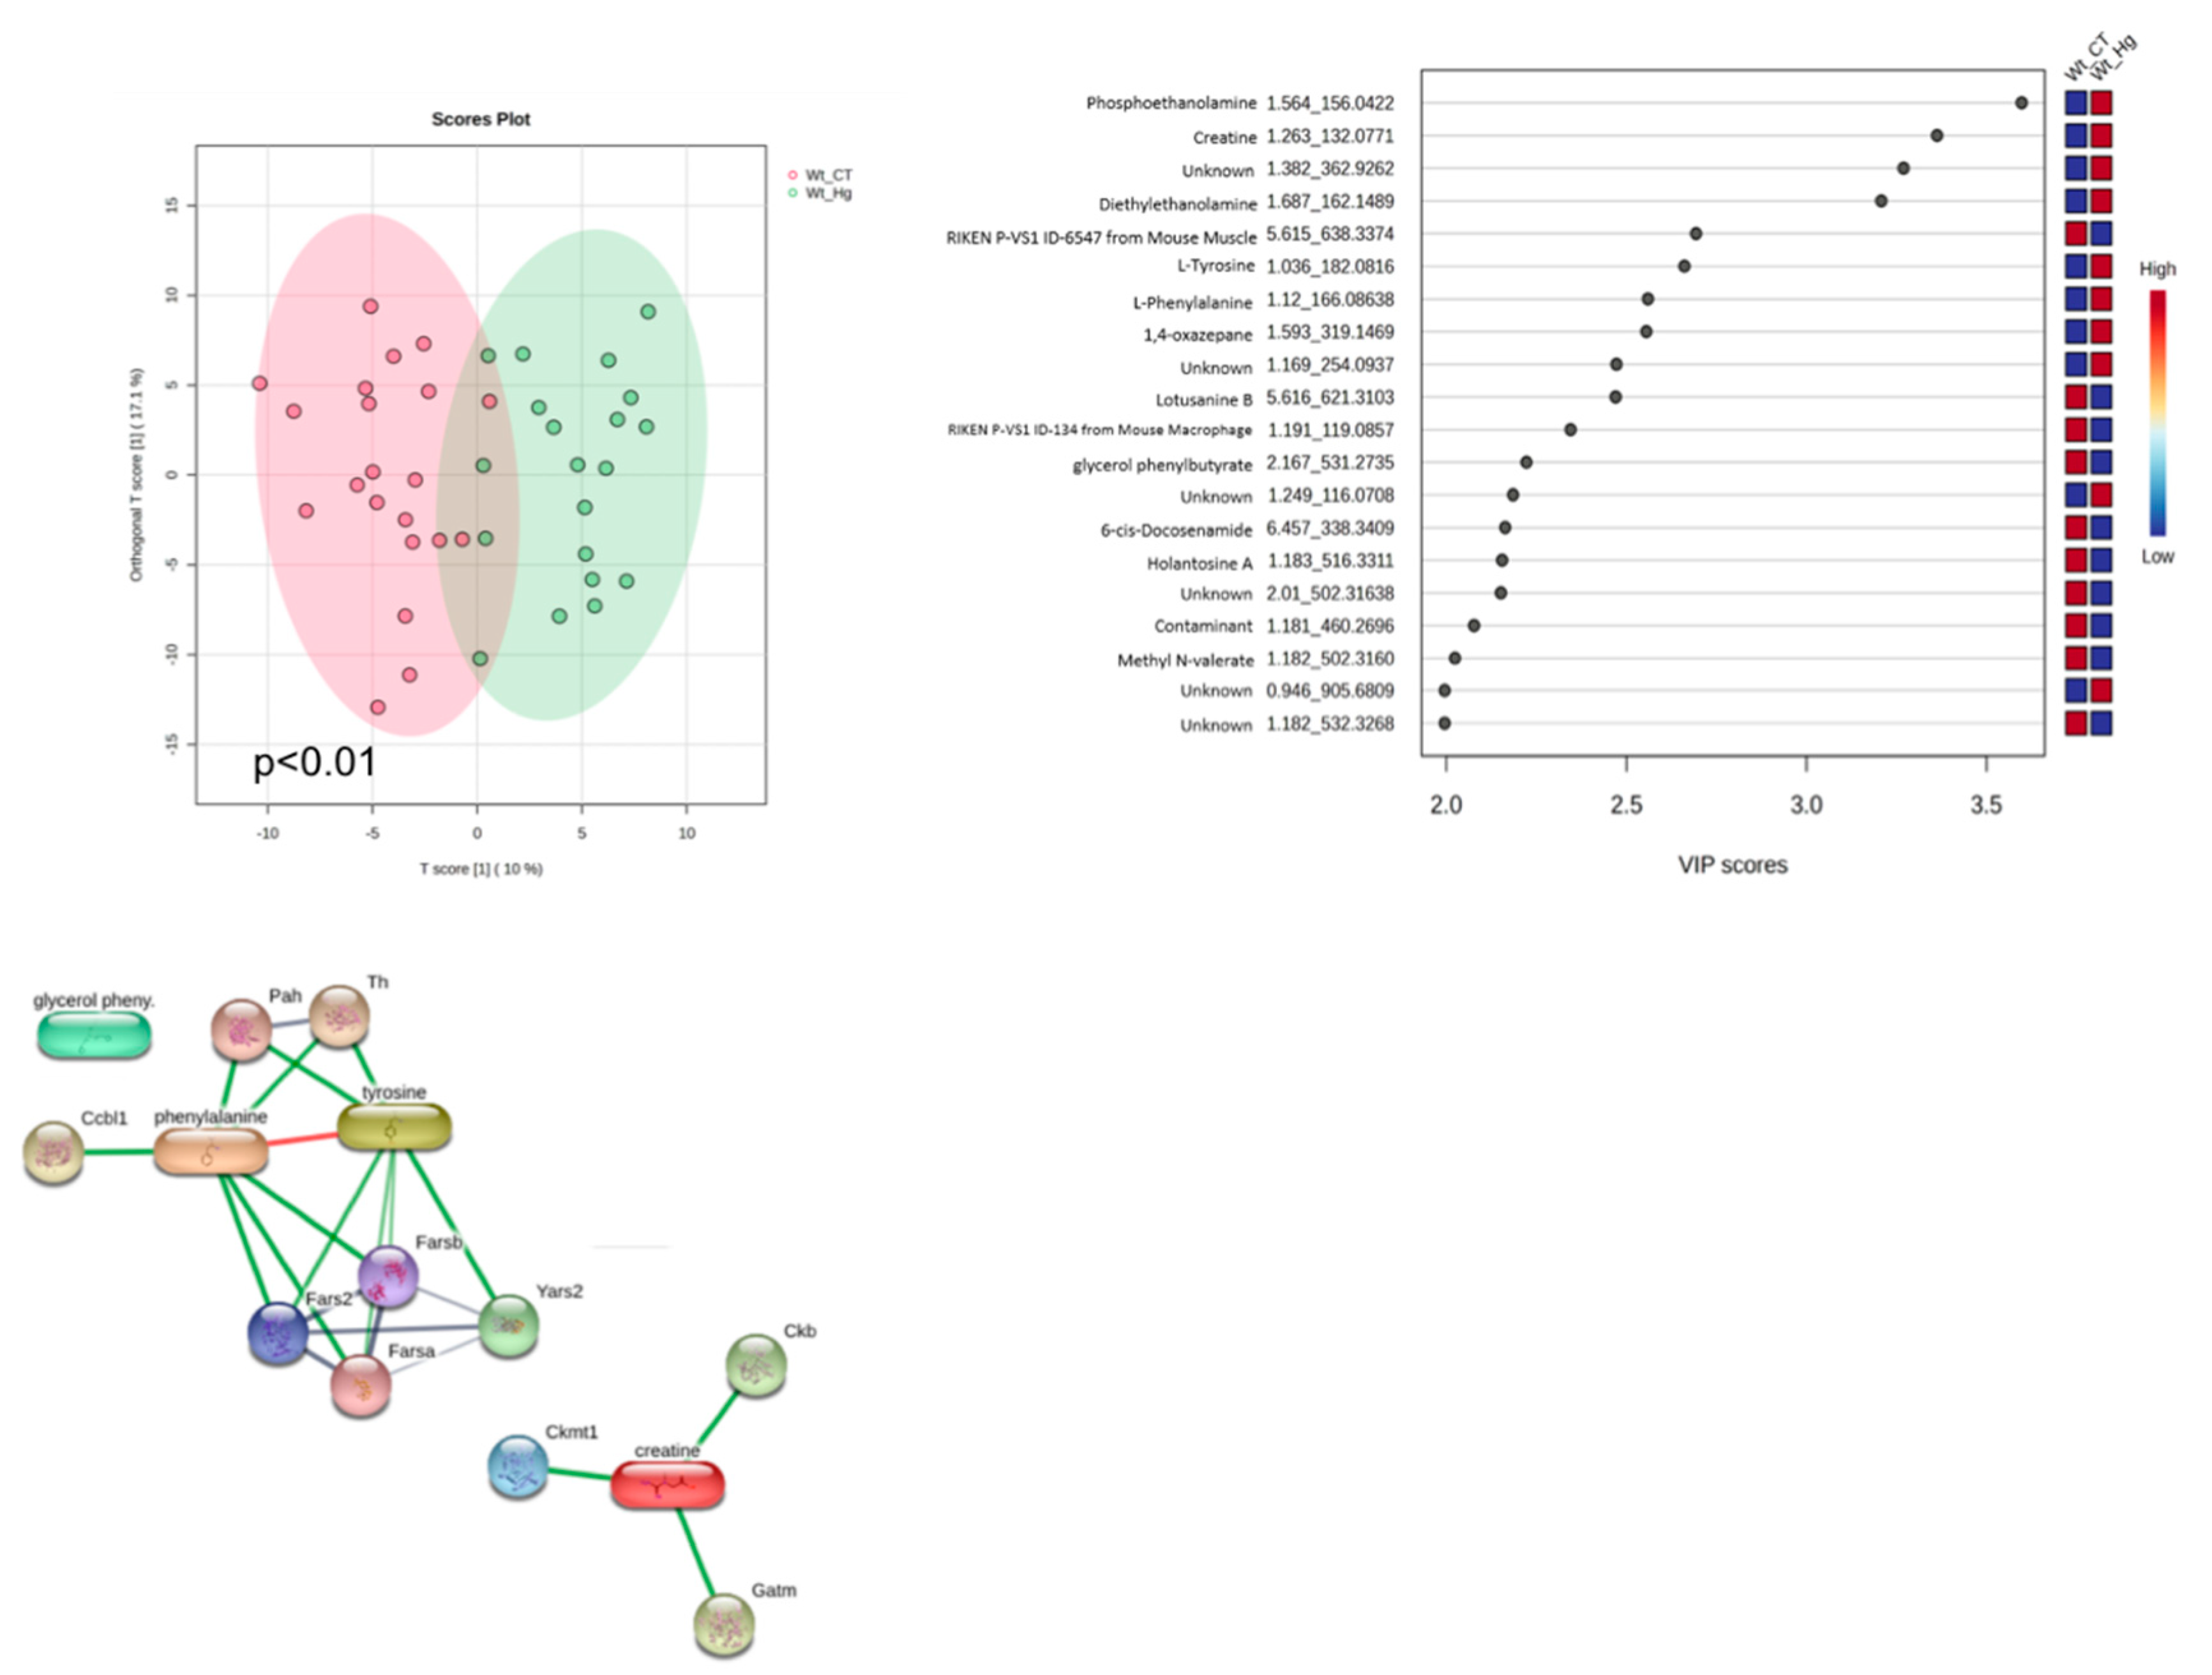
On the biological scenario related to the wild-type mice – WT CT vs. WT MeHg, we observe a low permutation value (p<0.01) in the orthogonal partial least squares-discriminant analysis (oPLS-DA), and the metabolites were able to discriminate the proposed model (Figure 7A). The metabolites phosethanolamine, creatine, and diethylethanolamine have VIP scores higher than 3 and are highly discriminant for the WT MeHg scenario. Also, the metabolites L-tyrosine, L-phenylalanine, and 1-4 oxazepane have high and discriminant VIP scores for the WT MeHg scenario, as shown in Figure 7B. An interactome map of the VIP metabolites is displayed in Figure 7C and we can observe that the amino acids interacting in the same node (Figure 7C).

4. Discussion

To the best of our knowledge, this is the first study that investigated the impact of MeHg intoxication on the function and structure of a metabolic-active EWF in ApoE-deficient animals. The study intended to address how MeHg and ApoE deficiency alone or in combination affect EWF and liver tissues and assess whether ApoE deficiency and MeHg intoxication show compounded deleterious effects. ApoE ko mice are well-recognized to show spontaneous dyslipidemia, even early in life [15].
As expected, MeHg-exposed mice had significantly higher concentrations of Hg in the fur, epididymal adipose tissue, and liver than the non-exposed groups, confirming the disseminated toxicity of the experimental model. Of note, Rizzetti et al could not find higher significant Hg deposition in the epididymal adipose tissue from exposed mice (challenged by 20mg/L of mercury chloride (HgCl2) in drinking water) compared to unchallenged mice [19]. This difference is probably due to MeHg's greater capacity to overcome cellular barriers than Hg [7].
Although we could find reduced weight gain in intoxicated C57BL/6J mice when compared to their non-intoxicated controls, this is not a universal finding in MeHg intoxication studies. Ferrer and colleagues found that when 8-week-old C57BL/6J mice were chronically exposed to lower doses of MeHg (0.5 or 5 mg/L in drinking water), they did not show changes in body weight. However, they reported that it did affect the expression of hypothalamic neuropeptides (which participate in food intake and body weight control) and increased the anorectic neuropeptide pro-opiomelanocortin (POMC) in a dose-dependent manner [20].
Exposure to heavy metals to adipose tissue is considered biphasic and may range from increased adipogenesis in chronic low dose exposures to inhibition of adipose tissue differentiation in higher doses [21], which may partly explain our findings.
In our study, intoxication with MeHg did not alter plasma triglyceride levels in wild-type and ApoE ko mice compared to their non-intoxicated controls. Nonetheless, triglyceride levels were higher in apoE ko mice regardless of MeHg exposure. Roque and colleagues found that 20mg/L of MeHg in drinking water induced hypertriglyceridemia in wild-type mice. This MeHg effect was augmented by ApoE deficiency [15].
Additionally, ApoE ko mice displayed significantly greater levels of cholesterol when compared to wild-type controls, and MeHg-challenged ApoE ko mice showed even more pronounced hypercholesterolemia. From these findings, we could hypothesize that long-term MeHg exposure may be more harmful to dyslipidemic individuals. Mounting evidence indicates worsening cardiovascular risk and accelerated atherosclerosis in ApoE ko mice [22]. Chronic MeHg intoxication may raise total blood cholesterol due to increased atherogenic or non-HDL fraction [22]. MeHg seems to bind to sulfhydryl groups in the main apoprotein of the non-HDL fraction (apoB-100), which can induce conformational rearrangements that compromise binding with its receptors [23]. Reduced LDL intake would contribute to a further rise in serum total cholesterol levels [22].
In our protocol, AST and ALT were not significantly altered with MeHg exposure, which may not rule out subtle hepatotoxicity and perhaps later effects outside the study's timeframe. Although with another form of Hg intoxication, one study showed that HgCl2-treated mice (subcutaneous dose of 4.6 mg/kg for three consecutive days) did not exhibit changes in liver aminotransferase activities [24]. Yet, ApoE ko mice presented an increase in ALT and AST levels compared to non-intoxicated wild-type mice, with amplifying effects following MeHg intoxication, which suggests that dyslipidemic (increase in ALT, but not AST) mice are vulnerable to liver damage by MeHg. Hypercholesterolemic ApoE ko mice are at a higher probability of developing severe liver injury later, suggesting that increased oxidative stress and cholesterol products may act as a catalyzer in the process of liver aging [25].
Our findings did not show significant MeHg-induced liver steatosis in wild-type mice; however, MeHg led to hepatic steatosis in ApoE-deficient mice, suggesting that a previous dyslipidemia state could predispose to this alteration. Leocadio and colleagues were able to detect nonalcoholic steatosis in the liver with increased Kupffer cell counts after exposing mice to a higher dose of MeHg (20mg/L in the drinking water) for two weeks in wild-type mice [26]. This later finding reinforces the need for a more robust intoxication to trigger a significant liver pathology. Of note, Wistar rats, when treated with 5 mg/kg/day of MeHg and 1 mg/kg/day of diphenyl diselenide given intragastrically for 21 days, showed increased Hg accumulation in the liver and brain, leading to motor deficits and weight loss [27].
The increase in oxidative stress and reactive oxygen species causes numerous toxic effects of MeHg. MeHg (0.5 mg/kg/day) for about 40 days significantly increased SOD, glutathione transferase, glutathione, and carbonyl activity [28]. In our study, liver TBARS levels were augmented as a proxy of oxidative stress due to MeHg intoxication, corroborating with a strong body of evidence. Although ApoE deficiency did show higher TBARS levels than MeHg-exposed wild-type mice, this difference did not reach a significance level. Our data showed increased liver SOD activity as well; that effect may be partly explained by a compensatory effect to counterbalance the increased oxidative stress to better neutralize excess free radicals [29].
Regarding lipid metabolism and plasticity, MeHg did not change the EWF weight, plasma leptin levels, and mean adipocyte size in wild-type mice. MeHg compounded with ApoE deficiency reduced overall EWF and mean adipocyte size compared to challenged wild-type mice, reflected by increased plasma total cholesterol, triglycerides, and tested liver transaminases.
Reduced absolute and relative weight of EWT and adipocyte size mice were seen with more prolonged mercury (HgCl2) intoxication and at low doses. In addition, HgCl2 was recognized as a potent environmental disruptor of the white adipose tissue by reducing the mean adipocyte size, affecting adipogenesis, adipokine synthesis, and secretion [19]. We have documented a synergistic effect of ApoE deficiency and MeHg intoxication, reducing adipocyte mean diameter in EWF.
Furthermore, mice fed a high-fat diet and injected subcutaneously with HgCl2 (1.0 mg/kg) showed decreased adipocyte size in males [30]. MeHg (5mg/L) for 30 days was able to induce anorexia in C57BL/6J wild-type mice. MeHg intoxication has been associated with an altered leptin-induced Janus kinase 2 (JAK2)/STAT3 signaling pathway in the hypothalamus [31]. Interestingly, HgCl2 treatment significantly decreased serum leptin levels with downregulation of leptin mRNA expression in white adipose tissue [30]. When adipose tissue is transplanted from ApoE ko mice into wild-type recipients after being fed a standard chow or high-fat diet for 8 to 10 weeks, transplanted ApoE ko adipocytes were found significantly smaller than transplanted wild-type adipocytes after receiving a standard chow diet while following a high-fat diet the size of transplanted wild-type adipocytes increased by 106 × 103 μm3 and the size of ApoE ko adipocytes increased by only 19 × 103 μm3 [32].
ApoE is highly expressed in adipocytes, which positively correlates with body fat mass. Conversely, ApoE deficiency in adipose cells compromises lipoprotein internalization and triglyceride accumulation in the tissue. ApoE-deficient lipoproteins cannot induce preadipocytes to form lipid-filled round adipocytes [33]. Furthermore, when challenged with a high-fat and a high-sucrose diet, lower adiposity, and higher insulin sensitivity are seen in ApoE ko mice compared to ApoE-sufficed mice. The authors related the findings to reduced lipid transport to insulin-sensitive tissues, improving diet-induced obesity and insulin resistance in these animals [34]. These findings corroborate our lower epididymal adipose tissue mass seen in the non-intoxicated ApoE ko mice.
In our study, we found an EWF-increased activity of creatine, L-phenylalanine, and L-tyrosine in a scenario of MeHg intoxication in wild-type mice. Creatine-dependent ADP/ATP substrate cycling has been identified in thermogenic beige adipocytes with UCP-1 involvement [35]. It would be interesting to know whether chronic MeHg exposure could augment the number of beige adipocytes in EWF. L-tyrosine serum levels are elevated after long-distance aerobic exercise, with increased glucose and lipid metabolism [36]. A high fat-induced mouse model of metabolic dysfunction-associated liver steatosis revealed that L-phenylalanine and L-tyrosine levels in liver samples were reduced when compared to the control group. Yu and colleagues have shown that L-phenylalanine and L-tyrosine were negatively associated with the levels of ALT, AST, perineal fat, and epididymal fat, but were positively associated with bacteria of the genus Muribaculaceae in metabolomic analysis of cecum samples [37].
In our metabolomics studies, we found increased EWF activity of L-acylcarnitine sphingomyelin, taurine, and hexaethyleneglycol in the context of double challenge with ApoE deficiency and MeHg intoxication. Interestingly, the L-carnitine and acylcarnitine pathway is involved in the generation of trimethylamine oxide (TMAO) following trimethylamine (TMA) oxidation by liver flavin-containing monooxygenases. TMA is produced by the intestinal microbiota. TMAO is considered a biomarker of atherosclerosis, as it disrupts the reverse cholesterol transport and increased the accumulation of foam cells in the arterial plaques [38]. Elevated blood concentrations of L-acylcarnitine are also indicative of fatty acid oxidation disorders [39]. In addition, it has been recognized that sphingomyelin plasma levels correlate with coronary heart disease even independently of cholesterol plasma levels and the blockage of sphingomyelin activity could reduce atherosclerosis in ApoE ko mice [40]. Conversely, taurine supplementation is associated with improved adipose tissue metabolism and lipolysis and aging-related diseases [41], and hexaethyleneglycol is considered a ligand of the Toll-like-9 receptor [42] which may be compensatory mechanisms in the context of systemic adipose function. Plausible interactions of paracrine and systemic EWF function of these metabolites remain elusive.
The elevated levels of MeHg in the fur of mice in comparison to average human hair concentrations in worldwide populations is a limiting factor in our study. However, it is important to highlight that severe anthropogenic-related environmental disasters have increased substantially [3], which can cause alarming levels of Hg contamination in water reservoirs to adjacent communities.

5. Conclusions

Altogether, our results suggest that ApoE deficiency and MeHg intoxication negatively affect the structure and function of white adipose tissue with liver toxicity. More studies are warranted to investigate the fine crosstalk signaling mechanisms underlying these modifications in ApoE ko mice. The better understanding of negative interactions of dyslipidemia and MeHg intoxication are key for building efficacious nutritional interventions to mitigate any compound deleterious effects in highly exposed human populations.

Author Contributions

All authors have read and agreed to the published version of the manuscript.

Funding

This research was funded by Projeto Universal, grant number 402738/2021-7 Research call CNPq/MCTI/FNDCT No. 18/2021. We would like also to thank Fundação Edson Queiroz for funding support.

Acknowledgments

The authors would like to acknowledge the support from the Brazilian funding agencies Fundação Cearense de Apoio ao Desenvolvimento Científicoe Tecnológico (FUNCAP) and Coordenação de Aperfeiçoamento de Pessoal de Nível Superior (CAPES) Brazilian funding agencies for their financial support.

Conflicts of Interest

The authors declare no conflict of interest. The funders had no role in the design of the study; in the collection, analyses, or interpretation of data; in the writing of the manuscript; or in the decision to publish the results.

References

  1. EPA. United States Evironmental Protection Agency. 2023. Basic Information about Mercury.
  2. Hudelson KE, Drevnick PE, Wang F, Armstrong D, Fisk AT. Mercury methylation and demethylation potentials in Arctic lake sediments. Chemosphere. 2020 Jun;248:126001. [CrossRef]
  3. Raposo R da S, Pinto DV, Moreira R, Dias RP, Fontes Ribeiro CA, Oriá RB, et al. Methylmercury Impact on Adult Neurogenesis: Is the Worst Yet to Come From Recent Brazilian Environmental Disasters? Front Aging Neurosci. 2020 Nov 23;12.
  4. Giang A, Selin NE. Benefits of mercury controls for the United States. Proceedings of the National Academy of Sciences. 2016 Jan 12;113(2):286–91. [CrossRef]
  5. Wang X, Mukherjee B, Park SK. Associations of cumulative exposure to heavy metal mixtures with obesity and its comorbidities among U.S. adults in NHANES 2003–2014. Environ Int. 2018 Dec;121:683–94. [CrossRef]
  6. Novo JP, Martins B, Raposo RS, Pereira FC, Oriá RB, Malva JO, et al. Cellular and Molecular Mechanisms Mediating Methylmercury Neurotoxicity and Neuroinflammation. Int J Mol Sci. 2021 Mar 18;22(6):3101. [CrossRef]
  7. Crespo-López ME, Macêdo GL, Pereira SID, Arrifano GPF, Picanço-Diniz DLW, Nascimento JLM do, et al. Mercury and human genotoxicity: Critical considerations and possible molecular mechanisms. Pharmacol Res. 2009 Oct;60(4):212–20. [CrossRef]
  8. Francis CE, Allee L, Nguyen H, Grindstaff RD, Miller CN, Rayalam S. Endocrine disrupting chemicals: Friend or foe to brown and beige adipose tissue? Toxicology. 2021 Nov;463:152972.
  9. Egger AE, Grabmann G, Gollmann-Tepeköylü C, Pechriggl EJ, Artner C, Türkcan A, et al. Chemical imaging and assessment of cadmium distribution in the human body. Metallomics. 2019;11(12):2010–9. [CrossRef]
  10. Freire C, Vrhovnik P, Fiket Ž, Salcedo-Bellido I, Echeverría R, Martín-Olmedo P, et al. Adipose tissue concentrations of arsenic, nickel, lead, tin, and titanium in adults from GraMo cohort in Southern Spain: An exploratory study. Science of The Total Environment. 2020 Jun;719:137458. [CrossRef]
  11. Huang Y, Mahley RW. Apolipoprotein E: Structure and function in lipid metabolism, neurobiology, and Alzheimer’s diseases. Neurobiol Dis. 2014 Dec;72:3–12. [CrossRef]
  12. Arrifano G de PF, Oliveira MA de, Souza-Monteiro JR, Paraense RO, Ribeiro-Dos-Santos A, Vieira JRDS, et al. Role for apolipoprotein E in neurodegeneration and mercury intoxication. Frontiers in Bioscience. 2018;10(1):819.
  13. Pereira LC, Nascimento JCR, Rêgo JMC, Canuto KM, Crespo-Lopez ME, Alvarez-Leite JI, et al. Apolipoprotein E, periodontal disease and the risk for atherosclerosis: a review. Arch Oral Biol. 2019 Feb;98:204–12. [CrossRef]
  14. Liu L, Shi Z, Ji X, Zhang W, Luan J, Zahr T, et al. Adipokines, adiposity, and atherosclerosis. Cellular and Molecular Life Sciences. 2022 May 3;79(5):272.
  15. Roque CR, Sampaio LR, Ito MN, Pinto D V., Caminha JSR, Nunes PIG, et al. Methylmercury chronic exposure affects the expression of DNA single-strand break repair genes, induces oxidative stress, and chromosomal abnormalities in young dyslipidemic APOE knockout mice. Toxicology. 2021 Dec;464:152992. [CrossRef]
  16. Andersen HR, Andersen O. Effects of Dietary α-Tocopherol and β-Carotene on Lipid Peroxidation Induced by Methyl Mercuric Chloride in Mice. Pharmacol Toxicol. 1993 Oct 25;73(4):192–201.
  17. Lowry OliverH, Rosebrough NiraJ, Farr AL, Randall RoseJ. PROTEIN MEASUREMENT WITH THE FOLIN PHENOL REAGENT. Journal of Biological Chemistry. 1951 Nov;193(1):265–75.
  18. Kleiner DE, Brunt EM, Van Natta M, Behling C, Contos MJ, Cummings OW, et al. Design and validation of a histological scoring system for nonalcoholic fatty liver disease. Hepatology. 2005 Jun;41(6):1313–21. [CrossRef]
  19. Rizzetti DA, Corrales P, Piagette JT, Uranga-Ocio JA, Medina-Gomez G, Peçanha FM, et al. Chronic mercury at low doses impairs white adipose tissue plasticity. Toxicology. 2019 Apr;418:41–50. [CrossRef]
  20. Ferrer B, Peres TV, dos Santos AA, Bornhorst J, Morcillo P, Gonçalves CL, et al. Methylmercury Affects the Expression of Hypothalamic Neuropeptides That Control Body Weight in C57BL/6J Mice. Toxicological Sciences. 2018 Jun 1;163(2):557–68. [CrossRef]
  21. Tinkov AA, Aschner M, Ke T, Ferrer B, Zhou JC, Chang JS, et al. Adipotropic effects of heavy metals and their potential role in obesity. Fac Rev. 2021 Mar 26;10. [CrossRef]
  22. Silva JL, Leocádio PCL, Reis JM, Campos GP, Capettini LSA, Foureaux G, et al. Oral methylmercury intoxication aggravates cardiovascular risk factors and accelerates atherosclerosis lesion development in ApoE knockout and C57BL/6 mice. Toxicol Res. 2021 Jul 5;37(3):311–21. [CrossRef]
  23. Rutledge AC, Su Q, Adeli K. Apolipoprotein B100 biogenesis: a complex array of intracellular mechanisms regulating folding, stability, and lipoprotein assembly. This paper is one of a selection of papers published in this special issue entitled “Canadian Society of Biochemistry, Molecular & Cellular Biology 52nd Annual Meeting — Protein Folding: Principles and Diseases” and has undergone the Journal’s usual peer review process. Biochemistry and Cell Biology. 2010 Apr;88(2):251–67.
  24. Brandão R, Santos FW, Farina M, Zeni G, Bohrer D, Rocha JBT, et al. Antioxidants and metallothionein levels in mercury-treated mice. Cell Biol Toxicol. 2006 Nov 11;22(6):429–38. [CrossRef]
  25. Bonomini F, Rodella LF, Moghadasian M, Lonati C, Rezzani R. Apolipoprotein E deficiency and a mouse model of accelerated liver aging. Biogerontology. 2013 Apr 18;14(2):209–20. [CrossRef]
  26. Lacerda Leocádio PC, Dias RP, Pinto DV, Reis JM, Rodrigues Nascimento JC, Anne de Castro Brito G, et al. Pollutants and nutrition: Are methylmercury effects on blood pressure and lipoprotein profile comparable to high-fat diet in mice? Ecotoxicol Environ Saf. 2020 Nov;204:111036.
  27. Dalla Corte CL, Ramos A, dos Santos CMM, Dressler VL, da Rocha JBT. Selenium and mercury levels in rat liver slices co-treated with diphenyl diselenide and methylmercury. BioMetals. 2016 Jun 2;29(3):543–50. [CrossRef]
  28. Rosa-Silva HT da, Panzenhagen AC, Schmidtt V, Alves Teixeira A, Espitia-Pérez P, de Oliveira Franco Á, et al. Hepatic and neurobiological effects of foetal and breastfeeding and adulthood exposure to methylmercury in Wistar rats. Chemosphere. 2020 Apr;244:125400. [CrossRef]
  29. Kumar A, Khushboo, Pandey R, Sharma B. Modulation of Superoxide Dismutase Activity by Mercury, Lead, and Arsenic. Biol Trace Elem Res. 2020 Aug 10;196(2):654–61. [CrossRef]
  30. Kawakami T, Hanao N, Nishiyama K, Kadota Y, Inoue M, Sato M, et al. Differential effects of cobalt and mercury on lipid metabolism in the white adipose tissue of high-fat diet-induced obesity mice. Toxicol Appl Pharmacol. 2012 Jan;258(1):32–42. [CrossRef]
  31. Ferrer B, Prince LM, Tinkov AA, Santamaria A, Farina M, Rocha JB, et al. Chronic exposure to methylmercury enhances the anorexigenic effects of leptin in C57BL/6J male mice. Food and Chemical Toxicology. 2021 Jan;147:111924. [CrossRef]
  32. Huang ZH, Gu D, Mazzone T. Role of adipocyte-derived apoE in modulating adipocyte size, lipid metabolism, and gene expression in vivo. American Journal of Physiology-Endocrinology and Metabolism. 2009 May;296(5):E1110–9. [CrossRef]
  33. Li Y hong, Liu L. Apolipoprotein E synthesized by adipocyte and apolipoprotein E carried on lipoproteins modulate adipocyte triglyceride content. Lipids Health Dis. 2014 Dec 23;13(1):136.
  34. Hofmann SM, Perez-Tilve D, Greer TM, Coburn BA, Grant E, Basford JE, et al. Defective Lipid Delivery Modulates Glucose Tolerance and Metabolic Response to Diet in Apolipoprotein E–Deficient Mice. Diabetes. 2008 Jan 1;57(1):5–12. [CrossRef]
  35. Kazak L, Chouchani ET, Jedrychowski MP, Erickson BK, Shinoda K, Cohen P, et al. A Creatine-Driven Substrate Cycle Enhances Energy Expenditure and Thermogenesis in Beige Fat. Cell. 2015 Oct;163(3):643–55. [CrossRef]
  36. Shi R, Zhang J, Fang B, Tian X, Feng Y, Cheng Z, et al. Runners’ metabolomic changes following marathon. Nutr Metab (Lond). 2020 Dec 13;17(1):19. [CrossRef]
  37. Yu Y, Zeng F, Han P, Zhang L, Yang L, Zhou F, et al. Dietary chlorogenic acid alleviates high-fat diet-induced steatotic liver disease by regulating metabolites and gut microbiota. Int J Food Sci Nutr. 2024 Feb 22;1–16. [CrossRef]
  38. Koeth RA, Wang Z, Levison BS, Buffa JA, Org E, Sheehy BT, et al. Intestinal microbiota metabolism of l-carnitine, a nutrient in red meat, promotes atherosclerosis. Nat Med. 2013 May 7;19(5):576–85. [CrossRef]
  39. McCann MR, George De la Rosa MV, Rosania GR, Stringer KA. L-Carnitine and Acylcarnitines: Mitochondrial Biomarkers for Precision Medicine. Metabolites. 2021 Jan 14;11(1):51. [CrossRef]
  40. Park TS, Panek RL, Mueller SB, Hanselman JC, Rosebury WS, Robertson AW, et al. Inhibition of Sphingomyelin Synthesis Reduces Atherogenesis in Apolipoprotein E–Knockout Mice. Circulation. 2004 Nov 30;110(22):3465–71. [CrossRef]
  41. Piña-Zentella G, de la Rosa-Cuevas G, Vázquez-Meza H, Piña E, de Piña MZ. Taurine in adipocytes prevents insulin-mediated H2o2 generation and activates Pka and lipolysis. Amino Acids. 2012 May 3;42(5):1927–35. [CrossRef]
  42. Putta MR, Yu D, Bhagat L, Wang D, Zhu FG, Kandimalla ER. Impact of Nature and Length of Linker Incorporated in Agonists on Toll-Like Receptor 9-Mediated Immune Responses. J Med Chem. 2010 May 13;53(9):3730–8. [CrossRef]
Figure 1. Effect of oral administration of MeHg (20 mg/L) for 20 days on Hg concentration in hair (A), liver (B), and epididymal adipose tissue (C) of young ApoE ko and wild-type mice. Results are expressed as mean ± SEM by two-way ANOVA. N of at least ten mice per group. *p<0.05, ***p<0.001.
Preprints 106532 g001
Figure 2. Effect of oral administration of MeHg (20 mg/L) for 20 days on delta weight gain (A), weekly body weight gain, (B) plasma triglycerides (C) and total cholesterol (D) from ApoE ko and wild-type mice. Results are expressed as mean ± SEM by two-way ANOVA. N of at least six mice per group. **p<0.01. (B) a: CT x ApoE CT, b: ApoE ko CT x ApoE ko MeHg.
Preprints 106532 g002
Figure 3. Effect of oral administration of MeHg (20 mg/L) for 20 days on plasma concentrations of AST (A) and ALT (B), TBARS, and SOD concentrations in liver tissue wild type and ApoE ko adult mice. Results are expressed as mean ± SEM by two-way ANOVA. N of at least six mice per group. **p<0.01.
Preprints 106532 g003
Figure 4. Effect of oral administration of MeHg (20 mg/L) for 20 days on e EWF (A), leptin plasma concentration (B), adipose mean diameter (C, D) of wild-type mice and ApoE ko adults. Results are expressed as mean ± SEM by two-way ANOVA. N of at least six mice per group. *p<0.05, **p<0.01.
Preprints 106532 g004
Figure 5. Metabolomics data analysis for all biological scenarios: ApoE ko CT vs. ApoE ko MeHg vs. WT CT vs. WT MeHg. A. Partial least squares-discriminant analysis (PLS-DA) of all biological scenarios. B. Variable importance in projection (VIP) scores of all biological scenarios, with their denotation including, metabolite name, experimental retention time and experimental monoisotopic mass. C. Heatmap with the molecular features displayed within their biological. clusters. D. Interactome analysis of VIP metabolites of all biological scenarios (node size≥2; edge confidence: medium=0.400).
Preprints 106532 g005
Figure 6. Metabolomics data analysis for ApoE ko CT vs. ApoE ko MeHg biological scenario. A. Orthogonal partial least squares-discriminant analysis (oPLS-DA). B. Variable importance in projection (VIP) scores, with their denotation including, metabolite name, experimental retention time and experimental monoisotopic mass. C. Interactome analysis of VIP metabolites (node size≥2; edge confidence: medium=0.400).
Preprints 106532 g006
Figure 7. Metabolomics data analysis for WT CT vs. WT MeHg biological scenario. A. Orthogonal partial least squares-discriminant analysis (oPLS-DA). B. Variable importance in projection (VIP) scores, with their denotation including, metabolite name, experimental retention time and experimental monoisotopic mass. C. Interactome analysis of VIP metabolites (node size≥2; edge confidence: medium=0.400).
Preprints 106532 g007
Table 1. Effects of mercury intoxication (20 mg/L in drinking water) on histopathological scores in the liver of wild-type C57BL6/J and adult ApoE ko mice.
Groups Steatosis Ballooning
CT 0 (0-0) 0 (0-1)
MeHg 0 (0-0) 0 (0-2)
ApoE ko CT 0 (0-1) 1 (0-2)
ApoE ko MeHg 0 (0-1)a,b 1 (0-2)b
a <0.05 compared to ApoE ko CT. b p<0.05 compared to CT.
Disclaimer/Publisher’s Note: The statements, opinions and data contained in all publications are solely those of the individual author(s) and contributor(s) and not of MDPI and/or the editor(s). MDPI and/or the editor(s) disclaim responsibility for any injury to people or property resulting from any ideas, methods, instructions or products referred to in the content.
Copyright: This open access article is published under a Creative Commons CC BY 4.0 license, which permit the free download, distribution, and reuse, provided that the author and preprint are cited in any reuse.
Prerpints.org logo

Preprints.org is a free preprint server supported by MDPI in Basel, Switzerland.

Subscribe

© 2024 MDPI (Basel, Switzerland) unless otherwise stated