Preprint
Article

Identifying Robust Biomarker Panels for Breast Cancer Screening

Altmetrics

Downloads

162

Views

162

Comments

0

Submitted:

14 May 2024

Posted:

15 May 2024

You are already at the latest version

Alerts
Abstract
Breast cancer remains a major public health concern, and early detection can result in more treatment options, which are crucial for improving survival rates. Metabolomics offers the potential to develop blood-based screening and diagnostics tools that are less invasive and more cost-effective. However, the inherent complexity of metabolomic datasets makes identifying the most diagnostically relevant biomarkers a difficult task, with multiple studies demonstrating lim-ited agreement on the specific metabolites and pathways involved. This study aims to identify a set of biomarkers for early diagnosis of breast cancer using metabolomics data. Plasma samples from 185 breast cancer patients and 53 controls (CHTN) were analyzed. We utilized univariate Naïve Bayes, L2-regularized Support Vector Machines, and Principal Component Analysis (PCA), along with feature engineering techniques, to select the most informative features. Multiple ma-chine learning models, including Support Vector Machines, Multidimensional Scaling, Logistic Regression, and Ensemble Learning were utilized for classification. The best-performing feature set comprised 4 biomarkers and 2 demographic variables, achieving an accuracy of 98%, demon-strating the potential for a robust, cost-effective, non-invasive breast cancer screening and diagnostic tool.
Keywords: 
Subject: Medicine and Pharmacology  -   Oncology and Oncogenics

1. Introduction

Internationally, breast cancer continues to be the primary cause of mortality in women, surpassing both lung and skin cancers. The American Society of Clinical Oncology (2024) predicts that there will be a remarkable 297,790 new instances of invasive breast cancer and 55,720 cases of non-invasive breast cancer in the United States in 2024 [1]. Additionally, 2,800 cases are expected to be detected in men. Furthermore, there are currently more than 3.8 million women who are either living with or have survived this disease. Early identification is essential for successful therapy and possibly halting the advancement of a condition. However, existing techniques such as mammography, which are mostly advised for women between the ages of 40 and 75, have several drawbacks. False positives, a common issue in lung cancer screening, also afflict mammography, resulting in unneeded biopsies, stress, discomfort, and radiation exposure. In addition, excluding younger or older individuals from routine cancer screenings risks missing a significant number of cancer cases. The invasive nature of biopsies currently employed to detect and analyze tumor biomarkers highlights the critical need for non-invasive methods for early-stage breast cancer detection. Such advancements would facilitate prompt, targeted interventions, potentially mitigating mortality risks associated with late diagnosis [2].
Metabolites, the small biomolecules that act as distinct chemical markers of our metabolic activities, have great potential to enhance the accuracy and precision of breast cancer screening and early diagnosis. Alteration of the metabolomics profile of an individual is often arise from a change in a gene, whether that be a gene mutation, over-expression, or downregulation, and these changes eventually could facilitate cancer development. Metabolites are also closely linked to the phenotype of an organism, and which can have a significant impact on the human health. Knowing that breast cancer is a highly complex and heterogenous disease with an array of clinical presentation and responses to therapy, metabolomic profiling of breast cancer patients offers a robust way of capturing a patient’s phenotype. This makes it especially useful for monitoring individuals at all risk levels, including those who are not in the normal screening age categories. While univariate and multivariate analyses of metabolite datasets from urine samples have shown promise, the need for more robust approaches has been highlighted [3].
Through the utilization of machine learning and deep learning algorithms on metabolomics data, it is possible to conceive the creation of models that may identify breast cancer and potentially different subtypes of cancers even prior to the manifestation of symptoms. Comprehensive metabolite profiling offers important perspectives on the fundamental processes driving cancer cell growth. Tumor cells exhibit altered metabolic profiles that indicate their increased energy demands, enhanced proliferation, and capacity to avoid programmed cell death. These alterations are observed in the levels of metabolites associated with many processes, including glycolysis, lipid metabolism, and amino acid metabolism. Glycolysis promotes the uptake of glucose and the production of lactate to support rapid cell division [4]. The process of synthesizing fatty acids to aid in the formation of cell membranes and enable cellular communication modifies lipid metabolism [5]. Heightened utilization of glutamine for anabolic functions and altered amino acid compositions, such as protein synthesis and degradation, stimulate metabolic pathways of amino acids [6,7]. By quantitative measure of these metabolites in blood samples and building diagnostic classifiers, we gain insights into the unique energy demands and vulnerabilities of cancer cells, potentially enabling earlier detection and more targeted treatment strategies compared to traditional approaches.
This study proposes a model that can ultimately pave the way towards development of non-invasive, routine, low-cost, and reliable diagnostics tests. We explore the utility of diverse machine learning techniques and statistical methods for breast cancer feature selection and classification. The principal aim of this research is to construct robust, parsimonious, and interpretable models for early-stage breast cancer detection utilizing strategically selected, information-rich metabolomics data. This approach has the potential to offer a safer, more personalized, and readily accessible alternative to established screening methods.

2. Results

We employed unsupervised, supervised, and ensemble machine learning on normalized data and feature subsets to discover top-performing models and the optimal feature set. To ensure a robust biomarker panel, we employed leave-one-out cross-validation on this optimal set and integrated metabolomic ratio between identified metabolites.

2.1. Unsupervised Models

Unsupervised learning algorithms applied to scaled data corroborated the PCA results of low-class separation. A key inference from the K-means clustering algorithm showed that the model exhibits a relatively high recall for the positive class (91%), suggesting that most observations assigned to the breast cancer cluster indeed share similar characteristics. However, the precision is relatively low (40%), thus the clusters are labeling many control patients as breast cancer cases. The F1-score, which is a measure of the harmonic mean of the precision and recall of a classification model, for the positive class is 56%. The negative class, or the control, demonstrates a lower recall (29%) compared to the cancer cases, and higher precision (87%). The F1-score for the control class is 44%. The overall accuracy of the K-Means clustering is 50%, showing that merely half of the observations were correctly assigned to their respective clusters.
Agglomerative clustering yielded similar results, with recall of the positive class reaching 89%, and a much lower negative class value of 28%. Precision of the positive class is lower when compared to the negative class, with values of 38% and 83% respectively. The F1-score for cancer cases is 54% and 42% for control. Overall accuracy is lower than K-Means clustering, at 48%. Multi-dimensional scaling (MDS) performed slightly better than the other unsupervised models, with an accuracy of 54% and an F1-score of 63% and 39% for positive and negative classes, respectively. The positive class recall was 84%, higher than the negative class recall of 28%. The precision of the positive class reached 50%, lower than the negative class, which achieved a value of 66%. In line with PCA, MDS did not find a clean separation between cases.
Gaussian Mixture Models slightly outperformed clustering and MDS algorithms in terms of accuracy (55%). Precision and recall of the positive class reached 48% and 88%, while for the negative class, these metrics were at 77% and 30% respectively. The F1-score for cancer cases was slightly higher at 62% when compared to control – at 43%. A few patterns emerged from the unsupervised learning results: the models tend to have lower precision and higher recall for cancer cases, and a higher F1-score for the positive class. However, the accuracy being in the low 50s suggests that the metabolomic profiles of cancer patients are not easily distinguishable from healthy individuals [8]. Therefore, supervised techniques would be better suited for breast cancer classification.

2.2. Supervised Models

Supervised learning techniques, particularly Naïve Bayes classification models and their variants (Categorical, Gaussian, Multinomial and Bernoulli), have demonstrated superior performance to unsupervised algorithms [9]. Applying cross-validation with Categorical and Bernoulli Naïve Bayes yielded a 75% accuracy on scaled data but could not identify negative classes. Gaussian Naïve Bayes yielded similar accuracy, with precision of 50% and 88% for the negative and positive classes respectively. Recall scores were 78% and 67% for the two classes, with F1-scores of 82% for the negative class and 57% for BC patients. Multinomial Naïve Bayes surpassed the other models with 79% accuracy, and BC cases exhibited higher F1-scores, precision, and recall compared to controls. SVMs are a particularly powerful choice for cancer classification and broader bioinformatics analysis, having proven successful in multiple studies [10,11,12]. A linear-kernel SVMs on the normalized dataset achieved a 94% accuracy and an F1-score of 91%. Precision and recall for the positive class were excellent (95% and 97%), with strong performance for the negative class as well (90% and 82%). Given the high observed correlation between variables, we tested the SVM model on the 9 subsets. The performance of the SVMs with bagging over the 9 data subsets are reported in Table 1.
Using 54 features identified by SVMs feature selection model resulted in perfect scores across all metrics. The 50 features identified by PCA decreased specificity to 25%, and the 15 Naïve Bayes variables lowered sensitivity to 95%. The union sets D, E, F maintained a sensitivity of 100%, but had lower specificity values. Sets D and E reached accuracies of 96%, however at the expense of larger number of variables. Intersection sets had fewer features, with set H achieving an accuracy of 96% while using only 7 variables.
Employing another bagging approach on a decision tree algorithm with 59 variables yielded an accuracy of 90% and an F1-Score of 84%, lower than the comparable SVMs model. Reducing dimensionality of the input data to two PCA and two MDS components led to a decline in accuracy (82%), due to low class separation on the underlying unsupervised models. For a visual representation of the class separation achieved by the models using low dimensional PCA and MDS data, refer to Figure 1.
Multiple studies have shown that ensemble learning often surpasses single-model approaches for classifying breast cancer [13,14,15]. Our experiments support these findings. To exemplify, a voting regressor ensemble (Gradient Boosting, Random Forest and Logistic Regression) performed in line Support Vector Machines on the top 17 features and achieved 92% accuracy, 97% precision, and 93% recall for cancer cases. However, precision (70%) and recall (88%) were lower for control cases. We found further improvements in accuracy when using ensemble models with fewer features. A voting regressor with the same component models achieved 94% accuracy on the 7 features, subset, and a voting classifier reached 92% accuracy using the same feature set.
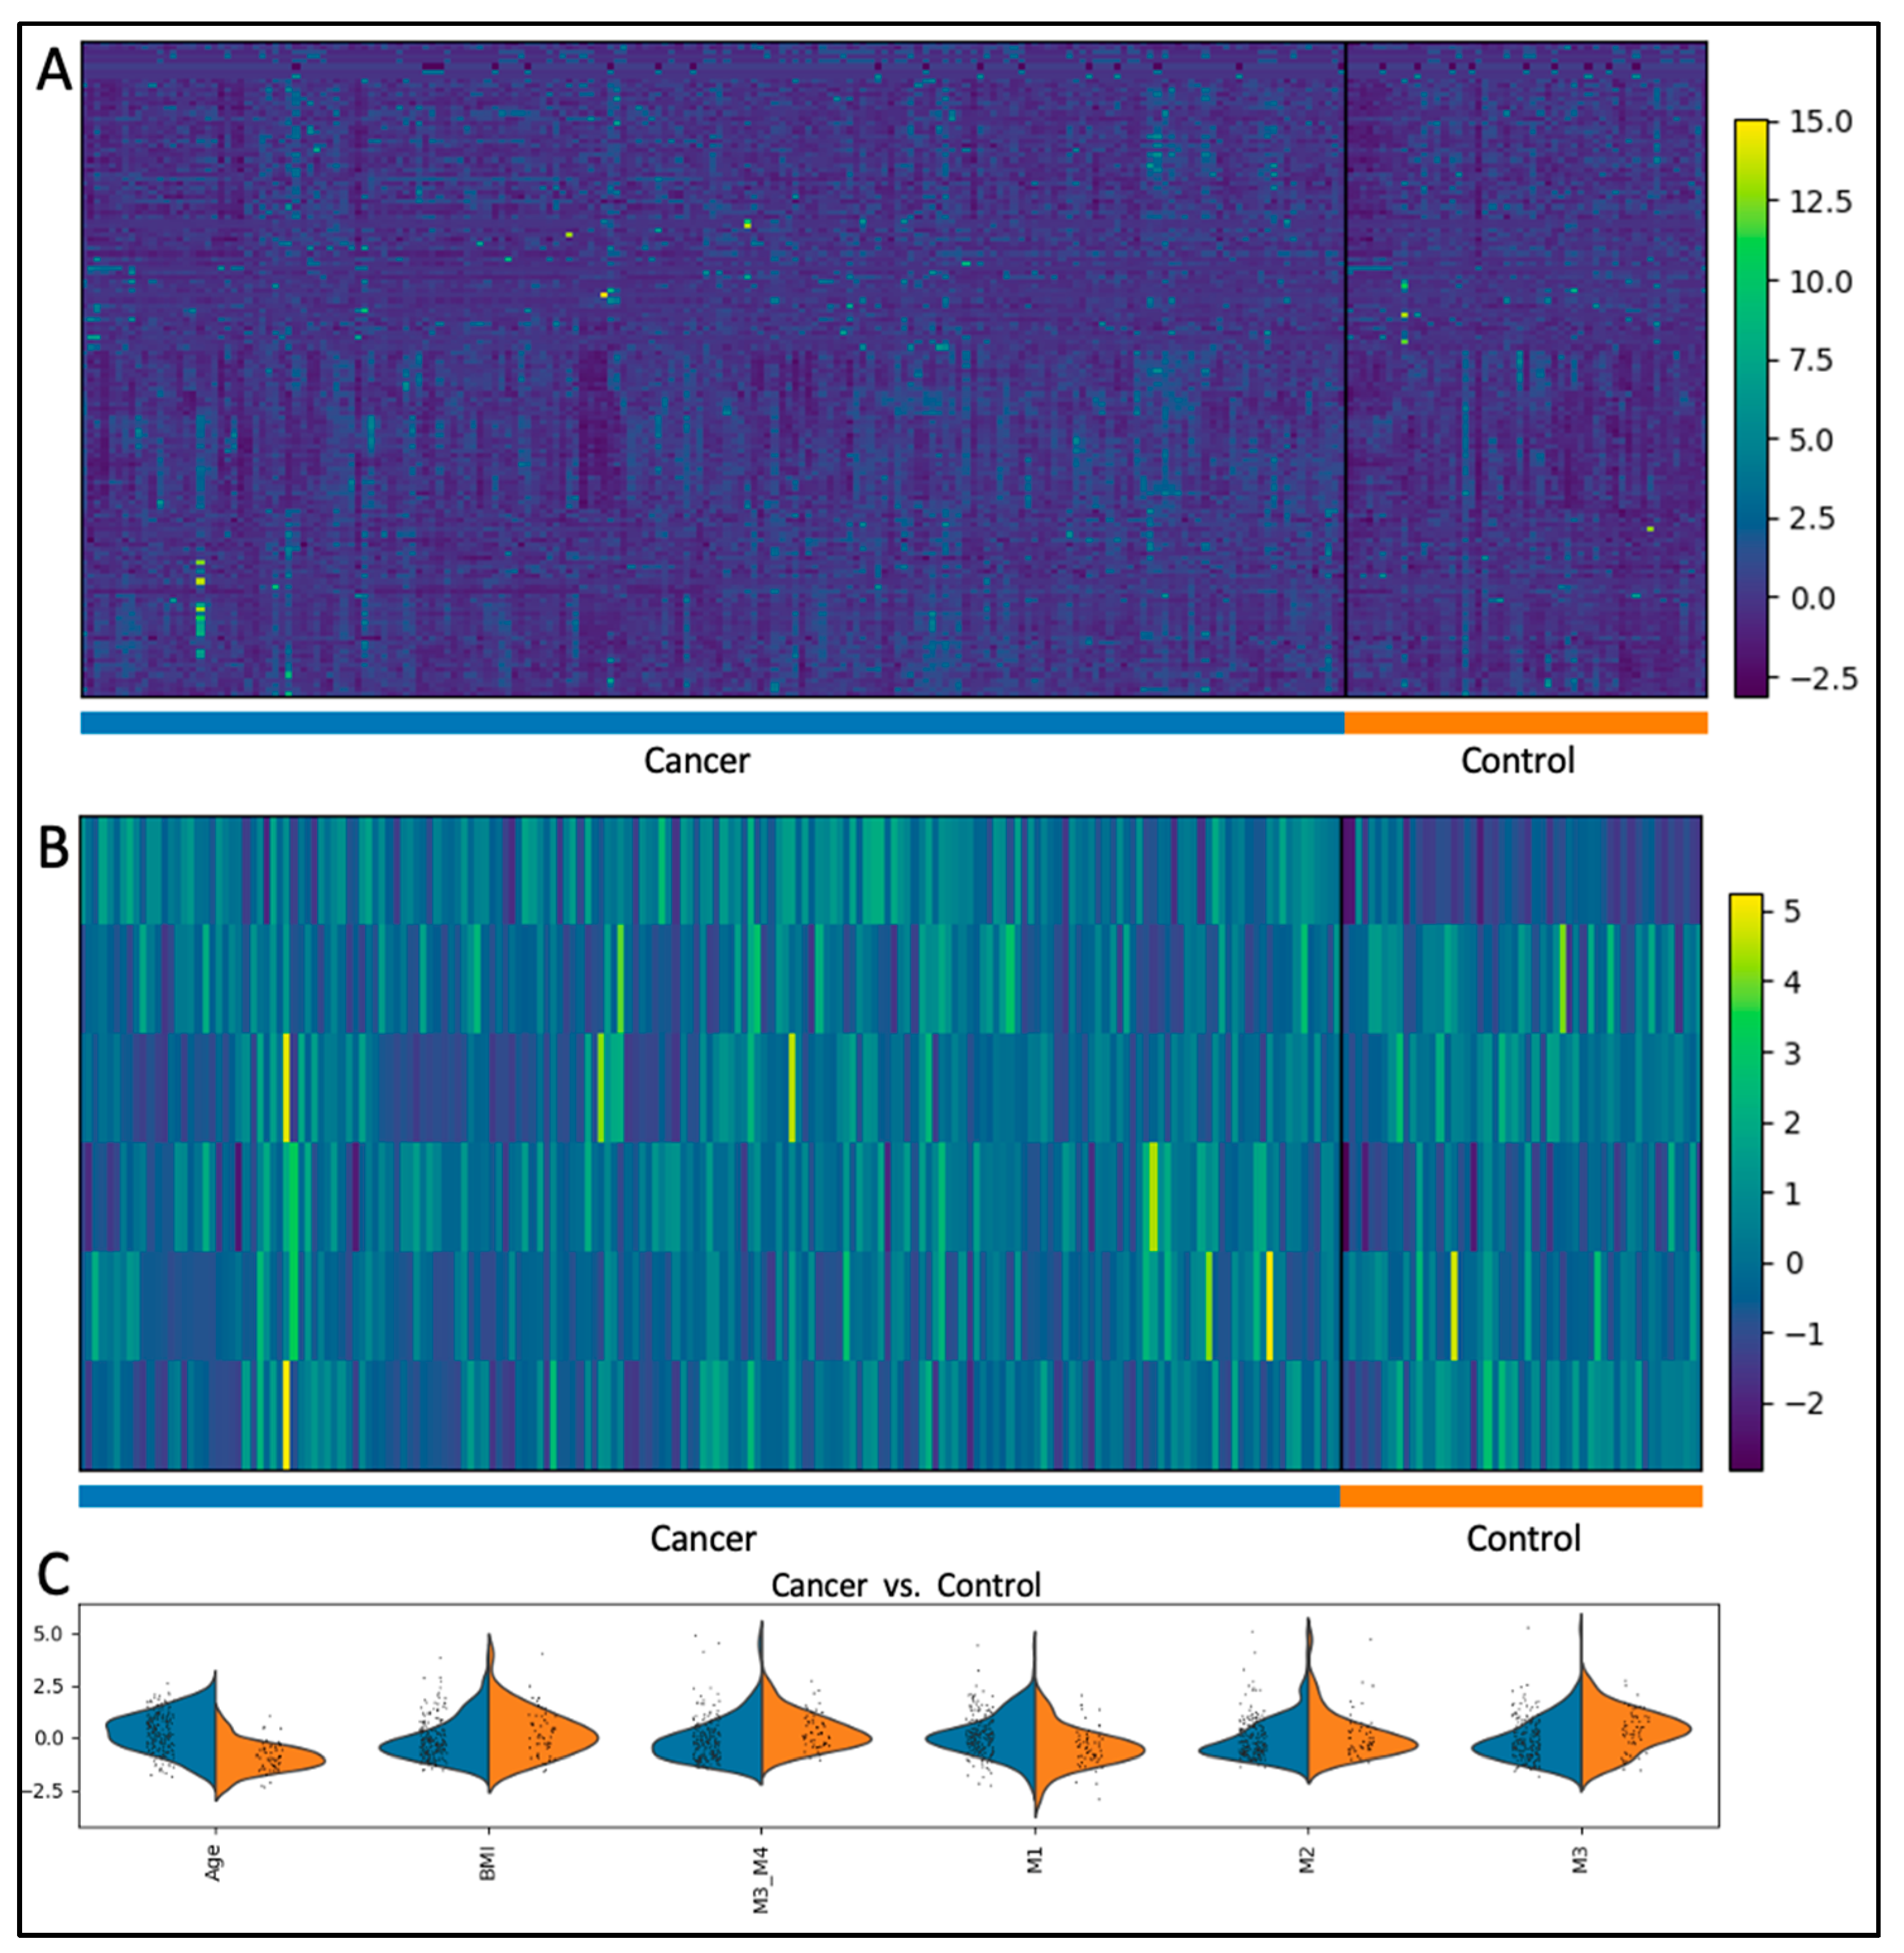
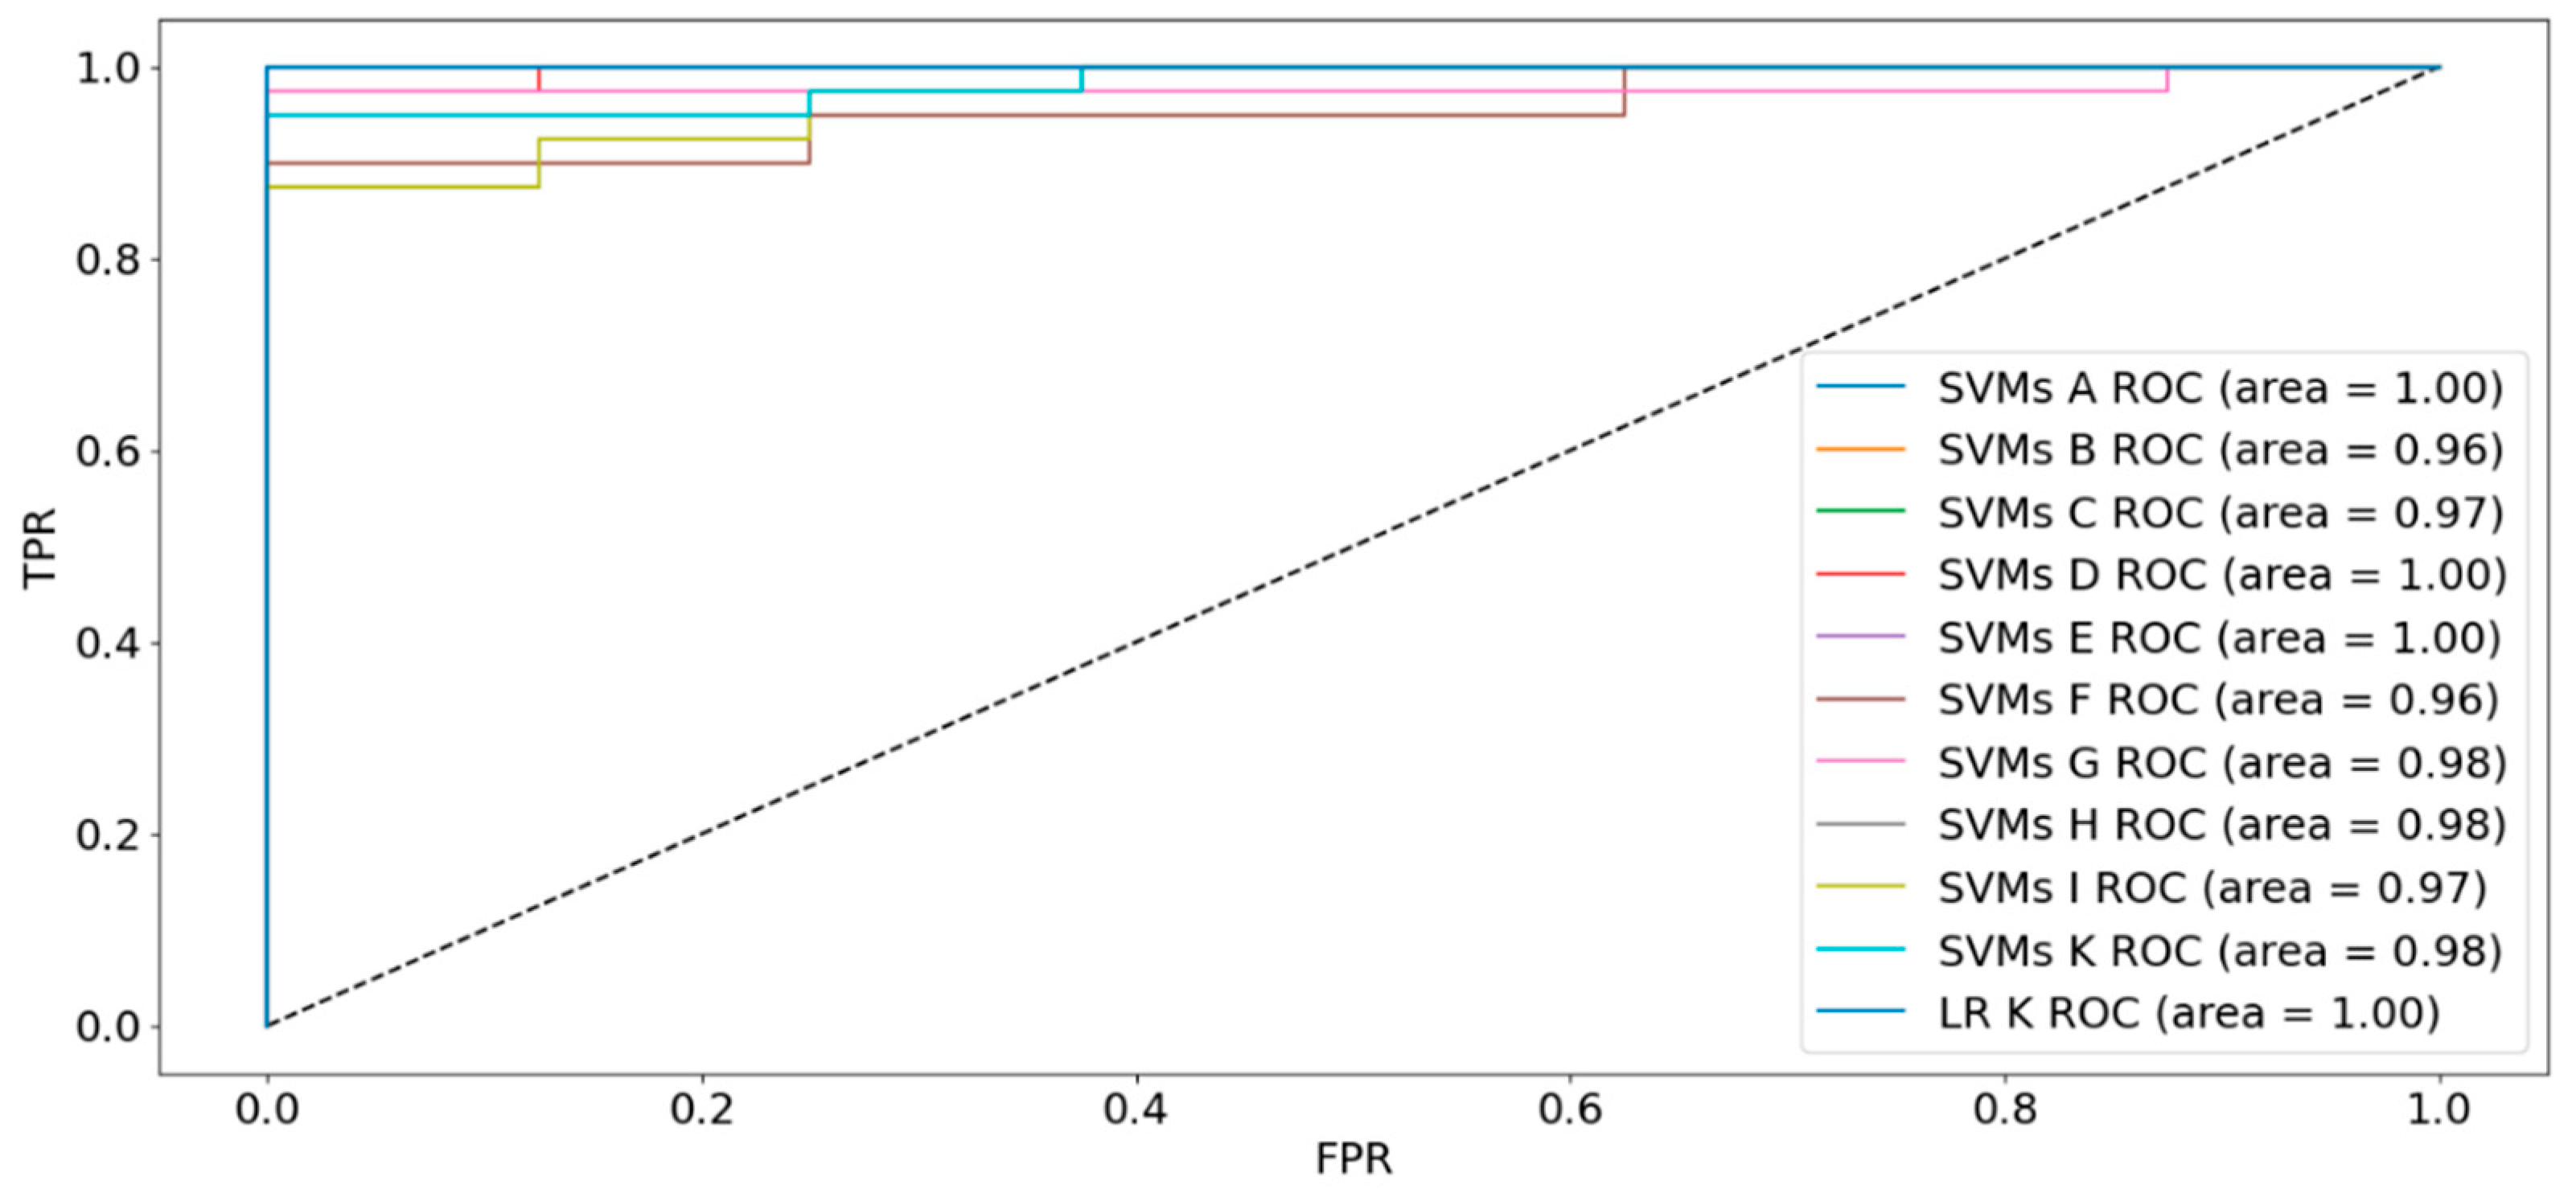
Our top-performing model was a single Logistic Regression model on a 6-feature dataset. We tested the model using feature set H, iteratively removing one feature at a time while introducing metabolite ratios to identify potential redundancies. We found that by eliminating a biomarker and smoking history, and introducing a metabolite ratio, we were able to further increase the accuracy to 98%. This 6-variable panel consisting of Age, BMI and 4 other metabolites achieved an F1 Score of 97%, and an AUC of 100%. Sensitivity and specificity were 97% and 100% respectively. The distribution of the variables for cancer vs. controls is shown in Figure 2. When compared to the entire feature space, the subset of variables shows a greater separation between cancer and healthy individuals. As features decreased, the AUC remained close to 100% for most of the datasets, including the 6-variable panel (Figure 3).
The 6-feature panel performed lower on the SVMs with bagging model, having 94% accuracy and an AUC of 98%. Adding more control cases to increase the balance between healthy and cancer cases generated similar results. The 6-variable models delivered superior performance compared to those with more features, except for the 59-feature SVMs. However, the almost 10-fold reduction in features form 59 to 6 led to a negligible 2% drop in accuracy while offering advantages such as reduced overfitting, better interpretability, and improved computational efficiency. In addition to the ML feature selection models, we also explored stepwise multivariate regression to validate the machine learning results. Z-score normalization techniques were implemented using the median to center the data on the dataset.
We applied multivariate regression using Statistical Analytical Systems (SAS) version 9.4. The analysis method included a stepwise variable selection procedure, with significance levels for variable entry into the model at 0.01. The stepwise selection identified nine significant metabolites and two demographic features associated with breast cancer prediction. Although the accuracy was in the low 90%, this aligns with findings from other machine learning models and reinforces the notion that incorporating both metabolic and demographic data can substantially enhance model prediction power while minimizing the required number of variables.

3. Discussion

It is apparent that cancer has a genetic component and, in fact, has been generally accepted as a genetic disease [16]. It is well known that variations in genetic make-up can influence susceptibility to certain diseases including cancer. Furthermore, epigenetic factors (DNA methylation and histone modification) are considered likely to play important roles in the pathogenesis of cancer. Although a number of blood-based cancer assays that detect protein, microRNA, circulating DNA, and methylated DNA biomarkers have been developed they are, however; specific to late-stage cancer and thus application for screening and/or early detection is rather limited. Furthermore, analytical techniques that require biopsy material for molecular diagnosis are invasive and uncomfortable for the patient and exhibit a concern pertaining to inaccurate interpretations. It is known that metabolites and genes are intimately connected [17]. Indeed, a single DNA base change in a given gene can lead to 10,000-fold shift in the generation of metabolite concentrations that are the products of a sequence of events i.e. gene transcription, translation, and subsequent protein synthesis and enzyme activation [18,19]. Accordingly, there is an amplification of the signal from DNA to protein to metabolites. It should be mentioned that there are several factors that can affect the metabolome including ethnicity, sex, age, diet as well as geographical location and environment [20]. Therefore, there are specific metabolomic signatures that could constitute a panel of biomarkers with huge clinical application and significance for not only diagnostic and prognostic value in cancer, but also as a predictive tool/early detection of cancer in high-risk populations. While our work is not meant to de-emphasize genetic and molecular components of cancer, the field of metabolomic biomarkers is a complimentary field that can be utilized to assist existing screening/surveillance technologies [21].
The present study identified a minimal 6-variable panel from a metabolomics dataset that demonstrated high accuracy in breast cancer detection. This finding holds significant promise for the development of non-invasive, accurate, and cost-effective diagnostic tools for breast cancer. The use of a metabolomics approach offers a unique perspective on cancer diagnosis, as it bypasses limitations associated with more invasive and late-stage detection methods. Metabolites represent the downstream products of cellular processes, providing a closer reflection of the functional state of a cell or tissue. In contrast to the established cancer screening methods, this approach has the potential to capture subtle metabolic alterations associated with early-stage cancers, potentially enabling earlier detection and intervention. The employed feature selection strategies enhanced the robustness and generalizability of the findings. By combining three distinct feature selection methods, the study effectively identified the most discriminative and non-redundant biomarkers within the dataset. Our findings underscore the criticality of multi-source data integration, incorporating both demographic and metabolomic profiles, to offer a more holistic perspective on patient health and improve cancer prediction. Metabolomics data presents unique challenges for standard analytical models. The inherent complexity of metabolomic data, with its large number of interconnected variables and often limited sample sizes, presents a significant challenge in identifying the most informative biomarkers. This complexity may explain why, despite widespread use of PLS/regression feature selection in metabolomic studies, there remains limited consensus on reliable metabolomic indicators of breast cancer.
Our research addressed this by systematically comparing multiple feature selection strategies to derive a robust and reliable panel of biomarkers, achieving a perfect AUC and a 98% accuracy. Despite these strengths, we share some limitations with other studies, namely a relatively small sample size. Additionally, the study focused solely on diagnostic accuracy. While this is an essential initial step, future research should explore the panel's potential for risk stratification, treatment response prediction, and early-stage cancer detection. Supervised and unsupervised machine learning (ML) have also emerged as a potent tool in multi-omics analysis, aiding in the identification of patterns and improved outcomes across diverse biological variables. Numerous studies have demonstrated their efficacy in profiling various omics data sources, including proteomics, genomics, metabolomics, and transcriptomics. Sugimoto et al. [22], for instance, employed various classification ML models like Random Forests, Naïve Bayes, and Support Vector Machines to analyze genomics data and gene assays. Their study, utilizing cross-validation for robust comparisons, highlighted the ability of ML to extract valuable insights from multi-omics data for tasks such as disease classification and biomarker discovery.
Other machine learning (ML) algorithms like Decision Trees, PCA, t-SNE and PLS have also shown promising results in identifying and classifying various cancers based on metabolomic data such as ovarian [23,24,25], lung [26,27,28], endometrial [29], skin and kidney carcinomas [30,31,32], glioma and meningioma brain tumors [33], and non-Hodgkin's lymphoma [34]. For breast cancer particularly, Henneges et al. [35] achieved sensitivity and specificity of 83.5% and 90.6% respectively with an SVM-based metabolomic approach. Using an ensemble based ADTree model, Mutata et al. [36] reached an accuracy of 91.2% in discriminating between breast cancer patients and the control group. A LASSO regression model, applied to a subset of 22 biomarkers specifically selected from triple-negative breast cancer patients, achieved an overall diagnostic accuracy of 93% and an AUC of 96%. The model also exhibited high sensitivity of 96% and specificity of 91%.
Metabolomic profiling of plasma from breast cancer patients has revealed distinct metabolite signatures not only when compared with healthy individuals, but also across various disease stages and demographic profiles. Jasbi et al [37] found significant variations in the levels of the same metabolites even between early-stage breast cancers (Stages 1 and 2), underscoring the sensitivity of these biomarkers to subtle shifts in tumor metabolism. Their analysis revealed significant differences in the levels of proline, myoinositol, 2-hydroxybenzoic acid, gentisic acid, hypoxanthine, and 2,3-dihydroxybenzoic acid [37]. The inclusion of age as a feature to a PLS-DA model, alongside the six metabolites enhanced the model's discriminatory power, achieving an AUC of 89%, with a sensitivity of 80% and a specificity of 75%.
Race also plays a critical role in discriminating between cancer and control cases. Santaliz-Casiano et al [38] observed 9 metabolomics signatures exclusive for African American patients and 6 others for white individuals. Alpha ketoisocaproic acid, arginine, alpha tocopherol, citric acid, histidine, maltose, methionine, n-acetylglutamic acid, o-phosphoethanolamine, and oxalic acid, were statistically significant in the African American cohort (AUC of 79%), while β-hydroxybutyrate, cholesterol, oxalic acid, palmitic acid, palmitoleic acid, and tetra decanoic acid were strong indicators of disease in white individuals (AUC of 78%). The distinct signatures of amino acid metabolism in cancerous tumors across various subpopulation and tumor stages suggest that altered metabolic pathways in cancer are not solely driven by tumor biology but may also be influenced by genetic factors such as underlying gene expression, epigenetic modifications caused by diet and lifestyle, and genetic marker variations. This potential dependence highlights the need for stratified approaches to metabolic profiling and biomarker identification that consider these variables to improve the accuracy and generalizability of findings.
Subramani et al [39] identified a distinct metabolic signature in cancer cells compared to healthy controls, characterized by elevated choline, and decreased glucose levels. This dysregulation likely supports the increased energy demands and rapid proliferation of cancer cells. Notably, the study also linked elevated serine levels to cancer cell division through its essential role in nucleic acid synthesis [39]. Expanding on specific metabolite associations, Jobard et al [40] identified ten plasma metabolites positively associated with BC risk in premenopausal women. These metabolites include histidine, glycerol, N-acetylcysteine, and ethanol, as well as other amino acids like leucine, ornithine, albumin, pyruvate, glutamate, and glutamine [40]. Higher levels of glutamate in breast cancer patients suggest it plays an important role in fatty acids overproduction [41,42]. Histidine association with BC has been corroborated by Huang et al [43]. Additionally, this team of researchers applied a neural network model on a panel of seven saliva biomarkers to predict the probability of being diagnosed as BrCa-positive breast cancer and attained an AUC of 86.5. The 7-metabolite panel consists of L-glyceric acid, nicotinamide, histamine, uracil, thymine, 3,4- dihydroxybenzyl amine and dehydro phenylalanine [43].
Nicotinamide, a water-soluble form of vitamin B3, is overexpressed in triple-negative breast cancer patients. This overexpression was associated with increased lipid metabolism and energy disruption, suggesting its potential as an anti-tumor agent [44]. A similar saliva-based biomarker study found elevated levels of polyamine and spermine in patients with breast cancer [36]. Another metabolic panel associated with an increased risk of developing breast cancer identified high levels of valine/norvaline, glutamine/isoglutamine, 5-aminovaleric acid, phenylalanine, tryptophan, γ-glutamyl-threonine, ATBC, and pregnenetriol sulfate, alongside a concomitant decrease in plasma O-succinyl-homoserine levels, as statistically significant indicators of disease [45].
The selected metabolites included DG(O-16:0/18:0), 1-butylamine, cytidine, histamine, phosphorylcholine, hydroxylinolenic acid, linoleic acid, glycerol 3-phosphate, glutamate, propenoyl carnitine, glutamine, tyrosine, 3-hydroxypalmitic acid, lysoPC(P-16:0), butyryl carnitine, pipecolic acid, lysoPC(18:2), N-acetyl spermidine, lactic acid, histidine, N-methyl histamine and N-acetyl histamine [46]. Elevated levels of carnitine derivatives such as of L-carnitine, acetylcarnitine, acylcarnitine C3:0, acylcarnitine C4:0, acylcarnitine C5:0 and acylcarnitine in murine breast cancer models indicate that this metabolite may be related to the development of breast cancer Sun et al [47].
Another LASSO-based regression model identified a panel of seven metabolites consisting of glutamine, ornithine, threonine, methionine sulfoxide, short-chain acylcarnitines C3, acetylcarnitine C2 and tryptophan, and reached an AUC of 80%. These significantly differentiated metabolites are mainly involved in the amino acid metabolism, aminoacyl-tRNA biosynthesis, and nitrogen metabolism [48]. Tryptophan holds particular significance due to its interference with cellular and immune signaling pathways, impacting cell division, and suppressing anticancer immune responses [49,50]. Indoleacetylglutamine, a tryptophan derivate was under expressed in a breast cancer cohort analyzed by Dougan et al [51]. further supporting tryptophan’s anti-cancer role. In addition to indoleacetylglutamine, this study observed a greater than 20% case-control difference in other 23 metabolites including 1-(1-enyl-palmitoyl)-2-oleoyl-GPC (P-16:0/18:1), 1-linoleoyl-GPA (18:2), 1-palmitoleoyl-2-linoleoyl-GPC (16:1/18:2), 1-palmitoyl-GPG (16:0), 1-palmitoylglycerol (16:0), 2-ethylphenylsulfate, 3-(cystein-S-yl)acetaminophen, 4-acetylphenol sulfate, adrenate (22:4n6), asparagine, cysteine s-sulfate, cysteinylglycine, ergothioneine, glycerate, glycolithocholate, heptanoate (7:0), indoleacetate, laurylcarnitine, maltotriose, N-(2-furoyl)glycine, sphingosine, sphingosine 1-phosphate and threonine [51]. While over 100 potential biomarkers have been proposed in the literature reviewed for this paper, few are consistently replicated across multiple studies (Figure 4).
Machine learning and deep learning (DL) models consistently outperform statistical regression in their ability to capture both linear and non-linear relationships within diverse variables. This advantage makes them compelling tools for analyzing biological data, particularly in the context of breast cancer screening and diagnosis. However, benchmarking these models using robust datasets is crucial to ensure consistency and reproducibility of insights gained. Integrated omics analysis, combining data from multiple molecular layers, holds promise for further enhancing robustness and accuracy. Strategies like cross-cohort data aggregation and cross-modality integration, as proposed by Jiang et al [52], offer exciting avenues for uncovering novel insights into disease progression. Yet, data availability remains a significant bottleneck in implementing these approaches effectively. The potential of deep learning models in cancer diagnosis is rapidly expanding, particularly in analyzing imaging data. These models can assist pathologists in accurately predicting and labeling cancer samples, ultimately aiding oncologists in making informed treatment decisions. For instance, a recent study by Liu and Li [53] demonstrated the effectiveness of DL models in lung cancer imaging analysis. Their findings highlight the significant role these models can play in assisting pathologists to screen and accurately detect cancerous tumors. Moreover, DL's potential extends beyond single datasets.
Prescreening diverse data sets like omics, X-rays, magnetic resonance imaging, and biopsies holds exciting possibilities for DL models. Gonzales Martinez and van Dongen [54] explored this concept in their study on breast cancer, comparing machine learning and DL approaches in predicting the disease using prescreening information. Their DL model achieved an AUC of 87%, demonstrating its promising potential [54]. On the other hand, Sultana and Jilani [55] found that simple logistic regression emerged as the most powerful predictor, delivering highly accurate results. While alternative methods like K-Nearest Neighbors and instance-based classifiers were employed, none surpassed the effectiveness of logistic regression in this specific context. This disparity highlights the need for robust and diverse training and validation datasets across multiple domains such as combining metabolites with imaging data. Nonetheless, these combined efforts highlight the significant promise of DL and ML for cancer diagnosis and prediction [56].
While further research is necessary to refine and validate these models, their ability to leverage diverse data sources and achieve high accuracy positions them as powerful tools for improving patient outcomes in the fight against cancer. Despite extensive research efforts devoted to the development of early diagnosis tools for breast cancer, the field currently lacks widely adopted, rapid, and non-invasive diagnostic methods readily implementable in routine clinical practice. To address this unmet need, the findings of the present paper demonstrate the potential of a machine learning model capable of achieving robust and accurate breast cancer detection using only 4 blood biomarkers and 2 demographic characteristics.

4. Materials and Methods

4.1. Study Samples

A total of 185 prospectively collected archived plasma samples from women with biopsy confirmed breast cancer and 53 plasma samples from healthy controls were obtained from the Cooperative Health Tissue Network (CHTN) biobank.

4.2. Analytical Procedures

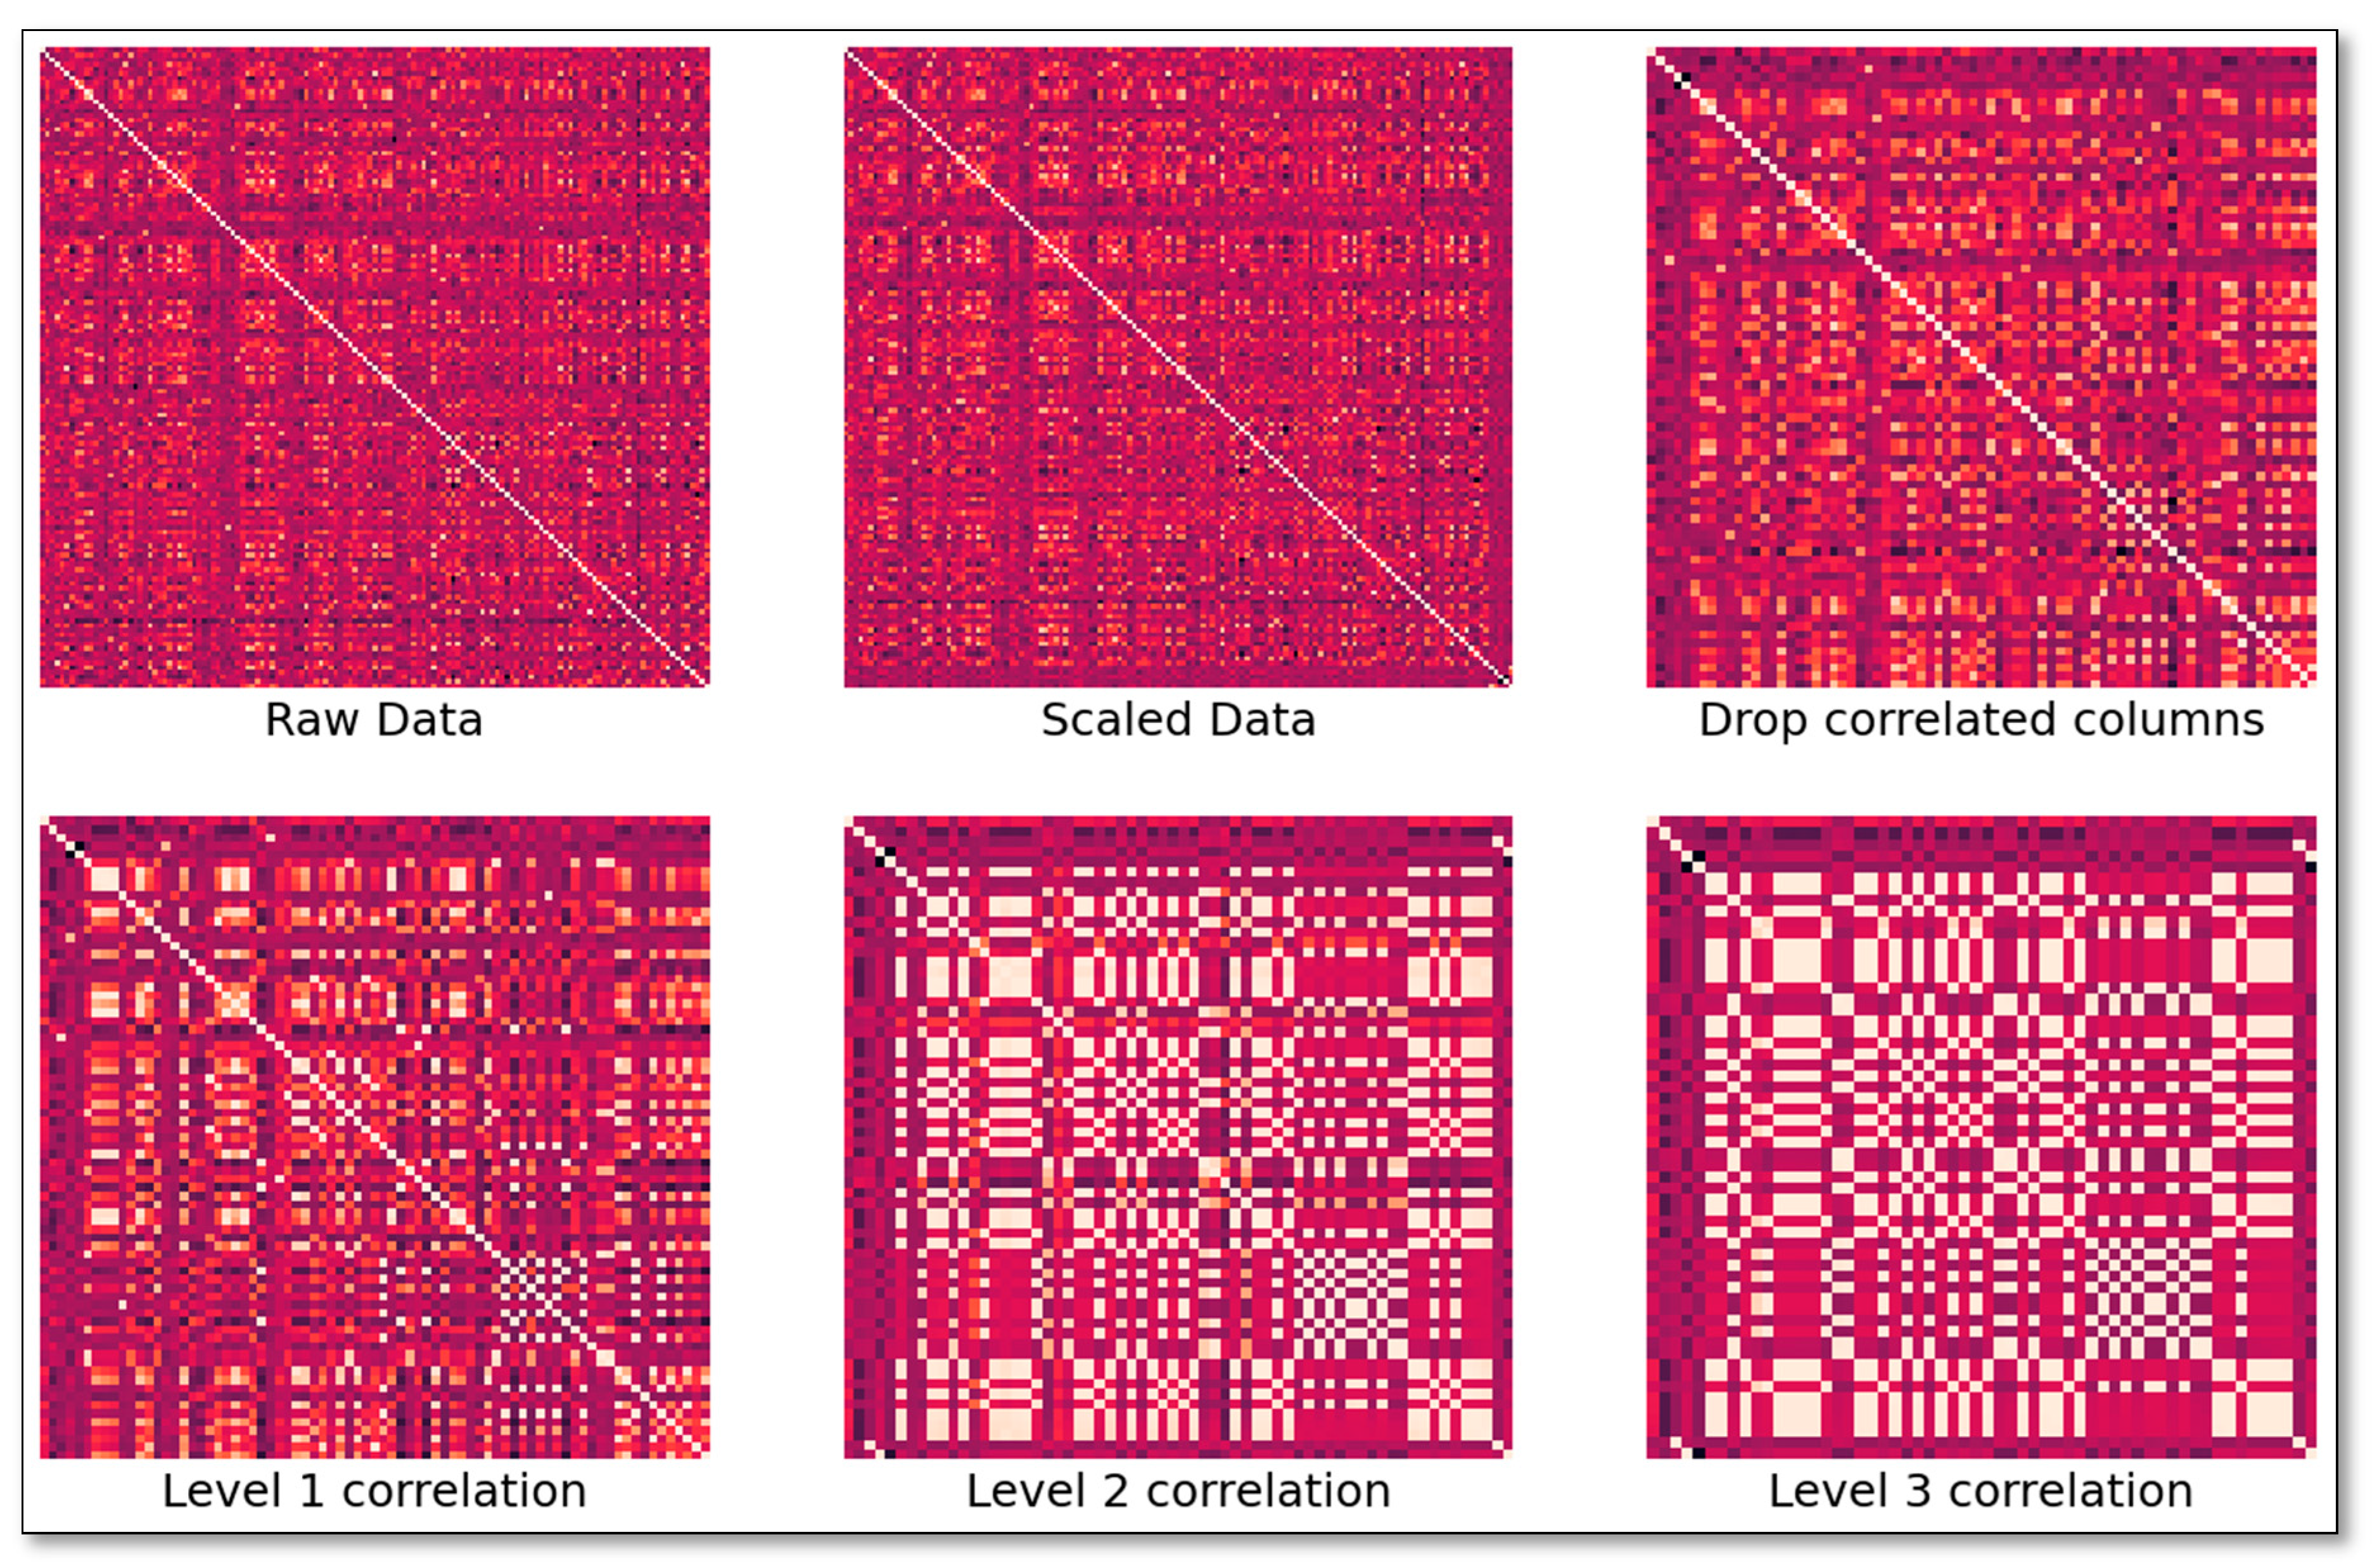
A targeted, quantitative mass spectrometry (MS) – based metabolomics approach was undertaken to analyze 138 metabolites in the plasma samples by DI-LC/MS/MS using the TMIC PRIME assay as previously described [57,58]. The sample set was split into a training set and a validation set. In addition to the metabolite concentration data, demographic data was used to determine optimal biomarker sets. The area under the receiver operator characteristic curves, sensitivities, specificities, F1-score, and overall accuracy were calculated for each subgroup. Subsequently, data preprocessing procedures were applied, which involved excluding male subjects from the breast cancer dataset. In addition, variables with more than 30% missing values were also excluded. The missing values for the remaining variables were replaced with the instrument limit of detection for metabolites and with mean values for demographic data. The continuous data was further subjected to standard normalization. The main goal of the research was to find the smallest number of biomarkers that are the best predictors of a positive diagnosis out of 138 metabolites. As a first step we analyzed the correlations between biomarkers to better understand the redundancies within the data. We proceeded to combine variables that showed over 50% correlation at multiple recursive combinatorial levels by taking the mean values. However, the correlation between combined columns tended to increase, as shown in Figure 5.
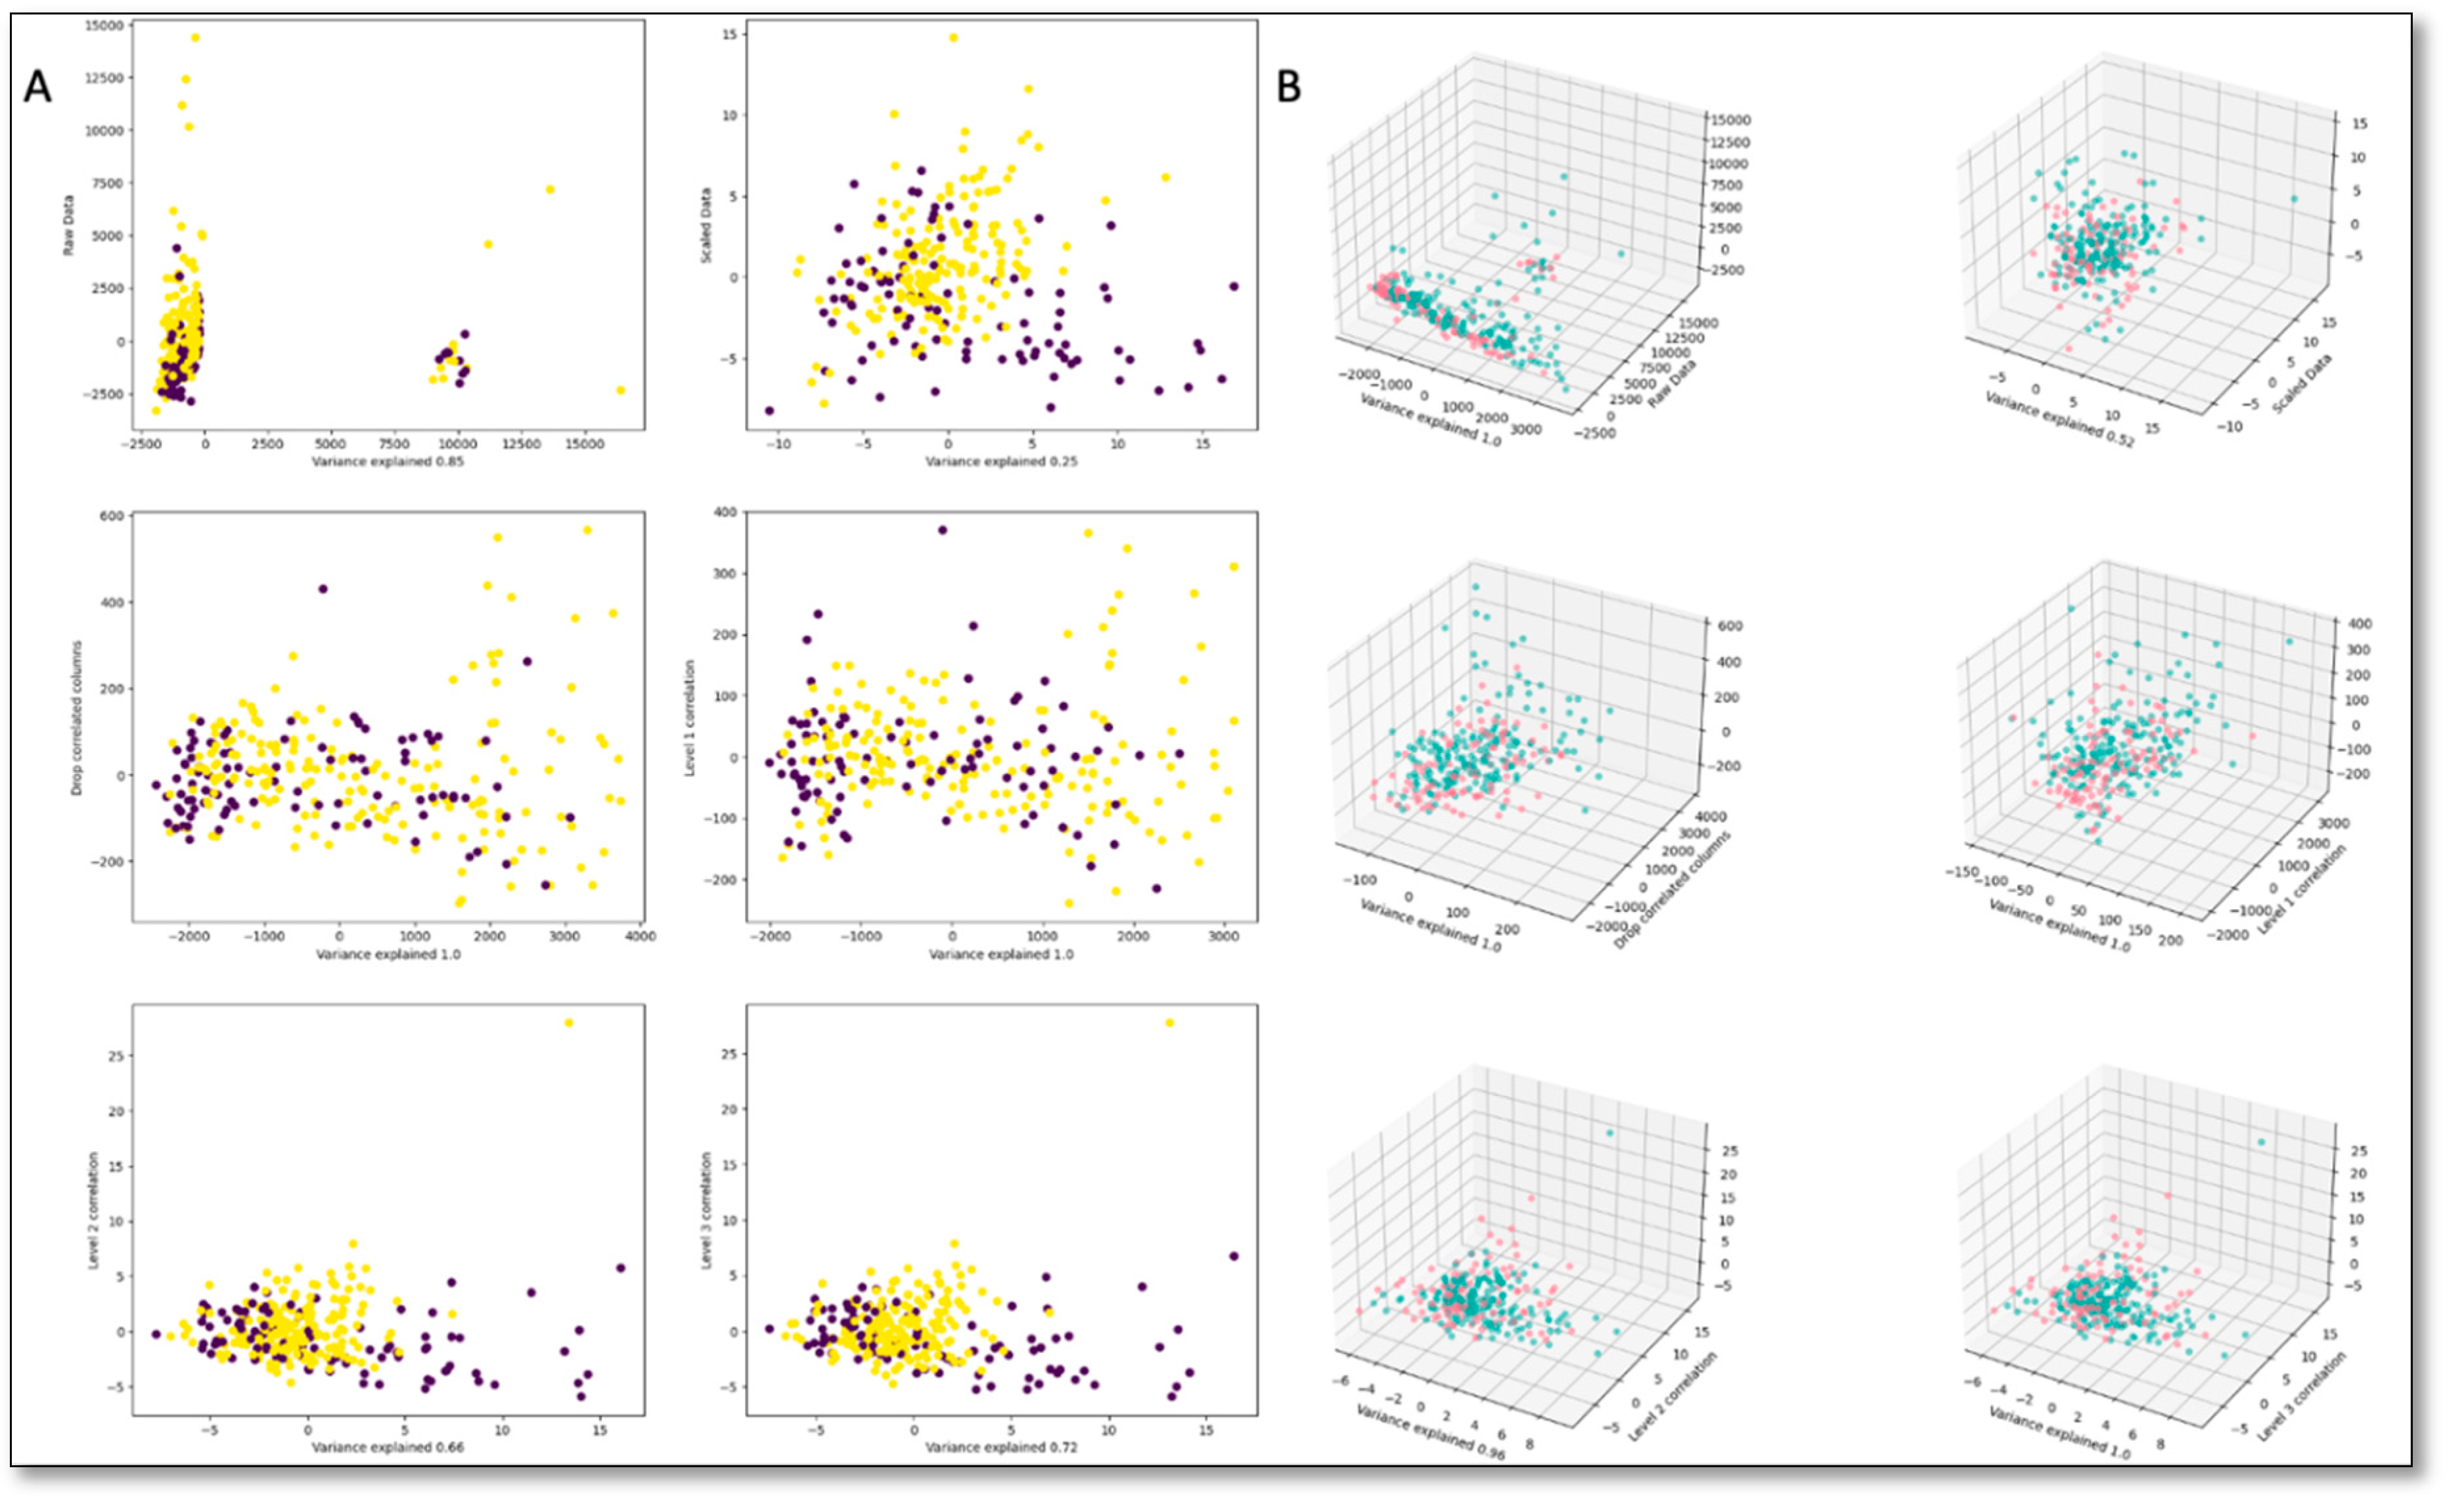
Dropping one of the correlated columns from a correlation set yielded similar results. Therefore, analysis of metabolite correlative networks may not grasp the complete underlying metabolic mechanisms [59]. The PCA projection of the different correlation levels corroborate this finding, as correlations between metabolomics do not necessarily lead to increased separation between control and breast cancer breast cancer cases (Figure 6). Strong correlations and lack of clear distinctions among the metabolites in the low dimensional space, made it difficult to pinpoint the most important variables for analysis.
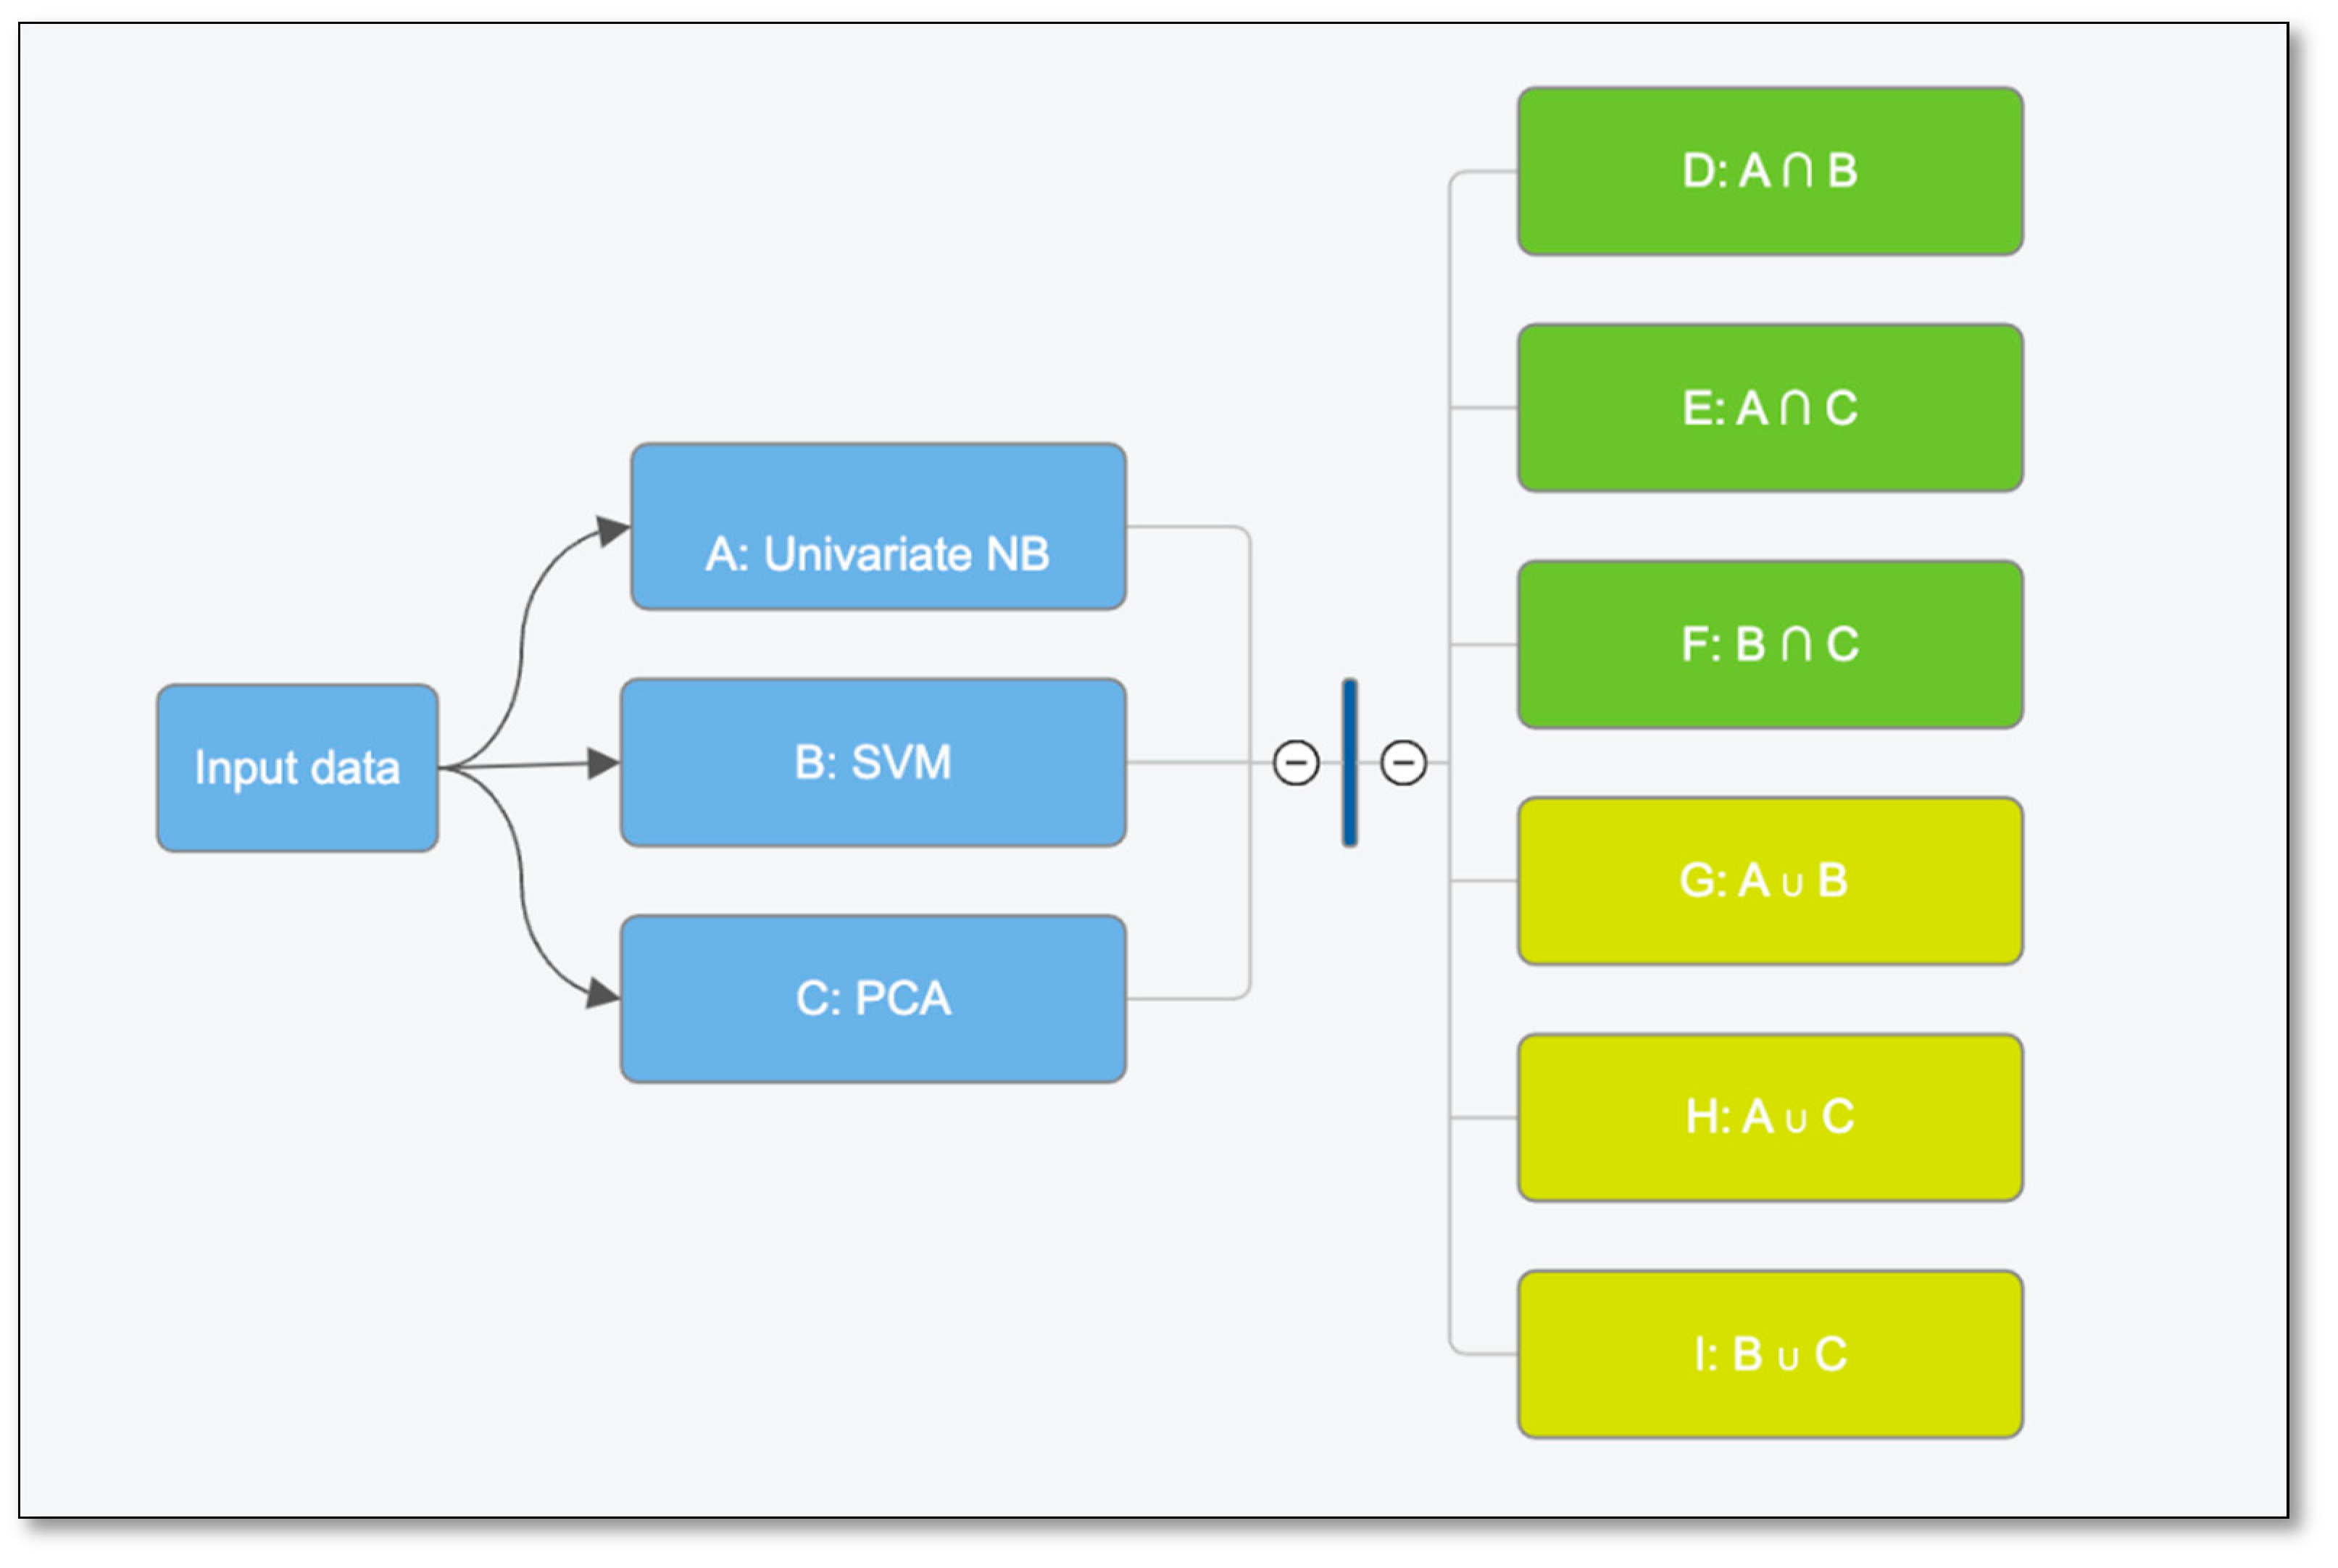
To solve this, we used three different machine learning strategies to identify significant variables. We applied Univariate Naive Bayes and selected the top 15 features which had the best accuracies. Support Vector Machines with L-2 regularization feature selection algorithm identified 57 important features. Furthermore, the top 50 features identified by Princi pal Component Analysis as having the largest loadings were selected. We then combined these results by looking at overlapping and the union set of features to create 9 groups with different combinations of variables. The feature selection workflow steps are described in Figure 7. Finally, we tested these variable groups with a range of supervised, unsupervised and ensemble machine learning models to find the combination of features and algorithms that would yield the best analytical results.

4.3. Statistical Analysis

Recommended statistical procedures for standard quantitative metabolomic analysis were followed [60]. In quantitative metabolomic studies, missing values normally indicate that the metabolite fell below the assay’s limit of detection (LOD). Therefore, metabolites with more than 50% of missing values (in all groups) were removed from further analysis. For metabolites with the fraction of missing values below 50%, values were imputed by using half of the minimum concentration value for that metabolite. Median normalization, log transformation, and auto-scaling (mean-centered and divided by the standard deviation of each variable) were applied for data scaling and normalization. Univariate analysis of the continuous data and the categorical data were performed by a Mann–Whitney rank sum test and a Fisher’s exact test, respectively. Principal component analysis (PCA) and partial least squares discriminant analysis (PLS-DA) were performed by using MetaboAnalyst [60]. A 1000-fold permutation test was performed to minimize the possibility that the observed separation of the PLS-DA was due to chance.
Logistic regression with a Lasso feature selection algorithm was used to develop predictive models of NSCLC staging using both metabolite and clinical variables. For these regression studies, two thirds of the samples (40 controls, and between 40 and 94 cancer samples, depending on staging) were randomly chosen to serve as the discovery sets. Then, 10-fold cross validation was performed on all discovery/training set models. Once the optimal regression models for each cancer stage predictor had been identified the remaining one third of the samples (20 controls and between 20 and 62 cancer samples, serving as a holdout set) were used to validate each of the corresponding regression models. The area under the receiver-operator characteristic curves (AUC), sensitivities/specificities at selected cut-off points and the 95% confidence intervals were calculated for all of the discovery and the validation sets and all of the models using MetaboAnalyst [61]. Cut-off points were selected by calculating the Youden Index (J = max {Sensitivity + Specificity − 1}).

5. Conclusions

By carefully combining feature selection techniques, we identified a 6-variable panel comprising age, BMI, and 4 metabolites that achieved 98% accuracy, outperforming models with larger feature sets. The strengths of our approach lie in its potential to address the limitations of traditional breast cancer screening. Metabolomic profiling offers a non-invasive way to detect subtle, early-stage cancer signatures. Additionally, the small, robust biomarker panel facilitates cost-effectiveness and interpretability than analyses involving large numbers of variables. While our results are highly promising, the relatively small sample size highlights the need for larger validation studies. Integrating metabolomic profiles with clinical and imaging data would further strengthen these findings. Despite the sample size limitation, our work demonstrates the power of a targeted, multi-pronged analytical approach for identifying metabolic markers in breast cancer. This research provides a strong foundation for developing more sensitive, accessible, and personalized cancer screening tools.

Author Contributions

Conceptualization, R.A., J-F. H., R.F. and M.L.V.; Data curation, J-F. H.; Formal analysis and interpretation, R.F., M.L.V., K.A., P.T. and B.P.; Funding acquisition, R.A. and P.S.T. Methodology, J-F. H., R.A. and P.S. T.; Project administration, R.A.; Project manager, G.H.; Resources, R.A., G.H., J-F. H. and P.S.T.; Writing—original draft, R.F., M.L.V.; R.A., J-F. H. and P.S.T.; Writing—review and editing, R.A., J-F. H., P.S.T., R.F. and M.L.V. All authors have read and agreed to the published version of the manuscript.

Funding

This study was supported, in part, by Biomark Diagnostics Inc. (Richmond, BC, Canada) and the Maunders-McNeil Foundation (Edmonton, AB, Canada).

Institutional Review Board Statement

The study was conducted in accordance with the Declaration of Helsinki, and approved by the University of Manitoba Health Research Ethics Board (Ethics File #: H2012:334) prior to study implementation.

Informed Consent Statement

Informed consent was obtained from all subjects prior to sample donation to biobanks.

Data Availability Statement

Data is unavailable due to privacy or ethical restrictions.

Acknowledgments

Infrastructure support was provided by the St. Boniface Hospital Foundation and the University of Manitoba and the Institut Universitaire de Cardiologie et de Pneumologie de Québec—Université Laval (IUCPQ), and the Cooperative Health Tissue Network (USA) for providing the plasma samples and patient data.

Conflicts of Interest

R.A.B. is President and CEO of BioMark Diagnostics Inc. and is a shareholder. G.H. is President of BioMark Diagnostic Solutions Inc. J-F. H is Executive Director of BioMark Diagnostic Solutions Inc. P.S.T. is a minor shareholder of BioMark Diagnostics, Inc. The authors have no other relevant affiliations or financial involvement with any organization or entity with a financial interest or financial conflict with the subject matter or materials discussed in the manuscript apart from those disclosed.

References

  1. American Society of Clinical Oncology. Breast cancer statistics. Cancer.Net. Retrieved from https://www.cancer.net/cancer-types/breast-cancer/statistics. Accessed, April 10, 2024.
  2. Ma, H.; Lu, Y.; Marchbanks, P.A.; Folger, S.G.; Strom, B.L.; McDonald, J.A.; et al. Quantitative measures of estrogen receptor expression in relation to breast cancer-specific mortality risk among white women and black women. Breast Cancer Res 2013, 15(R90), 1–12. [Google Scholar] [CrossRef]
  3. Kim, Y.; Koo, I.; Jung, B.H.; Chung, B.C.; Lee, D. Multivariate classification of urine metabolome profiles for breast cancer diagnosis. BMC Bioinformatics, 2010, 11(Suppl 2) (S4), 1–9. [CrossRef]
  4. Jiang, X. P.; Elliott, R. L.; Head, J. F. Exogenous normal mammary epithelial mitochondria suppress glycolytic metabolism and glucose uptake of human breast cancer cells. Breast Cancer Res Treat, 2015, 153(3), 519–529. [Google Scholar] [CrossRef] [PubMed]
  5. Hilvo, M.; Matej Orešiè, A. Regulation of lipid metabolism in breast cancer provides diagnostic and therapeutic opportunities. Clin Lipidol, 2012, 7(2), 177-188. [CrossRef]
  6. Ward, P.S.; Thompson, C.B. Glutamine metabolism and its regulation in the cancer cell. Biochem J. 2012;444(2):335-342. [CrossRef]
  7. Mikó, E.; Kovács, T.; Sebő, É.; Tóth, J.; Csonka, T.; Ujlaki, G.; et al. Microbiome—microbial metabolome—cancer cell interactions in breast cancer—familiar, but unexplored. Cells, 2019, 8(4), 293. [Google Scholar] [CrossRef] [PubMed]
  8. Gal, J.; Bailleux, C.; Chardin, D.; Pourcher, T.; Gilhodes, J.; Jing, L.; et al. Comparison of unsupervised machine-learning methods to identify metabolomic signatures in patients with localized breast cancer. Comput Struct Biotechnol J, 2020, 18, 1509–1524. [Google Scholar] [CrossRef]
  9. Saritas, M. M.; Yasar, A. Performance analysis of ANN and Naive Bayes classification algorithm for data classification. International journal of intelligent systems and applications in engineering, 2019, 7(2), 88–91. [Google Scholar] [CrossRef]
  10. Chiu, H. J.; Li, T. H. S.; Kuo, P. H. Breast cancer–detection system using PCA, multilayer perceptron, transfer learning, and support vector machine. IEEE Access, 2020, 8, 204309–204324. [Google Scholar] [CrossRef]
  11. Huang, H.; Feng, X. A.; Zhou, S.; Jiang, J.; Chen, H.; Li, Y.; et al. A new fruit fly optimization algorithm enhanced support vector machine for diagnosis of breast cancer based on high-level features. BMC Bioinformatics, 2019, 20(S8), 290. [CrossRef]
  12. Ozer, M. E.; Sarica, P. O.; Arga, K. Y. New machine learning applications to accelerate personalized medicine in breast cancer: rise of the support vector machines. OMICS, 2020, 24(5), 241–246. [Google Scholar] [CrossRef] [PubMed]
  13. Hosni, M.; Abnane, I.; Idri, A.; de Gea, J. M. C.; Alemán, J. L. F. Reviewing ensemble classification methods in breast cancer. Comput Methods Programs Biomed, 2019, 177, 89–112. [Google Scholar] [CrossRef] [PubMed]
  14. Murti Rawat, R.; Panchal, S.; Singh, V. K.; Panchal, Y. Breast Cancer detection using K-nearest neighbors, logistic regression, and ensemble learning. In 2020 International conference on electronics and sustainable communication systems (ICESC) Coimbatore, India, 02-04 July 2020 (pp. 534-540).
  15. Nguyen, Q. H., Do, T. T., Wang, Y., Heng, S. S., Chen, K., Ang, W. H. M.; et al. Breast cancer prediction using feature selection and ensemble voting. In 2019 International Conference on System Science and Engineering (ICSSE) Dong Hoi, Vietnam, pp. 250-254.
  16. Wishart, D.S. Metabolomics and the Multi-Omics View of Cancer. Metabolites 2022, 12(2), 154. [Google Scholar] [CrossRef]
  17. Wishart, D.S. Systems biology resources arising from the human metabolome project. In Genetics Meets Metabolomics: From Experiment to Systems Biology. Suhre K., ed. Springer; New York, NY, USA: 2012. pp. 157–175.
  18. Wishart, D.S. Metabolomics for investigating physiological and pathophysiological processes. Physiol. Rev. 2019, 99 1819–1875. [CrossRef]
  19. Fiehn, O. Metabolomics–the link between genotypes and phenotypes. Plant. Mol. Biol. 2002, 48, 155–171. [Google Scholar] [CrossRef]
  20. Suhre, K.; Raffler, J.; Kastenmüller, G. Biochemical insights from population studies with genetics and metabolomics. Arch. Biochem. Biophys. 2016, 589, 168–176. [Google Scholar] [CrossRef] [PubMed]
  21. Haince, J.F.; Joubert, P.; Bach, H.; Ahmed Bux, R.; Tappia, P.S.; Ramjiawan, B. Metabolomic Fingerprinting for the Detection of Early-Stage Lung Cancer: From the Genome to the Metabolome. Int J Mol Sci 2022, Jan 21;23(3), 1215. [CrossRef]
  22. Sugimoto, M.; Hikichi, S.; Takada, M.; Toi, M. Machine learning techniques for breast cancer diagnosis and treatment: a narrative review. Annals of Breast Surgery, 2023, 7, 7–7. [Google Scholar] [CrossRef]
  23. Zhang, F.; Zhang, Y.; Ke, C.; Li, A.; Wang, W.; Yang, K.; et al. Predicting ovarian cancer recurrence by plasma metabolic profiles before and after surgery. Metabolomics 2018, 14(5), 65. [Google Scholar] [CrossRef]
  24. Yao, J. Z.; Tsigelny, I. F.; Kesari, S.; Kouznetsova, V. L. Diagnostics of ovarian cancer via metabolite analysis and machine learning. Integr Biol, 2023, 15, zyad005. [Google Scholar] [CrossRef] [PubMed]
  25. Gaul, D. A.; Mezencev, R.; Long, T. Q.; Jones, C.M.; Benigno, B. B.; Gray, A.; et al. Highly-accurate metabolomic detection of early-stage ovarian cancer. Sci. Rep. 2015, 5(1), 16351–16357. [Google Scholar] [CrossRef]
  26. Wang, G.; Qiu, M.; Xing, X.; Zhou, J.; Yao, H.; Li, M.; et al. Lung cancer scRNA-seq and lipidomics reveal aberrant lipid metabolism for early-stage diagnosis. Sci. Transl. Med. 2022, 14 (630), eabk2756. [Google Scholar] [CrossRef] [PubMed]
  27. Choudhary, A.; Yu, J., Kouznetsova, V. L.; Kesari, S.; Tsigelny, I. F. Two-Stage Deep-Learning Classifier for Diagnostics f Lung Cancer Using Metabolites. Metabolites, 2023, 13(10), 1055. [CrossRef]
  28. Xie, Y.; Meng, W. Y.; Li, R. Z.; Wang, Y. W.; Qian, X.; Chan, C.; et al. Early lung cancer diagnostic biomarker discovery by machine learning methods. Transl Oncol 2021, 14(1), 100907. [Google Scholar] [CrossRef]
  29. Cheng, S-C.; Chen, K.; Chiu, C-Y.; Lu, K-Y.; Lu, H-Y.; Chiang, M-H.; et al. (2019). Metabolomic biomarkers in cervicovaginal fluid for detecting endometrial cancer through nuclear magnetic resonance spectroscopy. Metabolomics 2019, 15 (11), 146. [CrossRef]
  30. Bifarin, O. O.; Gaul, D. A.; Sah, S.; Arnold, R. S.; Ogan, K.; Master, V. A.; et al. . Machine learning-enabled renal cell carcinoma status prediction using multiplatform urine-based metabolomics. J. Proteome Res. 2021, 20(7), 3629–3641. [Google Scholar] [CrossRef]
  31. Chen, Z.; Gao, Y.; Huang, X.; Yao, Y.; Chen, K.; Su, Z.; et al. Tissue-based metabolomics reveals metabolic biomarkers and potential therapeutic targets for esophageal squamous cell carcinoma. J. Pharm. Biomed. Anal. 2021, 197, 113937. [Google Scholar] [CrossRef]
  32. Hsu, C-W.; Chen, Y-T.; Hsieh, Y-J.; Chang, K-P.; Hsueh, P-C.; Chen, T-W.; et al. Integrated analyses utilizing metabolomics and transcriptomics reveal perturbation of the polyamine pathway in oral cavity squamous cell carcinoma. Anal. Chim. Acta 2019, 1050, 113–122. [CrossRef]
  33. Godlewski, A.; Czajkowski, M.; Mojsak, P.; Pienkowski, T.; Gosk, W.; Lyson, T.; et al. A comparison of different machine-learning techniques for the selection of a panel of metabolites allowing early detection of brain tumors. Sci Rep, 2023, 13(1), 11044. [Google Scholar] [CrossRef]
  34. Duarte, G. H. B.; Fernandes, A. A. D. P.; Silva, A. A. R.; Zamora-Obando, H. R.; Amaral, A. G.; Mesquita, A. D. S.; et al. Gas chromatography-mass spectrometry untargeted profiling of non-hodgkin’s lymphoma urinary metabolite markers. Anal. Bioanal. Chem. 2020, 412 (27), 7469–7480. [Google Scholar] [CrossRef] [PubMed]
  35. Henneges, C.; Bullinger, D.; Fux, R.; Friese, N.; Seeger, H.; Neubauer, H.; et al. Prediction of breast cancer by profiling of urinary RNA metabolites using support vector machine-based feature selection. BMC Cancer 2009, 9, 104. [Google Scholar] [CrossRef] [PubMed]
  36. Murata, T.; Yanagisawa, T.; Kurihara, T.; Kaneko, M.; Ota, S.; Enomoto, A.; et al. Salivary metabolomics with alternative decision tree-based machine learning methods for breast cancer discrimination. Breast Cancer Res Treat, 2019, 177, 591–601. [Google Scholar] [CrossRef] [PubMed]
  37. Jasbi, P.; Wang, D.; Cheng, S. L.; Fei, Q.; Cui, J. Y.; Liu, L.; et al. (2019). Breast cancer detection using targeted plasma metabolomics. J Chromatogr B Analyt Technol Biomed Life Sci, 2019, 1105, 26–37. [Google Scholar] [CrossRef] [PubMed]
  38. Santaliz-Casiano, A.; Mehta, D.; Danciu, O. C.; Patel, H.; Banks, L.; Zaidi, A.; et al. Identification of metabolic pathways contributing to ER+ breast cancer disparities using a machine-learning pipeline. Sci Rep, 2023, 13(1). [Google Scholar] [CrossRef] [PubMed]
  39. Subramani, R.; Poudel, S.; Smith, K. D.; Estrada, A.; Lakshmanaswamy, R. Metabolomics of Breast Cancer: A Review. Metabolites 2022, 12(7), 643.
  40. Jobard, E.; Dossus, L.; Baglietto, L.; Fornili, M.; Lécuyer, L.; Mancini, F.R.; et al. Investigation of circulating metabolites associated with breast cancer risk by untargeted metabolomics: a case–control study nested within the French E3N cohort. Br J Cancer, 2021, 124(10), 1734–1743. [Google Scholar] [CrossRef] [PubMed]
  41. Xiao, Y.; Ma, D.; Yang, Y.S.; Yang, F.; Ding, J.H.; Gong, Y.; et al. Comprehensive metabolomics expands precision medicine for triple-negative breast cancer. Cell Res 2022, 32, 477–490. [Google Scholar] [CrossRef] [PubMed]
  42. Chistyakov, D. V.; Guryleva, M. V.; Stepanova, E. S.; Makarenkova, L. M.; Ptitsyna, E. V.; Goriainov, S. V.; et al. Multi-omics approach points to the importance of oxylipins metabolism in early-stage breast cancer. Cancers, 2022, 14(8), 2041. [CrossRef]
  43. Huang, Y., Du, S., Liu, J., Huang, W., Liu, W., Zhang, M.; et al. Diagnosis and prognosis of breast cancer by high-performance serum metabolic fingerprints. Proc Natl Acad Sci USA, 2022, 119(12), e2122245119. [CrossRef]
  44. Jung, M.; Lee, K.M.; Im, Y.; Seok, S.H.; Chung, H.; Kim, D.Y.; et al. Nicotinamide (niacin) supplement increases lipid metabolism and ROS-induced energy disruption in triple-negative breast cancer: potential for drug repositioning as an anti-tumor agent. Mol Oncol. 2022, 16(9):1795-1815. [CrossRef]
  45. Lécuyer, L.; Dalle, C.; Lyan, B.; Demidem, A.; Rossary, A.; Vasson, M. P.; et al. Plasma metabolomic signatures associated with long-term breast cancer risk in the SU. VI. MAX prospective cohort. Cancer Epidemiol, Biomarkers & Prev, 2019, 28(8), 1300–1307. [Google Scholar] [CrossRef]
  46. Song, Y.; Zhang, Y.; Xie, S.; Song, X. Screening and diagnosis of triple negative breast cancer based on rapid metabolic fingerprinting by conductive polymer spray ionization mass spectrometry and machine learning. Front Cell Dev Biol, 2022, 10, 1075810. [Google Scholar] [CrossRef]
  47. Sun, C.; Wang, F.; Zhang, Y.; Yu, J.; Wang, X. Mass spectrometry imaging-based metabolomics to visualize the spatially resolved reprogramming of carnitine metabolism in breast cancer. Theranostics, 2020, 10(16), 7070. [Google Scholar] [CrossRef]
  48. Yuan, B. , Schafferer, S., Tang, Q., Scheffler, M., Nees, J., Heil, J., Schott, S., Golatta, M., Wallwiener, M., Sohn, C., Koal, T., Wolf, B.; Schneeweiß, A.; Burwinkel, B. A plasma metabolite panel as biomarkers for early primary breast cancer detection. Int J Cancer, 2019, 144(11), 2833–2842. [Google Scholar] [CrossRef] [PubMed]
  49. Tsvetikova, S. A.; Koshel, E. I. Microbiota and cancer: host cellular mechanisms activated by gut microbial metabolites. Int J Med Microbiol, 2020, 310(4), 151425. [Google Scholar] [CrossRef] [PubMed]
  50. Girithar, H. N.; Staats Pires, A.; Ahn, S. B.; Guillemin, G. J.; Gluch, L.; Heng, B. Involvement of the kynurenine pathway in breast cancer: updates on clinical research and trials. Br J Cancer, 2023, 129(2), 185-203. [CrossRef]
  51. Dougan, M. M.; Li, Y.; Chu, L. W.; Haile, R. W.; Whittemore, A. S.; Han, S. S.; et al. Metabolomic profiles in breast cancer: A pilot case-control study in the breast cancer family registry. BMC Cancer, 2018, 18. [Google Scholar] [CrossRef] [PubMed]
  52. Jiang, P.; Sinha, S.; Aldape, K.; Hannenhalli, S.; Sahinalp, C.; Ruppin, E. Big data in basic and translational cancer research. Nat Rev Cancer 2022, 22(11), 625–639. [Google Scholar] [CrossRef] [PubMed]
  53. Liu, L.; Li, C. Comparative study of deep learning models on the images of biopsy specimens for diagnosis of lung cancer treatment. Journal of Radiation Research and Applied Sciences, 2023, 16(2), 10055. [Google Scholar] [CrossRef]
  54. Gonzales Martinez, R.; van Dongen, D. M. Deep learning algorithms for the early detection of breast cancer: A comparative study with traditional machine learning. Inform Med Unlocked, 2023, 41. [Google Scholar] [CrossRef]
  55. Sultana, J.; Jilani, A. K. Predicting Breast Cancer Using Logistic Regression and Multi-Class Classifiers. International Journal of Engineering & Technology 2018, (7), 22-26. [CrossRef]
  56. Alakwaa, F.M.; Chaudhary, K.; Garmire, L.X. Deep Learning Accurately Predicts Estrogen Receptor Status in Breast Cancer Metabolomics Data. J Proteome Res, 2018, 17(1), 337–347. [Google Scholar] [CrossRef]
  57. Singhal, S.; Rolfo, C.; Maksymiuk, A.W.; Tappia, P.S.; Sitar, D.S.; Russo, A.; et al. Liquid Biopsy in Lung Cancer Screening: The Contribution of Metabolomics. Results of A Pilot Study. Cancers 2019, 11(8):1069. [CrossRef]
  58. Zhang, L.; Zheng, J.; Ahmed, R.; Huang, G.; Reid, J.; Mandal, R.; et al. A High-Performing Plasma Metabolite Panel for Early-Stage Lung Cancer Detection. Cancers 2020, 12(3):622. [CrossRef]
  59. Rosato, A.; Tenori, L.; Cascante, M.; De Atauri Carulla, P.R.; Martins Dos Santos, V.A.P.; Saccenti, E. From correlation to causation: analysis of metabolomics data using systems biology approaches. Metabolomics. 2018, 14(4), 37. [CrossRef]
  60. Wishart, D.S. Computational approaches to metabolomics. In Methods in Molecular Biology, Clifton, N.J.; Humana Press Inc: Totowa, NJ, USA, 2010; 593, pp. 283–313. editor.
  61. Xia J.; Wishart, D.S. Using MetaboAnalyst 3.0 for comprehensive metabolomics data analysis. Curr. Protoc. Bioinform. 2016;55:14. [CrossRef]
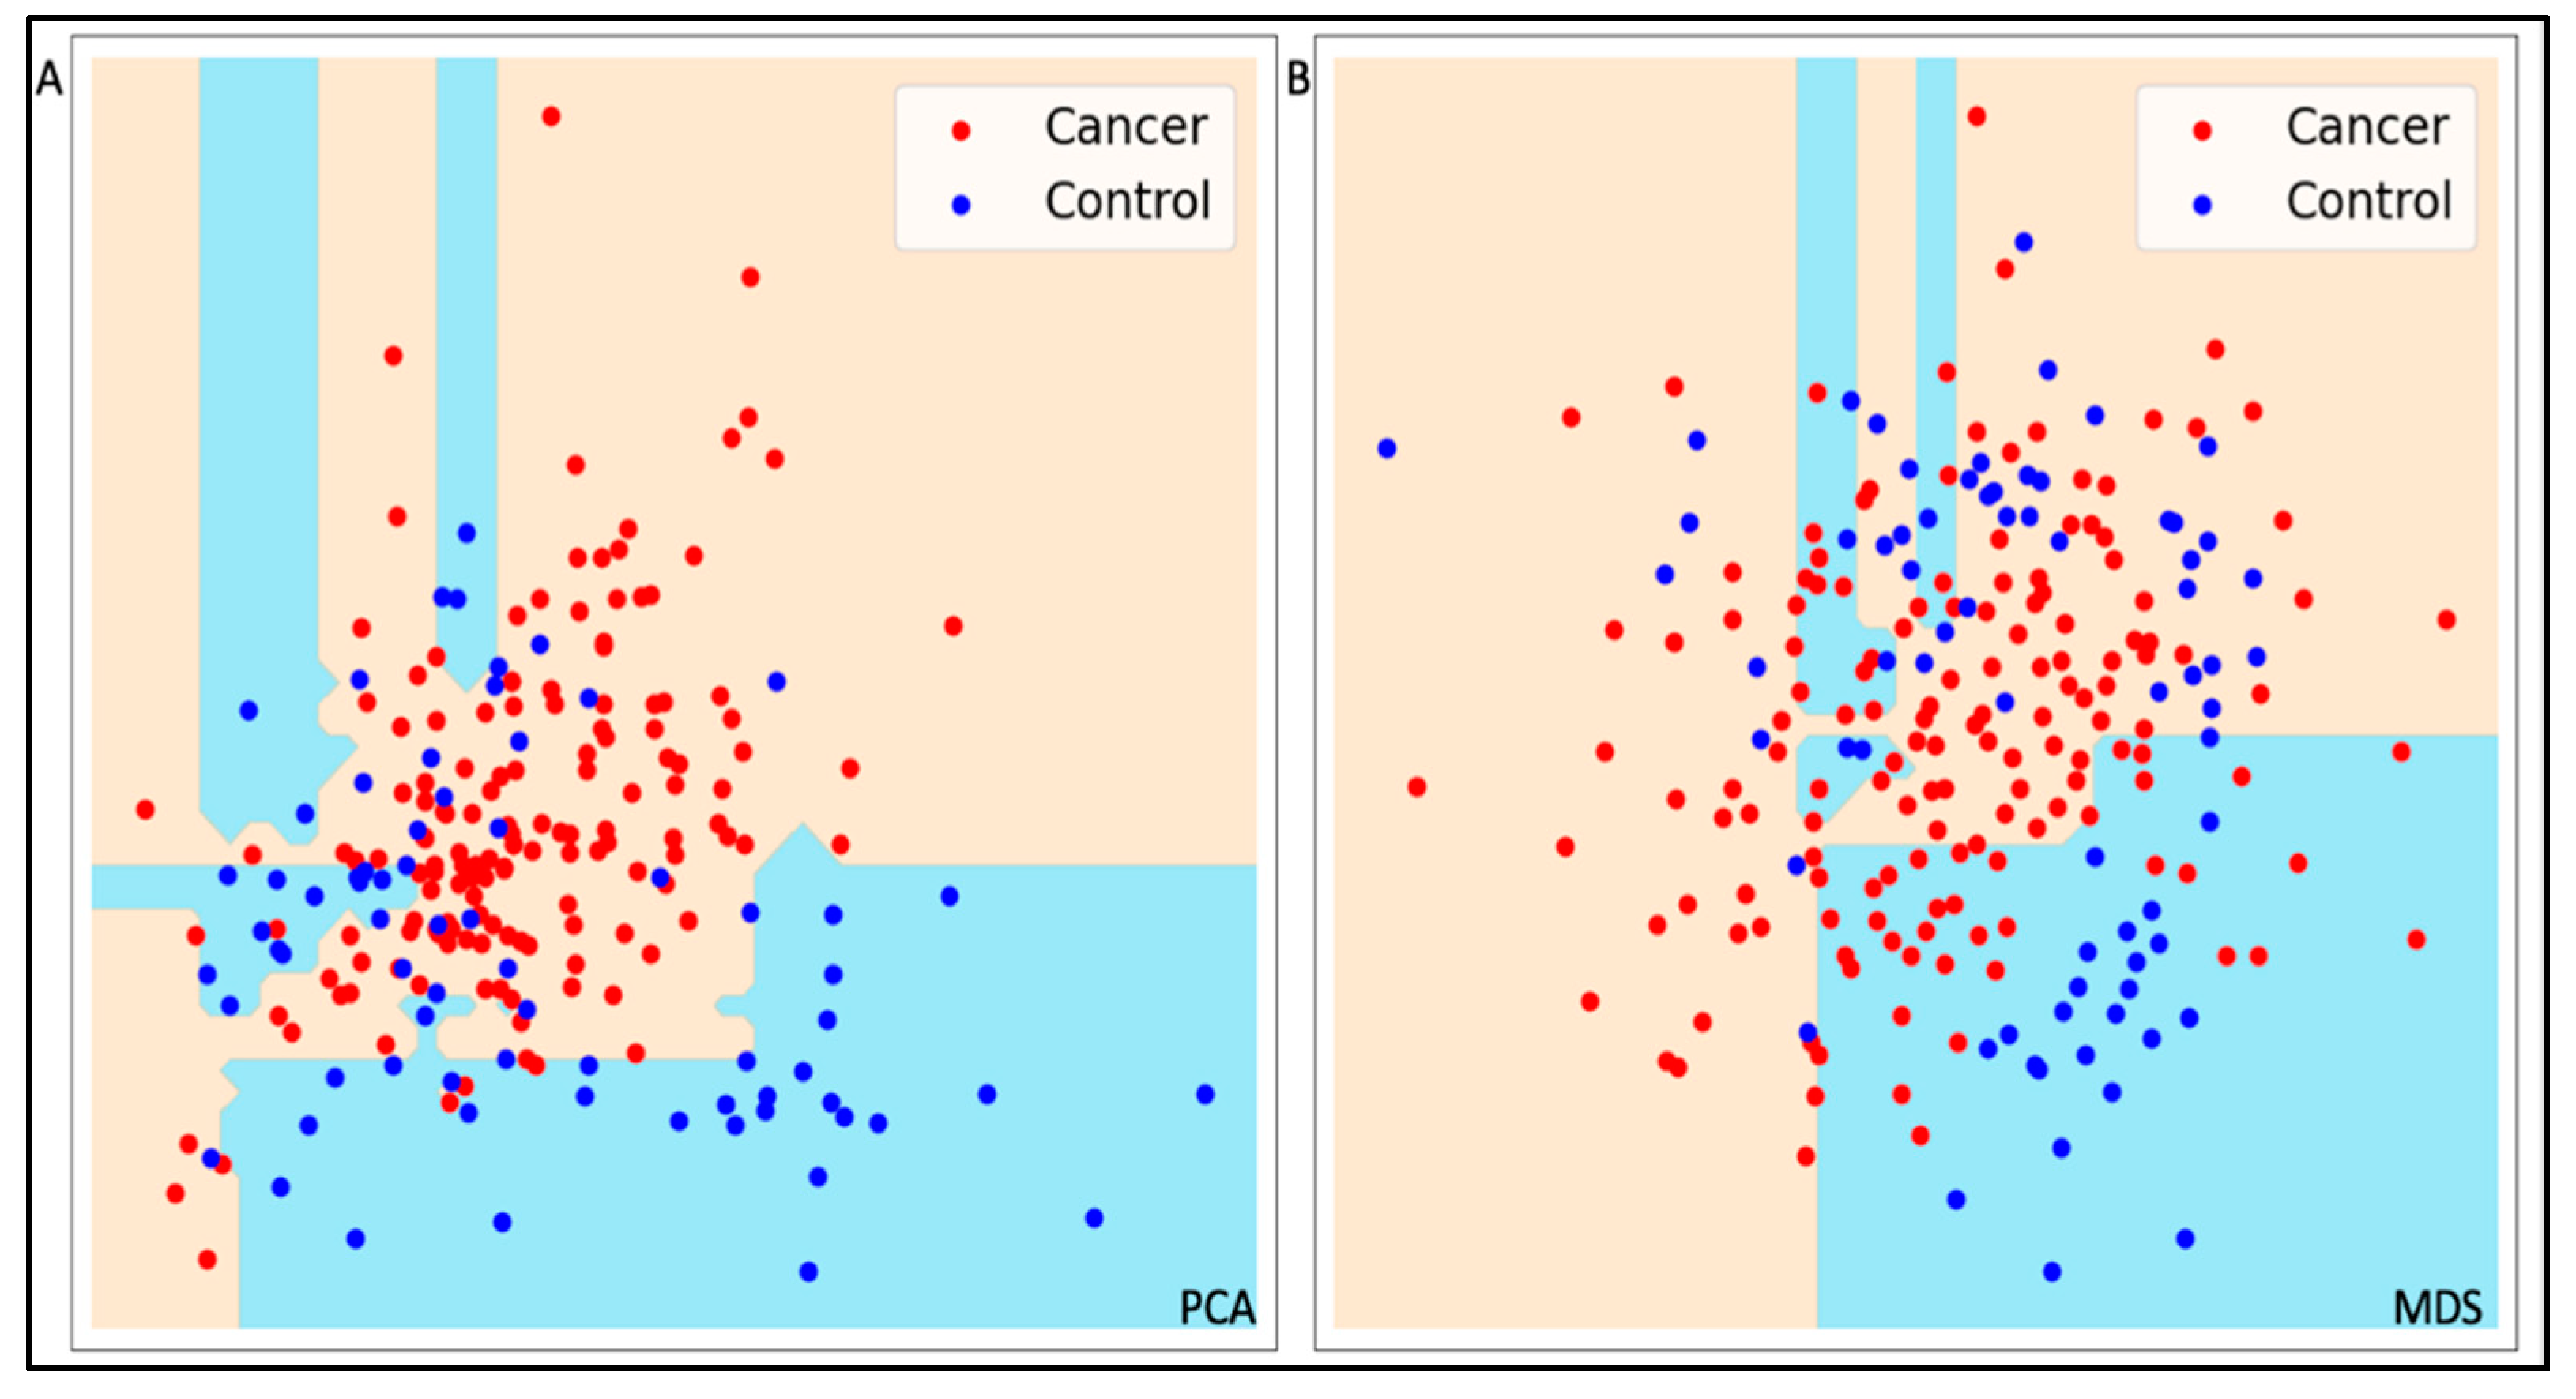
Figure 1. Comparison of Decision Tree models trained on a low-dimensional view of the data. (a) Decision Trees decision function on two PCA components; (b) Decision Trees decision function on two MDS components. Low-dimensional datasets display low separation between classes. Decision trees can distinguish between cancer and control for well-separated classes only.
Preprints 106550 g001
Figure 2. (a) Heatmap of all features; (b) Heatmaps of 6-feature panel. A greater separation between control and cancer cases is seen in this subset; (c) Distribution of features in cancer (blue) vs control (orange) cases.
Preprints 106550 g002
Figure 3. AUC Curves for SVMs and LR on the data subsets. Feature sets A through I are derived from the combinations of SVMs, Univariate Naïve Bayes and PCA feature selection strategies. Feature set K includes the best 6 features derived by excluding 2 metabolites and smoking history from feature set H and adding a metabolite ratio.
Preprints 106550 g003
Figure 4. Word could of significant metabolites in the literature. The text size represents the prevalence of the biomarkers in the reviewed literature.
Preprints 106550 g004
Figure 5. Correlation between features at different correlation levels. The first three panels include raw and scaled data correlations, followed by correlations after one of the highly correlated columns was dropped. The second row of figures shows correlations after highly correlated columns are recursively combined.
Preprints 106550 g005
Figure 6. (a) 2D projection with 2 components; (b) PCA projection with 3 components. Although variance explained improvers with higher level correlations, separation between classes does not.
Preprints 106550 g006
Figure 7. Feature selection workflow starting with variables identified by Naive Bayes, SVMs and PCA. The 3 sets of variables were combined using intersection and union between two sets at a time.
Preprints 106550 g007
Table 1. SVMs with bagging performance metrics on 9 data subsets.
Dataset Sensitivity Specificity Accuracy FI Score AUC
A: 59 features 100% 100% 100% 100% 100%
B: 50 features 100% 25% 88% 67% 96%
C: 15 features 95% 75% 92% 85% 97%
D: 92 features 100% 88% 98% 96% 100%
E: 67 features 100% 88% 98% 96% 100%
F: 50 features 100% 25% 88% 67% 96%
G: 17 features 97% 62% 92% 83% 98%
H: 7 features 95% 100% 96% 93% 98%
I: 15 features 95% 75% 92% 85% 97%
Disclaimer/Publisher’s Note: The statements, opinions and data contained in all publications are solely those of the individual author(s) and contributor(s) and not of MDPI and/or the editor(s). MDPI and/or the editor(s) disclaim responsibility for any injury to people or property resulting from any ideas, methods, instructions or products referred to in the content.
Copyright: This open access article is published under a Creative Commons CC BY 4.0 license, which permit the free download, distribution, and reuse, provided that the author and preprint are cited in any reuse.
Prerpints.org logo

Preprints.org is a free preprint server supported by MDPI in Basel, Switzerland.

Subscribe

© 2024 MDPI (Basel, Switzerland) unless otherwise stated