Preprint
Article

Study on Comprehensive Evaluation and Key Influencing Factors of Rural Building Energy Consumption from Energy-Building-Behavior Composite Perspective

Altmetrics

Downloads

90

Views

34

Comments

0

Submitted:

14 May 2024

Posted:

15 May 2024

You are already at the latest version

Alerts
Abstract
A comprehensive evaluation system of rural building energy consumption from a innovative composite perspective is established, which is suitable for southwest China. the brainstorming method and Delphi method were used to establish the indicator system, the ANP method was applied to calculate the weights of the comprehensive evaluation model, the scoring criteria of all evaluation indexes are constructed based on fuzzy evaluation theory, the applicability of the model is verified by an example of the countryside around Chengdu. The results showed that the score of some factors is low, whole or part area, just like the percentage of clean energy use(C24), the thermal performance of external walls(E21), the implementation of energy-saving measures(S22), were key factors affecting the target level, which has greater potential for improvement. The distribution of comprehensive indicators and evaluation factors have certain spatial distribution characteristics, the overall spatial distribution shows the characterwastic of "high in the southeast and low in the northwest". The key factors and spatial distribution characteristics found can be used as an important basis for the improvement of green energy-saving promotion measures, energy-saving retrofit programmes were proposed in terms of additional solar room, energy-saving of external walls and air-conditioning temperature setting guidance.
Keywords: 
Subject: Engineering  -   Architecture, Building and Construction

1. Introduction

Global warming, pollution, extreme climate and other environmental problems caused by energy consumption have attracted wide attention of scholars. The whole life cycle of housing construction contributes a lot of energy consumption, becoming one of the largest components of energy consumption in today’s society. Both in United States and Europe (Han et al., 2021)[1], the building sector is responsible for 39% and 40% of energy consumption and 38% and 36% of CO2 emissions, respectively. At the same time, it accounts for a quarter of China’s total emissions from energy consumption (Zhang et al., 2020)[2].
According to the latest China Energy Statistics Yearbook 2022, per capita domestic energy consumption in rural areas has increased from 132 kilograms of standard coal (kgce) in 2000 to 529 kgce in 2021, more than tripling per capita energy consumption. With energy consumption in rural areas increasing year by year, China has placed the issue of energy consumption and carbon emissions in rural areas at a high level of importance. This is evident in their proposal to promote energy-saving renovations of farm buildings, construction of green farm buildings, and use of clean energy (Liu et al., 2023)[3].
To investigate the causes of high energy consumption in buildings, scholars have studied various building factors (Tso and Guan, 2014; Baker, Rylatt, 2008)[4,5]. These studies aim to identify factors that significantly impact energy consumption. They recommend alternative building designs, such as window design or choice of roofing materials (Saadatian et al., 2021; Mano and Thongtha, 2021)[6,7], and analyze the impact of single factors, such as wall thickness, external windows, and solar chimneys, on the building’s energy consumption, with respect to building characteristics (Wang, 2017; Marincu et al., 2024; Wang et al., 2024; Bosu et al., 2023)[8,9,10,11]. Scholars have investigated the impact of environmental changes on building energy consumption (Li et al., 2021)[12]. This includes the effects of temperature changes (Omer, 2007; Yuan et al.,2024)[13,14] and solar radiation (Callegas et al., 2021)[15].Additionally, they have studied the effects of façade geometry on visual comfort and energy consumption under four different climatic conditions in Iran (Mahdavinejad et al., 2024)[16]. Previous studies have examined the influence of energy consumption behaviors on building energy usage (Wei et al., 2022)[17]. For instance, statistical analyses have been conducted on factors such as occupant behaviors and energy conservation awareness, resulting in the identification of three types of behaviors: active, intermediate, and careless. These behaviors were then analysed to determine their impact on building energy consumption (Duan et al., 2023; Hax et al., 2022; Xu et al., 2023)[18,19,20].
Most of the studies mentioned above focus solely on factors that influence unilateral energy consumption, such as building, environment, or energy use behavior. However, they often overlook the fact that building energy consumption is a complex and dynamic system. Therefore, it is necessary to analyse the system from a composite perspective (Lee, Cheng, 2015)[21]to understand the interaction between the various influences. Building operation accounts for a significant proportion of energy consumption. To achieve the goal of low energy consumption and low carbon emissions in rural buildings, it is necessary to evaluate building energy consumption from a composite Energy-Building-behavior perspective.
At the same time, the regional characteristics of the evaluation model should also be considered. China’s previous comprehensive evaluation of rural human settlements and green buildings was mostly applied to the eastern coastal areas and the northern plain, while the rural comprehensive evaluation system under mountainous conditions was very lacking. Scientific research work in this field should be continued to provide theoretical and data support for building a well-off society in an all-round way.
Based on this, innovatively, based on the composite perspective of Energy-Building-behavior, the field of rural human settlements and green buildings is considered, a comprehensive evaluation model of building energy consumption in rural areas of Southwest China was constructed, 20 villages around Chengdu were selected for case studies to quantify the level of building energy consumption, key factors were identified, energy-saving retrofitting options were explored. The evaluation system can provide an easy-to-operate and effective tool for promoting low-carbon energy development in rural areas.

2. Research Process

2.1. Research Framework

Figure 1 shows the research framework diagram. The influencing factors were sorted out using brainstorming and Delphi methods. An evaluation index system for rural building energy consumption was constructed, and the weights of each index were determined using the expert consultation method and ANP method. The scoring standard of each index was determined using the energy simulation method, linear interpolation method, and fuzzy theory. The case of werea was selected for data collection. The spatial distribution pattern of low carbon degree (LCD) of building energy consumption was derived by analyzing the evaluation results and research data using ArcGIS interpolation. Based on the evaluation results, targeted building energy efficiency retrofit programs were proposed.

2.2. Construction of Evaluation Models

2.2.1. Construction of an Evaluation Index System and Weight Calculation

Various factors affect energy consumption in rural areas, and multiple indicators are analyzed comprehensively. Studies have used different metrics to quantify energy consumption levels, including the energy sustainability index (Lan et al., 2022; Koray et al., 2020)[22,23], energy vulnerability index(Tatiana et al., 2022; Tian et al., 2022)[24,25], energy intensity index (Marco et al., 2022)[26], and energy composite index (Ghafarian and Faridzad, 2021; Suwin et al., 2021; Cheng et al., 2019)[27,28,29]. This study aims to quantify energy consumption using a new comprehensive evaluation index, the Low Carbon Degree (LCD).
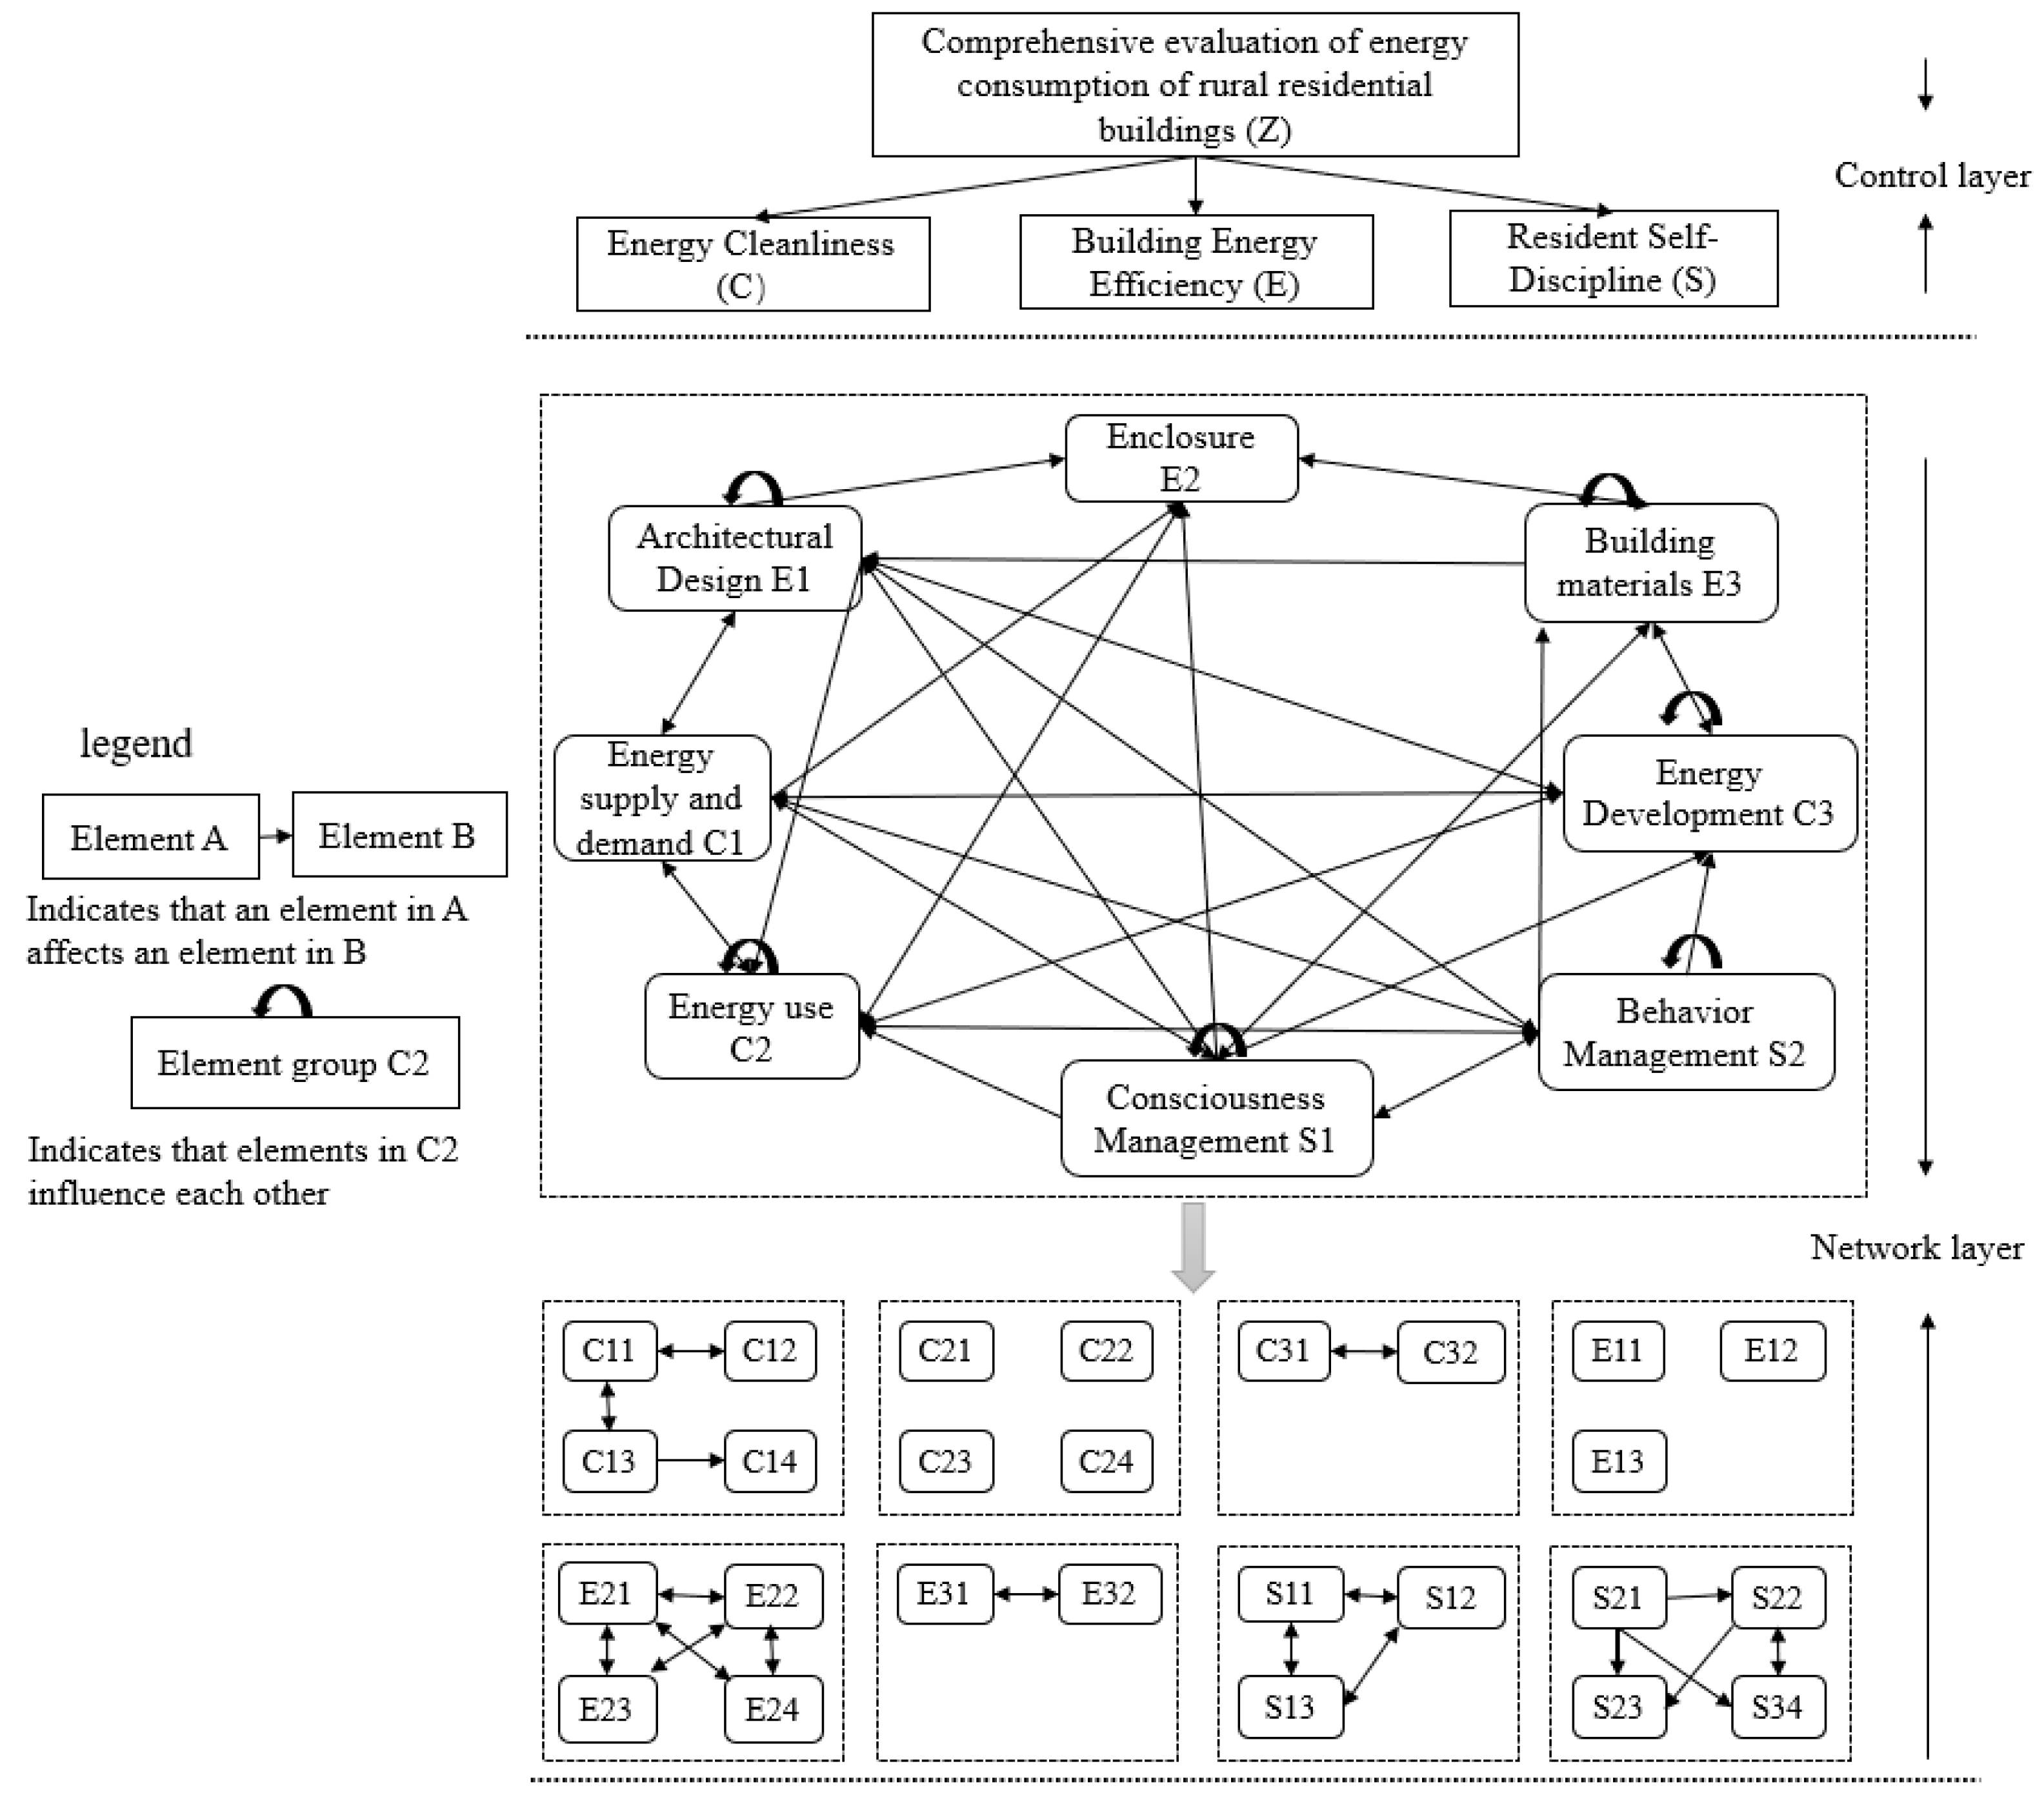
The evaluation indicator system consists of four levels: the objective level, the criterion level, the sub-criterion level, and the factor level. The research focuses on rural buildings and aims to achieve open-source and cost-saving principles. The target layer is LCD, and the criterion layer includes energy cleanliness (C), building energy-saving (E), and residents’ self-discipline (S). These criteria are based on the three aspects of energy’s own attributes, the spatial carriers of energy utilization, and the implementers of energy utilization. Figure 2 shows the framework of the indicator system. Two rounds of brainstorming were used to select indicators. Then, two rounds of the Delphi method were carried out to optimize the indicators. Finally, 8 sub-criteria layers and 26 factor layers were obtained, and the evaluation indicator system is shown in Table 1 as the equal columns of criterion layers, defining the model as a CES model based on the criterion layer.
The weight coefficients of the factor indicators were calculated using the Analytic Network Process (ANP) method. Figure 3 shows the network structure among the indicators. The interrelationships between the indicators were determined through expert consultation and questionnaires. The importance of the two indicators was evaluated using a judgement matrix. The consistency of the matrix was verified and the weights were determined through limit supermatrix calculation. The weighting results are presented in the corresponding columns of Table 1.

2.2.2. Criteria for Classifying Indicators and Low Carbon Intensity of Energy Consumption Determination

The set of objective indicators were evaluated based on specific values and scored using linear interpolation according to national or local standards, current norms, and statistical yearbooks. Data sources include field measurements and observations. Quantitative values cannot directly reflect subjective evaluation indicators. Therefore, we collected data through a questionnaire that captured the interviewee’s subjective feelings. We then used fuzzy mathematical theory to quantify these indicators. The grading criteria for specific indicators are shown in the standardised value columns of Table 1.
LCD is used as a measure of energy consumption levels and is dependent on the guideline tier scale:
L C D = F C , E , S
Equation (2.1) describes the functional relationship between the three criterion layers, C, E, and S, and the sub-criterion layer. It can be written as L C D = F ( f C ( C i ) , f E ( E i ) , f S ( S i ) ) , where Ci, Ei, and Si represent the sub-criterion layer and i represents the number of sub-criterion layers. The sub-functions are derived as follows:
C = f C C i = i = 1 i = 3   w C i C i = i = 1 , j = 1 i = 3 , j = m   w i j C i j
E = f E E i = i = 1 i = 3   w E i E i = i = 1 , j = 1 i = 3 , j = n   w i j E i j
S = f S S i = i = 1 i = 3   w S i S i = i = 1 , j = 1 i = 3 , j = l   w i j S i j
The weight coefficient for each level of indicators is denoted by ‘w’. ‘j’ represents the number of factor layers, while ‘m’, ‘n’, and ‘l’ represent the number of factors corresponding to the sub-criterion layer. Equation (2.5) shows the functional relationship between LCD and the criterion and factor layers.:
L C D = 0.559 C + 0.297 E + 0.144 S                 = 0.041 C 11 + 0.016 C 12 + + 0.013 S 24 #

2.3. Application of Evaluation Model

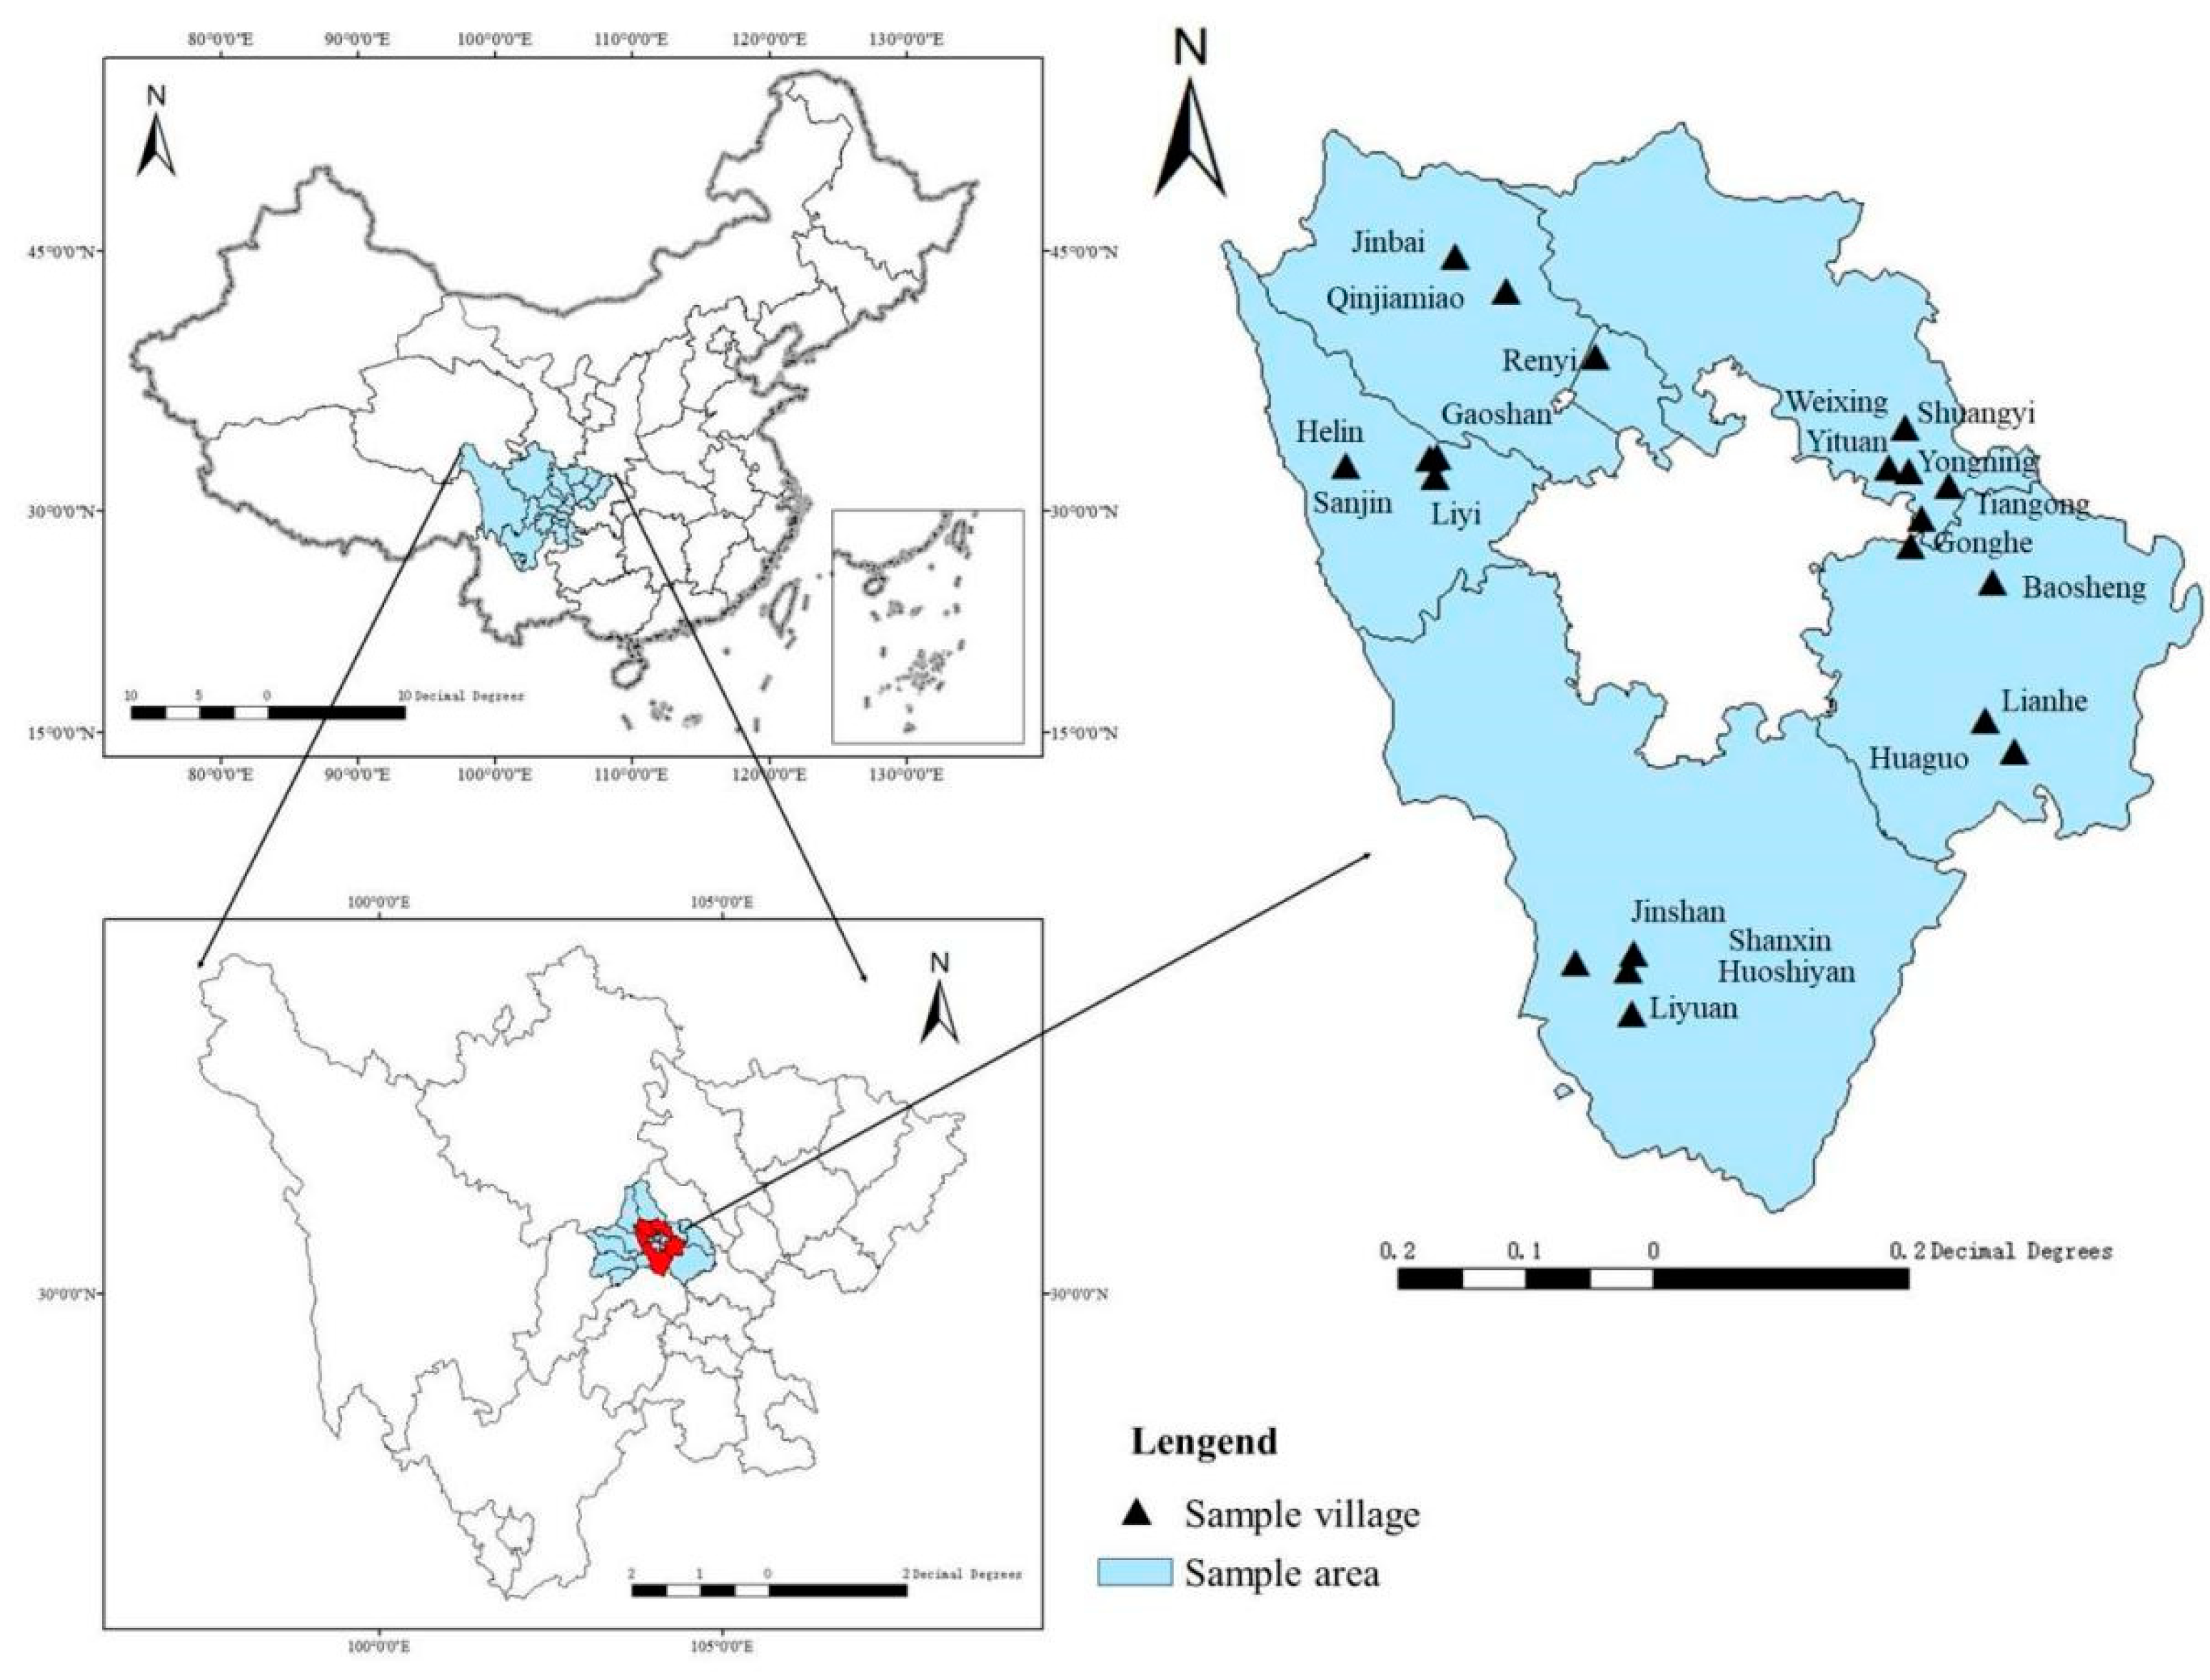
There is a lack of research on low carbon assessments of energy use in the South West countryside. Chengdu, as the centre of the Southwest region, demonstrates the development achievements of the countryside in recent years. Its investment in energy infrastructure outperforms that of villages in other regions. The evaluation results are instructive for energy planning and align with the objectives of this academic research. A multi-stage stratified sampling method was used to select the second circle of Chengdu City District, namely Pidu District, Xindu District, Longquanyi District, Shuangliu District, and Wenjiang District, within a 30 km regional radius from the southeast, northwest, and west of the main city of Chengdu. This was done to ensure the objectivity of the research object. In this study, 20 villages were sampled across five districts, including 6 model villages and 14 ordinary villages. The specific locations of the sampled households are shown in Figure 5 below. A total of 550 households were surveyed, and 521 valid responses were obtained, resulting in a valid questionnaire percentage of 94.73%.
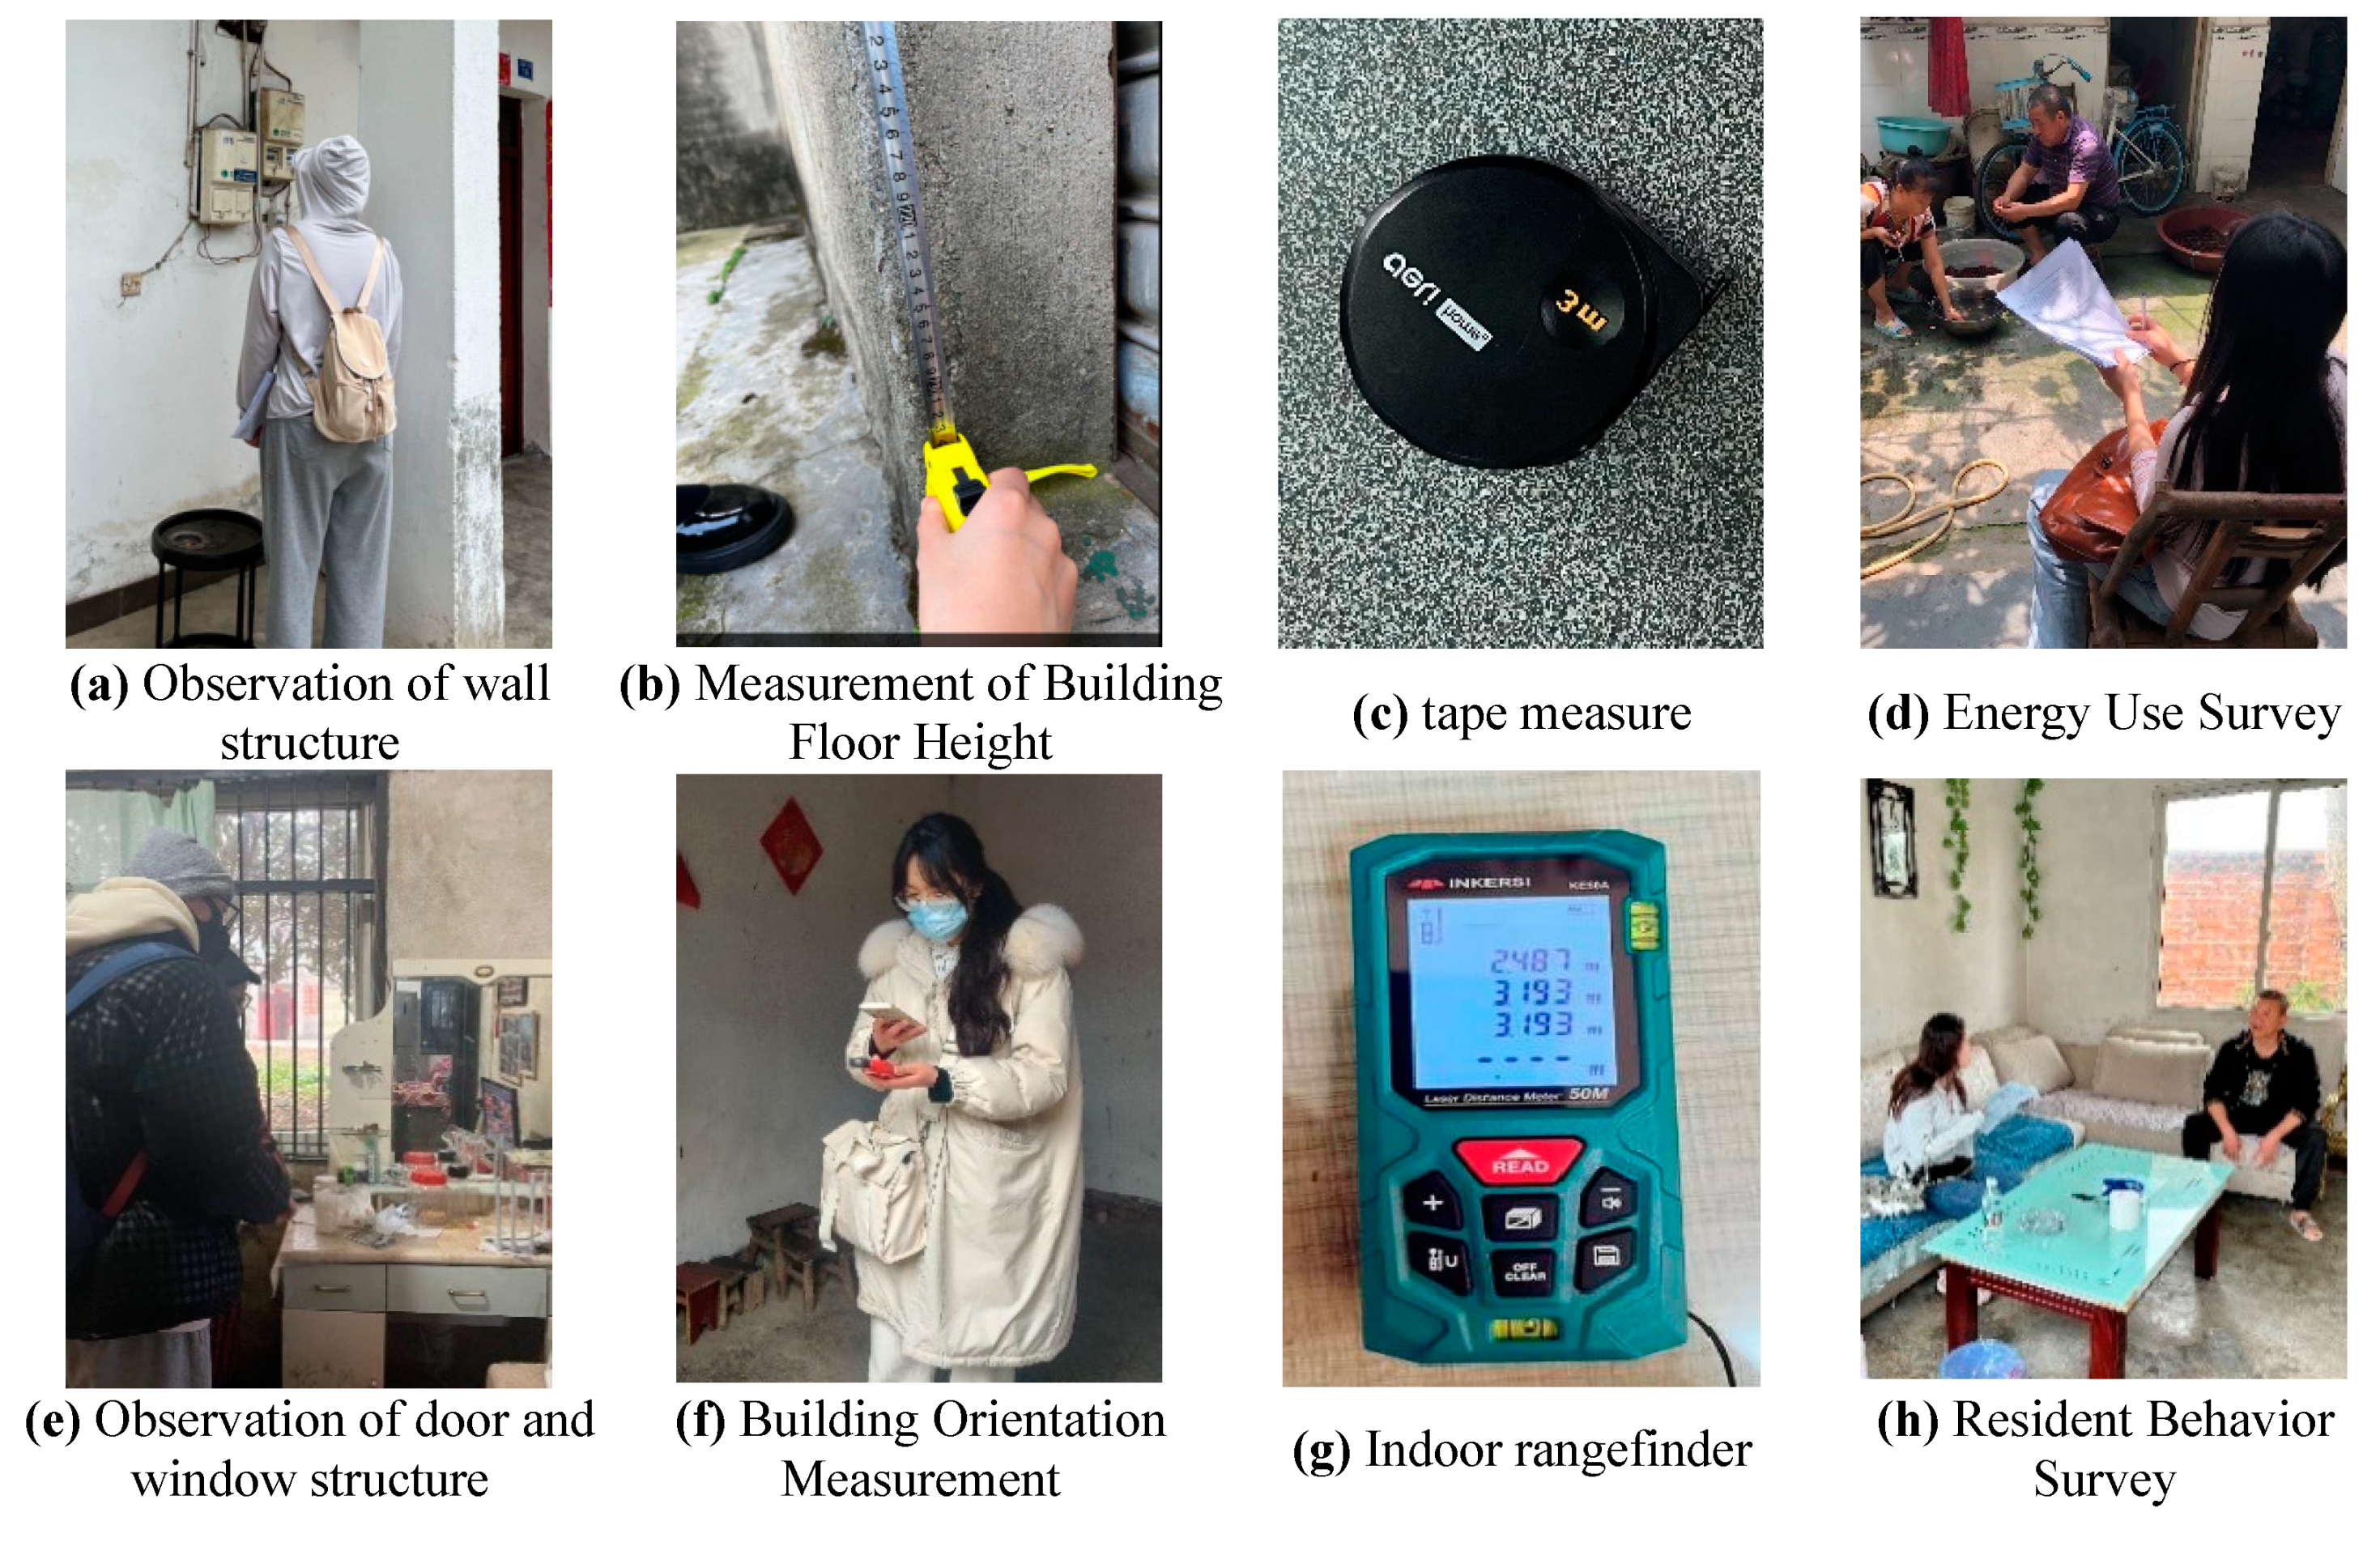
The data were collected through field observations, field measurements, and questionnaire interviews. Field observations provided data on indicators such as envelope E2 and building material E3 (materials and construction of building walls, windows, doors, shading, roofing, etc.). Field measurements provided data on E1 indicators of building design (orientation, depth, height of floors, etc.). (1) Building inspection: data on building structure and materials; (2) Energy audit: data on energy supply and demand, energy use, and energy development indicators; and (3) Questionnaire interviews: data on awareness and behavioral management indicators, including the structure of household energy consumption, satisfaction with energy supply and demand, consumption of various types of energy, and residents’ behavior in regulating room temperatures, controlling indoor lighting, and managing standby equipment. Figure 5 below displays the specific research process and tools used for field measurements.

3. Results and Discussion

The evaluation model was applied in the case of werea to obtain the factor score by combining research data and grading criteria of the indicator factor. Equations (2.2), (2.3), (2.4), and (2.5) were used to calculate the combined evaluation values for the guideline and target layers. The results are presented below.

3.1. Evaluation Results and Discussion of Energy Cleanliness (C)

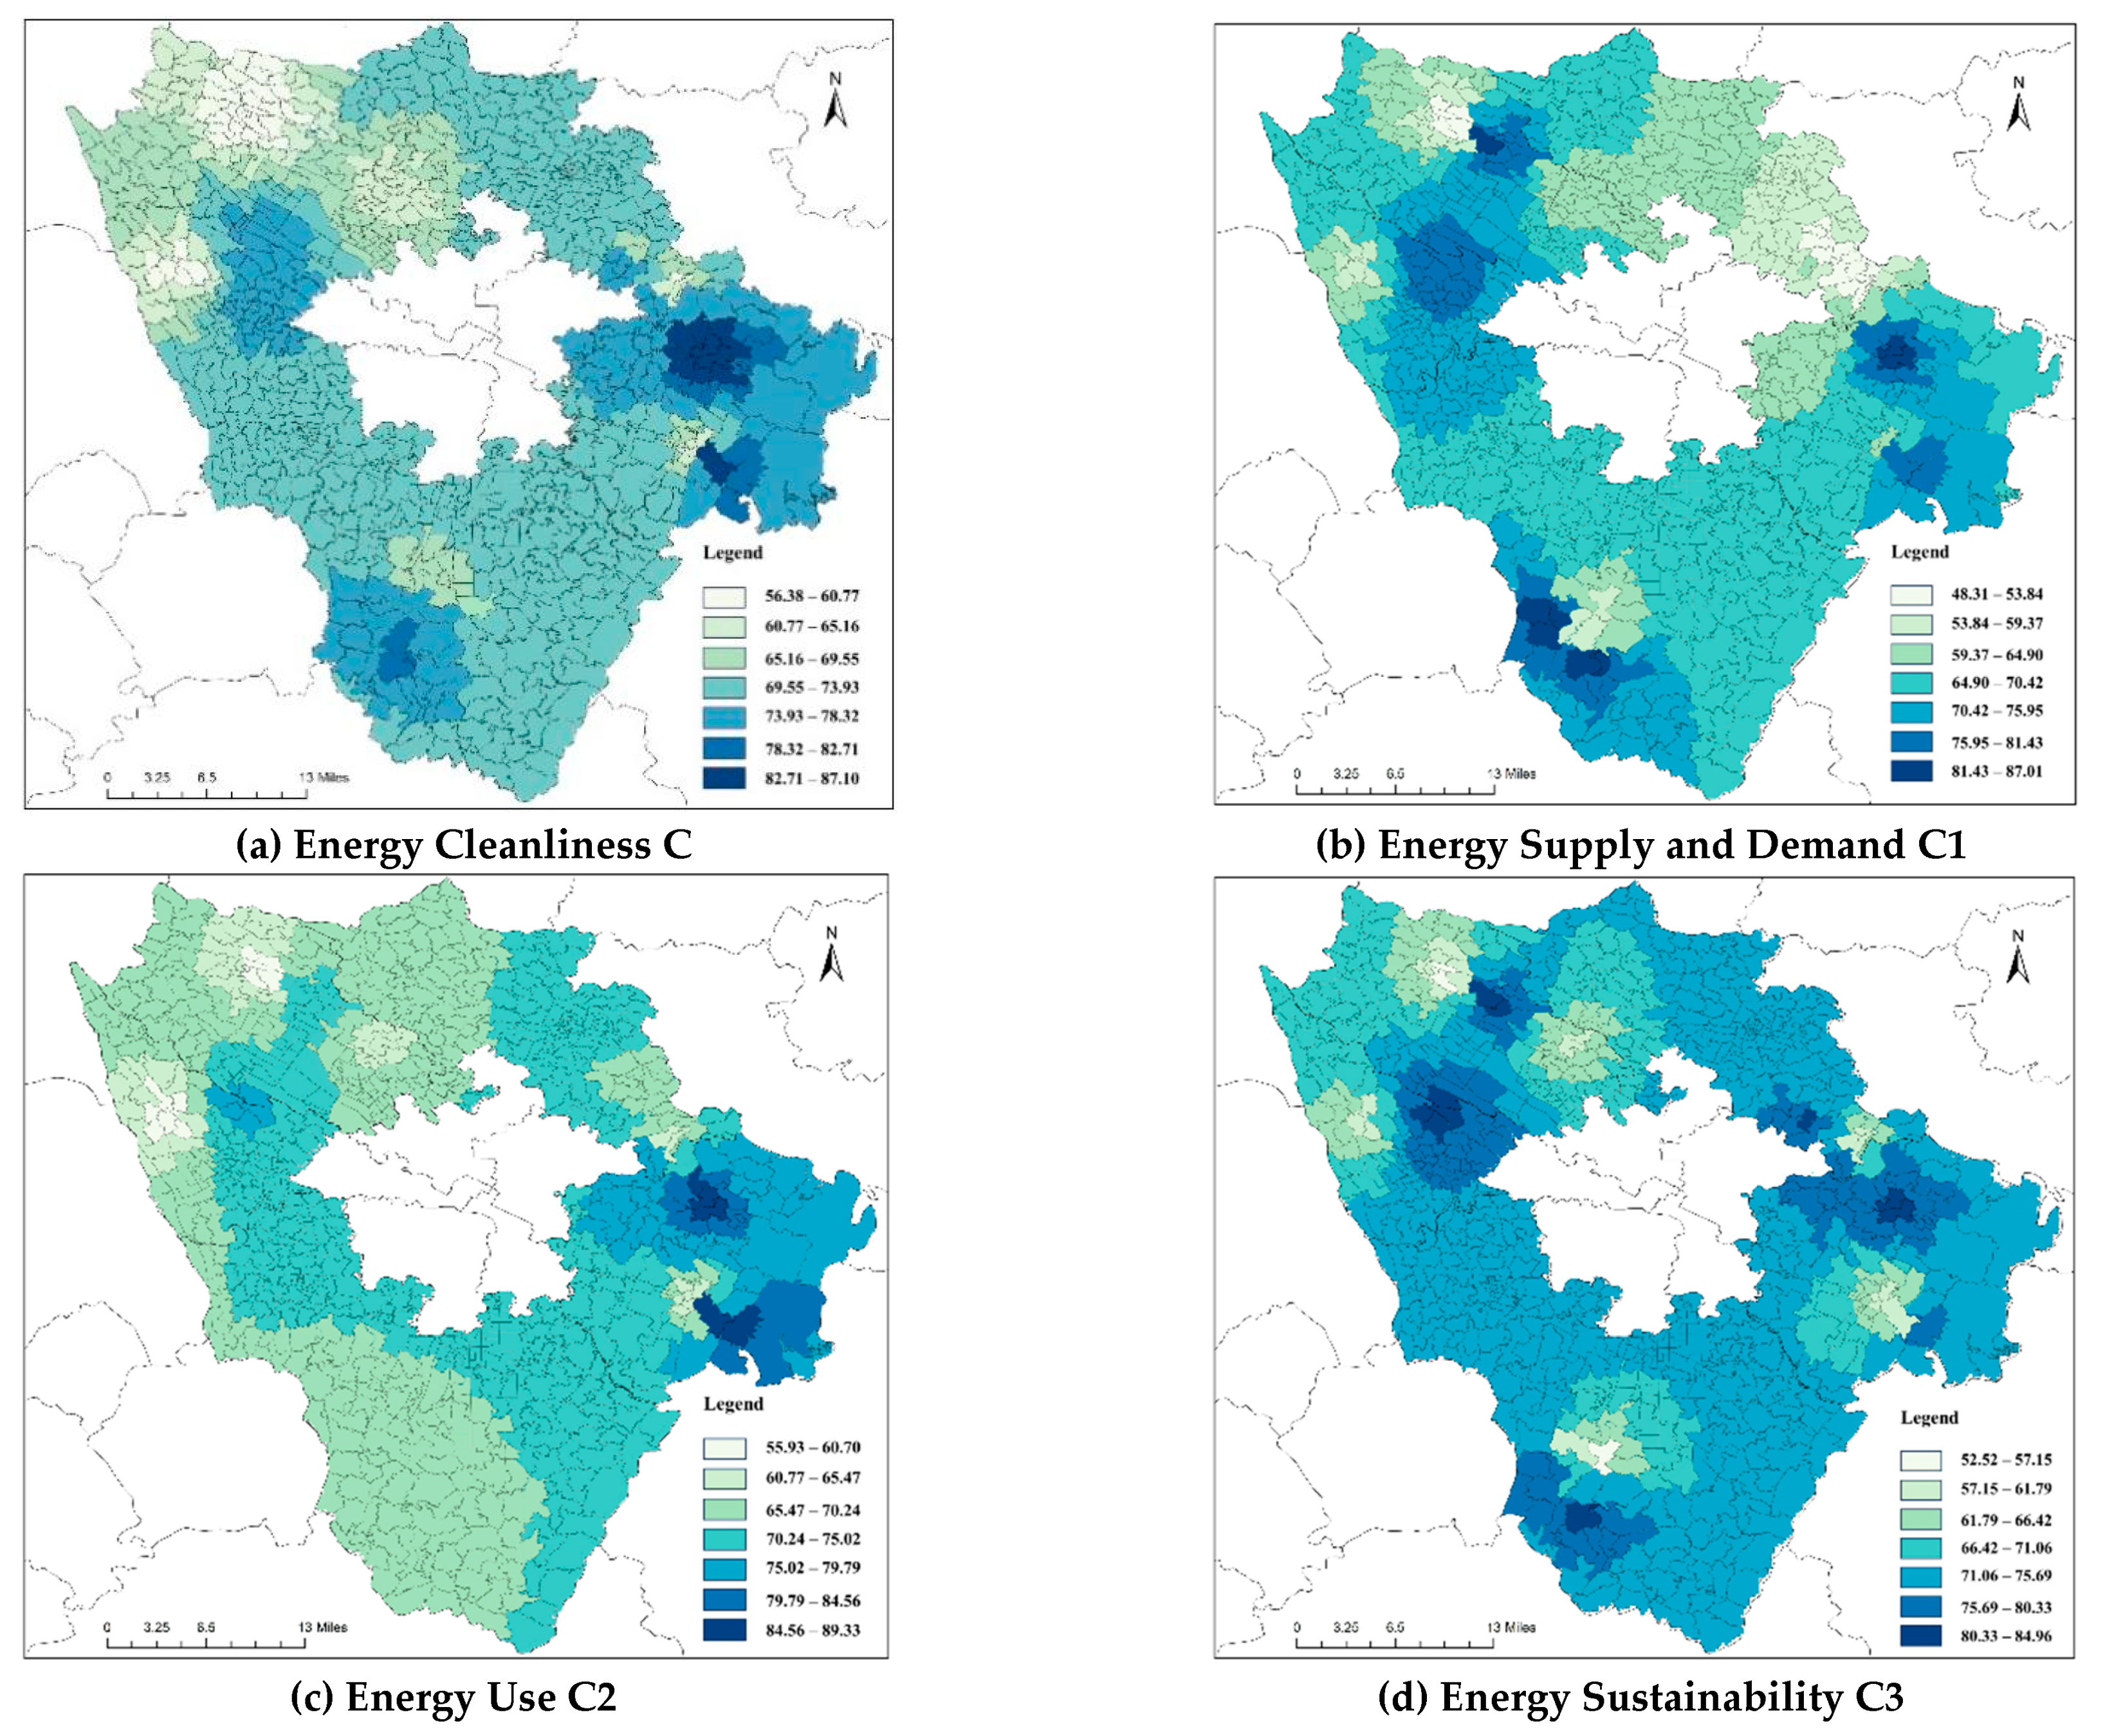
The Energy Cleanliness (C) category comprises nine factors, including Clean Energy Demand Satisfaction (C11). The distribution pattern of factor values shows that C11 has a small, extreme difference in the distribution of values, which all fall within the range of 60.00-75.87. The same distribution pattern applies to factors C12, C13, and C14. The ratio of clean energy use, C24, in the distribution of extreme differences has an average value of 77.03 and a maximum value of 89.82 (Shuangliu District Liyuan Xincun), which is higher than the average value by 16.60%. The minimum value is 55.58 (PiDu District, JinBaiCun a), which is lower than the average value by 27.85%. This distribution pattern arises due to differences in domestic energy choices of farmers, as well as the high weight score of C24.
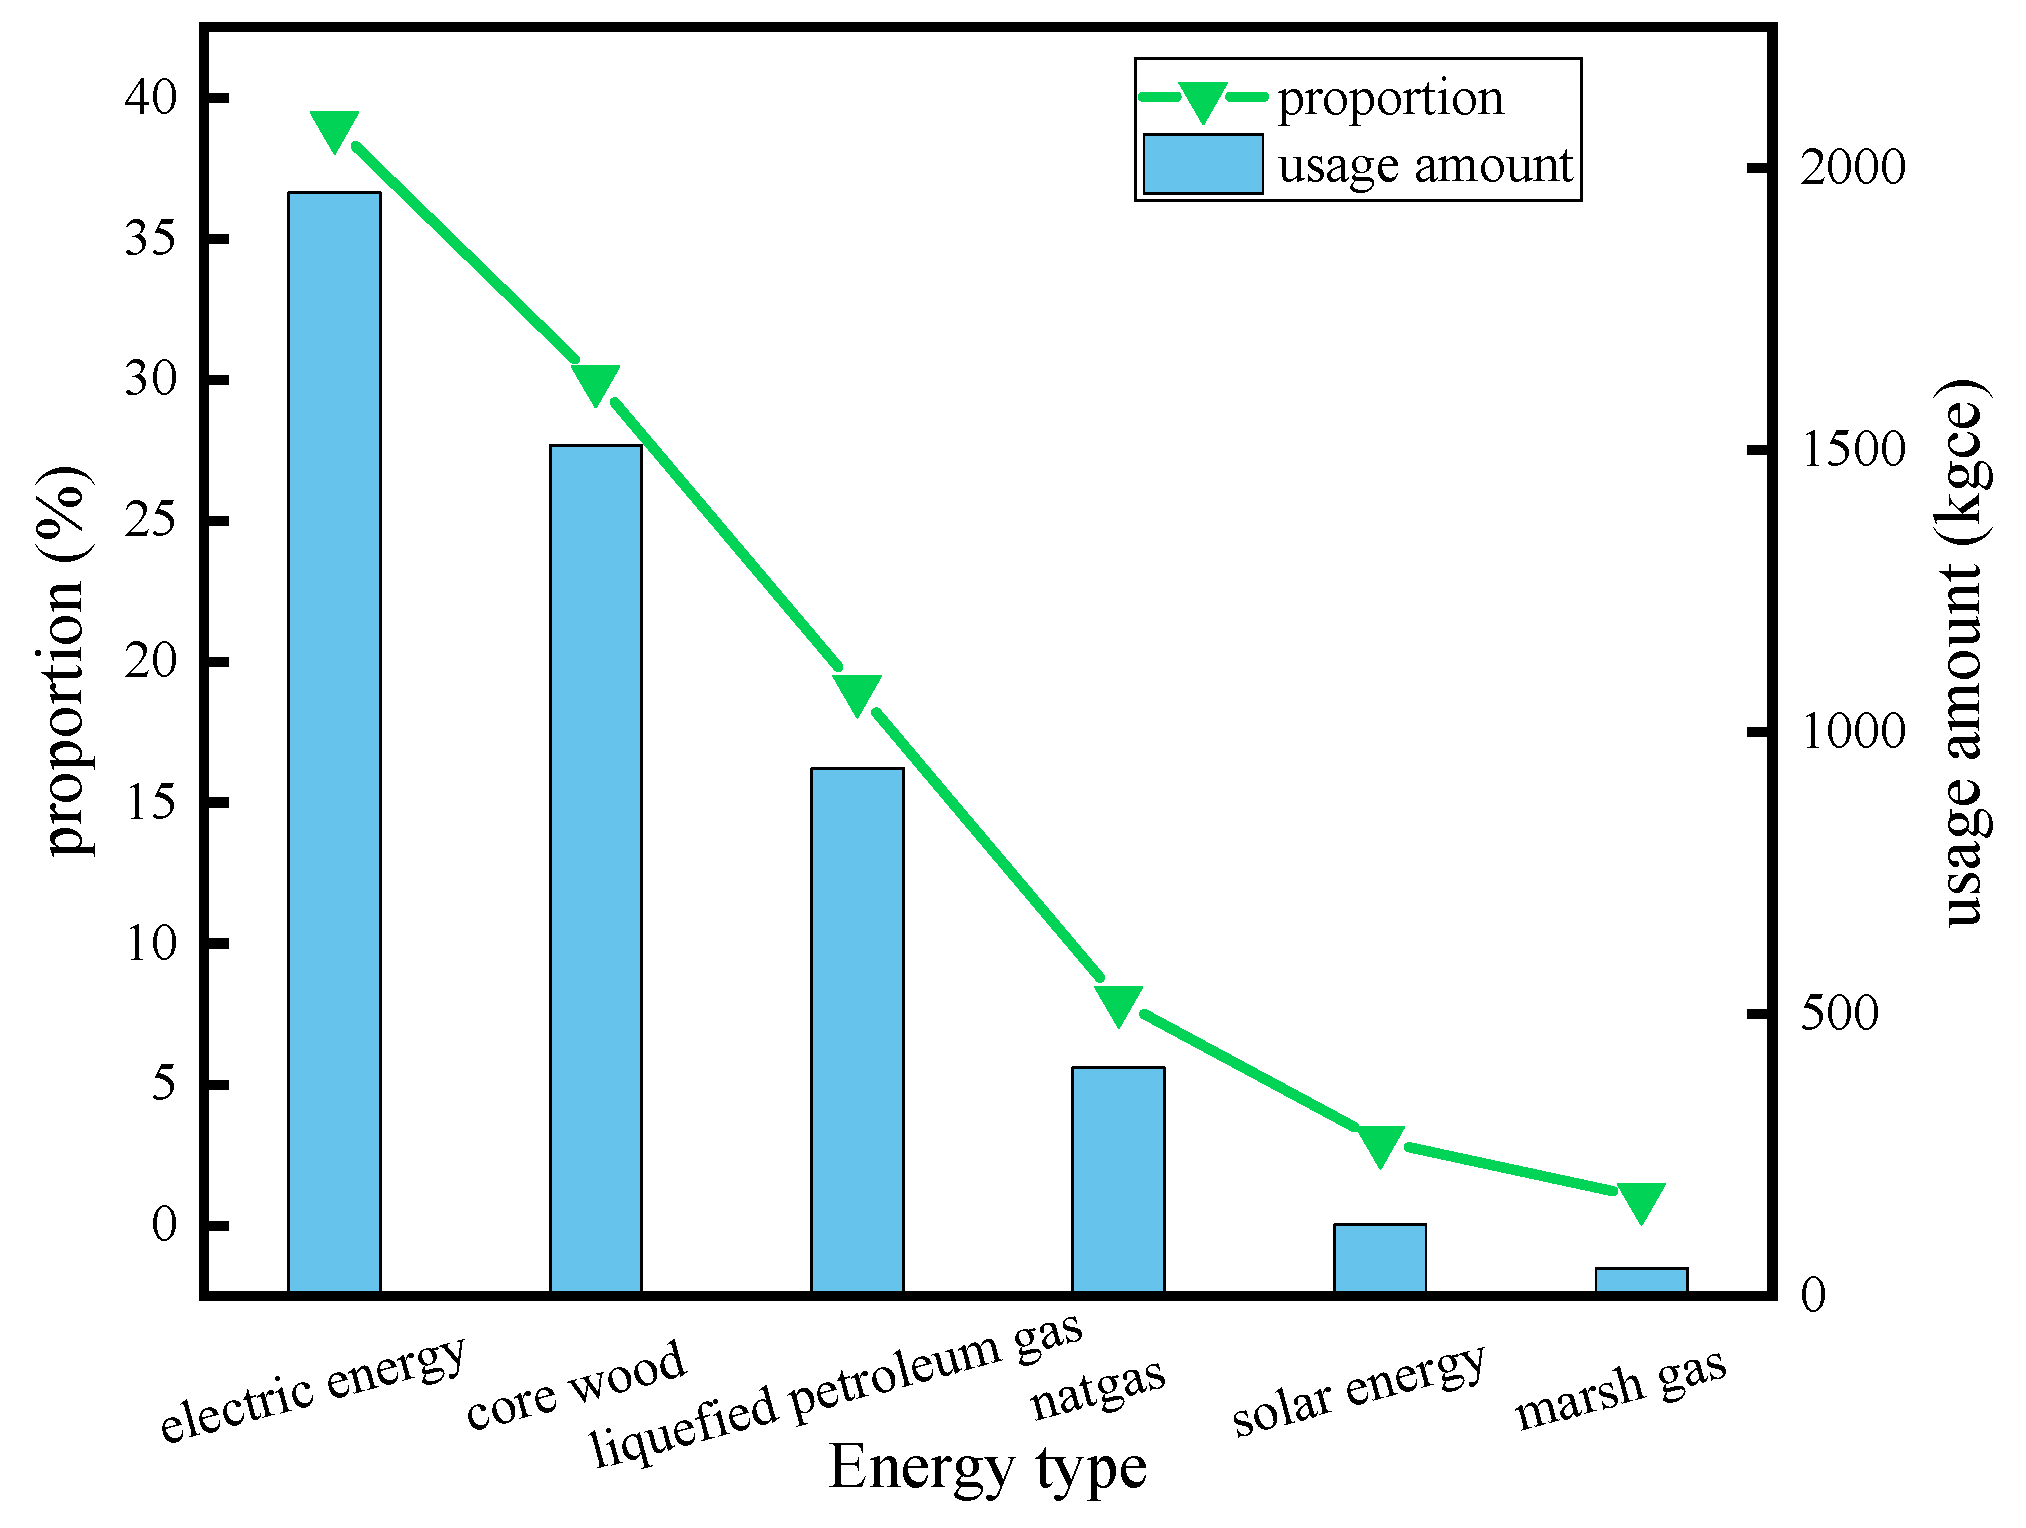
In the case, the types of energy used for domestic purposes, in order of percentage, were electricity, fuel wood, LPG, natural gas, solar energy, and biogas, with 39.29%, 30.30%, 18.77%, 8.13%, 2.53%, and 0.98%, respectively, as shown in Figure 6. The research data indicates that Shuangliu District has a high natural gas penetration rate and a high percentage of clean energy, as high as 75.30 per cent, with a C24 score of 80.99. In PI, the gas infrastructure was relatively weak, and the proportion of clean energy use was only 62.30%, resulting in a low carbon score of 64.96 for C24.
Figure 6 shows low utilisation of solar energy and biogas by the residents of the case. The investigation of reasons for not using solar energy revealed that the intensity of solar radiation could not meet the demand for hot water supply. Statistics were kept on the reasons for not using biogas. There are differing opinions among residents regarding the use of biogas. Some believe that there was a shortage of biogas feedstock, while others argue that it was unnecessary to use biogas when LPG, natural gas, and other alternatives were available.
The interpolation method was used to analyse the C-indicators of Energy Cleanliness based on the evaluation values, using ArcGWAS. Figure 7 demonstrates the spatial distribution of the composite evaluation values. A general downward trend in the values of the C-indicator was observed from south-east to north-west in the rural areas around Chengdu. The highest value of the C-indicator was 87.14 (Huaguo Village, Longquanyi District), and the lowest value was 56.37 (Jinbai Village, Pidu District). The Longquanyi district is situated in the Longquan mountain range and experiences high solar radiation. It has a rich energy structure with 80% natural gas distribution and a C-indicator value of 77.20. However, gas infrastructure is relatively weak in some parts of Pidu, and energy consumption is dominated by fuelwood, resulting in a lower C-indicator value of 66.56.

3.2. Results and Discussion of Building Energy Efficiency (E) Evaluation

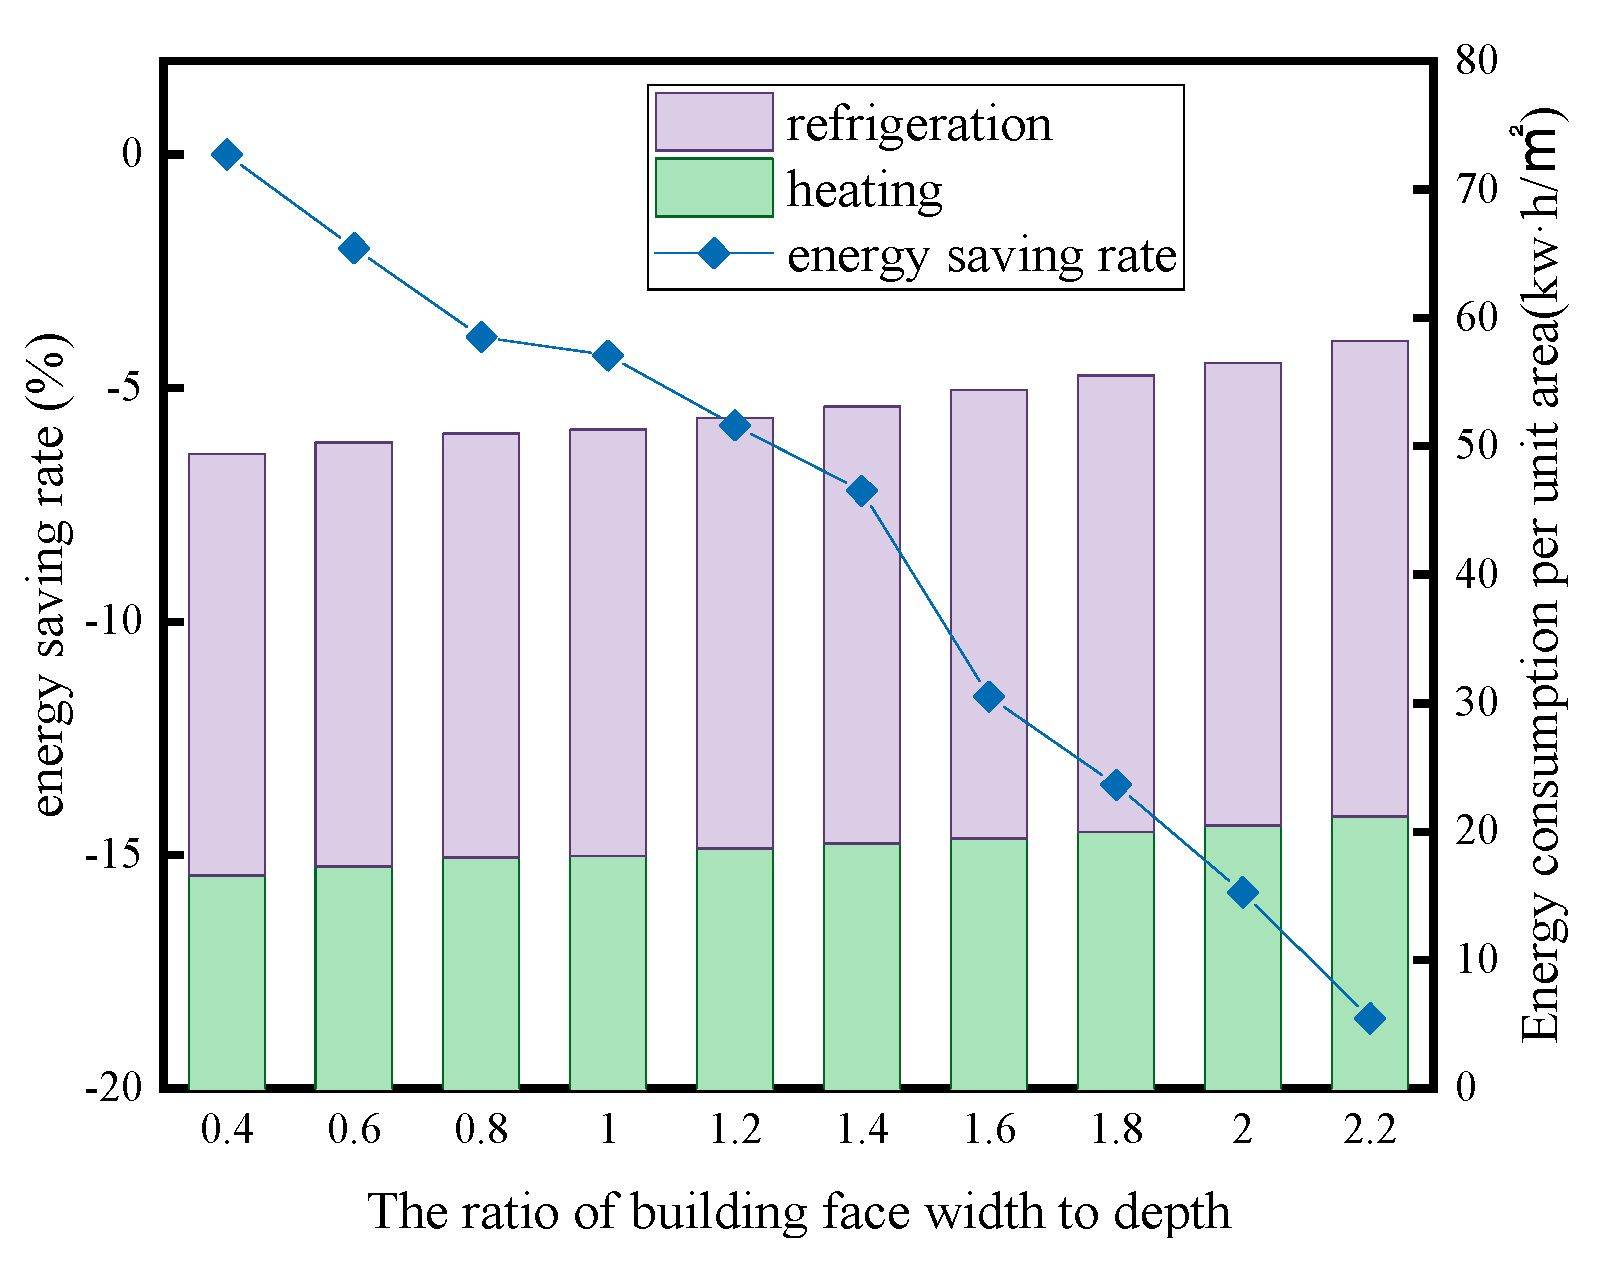
Building Energy Efficiency (E) encompasses various factors, including the values of the building form factor E14, which were distributed between 66.00 and 75.00, with a mean value of 71.92. The average height of rural buildings around Chengdu ranges from 2.7m to 4.2m. When the building height is fixed, the plan form of the building becomes the primary factor affecting the form factor. Therefore, we introduce the ratio of the building’s face width and depth to explore its influence in depth.
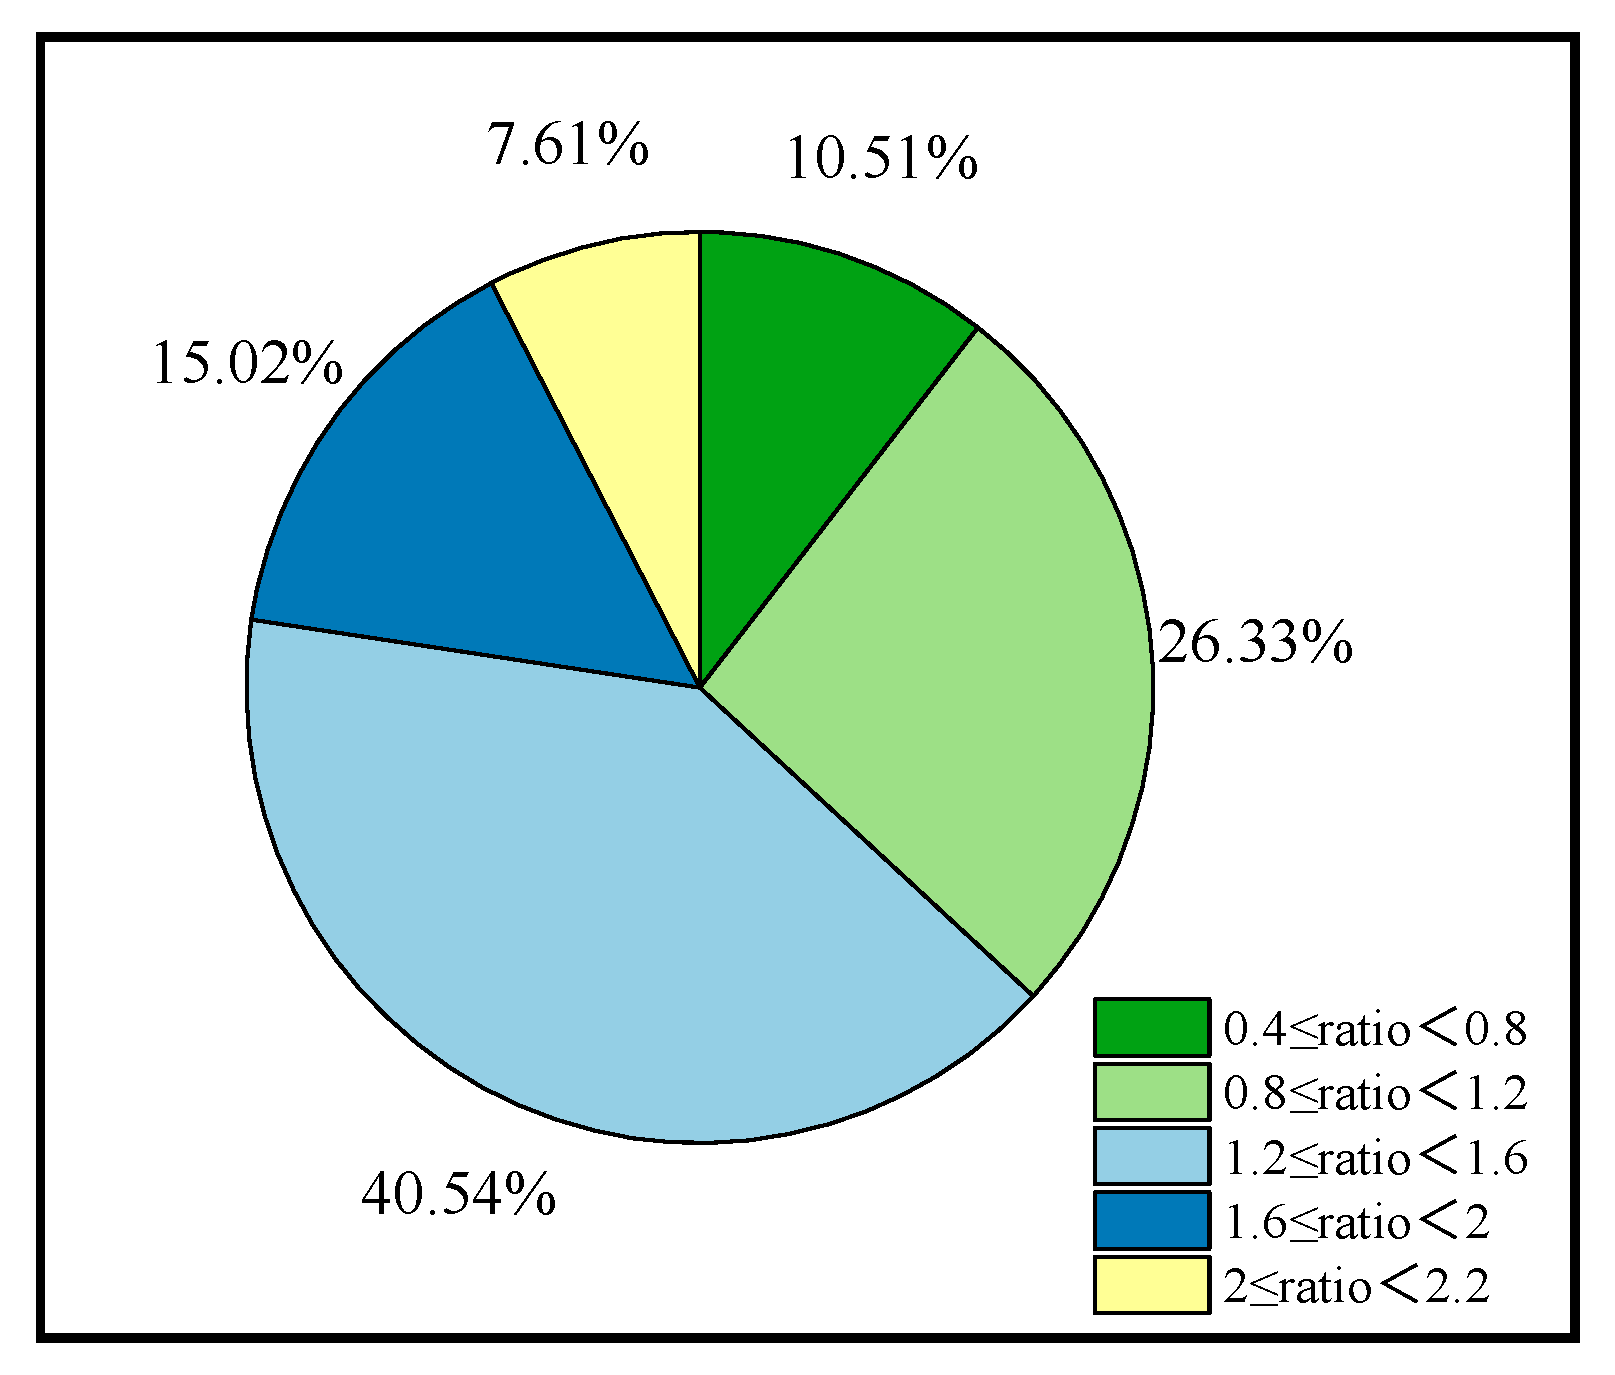
Figure 8 displays the results of the investigation into the correlation between the variation of face width to depth ratio and the energy consumption per unit area, as well as the energy saving rate of rural buildings. The data indicates that as the aspect to depth ratio increases, the energy consumption per unit area of the building gradually increases, while the energy saving rate decreases. The research indicates that the aspect ratio of buildings in the countryside around Chengdu ranges from 0.4 to 2.2. Figure 9 displays the statistics of the percentage of the aspect ratio of buildings in the research process. The highest percentage, 66.89%, was in the range of 0.8-1.6, while the lowest percentage, 7.63%, was in the range of 2-2.2. Therefore, the value of the indicator of the building form factor E14 was 71.92, which represents a medium carbon level.
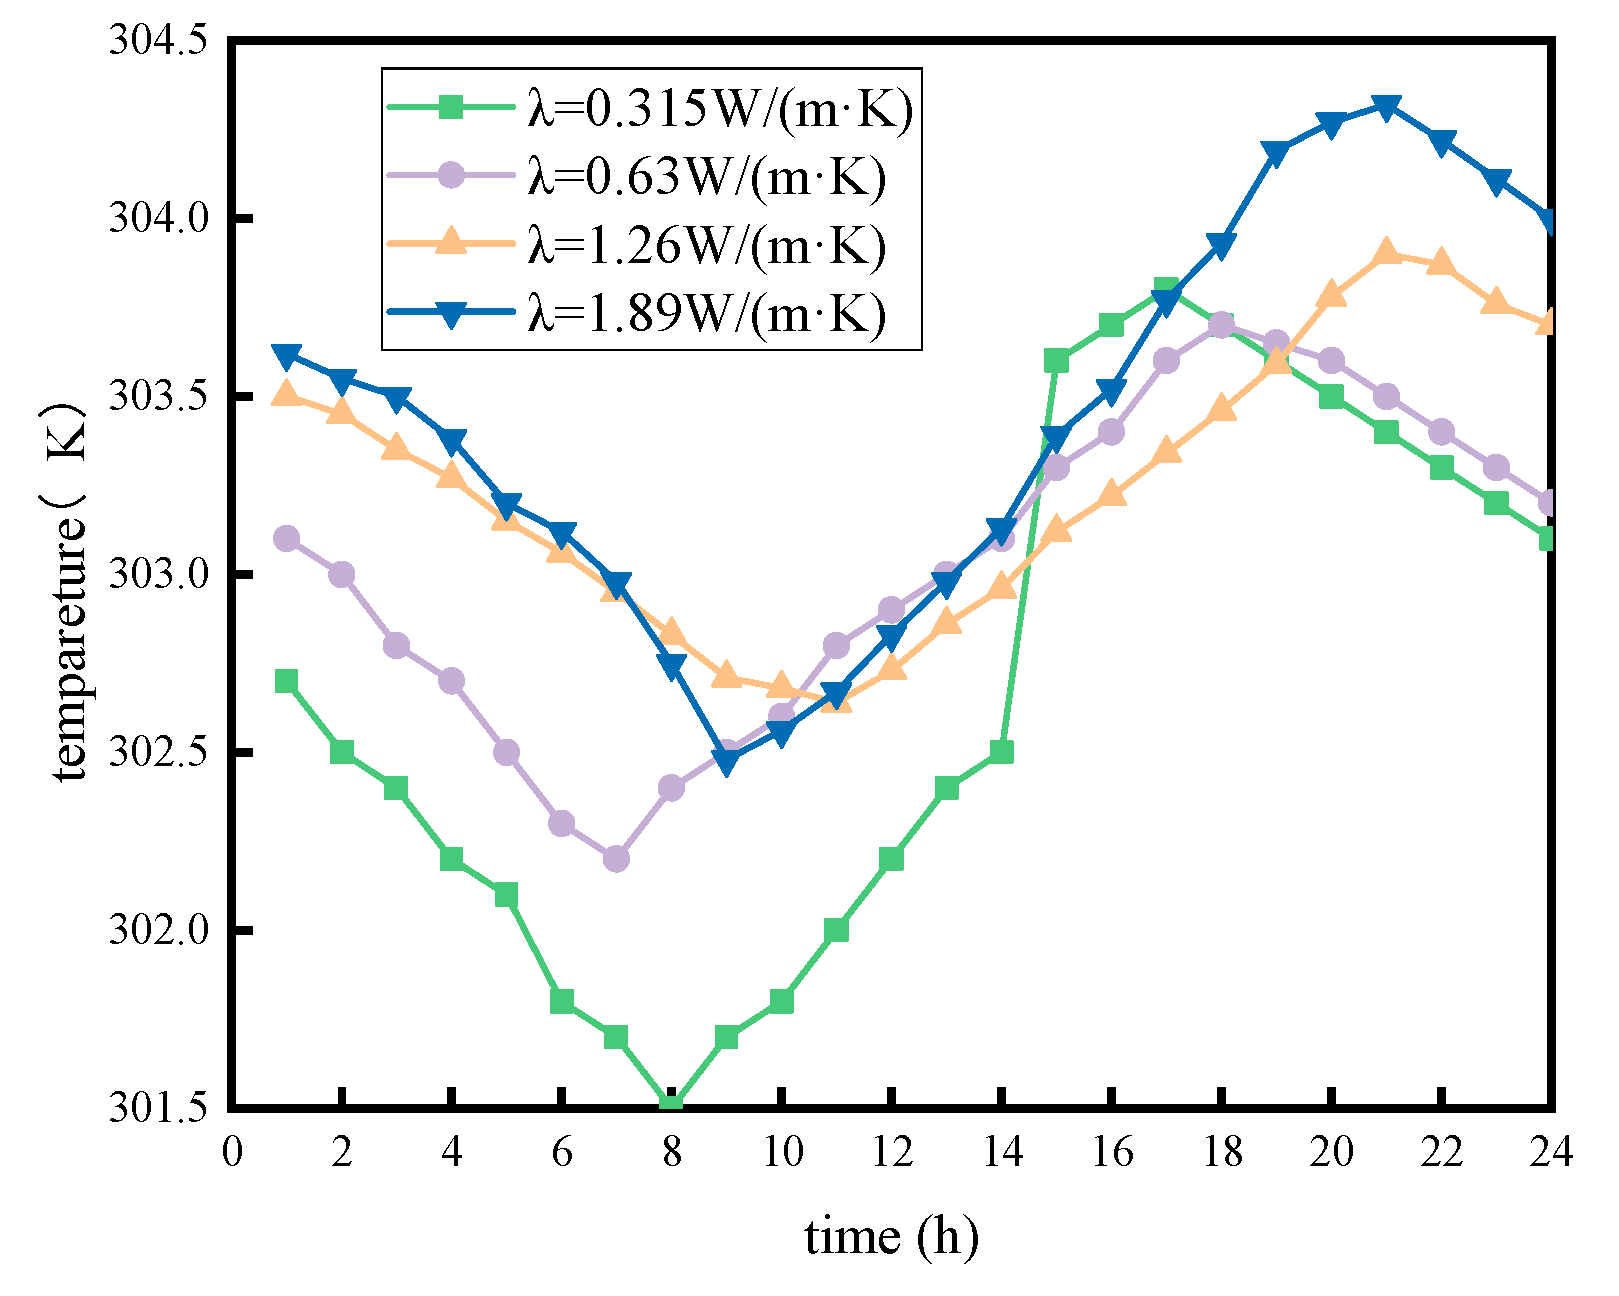
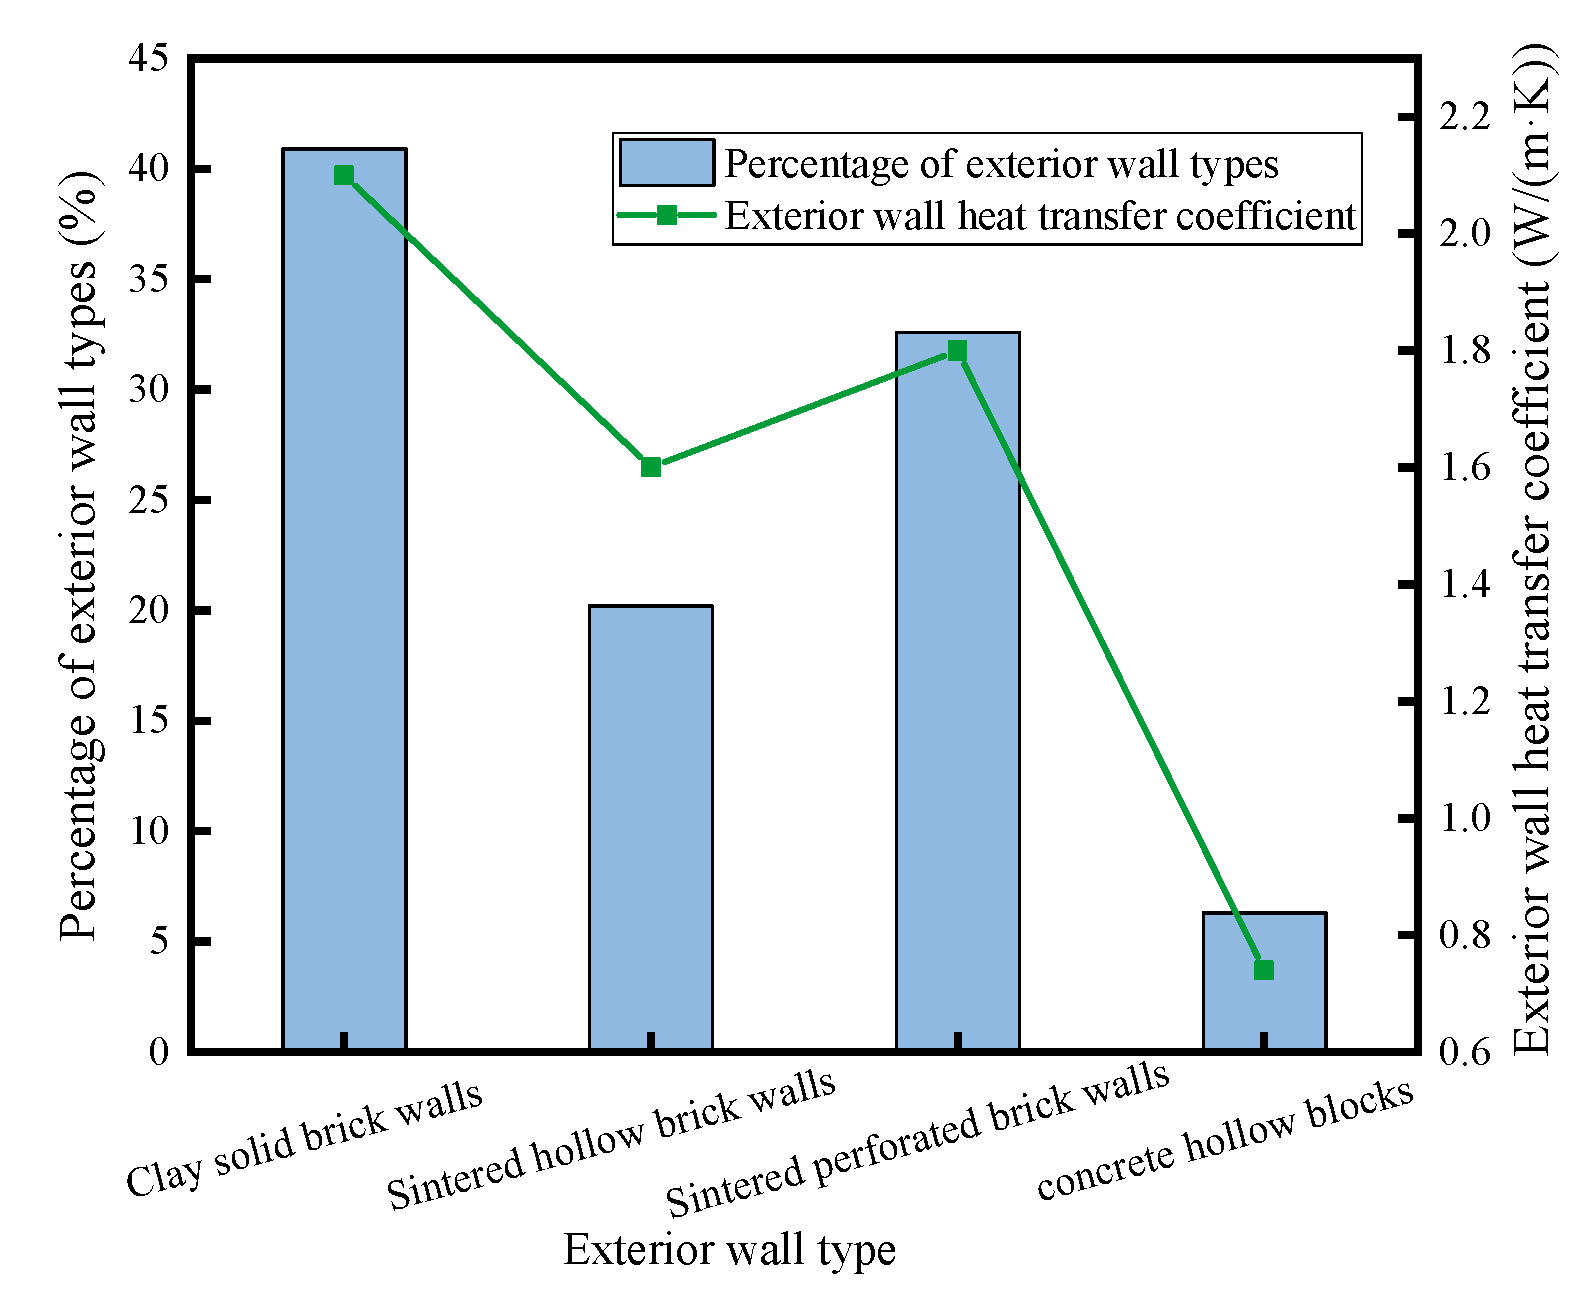
The thermal performance of the external wall, as measured by the E21 value distribution pattern, exhibited a significant difference between districts. The average value was only 60.18, with a maximum value of 81.4 (found in Shuangliu District’s Liyuan Village), which was 34.78% higher than the average value. The lowest value was 42.19 (found in Pidu District’s Renyi Village), which was 29.89% lower than the average value. This distribution pattern can be attributed to the differences in façade types between the districts. The rural buildings surrounding Chengdu have external walls made of clay solid brick, sintered hollow brick, sintered porous brick, and concrete hollow blocks. The thermal conductivities of these materials are 1.89W/(m·K), 0.63W/(m·K), 1.26W/(m·K), and 0.315W/(m·K), respectively. Figure 10 illustrates the temperature cycle changes of the wall surface inside the wall with varying thermal conductivity. It is evident that there is a significant difference in wall surface temperature between walls with different thermal conductivity. The concrete hollow block has the smallest thermal conductivity, resulting in less heat dissipation to the indoor air and a greater reduction in room temperature. Conversely, the clay solid brick has the largest thermal conductivity, leading to increased heat dissipation to the indoor air.
Figure 11 shows the percentage of different facade types of buildings in the countryside around Chengdu. The results indicate that only 6.3% of the external walls of rural buildings around Chengdu were made of concrete hollow blocks, while the proportion of clay solid brick walls was as high as 40.9%. As a result, the overall thermal performance of the external walls in Chengdu’s rural areas scored only 59.68 on the E21 index. The Pidu District is one of the more prominent typical areas. Most of the buildings in Jinbai Village were self-built by villagers, resulting in a long service life. However, the external walls have a large thermal conductivity and the internal wall surfaces absorb more heat from the interior, resulting in a low value of 59.04 points in the E21 index of thermal performance of external walls. However, the external walls have a large thermal conductivity and the internal wall surfaces absorb more heat from the interior, resulting in a low value of 59.04 points in the E21 index of thermal performance of external walls. However, the external walls have a large thermal conductivity and the internal wall surfaces absorb more heat from the interior, resulting in a low value of 59.04 points in the E21 index of thermal performance of external walls.
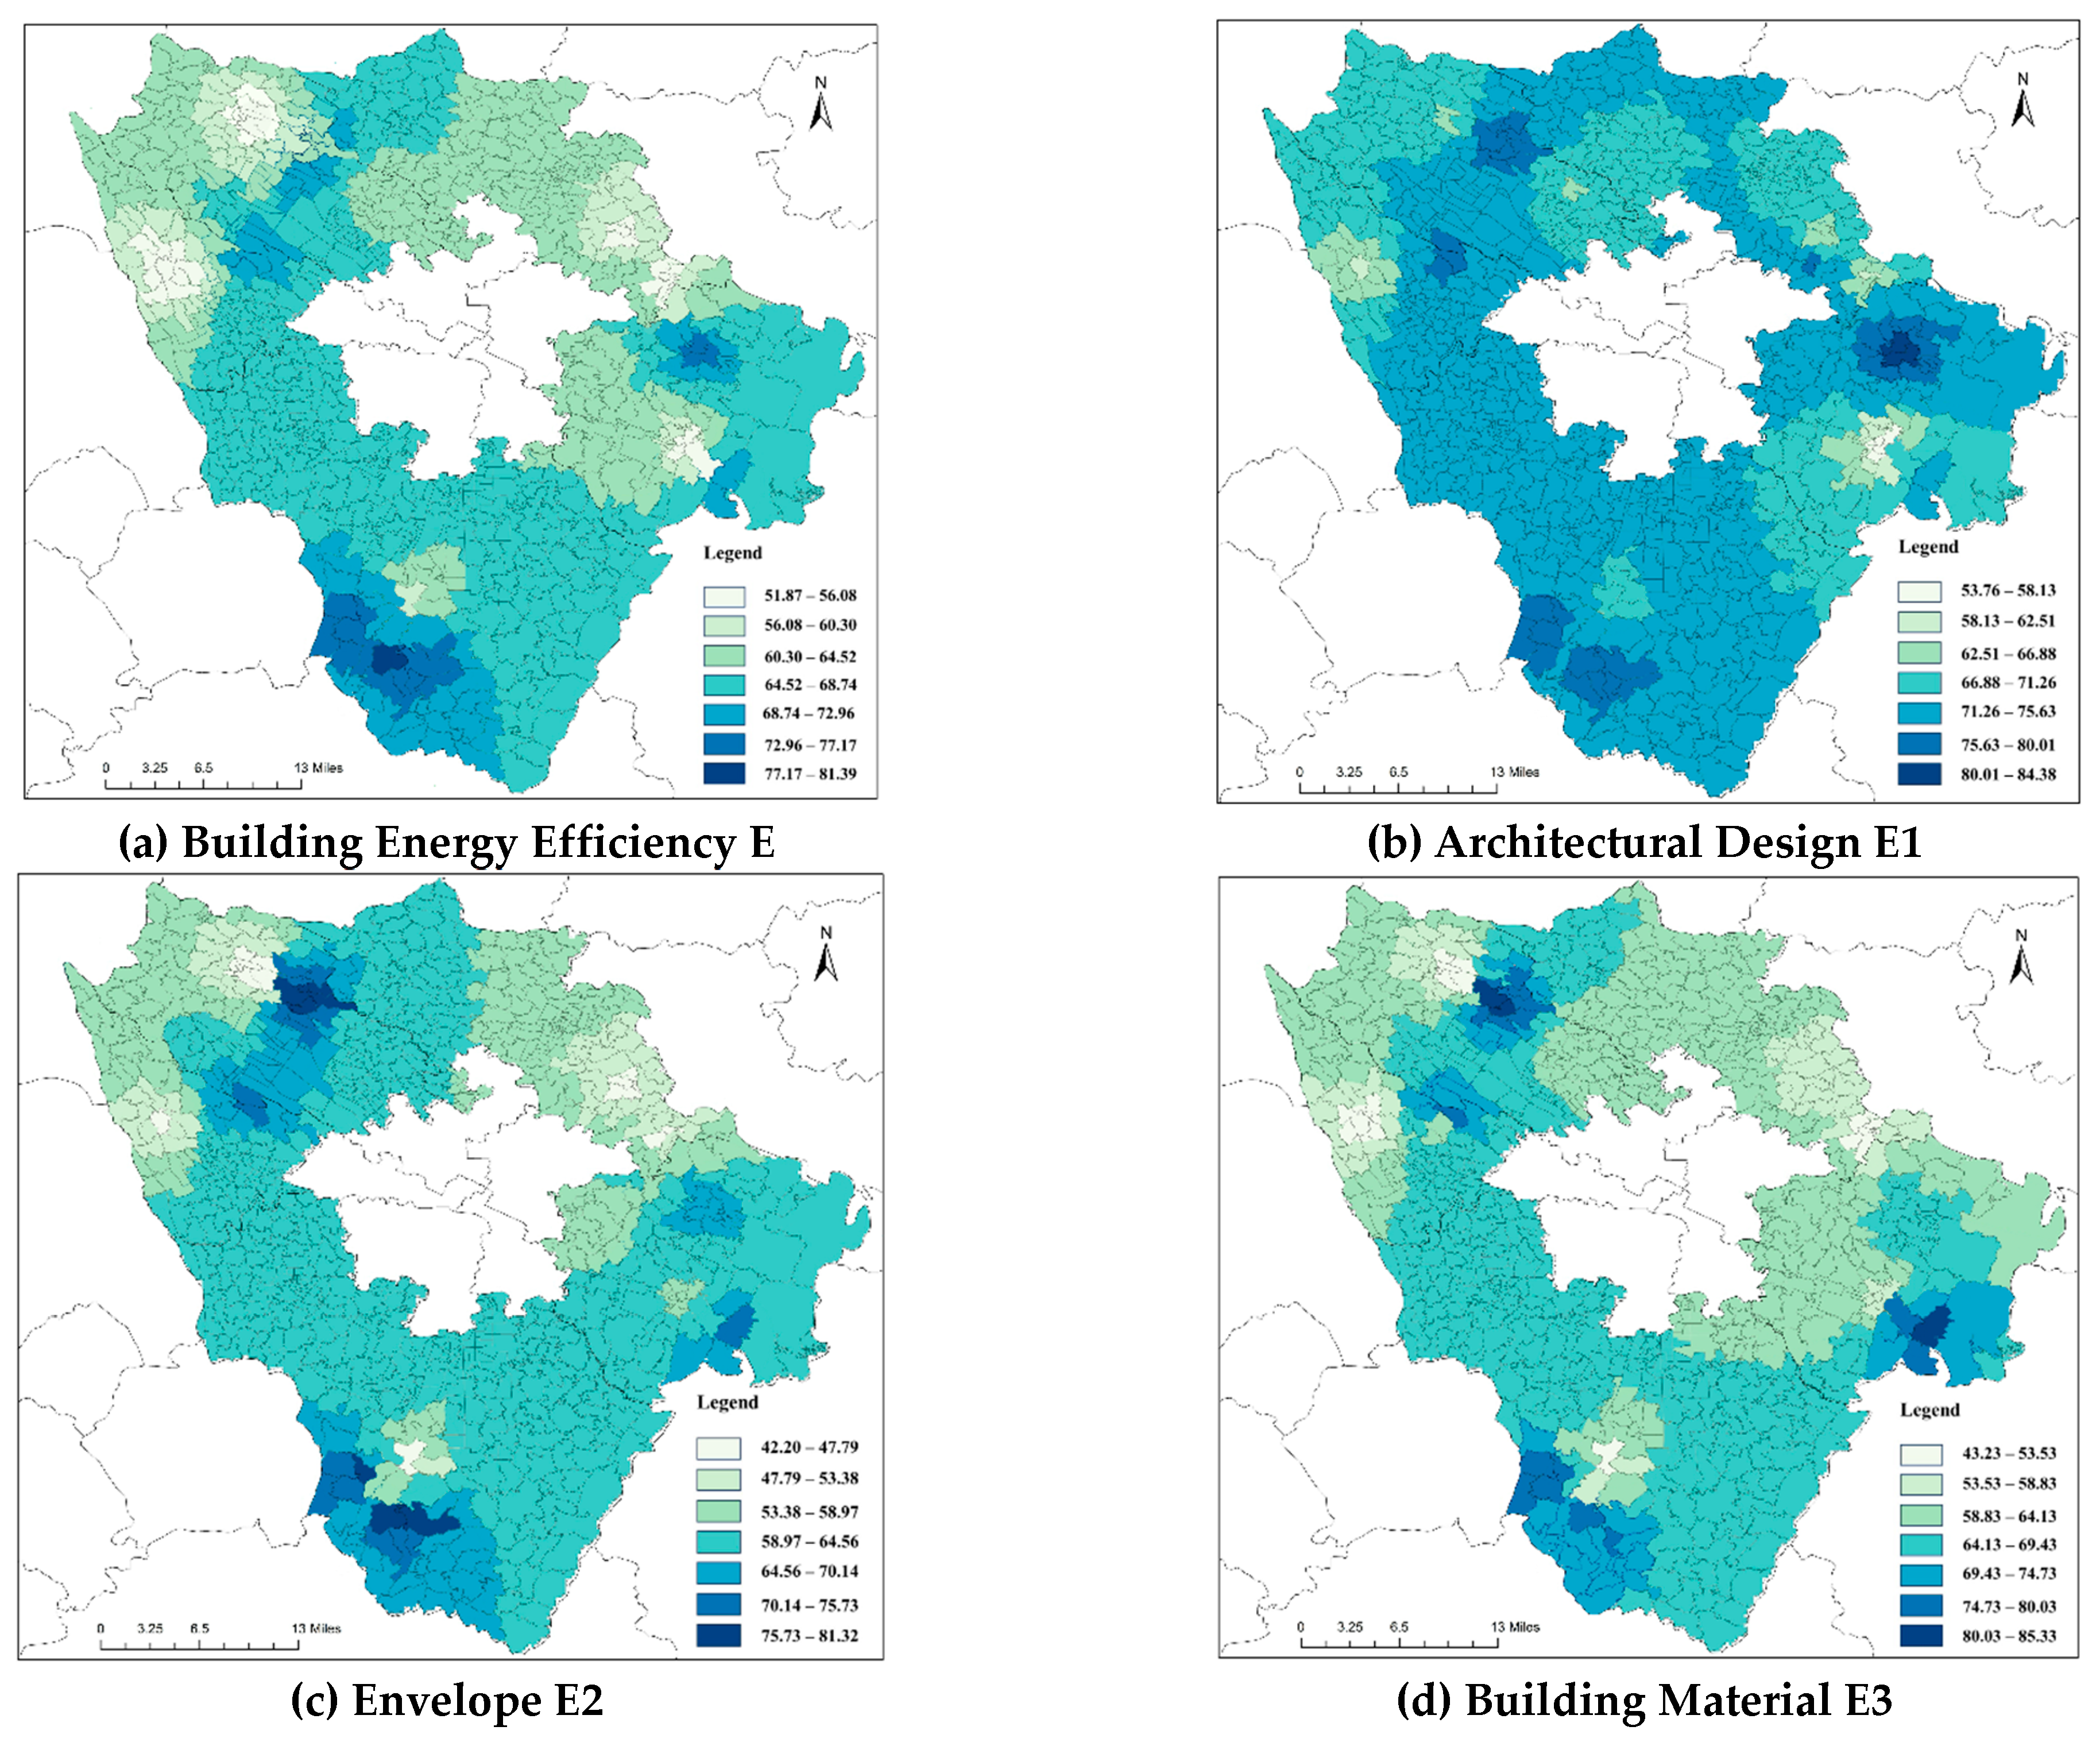
Figure 12 shows the spatial distribution of composite evaluation values for the E-indicator. The distribution of low carbon values for indicator E decreased from the southwest to the northeast. The highest score for the E-indicator was 81.35 (Liyuan Village, Shuangliu District), while the lowest score for building energy efficiency was only 51.79 (Yituan Village, Xindu District). Some of the buildings in Xindu District have been standing for a long time, and their overall form is poor. The external walls of some of the buildings are made of solid bricks, and the windows are either single-glazed plastic-steel or wooden, resulting in a low energy-saving E-indicator value of only 59.00. Liyuan Village in Shuangliu District is a demonstration village. The government coordinated and constructed the buildings with consideration for their greenness and comfort during the design, construction, and operation phases. As a result, the building energy-saving E-indicator value reaches 68.89.

3.3. Results and Discussion of Self-discipline Evaluation for Residents (S)

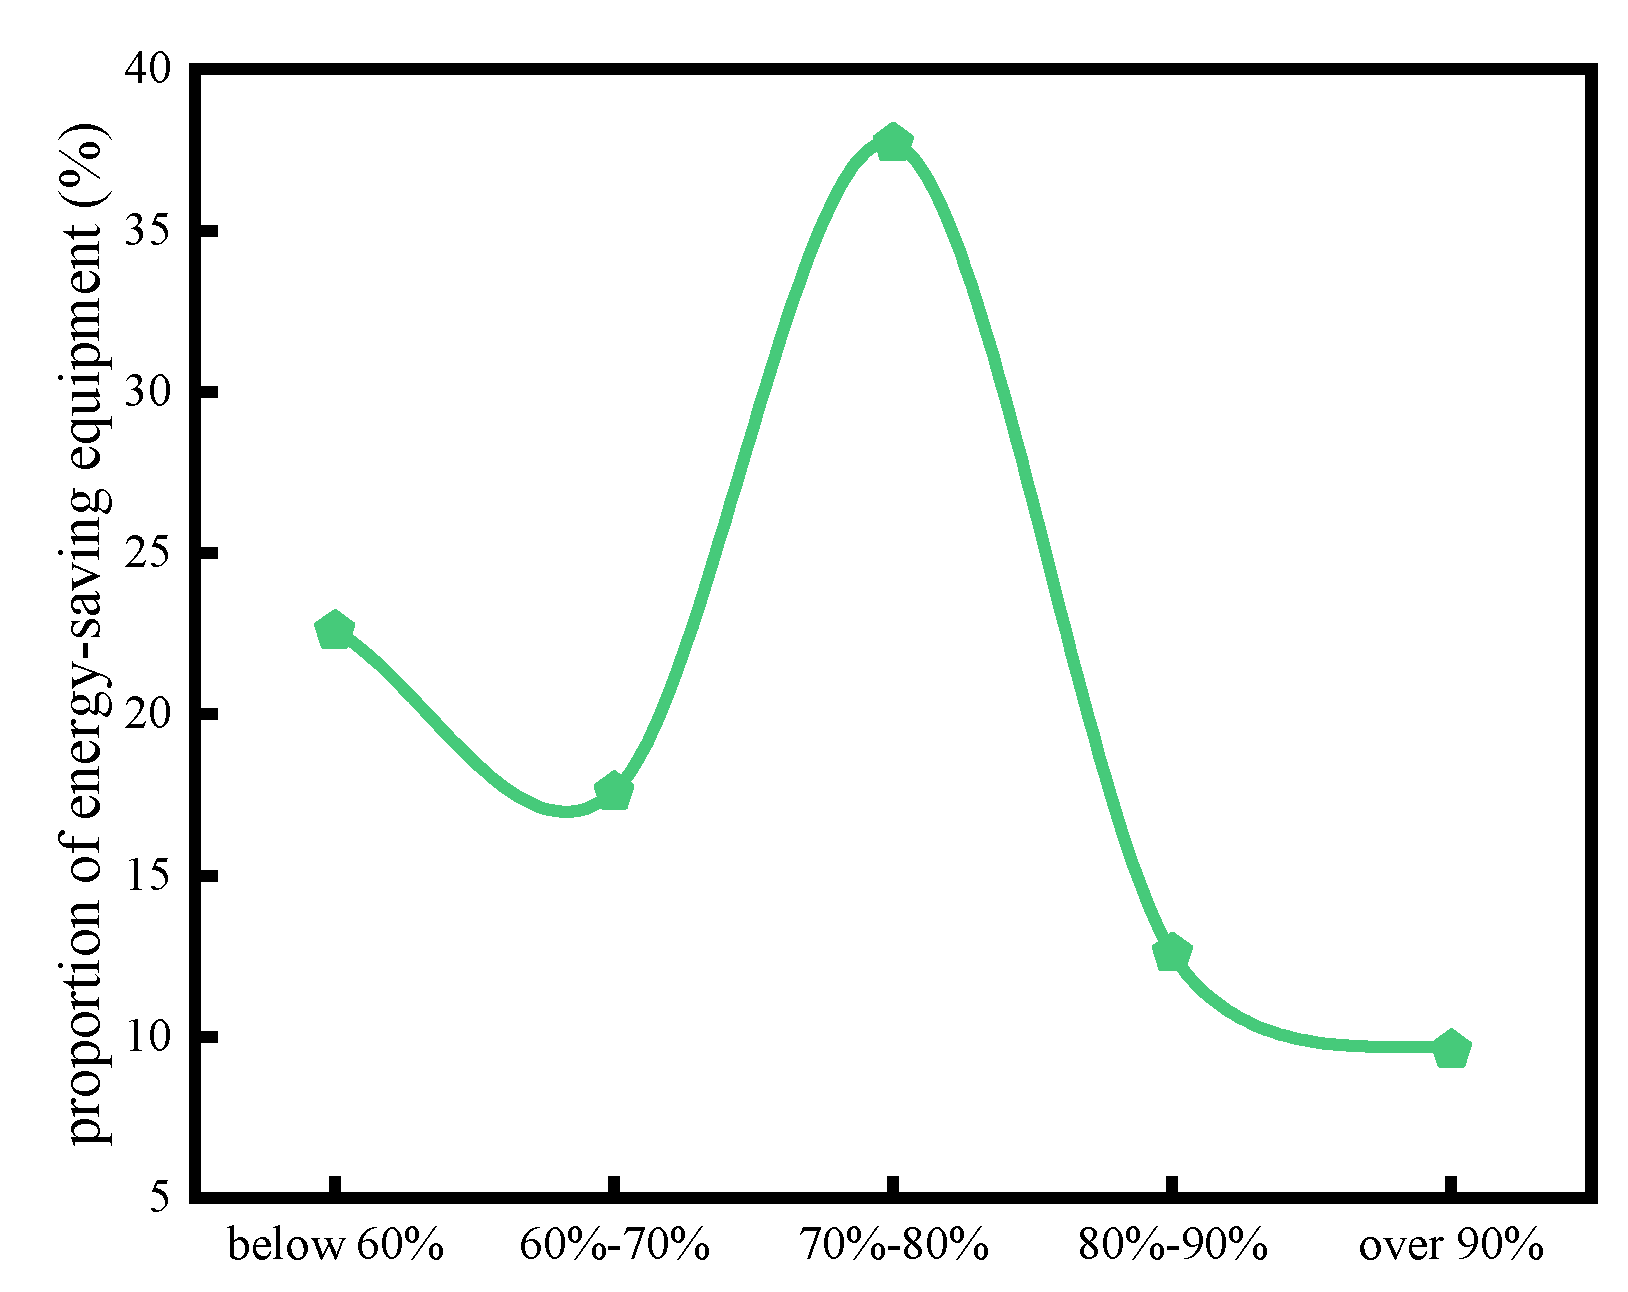
The evaluation covered factors related to Resident Self-discipline (S), including resident awareness and attitudes towards energy conservation. The results indicate that the S21 indicator values for energy-saving equipment have small differences, ranging from 71.8% to 86.92%. Figure 13 shows the percentage of energy-saving equipment in each household in the countryside around Chengdu. In 65% of households, the proportion of energy-saving equipment exceeded 70%. Only 20% of households had less than 60% of energy-saving equipment. Therefore, the S21 indicator for the proportion of energy-saving equipment has a high value, with an average of 76.09%.
The implementation rate of energy-saving measures S22 has a large extreme difference in its numerical distribution. The mean value is 71.86, with a maximum value of 84.49 (Gaoshan Village, Wenjiang District), which is 17.57% higher than the mean value, and a minimum value of 56.69 (Yituan Village, Xindu District), which is 21.11% lower than the mean value.
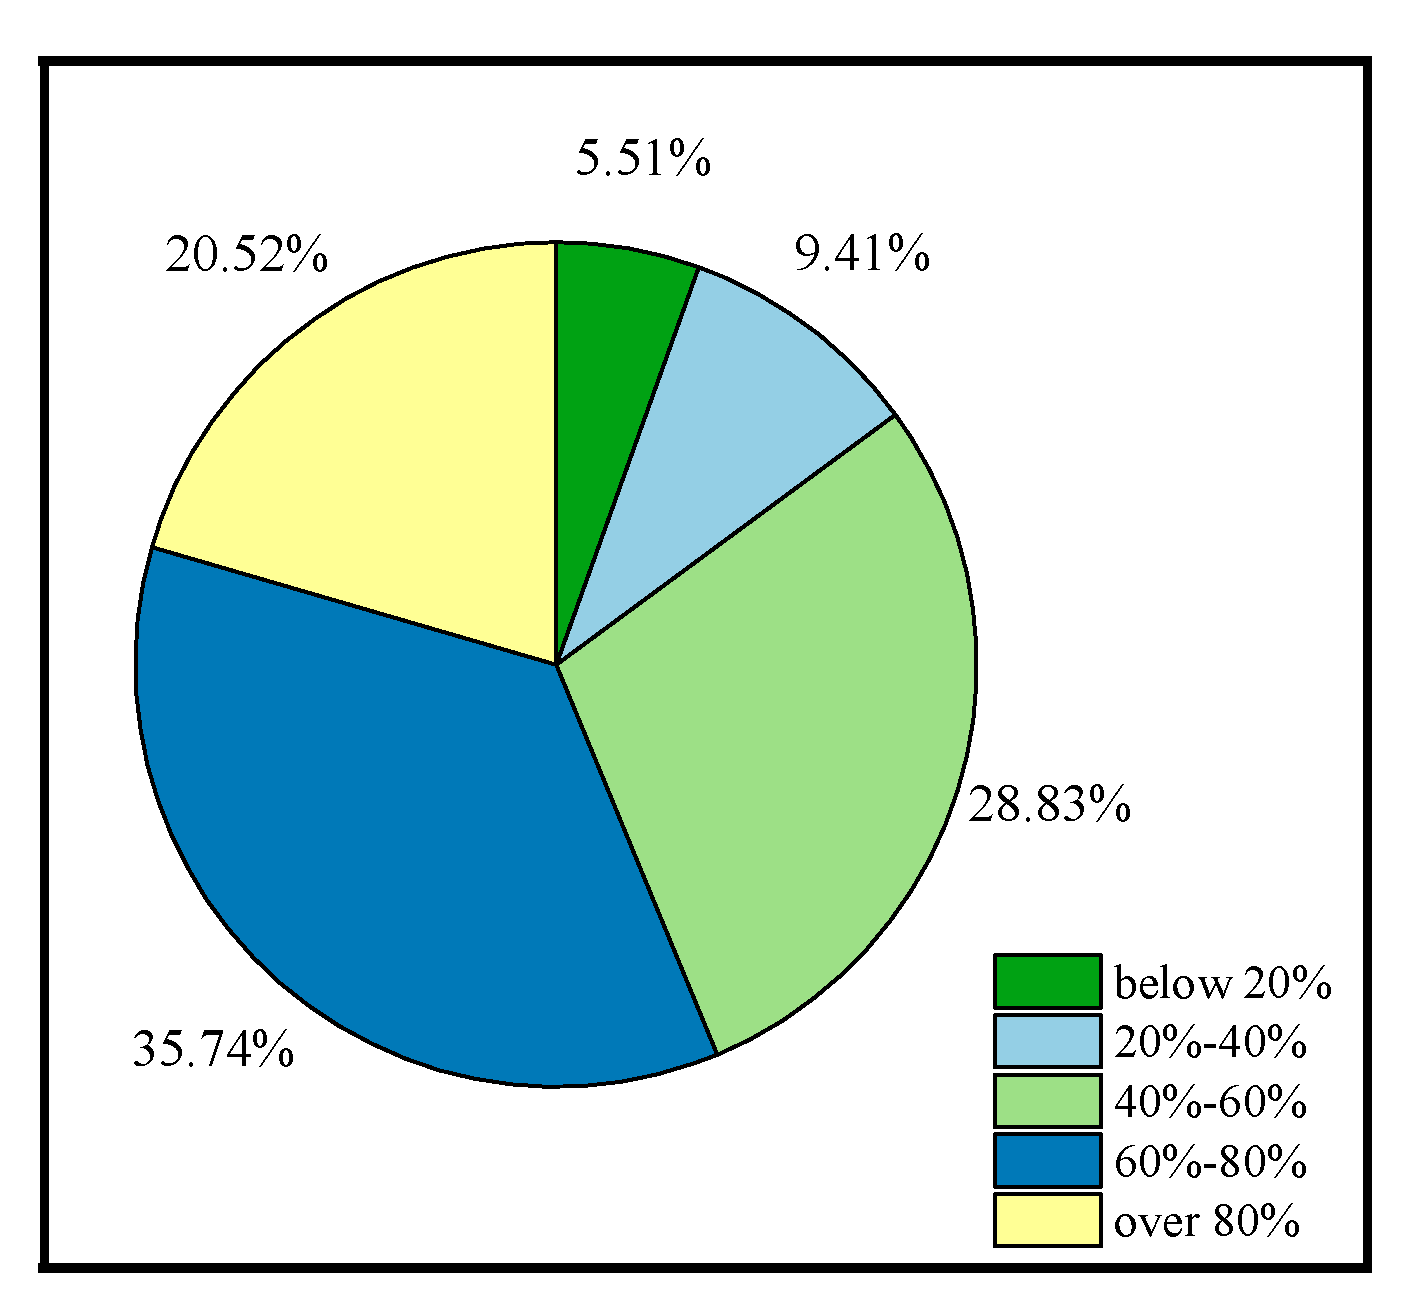
To gain a deeper understanding of the implementation of energy-saving measures, the research recorded the air-conditioning temperature settings of residents during the summer cooling season, as shown in Figure 14. The majority of people (77%) preferred to set the air-conditioning temperature between 21-26°C. 84% of households set their air-conditioning at less than 26°C, with 7% setting it at less than 20°C. Studies have shown that increasing the set temperature of a domestic air-conditioner by 1°C can result in an electricity saving of 8-12%. It is evident that the residents in the rural areas surrounding Chengdu habitually set their air-conditioning temperature too low, and they lack awareness of energy conservation. Notably, Jinbai Village in Pidu District scored only 58.34 in the implementation rate of energy-saving measures S22 indicator, indicating significant potential for energy conservation in terms of air-conditioning temperature settings.
Figure 15 shows the spatial distribution of Resident Self-discipline (S). The S indicator has high values and decreases from southwest to northeast. The highest value of the S-indicator was 84.67 (Gaoshan Village, Wenjiang District), and the lowest value was only 59.59 (Jinbai Village, Pidu District). In certain buildings within the Pidu District, there is equipment that has been in use for a long time. However, the use of traditional fuelwood stoves has resulted in a relatively low percentage of energy-efficient equipment. The majority of residents are relocated households with weak low-carbon awareness and choose to use fuelwood for cooking and hot water supply.

3.4. Low Carbon Degree of Energy Consumption (LCD) for Rural Buildings Synthesis Results and Discussion

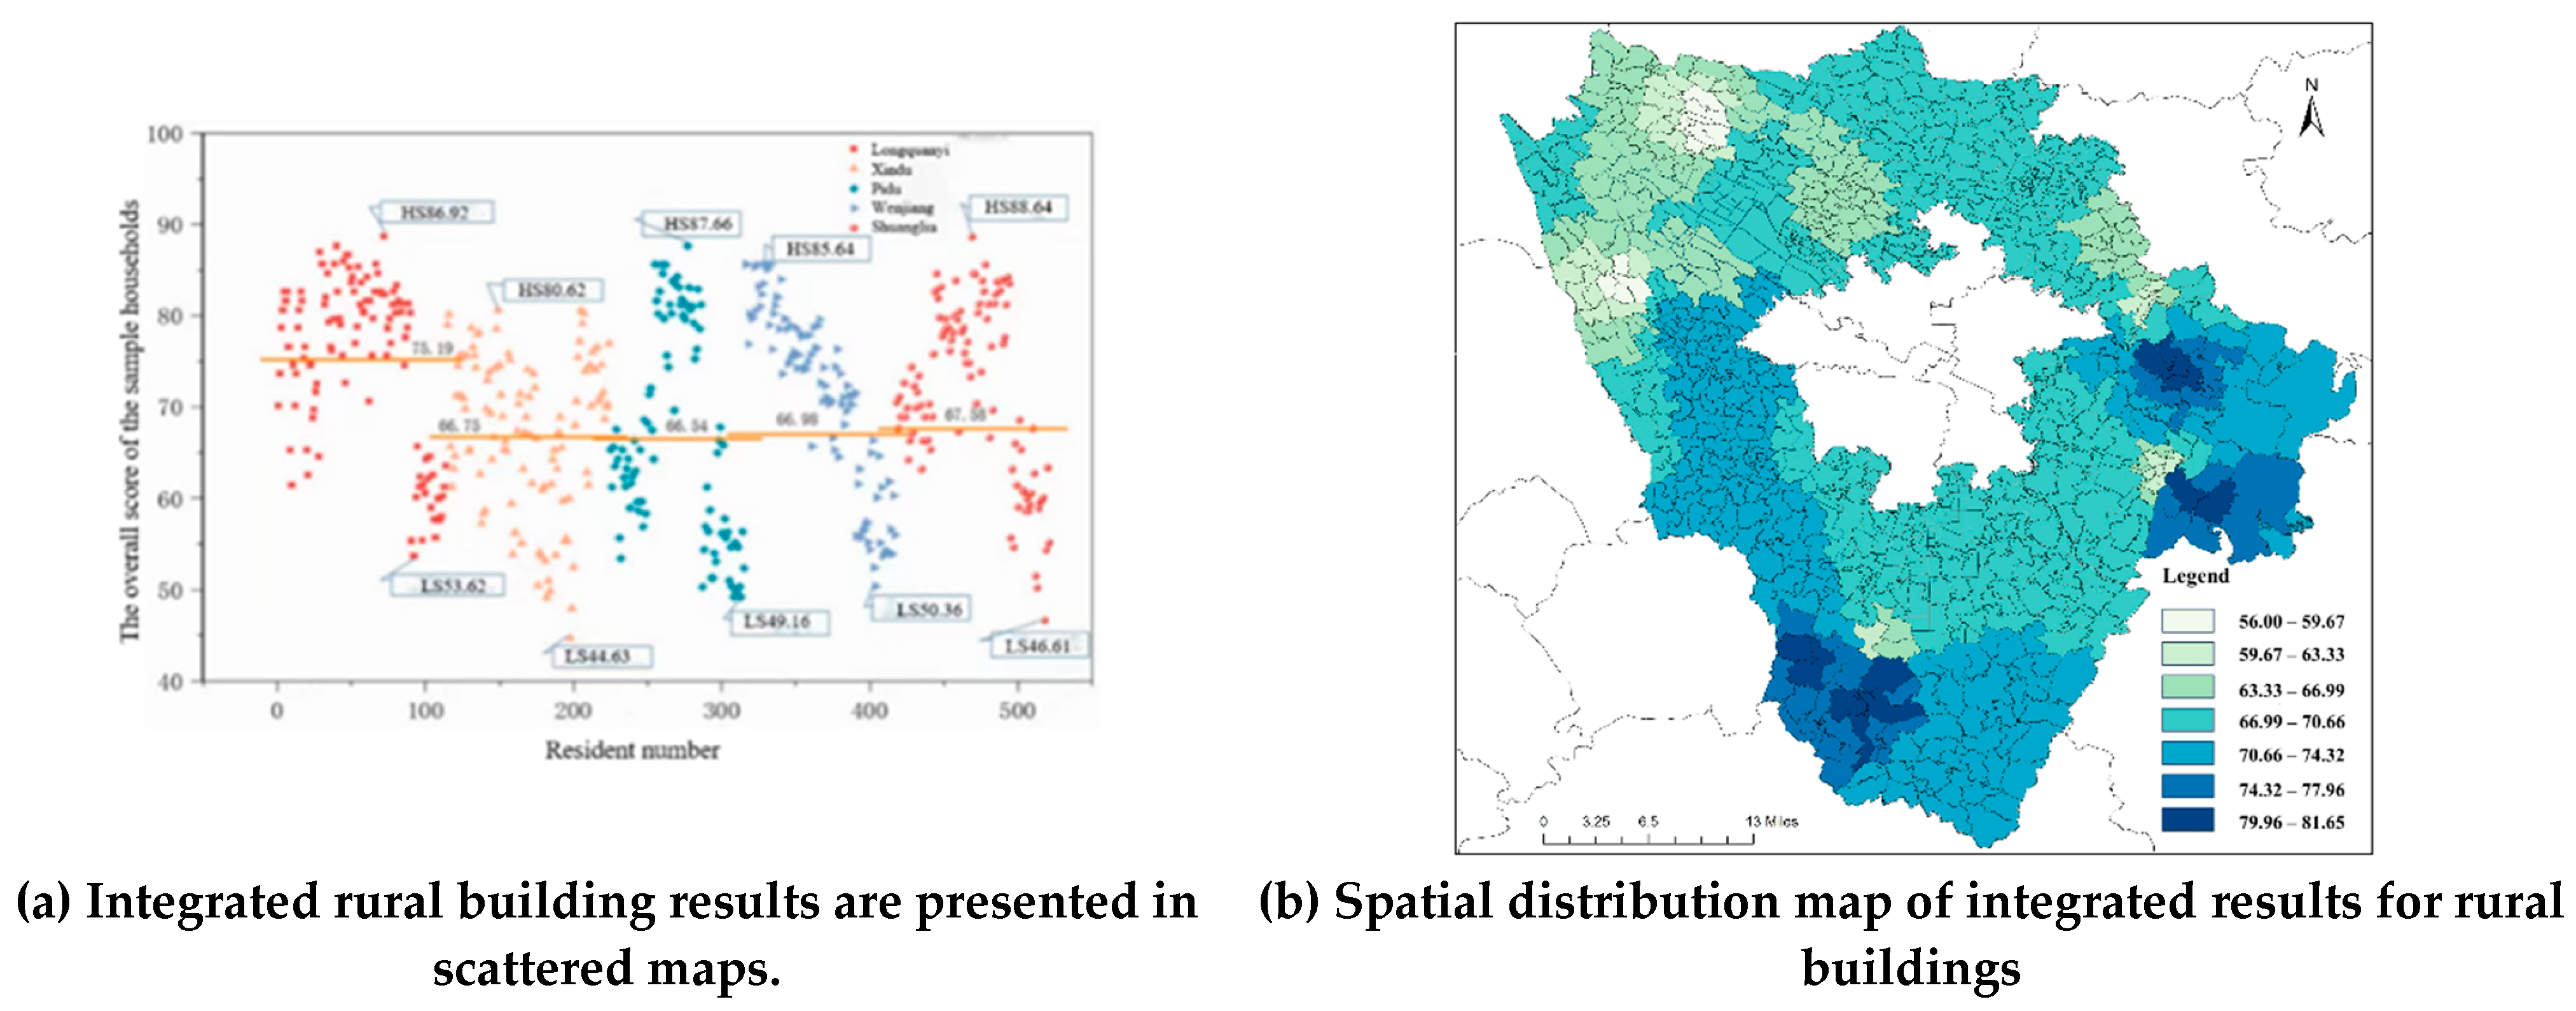
Figure 16 displays the results of the comprehensive evaluation of the low carbon level of energy consumption of buildings in the rural areas surrounding Chengdu. The low carbon values of buildings in each district varied greatly, with Longquanyi district having the highest mean value of 75.19, the lowest value of 56.62 (a building in Union Village), and the highest value of 86.92 (a building in Baosheng Village). The mean values of the remaining four districts were similar, with PI having the smallest mean value of 66.54, the highest value of 87.66 (a building in Qinjiamiao Village), and the lowest value of 44.63 (a building in Jinbai Village). Regarding spatial distribution, the overall pattern shows a characteristic of being high in the southeast, low in the northwest, and average in the centre. This pattern is influenced by key factors such as the proportion of clean energy use (C24), thermal performance of external walls (E21), and the implementation rate of energy-saving measures (S22).
Table 2 shows the classification of the low carbon level of each of the 20 sample villages based on their low carbon values. The combined low carbon rating of the sample villages ranged from low carbon to medium-high carbon, with no high carbon villages, indicating the effectiveness of low carbonisation in villages around Chengdu. Among the low-carbon sample villages, all four villages, except Flower Fruit Village, were demonstration villages. Demonstration villages have better building performance and a rich energy consumption structure. Residents’ daily energy consumption mainly uses clean energy, resulting in a lower carbon level compared to ordinary villages. Huaguo Village has a high level of low carbon intensity due to the development of the tourism industry and the government’s unification and renovation of buildings. The village’s high altitude, intense solar radiation, and widespread use of renewable energy are key factors in reducing its carbon footprint. The five medium-high-carbon villages share three common issues: low usage of clean energy, poor thermal performance of building envelopes, and a lack of awareness among residents regarding low-carbon behaviors.

4. Recommendations

The aim of this study was to explore retrofitting solutions for building energy use in rural areas around Chengdu, taking into account the actual situation in the southwestern region. The study was based on an evaluation of energy consumption in buildings and identified problems in some of the buildings. The principles of open-source and cost-saving were followed, and economic applicability, environmental friendliness, and social sustainability were integrated. The following details outline the proposed solutions:

4.1. Energy Efficiency Transformation

Regarding the Energy Cleanliness (C) factor, the rural areas around Chengdu have a rich energy structure but are not highly utilised for clean energy. To promote the full use of renewable resources such as solar energy in Chengdu, additional solar panels were installed to utilise passive solar technology.
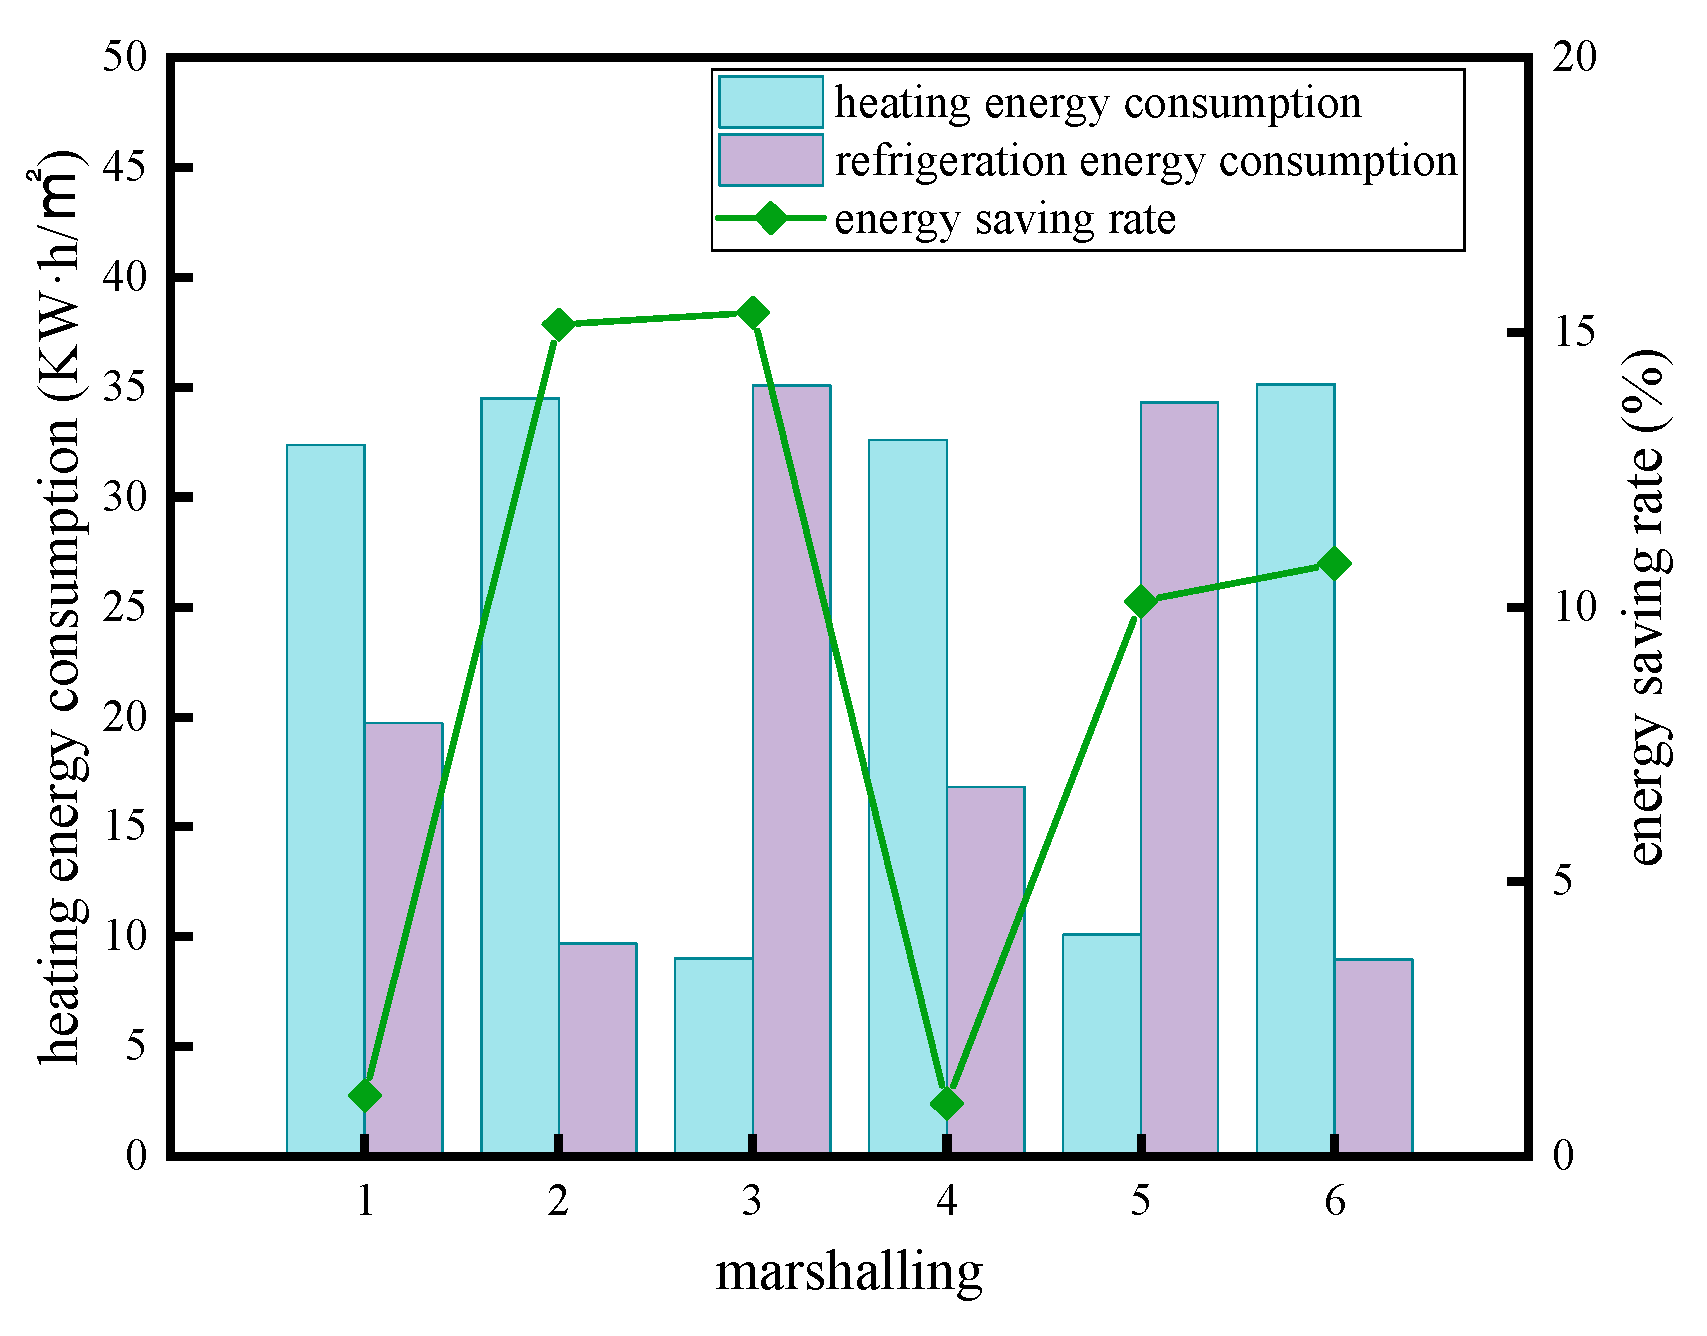
The energy consumption of a building in Liyi Village, Wenjiang District was simulated by adding a sunroom with varying depths, as depicted in Figure 17. The results indicate that as the depth of the sunroom increases, the cumulative heat load of the building also increases, along with the cumulative cooling load. The energy saving rate of the entire building was highest when the sun room had a depth of 1 metre, resulting in a total cumulative load of 151.43kW·h/㎡ and an energy saving rate of 14%. As the depth of the sunroom increases, the energy savings decrease and fall more rapidly. Based on the actual situation in rural areas around Chengdu, it is recommended that the depth of the sunroom be between 1 metre and 1.5 metres. When the depth of a sunroom in Jinbai Village, Pidu District was set to 1.2m, the score of the C24 indicator for clean energy use ratio increased from 55.58 to 70.21, resulting in a significant improvement in energy-saving benefits.

4.2. Transformation of Energy Carriers

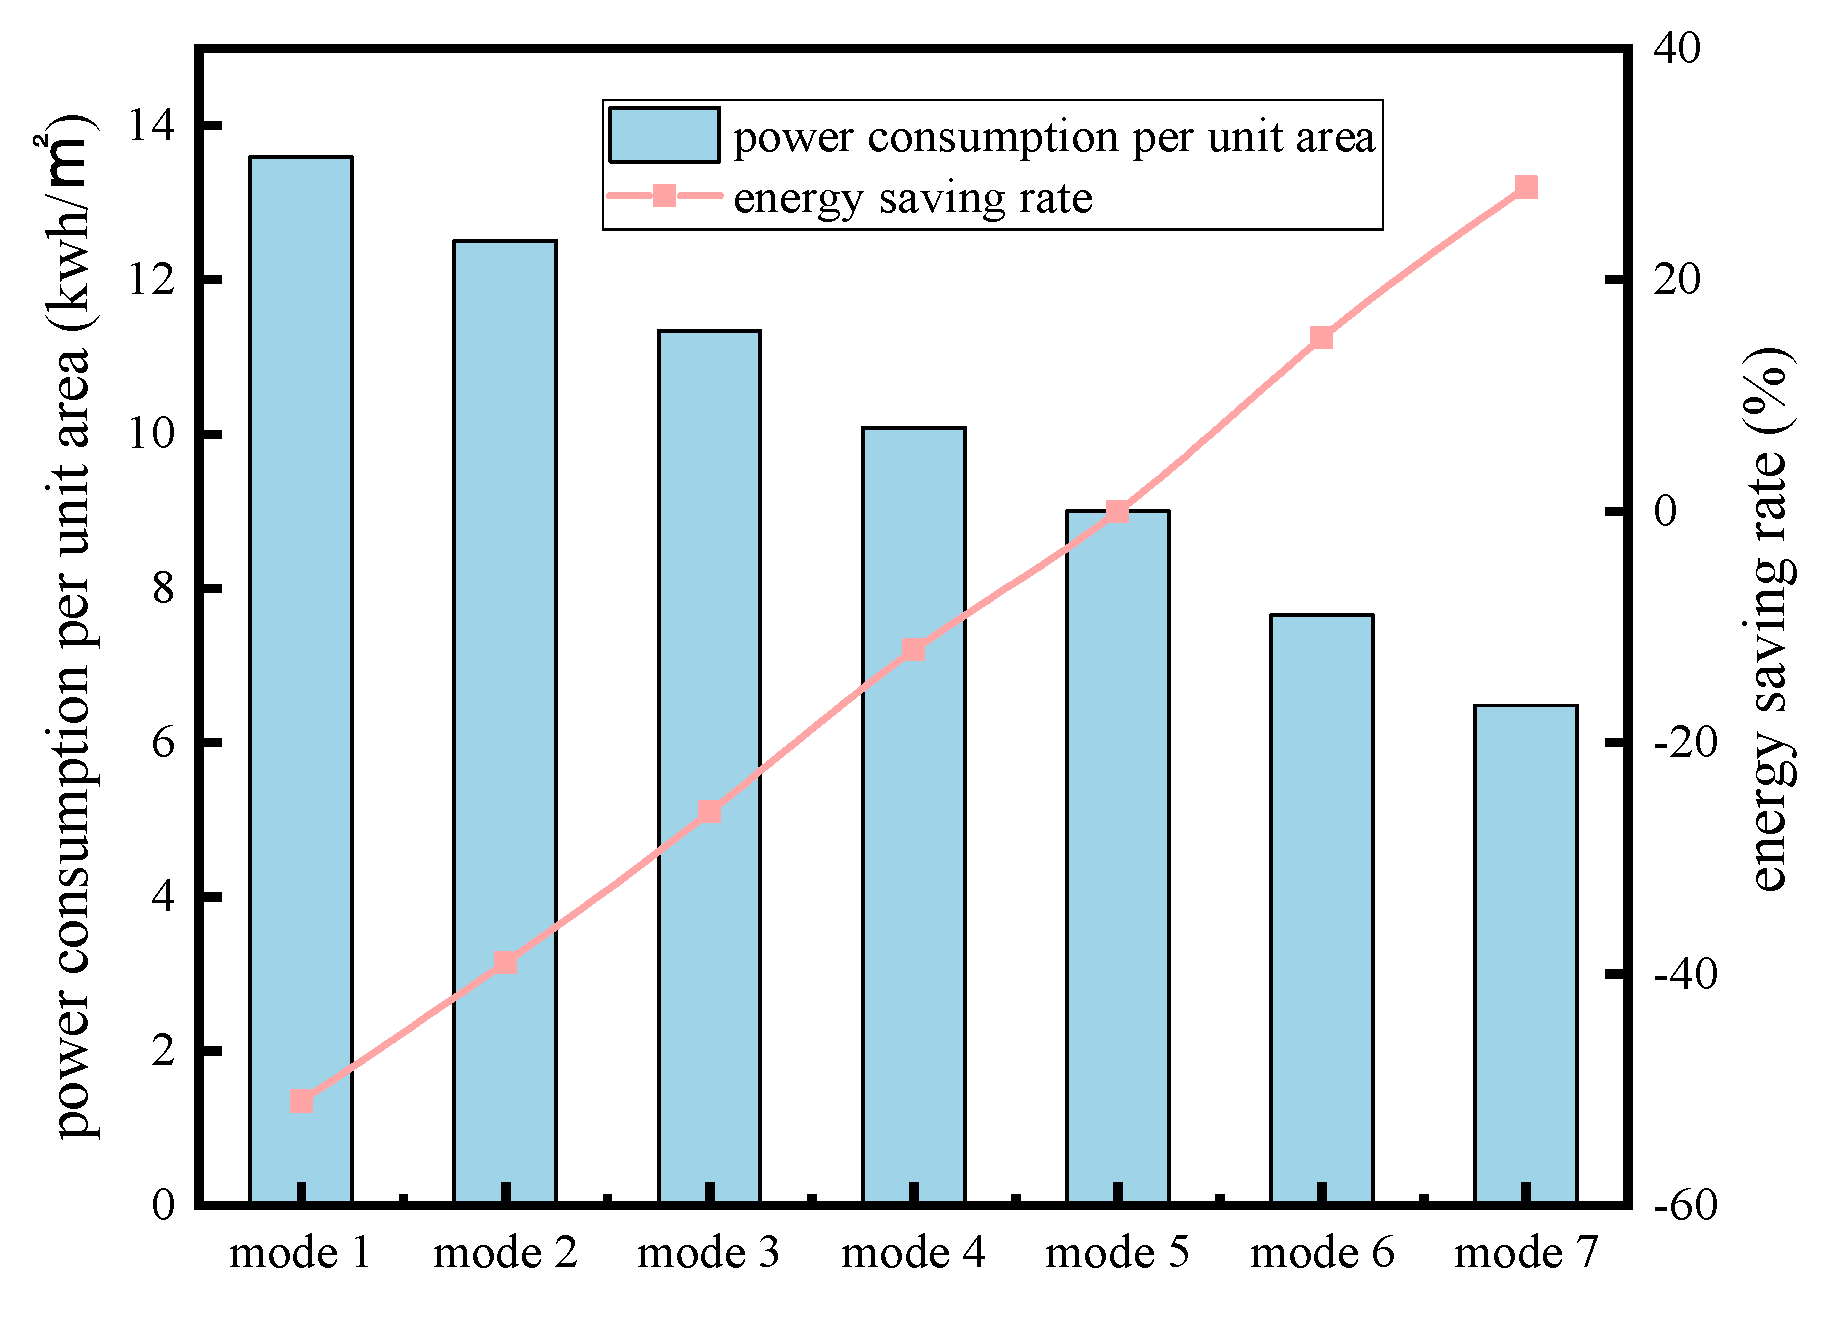
To address the factor of Building Energy Efficiency (E), the most prominent issue of poor thermal performance of the external walls was retrofitted for energy efficiency. As mentioned before, the external wall of a building in Jinbai Village, PI District is a solid clay brick wall, for this type of external wall, taking the baseline model as an example, keeping the other parameters unchanged, change the construction of the external wall and use DeST-h software to simulate the energy consumption per unit area, and the results obtained are shown in Figure 18.
To increase the energy-saving rate of a 240mm clay solid brick wall, it is recommended to increase the thickness of the extruded polystyrene board by 20-30mm. This resulted in an energy-saving rate improvement of 15.14%-15.36%. However, increasing the thickness of the thermal insulation layer from 20mm to 30mm only improved the energy-saving rate by 0.22%. The addition of 15mm thick extruded polystyrene board to the sintered porous bricks resulted in an energy saving rate of 10.1%. Similarly, the addition of 30mm thick extruded polystyrene board to the insulation resulted in an energy saving rate of 10.79%, indicating an improvement of only 0.69%. In Jinbai Village’s Pidu District, a building’s external wall was improved by adding a 20mm extruded polystyrene board insulation material. This increased the thermal performance of the external wall, raising the E21 index value from 59.04 to 67.24.

4.3. Implement Behavioral Guidance

Targeting implementation behavioral factors to guide residents’ air-conditioning temperature setting behavior. DeST-h softwwere was used to simulate and analyse the impact of different air-conditioning usage behaviors on building energy consumption. The simulation results were shown in Figure 19 below.
The relationship between the set temperature of air conditioning and energy consumption is positive. To increase energy savings by approximately 10%, it is recommended to lower the air conditioning temperature by 1°C. The research revealed that 70% of residents set their air conditioning temperature below 26%, indicating non-standardized settings. The optimal air conditioning temperature setting in Chengdu is 26℃. The air conditioning usage habits of the building in Jinbai Village, PI Dwastrict were standardised, resulting in an increase of the S22 indicator score from the original 58.34 to 72.36. This significantly reduced the overall energy consumption of the surrounding countryside buildings in Chengdu, making it of great significance for energy saving.

5. Conclusions

Both theoretical work and case verification support the feasibility of considering rural green building and energy saving evaluation from a composite perspective of Energy-Buildings-behavioral, the evaluation system provides an easy-to-use and effective tool for promoting low-carbon energy development in rural areas, several important conclusions are presented as follows:
(1) The low carbon degree of rural residential energy consumption is affected by some key factors. The percentage of clean energy use (C24), the thermal performance of external walls (E21), and the implementation rate of energy-saving measures (S22) were identified as the key factors affecting the energy consumption of rural buildings around Chengdu, which has great potential for improvement.
(2) Both the comprehensive evaluation index and the impact factor have certain regional distribution characteristics. Based on the key factors, the spatial distribution of building energy consumption in the case study shows a pattern of high consumption in the south-east, low consumption in the north-west, and average consumption in the central area. Some villages in the case have problems, such as low utilization of clean energy, poor thermal performance of external walls, and weak awareness of energy-saving behaviors among residents. The detailed description of these rules is helpful to understand the important characteristics of rural building energy consumption more clearly.
(3) Based on the composite perspective of Energy-Buildings-behavior, the establishment of a comprehensive evaluation model has theoretical feasibility, and has been verified by cases. Besides being applicable to the evaluation of rural green buildings in southwest China, a comprehensive evaluation model applicable to inaccessible areas can also be constructed by adjusting factors and scoring criteria. It can provide more comprehensive and accurate support and relevant data for the construction and transformation of rural green buildings.
Authors’ Contributions: All authors have accepted responsibility for the entire content of this manuscript and approved its submission.
Declaration of Competing Interest: The authors declare that they have no known competing financial interests or personal relationships that could have appeared to influence the work reported in this paper.
Date Availability: Data will be made available on request.

Acknowledgments

The authors would like to thank the project team members for their help. This study was funded by the Philosophy and Social Science Research Fund Project of Chengdu University of Technology (YJ2021-ZD002), Project of Western Ecological Civilization Research Center (XBST2021-YB002), Chengdu University of Technology Development Funding Program for Young and Middle-aged Key Teachers (10912-JXGG2021-01003). These supports are greatly appreciated.

References

  1. Jiashi Han, Lei Zhang,Yang Li. Hotspots. flaws and deficiencies of research on rural energy upgrading:A review. Energy Strategy Reviews 38 (2021) 100766. [CrossRef]
  2. Donglin Zhang, Yong Ding, Lingxiao Fan, Xiangting Jiang. New indicator for a comprehensive evaluation of building energy performance through spatial and temporal dimensions.Energy & Buildings. [CrossRef]
  3. Zhengxuan Liu,Chenxi Yu, Queena K Qian, Ruopeng Huang, Kairui You,Henk Visscher, Guoqiang Zhang. Incentive initiatives on energy-efficient renovation of existing buildings towards carbon–neutral blueprints in China: Advancements, challenges and prospects. Energy & Buildings 296 (2023) 113343. [CrossRef]
  4. Geoffrey.K.F. Tso, JingJing Guan. A multilevel regression approach to understand effects of environment indicators and household features on residential energy consumption, Energy 66 (2014) 722–731. [CrossRef]
  5. 5. Keith J. Baker, R.Mark Rylatt. Improving the prediction of UK domestic energy-demand using annual consumption-data, Appl. Energy 85 (6) (2008) 475–482. [CrossRef]
  6. Shva.Saadatian, Nuno.Simoes, Fausto Freire. Integrated environmental, energy and cost lifecycle analysis of windows: optimal selection of components, Build. Environ. 188 (2021) 107516. [CrossRef]
  7. Chanita. Mano, Atthakorn Thongtha. Enhanced thermal performance of roofing materials by integrating phase change materials to reduce energy consumption in buildings, J. Renew. Mater. 9 (3) (2021). [CrossRef]
  8. Yanling Wang, Fang Wanga, Haiyan Wanga. Influencing factors regression analysis of heating energy consumption of rural buildings in China. Procedia Engineering 205 (2017) 3585–3592. [CrossRef]
  9. Cristina Marincu, Daniel Dan, Ligia Moga. Investigating the influence of building shape and insulation thickness on energy efficiency of buildings. Energy for Sustainable Development 79 (2024) 101384. [CrossRef]
  10. Xiaoliang Wang, Yi Wu, Xinyi Dong, Manshu Liu, Bo Lei, Xianmin Mai. Optimization of global energy consumption of buildings based on photothermal coupling effect of exterior windows in Qinghai-Tibet plateau. Journal of Building Engineering 85 (2024) 108710. [CrossRef]
  11. Issa Bosu, Hatem Mahmoud, Shinichi Ookawara, Hamdy Hassan. Applied single and hybrid solar energy techniques for building energy consumption and thermal comfort: A comprehensive review. Solar Energy 259 (2023) 188–228. [CrossRef]
  12. Lingyan Li, Wangming Sun, Wei Hu, Yongkai. Sun. Impact of natural and social environmental factors on building energy consumption: based on bibliometrics, J. Build. Eng. 37 (2021) 102136. [CrossRef]
  13. Abdeen Mustafa Omer. Energy, environment and sustainable development, Renew. Sustain. Energy Rev. 12 (9) (2008) 2265–2300. [CrossRef]
  14. Jihui Yuan, Zhichao Jiao, Xiong Xiao, Kazuo Emura, Craig Farnham. Impact of future climate change on energy consumption in residential buildings: A case study for representative cities in Japan. Energy Reports 11 (2024) 1675–1692. [CrossRef]
  15. Ivan Julio Apolonion Callegas, Raquel Moussalem Apolonio, Emeli Lalesca Aparecida da Guarda, Luciane Cleonice Durante, Karyna de Andrade Carvalho Rosseti, Filipa Roseta and Leticia Mendes do Amarante. Bermed earth-sheltered wall for low-income house: thermal and energy measure to face climate change in tropical region, Appl. Sci. 11 (1) (2021). [CrossRef]
  16. Mohammadjavad Mahdavinejad, Hassan Bazazzadeh, Fatemeh Mehrvarz,Umberto Berardi, Tahereh Nasr, Somayeh Pourbagher, Siamak Hoseinzadeh. The impact of facade geometry on visual comfort and energy consumption in an office building in different climates. Energy Reports 11 (2024) 1–17. [CrossRef]
  17. Qiaoni Wei, Qifen Li, Yongwen Yang, Liting Zhang, Wanying Xie. A summary of the research on building load forecasting model of colleges and universities in North China based on energy consumption behavior: A case in North China. Energy Reports 8 (2022) 1446–1462. [CrossRef]
  18. Jiaojiao Duan, Nianping Li, Jinqing Peng, Qingqing Liu, Ting Peng,Sheng Wang. Clustering and prediction of space cooling and heating energy consumption in high-rise residential buildings with the influence of occupant behavior: Evidence from a survey in Changsha, China. Journal of Building Engineering 76 (2023) 107418. [CrossRef]
  19. Douglas Roschildt Hax, Rodrigo Karini Leitzke, Antonio César Silveira Baptista da Silva,Eduardo Grala da Cunha. Influence of user behavior on energy consumption in a university building versus automation costs. Energy & Buildings 256 (2022) 111730. [CrossRef]
  20. Xiaoxiao Xu, Hao Yu, Qiuwen Sun, Vivian W.Y. Tam. A critical review of occupant energy consumption behavior in buildings:How we got here, where we are, and where we are headed. Renewable and Sustainable Energy Reviews 182 (2023) 113396. [CrossRef]
  21. Dasheng Lee, Chin-Chi Cheng. Energy savings by energy management systems: a review, Renew. Sustain. Energy Rev. 56 (2016) 760–777. [CrossRef]
  22. Jing Lan, SufyanUllah Khan, Muhammad Sadiq, Fengsheng Chien, Zulfiqar Ali Baloch. Evaluating energy poverty and its effects using multi-dimensional based DEA-like mathematical composite indicator approach: findings from Asia. Energy Policy 2022:165. [CrossRef]
  23. Altintas Koray, Vayvay Ozalp, Apak Sinan, Cobanoglu Emine. An extended GRA method integrated with fuzzy AHP to construct a multidimensional index for ranking overall energy sustainability performances. Sustain Switz 2020:12. [CrossRef]
  24. Ponomarenko Tatiana, Reshneva Ekaterina, Mosquera Urbano Alexander Patricio. Assessment of energy sustainability issues in the Andean community: additional indicators and their interpretation. Energies 2022:15. [CrossRef]
  25. XingtaoTian, Xiaojie Lin, Wei Zhong, Yi Zhou. Security assessment of electricity-gas-heat integrated energy systems based on the vulnerability index. Energy 2022:249. [CrossRef]
  26. Guevara-Luna Marco, Ramos Luis, Casallas Alejandro, Guevara Fredy. Design of an energy vulnerability index — spatial and temporal analysis: case of study Colombia.Environ Sci Pollut Res 2022. [CrossRef]
  27. Ghadim Mahta Ghafarian, Faridzad Ali. Composite energy intensity index estimation in Iran: an exploration of index decomposition analysis. Polityka Energ 2021;24:5–28. [CrossRef]
  28. Sandu Suwin, Yang Muyi, Phoumin Han, Aghdam Reza Fathollahzadeh, Xunpeng Shi. Assessment of accessible, clean and efficient energy systems: a statistical analysis of composite energy performance indices. Appl Energy 2021:304. [CrossRef]
  29. Wanjing Cheng, Dongxu Mo, Yajun Tian, Wenqiang Xu, Kechang Xie. Research on the composite index of the modern Chinese energy system. Sustain Switz 2019:11. [CrossRef]
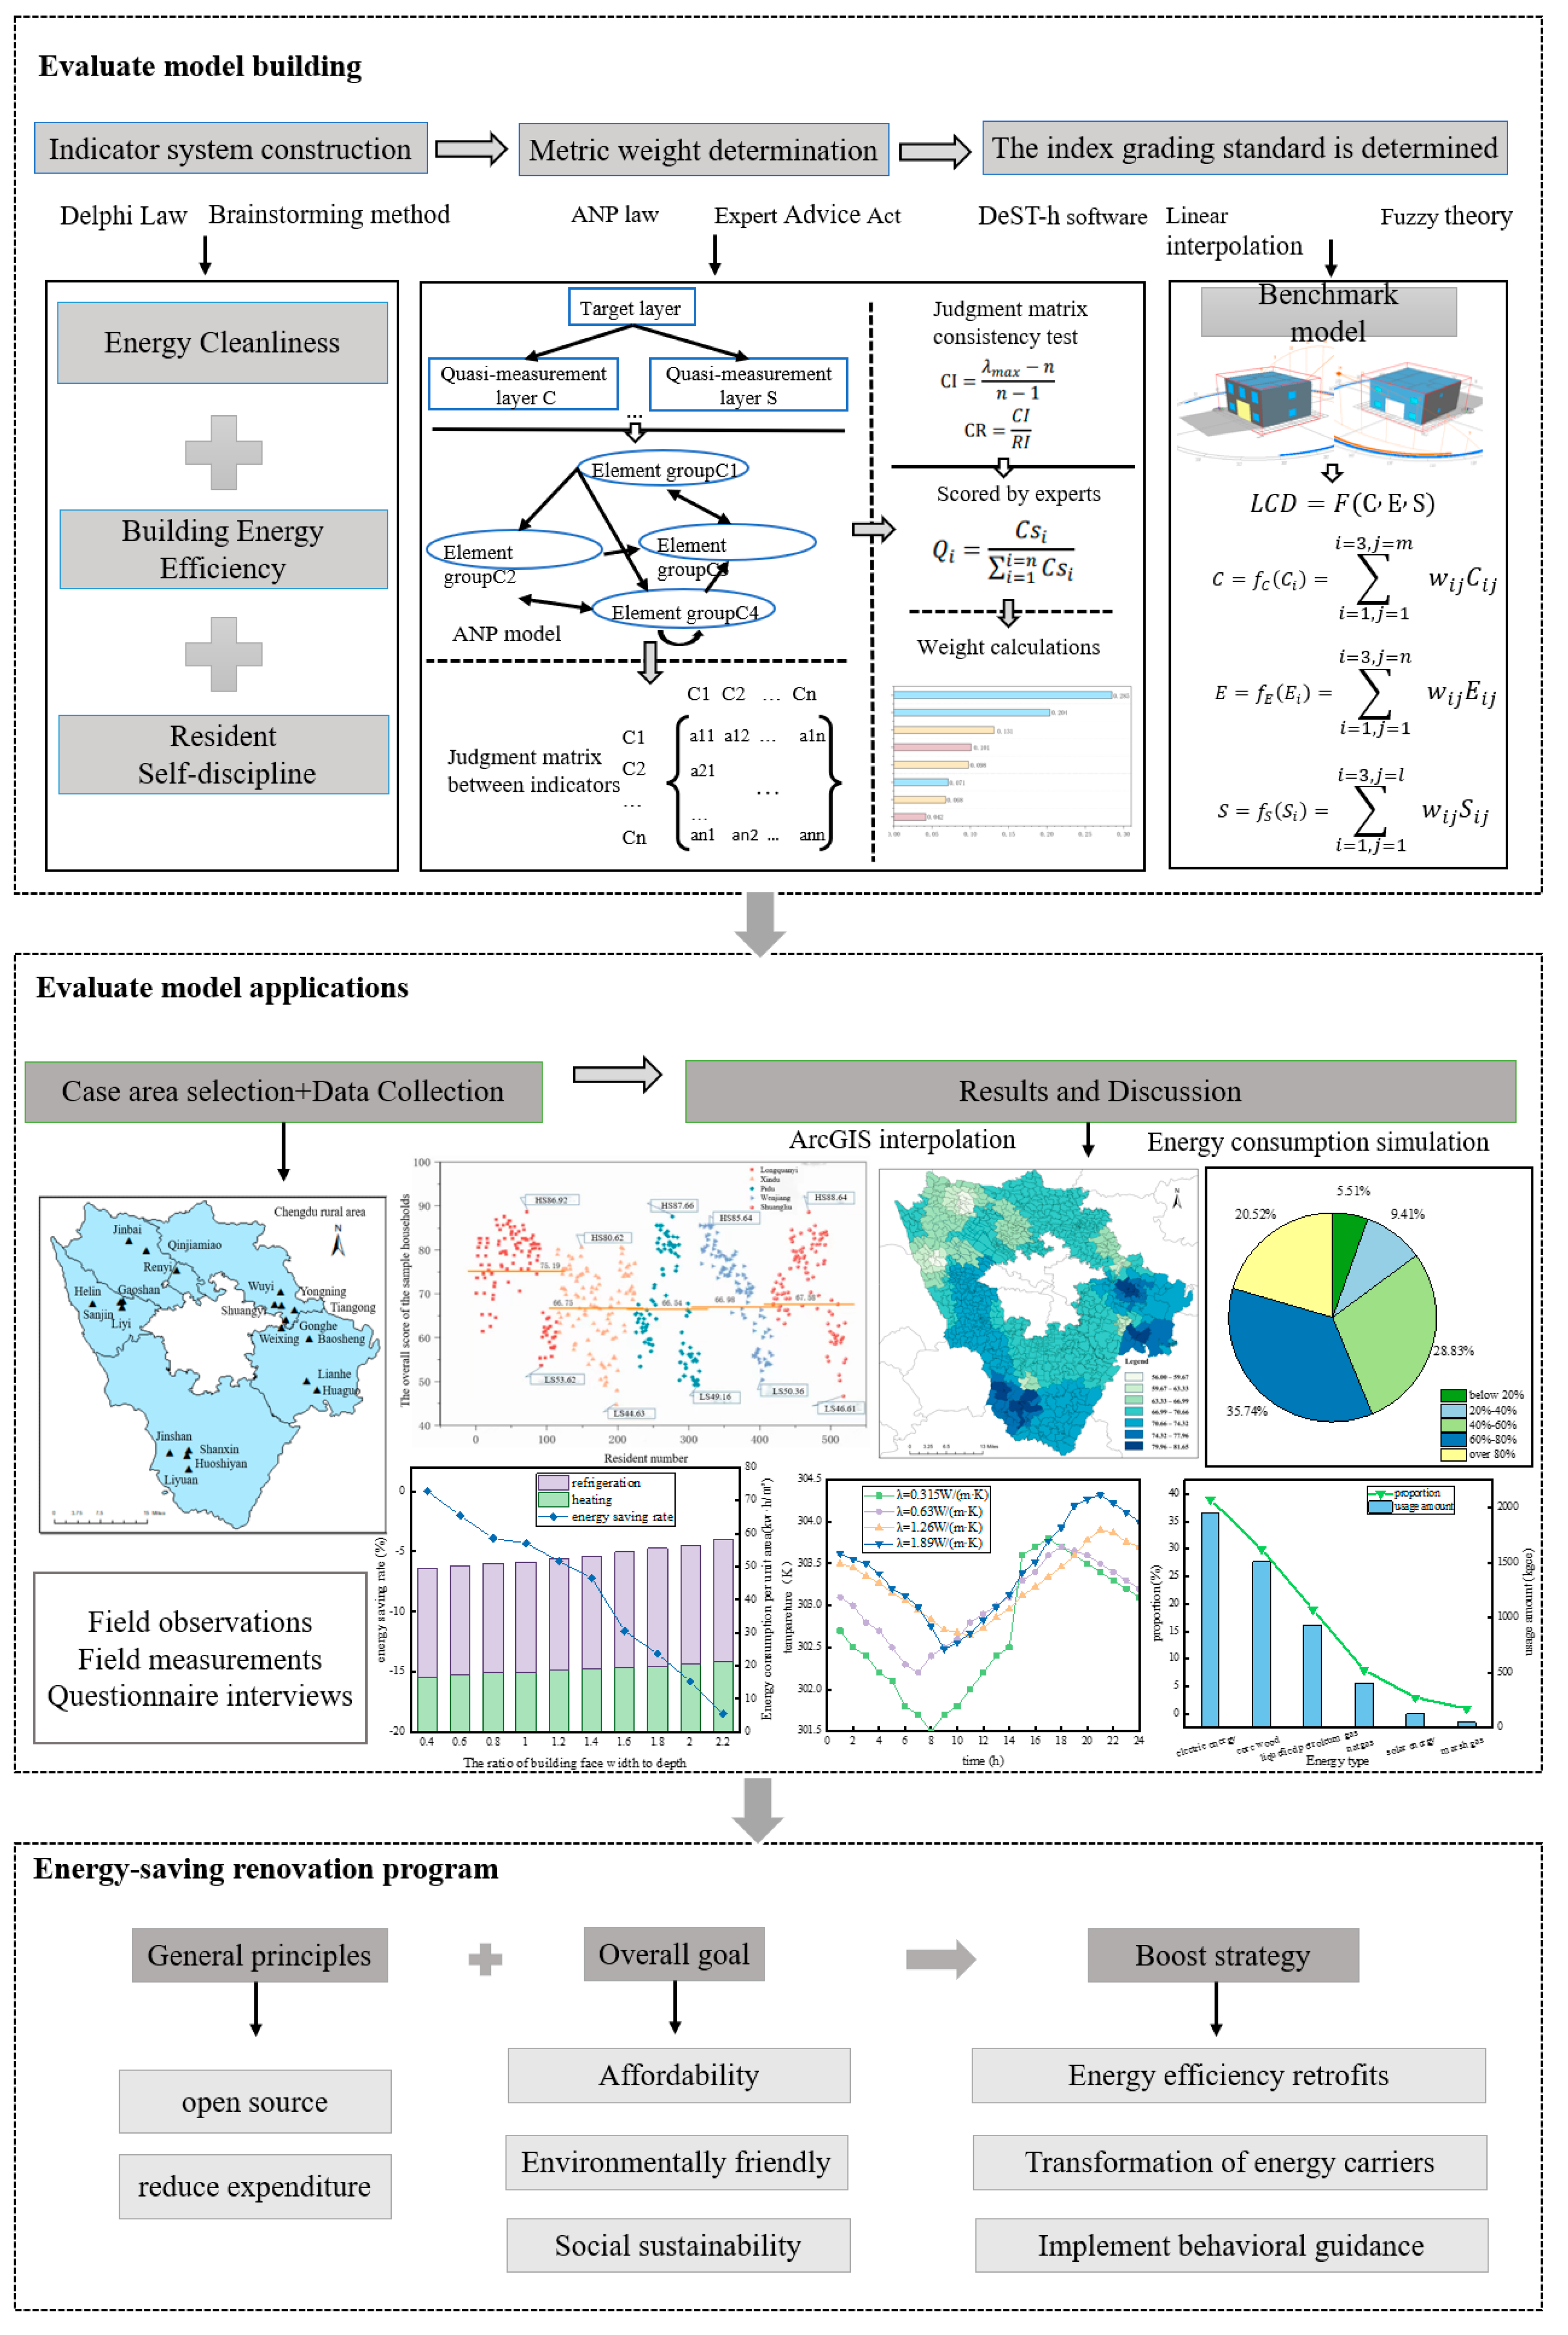
Figure 1. Research Flow Chart.
Preprints 106518 g001
Figure 2. Indicator Framework.
Preprints 106518 g002
Figure 3. Indicator architecture model based on the Analytic Network Process (ANP) method.
Preprints 106518 g003
Figure 4. Study Area Location.
Preprints 106518 g004
Figure 5. The survey process of the sample residential buildings.
Preprints 106518 g005
Figure 6. The annual consumption and proportion of different types of energy in the area under consideration.
Preprints 106518 g006
Figure 7. Spatial Distribution of ‘Energy Cleanliness’ in Rural Buildings around Chengdu.
Preprints 106518 g007
Figure 8. Energy consumption and energy savings per unit area are compared for different shape coefficients.
Preprints 106518 g008
Figure 9. Statistics on the proportion of the width and depth ratio of the sample building face.
Preprints 106518 g009
Figure 10. Periodic variation curves of wall temperature were analysed for walls with different thermal conductivity.
Preprints 106518 g010
Figure 11. Proportions of exterior wall types in the sample villages.
Preprints 106518 g011
Figure 12. Spatial Distribution of Building Energy Efficiency in Rural Areas around Chengdu.
Preprints 106518 g012
Figure 13. Proportion of energy-saving equipment used for cooking and hot water supply.
Preprints 106518 g013
Figure 14. Air conditioner set temperature percentage.
Preprints 106518 g014
Figure 15. Spatial Distribution of ‘Residents’ Self-Discipline’ in Rural Areas around Chengdu.
Preprints 106518 g015
Figure 16. Composite Results for Low Carbon Degree of Energy Consumption (LCD) in Rural Buildings.
Preprints 106518 g016
Figure 17. Energy-saving benefits of solar houses at varying depths.
Preprints 106518 g017
Figure 18. The benefits of energy-saving renovation of external walls under different schemes.
Preprints 106518 g018
Figure 19. Power consumption and energy efficiency per unit area in various modes.
Preprints 106518 g019
Table 1. Comprehensive evaluation index system of energy consumption of rural residential buildings.
Criterion layer weight Sub-canonical layer weight Factor layer weight Normalized values
q∈[80,100] q∈[60,80) q∈[40,60) q∈[20,40) q<20
Energy Cleanliness C 0.559 Energy Supply and Demand C1 0.071 Clean energy demand satisfaction C11(subjective) 0.041 Satisfaction with clean energy demand is high Satisfaction with clean energy demand is relatively high Satisfaction with clean energy demand is average Satisfaction with clean energy demand is relatively low Satisfaction with clean energy demand is low
Energy price stability C12(subjective) 0.016 Energy prices are stable Energy prices are relatively stable Energy prices vary in general Energy prices are relatively highly volatile Energy prices are highly volatile
Energy Subsidies and Satisfaction C13(subjective) 0.013 Residents are highly satisfied with energy subsidies Residents are more satisfied with energy subsidies Residents’ satisfaction with energy subsidies is average Residents’ satisfaction with energy subsidies is relatively low Residents’ satisfaction with energy subsidies is low
Energy Use C2 0.285 Electricity consumption per capita C21 0.064 Electricity consumption Q∈ [646,727] Electricity consumption Q∈(727,808] Electricity consumption Q∈(808,889] Electricity consumption Q∈(889,970] Electricity consumption Q∈(970,1051]
Gas consumption per capita C22 0.041 Gas consumption
G∈[72,81]
Gas consumption G∈(81,90] Gas consumption G∈(90,99] Gas consumption G∈(99,108] Gas consumption G∈(108,117]
Proportion of energy use from commodities C23 0.074 commodity energy use/total energy ×100%
Proportion of renewable energy usage C24 0.105 Total clean energy usage/total energy usage×100%
Energy Sustainable C3 0.204 Biomass energy utilisation C31 0.102 It meets the requirements of biogas digester on-site use and has a high frequency of use It meets the requirements of biogas digester on-site use and the frequency of use is average It meets the requirements of biogas digester on-site use and is used less frequently Does not meet the requirements for use or does not use modern biomass energy Conventional biomass energy is used
Solar energy systems C32 0.102 30 points for solar thermal equipment, 30 points for solar photovoltaic equipment, and 20 points for setting up a sunshine room, and the cumulative score is calculated
Building Energy Efficiency E 0.297 Architectural Design E1 0.098 Building Site Selection E11 0.043 According to the definition of the rationality of building site selection in relevant specifications, five main conditions are established to determine the evaluation criteria for building site selection based on the number of buildings
5 conditions are met 4 conditions are met 3 conditions are met 2 conditions are met 0-1 conditions are met
Building orientation E12 0.016 The growth rate of energy consumption is 0%-3%, corresponding to the direction The growth rate of energy consumption is 3%-6%, corresponding to the direction The growth rate of energy consumption is 6%-9%, corresponding to the direction The energy consumption growth rate of 9%-12% corresponds to the direction The energy consumption growth rate is greater than 12%, corresponding to the direction
Architectural space layout E13 0.025 Floor height 2.7≤h≤3.0 Floor height 3.0<h≤3.3 loor height 3.0<h≤3.3 Floor height 3.6<h≤3.9 Floor height 3.9<h≤4.2
Building Form Factor E14 0.013 0.35≤Tx≤0.45 0.45<Tx≤0.55 0.55<Tx≤0.75 0.75<Tx≤0.95 0.95<Tx≤1.2
Envelope Structure E2 0.131 Thermal Performance of Exterior Walls E21 0.041 0.6≤Km≤1.0 1.0<Km≤1.4 1.4<Km≤1.8 1.8<Km≤2.2 2.2<Km≤2.6
Thermal Performance of Exterior Windows E22 0.041 1.4≤Kw≤2.4 2.4<Kw≤3.4 3.4<Kw≤4.4 4.4<Kw≤5.4 5.4<Kw≤6.4
Thermal Performance of Roofing E23 0.022 0.8≤Kr≤1.4 1.4<Kr≤2.0 2.0<Kr≤2.6 2.6<Kr≤3.2 3.2<Kr≤4.0
External shading measures E24 0.027 2.0≤L≤2.7 1.5<L≤2.0 1.0<L≤1.5 0.5<L≤1.0 0<L≤0.5
Building Material E3 0.068 Building materials localization ratio E31 0.026 City-wide use of building materials/total use of building materials×100%
Utilization rate of environmentally friendly construction materials E32 0.042 Green building materials used/total building materials used×100%
Resident Self-discipline S 0.144 Awareness Management S1 0.042 Widespread awareness of low carbon S11(subjective) 0.016 Residents have a high level of low-carbon knowledge Residents have a relatively high level of low-carbon knowledge Residents’ low-carbon knowledge is average Residents’ understanding of low-carbon knowledge is relatively low Residents’ low-carbon knowledge is low
Acceptance of Low-Carbon Living S12(subjective) 0.011 The main low-carbon lifestyles are green consumption, food conservation, residential energy-saving renovation, energy-saving household appliances, garbage classification, and clean travel
Meet 5-6 items Meet 4 items Meet 3 items Meet 2 items Meet 0-1 items
Responsiveness to low-carbon construction S13(subjective) 0.015 The village residents are supportive of infrastructure construction Residents are in favour of the development of rural infrastructure and hardware Residents generally support the construction of rural infrastructure and hardware The construction of rural infrastructure is less supported by residents Residents do not support the construction of rural infrastructure
Behavior Management S2 0.101 Proportion of equipment designed to save energy S21 0.036 Number of energy-saving devices in the dwelling/Total number of devices in the dwelling×100%
Implementation rate of energy-saving measures S22 0.037 The number of energy-saving behaviors achieved by residents/10×100%
Waste recycling S23(subjective) 0.015 Utilise household waste to its full potential A significant proportion of household waste is utilised. Household waste is partly utilised A small quantity of domestic waste is utilised Household waste is not utilised
Indoor air quality regulation S24 0.013 The cumulative score is calculated by assigning 30 points for indoor planting of green plants, 30 points for indoor air purifiers, and 20 points for window ventilation.
Table 2. The low carbon level of each sample village was comprehensively assessed.
Low carbon level The name of the village
Low-carbon [80,100] Baosheng Village, Huaguo Village, Qinjiamiao Village, Gaoshan Village, Liyuan New Village
Medium- low carbon [70,80) Satellite Village, Gonghe Village, Shuangyi Village, Helin Village, Mitsui Village, Sanxin Village
Medium carbon [60,70) Tiangong Village, Yongning Village, Renyi Village, Jingshan Village
Medium- high carbon [50,60) Lianhe Village, Wuyi Village, Jinbai Village, Liyi Village, Huoshiyan Village
High-carbon [0,50) without
Disclaimer/Publisher’s Note: The statements, opinions and data contained in all publications are solely those of the individual author(s) and contributor(s) and not of MDPI and/or the editor(s). MDPI and/or the editor(s) disclaim responsibility for any injury to people or property resulting from any ideas, methods, instructions or products referred to in the content.
Copyright: This open access article is published under a Creative Commons CC BY 4.0 license, which permit the free download, distribution, and reuse, provided that the author and preprint are cited in any reuse.
Prerpints.org logo

Preprints.org is a free preprint server supported by MDPI in Basel, Switzerland.

Subscribe

© 2024 MDPI (Basel, Switzerland) unless otherwise stated