Submitted:
16 May 2024
Posted:
16 May 2024
You are already at the latest version
Abstract
Keywords:
Introduction
Methods and Materials:
Study Animals and Approval
SIV Inoculation, Monitoring, and ART Treatment
P. fragile Inoculation, Monitoring, and Anti-Malarial Treatment
Sample Collection and Processing
Flow Cytometry
Detection of Plasma Markers of Neutrophil Function, GI Mucosal Barrier Integrity, and Microbial Translocation
Detection of Plasma Markers of Systemic Inflammation
Data and Statistical Analysis
Results:
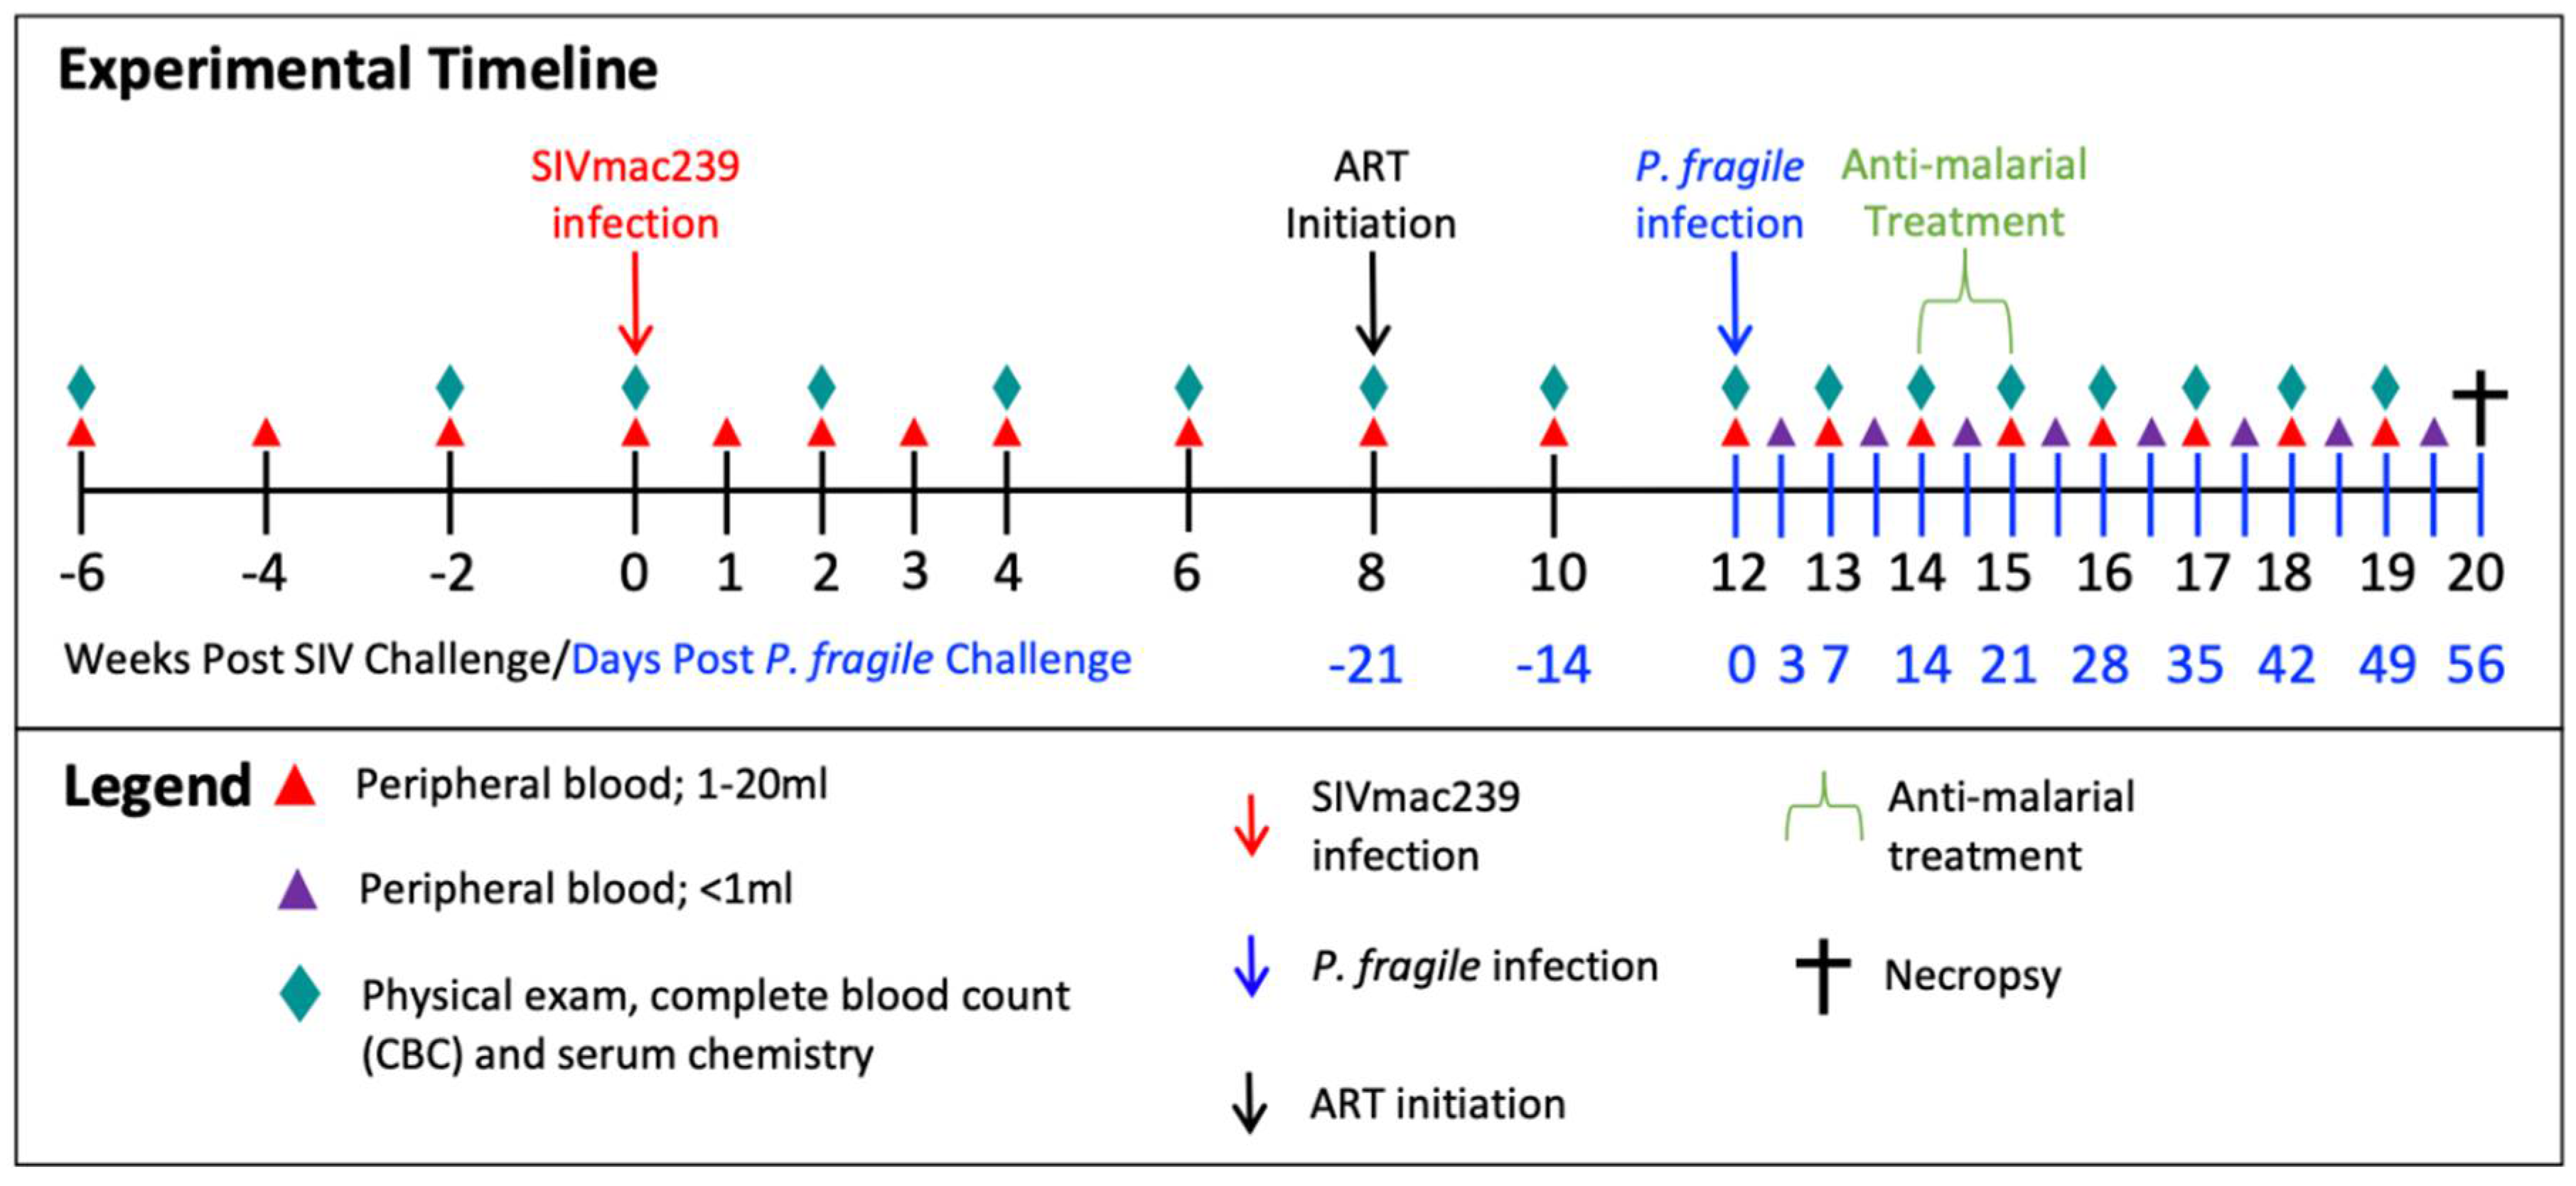
Experimental Design
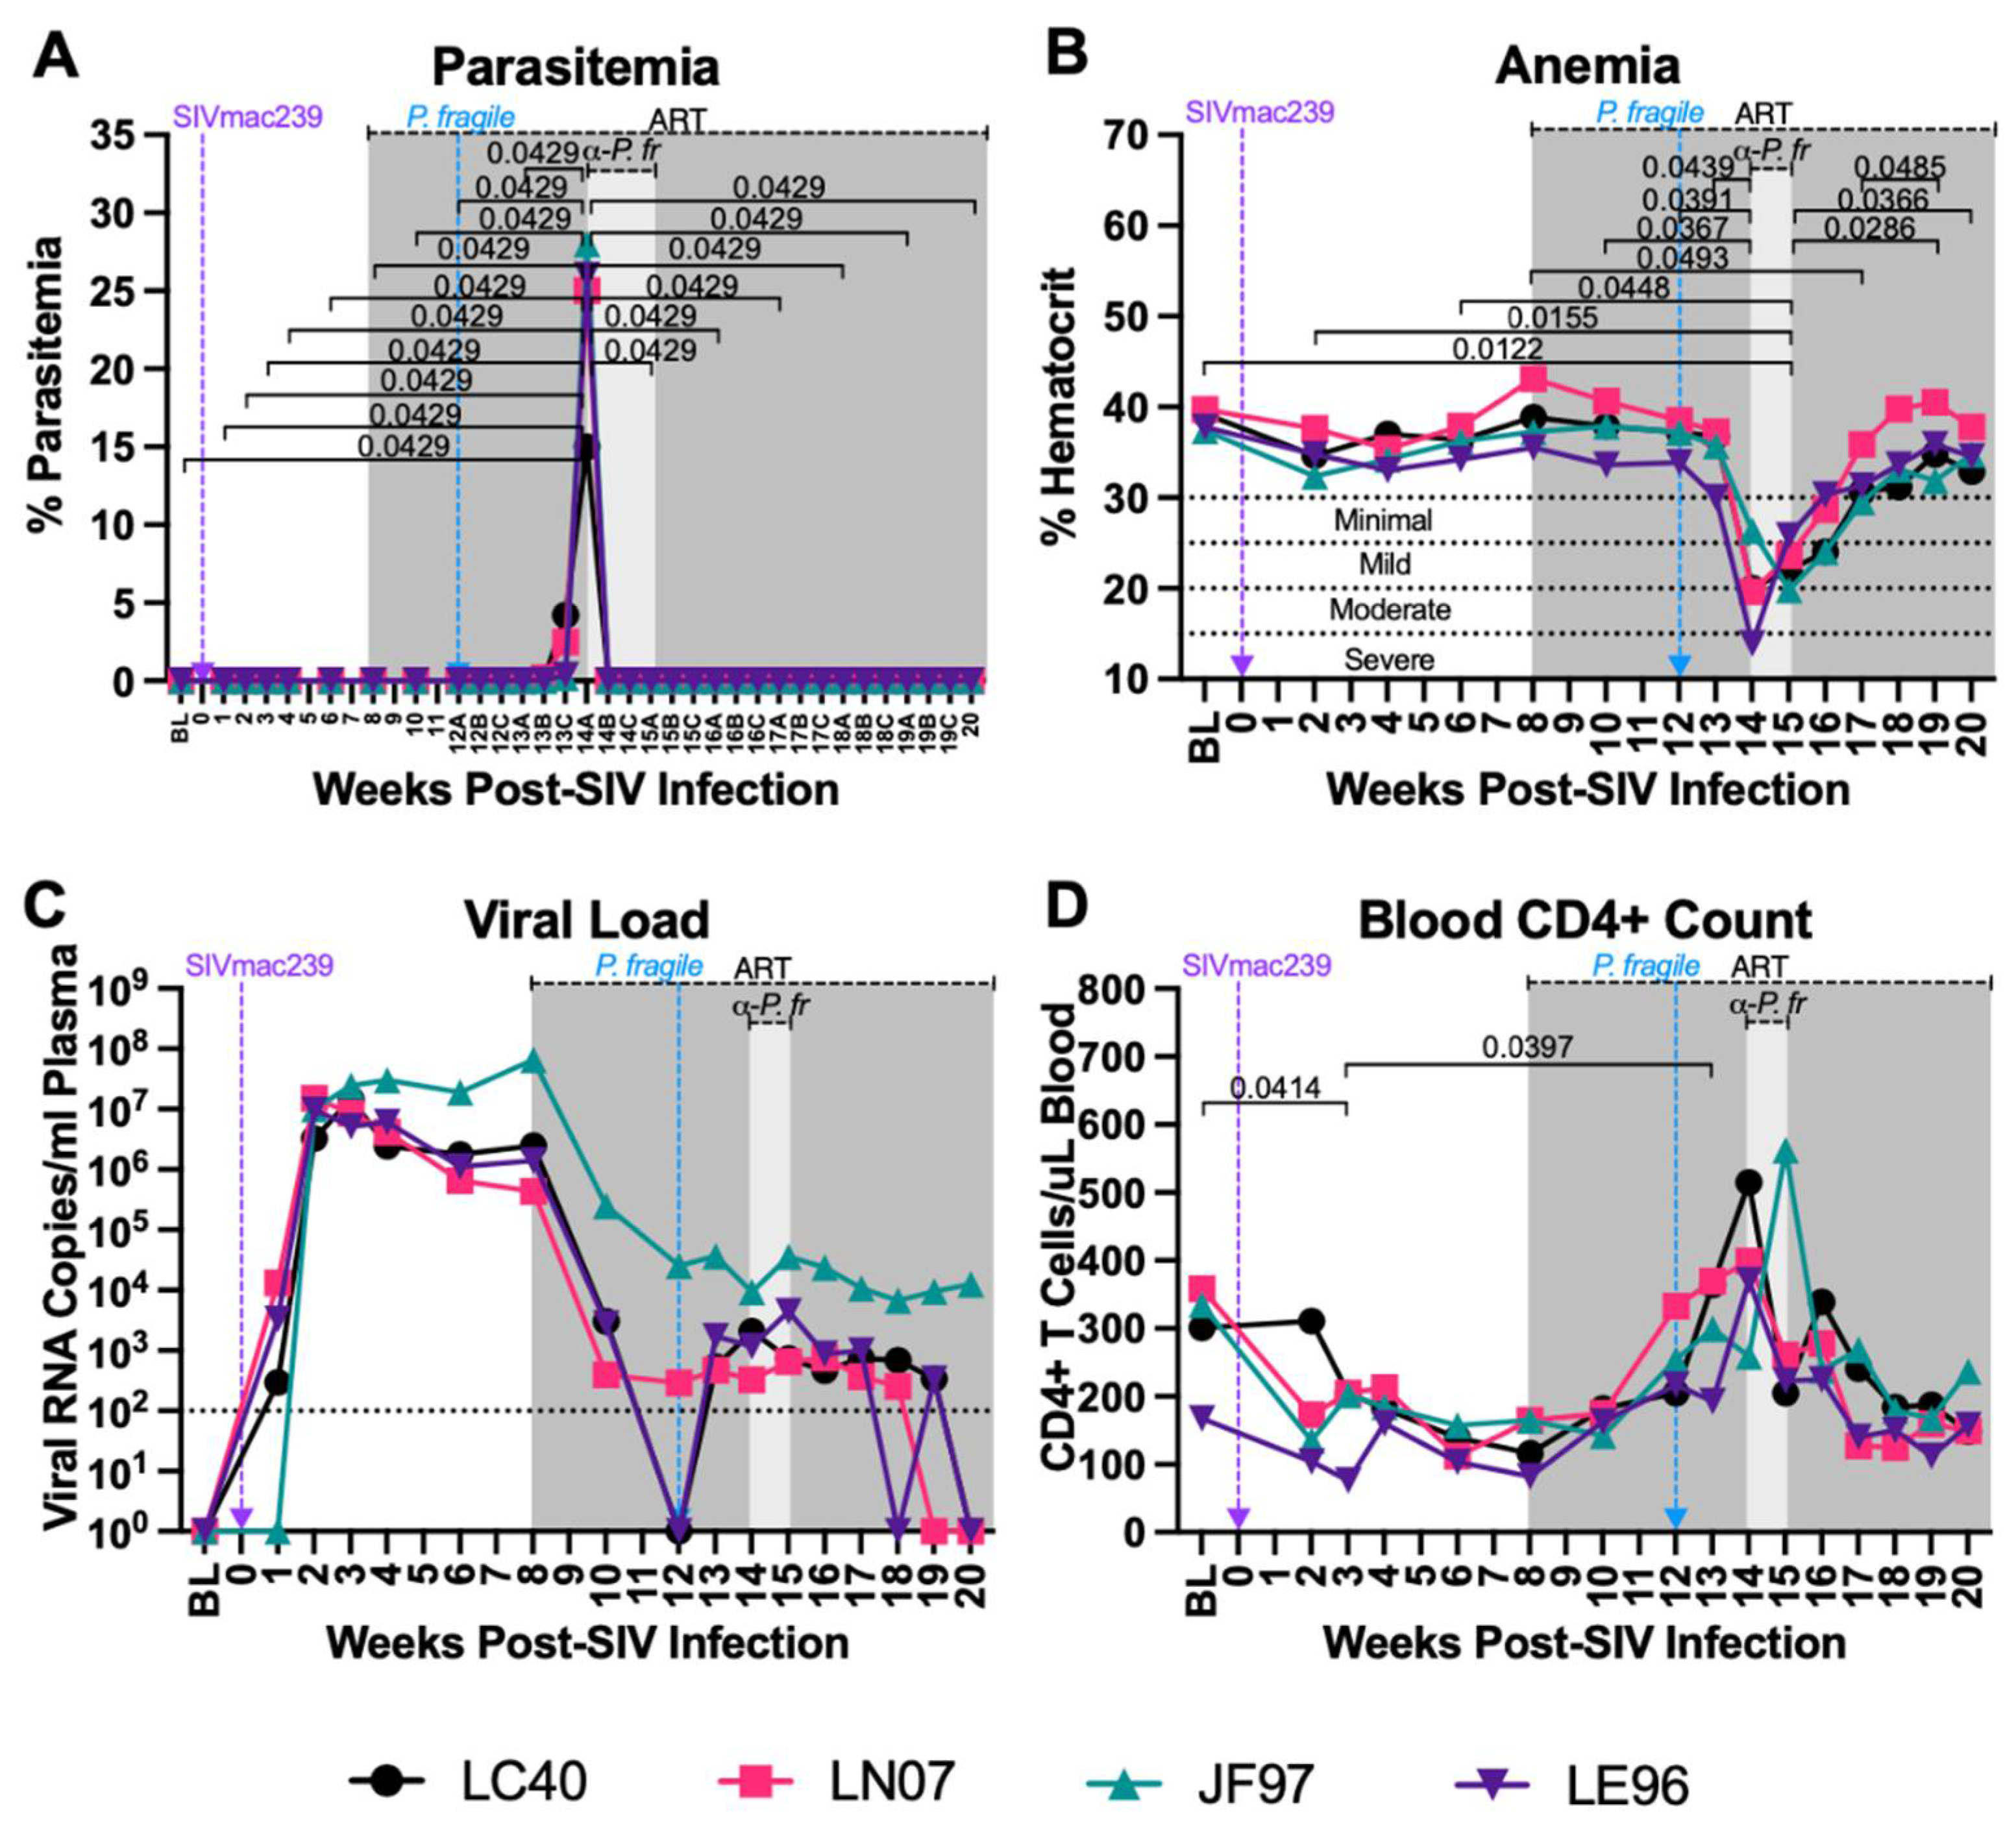
P. fragile co-Infection of ART-Treated SIV+ RMs Results in Clinical Signs of Malaria
P. fragile co-Infection Results in Clinical Signs of SIV Infection Despite Daily ART
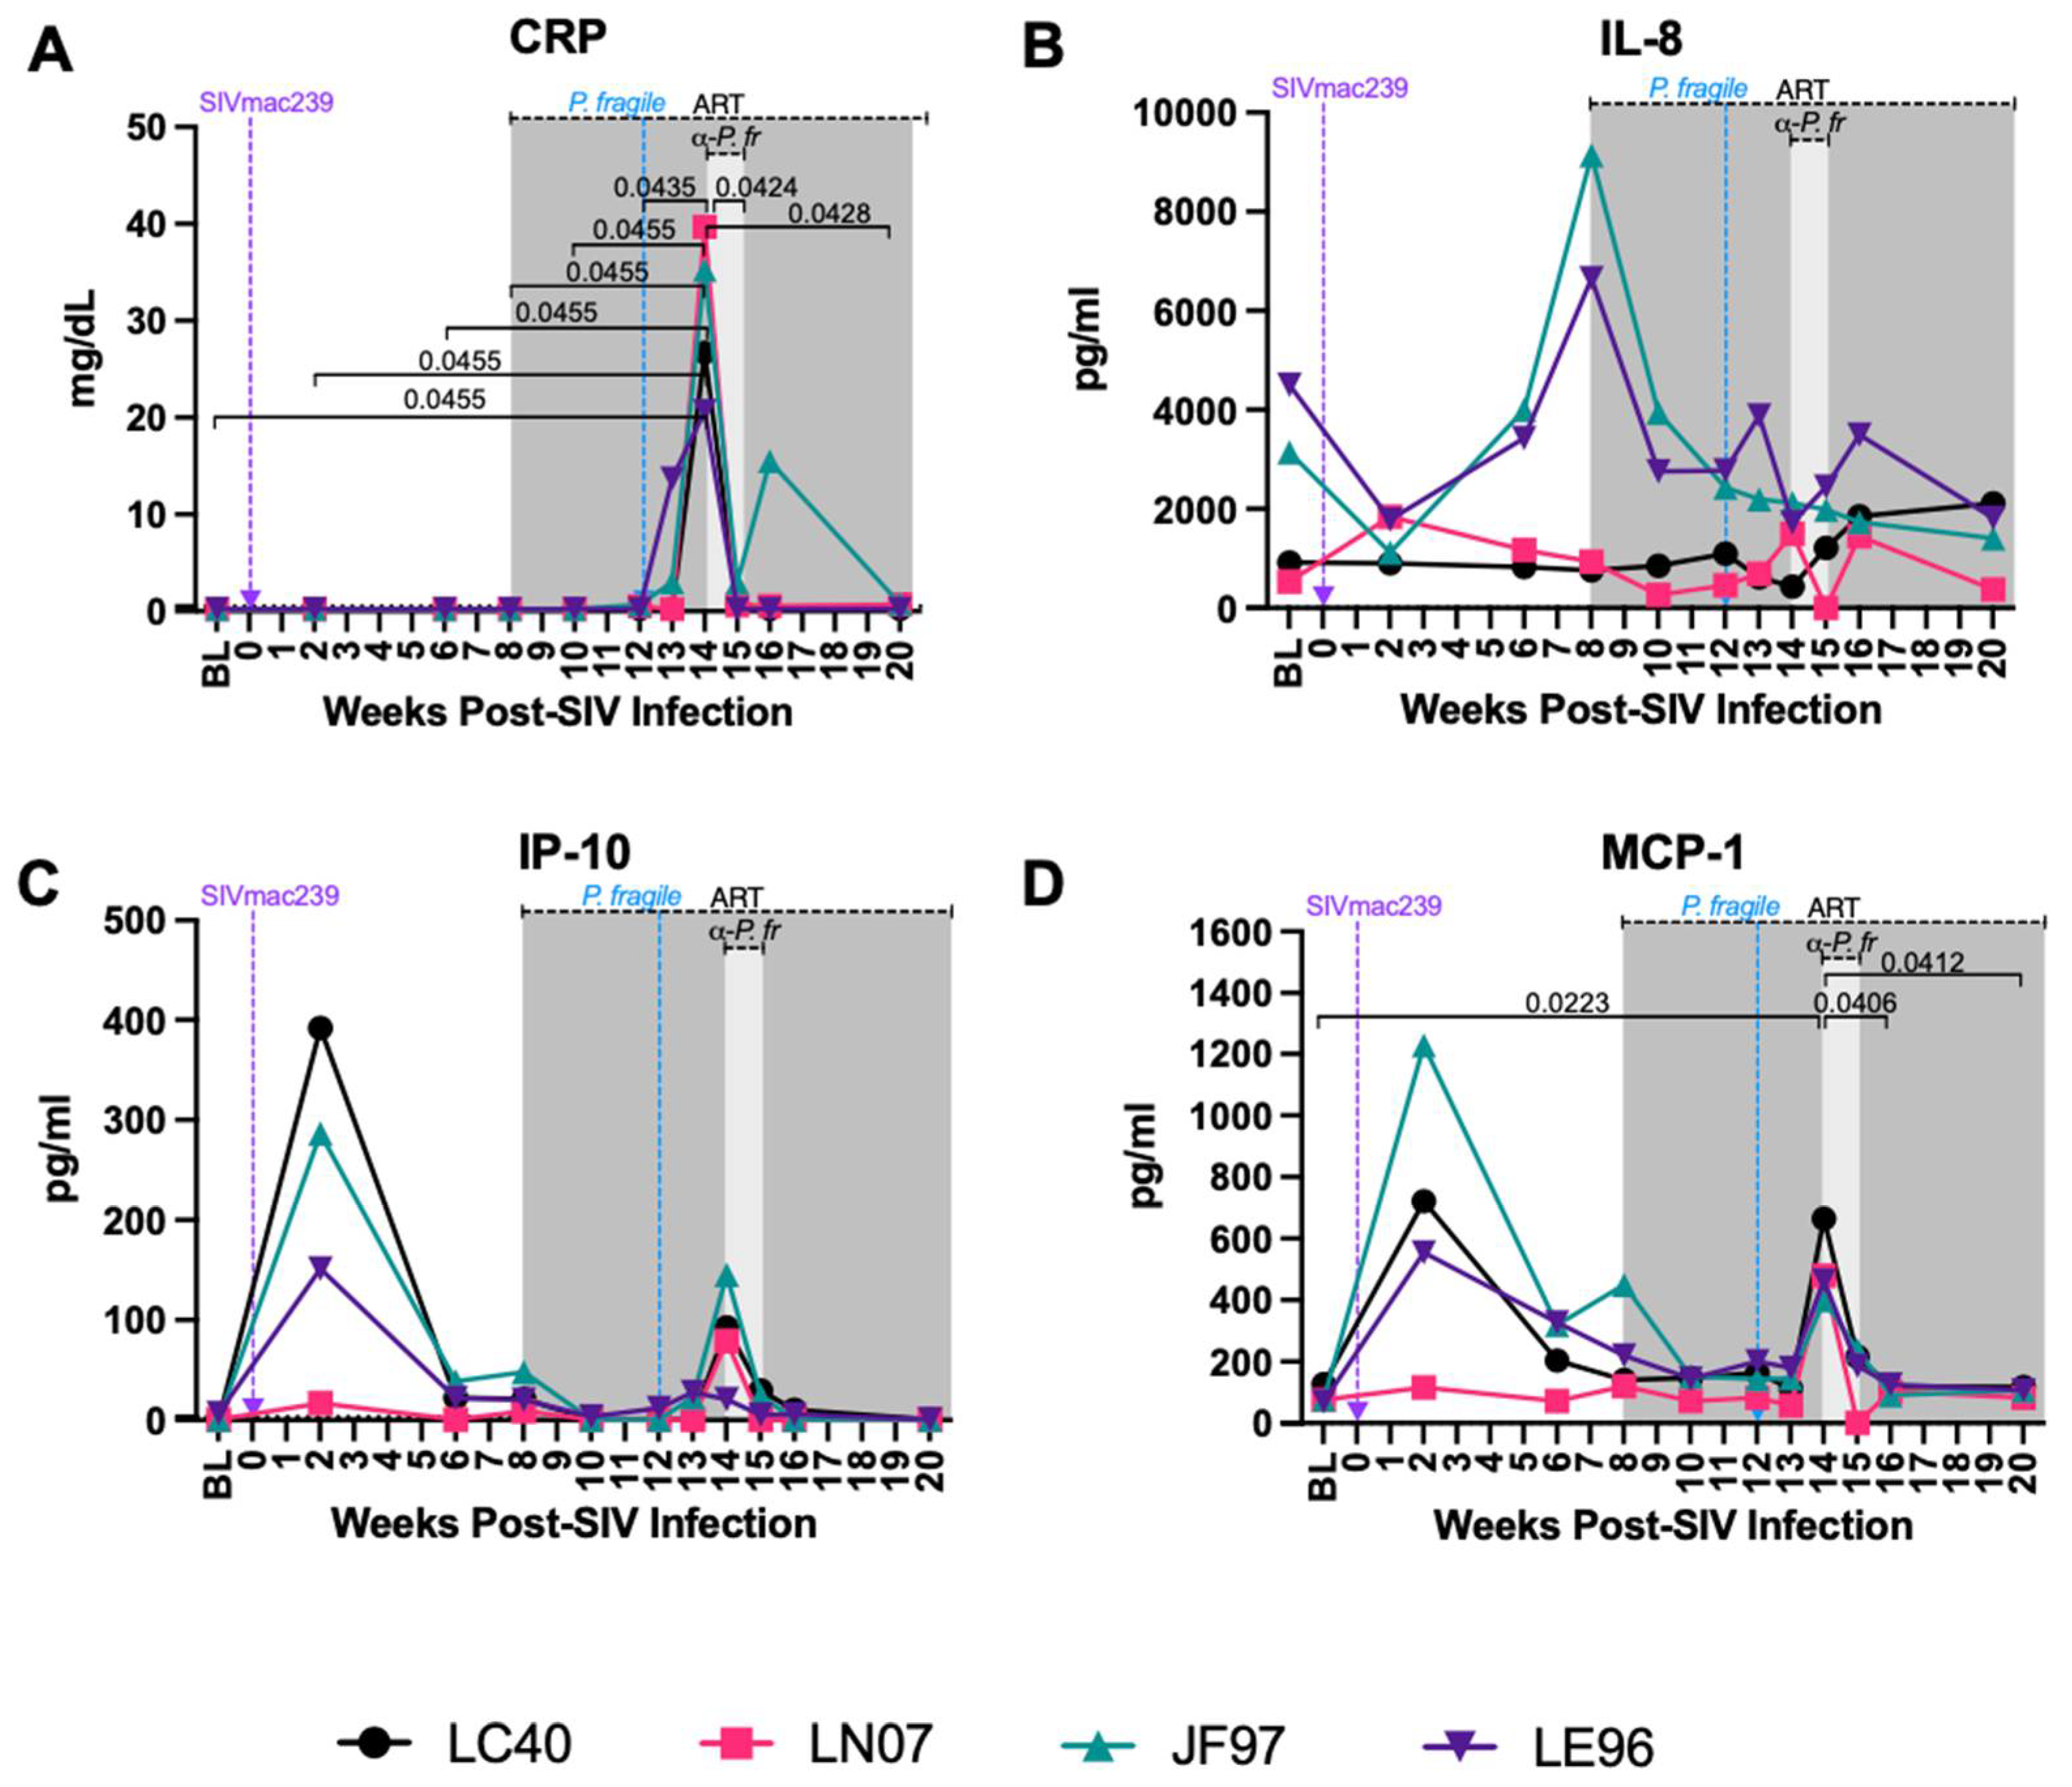
Increased Levels of Inflammatory Markers Associated with Neutrophil Function during ART-Treated SIV/P. Fragile co-Infection
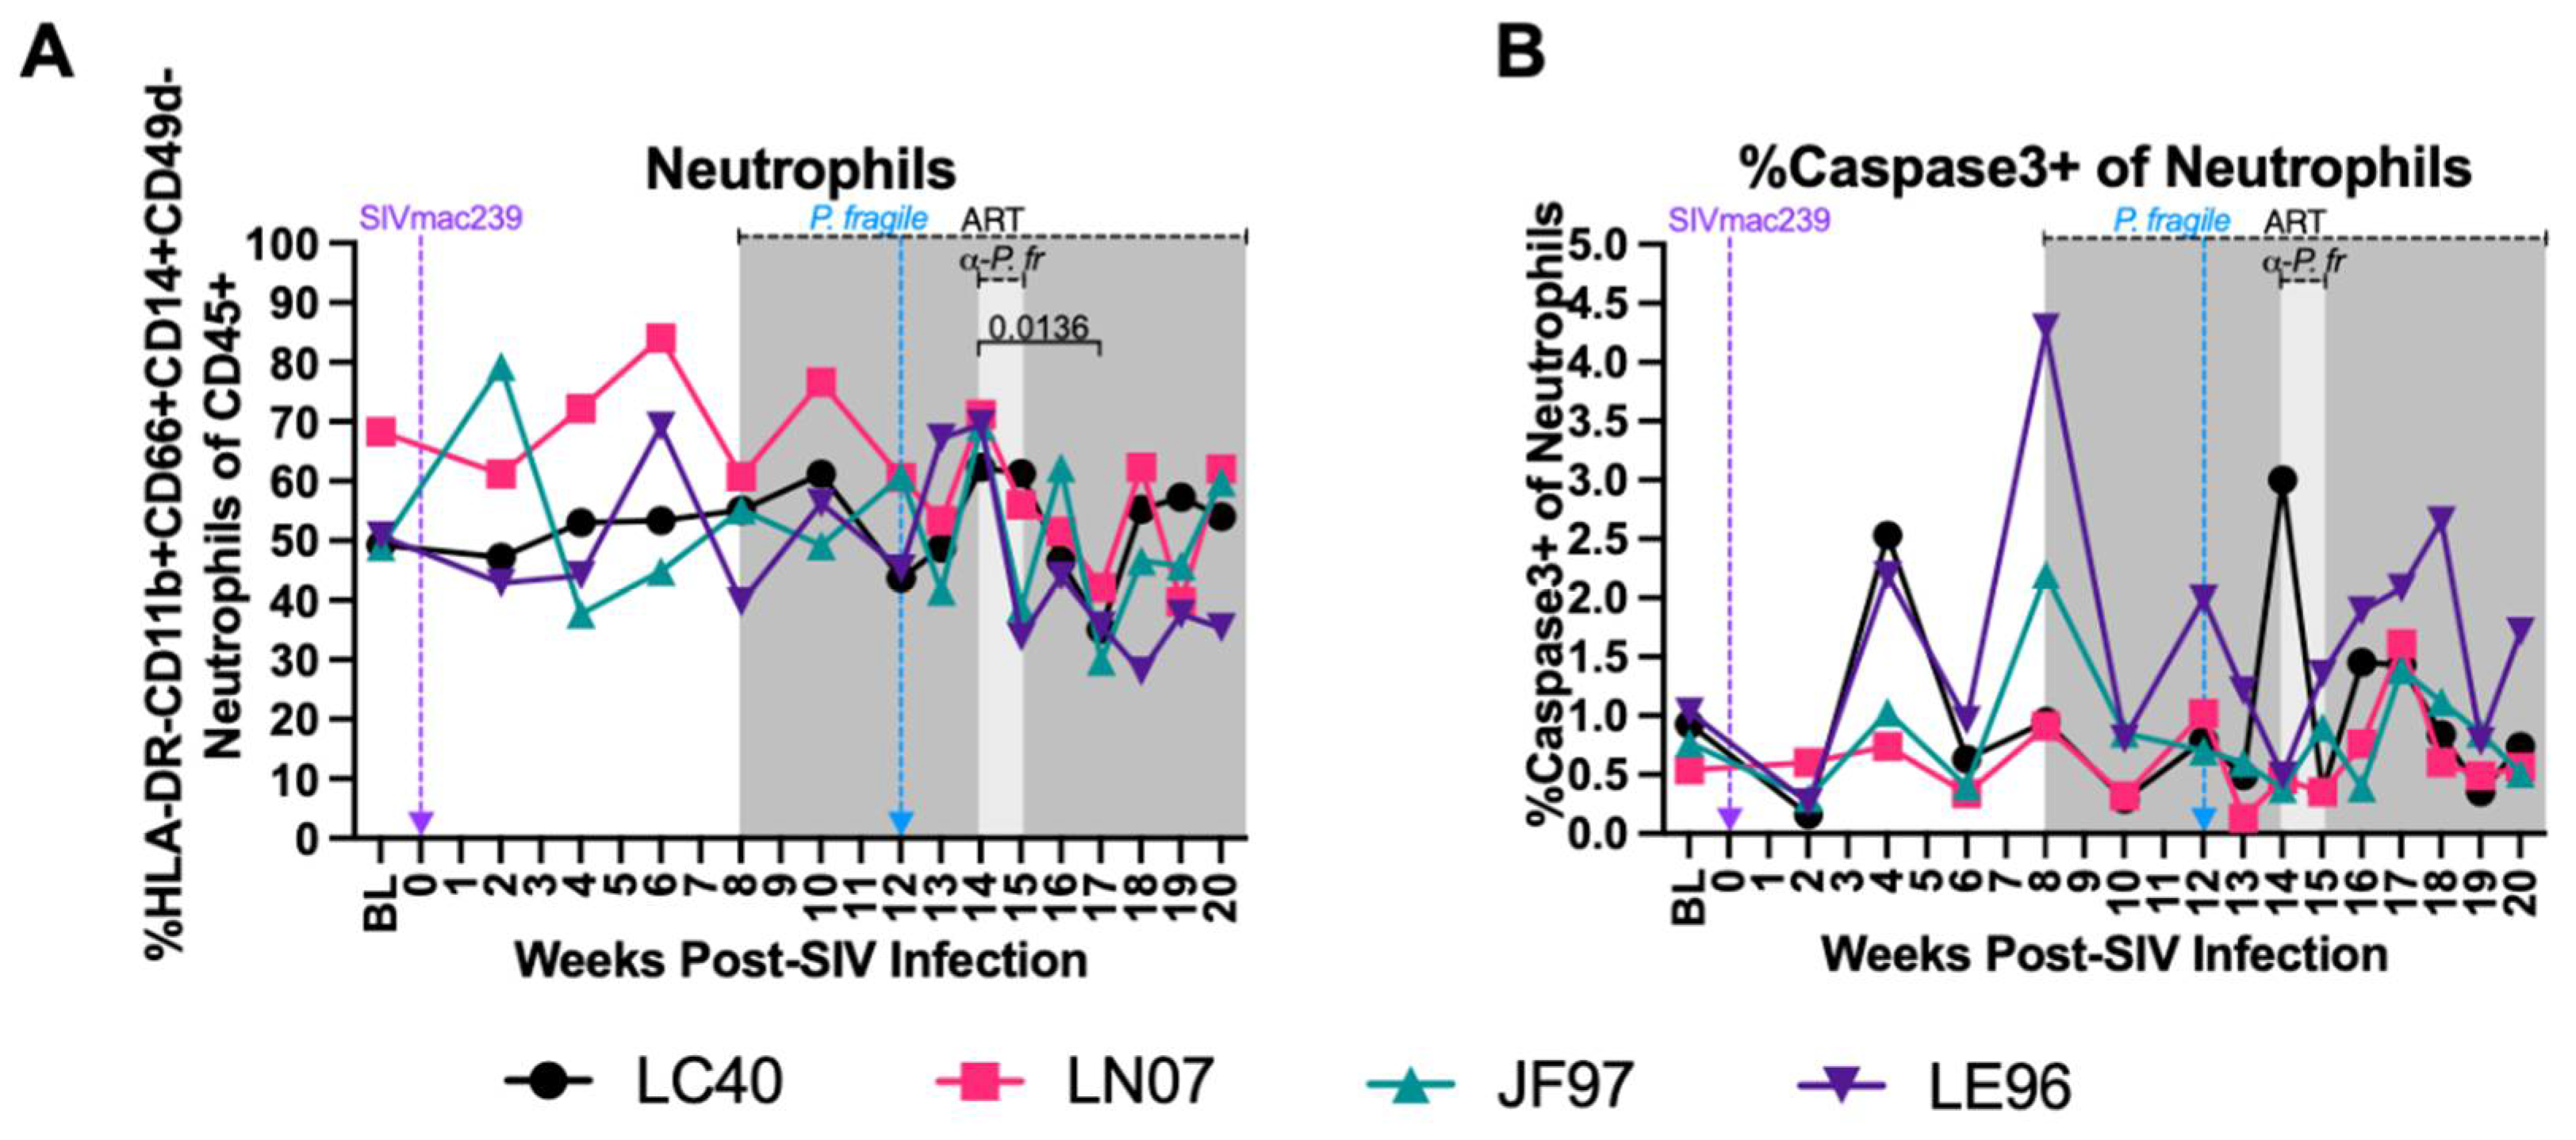
Stable Peripheral Neutrophil Frequencies and Apoptosis during ART-Treated SIV/P. fragile co-Infection
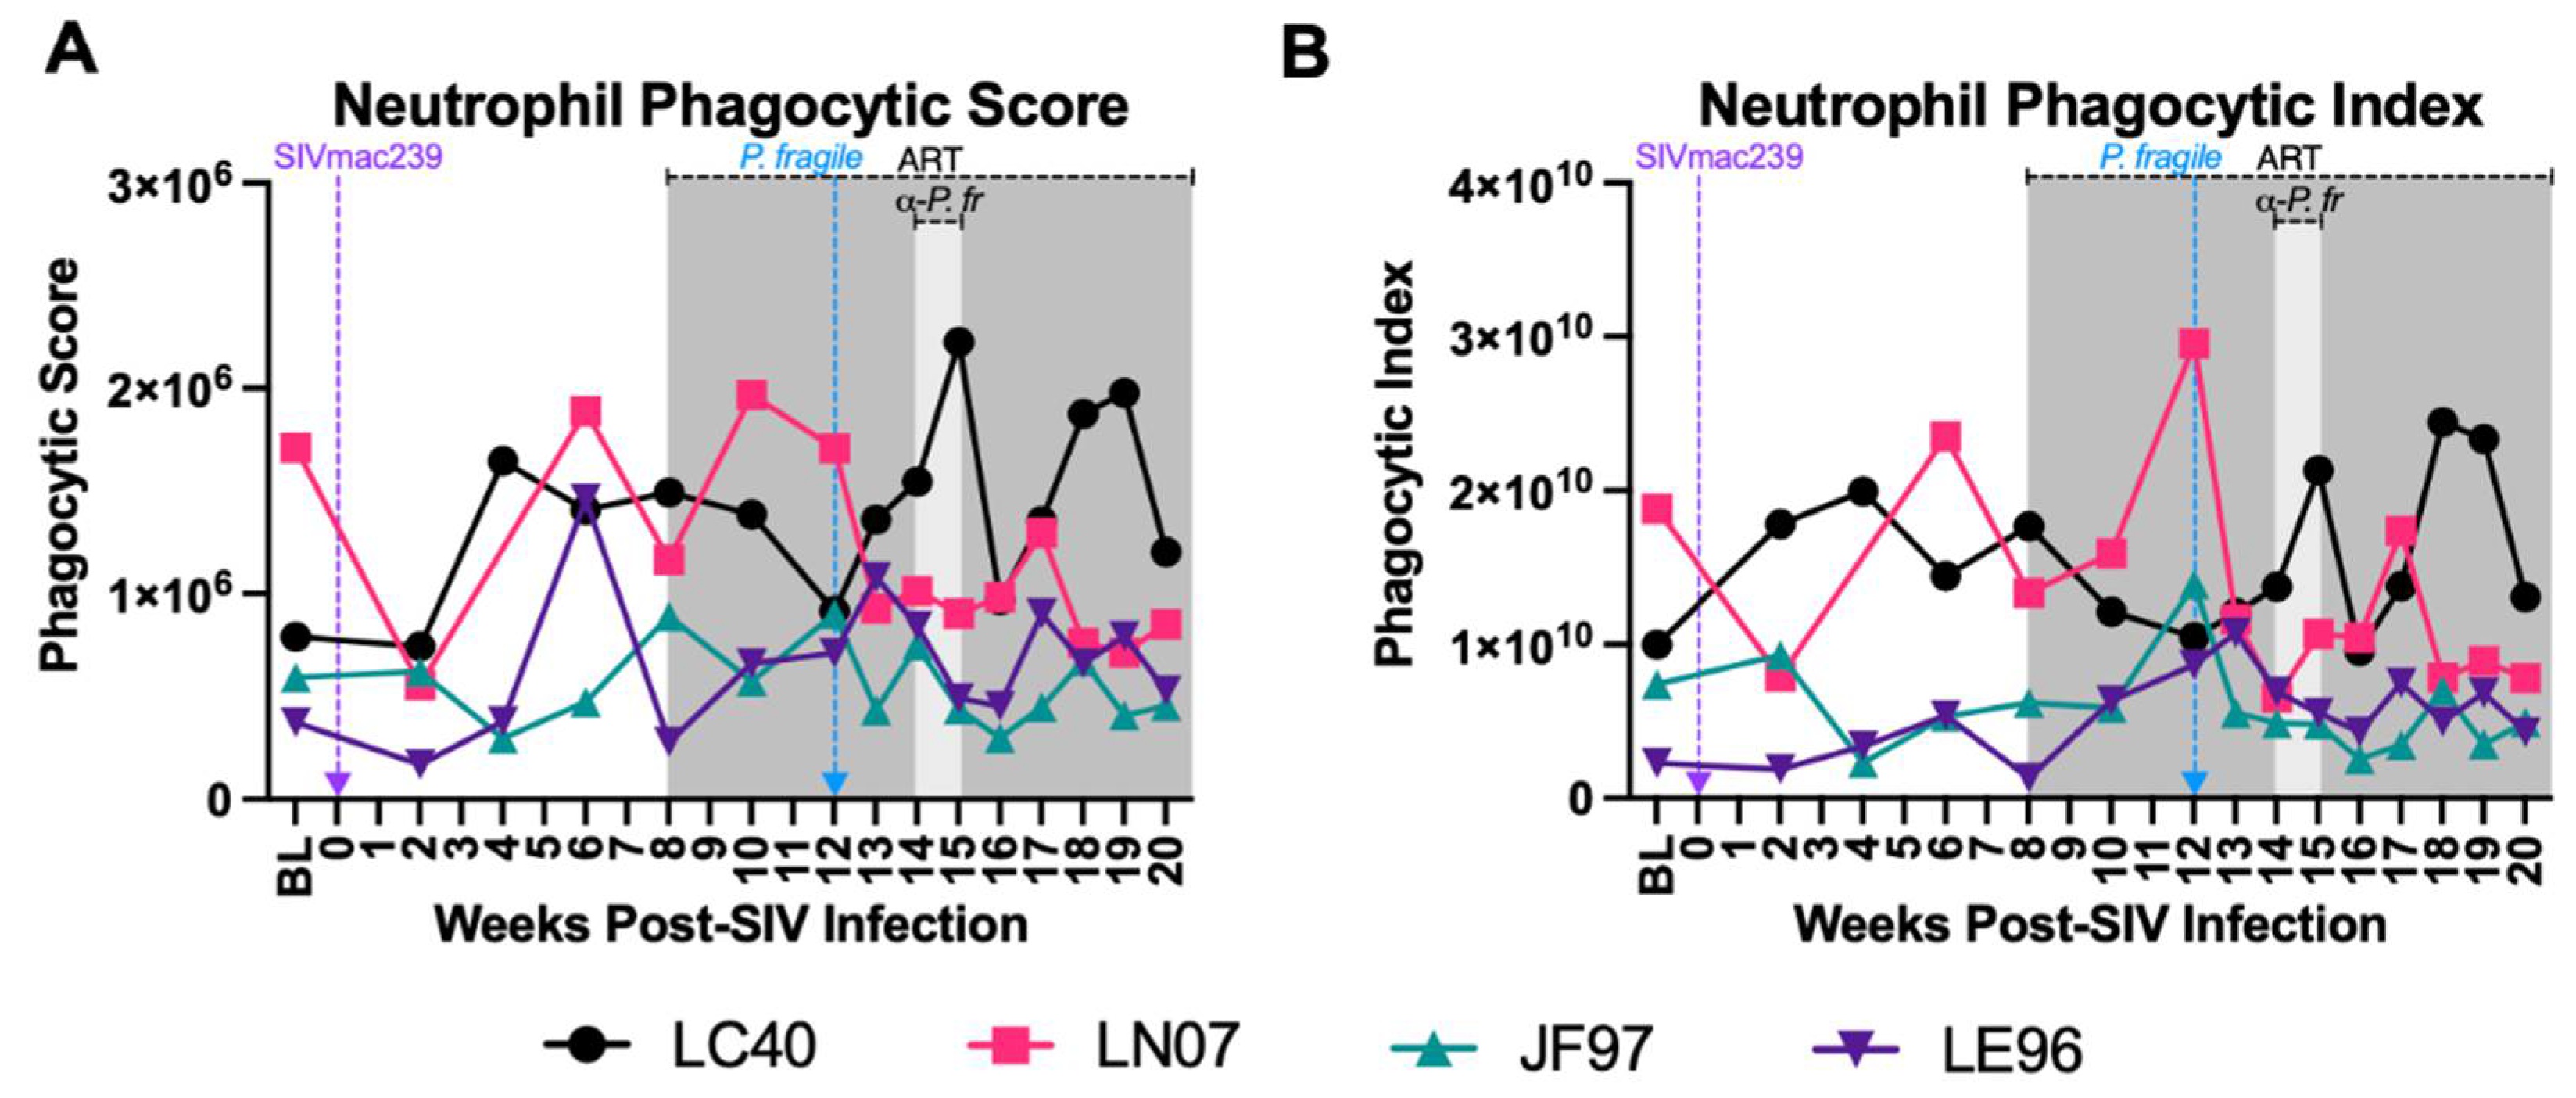
Minimal Disruption in Neutrophil Phagocytosis during ART-Treated SIV/P. Fragile co-Infection
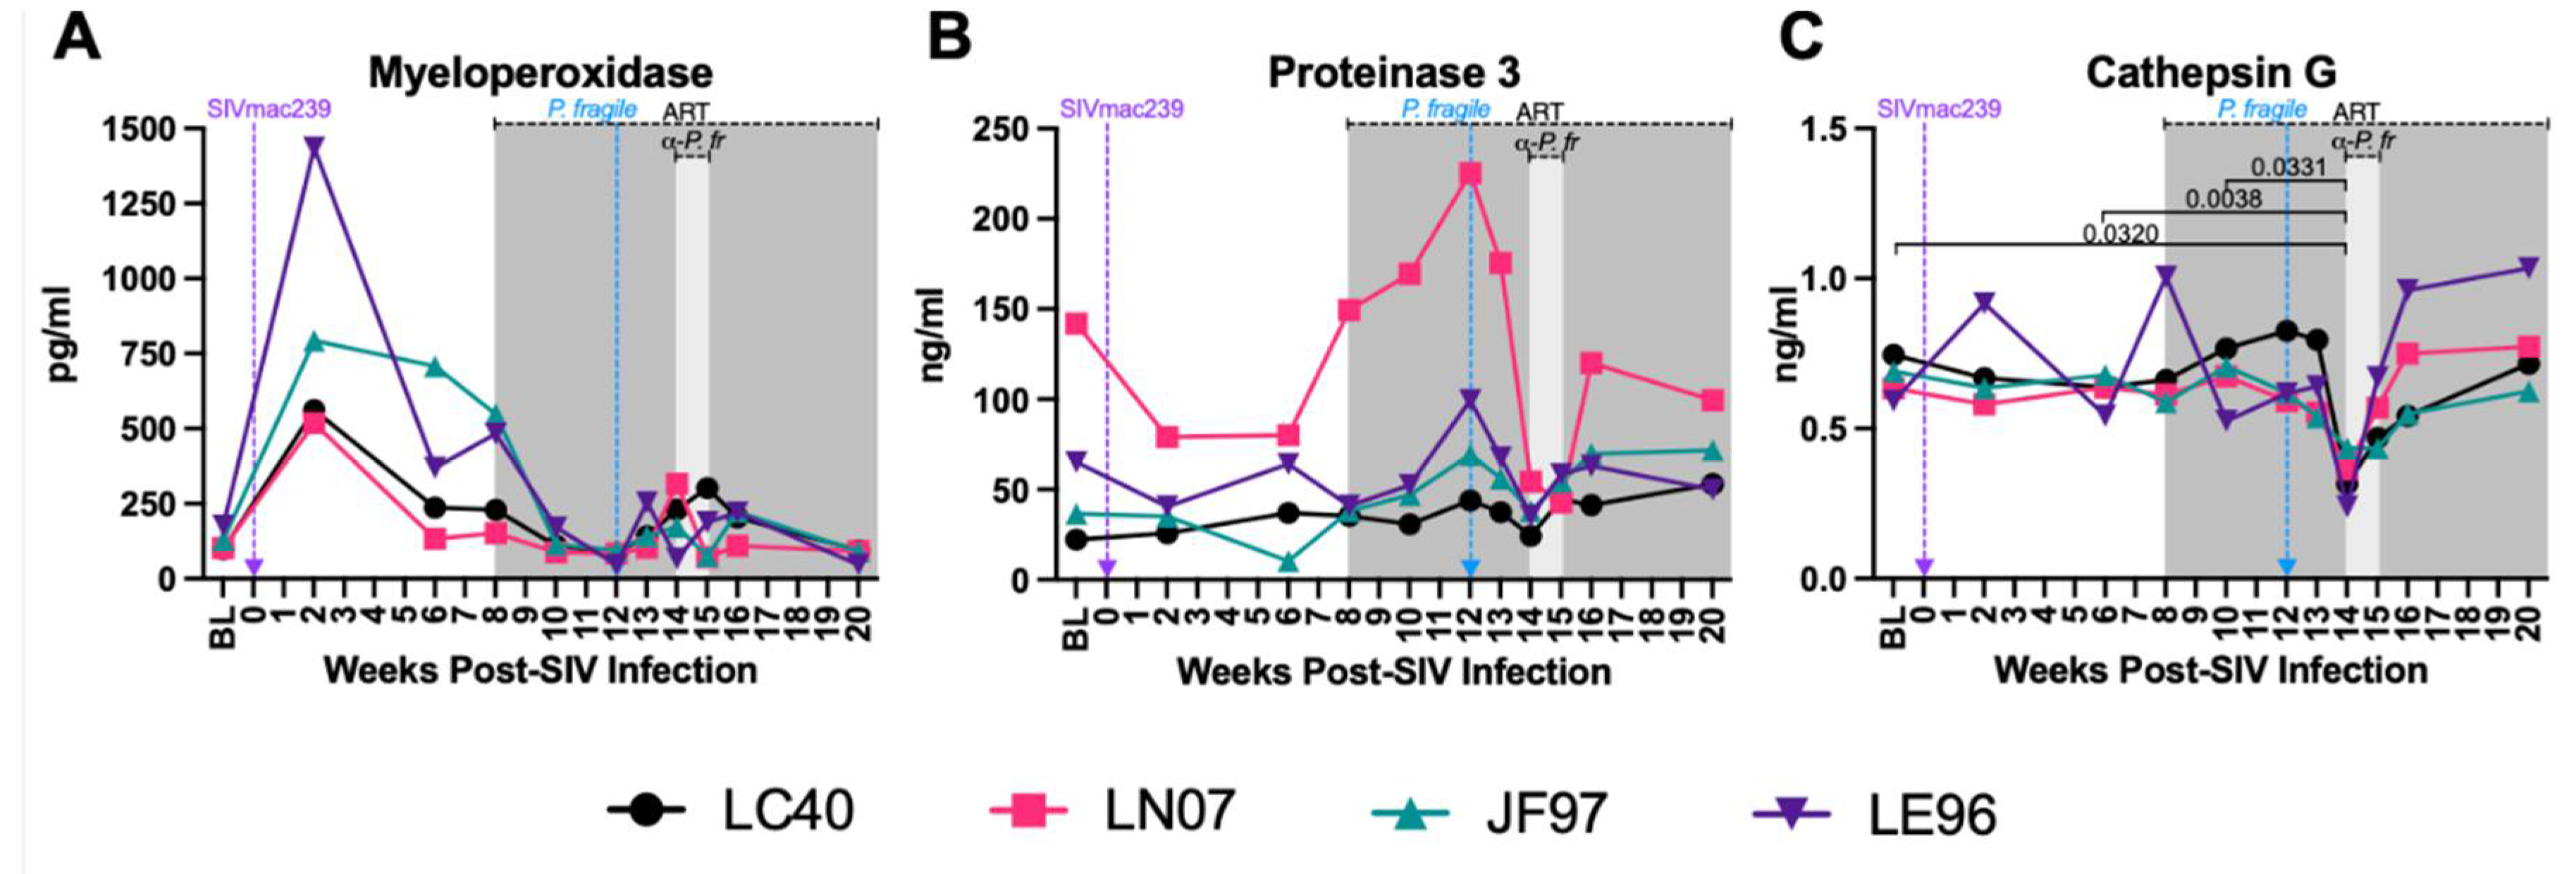
Decreased Plasma Levels of Neutrophil Granule Components during ART-Treated SIV/P. fragile co-Infection
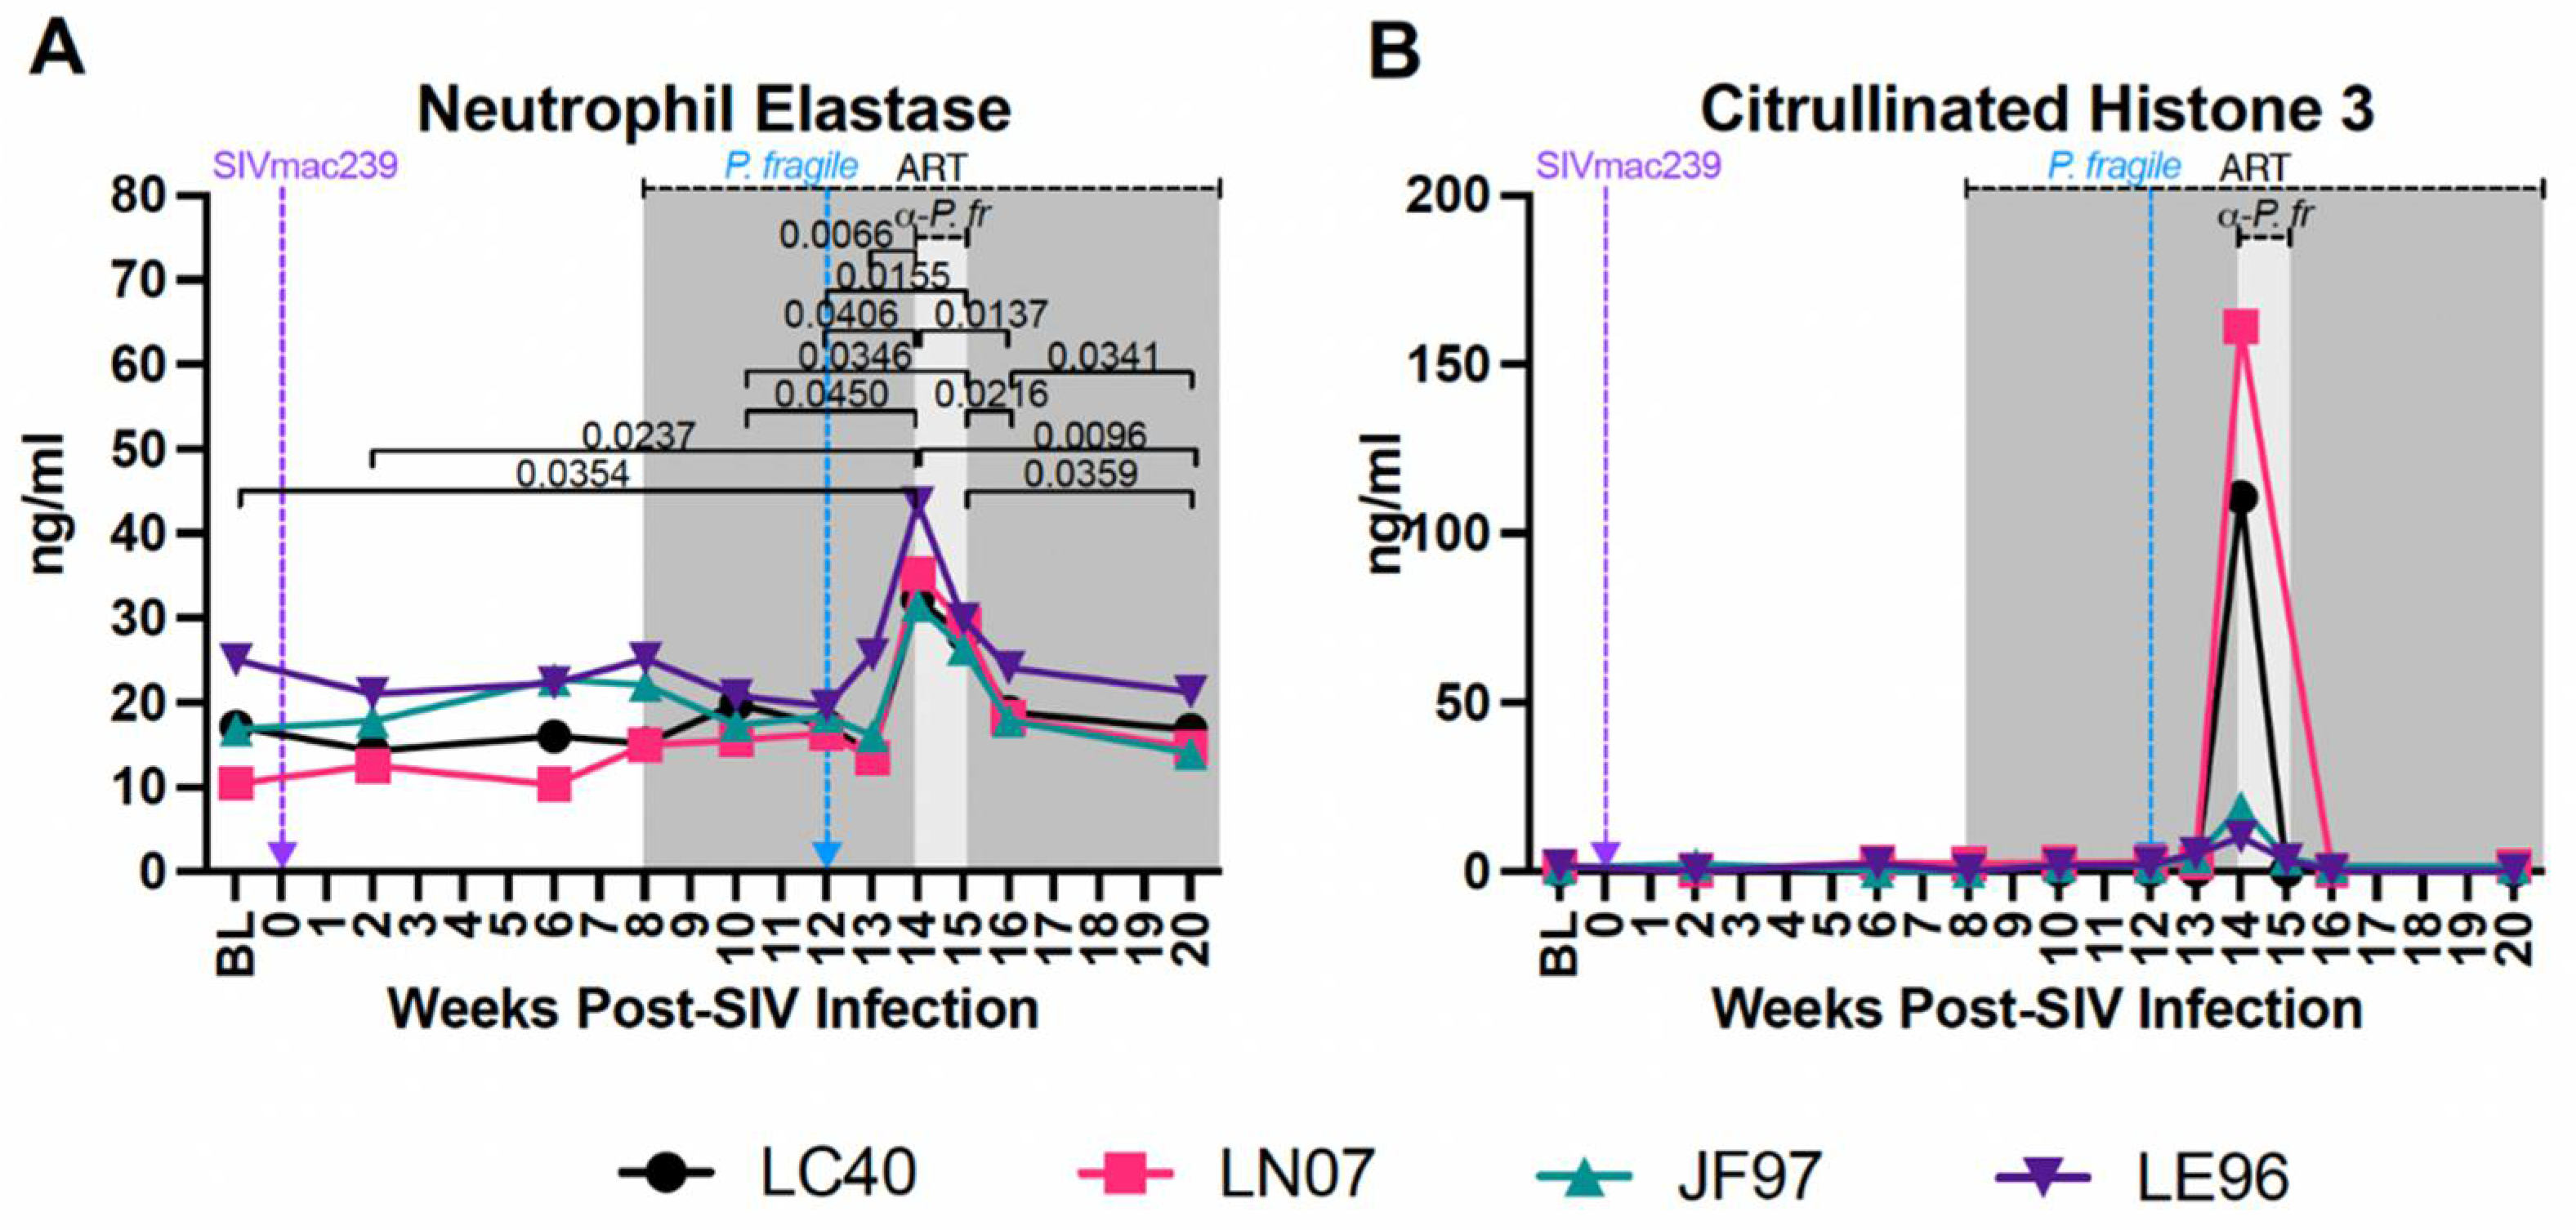
Increased Plasma Biomarker of NET Formation during ART-Treated SIV/P. Fragile co-Infection
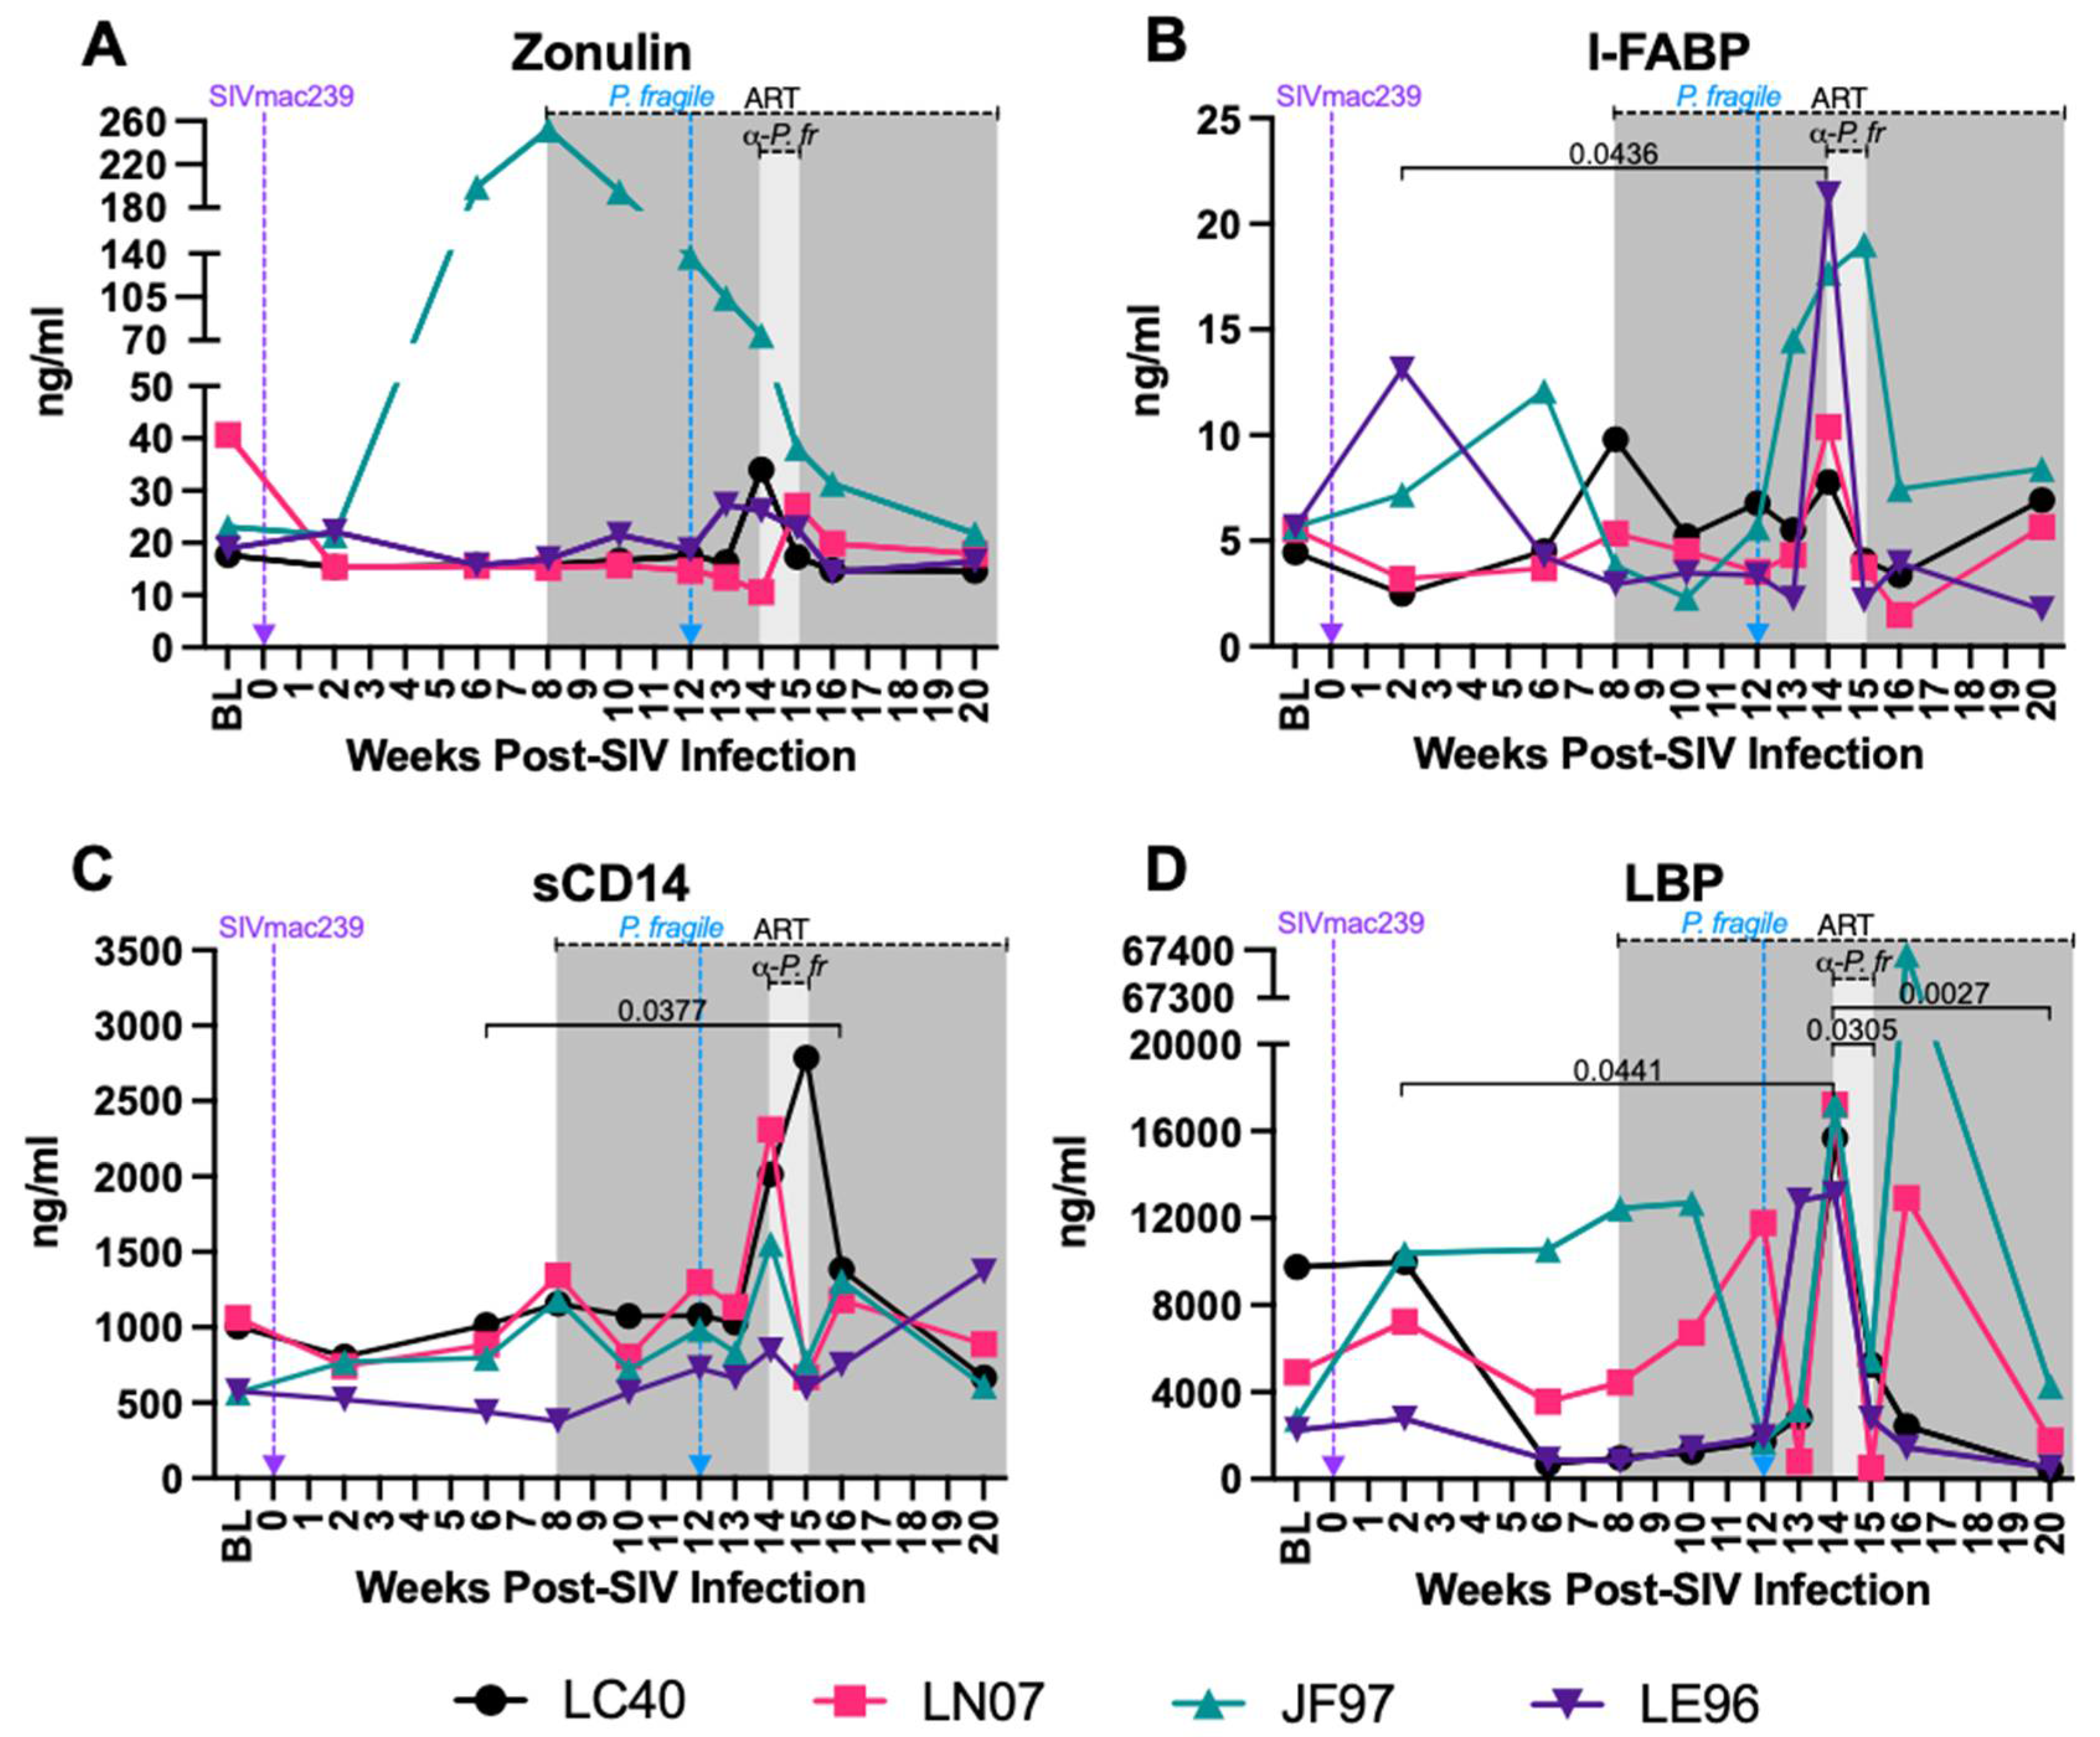
Increased Plasma Markers of Gut Permeability and Microbial Translocation during ART-Treated SIV/P. Fragile co-Infection
Discussion:
Supplementary Materials
Author Contributions
Data Availability
Acknowledgements
Conflict of Interest
References
- WHO. 2022. HIV data and statistics 2022, on World Health Organization. Accessed 11/5/23.
- WHO. 2023. World malaria report 2023, on World Health Organization. https://www.who.int/publications/i/item/9789240086173. Accessed 12/12/23.
- Tseng A, Seet J, Phillips EJ. 2015. The evolution of three decades of antiretroviral therapy: challenges, triumphs and the promise of the future. Br J Clin Pharmacol 79:182-94.
- Finzi D, Blankson J, Siliciano JD, Margolick JB, Chadwick K, Pierson T, Smith K, Lisziewicz J, Lori F, Flexner C, Quinn TC, Chaisson RE, Rosenberg E, Walker B, Gange S, Gallant J, Siliciano RF. 1999. Latent infection of CD4+ T cells provides a mechanism for lifelong persistence of HIV-1, even in patients on effective combination therapy. Nat Med 5:512-7.
- Holkmann Olsen C, Mocroft A, Kirk O, Vella S, Blaxhult A, Clumeck N, Fisher M, Katlama C, Phillips AN, Lundgren JD. 2007. Interruption of combination antiretroviral therapy and risk of clinical disease progression to AIDS or death. HIV Med 8:96-104.
- Menard D, Dondorp A. 2017. Antimalarial Drug Resistance: A Threat to Malaria Elimination. Cold Spring Harb Perspect Med 7.
- Balikagala B, Fukuda N, Ikeda M, Katuro OT, Tachibana SI, Yamauchi M, Opio W, Emoto S, Anywar DA, Kimura E, Palacpac NMQ, Odongo-Aginya EI, Ogwang M, Horii T, Mita T. 2021. Evidence of Artemisinin-Resistant Malaria in Africa. N Engl J Med 385:1163-1171.
- Mahittikorn A, Kotepui KU, De Jesus Milanez G, Masangkay FR, Kotepui M. 2021. A meta-analysis on the prevalence and characteristics of severe malaria in patients with Plasmodium spp. and HIV co-infection. Sci Rep 11:16655.
- Froebel K, Howard W, Schafer JR, Howie F, Whitworth J, Kaleebu P, Brown AL, Riley E. 2004. Activation by malaria antigens renders mononuclear cells susceptible to HIV infection and re-activates replication of endogenous HIV in cells from HIV-infected adults. Parasite Immunol 26:213-7.
- Hoffman IF, Jere CS, Taylor TE, Munthali P, Dyer JR, Wirima JJ, Rogerson SJ, Kumwenda N, Eron JJ, Fiscus SA, Chakraborty H, Taha TE, Cohen MS, Molyneux ME. 1999. The effect of Plasmodium falciparum malaria on HIV-1 RNA blood plasma concentration. Aids 13:487-94.
- Kublin JG, Patnaik P, Jere CS, Miller WC, Hoffman IF, Chimbiya N, Pendame R, Taylor TE, Molyneux ME. 2005. Effect of Plasmodium falciparum malaria on concentration of HIV-1-RNA in the blood of adults in rural Malawi: a prospective cohort study. Lancet 365:233-40.
- Abu-Raddad LJ, Patnaik P, Kublin JG. 2006. Dual infection with HIV and malaria fuels the spread of both diseases in sub-Saharan Africa. Science 314:1603-6.
- Cuadros DF, Branscum AJ, Crowley PH. 2011. HIV-malaria co-infection: effects of malaria on the prevalence of HIV in East sub-Saharan Africa. Int J Epidemiol 40:931-9.
- Quinn TC, Wawer MJ, Sewankambo N, Serwadda D, Li C, Wabwire-Mangen F, Meehan MO, Lutalo T, Gray RH. 2000. Viral load and heterosexual transmission of human immunodeficiency virus type 1. Rakai Project Study Group. N Engl J Med 342:921-9.
- Berg A, Patel S, Aukrust P, David C, Gonca M, Berg ES, Dalen I, Langeland N. 2014. Increased severity and mortality in adults co-infected with malaria and HIV in Maputo, Mozambique: a prospective cross-sectional study. PLoS One 9:e88257.
- Beyene HB, Tadesse M, Disassa H, Beyene MB. 2017. Concurrent Plasmodium infection, anemia and their correlates among newly diagnosed people living with HIV/AIDS in Northern Ethiopia. Acta Trop 169:8-13.
- Ojurongbe O, Oyeniran OA, Alli OA, Taiwo SS, Ojurongbe TA, Olowe AO, Opaleye OO, Adeyeba OA. 2014. Prevalence of Plasmodium falciparum Parasitaemia and Its Correlation with Haematological Parameters among HIV-Positive Individuals in Nigeria. J Trop Med 2014:161284.
- Tay SC, Badu K, Mensah AA, Gbedema SY. 2015. The prevalence of malaria among HIV seropositive individuals and the impact of the co- infection on their hemoglobin levels. Ann Clin Microbiol Antimicrob 14:10.
- Ludlow LE, Zhou J, Tippett E, Cheng WJ, Hasang W, Rogerson SJ, Jaworowski A. 2012. HIV-1 inhibits phagocytosis and inflammatory cytokine responses of human monocyte-derived macrophages to P. falciparum infected erythrocytes. PLoS One 7:e32102.
- Hochman SE, Madaline TF, Wassmer SC, Mbale E, Choi N, Seydel KB, Whitten RO, Varughese J, Grau GE, Kamiza S, Molyneux ME, Taylor TE, Lee S, Milner DA, Jr., Kim K. 2015. Fatal Pediatric Cerebral Malaria Is Associated with Intravascular Monocytes and Platelets That Are Increased with HIV Coinfection. mBio 6:e01390-15.
- Joice R, Frantzreb C, Pradham A, Seydel KB, Kamiza S, Wirth DF, Duraisingh MT, Molyneux ME, Taylor TE, Marti M, Milner DA, Jr. 2016. Evidence for spleen dysfunction in malaria-HIV co-infection in a subset of pediatric patients. Mod Pathol 29:381-90.
- Deeks SG, Tracy R, Douek DC. 2013. Systemic effects of inflammation on health during chronic HIV infection. Immunity 39:633-45.
- Popa GL, Popa MI. 2021. Recent Advances in Understanding the Inflammatory Response in Malaria: A Review of the Dual Role of Cytokines. J Immunol Res 2021:7785180.
- Lv T, Cao W, Li T. 2021. HIV-Related Immune Activation and Inflammation: Current Understanding and Strategies. J Immunol Res 2021:7316456.
- Dobbs KR, Crabtree JN, Dent AE. 2020. Innate immunity to malaria-The role of monocytes. Immunol Rev 293:8-24.
- Kwenti TE. 2018. Malaria and HIV coinfection in sub-Saharan Africa: prevalence, impact, and treatment strategies. Res Rep Trop Med 9:123-136.
- Nathan C. 2006. Neutrophils and immunity: challenges and opportunities. Nat Rev Immunol 6:173-82.
- Borregaard N, Cowland JB. 1997. Granules of the human neutrophilic polymorphonuclear leukocyte. Blood 89:3503-21.
- Brinkmann V, Reichard U, Goosmann C, Fauler B, Uhlemann Y, Weiss DS, Weinrauch Y, Zychlinsky A. 2004. Neutrophil extracellular traps kill bacteria. Science 303:1532-5.
- Häger M, Cowland JB, Borregaard N. 2010. Neutrophil granules in health and disease. J Intern Med 268:25-34.
- Schönrich G, Raftery MJ. 2016. Neutrophil Extracellular Traps Go Viral. Front Immunol 7:366.
- Burn GL, Foti A, Marsman G, Patel DF, Zychlinsky A. 2021. The Neutrophil. Immunity 54:1377-1391.
- Saitoh T, Komano J, Saitoh Y, Misawa T, Takahama M, Kozaki T, Uehata T, Iwasaki H, Omori H, Yamaoka S, Yamamoto N, Akira S. 2012. Neutrophil extracellular traps mediate a host defense response to human immunodeficiency virus-1. Cell Host Microbe 12:109-16.
- Bowers NL, Helton ES, Huijbregts RP, Goepfert PA, Heath SL, Hel Z. 2014. Immune suppression by neutrophils in HIV-1 infection: role of PD-L1/PD-1 pathway. PLoS Pathog 10:e1003993.
- Elbim C, Prevot MH, Bouscarat F, Franzini E, Chollet-Martin S, Hakim J, Gougerot-Pocidalo MA. 1994. Polymorphonuclear neutrophils from human immunodeficiency virus-infected patients show enhanced activation, diminished fMLP-induced L-selectin shedding, and an impaired oxidative burst after cytokine priming. Blood 84:2759-66.
- Ramsuran V, Kulkarni H, He W, Mlisana K, Wright EJ, Werner L, Castiblanco J, Dhanda R, Le T, Dolan MJ, Guan W, Weiss RA, Clark RA, Karim SS, Ahuja SK, Ndung'u T. 2011. Duffy-null-associated low neutrophil counts influence HIV-1 susceptibility in high-risk South African black women. Clin Infect Dis 52:1248-56.
- Hadad N, Levy R, Schlaeffer F, Riesenberg K. 2007. Direct effect of human immunodeficiency virus protease inhibitors on neutrophil function and apoptosis via calpain inhibition. Clin Vaccine Immunol 14:1515-21.
- Roilides E, Venzon D, Pizzo PA, Rubin M. 1990. Effects of antiretroviral dideoxynucleosides on polymorphonuclear leukocyte function. Antimicrob Agents Chemother 34:1672-7.
- Estes JD, Harris LD, Klatt NR, Tabb B, Pittaluga S, Paiardini M, Barclay GR, Smedley J, Pung R, Oliveira KM, Hirsch VM, Silvestri G, Douek DC, Miller CJ, Haase AT, Lifson J, Brenchley JM. 2010. Damaged intestinal epithelial integrity linked to microbial translocation in pathogenic simian immunodeficiency virus infections. PLoS Pathog 6:e1001052.
- Hensley-McBain T, Wu MC, Manuzak JA, Cheu RK, Gustin A, Driscoll CB, Zevin AS, Miller CJ, Coronado E, Smith E, Chang J, Gale M, Jr., Somsouk M, Burgener AD, Hunt PW, Hope TJ, Collier AC, Klatt NR. 2019. Increased mucosal neutrophil survival is associated with altered microbiota in HIV infection. PLoS Pathog 15:e1007672.
- Somsouk M, Estes JD, Deleage C, Dunham RM, Albright R, Inadomi JM, Martin JN, Deeks SG, McCune JM, Hunt PW. 2015. Gut epithelial barrier and systemic inflammation during chronic HIV infection. Aids 29:43-51.
- Hunt PW, Sinclair E, Rodriguez B, Shive C, Clagett B, Funderburg N, Robinson J, Huang Y, Epling L, Martin JN, Deeks SG, Meinert CL, Van Natta ML, Jabs DA, Lederman MM. 2014. Gut epithelial barrier dysfunction and innate immune activation predict mortality in treated HIV infection. J Infect Dis 210:1228-38.
- Klatt NR, Funderburg NT, Brenchley JM. 2013. Microbial translocation, immune activation, and HIV disease. Trends Microbiol 21:6-13.
- Sandler NG, Wand H, Roque A, Law M, Nason MC, Nixon DE, Pedersen C, Ruxrungtham K, Lewin SR, Emery S, Neaton JD, Brenchley JM, Deeks SG, Sereti I, Douek DC. 2011. Plasma levels of soluble CD14 independently predict mortality in HIV infection. J Infect Dis 203:780-90.
- Feng G, Wines BD, Kurtovic L, Chan JA, Boeuf P, Mollard V, Cozijnsen A, Drew DR, Center RJ, Marshall DL, Chishimba S, McFadden GI, Dent AE, Chelimo K, Boyle MJ, Kazura JW, Hogarth PM, Beeson JG. 2021. Mechanisms and targets of Fcγ-receptor mediated immunity to malaria sporozoites. Nat Commun 12:1742.
- Kumaratilake LM, Ferrante A. 2000. Opsonization and phagocytosis of Plasmodium falciparum merozoites measured by flow cytometry. Clin Diagn Lab Immunol 7:9-13.
- Sun T, Chakrabarti C. 1985. Schizonts, merozoites, and phagocytosis in falciparum malaria. Ann Clin Lab Sci 15:465-9.
- Tannous S, Ghanem E. 2018. A bite to fight: front-line innate immune defenses against malaria parasites. Pathog Glob Health 112:1-12.
- Baker VS, Imade GE, Molta NB, Tawde P, Pam SD, Obadofin MO, Sagay SA, Egah DZ, Iya D, Afolabi BB, Baker M, Ford K, Ford R, Roux KH, Keller TC, 3rd. 2008. Cytokine-associated neutrophil extracellular traps and antinuclear antibodies in Plasmodium falciparum infected children under six years of age. Malar J 7:41.
- Knackstedt SL, Georgiadou A, Apel F, Abu-Abed U, Moxon CA, Cunnington AJ, Raupach B, Cunningham D, Langhorne J, Krüger R, Barrera V, Harding SP, Berg A, Patel S, Otterdal K, Mordmüller B, Schwarzer E, Brinkmann V, Zychlinsky A, Amulic B. 2019. Neutrophil extracellular traps drive inflammatory pathogenesis in malaria. Sci Immunol 4.
- Rodrigues DAS, Prestes EB, Gama AMS, Silva LS, Pinheiro AAS, Ribeiro JMC, Campos RMP, Pimentel-Coelho PM, De Souza HS, Dicko A, Duffy PE, Fried M, Francischetti IMB, Saraiva EM, Paula-Neto HA, Bozza MT. 2020. CXCR4 and MIF are required for neutrophil extracellular trap release triggered by Plasmodium-infected erythrocytes. PLoS Pathog 16:e1008230.
- Kho S, Minigo G, Andries B, Leonardo L, Prayoga P, Poespoprodjo JR, Kenangalem E, Price RN, Woodberry T, Anstey NM, Yeo TW. 2019. Circulating Neutrophil Extracellular Traps and Neutrophil Activation Are Increased in Proportion to Disease Severity in Human Malaria. J Infect Dis 219:1994-2004.
- Lee HJ, Georgiadou A, Walther M, Nwakanma D, Stewart LB, Levin M, Otto TD, Conway DJ, Coin LJ, Cunnington AJ. 2018. Integrated pathogen load and dual transcriptome analysis of systemic host-pathogen interactions in severe malaria. Sci Transl Med 10.
- Gardner MB CM, Luciw PA.. 2004. AIDS and other manifestations of HIV infection, 4th ed ed. Raven Press, New York.
- Coatney GR CW, Contacos PG. 1971. The primate malarias. US National Institute of Allergy and Infectious Diseases, Washington DC.
- Trott KA, Chau JY, Hudgens MG, Fine J, Mfalila CK, Tarara RP, Collins WE, Sullivan J, Luckhart S, Abel K. 2011. Evidence for an increased risk of transmission of simian immunodeficiency virus and malaria in a rhesus macaque coinfection model. J Virol 85:11655-63.
- Trott KA, Richardson A, Hudgens MA, Abel K. 2013. Immune activation and regulation in simian immunodeficiency virus-Plasmodium fragile-coinfected rhesus macaques. J Virol 87:9523-37.
- Loffredo JT, Maxwell J, Qi Y, Glidden CE, Borchardt GJ, Soma T, Bean AT, Beal DR, Wilson NA, Rehrauer WM, Lifson JD, Carrington M, Watkins DI. 2007. Mamu-B*08-positive macaques control simian immunodeficiency virus replication. J Virol 81:8827-32.
- Mothé BR, Weinfurter J, Wang C, Rehrauer W, Wilson N, Allen TM, Allison DB, Watkins DI. 2003. Expression of the major histocompatibility complex class I molecule Mamu-A*01 is associated with control of simian immunodeficiency virus SIVmac239 replication. J Virol 77:2736-40.
- Yant LJ, Friedrich TC, Johnson RC, May GE, Maness NJ, Enz AM, Lifson JD, O'Connor DH, Carrington M, Watkins DI. 2006. The high-frequency major histocompatibility complex class I allele Mamu-B*17 is associated with control of simian immunodeficiency virus SIVmac239 replication. J Virol 80:5074-7.
- Del Prete GQ, Scarlotta M, Newman L, Reid C, Parodi LM, Roser JD, Oswald K, Marx PA, Miller CJ, Desrosiers RC, Barouch DH, Pal R, Piatak M, Jr., Chertova E, Giavedoni LD, O'Connor DH, Lifson JD, Keele BF. 2013. Comparative characterization of transfection- and infection-derived simian immunodeficiency virus challenge stocks for in vivo nonhuman primate studies. J Virol 87:4584-95.
- Monjure CJ, Tatum CD, Panganiban AT, Arainga M, Traina-Dorge V, Marx PA, Jr., Didier ES. 2014. Optimization of PCR for quantification of simian immunodeficiency virus genomic RNA in plasma of rhesus macaques (Macaca mulatta) using armored RNA. J Med Primatol 43:31-43.
- Del Prete GQ, Smedley J, Macallister R, Jones GS, Li B, Hattersley J, Zheng J, Piatak M, Jr., Keele BF, Hesselgesser J, Geleziunas R, Lifson JD. 2016. Short Communication: Comparative Evaluation of Coformulated Injectable Combination Antiretroviral Therapy Regimens in Simian Immunodeficiency Virus-Infected Rhesus Macaques. AIDS Res Hum Retroviruses 32:163-8.
- Collins WE, Warren M, Sullivan JS, Galland GG, Strobert E, Nace D, Williams A, Williams T, Barnwell JW. 2006. Studies on sporozoite-induced and chronic infections with Plasmodium fragile in Macaca mulatta and New World monkeys. J Parasitol 92:1019-26.
- Dissanaike A, Nelson P, Garnham P. 1965. Two new malaria parasites plasmodium cynomolgi ceylonensis subsp. nov. and plasmodium fragile sp. nov. from monkeys in Ceylon.
- Moll K KA, Scherf A, Wahlgren M. 2013. Methods in Malaria Researcb, 6th ed ed. EviMalaR, Glasgow, UK & Manassas VA, USA.
- Karsten CB, Mehta N, Shin SA, Diefenbach TJ, Slein MD, Karpinski W, Irvine EB, Broge T, Suscovich TJ, Alter G. 2019. A versatile high-throughput assay to characterize antibody-mediated neutrophil phagocytosis. J Immunol Methods 471:46-56.
- Butcher SK, Chahal H, Nayak L, Sinclair A, Henriquez NV, Sapey E, O'Mahony D, Lord JM. 2001. Senescence in innate immune responses: reduced neutrophil phagocytic capacity and CD16 expression in elderly humans. J Leukoc Biol 70:881-6.
- Christensen R. 2013. Plane Answers to Complex Questions, 4 ed. Springer New York, NY, New York, New York.
- Trampuz A, Jereb M, Muzlovic I, Prabhu RM. 2003. Clinical review: Severe malaria. Crit Care 7:315-23.
- White NJ. 2018. Anaemia and malaria. Malar J 17:371.
- Schacker TW, Hughes JP, Shea T, Coombs RW, Corey L. 1998. Biological and virologic characteristics of primary HIV infection. Ann Intern Med 128:613-20.
- Brenchley JM, Paiardini M. 2011. Immunodeficiency lentiviral infections in natural and non-natural hosts. Blood 118:847-54.
- Estes JD, Wong SW, Brenchley JM. 2018. Nonhuman primate models of human viral infections. Nat Rev Immunol 18:390-404.
- Silvestri G. 2008. AIDS pathogenesis: a tale of two monkeys. J Med Primatol 37 Suppl 2:6-12.
- Okoye AA, Picker LJ. 2013. CD4(+) T-cell depletion in HIV infection: mechanisms of immunological failure. Immunol Rev 254:54-64.
- Lau B, Sharrett AR, Kingsley LA, Post W, Palella FJ, Visscher B, Gange SJ. 2006. C-reactive protein is a marker for human immunodeficiency virus disease progression. Arch Intern Med 166:64-70.
- Mabhida SE, McHiza ZJ, Mokgalaboni K, Hanser S, Choshi J, Mokoena H, Ziqubu K, Masilela C, Nkambule BB, Ndwandwe DE, Kengne AP, Dludla PV. 2024. High-sensitivity C-reactive protein among people living with HIV on highly active antiretroviral therapy: a systemic review and meta-analysis. BMC Infect Dis 24:160.
- Redd AD, Eaton KP, Kong X, Laeyendecker O, Lutalo T, Wawer MJ, Gray RH, Serwadda D, Quinn TC. 2010. C-reactive protein levels increase during HIV-1 disease progression in Rakai, Uganda, despite the absence of microbial translocation. J Acquir Immune Defic Syndr 54:556-9.
- Shivakoti R, Yang WT, Berendes S, Mwelase N, Kanyama C, Pillay S, Samaneka W, Santos B, Poongulali S, Tripathy S, Riviere C, Lama JR, Cardoso SW, Sugandhavesa P, Balagopal A, Gupte N, Semba RD, Campbell TB, Bollinger RC, Gupta A. 2016. Persistently Elevated C-Reactive Protein Level in the First Year of Antiretroviral Therapy, Despite Virologic Suppression, Is Associated With HIV Disease Progression in Resource-Constrained Settings. J Infect Dis 213:1074-8.
- Hashmi F, Aqeel S, Zuberi UF, Khan W. 2023. A systematic review and meta-analysis of inflammatory biomarkers associated with malaria infection and disease severity. Cytokine 169:156305.
- Wilairatana P, Mahannop P, Tussato T, Hayeedoloh IM, Boonhok R, Klangbud WK, Mala W, Kotepui KU, Kotepui M. 2021. C-reactive protein as an early biomarker for malaria infection and monitoring of malaria severity: a meta-analysis. Sci Rep 11:22033.
- Breen EC. 2002. Pro- and anti-inflammatory cytokines in human immunodeficiency virus infection and acquired immunodeficiency syndrome. Pharmacol Ther 95:295-304.
- Hensley-McBain T, Klatt NR. 2018. The Dual Role of Neutrophils in HIV Infection. Curr HIV/AIDS Rep 15:1-10.
- Jones R, Manickam C, Ram DR, Kroll K, Hueber B, Woolley G, Shah SV, Smith S, Varner V, Reeves RK. 2021. Systemic and mucosal mobilization of granulocyte subsets during lentiviral infection. Immunology 164:348-357.
- Lin A, Liang F, Thompson EA, Vono M, Ols S, Lindgren G, Hassett K, Salter H, Ciaramella G, Loré K. 2018. Rhesus Macaque Myeloid-Derived Suppressor Cells Demonstrate T Cell Inhibitory Functions and Are Transiently Increased after Vaccination. J Immunol 200:286-294.
- Rogers KA, Scinicariello F, Attanasio R. 2006. IgG Fc receptor III homologues in nonhuman primate species: genetic characterization and ligand interactions. J Immunol 177:3848-56.
- Musich T, Rahman MA, Mohanram V, Miller-Novak L, Demberg T, Venzon DJ, Felber BK, Franchini G, Pavlakis GN, Robert-Guroff M. 2018. Neutrophil Vaccination Dynamics and Their Capacity To Mediate B Cell Help in Rhesus Macaques. J Immunol 201:2287-2302.
- Vono M, Lin A, Norrby-Teglund A, Koup RA, Liang F, Loré K. 2017. Neutrophils acquire the capacity for antigen presentation to memory CD4(+) T cells in vitro and ex vivo. Blood 129:1991-2001.
- Hensley-McBain T, Berard AR, Manuzak JA, Miller CJ, Zevin AS, Polacino P, Gile J, Agricola B, Cameron M, Hu SL, Estes JD, Reeves RK, Smedley J, Keele BF, Burgener AD, Klatt NR. 2018. Intestinal damage precedes mucosal immune dysfunction in SIV infection. Mucosal Immunol 11:1429-1440.
- Korkmaz B, Horwitz MS, Jenne DE, Gauthier F. 2010. Neutrophil elastase, proteinase 3, and cathepsin G as therapeutic targets in human diseases. Pharmacol Rev 62:726-59.
- Segal AW. 2005. How neutrophils kill microbes. Annu Rev Immunol 23:197-223.
- Klebanoff SJ, Coombs RW. 1992. Viricidal effect of polymorphonuclear leukocytes on human immunodeficiency virus-1. Role of the myeloperoxidase system. J Clin Invest 89:2014-7.
- Remijsen Q, Kuijpers TW, Wirawan E, Lippens S, Vandenabeele P, Vanden Berghe T. 2011. Dying for a cause: NETosis, mechanisms behind an antimicrobial cell death modality. Cell Death Differ 18:581-8.
- Wilairatana P, Meddings JB, Ho M, Vannaphan S, Looareesuwan S. 1997. Increased gastrointestinal permeability in patients with Plasmodium falciparum malaria. Clin Infect Dis 24:430-5.
- Tripathi A, Lammers KM, Goldblum S, Shea-Donohue T, Netzel-Arnett S, Buzza MS, Antalis TM, Vogel SN, Zhao A, Yang S, Arrietta MC, Meddings JB, Fasano A. 2009. Identification of human zonulin, a physiological modulator of tight junctions, as prehaptoglobin-2. Proc Natl Acad Sci U S A 106:16799-804.
- Kanda T, Fujii H, Tani T, Murakami H, Suda T, Sakai Y, Ono T, Hatakeyama K. 1996. Intestinal fatty acid-binding protein is a useful diagnostic marker for mesenteric infarction in humans. Gastroenterology 110:339-43.
- Pelsers MM, Hermens WT, Glatz JF. 2005. Fatty acid-binding proteins as plasma markers of tissue injury. Clin Chim Acta 352:15-35.
- Brenchley JM, Douek DC. 2012. Microbial translocation across the GI tract. Annu Rev Immunol 30:149-73.
- Ariyoshi K, Schim van der Loeff M, Berry N, Jaffar S, Whittle H. 1999. Plasma HIV viral load in relation to season and to Plasmodium falciparum parasitaemia. Aids 13:1145-6.
- Pisell TL, Hoffman IF, Jere CS, Ballard SB, Molyneux ME, Butera ST, Lawn SD. 2002. Immune activation and induction of HIV-1 replication within CD14 macrophages during acute Plasmodium falciparum malaria coinfection. Aids 16:1503-9.
- Xiao L, Owen SM, Rudolph DL, Lal RB, Lal AA. 1998. Plasmodium falciparum antigen-induced human immunodeficiency virus type 1 replication is mediated through induction of tumor necrosis factor-alpha. J Infect Dis 177:437-45.
- Sharma G, Kaur G, Mehra N. 2011. Genetic correlates influencing immunopathogenesis of HIV infection. Indian J Med Res 134:749-68.
- Albrecht C, Malzahn D, Brameier M, Hermes M, Ansari AA, Walter L. 2014. Progression to AIDS in SIV-Infected Rhesus Macaques is Associated with Distinct KIR and MHC class I Polymorphisms and NK Cell Dysfunction. Front Immunol 5:600.
- Evans DT, Jing P, Allen TM, O'Connor DH, Horton H, Venham JE, Piekarczyk M, Dzuris J, Dykhuzen M, Mitchen J, Rudersdorf RA, Pauza CD, Sette A, Bontrop RE, DeMars R, Watkins DI. 2000. Definition of five new simian immunodeficiency virus cytotoxic T-lymphocyte epitopes and their restricting major histocompatibility complex class I molecules: evidence for an influence on disease progression. J Virol 74:7400-10.
- Liverpool Uo. HIV Drug Interactions, on University of Liverpool. https://www.hiv-druginteractions.org/checker. Accessed November 6th, 2023.
- Aitken EH, Alemu A, Rogerson SJ. 2018. Neutrophils and Malaria. Front Immunol 9:3005.
- Babatunde KA, Adenuga OF. 2022. Neutrophils in malaria: A double-edged sword role. Front Immunol 13:922377.
- Gabali AM, Anzinger JJ, Spear GT, Thomas LL. 2004. Activation by inflammatory stimuli increases neutrophil binding of human immunodeficiency virus type 1 and subsequent infection of lymphocytes. J Virol 78:10833-6.
- Massanella M, Fromentin R, Chomont N. 2016. Residual inflammation and viral reservoirs: alliance against an HIV cure. Curr Opin HIV AIDS 11:234-41.
- Mazzuti L, Turriziani O, Mezzaroma I. 2023. The Many Faces of Immune Activation in HIV-1 Infection: A Multifactorial Interconnection. Biomedicines 11.
- Yoshimura T, Takahashi M. 2007. IFN-gamma-mediated survival enables human neutrophils to produce MCP-1/CCL2 in response to activation by TLR ligands. J Immunol 179:1942-9.
- Hofbauer TM, Ondracek AS, Mangold A, Scherz T, Nechvile J, Seidl V, Brostjan C, Lang IM. 2020. Neutrophil Extracellular Traps Induce MCP-1 at the Culprit Site in ST-Segment Elevation Myocardial Infarction. Front Cell Dev Biol 8:564169.
- Cahilog Z, Zhao H, Wu L, Alam A, Eguchi S, Weng H, Ma D. 2020. The Role of Neutrophil NETosis in Organ Injury: Novel Inflammatory Cell Death Mechanisms. Inflammation 43:2021-2032.
- Branzk N, Lubojemska A, Hardison SE, Wang Q, Gutierrez MG, Brown GD, Papayannopoulos V. 2014. Neutrophils sense microbe size and selectively release neutrophil extracellular traps in response to large pathogens. Nat Immunol 15:1017-25.
- Ataíde R, Mwapasa V, Molyneux ME, Meshnick SR, Rogerson SJ. 2011. Antibodies that induce phagocytosis of malaria infected erythrocytes: effect of HIV infection and correlation with clinical outcomes. PLoS One 6:e22491.
- Serghides L, Finney CA, Ayi K, Loutfy M, Kain KC. 2015. Chronic HIV infection impairs nonopsonic phagocytosis of malaria parasites. J Acquir Immune Defic Syndr 68:128-32.
- Donnelly E, de Water JV, Luckhart S. 2021. Malaria-induced bacteremia as a consequence of multiple parasite survival strategies. Curr Res Microb Sci 2:100036.
- Olsson RA, Johnston EH. 1969. Histopathologic changes and small-bowel absorption in falciparum malaria. Am J Trop Med Hyg 18:355-9.
- Boone BA, Murthy P, Miller-Ocuin J, Doerfler WR, Ellis JT, Liang X, Ross MA, Wallace CT, Sperry JL, Lotze MT, Neal MD, Zeh HJ, 3rd. 2018. Chloroquine reduces hypercoagulability in pancreatic cancer through inhibition of neutrophil extracellular traps. BMC Cancer 18:678.
- Boone BA, Orlichenko L, Schapiro NE, Loughran P, Gianfrate GC, Ellis JT, Singhi AD, Kang R, Tang D, Lotze MT, Zeh HJ. 2015. The receptor for advanced glycation end products (RAGE) enhances autophagy and neutrophil extracellular traps in pancreatic cancer. Cancer Gene Ther 22:326-34.
- Labro MT, Babin-Chevaye C. 1988. Effects of amodiaquine, chloroquine, and mefloquine on human polymorphonuclear neutrophil function in vitro. Antimicrob Agents Chemother 32:1124-30.
- Murthy P, Singhi AD, Ross MA, Loughran P, Paragomi P, Papachristou GI, Whitcomb DC, Zureikat AH, Lotze MT, Zeh Iii HJ, Boone BA. 2019. Enhanced Neutrophil Extracellular Trap Formation in Acute Pancreatitis Contributes to Disease Severity and Is Reduced by Chloroquine. Front Immunol 10:28.
- Liles NW, Page EE, Liles AL, Vesely SK, Raskob GE, George JN. 2016. Diversity and severity of adverse reactions to quinine: A systematic review. Am J Hematol 91:461-6.
- van Wolfswinkel ME, Langenberg MCC, Wammes LJ, Sauerwein RW, Koelewijn R, Hermsen CC, van Hellemond JJ, van Genderen PJ. 2017. Changes in total and differential leukocyte counts during the clinically silent liver phase in a controlled human malaria infection in malaria-naïve Dutch volunteers. Malar J 16:457.
- Broyles LN, Luo R, Boeras D, Vojnov L. 2023. The risk of sexual transmission of HIV in individuals with low-level HIV viraemia: a systematic review. Lancet 402:464-471.
Disclaimer/Publisher’s Note: The statements, opinions and data contained in all publications are solely those of the individual author(s) and contributor(s) and not of MDPI and/or the editor(s). MDPI and/or the editor(s) disclaim responsibility for any injury to people or property resulting from any ideas, methods, instructions or products referred to in the content. |
© 2024 by the authors. Licensee MDPI, Basel, Switzerland. This article is an open access article distributed under the terms and conditions of the Creative Commons Attribution (CC BY) license (http://creativecommons.org/licenses/by/4.0/).


