Preprint
Article

Screening and Industry of Bacterial L-glutaminase as an Anticancer Agent from Different Soil Environments in Egypt

Altmetrics

Downloads

144

Views

84

Comments

0

This version is not peer-reviewed

Submitted:

15 May 2024

Posted:

16 May 2024

You are already at the latest version

Alerts
Abstract
Background: Breast cancer and other neoplasms like acute lymphocytic leukemia pose a serious threat to public health worldwide. Treatment for malignancies including acute lymphocytic leukemia and breast cancer requires enzymes that break down L-glutamine. An amidohydrolase called L-glutaminase can be an effective chemotherapeutic tool for treating various cancers. Methods: On mineral L-glutamine agar selective medium (MGA), a few bacterial isolates were examined in the current investigation to see if they produced L-glutaminase. However, the most effective positive bacterial isolates generating L-glutaminase were identified using morphological and biochemical testing. Molecular detection using the direct Southern blotting approach was also used to determine the main positive isolate that produces L-glutaminase. L-glutaminase synthesis by bacteria was evaluated for its characteristics. Using an MTT test, the anticancer activity was evaluated. Results: exclusive bacterial isolates that used L-glutamine as their sole source of metabolic nitrogen exhibited favorable growth on MGA. PH 7.4 and a temperature of 37 0C were the ideal environmental and physiological conditions for developing positive bacterial isolates. From the soil samples taken from various soil conditions in Egypt, the morphological and biochemical analyses showed that Bacillus cereus 14579 was the main positive bacterial generating L-glutaminase isolate. At a pH of 7.4 and a temperature of 37 °C, the following activators—KCL, ZnSO4, FeSO4, K2HPO4, and MgSO4—provided the high-grade circumstances for characterizing L-glutaminase synthesis. Bacillus cereus-produced L-glutaminase has shown excellent bioavailability and effectiveness as an anticancer therapy. The yield [productivity] was 5.2 U/ml during the original manufacture from MGA, but it increased to 42.96 U/ ml by bacterial recombinant DNA manufacturing. The molecular mass of L-glutaminase was roughly 37 KDa. L-glutaminase was purified, yielding final enzyme recovery of 55 1.23%, total activity 12,990± 19.76 ( U), specific activity 384.66± 8.92( U/ mg of protein), and purification fold 2± 2.99. Furthermore, the L-glutaminase activity was raised by 19%, 23%, 15%, and 9%, respectively, by the enzymatic activators Mn2+, K+, Na+, and Fe3+. It demonstrated strong DPPH scavenging activity (IC50 = 61 μg/ mL) and anticancer activity( IC50 = 40.72, 9.7, 7.39, 20.61, 51.28, and 11.55 μg/ mL, respectively) against human liver (HepG-2), colon ( HCT-116), breast ( MCF-7), lung( A-549), lymphocytic( CCL-120), and cervical( Hela) cancer cell lines. A stronger affinity for its substrate was shown by the kinetic parameters of Km and Vmax, which were 13.2 10-5 M and 119.86 μmol/ ml/ min, respectively. Conclusion: Acute lymphocytic leukemia and breast cancer are examples of auxotrophic malignancies for which L-glutamine serves as the only metabolic source, and L-glutaminase generated by Bacillus cereus was an appropriate enzyme in the therapy of these diseases.
Keywords: 
Subject: Medicine and Pharmacology  -   Medicine and Pharmacology

Introduction

Major causes of death globally include acute lymphocytic leukemia and breast cancer, which are auxotrophic cancer cells for L-glutamine [1].
Bacterial sources of L-glutaminase are efficient and cost-effective agents in the treatment of cancer, the food industry, and the production of high-value compounds like threonine [2]. Leukemic and breast cancer cells are examples of auxotrophic cancer cells that are unable to produce the amino acid L-glutamine, which is crucial for their survival and expansion. L-glutaminase is an amide that plays a crucial supporting function in cancer cells’ cellular nitrogen metabolism. L-glutaminase is a flavor and fragrance enhancer used in the food industry. The use of L-glutaminase in biosensors to monitor L-glutamine levels in mammalian and hybridoma cell cultures without the need for separate measurements of L-glutamic acid is another significant use [3].
Normal cells may, however, synthesize it [4]. It is highly beneficial to deprive these cancer cells of L-glutamine using bacterial L-glutaminase [5]. The physiological significance of L-glutamine for cancer cell biology: L-glutamine is not needed for normal cells since they can synthesize it [6], but it is necessary for cancer cells as a source of nitrogen for their metabolism [7].
L-glutaminase, an enzyme from the hydro-lase family, breaks down the amino acid L-glutamine, releasing ammonia and L-glutamate in the process [8]. L-glutaminase is an amidohydrolase that can be an effective chemotherapeutic tool for treating a variety of cancers [9]. Different microbial sources of L-glutaminase have drawn a lot of interest in a variety of biological processes. Alcaligenes faecalis L-glutaminase’s anti-tumor activity against the HeLa cell line [10] and Bacillus cereus MTCC 1305’s anti-tumor activity against the hepatocellular carcinoma (Hep-G2) cell line have both been shown [11]. L-glutaminase from Pseudomonas 7A inhibits the translation of mRNA and suppresses viral replication, exhibiting antiviral efficacy against retroviral illness [12]. L-glutaminase from Bacillus amyloliquefaciens was further utilized in food as a flavor enhancer [13]. While the Bacillus cereus LC13 enzyme demonstrated antioxidant activity when combined with ascorbic acid [14].
The colorectal cancer cells’ rapid growth indicates that they have greater nutritional needs. The provision of certain nutrients, including amino acids, that the tumor cells require from normal cells is what drives their growth. Without exogenous L-glutamine, glutamine-dependent tumor cells cannot survive [15].
Immobilized-metal affinity chromatography, or IMAC, is the technique used to purify recombinant proteins attached to short peptide affinity tags. IMAC relies on interactions between a large number of electron donors on an affinity tag attached to a transition metal ion (Co2+, Ni2+, Cu2+, or Zn2+) chelated to a solid-phase support. Both denaturing and non-denaturing conditions can be used for IMAC. Most frequently, 6-His is used as the affinity tag, and the tag’s electron donor is the histidine imidazole ring.
The N- or C-terminus of the target usually has 6–12 polyhistidine residues added as affinity tags. A recent affinity tag was built using a natural peptide produced from the N-terminus of chicken lactate dehydrogenase.
Six histidine residues may be found throughout the 19-residue polypeptide (KDHLI HNVHK EEHAH AHNK) that makes up the HAT tag. Compared to polyhistidine tags, it has a reduced net charge and only binds to Co2+-carboxymethylaspartate. The most popular metal chelators are imidodiacetic acid (IDA), aspartic acid carboxymethylated (marketed under the name TALON), and nitrilotriacetic acid (NTA). The chelator is frequently covalently bonded to polymer beads or ferromagnetic beads to isolate magnetic fields. Proteins with IMAC tags are generally adsorbed at neutral to slightly basic pH levels to avoid protonation of the histidine imidazole groups. Under moderate elution circumstances, a weak chelator, such as ethylene diamine tetraacetic acid (EDTA), as well as proteolytic elution, can be utilized to remove the metal ion. Low pH may occasionally cause the target protein to become denatured, but it will still elute. For target proteins having a metal core, IMAC is not indicated since the metal can be removed by the binding partner chelators.
The Arg-tag, a different brief polyamino acid affinity tag, is employed to raise the fusion protein’s isoelectric point and enhance its capacity to bind to a cation-exchange matrix. Mild elution conditions are typically characterized by an alkaline pH gradient of NaCl. This tag’s ability to cling to flat mica sheets may lead to a variety of brand-new applications [16]. Due to microbial enzymes’ lower cost of production, controllable nature, and dependability, attempts have been made to replace classical enzymes like L-glutaminase that were isolated from plant and animal tissues [17]. The current work sought to identify and produce bacterial L-glutaminase from various soil environments in Egypt as an anticancer drug against auxotrophic cancer cells, including leukemia and breast malignancies.

Material and Methods

Place and Date of the Study

This study was carried out in Egypt by Cairo University’s pharmacy department between November 2021 and May 2023.

Collection of the Samples

100 soil samples with a depth of 10 cm were collected from various sites in Egypt (Menofia, Sharqia, Qalyobia, Giza, and Cairo governorates). The soil samples were gathered in sterile plastic bags. The samples were grassland soil taken at a 0-10 cm depth, collected from different sites, and chosen at random. The samples were deposited in sterile containers and kept at 4 0C until processed.

Material Source

The chemical and biological components were purchased from the Egyptian Algomhuria Pharmaceutical Chemical Company. Cell lines were purchased from the Accegen biological company.

Identification and Isolation Media

A selective medium called mineral glutamine agar (MGA) was used to isolate and characterize bacteria with the capacity to utilize L-glutamine as their sole source of nitrogen. The following components (in g/L) made up this medium:
Table 1. It indicates to Ingredients of Mineral Glutamine Agar.
Ingredient Unit of measurement
Potassium chloride 0.5 mg
Magensium sulfate 0.5 mg
KH2PO4 1.0 g
Ferrous sulfate 0.1 g
Zinc sulfate 0.1 g
L.glutamine 2.5 g
agar 2%
After being combined, the materials were dissolved in hot water and repeatedly stirred until entirely dissolved. The medium was then cooled in a water bath to 47–50 0C, with a PH of 7.3 at a temperature of 37 0C. The plates were immediately poured into dishes with a 90 mm diameter once the ingredients had been mixed, up to a level of 15-20 ml. All substances were purchased from the Cairo, Egypt-based Algomhuria Company for Chemicals.

Blood Agar Medium [BAM]

To identify the L-glutaminase-producing bacterial species together with the gram stain, the biochemical responses, and the colony shape, an enrichment medium was used for the identification of beta-hemolysis of the positive isolates cultivated on MGA.

Composition of Blood Agar

The ingredients were combined then 5% sheep blood was added after autoclave at 1210C for 15 minutes and before pouring onto the plates.
Table 2. It indicates to a list of ingredients of blood agar:1.
ingredient Unit of measurement
peptone 10.0 g/ L
tryptose 10.0 g/ L
Sodium chloride 5.0 g/ L
Agar 15.0g/ L
Distilled water 960 ml

Equipment

Table 3. List of instruments.
Instrument Model and manufacturer
Autoclaves Tomy, japan
Aerobic incubator Sanyo, Japan
Digital balance Mettler Toledo, Switzerland
Oven Binder, Germany
Deep freezer -70 0C Artiko
Refrigator 5 whirpool
PH meter electrode Mettler-toledo, UK
Deep freezer -20 0C whirlpool
Gyratory shaker Corning gyratory shaker, Japan
190-1100nm Ultraviolet visible spectrophotometer UV1600PC, China
Light(optical) microscope Amscope 120X-1200X, China

Methods

The type of the study: Screening experimental study.
Isolation of L-glutaminase producing strains under drastic conditions:
In 250 ml Erlenmeyer flasks, one gram of each soil sample was suspended in 99 ml of sterile distilled water and shaken at 4000 RPM for two minutes in a gyratory shaker. The mineral glutamine agar (MGA) medium, which contains 0.5 g KCl, 0.5 g Mgso4, 1 g KH2po4, 0.1 g Feso4, 0.1 g Znso4, 2.5 g L-glutamine, and 2% agar, was used to plate the soil suspensions after they had been serially diluted in sterile distilled water. A 7.3–7.4 PH adjustment was made to the medium at a temperature of 37.0 °C. 48 hours were spent incubating the plates at 370C.
The MGA medium could only support the growth of bacteria that could use L-glutamine as their only supply of carbon and nitrogen. Colonies that demonstrated growth underwent two rounds of purification using the streak plate technique before being placed on nutrient agar slants and maintained at 4°C. Sub-culturing of positive isolated colonies on sheep blood agar was performed to detect whether or not beta-hemolysis had occurred. The selected isolate was routinely sub-cultured every 4 weeks, and the slant culture was maintained in the refrigerator.

Inoculum Preparation

The investigated bacterial strain’s inoculum was generated in 250 mL Erlenmeyer flasks containing 50 mL of nutrient broth liquid at PH 7. After autoclave the medium, it was infected with a loopful of culture from a 24-hour-old nutritional agar slant. The inoculated flasks were shaken for 24 hours at 150 rpm and utilized as the inoculum.

a. Identification of L-Glutaminase Producing Strains

Gram Stain

It classified bacteria into two categories based on the makeup of their cell walls. The bacterial cells became purple after being treated with a solution of crystal violet and subsequently iodine on a microscope slide. When colored cells were treated with a solvent such as alcohol or acetone, gram-positive organisms kept the stain whereas gram-negative organisms lost the stain and turned colorless. With the addition of the counter-stain safranin, the clear, gram-negative bacteria became pink.

Spore Shape

Gram staining was used to identify the morphology of the spores.

Spore Site

During the Gram stain test, the spore location was established.

Cell Shape

During the Gram stain test, the cell shape was assessed.

Blood Haemolysis

On blood agar media, the microorganism’s capacity to haemolyze the blood was tested.

Motility Test under the Microscope

It discriminated between motile bacteria and nonmotile bacteria.
A sterile needle was used to penetrate the medium to within 1 cm of the tube’s bottom to select a well-isolated colony and test for motility. The needle was certainly retained in the same position as it was inserted and removed from the medium. It took 18 hours of incubation at 35°C, or until noticeable growth appeared.

Biochemical Reactions

Lecithinase Test

The differentiated and enriched media known as egg yolk agar is used to isolate and suppose the differentiation of numerous species depending on their lecithinase activity. Lecithin is a common component in egg yolks. In egg yolk agar, lecithovitellin, a lipoprotein component, may be broken down by the enzyme lecithinase into phosphorylcholine and an insoluble diglyceride, causing a precipitate to form in the medium. Microorganisms with the enzyme lecithinase degrade lecithin into insoluble diglyceride and phosphorylcholine, resulting in a white, opaque zone of precipitation that spreads beyond the colony’s perimeter. When a colony forms on egg yolk agar medium, an opaque halo forms around it, suggesting that the lecithinase activity of the test is positive. The test organism was withdrawn in a loop after being streaked on the plate. After 24 hours at 35-37°C, the plate was examined for an opalescent halo surrounding the inoculates [precipitation surrounding the bacterium stripe (+ve)].

Methyl Red Test

In the Methyl Red test, an infected tube of MR-VP broth was used before adding the methyl red pH indicator. The buffers in the medium were overcome by the acids when an organism used the mixed acid fermentation pathway and produced stable acidic end products, resulting in an acidic environment.

Catalase Test

A little inoculum of a specific bacterial strain was introduced to a 3% hydrogen peroxide solution to see if it might produce catalase. It was observed for the rapid emergence of oxygen bubbles.

Oxidase Test

The 1% Kovács oxidase reagent was applied to a tiny piece of filter paper, which was then allowed to air dry. A well-isolated colony was taken from a fresh (18 to 24-hour culture) bacterial plate using a sterile loop, and it was then rubbed onto prepared filter paper. Color alterations were noticed.

Citrate Utilization

Five milliliters of a Simmon Koser’s citrate medium were taken after it had been autoclaved at 15 pounds for 15 minutes. To create a clear slant and butt, the test tube containing melted citrate medium was slanted. Using sterilized wire and labeled tubes, the specified samples of microbe were injected on the media’s incline. For 24 hours, the tubes were incubated at 37°C. The medium’s color shift was watched for.

Starch Hydrolysis

For 48 hours at 37°C, the bacterium plates were injected. After incubation, a dropper was used to saturate the surface of the plates with an iodine solution for 30 seconds. Iodine that was in excess was afterward poured out. The area surrounding the bacterial growth line was looked at.

Gelatin Hydrolysis

1% gelatin was used to create agar media. The supplied microorganism was added to the gelatin agar plates by utilizing an inoculating loop to create a single center streak in the plate. The plates were incubated for 24 hours at 37 °C. HgCl2 solution was poured over the plates. After a short while, the plates were examined. Positive test result; distinct halo-zone surrounding the injected region showed gelatin hydrolysis.
Growth at 45 0C
On nutrient agar media, growth was observed to be possible at 45°C.

Indol Test

The test tube containing the microorganism for inoculation received 5 drops of the Kovács reagent directly. Within seconds after introducing the reagent to the media, the reagent layer formed a pink to red colour (cherry-red ring), which was a sign of a positive indol test.

Tolerance Salinity

Its capacity to develop on nutrient agar while being responsive to 5% and 7% NaCl was examined.

Voges-Proskauer(VP) Test

For the test, Voges-Proskauer broth, a glucose-phosphate broth loaded with microorganisms, was added to alpha-naphthol and potassium hydroxide. A successful outcome was indicated by a cherry red tint, whereas an unfortunate outcome was indicated by a yellow-brown color.

Triple Sugar Iorn Test (TSI)

Glucose, lactose, and sucrose fermentation with or without gas generation were evaluated using triple-sugar iron agar (TSI agar). It also examined if amino acids may produce hydrogen sulfide. In this test medium, the pH indicator was phenol red. A TSIA slant was attained. The designated organism was injected into the TSIA slant’s butt using an inoculating needle. TSIA pulled up the surface of the slanted part of the tube in a zigzag manner after the inoculating needle was removed. 24 hours were spent incubating the slant. Any changes in the tube were noted after the incubation time. The lactose and/or sucrose fermentation was shown by the slant color. The butt color suggested that glucose was fermenting. Agar bubbles, a sign of gas production, were seen. The medium became dark, indicating the production of H2S.

Saccharide Fermentation Tests

Glucose Fermentation Test

The fermentation reactions of glucose were investigated using glucose purple broth. Peptone and the PH indicator bromcresol purple made up the purple broth. A 1% concentration of glucose was added. Isolated colonies from a 24-hour pure culture of microorganisms were added to the glucose purple broth as an inoculant. Parallel to the inoculation of the glucose-based medium, a control tube of purple broth base was used. The inoculated medium was incubated aerobically for 3 days at a temperature of 35–37 0C. The medium began to become yellow, which was a sign of a successful outcome. A poor carbohydrate fermentation response was indicated by the lack of yellow color development.

Fructose Fermentation Test

A pure culture’s inoculum was aseptically transferred to a sterile tube of phenol red fructose broth. The infected tube was incubated for 18–24 hours at 35–37 0C. A color shift from red to yellow, signifying an acidic PH alteration, was a sign of a favorable response.

Maltose Fermentation Test

A pure culture inoculum was aseptically transferred to a sterile tube containing phenol red maltose broth. The infected tube was incubated for 18–24 hours at 35–37 0C. A color shift from red to yellow, signifying an acidic PH alteration, was a sign of a favorable response.

Sucrose Fermentation Test

A pure culture’s inoculum was aseptically transferred to a sterile tube containing phenol red sucrose broth. For 24 hours, the infected tube was incubated at 35–37 0C. A colour shift from red to yellow, signifying an acidic PH alteration, was a sign of a favourable response.
The determination of optimal environmental and physiological factors affecting growth of some selected bacterial isolates producing L-glutaminase [PH, Temperature, NaCl salt concentration, and incubation time]:
This was accomplished by cultivating several soil samples previously obtained on MGA at various PH, Temperature, NaCl salt concentrations, and incubation durations.

Optimization of L-Glutaminase

There have been investigations into several process variables that increase L-glutaminase yield. Peptone, L-glutamine, and ammonium nitrate at a concentration of 1% W/V were used as nitrogen sources, and the effects of adding additional carbon sources (such as sucrose, mannitol, and soluble starch) and nitrogen sources (such as ammonium nitrate) were also studied. Additionally, the effects of various sodium chloride concentrations [2-8.5%], starting PH values [4,5,6,7,8,9,10], incubation temperatures [20-50 0C], inoculum concentrations [4-30%], and incubation periods [20-120 hours] were investigated. When doing this optimization, a specific parameter was used in further experiments when another parameter needed to be optimized. For L-glutaminase activity testing, all extracts derived from the aforementioned parameters were used. The experiments were run in triplicate, and the mean results were presented.

Characterization of L-Glutaminase Produced by Certain Selected Isolates

Figuring out the foremost activators such as Co+2, Ni+2 and Mn+2 to use to get the L-glutaminase enzyme out of the positive bacterial isolates that were cultivated on mineral L-glutamine agar.

UV Detection of Egyptian Soil Bacterial Cultures Containing L-Glutaminase Degrading Enzyme

When bacterial glutamine-degrading enzymes break down L-glutamine in media at PH 7, 37 °C, 0.05 mg/ml borate buffer, and minute amounts [5 mcg/ml] of the metal ions Ni+2, Co+2, or Mn+2 as co-factors, the optical density of the resulting compound is estimated using an explicit nesslerization assessment. Following the addition of 10 ml of sterile water to various grassland soil samples received from several Egyptian governments, 1 ml of each diluted sediment sample was extracted. Additionally, a substrate containing 2% L-glutamine was added to each diluted sediment. The model was then incubated over the following 24 hours at 37 °C. 3 ml of each growth medium was added after 24 hours at 37 °C of incubation. The purpose of this experiment was to determine ammonia concentration as a metric of L-glutaminase activity. When feasible, supernatants were collected, and 1 ml of each collected supernatant was subjected to 100 µl of Nessler’s reagent. To figure out the quantity of ammonia created, the absorbance at 480 nm was measured using a UV/VIS spectrophotometer. The experiment was replicated three times. Under ideal assay conditions, one unit of L-glutaminase was the quantity of enzyme that released 1 µmole of ammonia per minute per milliliter [mole/ ml/ min]. The enzyme activity was measured in triplicate and represented as a unit per ml [U/ ml].

Molecular Detection

This was accomplished using the Southern blotting method and the direct hybridization approach. The Southern blotting technique is used to transfer DNA molecules to nitrocellulose paper by blotting them there after being separated by electrophoresis, denatured, and hybridized with a DNA probe. DNA gel electrophoresis: An electrical field was applied while DNA samples were positioned in depressions (also known as wells) at one end of a gel. Depending on the size of the DNA molecules, the DNA moved toward the positive electrode at a different rate. Shorter molecules moved more quickly than longer ones because the gel functioned as a sieve. The gel was then taken out of the device. Before using tools to visualize them, the bands were not apparent. Various methods might be used to see the DNA bands in the gel. Using a dye stain, such as ethidium bromide, made it possible to directly see DNA bands under ultraviolet light. The most common method of identifying certain sequences was to use a labelled probe.

Upstream Process

Bacterial Recombinant DNA Production of L-Glutaminase

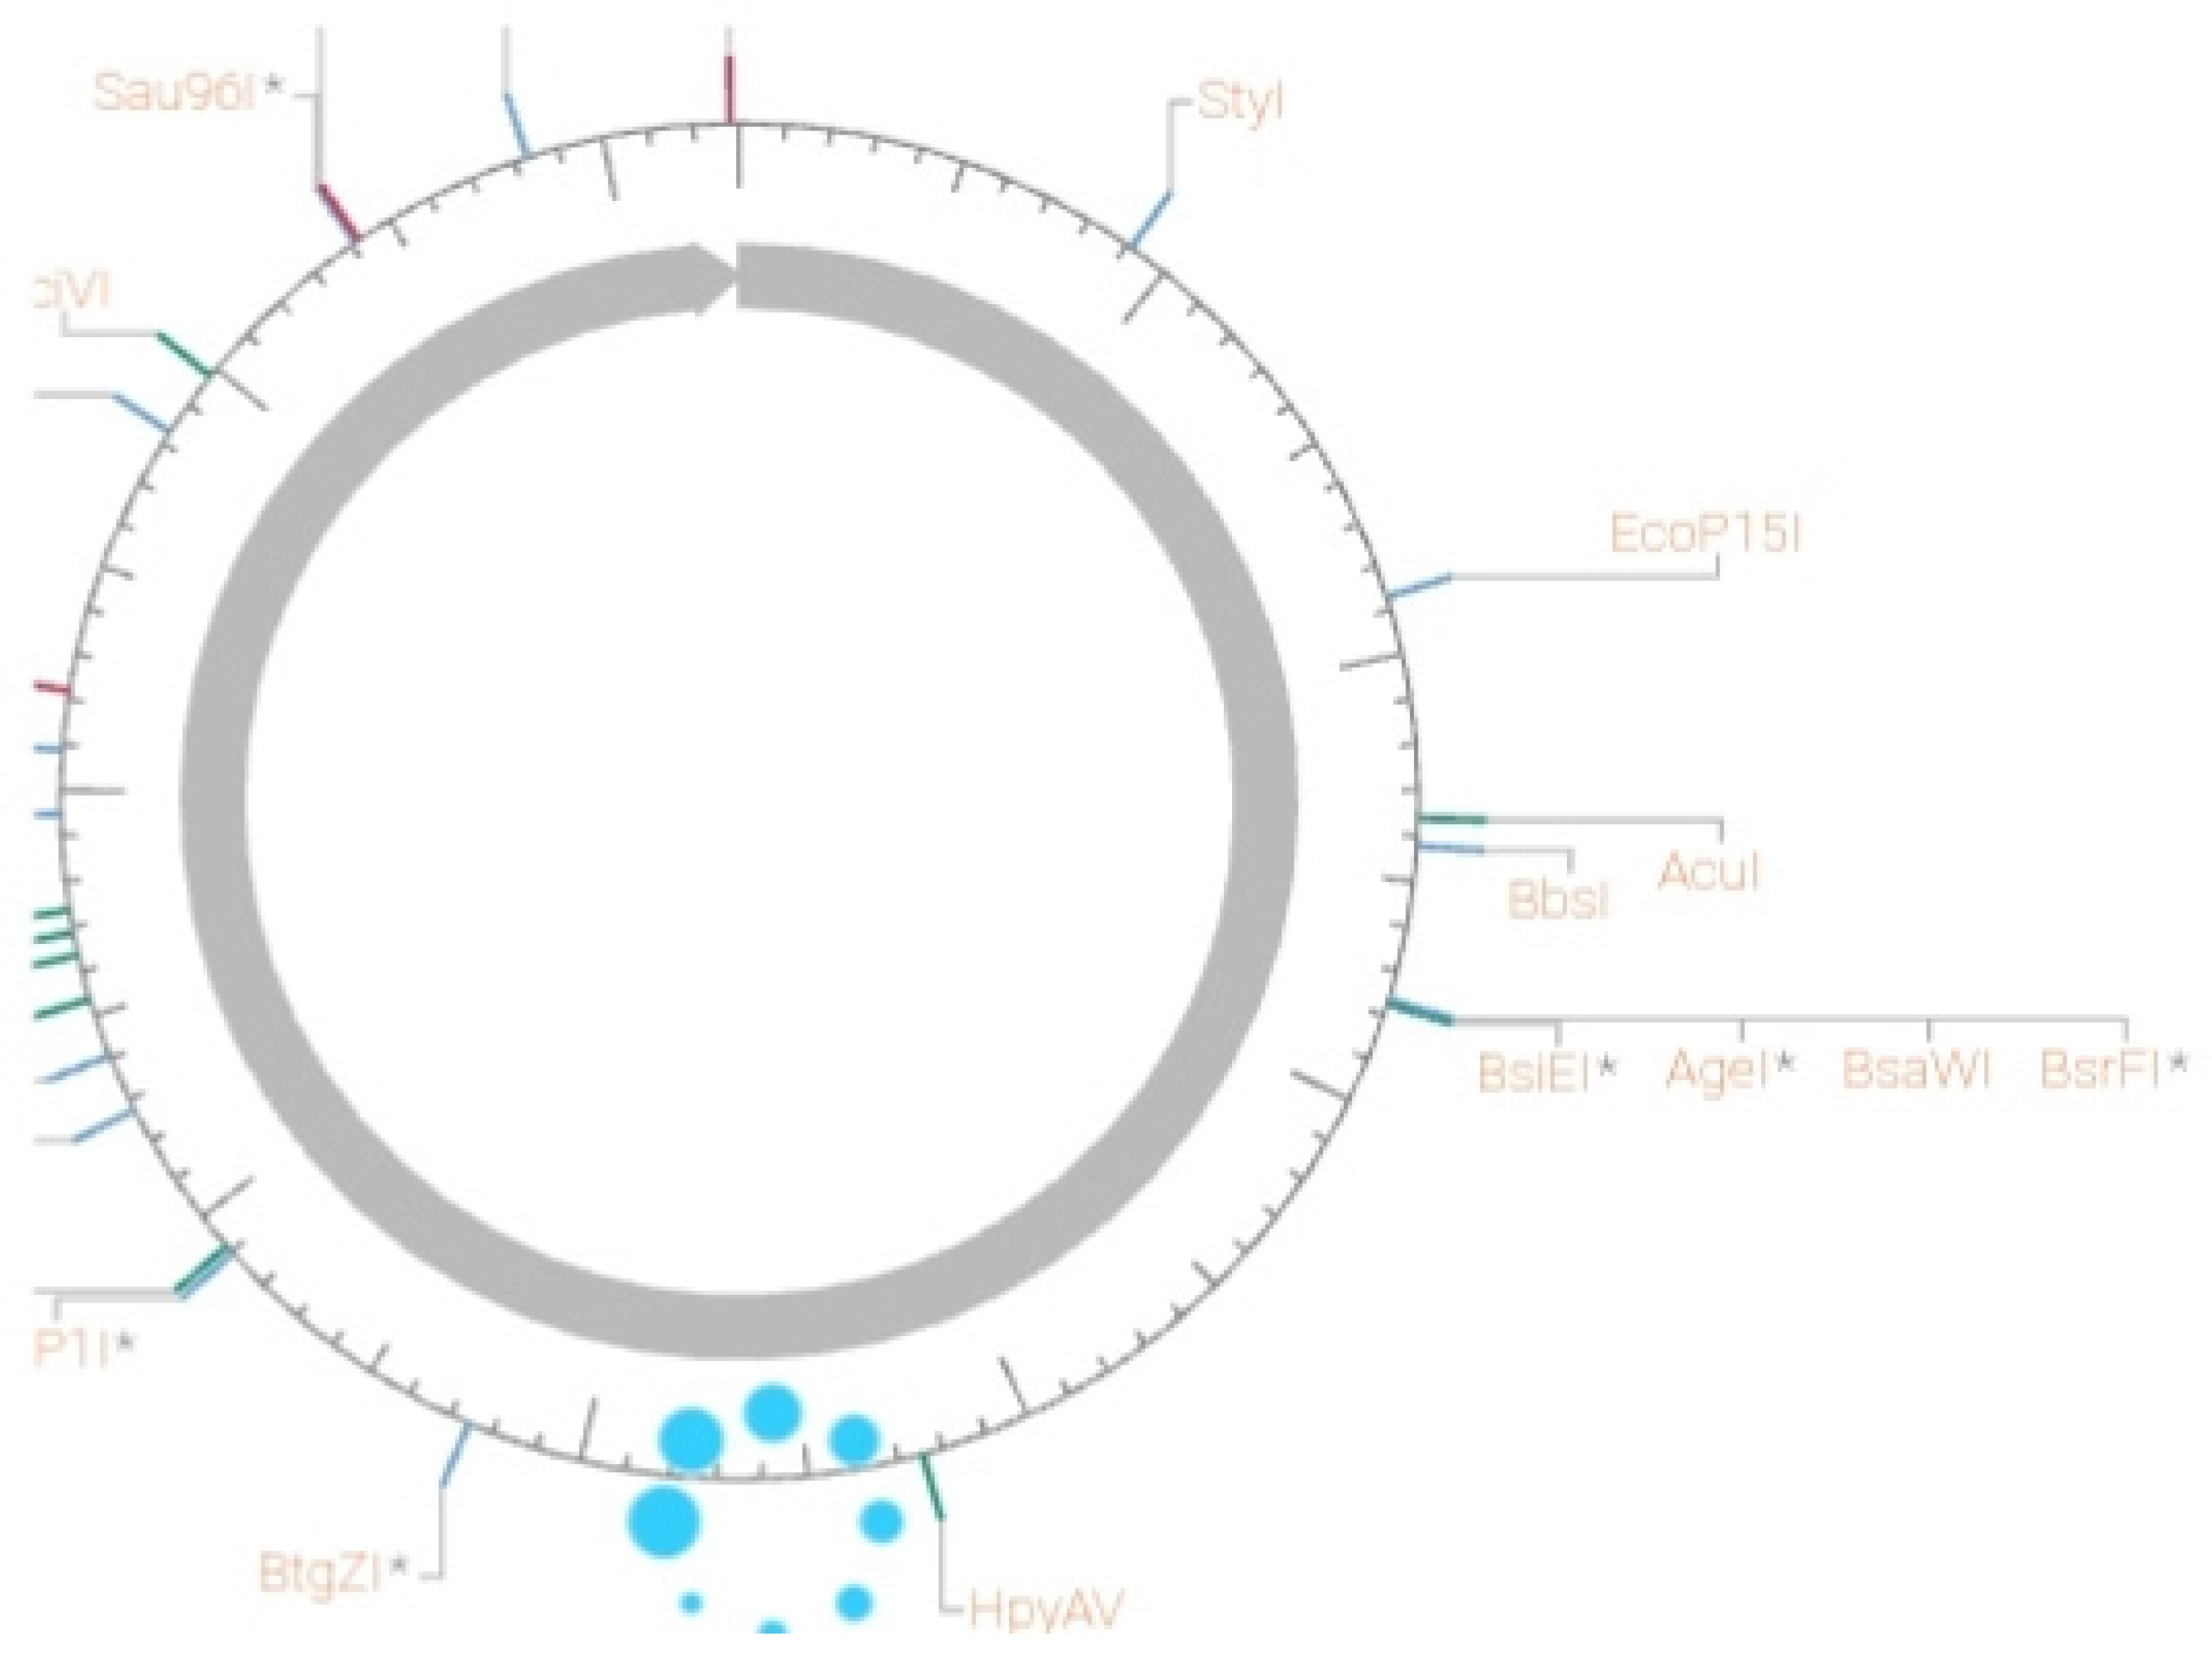
The expression vector was pET-14b (purchased from Novagene in the United States), the promotor was T7 Lac, and the tagged protein was 6x histidine linked to the C terminus of an L-glutaminase molecule. Escherichia coli BL21[DE3] polys S served as the expression host. All of them were used in the manufacture of L-glutaminase using bacterial recombinant DNA technology. IPTG was the transcription process’s inducer. The principal host for the plasmid synthesis and replication was Escherichia coli DH5 [obtained from Stratagene corporation, USA].
L-glutaminase genomic DNA was isolated from Bacillus cereus ATCC 14579 discovered in several Egypt soil conditions using restriction endonuclease type II enzymes [DNA cutting enzymes] Xbal and ACCI. These cutting enzymes were bought from the German business Sigma-Aldrich. Furthermore, genomic DNA was amplified using the polymerase chain reaction method before being sub-cloned to the prokaryotic expression vector PUC18 using the same restriction endonuclease type II enzymes used to extract genomic DNA from Bacillus cereus ATCC 14579. This was followed by the transformation of pET-14b into the polys S expression host Escherichia coli BL21[DE3]. The addition of IPTG stimulated transcription at the promotor site T7 Lac, hence initiating gene expression. Luria agar and broth [LA, LB] were used for routine bacterial culture for 24 hours at 37 0C incubation temperature. Ampicillin and/or Kanamycin were added to the culture medium according to the manufacturer’s guidelines.

Downstream Process

Purification was carried out using 500 cc of crude enzyme extract.
For recombinant expression yield, a centrifuge tube was spun for 3 minutes at 4000 RPM. The expressed protein was extracted using 70% ethanol [one volume of 70% ethyl alcohol was added to each 9 volumes of supernatant extract]. Furthermore, the expressed protein was purified using immobilized affinity chromatography [IMAC] and Ni-NTA resin. Immobilized affinity chromatography technique:
Immobilized metal affinity chromatography (IMAC) is the most extensively used technology for purifying proteins based on their affinity to certain metal ions. This was accomplished by chelating metals having phosphate affinity on resin or beads and arranging them in a column. Nitrilotriacetic acid and iminodiacetic acid were the most often used linker molecules, and they were used to join the metal to the resin. Chelating metals such as Fe2 + or Ga3 + retained the positively charged ions to which the negatively charged phosphate ions were linked in a matrix of silica or agarose. After incubating with the matrix at 37 °C, the protein was washed with a methanol and water solution. Binding peptides were released by using too much sodium phosphate or ammonium phosphate. The four major steps of the IMAC method were, in summary, as follows: (I) metal-ion immobilization on the matrix; (II) sample injection; (III) washing phase to remove unbound components; and (IV) finally, elution of the target biomolecule. IMAC was made up of various parts. First, the matrix, which includes cellulose, silica, agarose, and sepharose, was very hydrophilic, displayed minimal nonspecific adsorption, and had a high porosity to allow for considerable ligand immobilization. A chelating agent was covalently linked to the matrix via a spacer arm (generally a short alkyl chain) for additional Ni+2 immobilization; this agent was commonly tridentate, like iminodiacetic acid (IDA), or tetradentate, like NTA. When a material’s denticity was higher, stronger metal ion immobilization resulted in decreased metal-ion leakage. However, for protein or peptide adsorption, fewer coordination bonds remained accessible. Complexes between the complexing agent and the metal ions developed after the Ni+2 was deposited on the column, allowing some of the free coordination sites on the immobilized metal ions to be exploited to further coordinate peptides or proteins. Along with the specific coordination connections between certain amino-acid residues exposed on the biomolecule’s surface and the immobilized metal ions, various other specific interactions, most notably electrostatic and hydrophobic interactions, were seen.
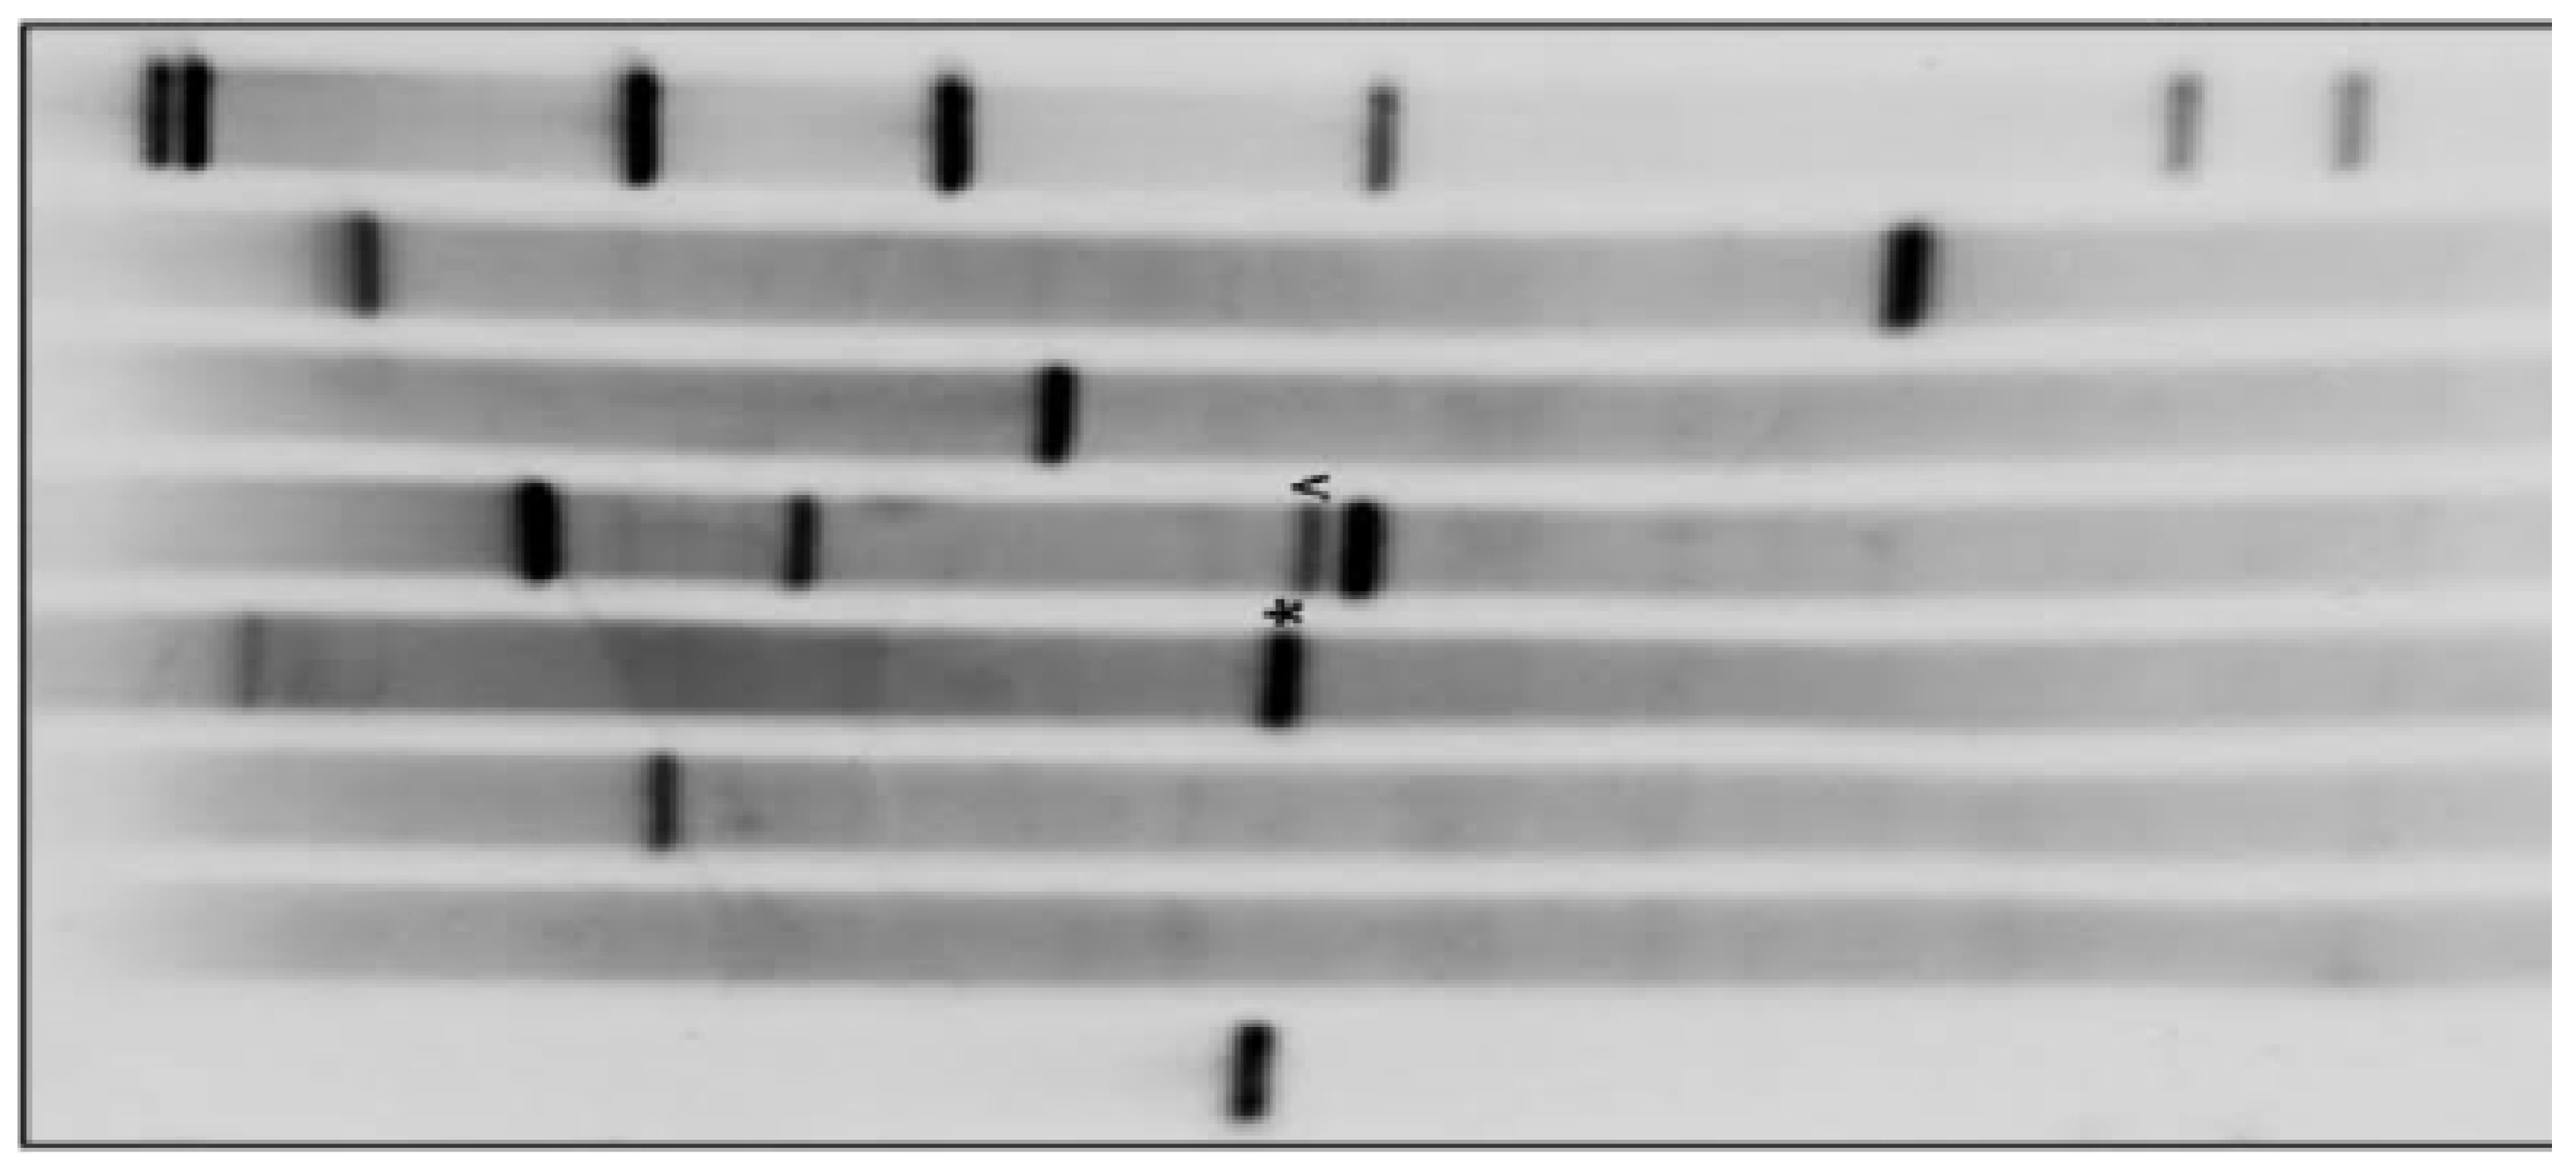
The chemistry of the surrounding environment (i.e., the type of buffer salts used, their concentration, pH, and ionic strength) reduced these unusual interactions. To accomplish this, relatively strong ionic buffers (often NaCl, 0.1-1.0 M) were used during washing or adsorption. IMAC’s elution method comprised altering pH, using a competition elution such as imidazole, and adopting a ligand exchange technology. The Western blot approach was used to determine the sizes, molecular masses, and quantities of recombinant proteins fused with a 6 x histidine tag at the carboxylic terminus of L-glutaminase. Western blot procedure: In this process, a protein mixture was separated based on molecular weight using gel electrophoresis. These discoveries were then transferred on nitrocellulose paper, where each protein was represented by a band. Western blot includes separating proteins by gel electrophoresis and searching for particular proteins using labelled antibodies.

Protein Content of L-Glutaminase Estimation

The protein content of the crude L-glutaminase enzyme source was evaluated using Lowry’s technique (Lowry et al. research, 1951), with bovine serum albumin as the reference, and the data were represented as mg/ml.

In Vitro Cell Viability Assay

The L-glutaminase enzyme’s physiologic, pharmacologic, and toxicological effects on acute lymphocytic leukaemia cancer cells were studied using the CCL-120 cancer cell line.
The L-glutaminase enzyme’s physiologic, pharmacologic, and toxicological effects on mammalian cells were studied using the Vero cell line. Human cancer cell lines include HepG-2 (liver), HCT-116(colon), MCF-7(breast), A-549(lung), CCL-120 (lymphocytic), and Hela (cervical). Cell lines were purchased from the Accegen biological firm in the United States.
The tumor cells were grown in Dulbecco’s modified Eagle’s medium [DMEM for normal cell lines] and DMEM-F12 for normal Vero cell lines, which were supplemented with 10% heat-inactivated fetal calf serum [GIBO], penicillin [110 mcg/ ml] and streptomycin [115 mcg/ ml] at 37 0C in a humidified atmosphere containing 5% carbon dioxide. In a 30 ml tissue culture flask, cells were planted at a density of 2×10⁶ and cultured at 37 0C till 85-90 confluent sheet.
For the in vitro cell viability assessment of bacterial L-glutaminase as an oncolytic agent, the MTT ((dimethylthiazol-2-yl)diphenyl tetrazonium) technique was utilized. The medium from cell cultures was discarded. For adherent cells, the medium was carefully aspirated. The 96-well plate was spined for suspension cells in a microplate centrifuge at 1,000 x g, 4 °C, for 5 minutes before the media was carefully aspirated. 50 ml of serum-free medium and 50 mL of MTT solution were added to each well. The plate was incubated at 37°C for three hours. During the incubation period, each well got 150 L of MTT solvent. The plate was stirred on an orbital shaker for 15 minutes while covered in foil. To thoroughly dissolve the MTT formazan, the liquid has to be pipetted at times. Within an hour, the absorbance at OD=590 nm was measured.

Estimation of Antioxidant Activity of L-Glutaminase

The DPPH [2, 2-diphenyl-2-picryl-hydroxyl] test was used to accomplish this. The procedure involves combining 2 ml of DPPH solution [purchased from Sigma Aldrich, Germany] with 2 ml of L-glutaminase extract solution. The reducing power and scavenging activity of the antioxidants towards DPPH could be measured by monitoring the reduction of its absorbance at 225 nm when the color of DPPH changed from purple to yellow of the equivalent hydrazine.

Estimation of Activity of L-Glutaminase via Indol Phenol Assay

Monochloramine was formed when ammonium ions interacted with hypochlorite in an alkaline solution [PH 10.8]. When nitroprusside was employed as a catalyst, the monochloramine generated a blue coloured chemical, indophenol, in the presence of phenol and an excess of hypochlorite. Indophenol was created by combining reagents A and B. To make Reagent A, dissolve 0.2 M phenol and 0.4 mM sodium nitroprusside dihydrate in water. To make Reagent B, dissolve 3 mM sodium dichloroisocyanurate dihydrate and 0.15 in water. Before use, both reagents were kept in the refrigerator. Soil samples were serially diluted with distilled water, and 2 ml of each soil sample was added to reagent A and combined with reagent B. After shaking vigorously for 1 minute, the reaction was allowed to proceed for 20 minutes, resulting in the formation of indophenol complex. Its absorbance was measured color-metrically at 650 nm using a UV spectrophotometer.

Formulation of L-Glutaminase

Different formulations of L-glutaminase were designed from which the optimum formulation was selected during the present study.

Detection of Immunogenicity of L-Glutaminase Conjugated with PEG

This was carried out using ELISA technique.

Statistical Analysis

All cultures were conducted in triplets. Their presentation was by means and standard deviation. One way analysis of variance (p value≤.05) was used as means for performing statistical analysis and also, statistical analysis based on excel-spreadsheet-software. F test was utilized during statistical analysis in the present study.

Results

In the present study, an attempt was made to detect an efficient strain of Bacillus cereus from different soil environments in Egypt for the enhanced production of L-glutaminase as anticancer agent. As well as, the antioxidant attribute of L-glutaminase was reported.
Only bacterial isolates which utilized L-glutamine as the sole metabolic source of carbon and nitrogen showed positive growth on selective metallic glutamine agar medium [MGA]. The optimal environmental and physiological factors affecting growth of positive bacterial isolates were PH 7.4 at temperature 37 0C. The morphological and the biochemical tests revealed that Bacillus cereus was the major positive bacterial producing L-glutaminase isolate from the soil samples collected from different soil environments in Egypt. The optimal conditions for characterization of L-glutaminase production were with the following activators KCL, ZnSO4, FeSO4, K2HPO4, MgSO4 at PH 7.4 and temperature 37 0C. L-glutaminase produced from Bacillus cereus showed high efficacy and bio-availability as anticancer agent. Molecular mass of L-glutaminase was approximately 37 KDa, The yield [productivity] was 5.2 U/ml during the initial production from MGA; while it rose to 42.96 U/ml via bacterial recombinant DNA production. L-glutaminase was purified to yield total activity 12,990 ± 19.76 (U), specific activity 384.66 ± 8.92 (U/mg of protein), and purification fold 2 ± 2.99 with final enzyme recovery 55 ± 1.23 %. Furthermore, Mn2+, K+, Na+, and Fe3+ were enzymatic activators that increased the L-glutaminase activity by 19 %, 23 %, 15 %, and 9 %, respectively. It showed potent DPPH scavenging activities with IC50 = 203 μg/mL and anticancer activities against human liver (HepG-2), colon (HCT-116), breast (MCF-7), lung (A-549), lymphocytic (CCL-120) and cervical (Hela) cancer cell lines with IC50 40.72, 9.7, 7.39, 20.61, 51.28 and 11.55 μg/mL, respectively. The kinetic parameters of Km and Vmax were 13.2 × 10⁻⁵ M and 119.86 μmol/mL/min, respectively, which reflected a higher affinity for its substrate. The inoculate contained 1*107 spores/ml.

Isolation and the Screening of L-Glutaminase Producing Bacteria

A total of 31 bacterial isolates were isolated from different soil samples and used for various screening studies. The current study involved the screening of isolated bacteria on mineral glutamine agar media with the glutamine as the sole source of nitrogen and carbon. Only the organisms that were able to utilize L-glutamine as nitrogen and carbon source could grow.

Identification and Screening of L-Glutaminase Degrading Enzyme

The collected soil samples were further analyzed by nesslerization test. This method has been applied for the determination of the ammonia concentration as a product of enzymatic degradation by glutamine degrading enzyme. The concentration of the liberated ammonia by test samples demonstrated that glutamine degrading enzymes were present in collected samples. Among the collected samples, samples from 1 to 31 which were further identified as Bacillus cereus species produced the highest amount of glutamine degrading enzyme.

Identification and the Characterization of the Most Potent Bacteria

The morphological characteristics of isolates from 1 to 31 which showed high L-glutaminase activity indicated that the organism belonged to the genus Bacillus. The biochemical characterization by biochemical tests revealed that it was similar to Bacillus cereus. Comparing our results with another study conducted in Iran(Isolation, screening and characterization of glutamine producing soil bacteria), it was found that the prevalent producing bacteria were Bacillus cereus 14579 in the present investigation; while It was Escherichia coli species in another study.

Environmental and Physiological Factors Affecting Growth of Glutaminase Producing Bacteria

The optimal conditions for the growth were PH7.3 at temperature 370C.

Characterization of Bacterial Glutaminase Production

The activators of the enzyme production: 0.5 g/l KCL, 0.5 g/l MGSO4, 1.0 g/l FESO4, 0.1 g/l ZnSO4.

Determination of Oncolytic Activity of Bacterial L-Glutaminase

This bacterial enzyme showed higher efficacy as antileukaemic anticancer agent against acute lymphocytic leukaemia as indicated by the in vitro cell viability test using MTT assay.
The purified L-glutaminase showed a maximal activity against L-glutamine when, it was incubated at PH 8.5 at 40.5 0C for 35 minutes. It maintained its stability at a wide range of PH from 5-10.5 and was thermostable up to 60 0C with Tm [melting temperature] value 56.810C. It demonstrated high affinity and catalytic activity for L-glutamine. The crude extract of L-glutaminase contained 83.9 mg protein content during purification with Nickel immobilized affinity chromatography.
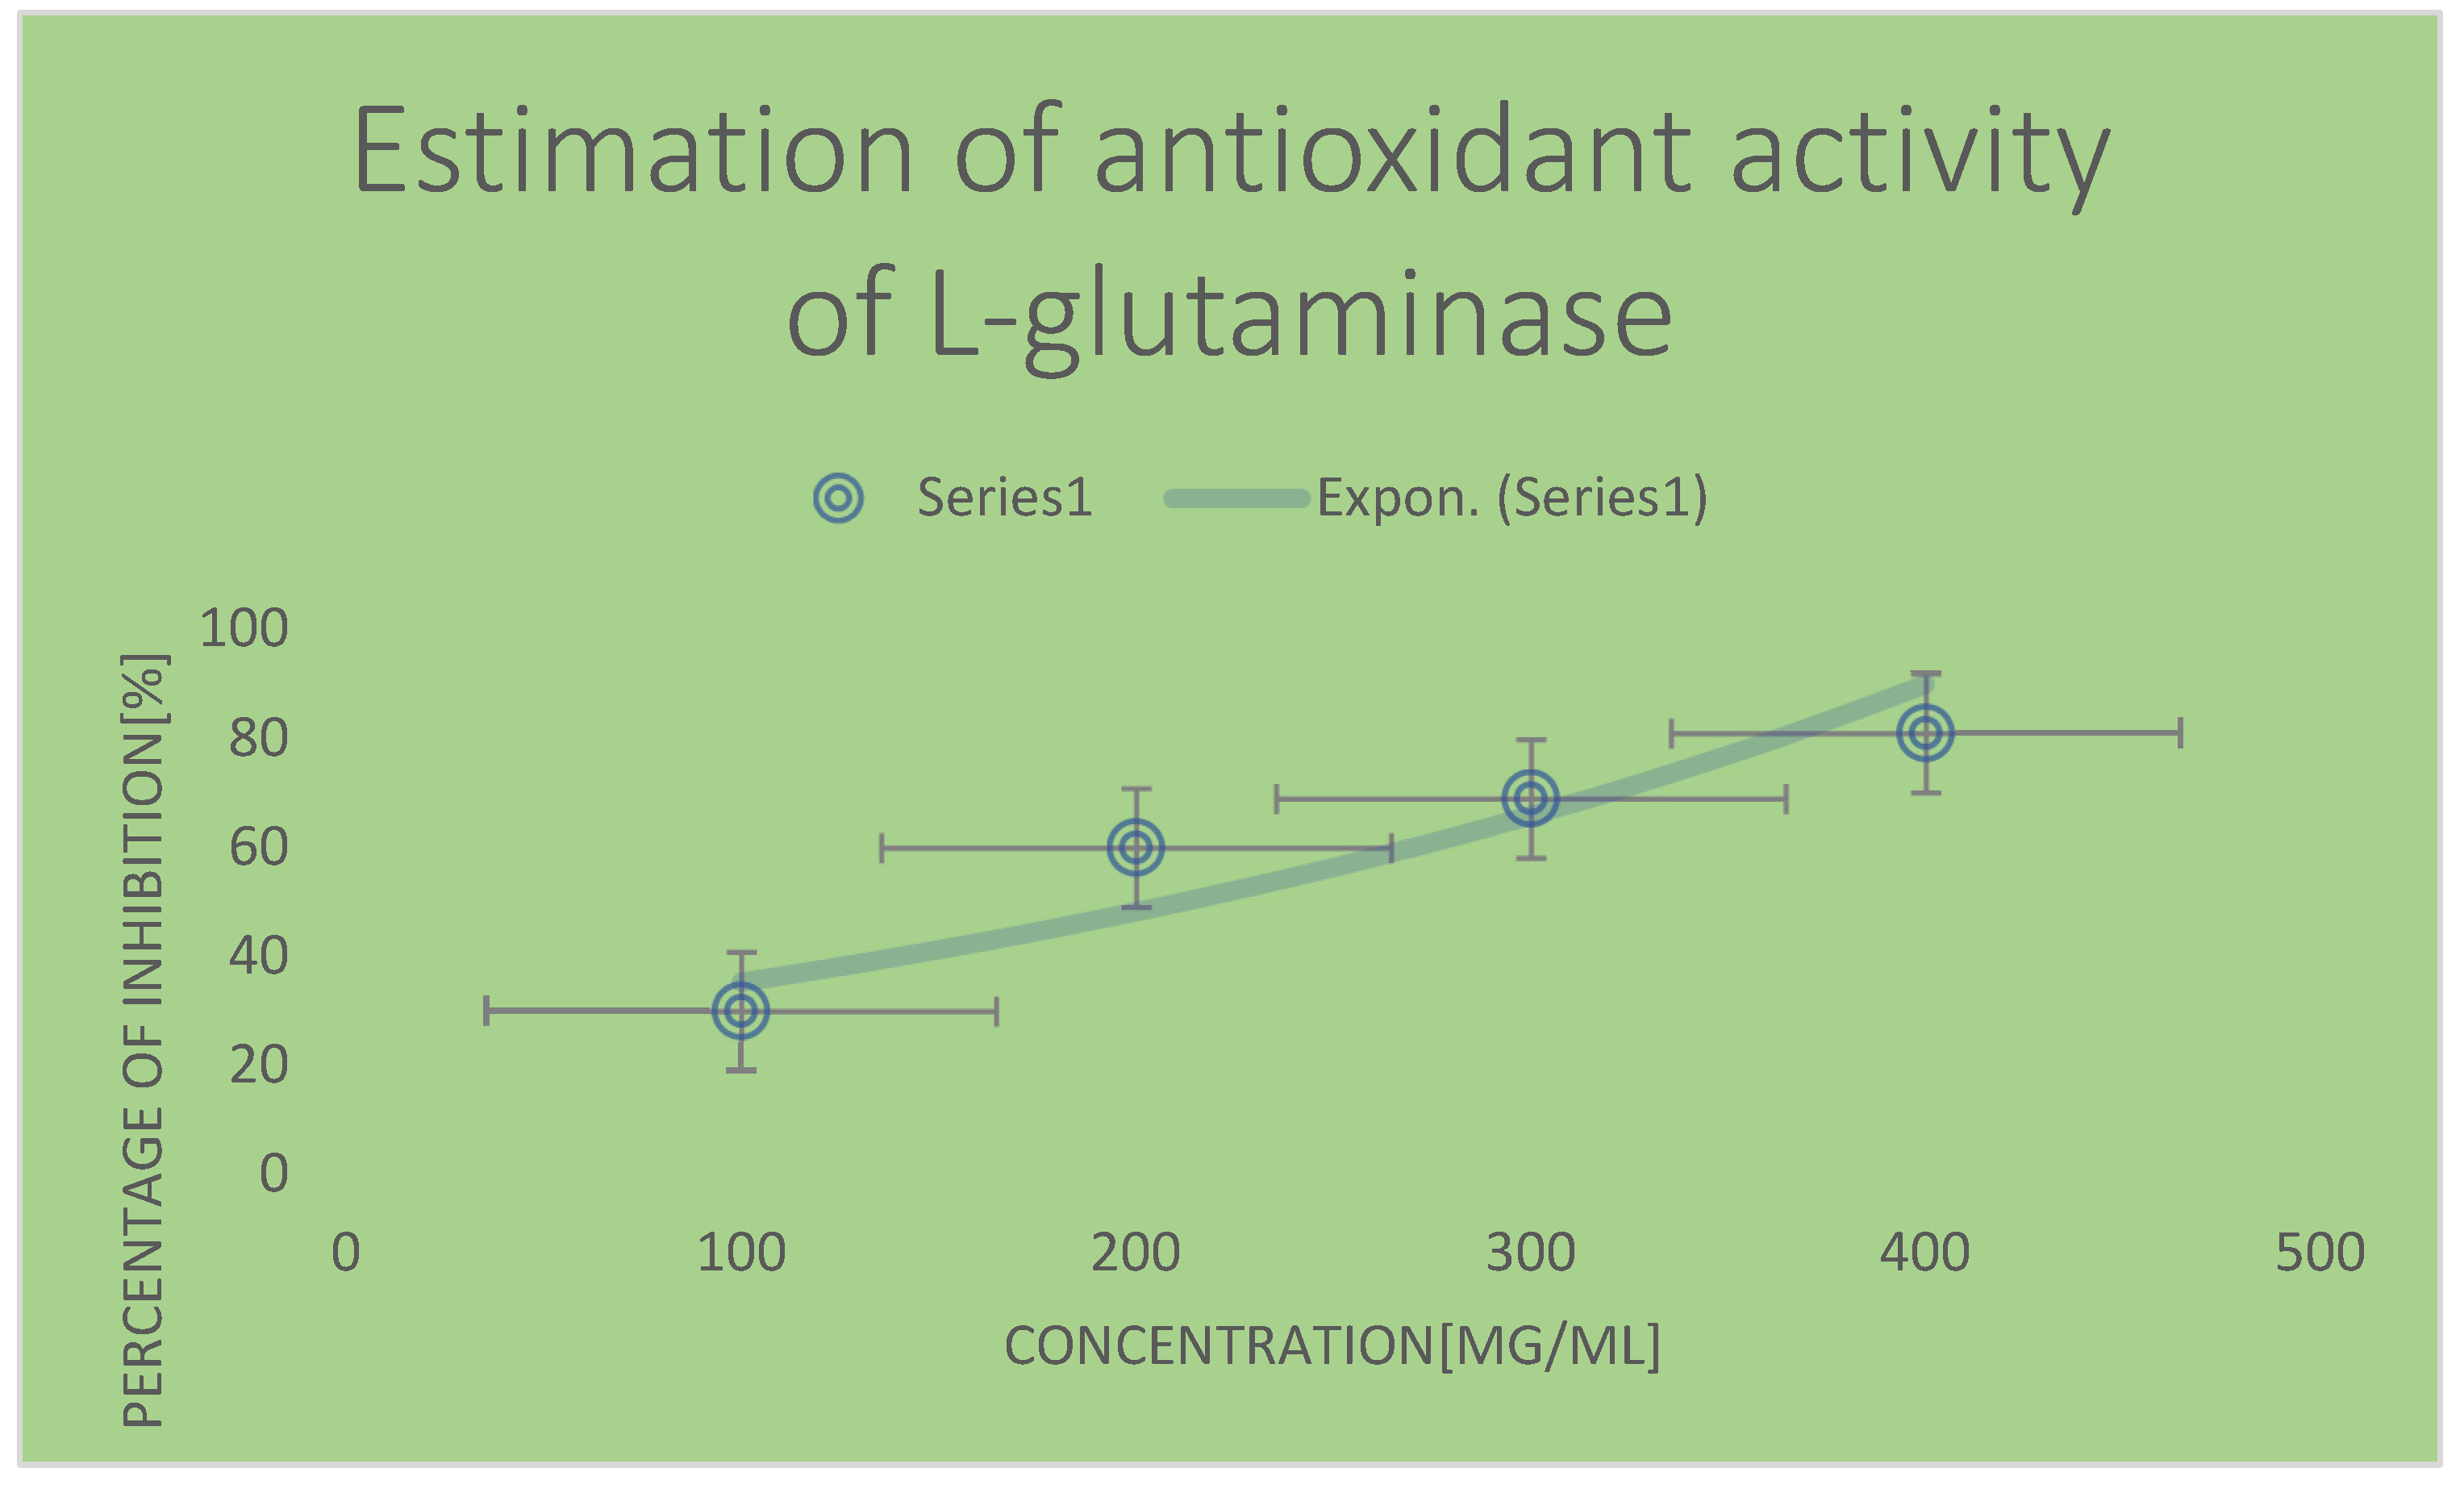
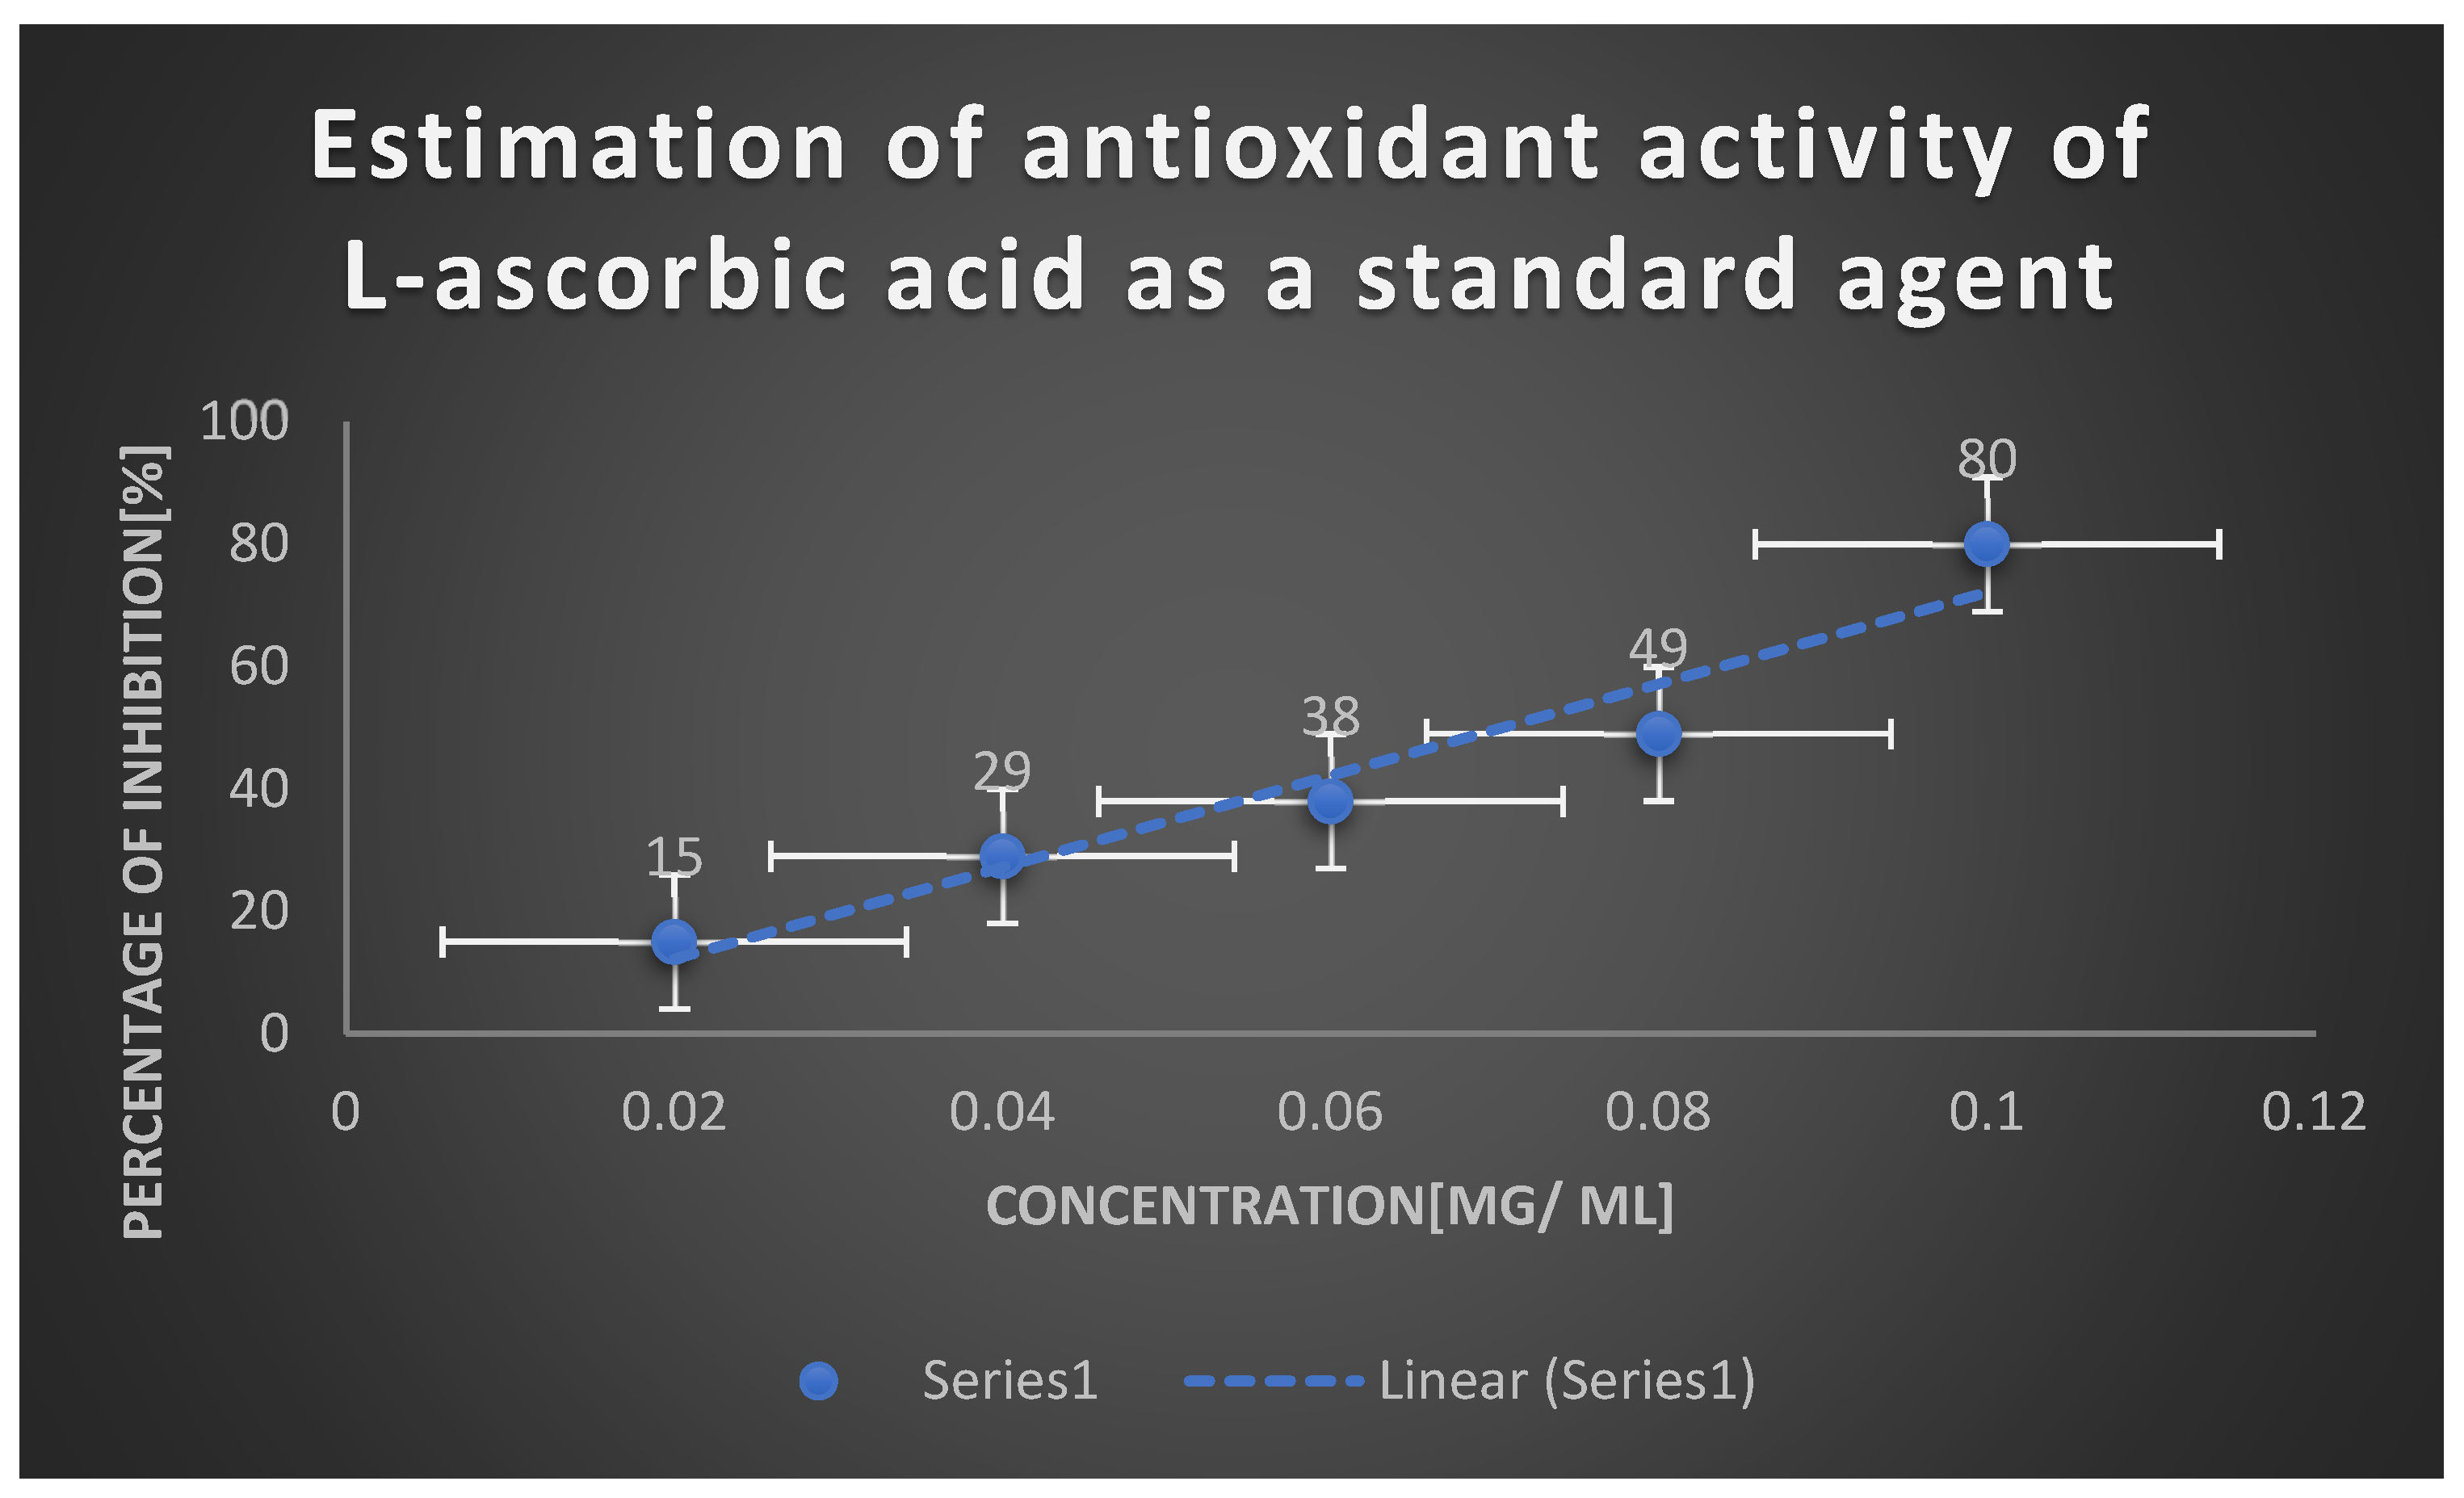
The IC50 values for antioxidant activities for the control [vitamin C] and L-glutaminase were discovered to be 99 mcg/ml and 203 mcg/ml respectively. The optimum of maximum production of L-glutaminase was observed, when it was incubated at PH 8.5 at 40.5 0C for 35 minutes in addition to agitation at 195 rev/min. And inoculum size 1× 10⁸ spores/ml.

Detection of Immunogenicity of L-Glutaminase Conjugated with PEG

This was accomplished by the use of the ELISA method. During the current investigation, few IgG2 antibodies were detected against L-glutaminase produced by Bacillus cereus.
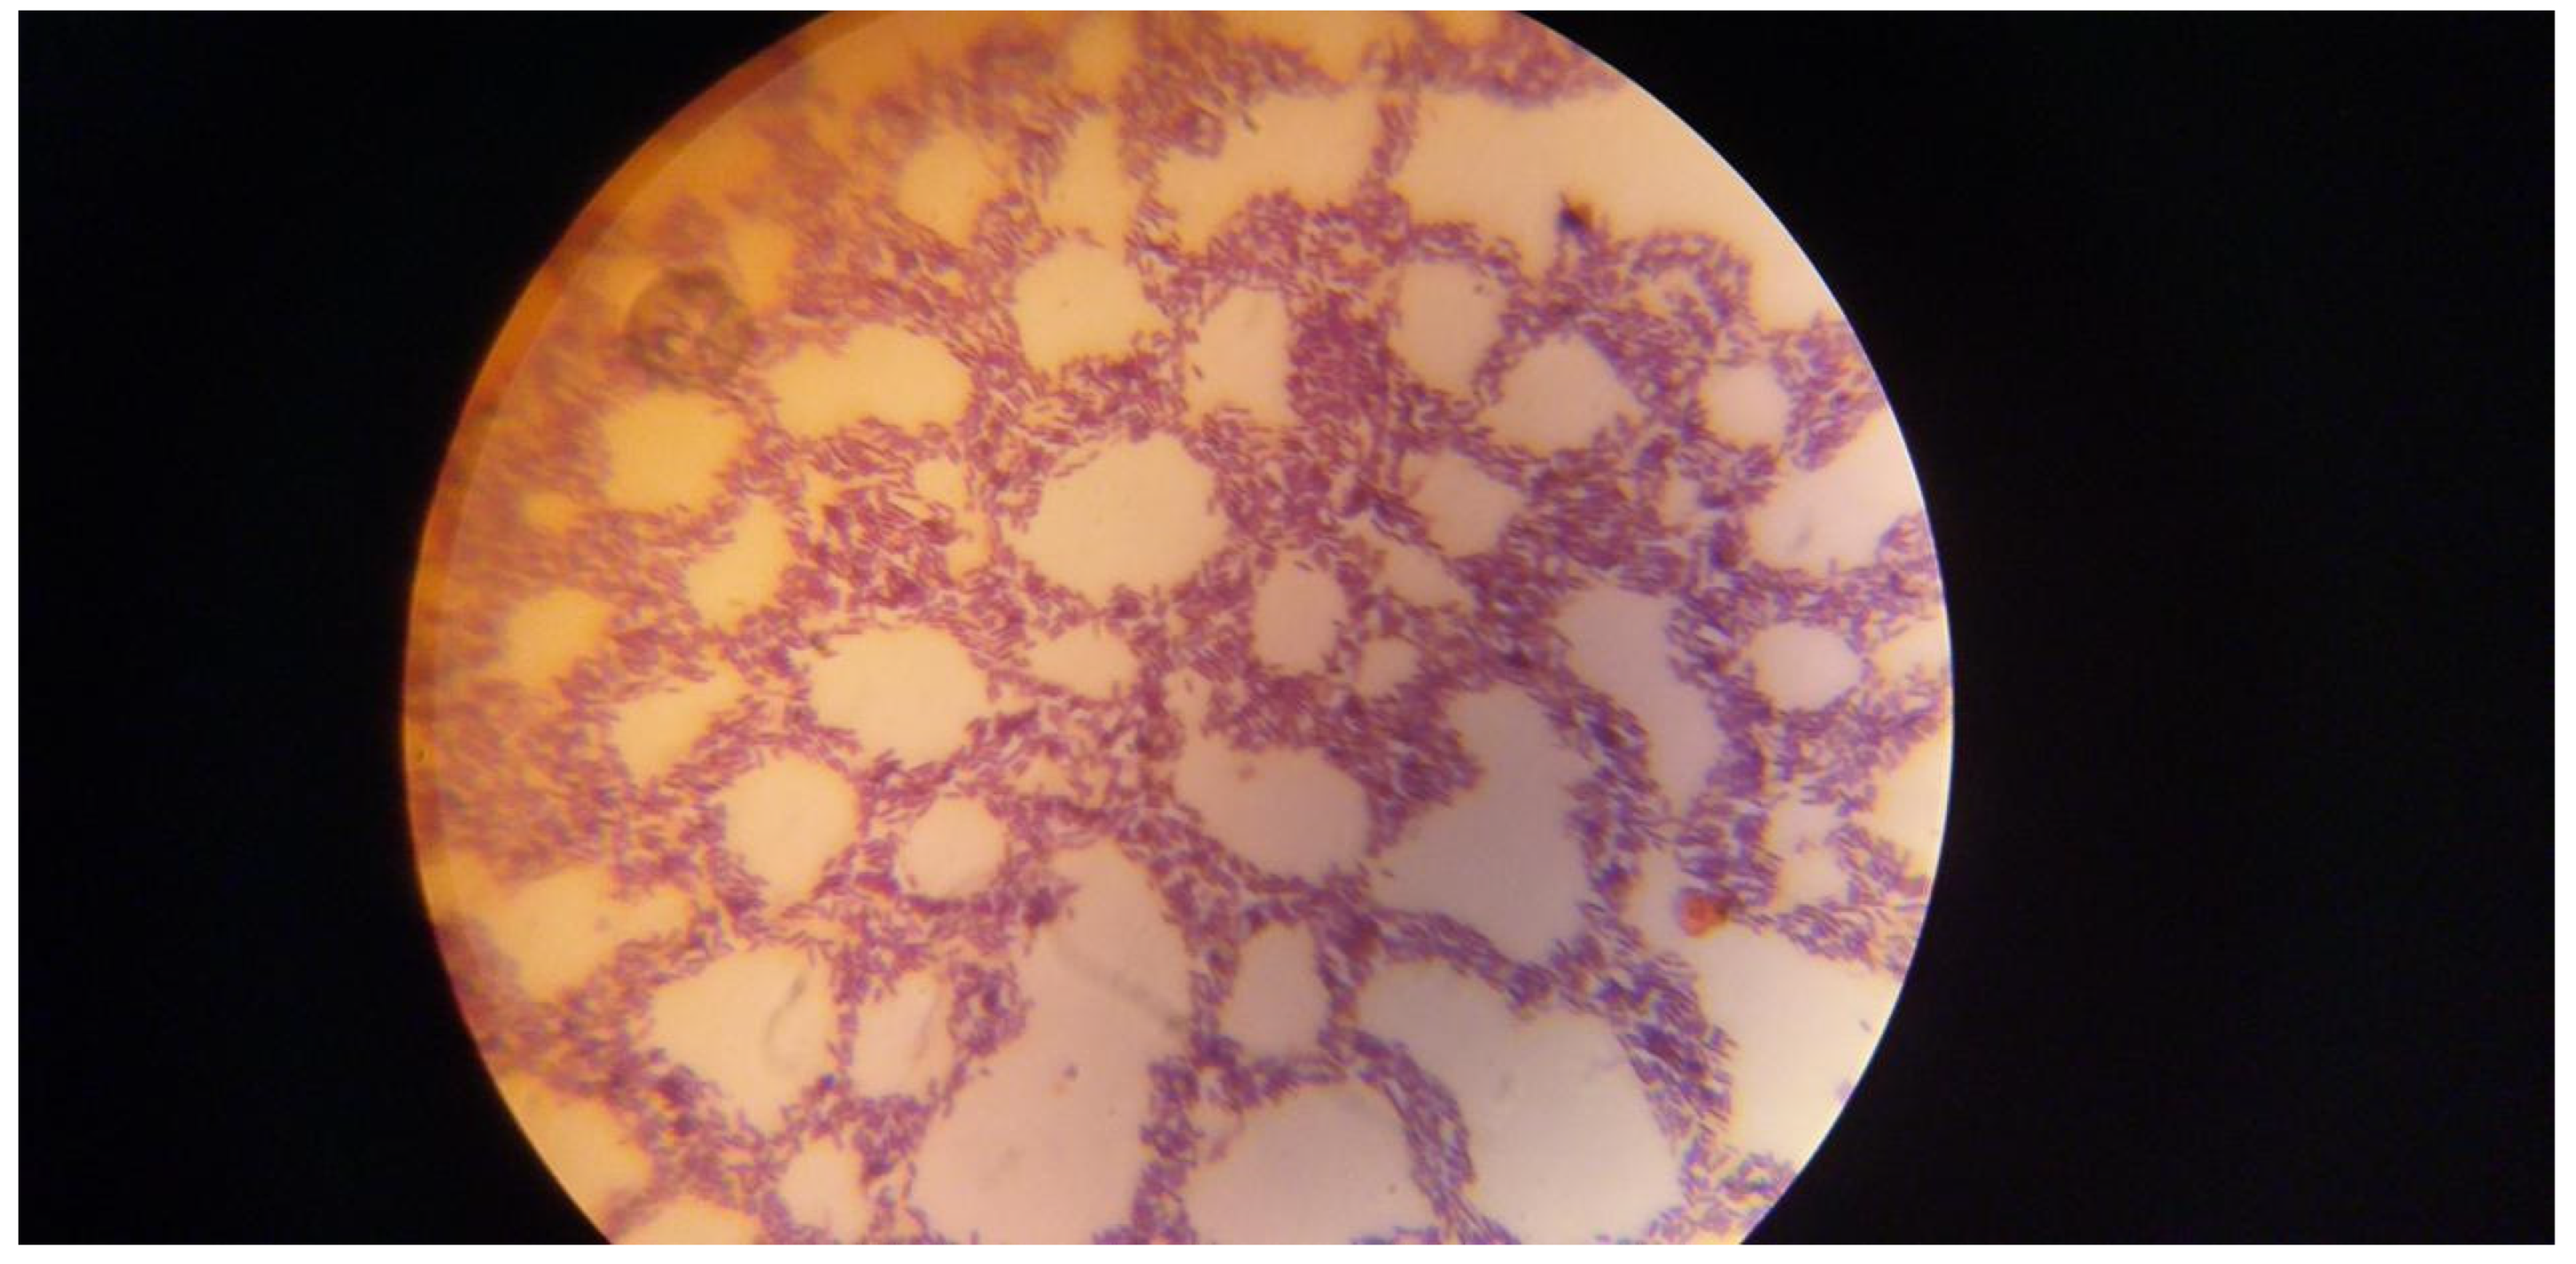
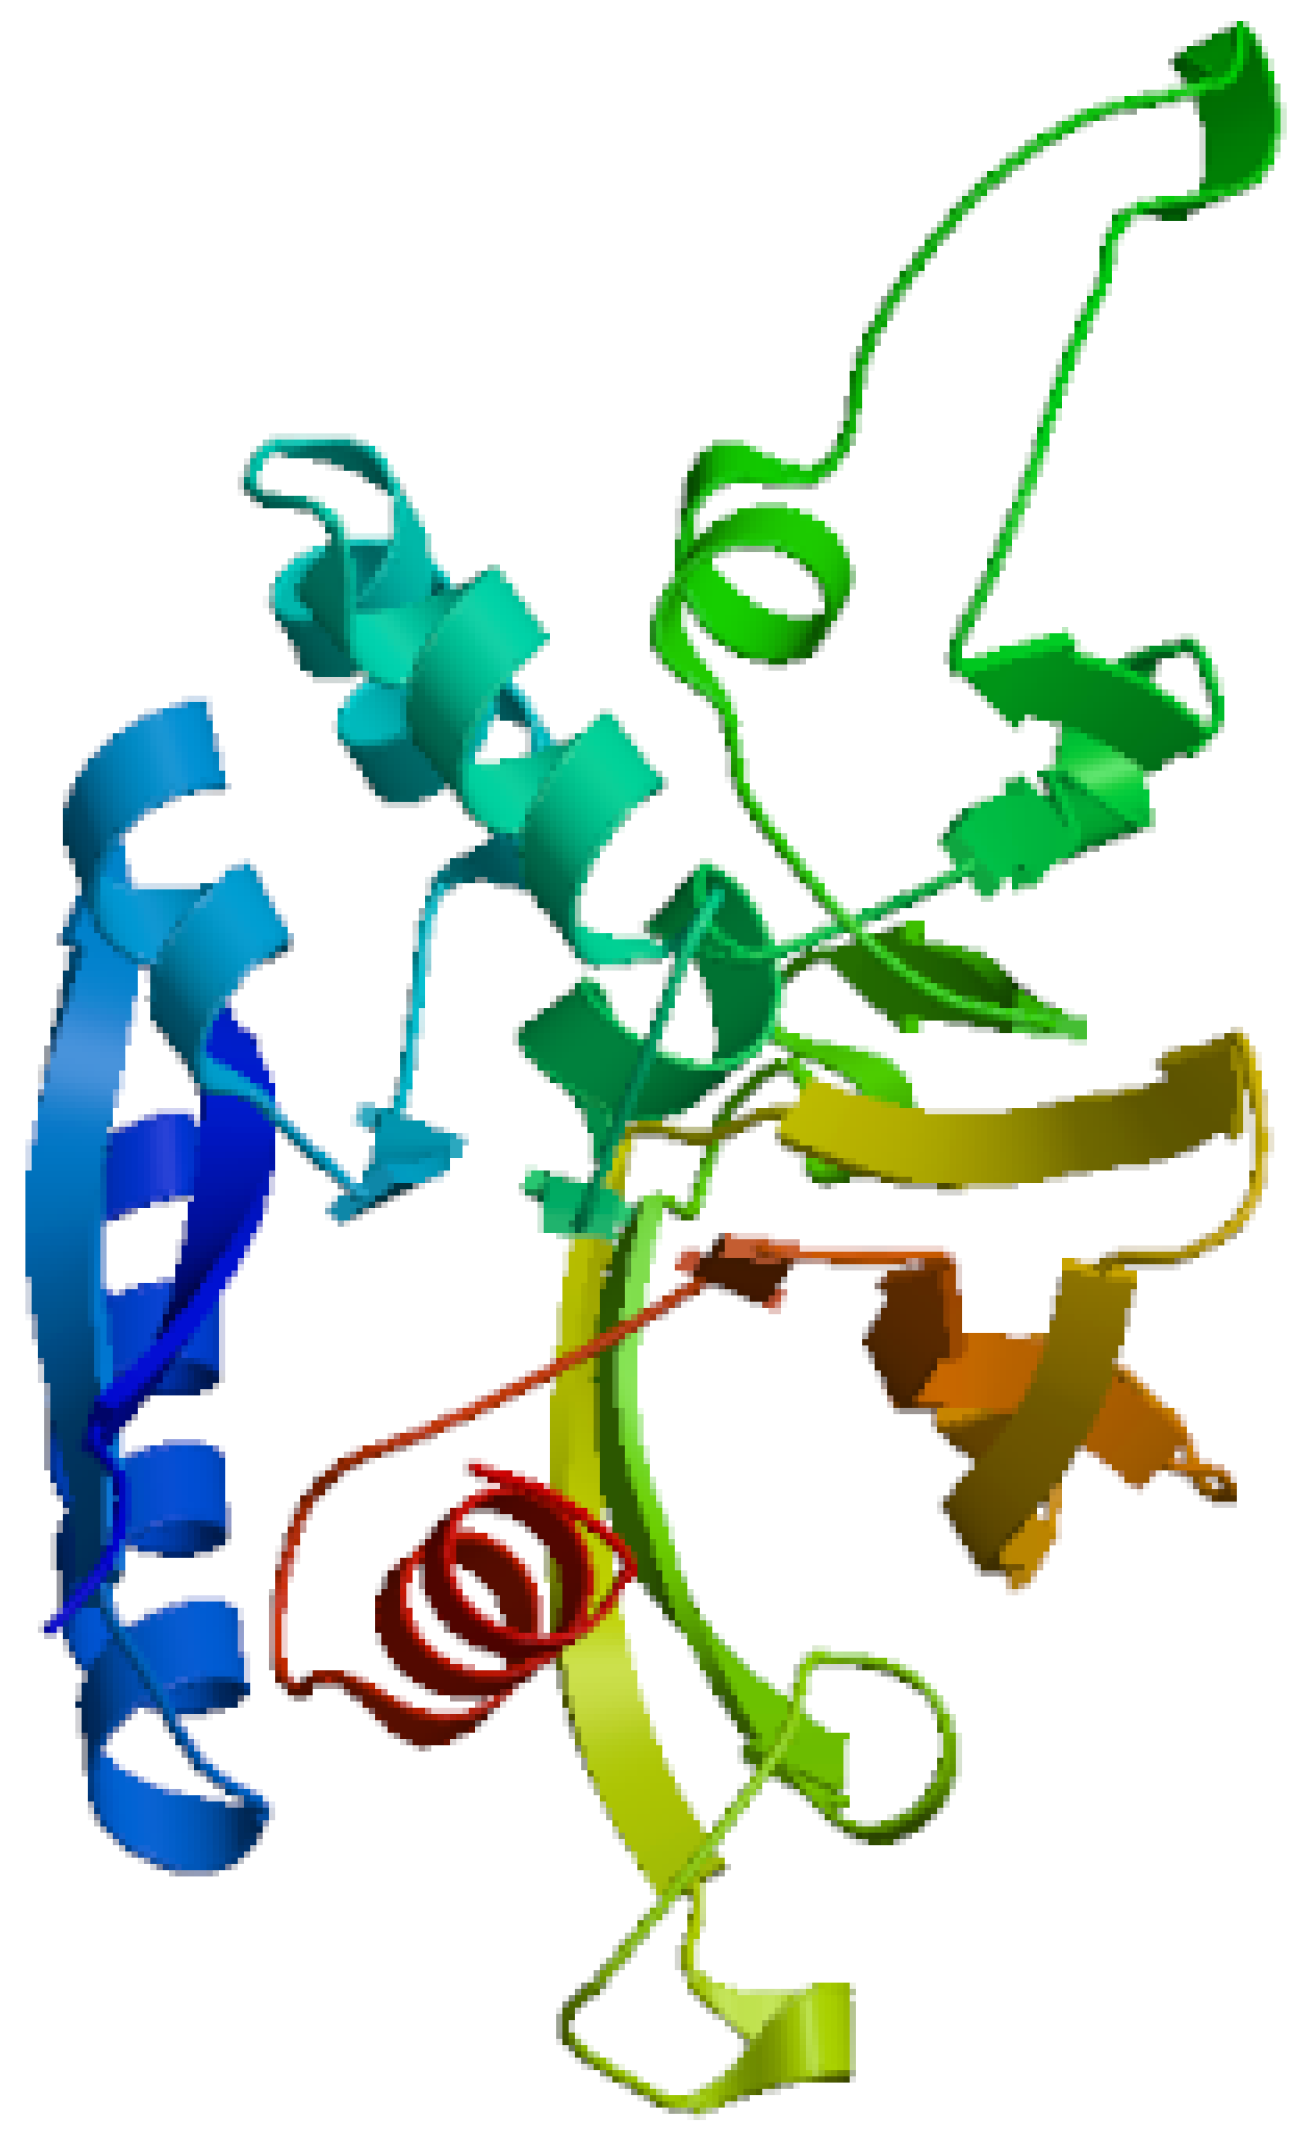
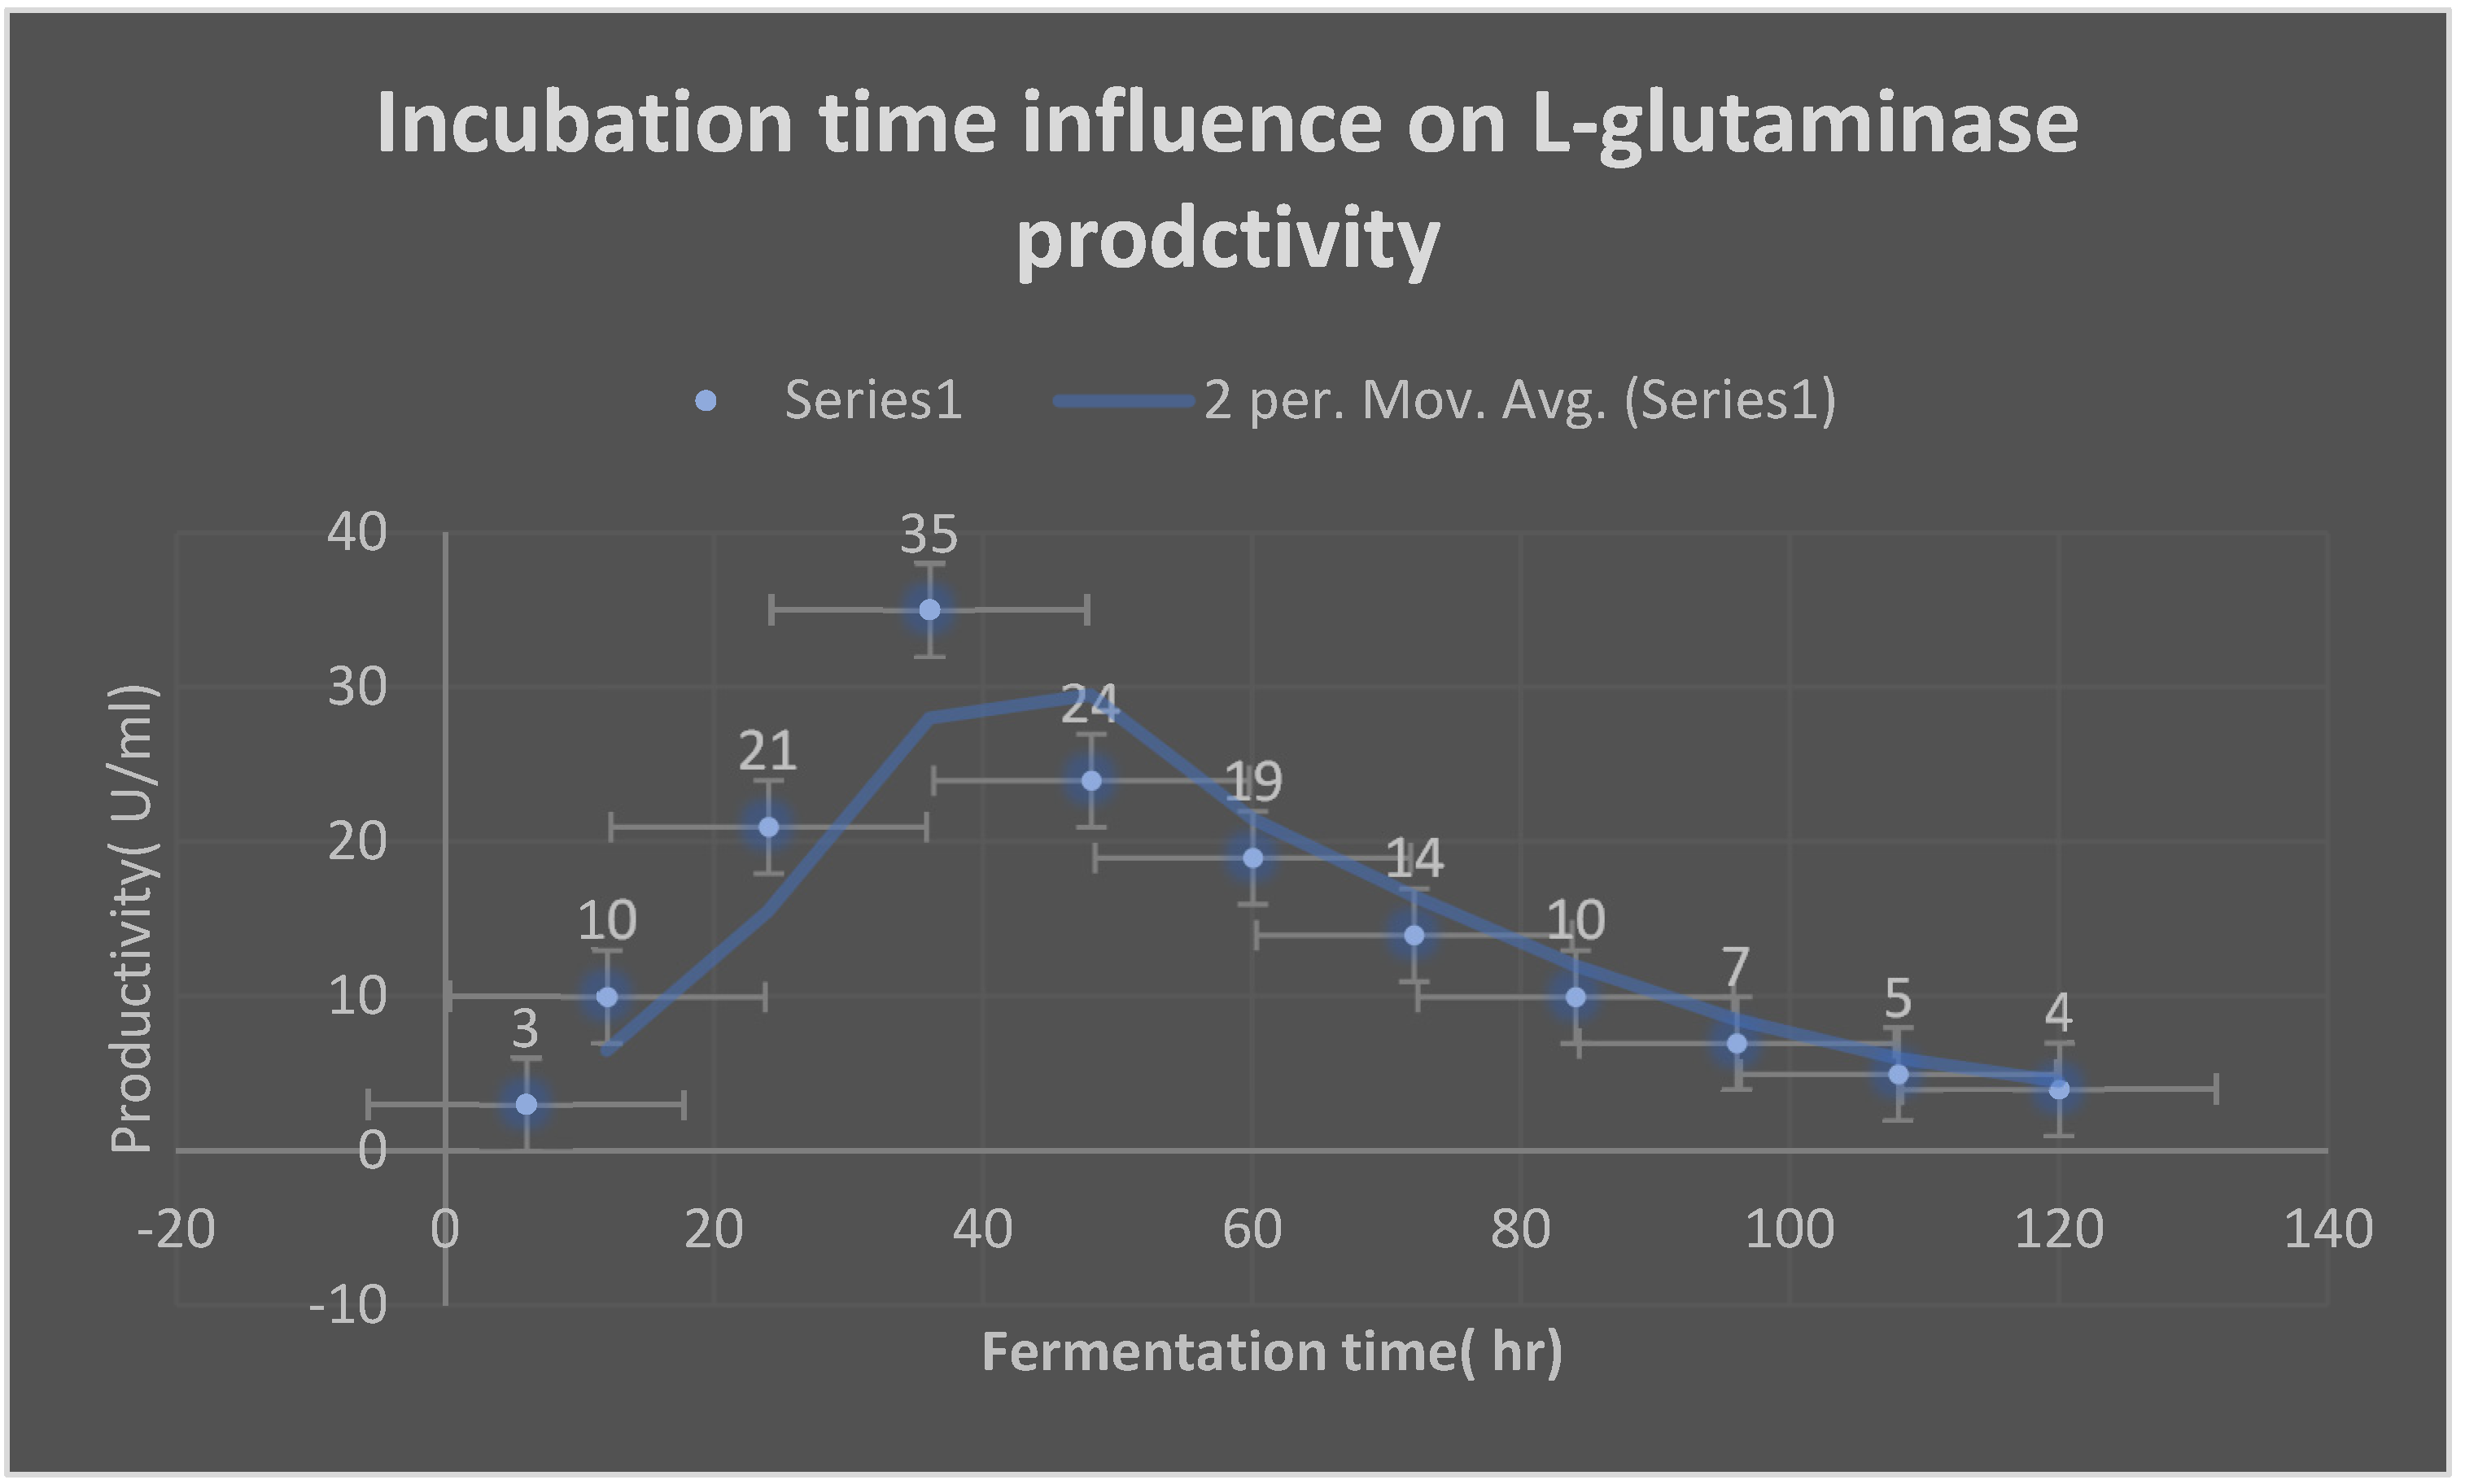
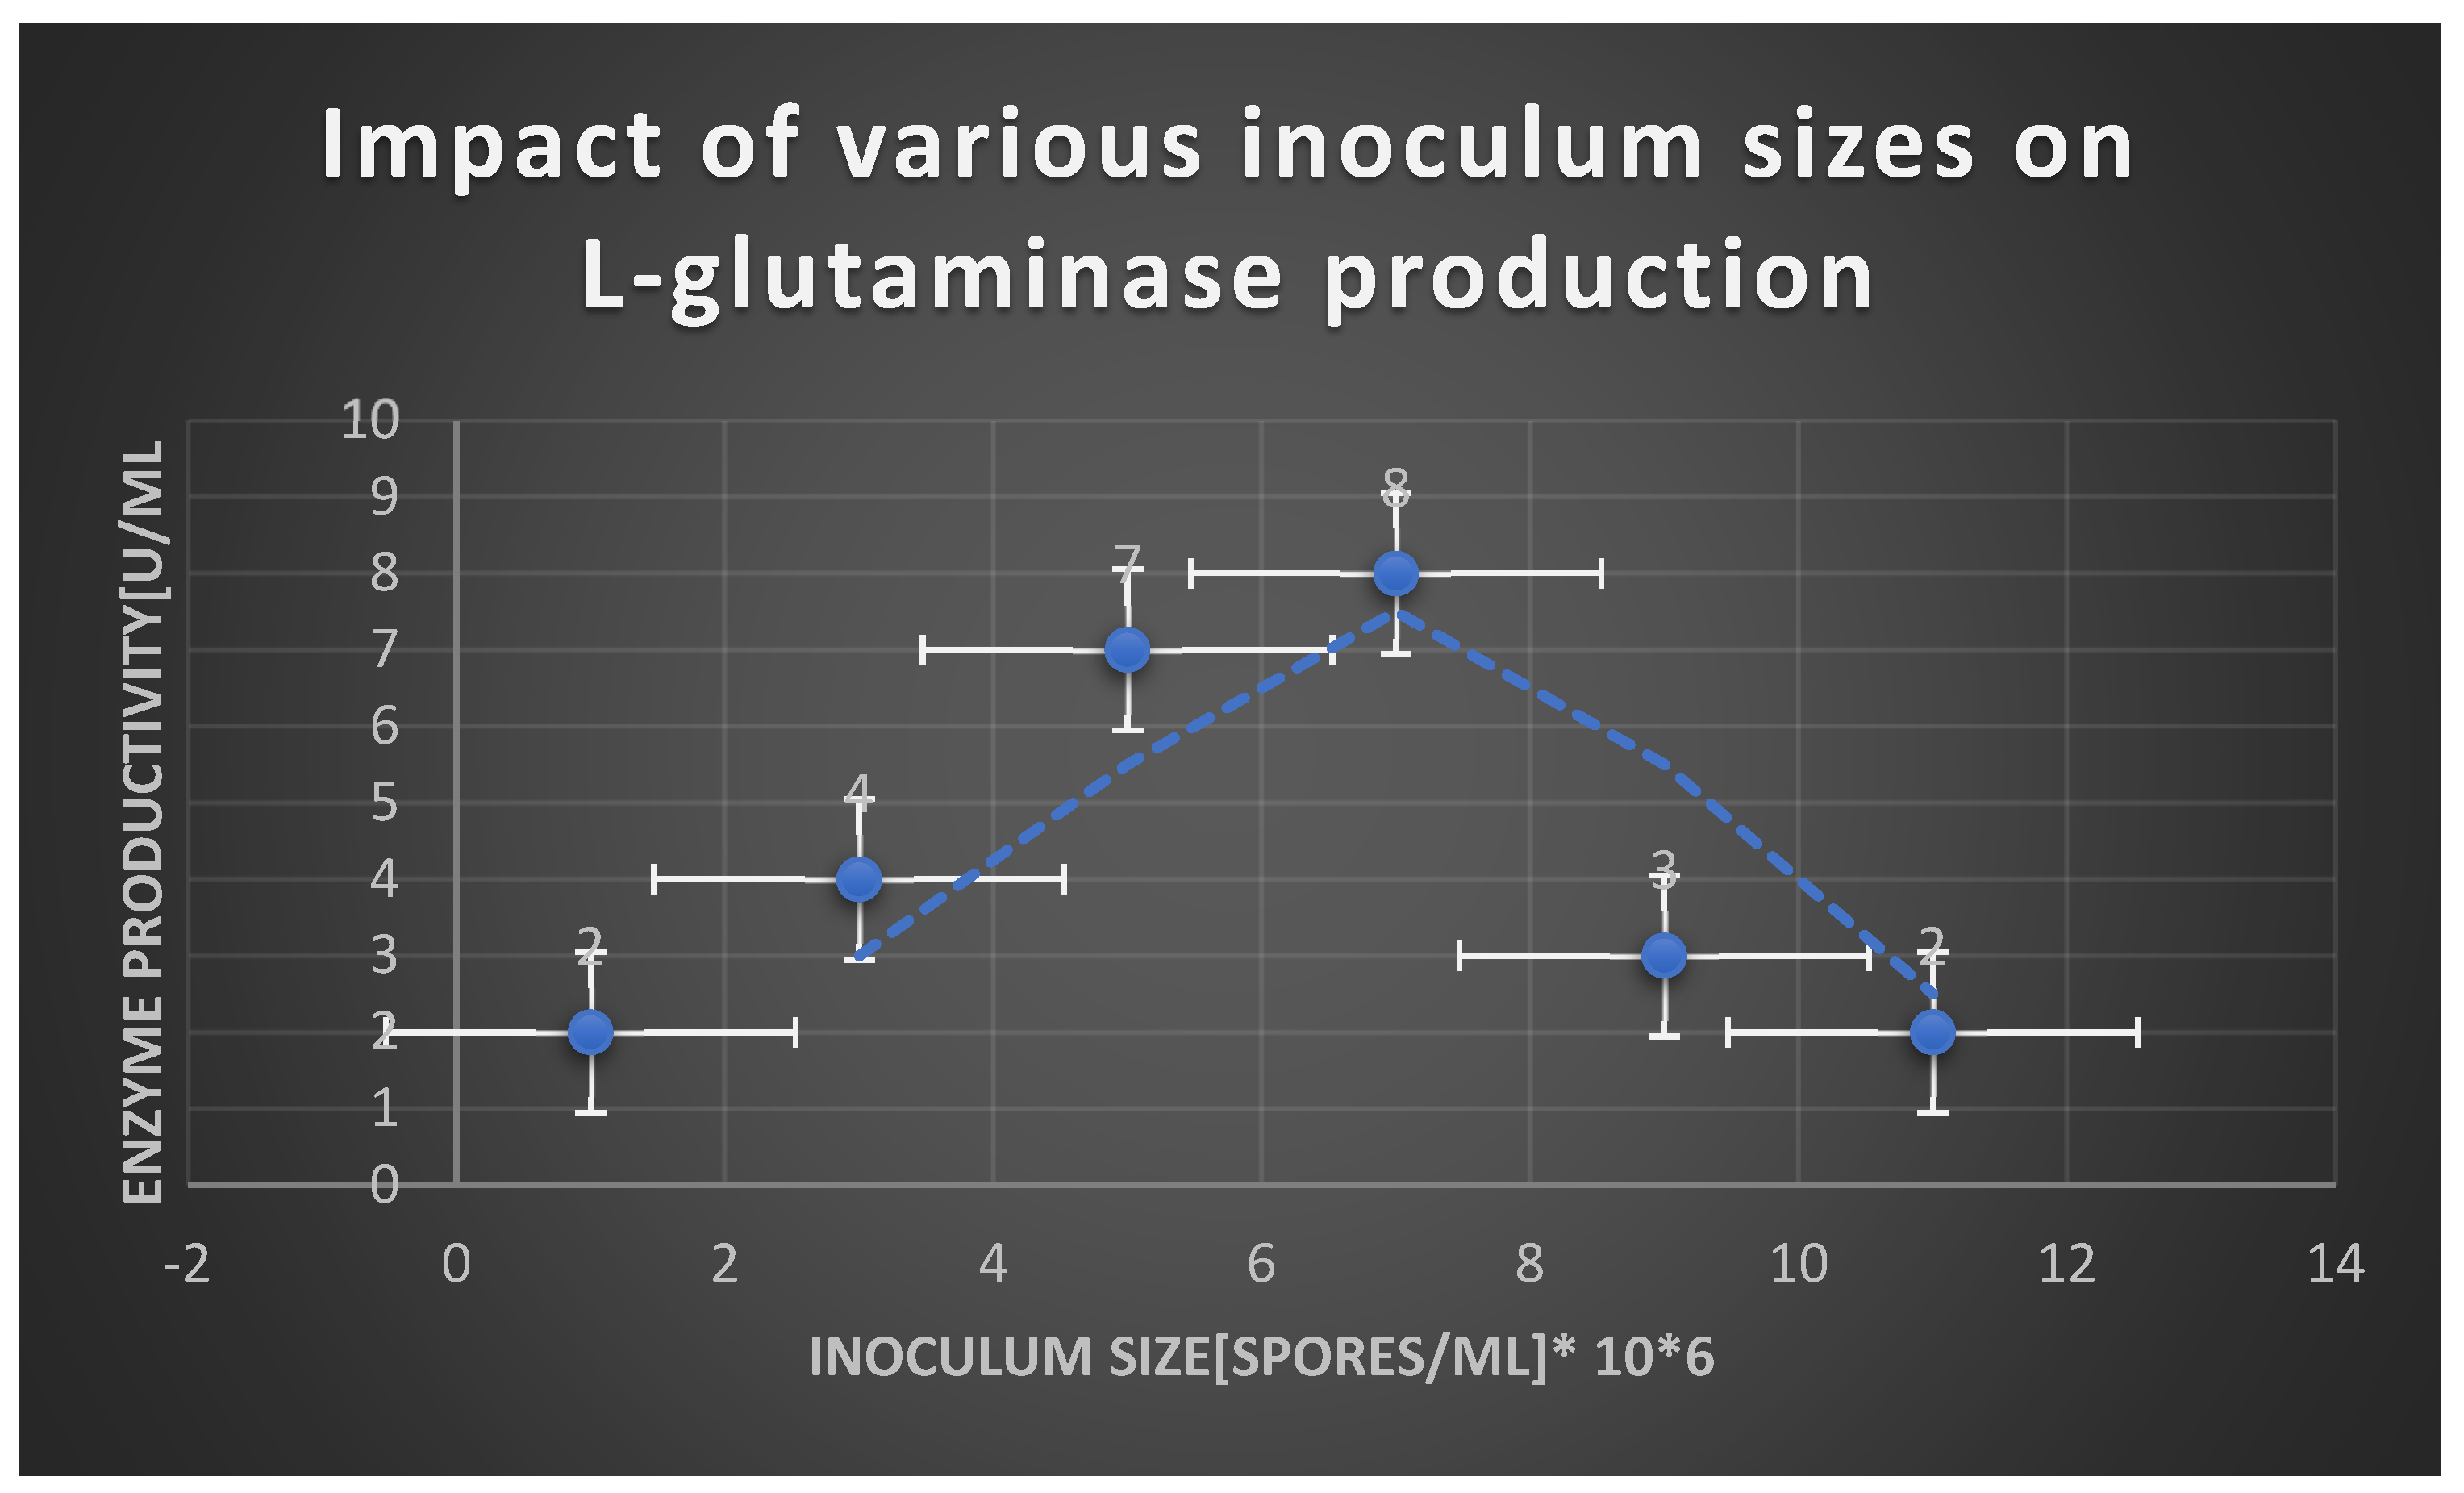
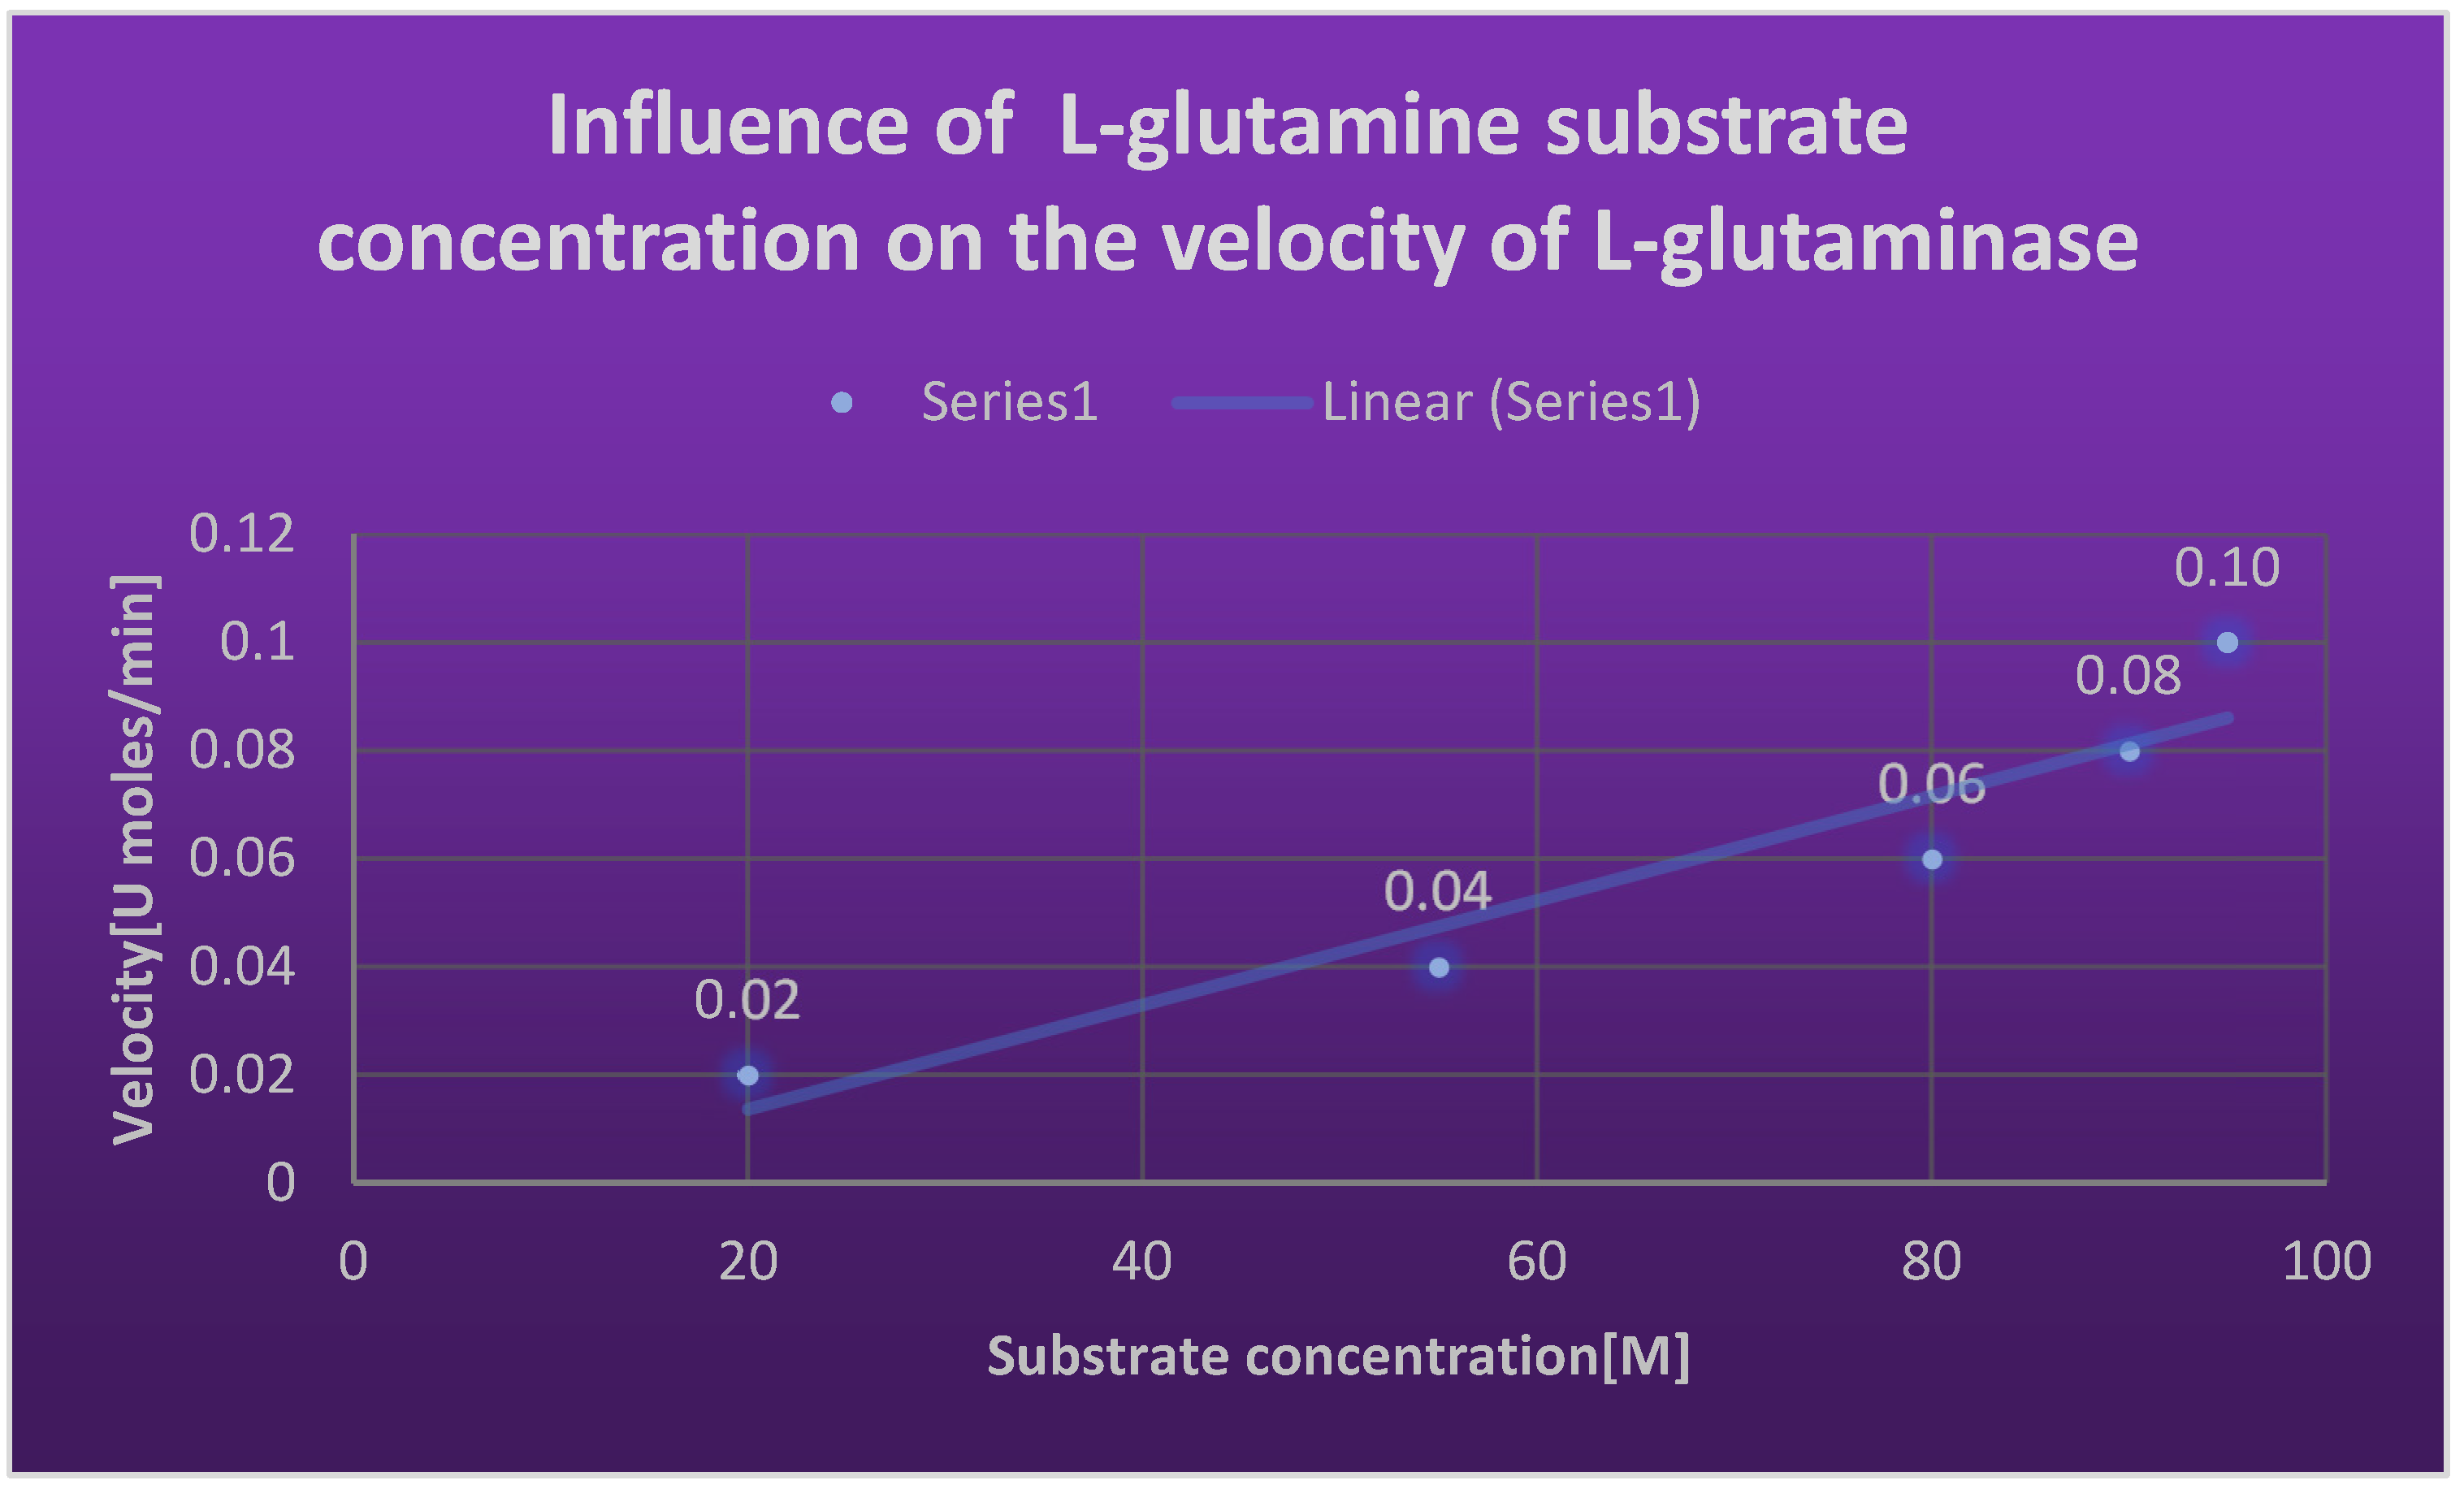
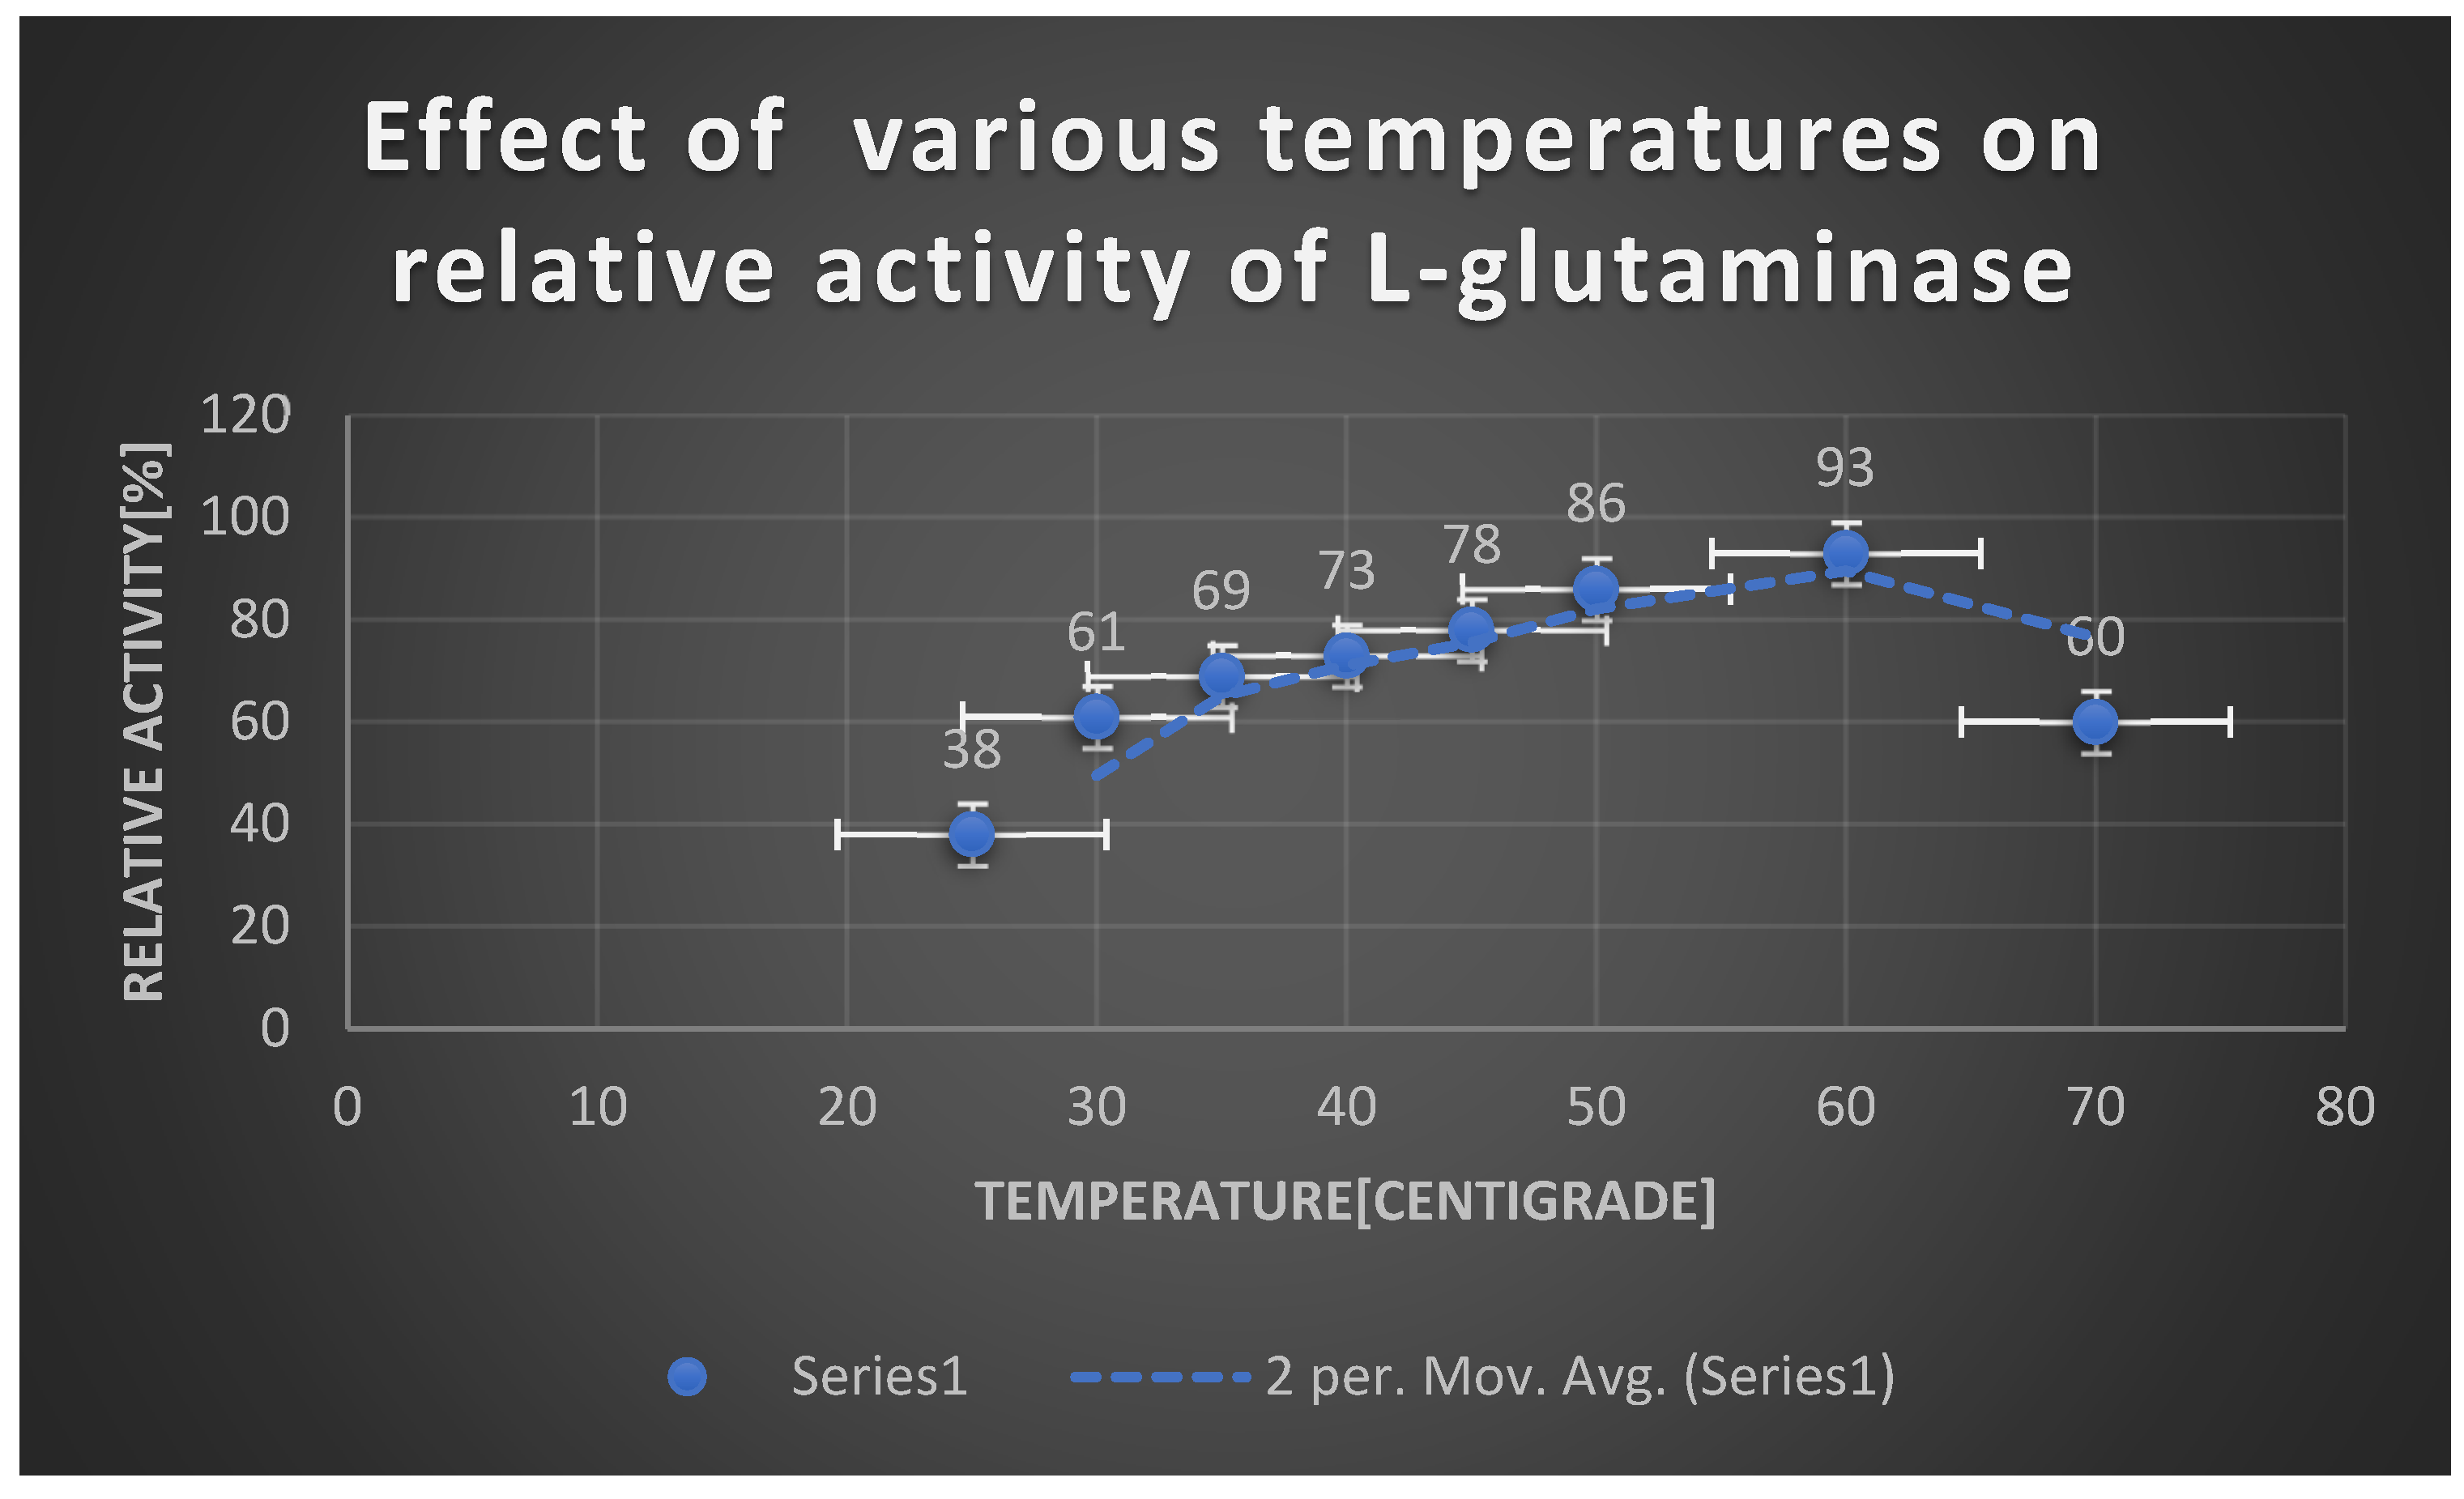
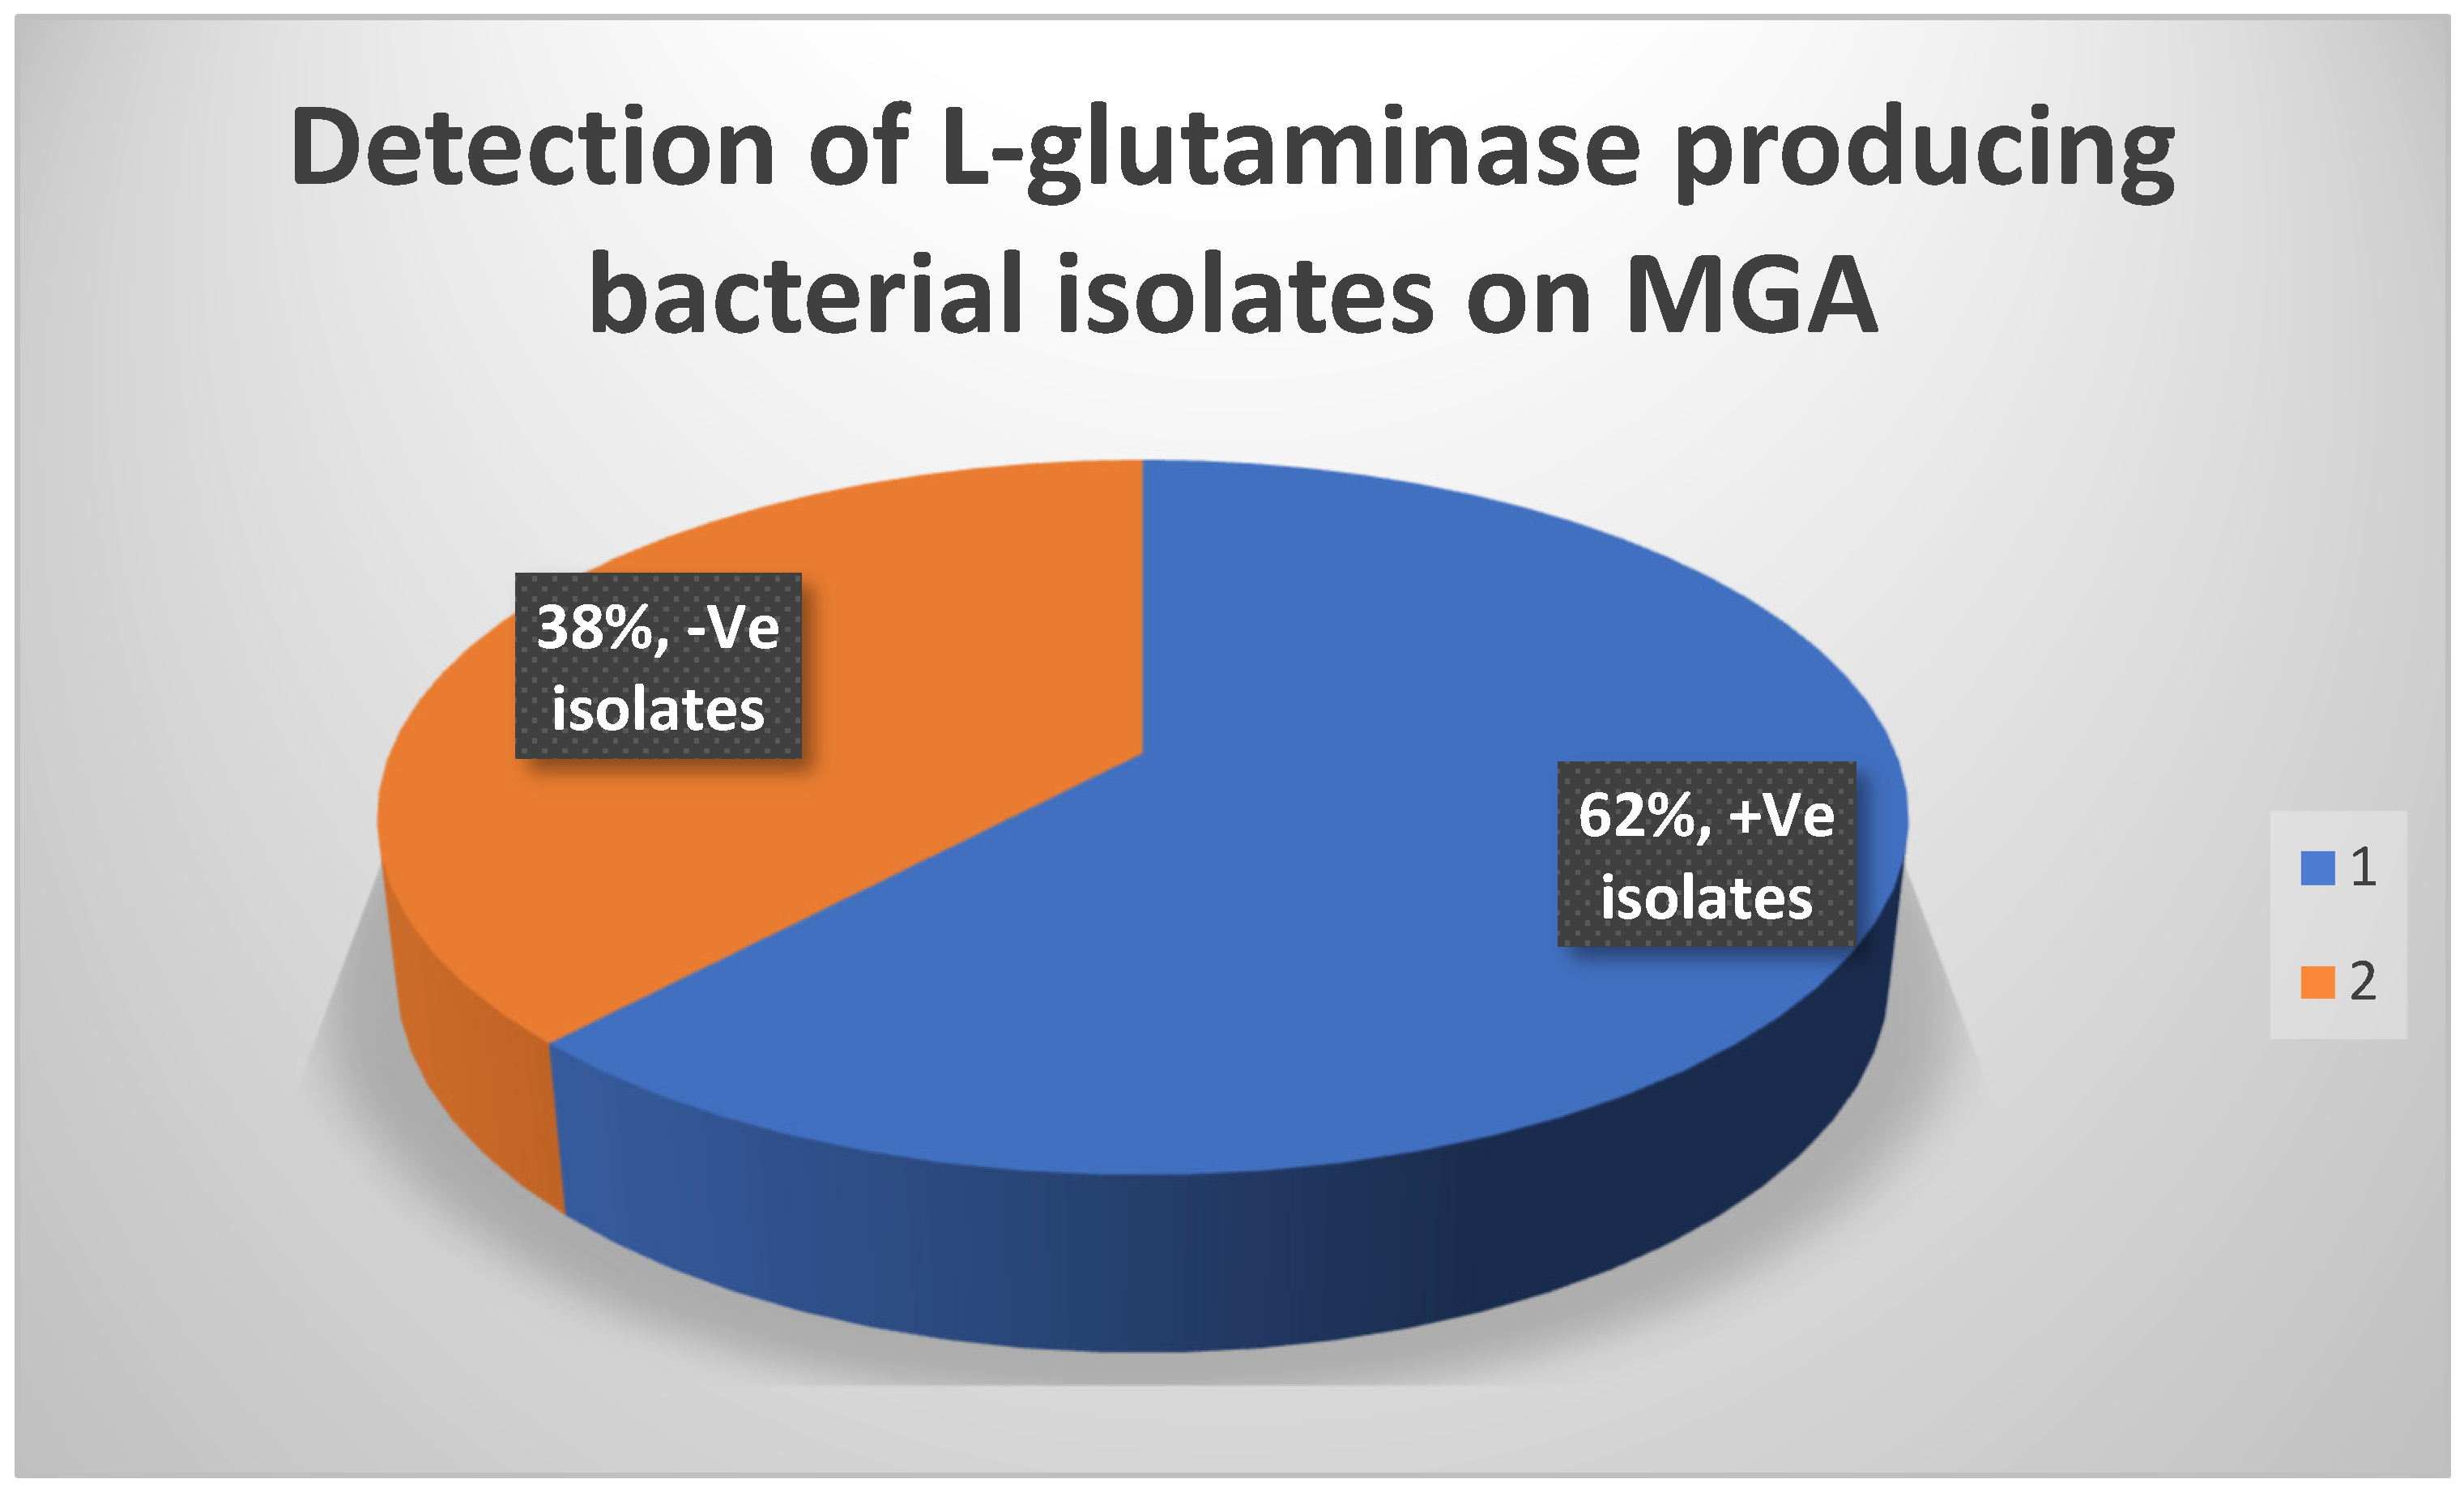
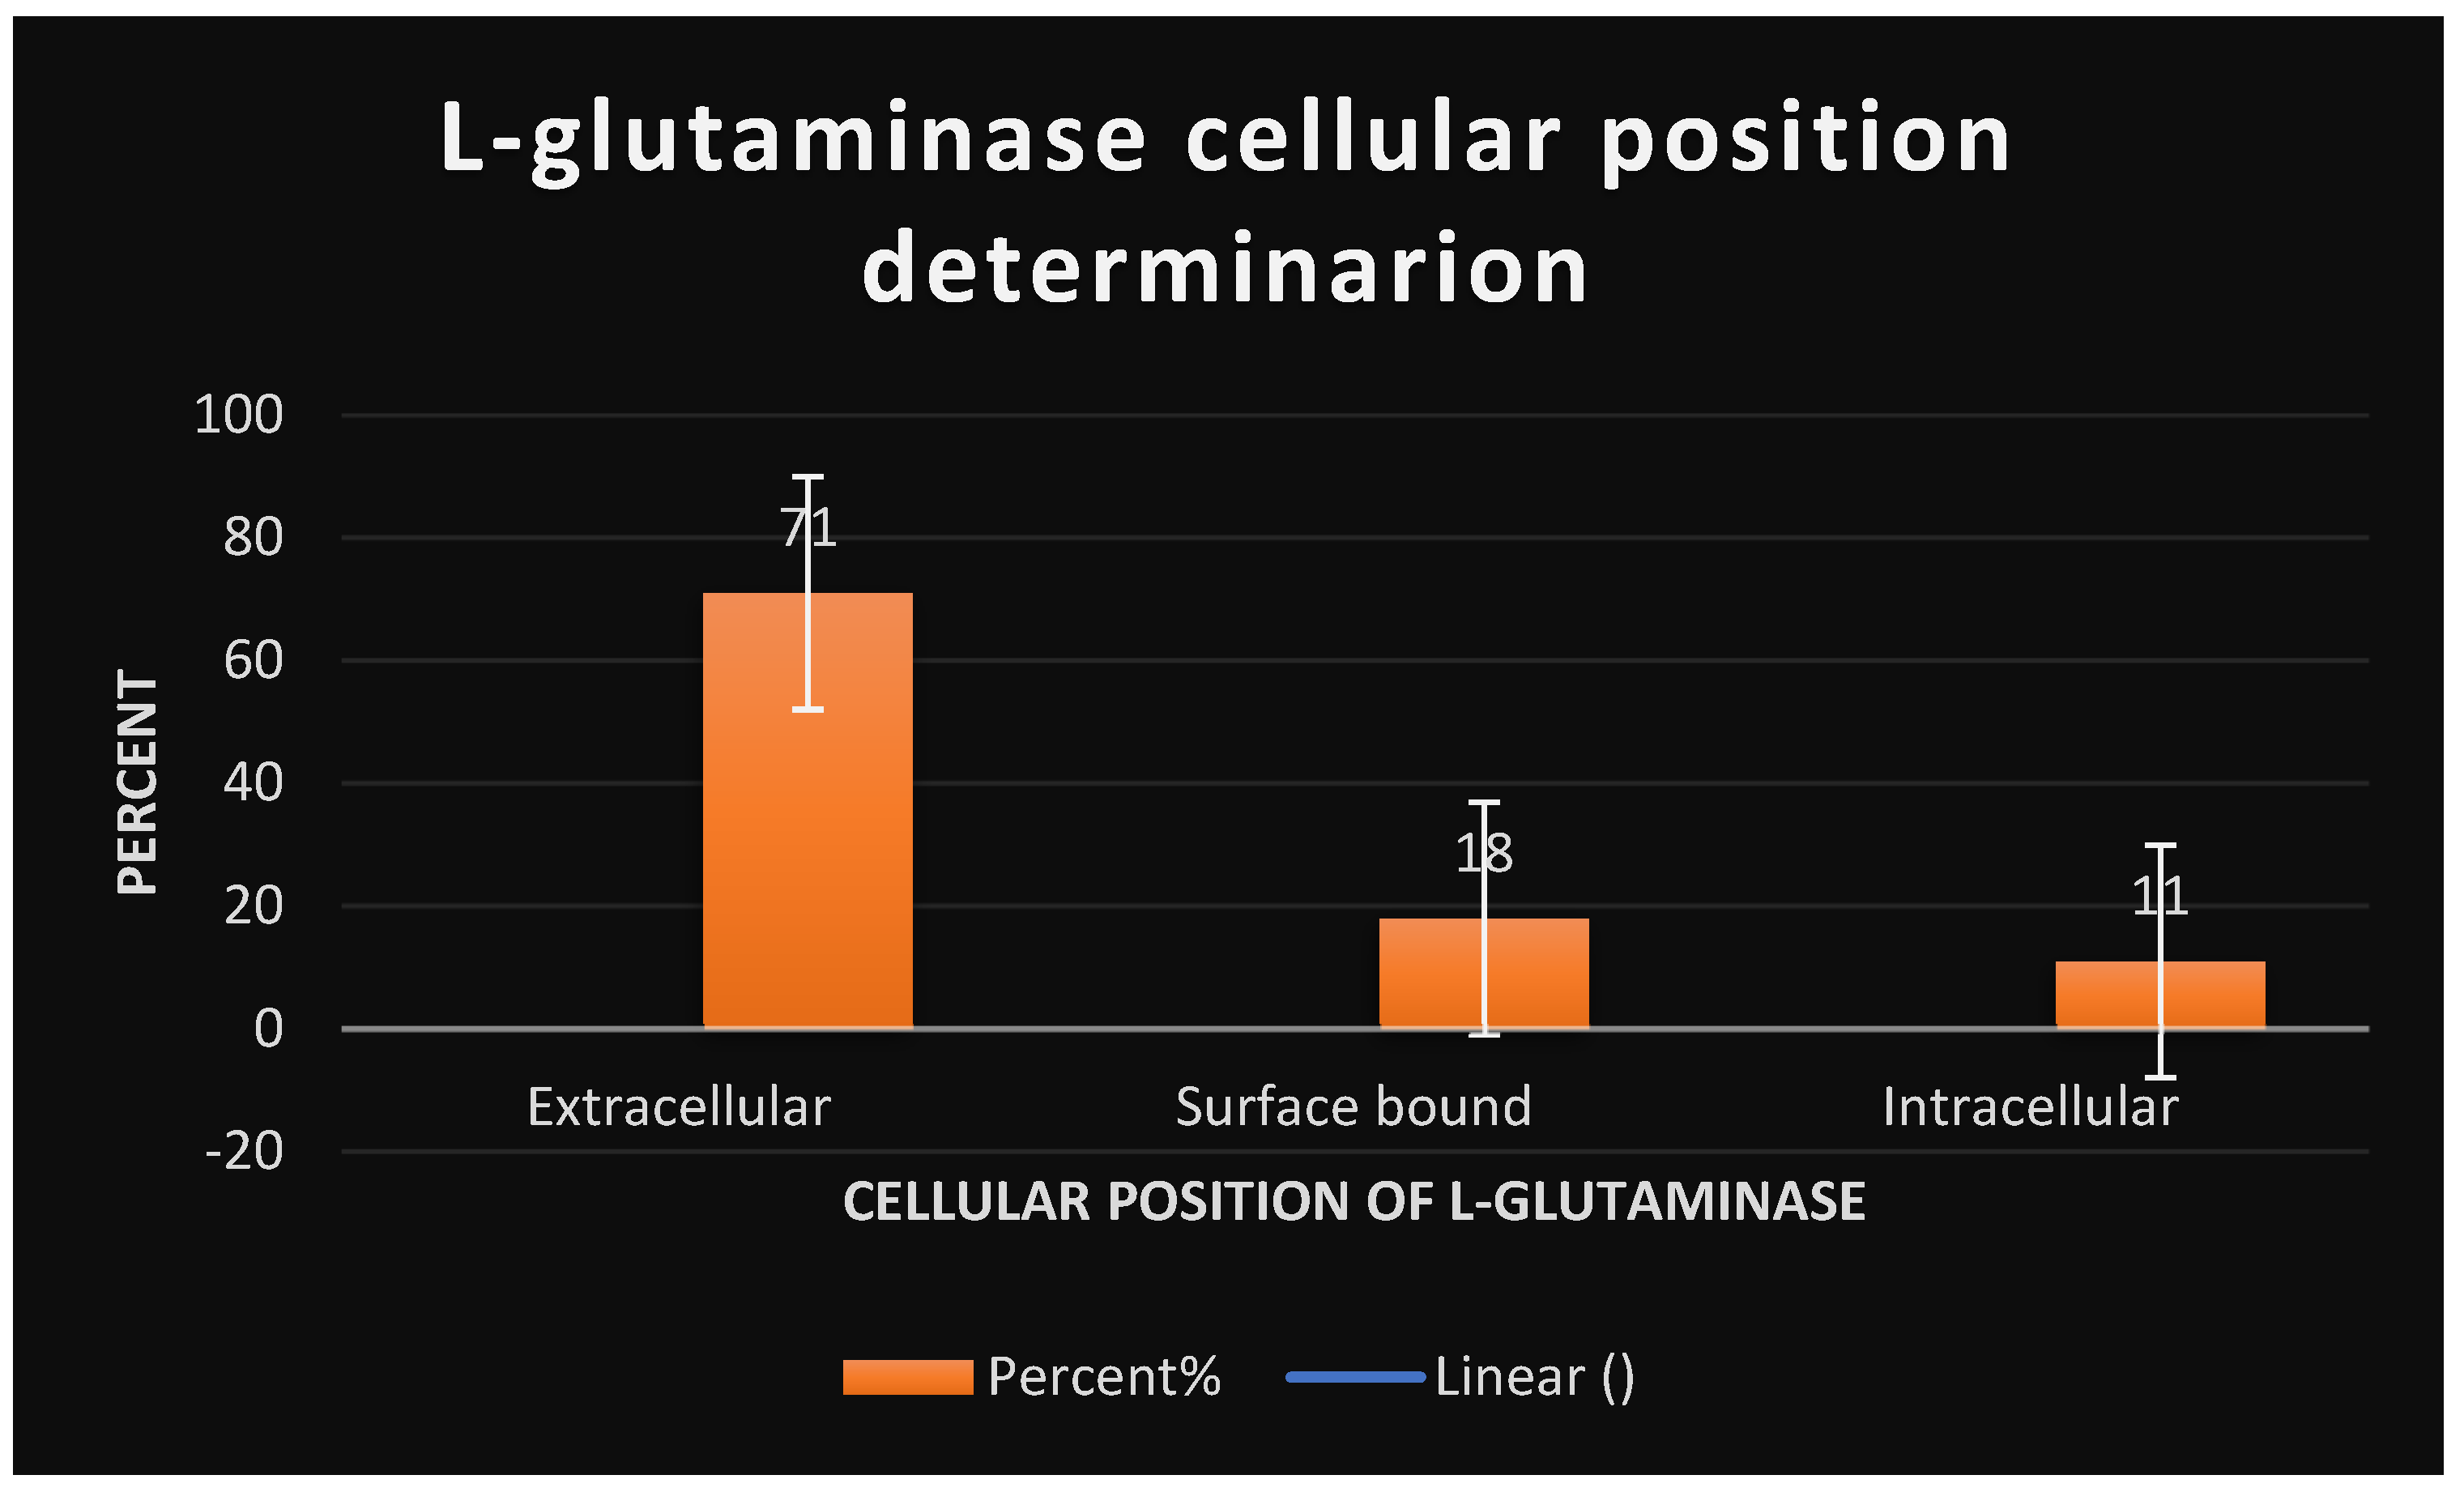
Table 4 displays the antioxidant activity of standard L-ascorbic acid as measured by the DPPH test. Table 5 displays the antioxidant activity of the test L-glutaminase as measured by the DPPH experiment. The findings of biochemical reactions are shown in Table 27. The influence of substrate concentration on L-glutaminase velocity is shown in Table 26. Table 6 illustrates the cytotoxicity of L-glutaminase on the Hela cervical cancer cell line. Table 7 indicates the detection of L-glutaminase cytotoxicity in the lymphocytic CCL4 cancer cell line. The impact of temperature on the relative activity of L-glutaminase is shown in Table 25. The cellular location of L-glutaminase was determined using the Nesslerization Assay, as shown in Table 23. The impact of PH on L-glutaminase activity is seen in Table 24. The incubation period for L-glutaminase synthesis is shown in Table 20. The growth of L-glutaminase-secreting bacterial isolates on MGA is shown in Table 22. The effect of varied inoculum sizes on L-glutaminase production is shown in Table 21. Table 8 indicates the detection of L-glutaminase cytotoxicity on the A-549 lung cancer cell line. The influence of different Nitrogen sources on L-glutaminase production is shown in Table 17. The influence of static and shaking settings on L-glutaminase production is shown in Table 19. Table 18 indicates the influence of PH on L-glutaminase production. Table 9 indicates the detection of L-glutaminase cytotoxicity on the MCF-7 breast cancer cell line. The cytotoxicity of L-glutaminase on the He-PG-Z hepatic cancer cell line is shown in Table 11. Table 10 indicates the detection of L-glutaminase cytotoxicity on the HCT-116 colon cancer cell line. Figure 1 depicts Bacillus cereus bacterial isolates that were shown to be positive on MGA. The effects of varying NaCl concentrations on L-glutaminase synthesis are shown in Table 16. Figure 6 depicts the 3D structure of L-glutaminase, which has 723 amino acids. The influence of different carbon sources on L-glutaminase production is shown in Table 12. The effect of varied incubation temperatures on L-glutaminase synthesis is shown in Table 14. Graph 1 depicts the antioxidant activity of the test L-glutaminase as measured by the DPPH experiment. The influence of varied incubation conditions on L-glutaminase production is shown in Table 13. Graph 23 depicts the detection of L-glutaminase cellular location using the Nesslerization test. Figure 5 shows the purification of L-glutaminase using a western blot after it was expressed using bacterial recombinant DNA technology. Gram-positive Bacilli-producing L-glutaminase is seen in Figure 2. Figure 4 depicts the plasmid expression vector used to produce L-glutaminase using bacterial recombinant DNA technology. Figure 3 depicts a positive catalase test with Bacillus sp isolates on MGA. Graph 2 depicts the antioxidant activity of standard L-ascorbic acid as measured by the DPPH test. The development of L-glutaminase-secreting bacterial isolates on metallic glutamine agar media is depicted in Graph 22. Graph 20 depicts the influence of temperature on the relative activity of L-glutaminase. Graph 19 depicts the influence of substrate concentration on L-glutaminase velocity. Graph 21 depicts the influence of PH on L-glutaminase activity. Graph 5 depicts the detection of L-glutaminase cytotoxicity on the MCF-7 breast cancer cell line. The cytotoxicity of L-glutaminase on the HePG-Z hepatic cancer cell line is shown in Graph 3. Graph 8 depicts the detection of L-glutaminase cytotoxicity on the Hela cervical cancer cell line. Graph 6 demonstrates the detection of L-glutaminase cytotoxicity on the A-549 lung cancer cell line. Graph 9 depicts the impact of various carbon sources on L-glutaminase production. Graph 11 depicts the influence of various incubation temperatures on L-glutaminase synthesis. Graph 7 depicts the cytotoxicity of L-glutaminase on a lymphocytic CCL4 cancer cell line. The effect of varied inoculum sizes on L-glutaminase production is seen in Graph 18. The influence of static and shaking circumstances on L-glutaminase production is shown in Graph 16. Graph 17 shows the incubation time for L-glutaminase synthesis. The effect of varied incubation conditions [dark and light] on L-glutaminase production is shown in Graph 10. Graph 15 shows the influence of varying PH on L-glutaminase production. The effects of varying NaCl concentrations on L-glutaminase synthesis are depicted in Graph 13. The impact of various metal ions on L-glutaminase cytotoxicity is depicted in Graph 12. The effect of different Nitrogen sources on L-glutaminase synthesis is seen in Graph 14. Table 28 displays the formulation of L-glutaminase as a sterile solution at PH 7.
Figure 1. It shows positive Bacillus cereus bacterial isolates on MGA.
Preprints 106636 g001
Figure 2. Gram positive Bacilli.
Preprints 106636 g002
Figure 3. Positive catalase test with positive bacterial Bacillus sp isolates on MGA.
Preprints 106636 g003
Figure 4. It shows the plasmid expression vector utilized during the expression of L-glutaminase via bacterial recombinant DNA technology.
Preprints 106636 g004
Figure 5. It displays western blot purification of L-glutaminase after its expression via bacterial recombinant DNA technology.
Preprints 106636 g005
Figure 6. It represents 3D structure of L-glutaminase with 723 amino-acids sequence.
Preprints 106636 g006
Graph 1. Antioxidant activity of test L-glutaminase via DPPH assay.
Preprints 106636 g007
Graph 2. Antioxidant activity of standard L-ascorbic acid via DPPH assay.
Preprints 106636 g008
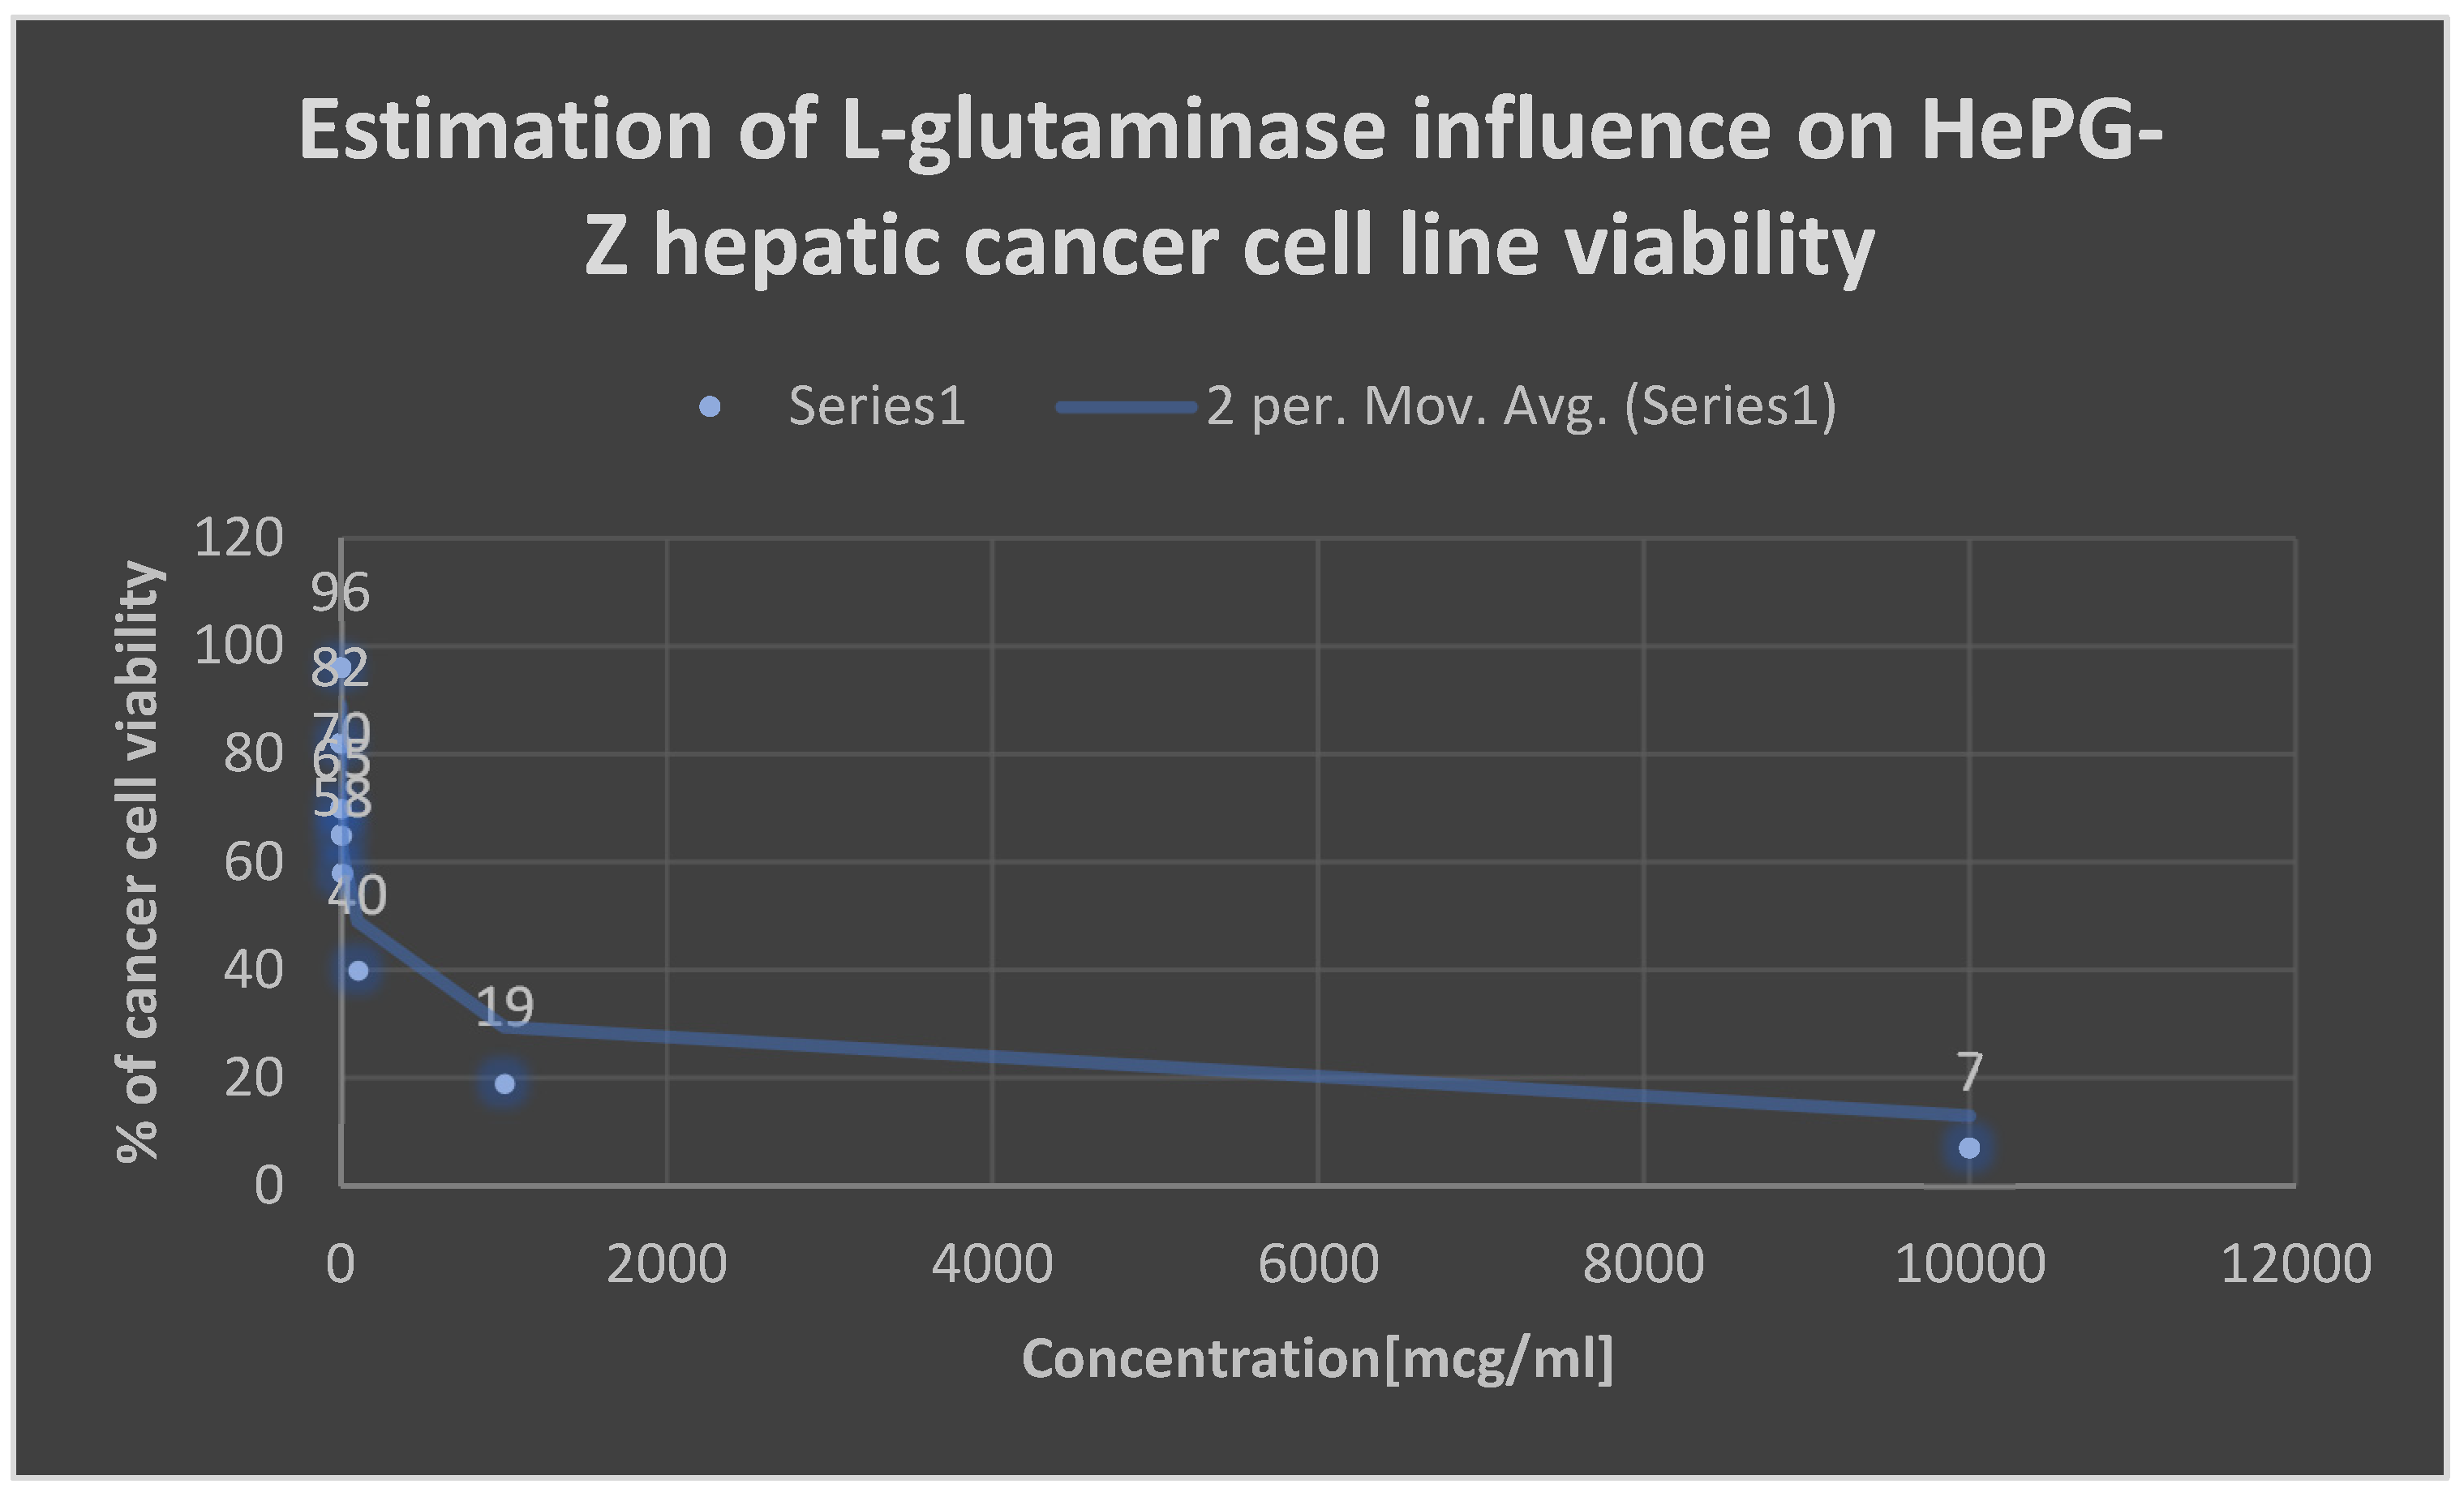
Graph 3. Detection of the cytotoxicity of L-glutaminase on HePG-Z hepatic carcinoma cell line.
Preprints 106636 g009
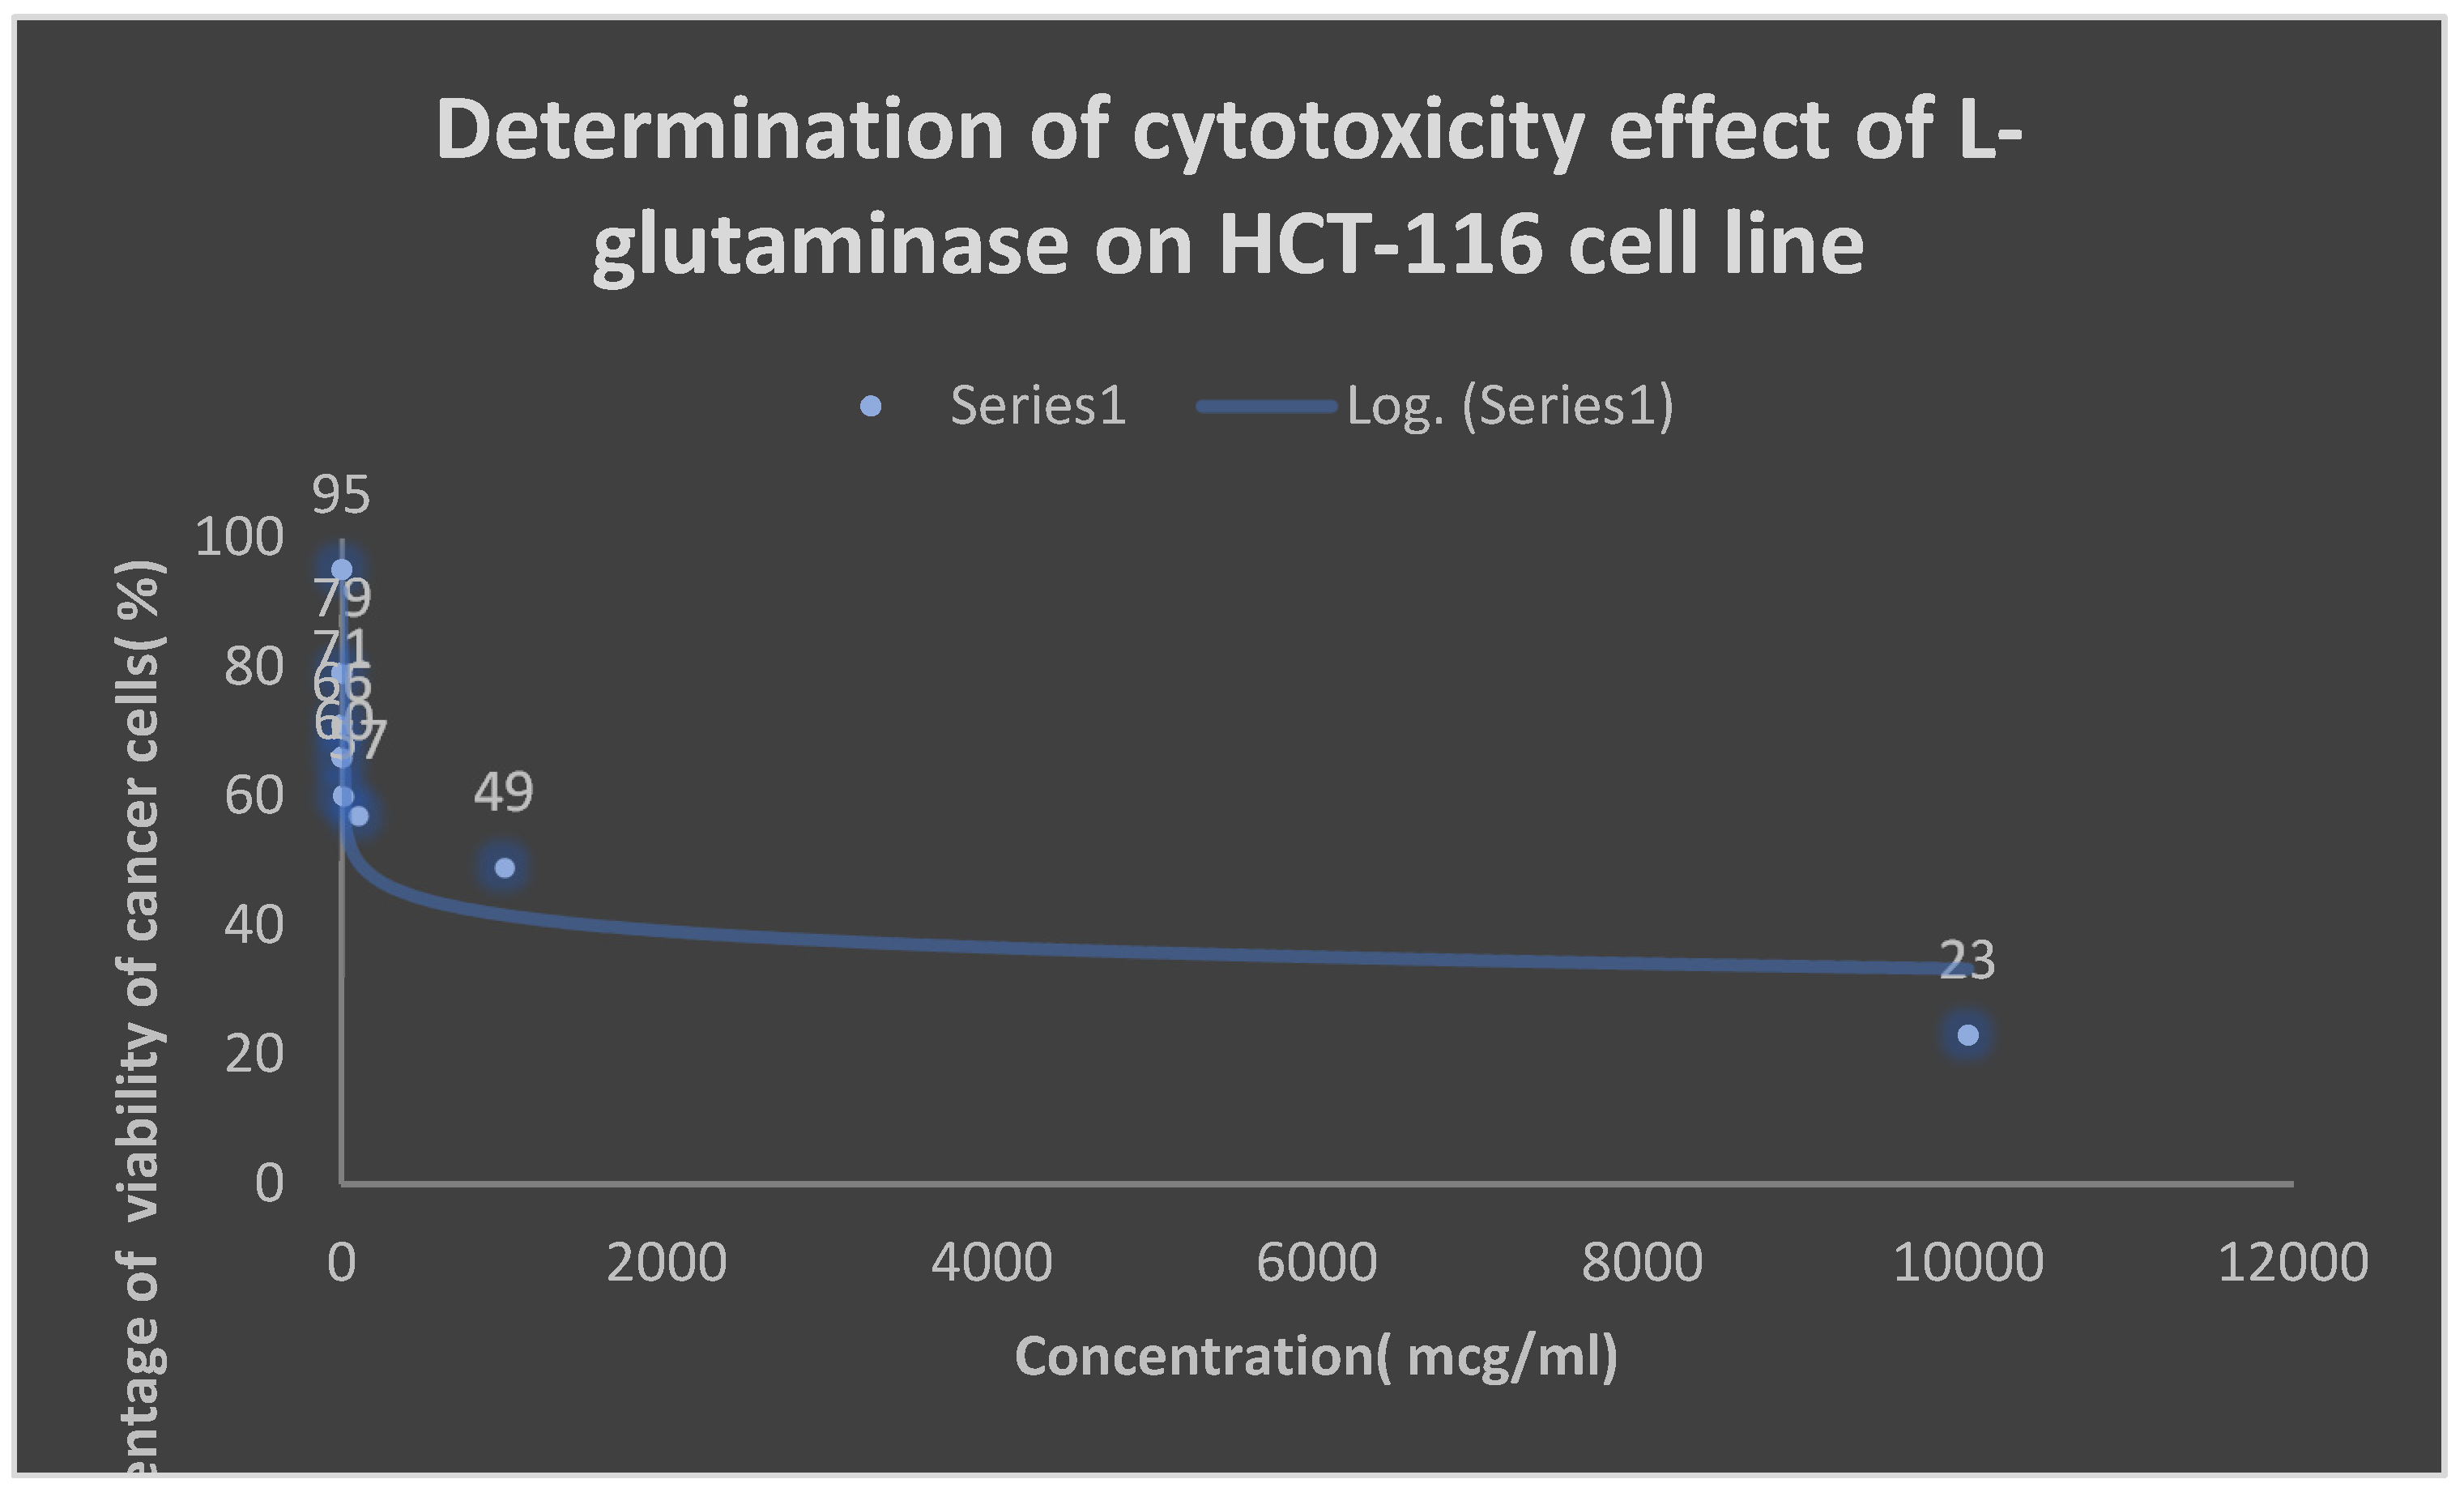
Graph 4. Detection of the cytotoxicity of L-glutaminase on HCT-116 colon cancer cell line.
Preprints 106636 g010
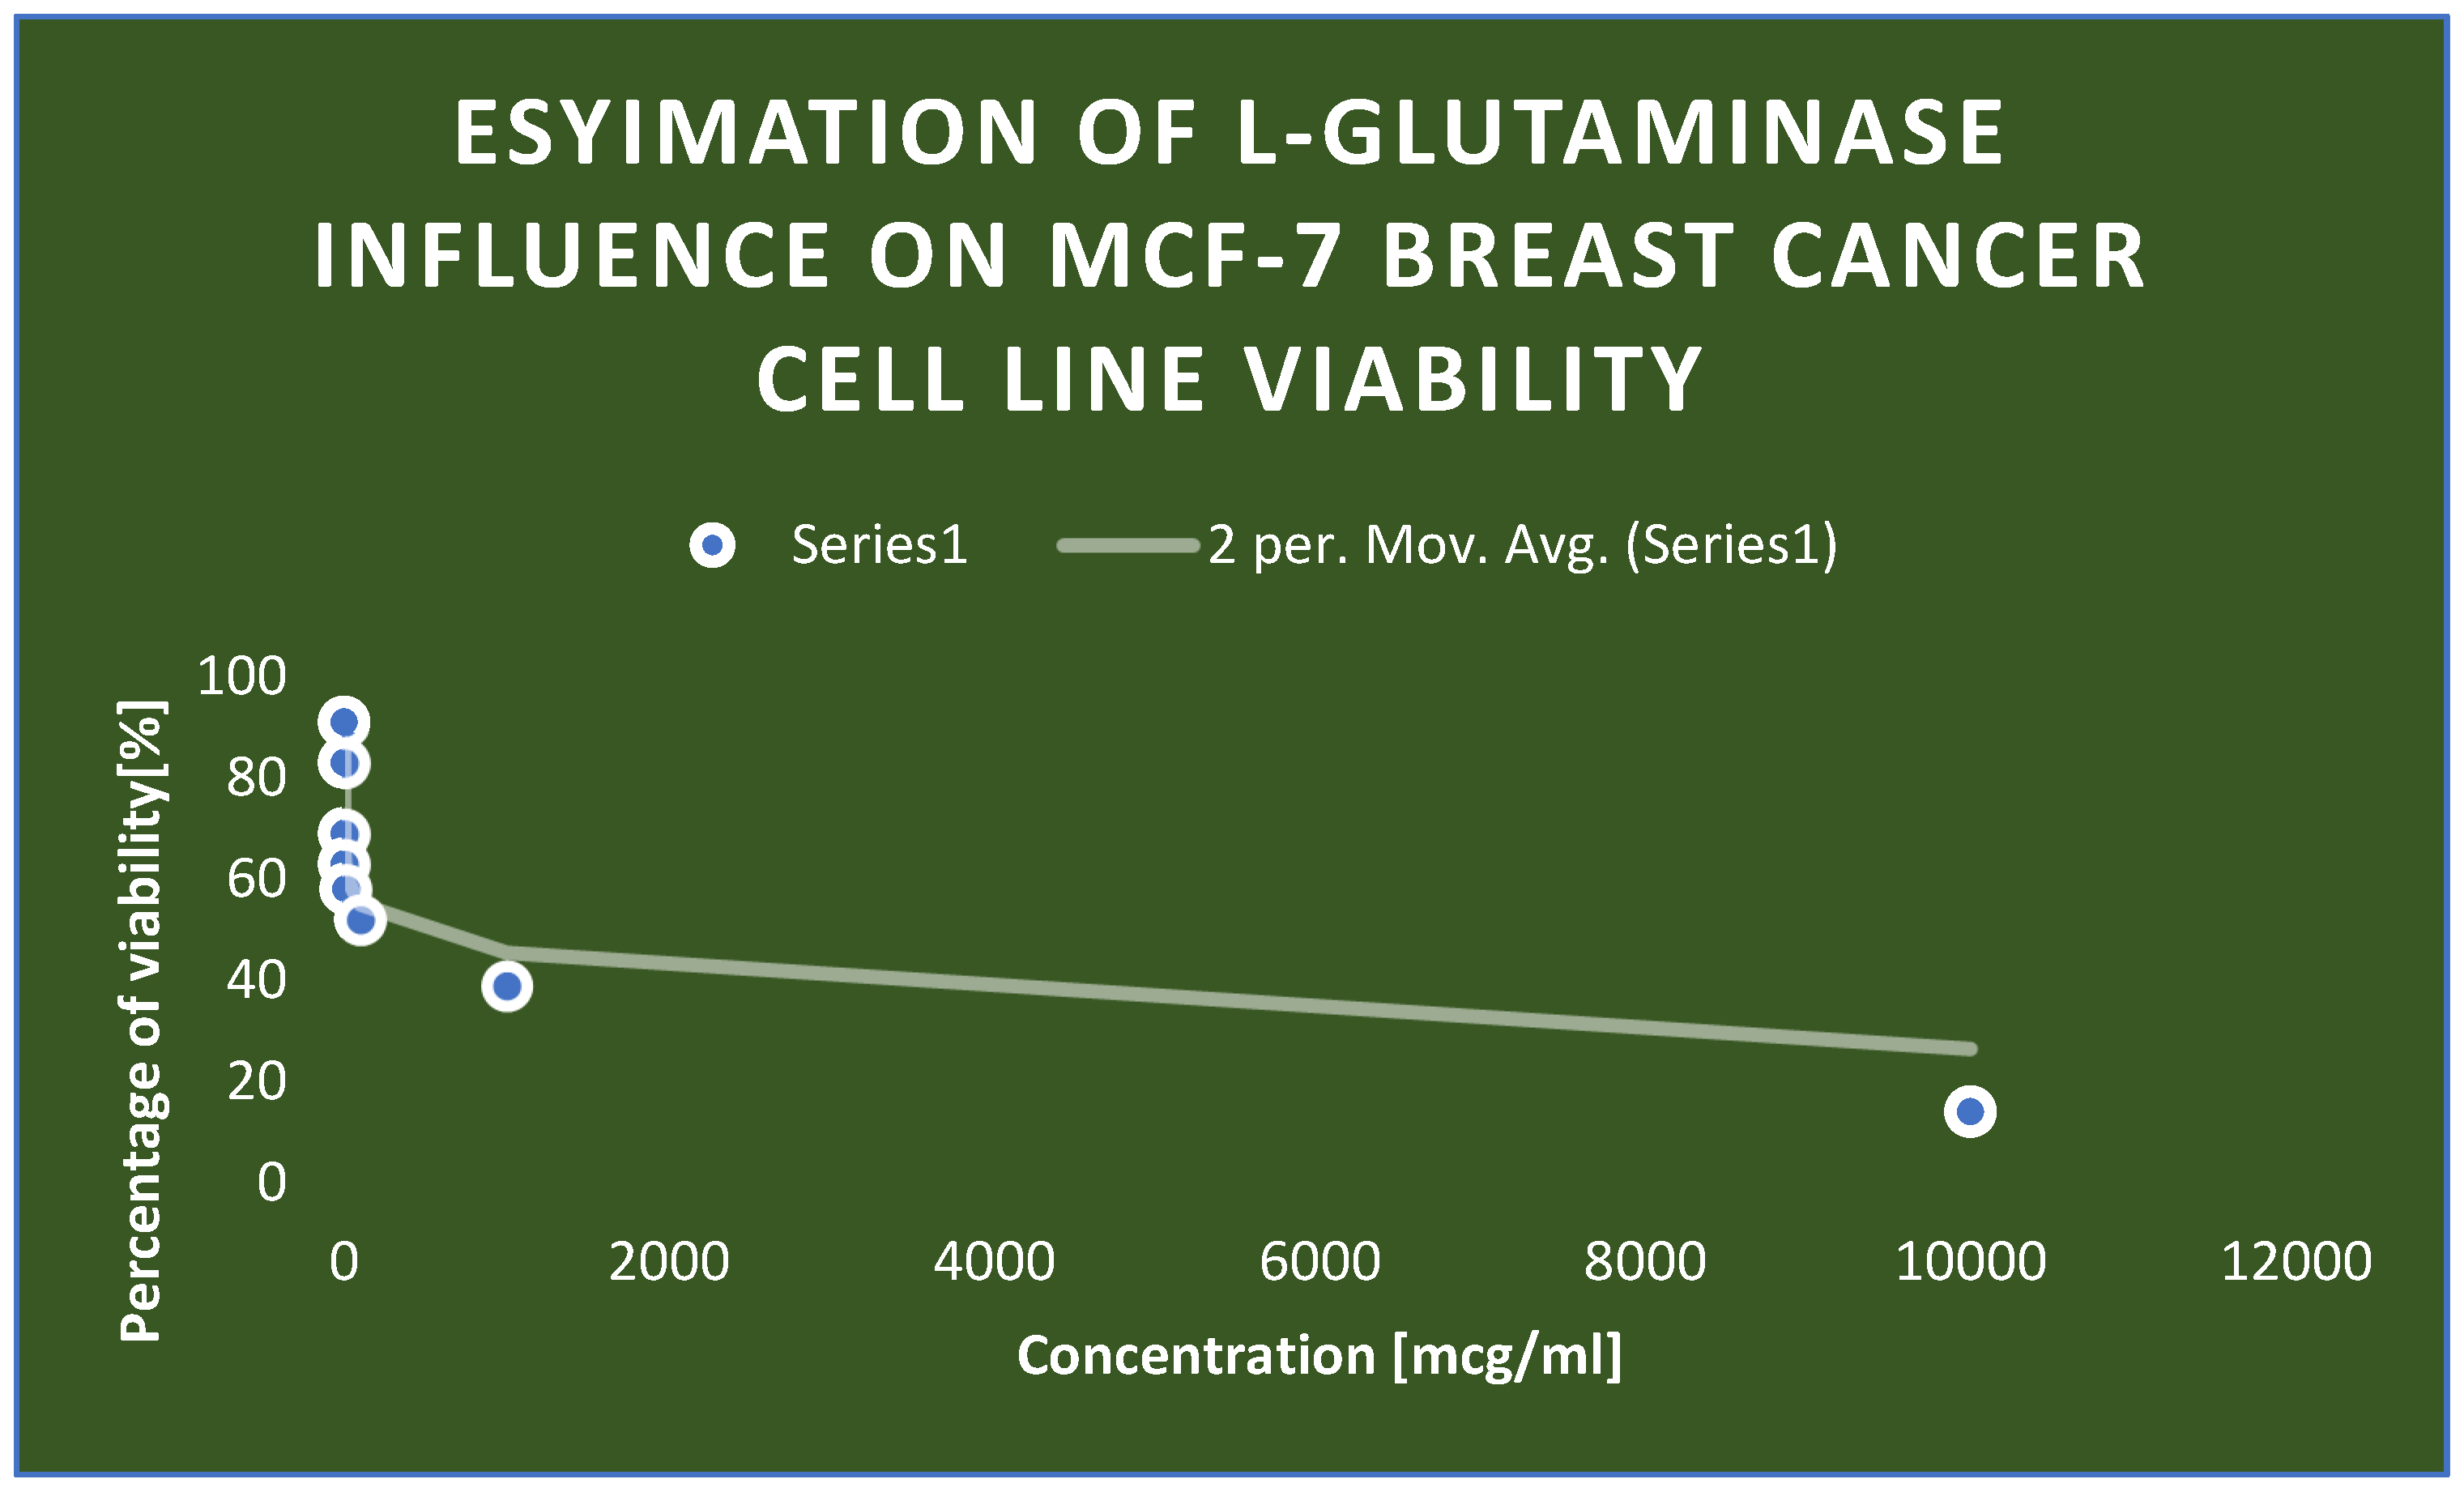
Graph 5. Detection of the cytotoxicity of L-glutaminase on MCF-7 breast cancer cell line.
Preprints 106636 g011
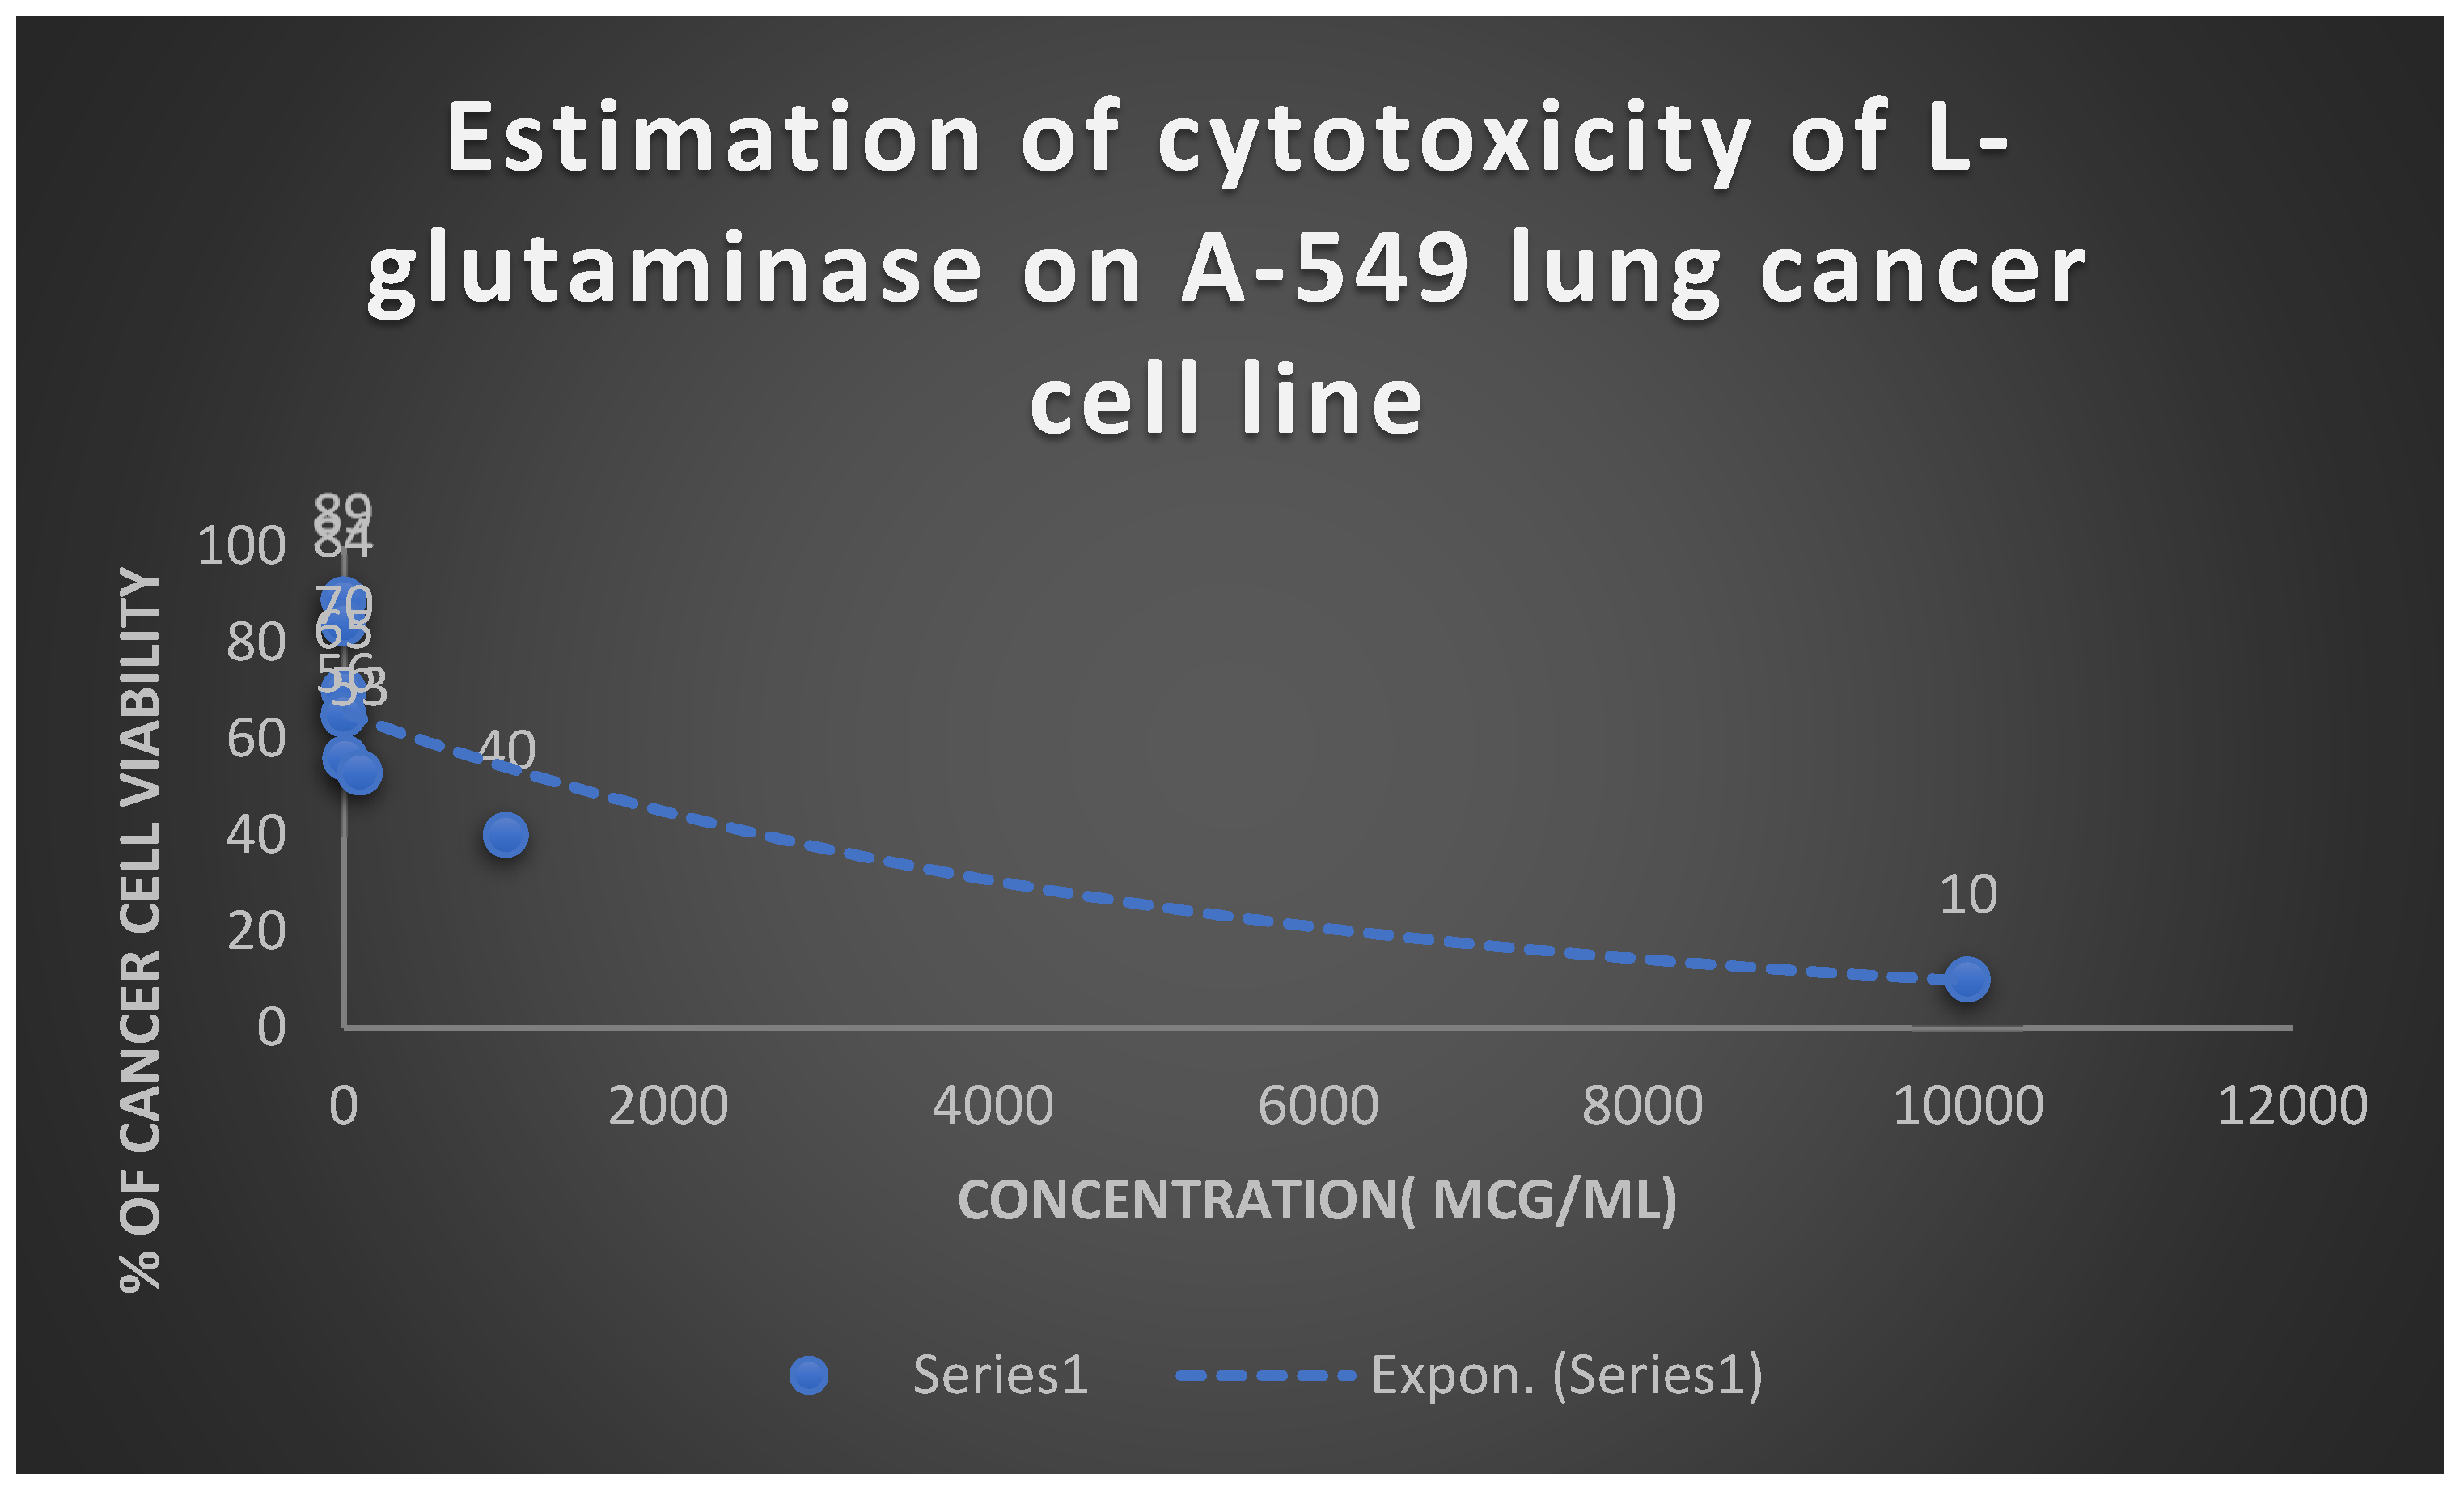
Graph 6. Detection of the cytotoxicity of L-glutaminase on A-549 lung cancer cell line.
Preprints 106636 g012
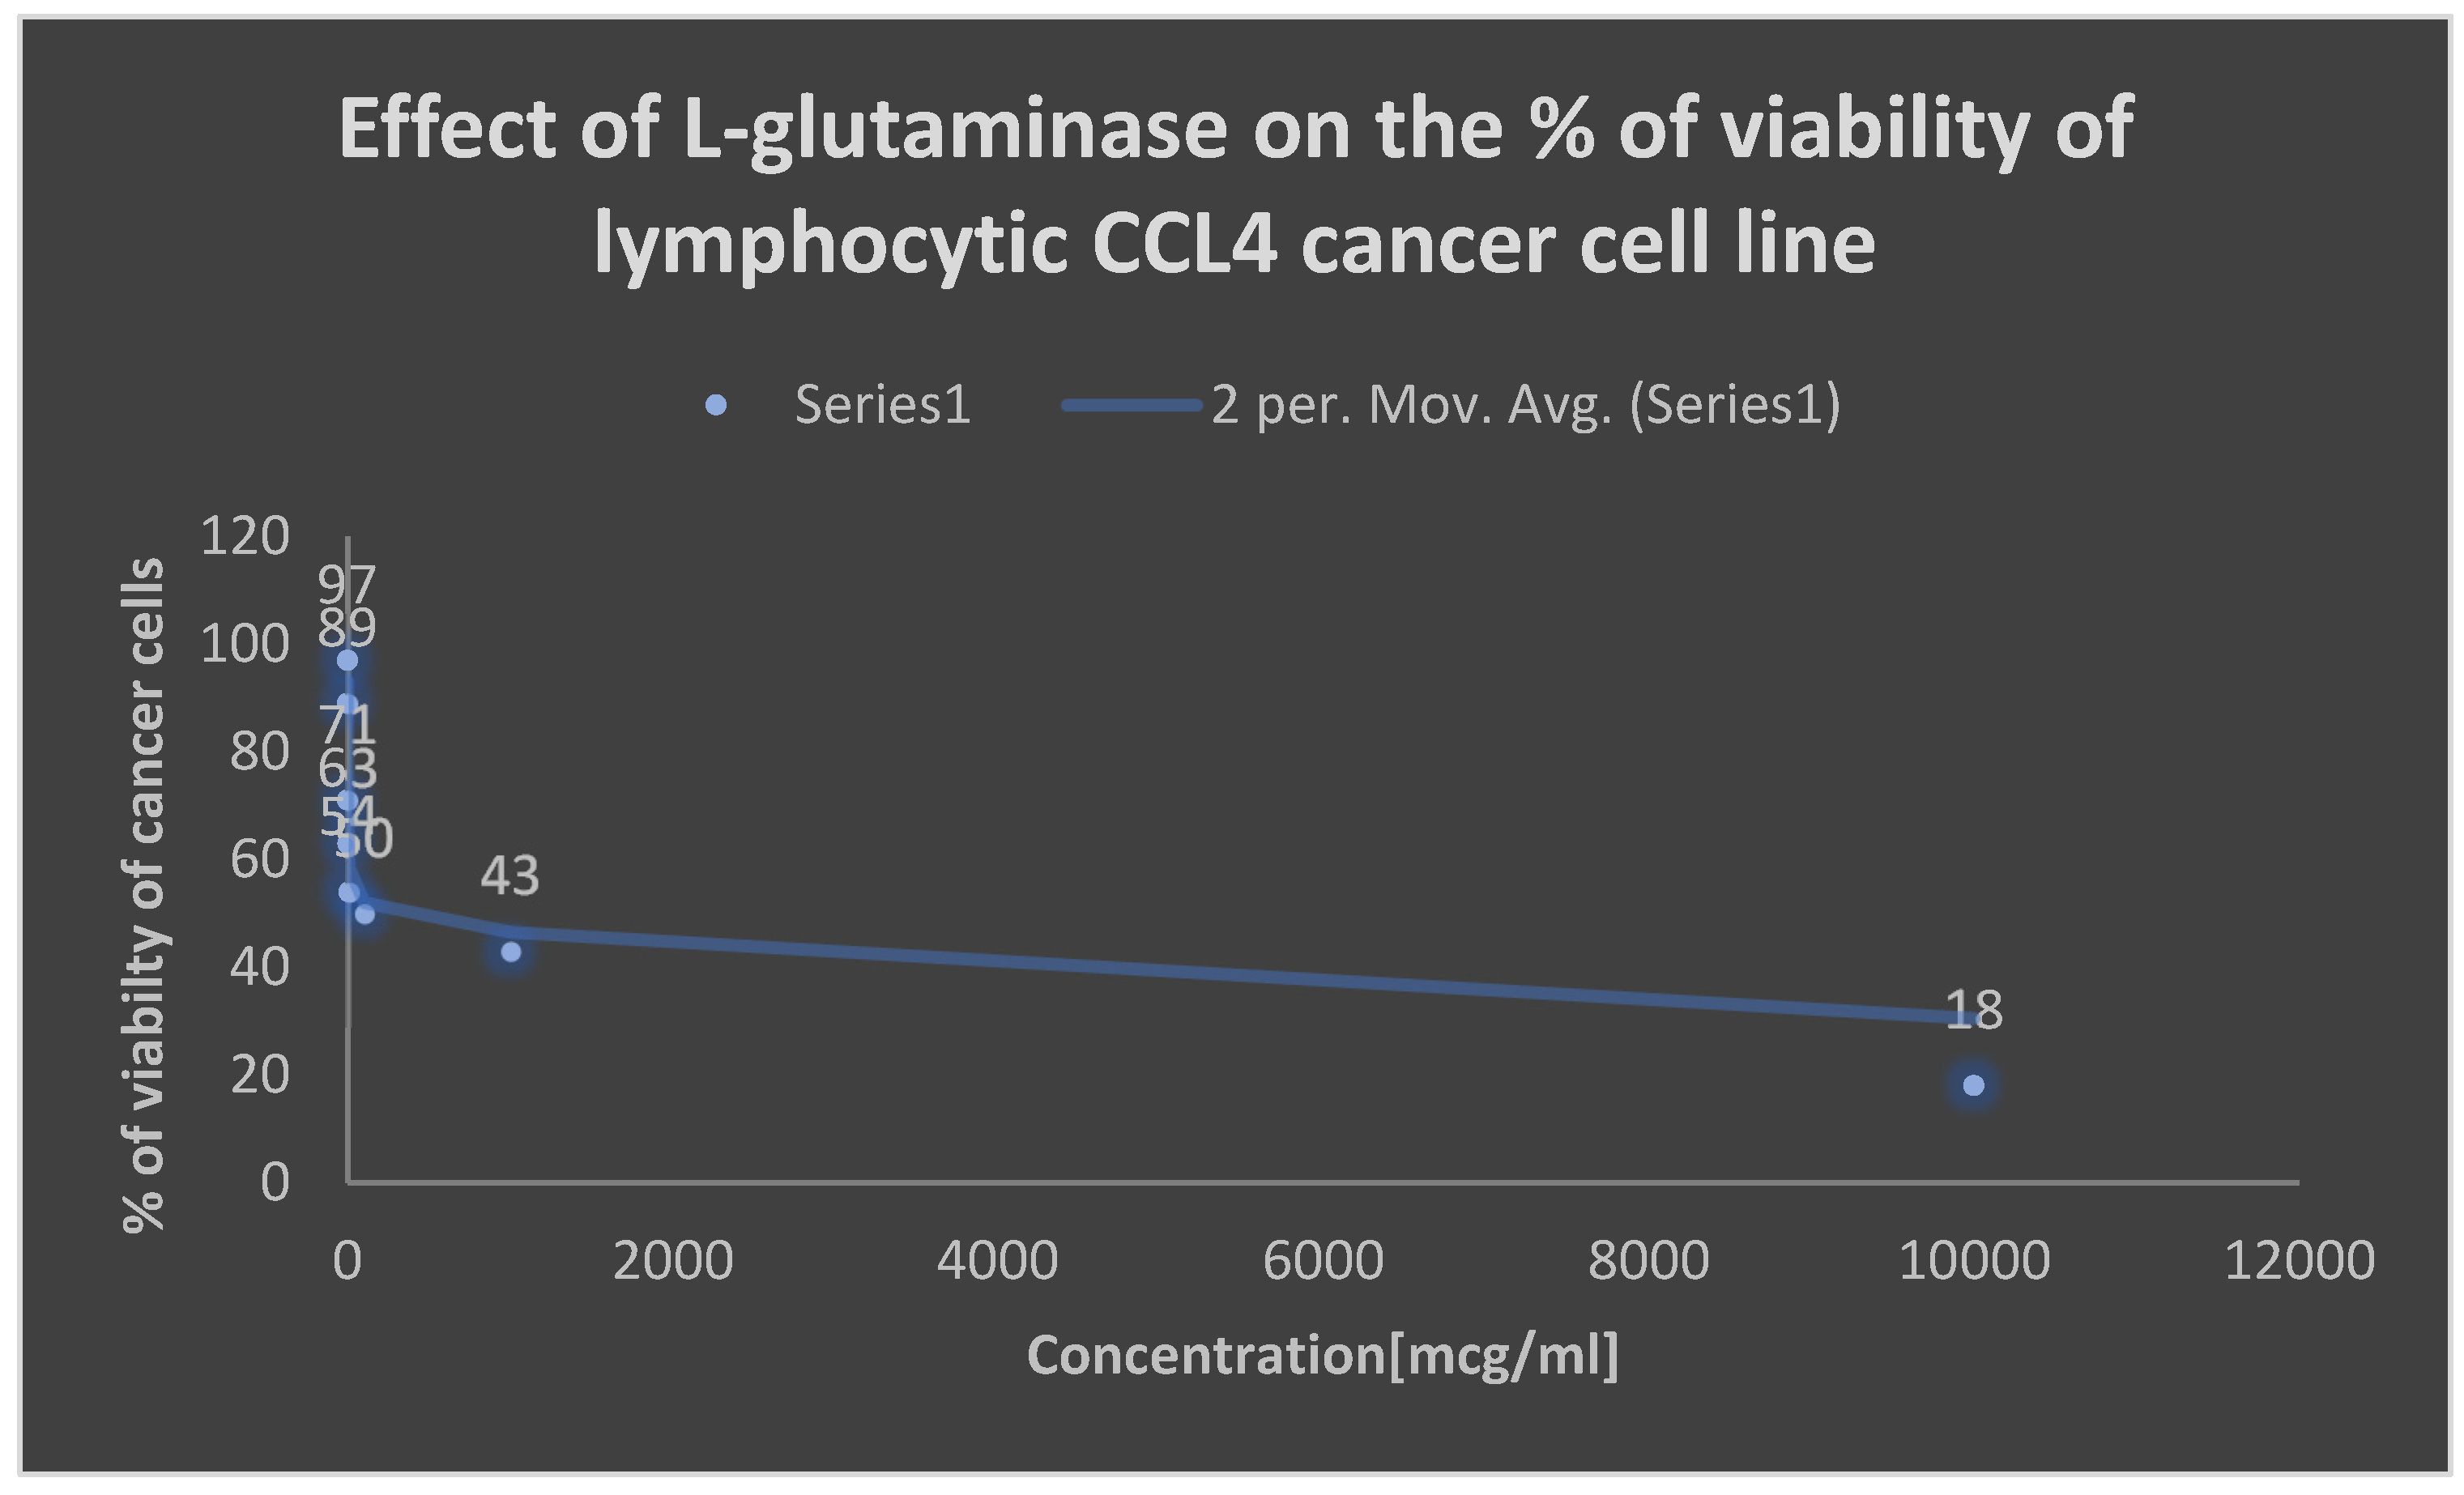
Graph 7. Detection of the cytotoxicity of L-glutaminase on lymphocytic CCL4 cancer cell line.
Preprints 106636 g013
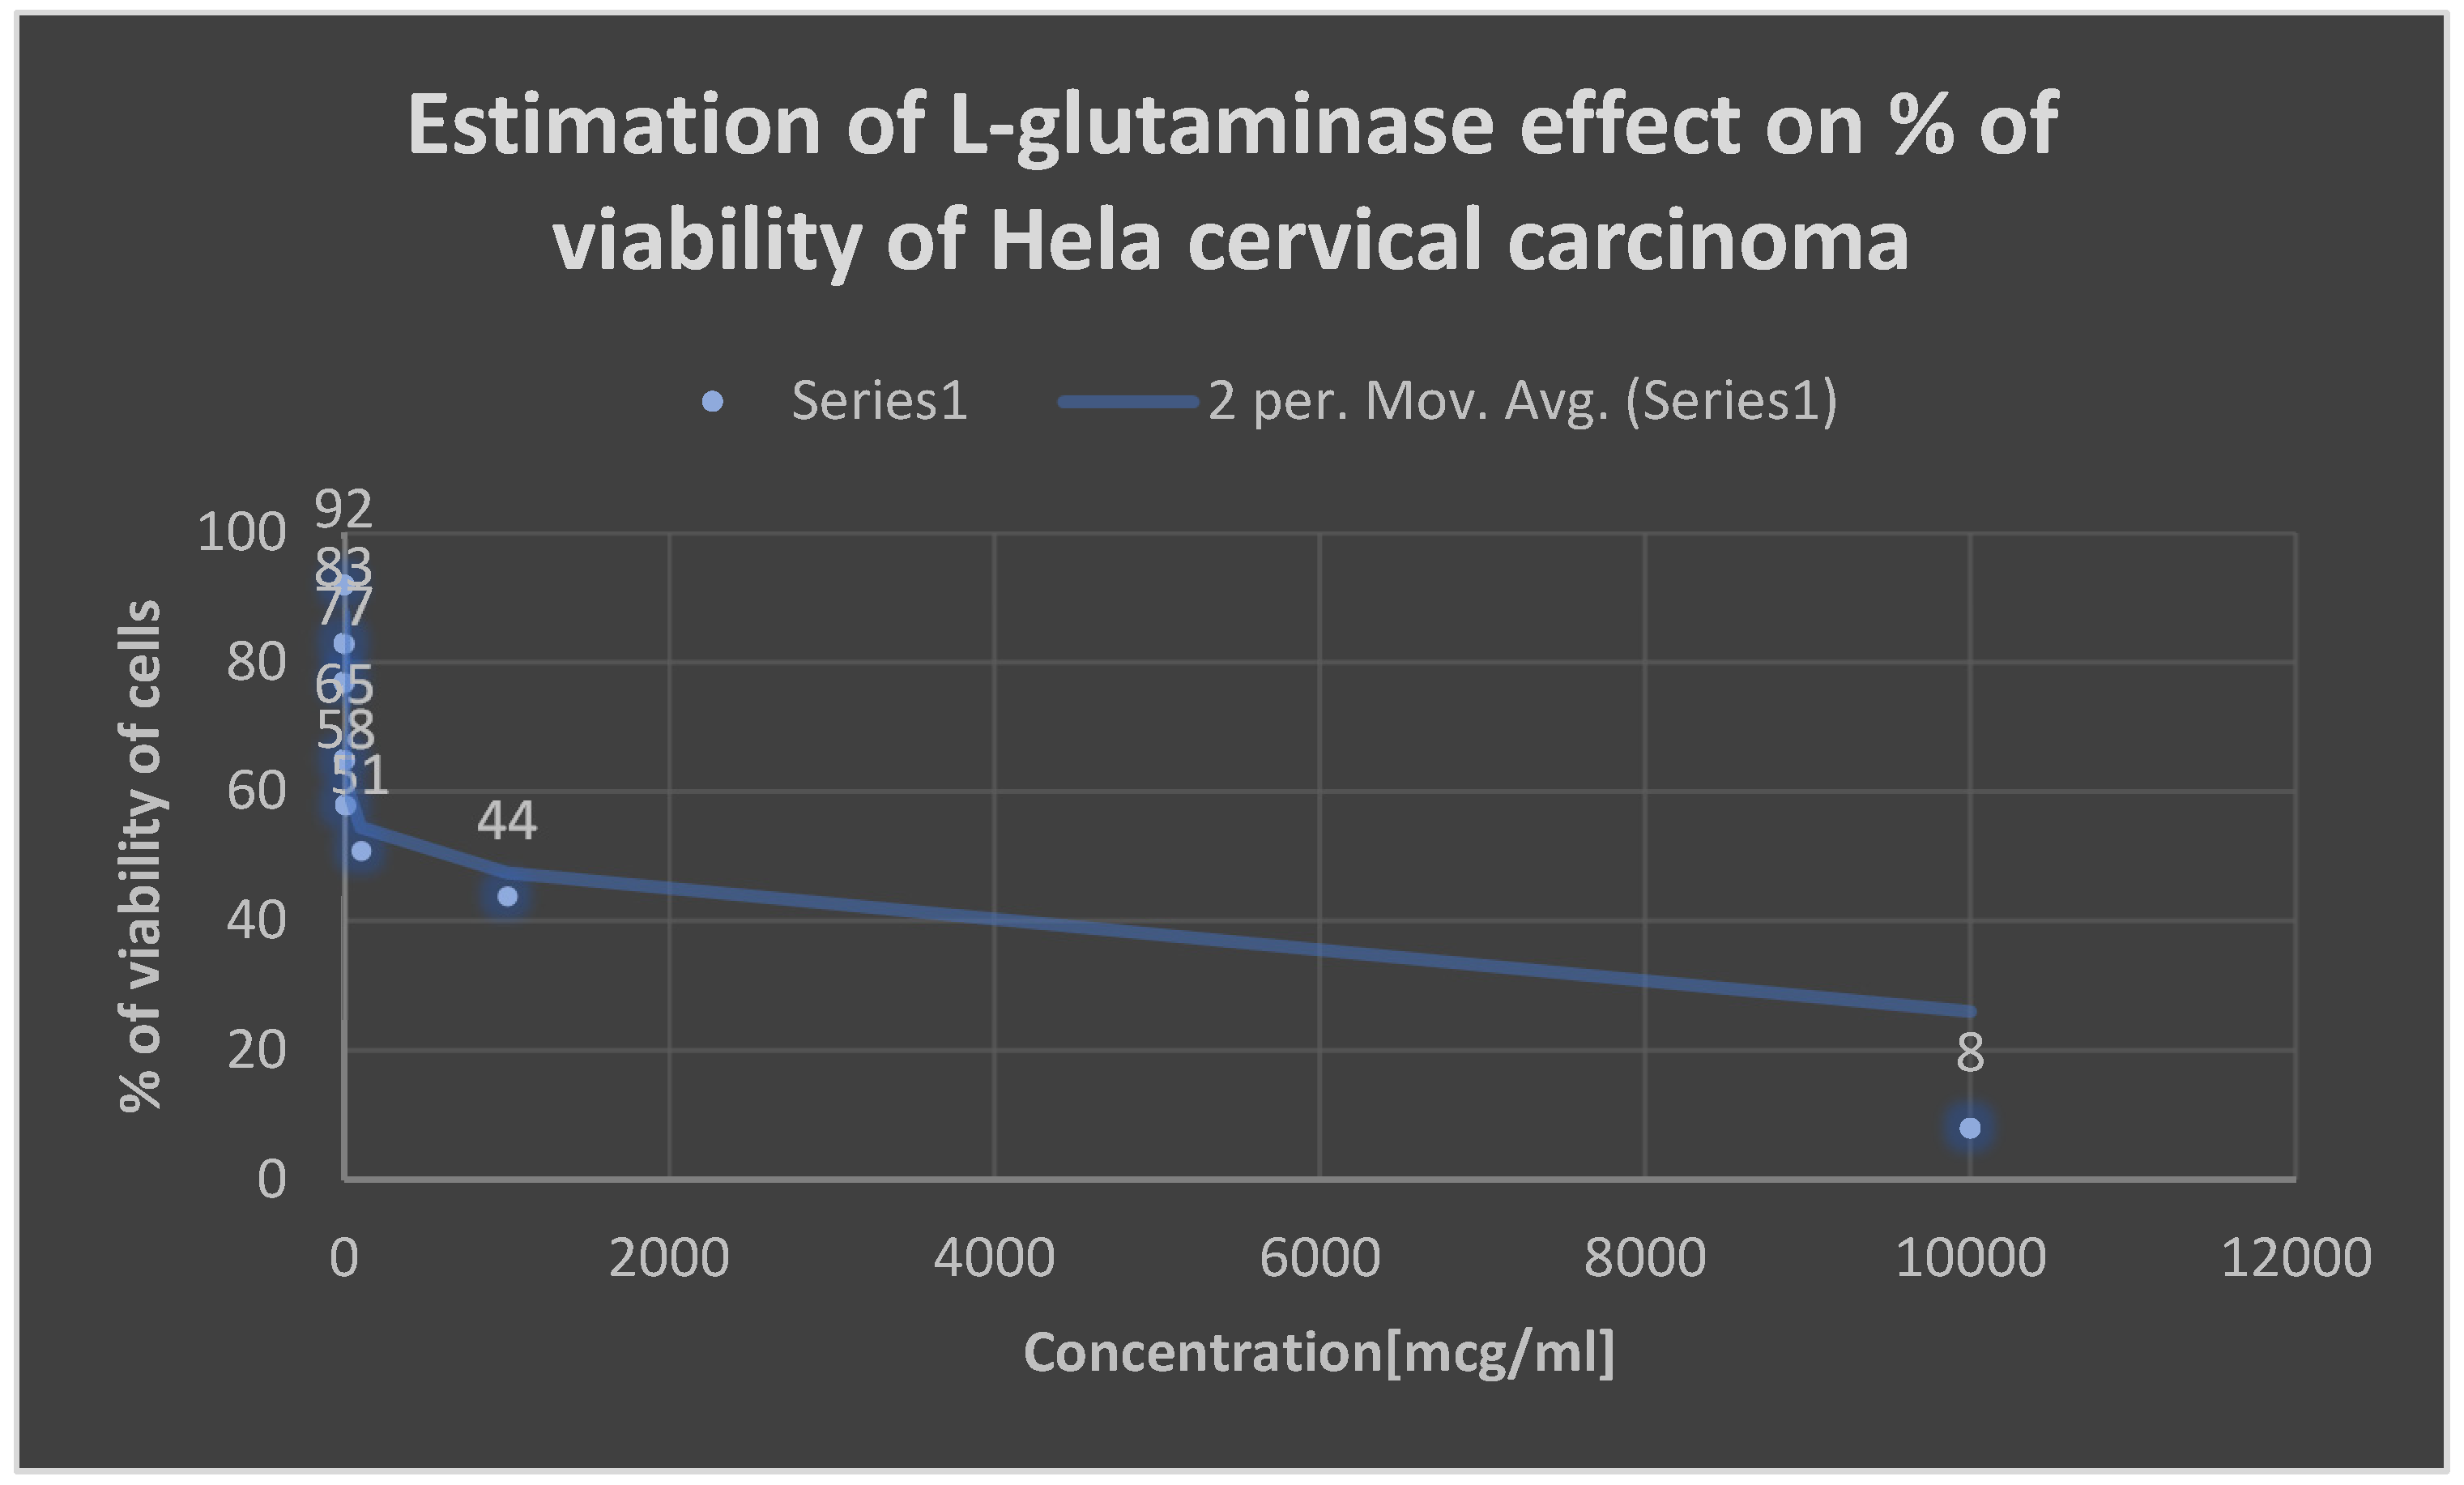
Graph 8. Detection of the cytotoxicity of L-glutaminase on Hela cervical cancer cell line.
Preprints 106636 g014
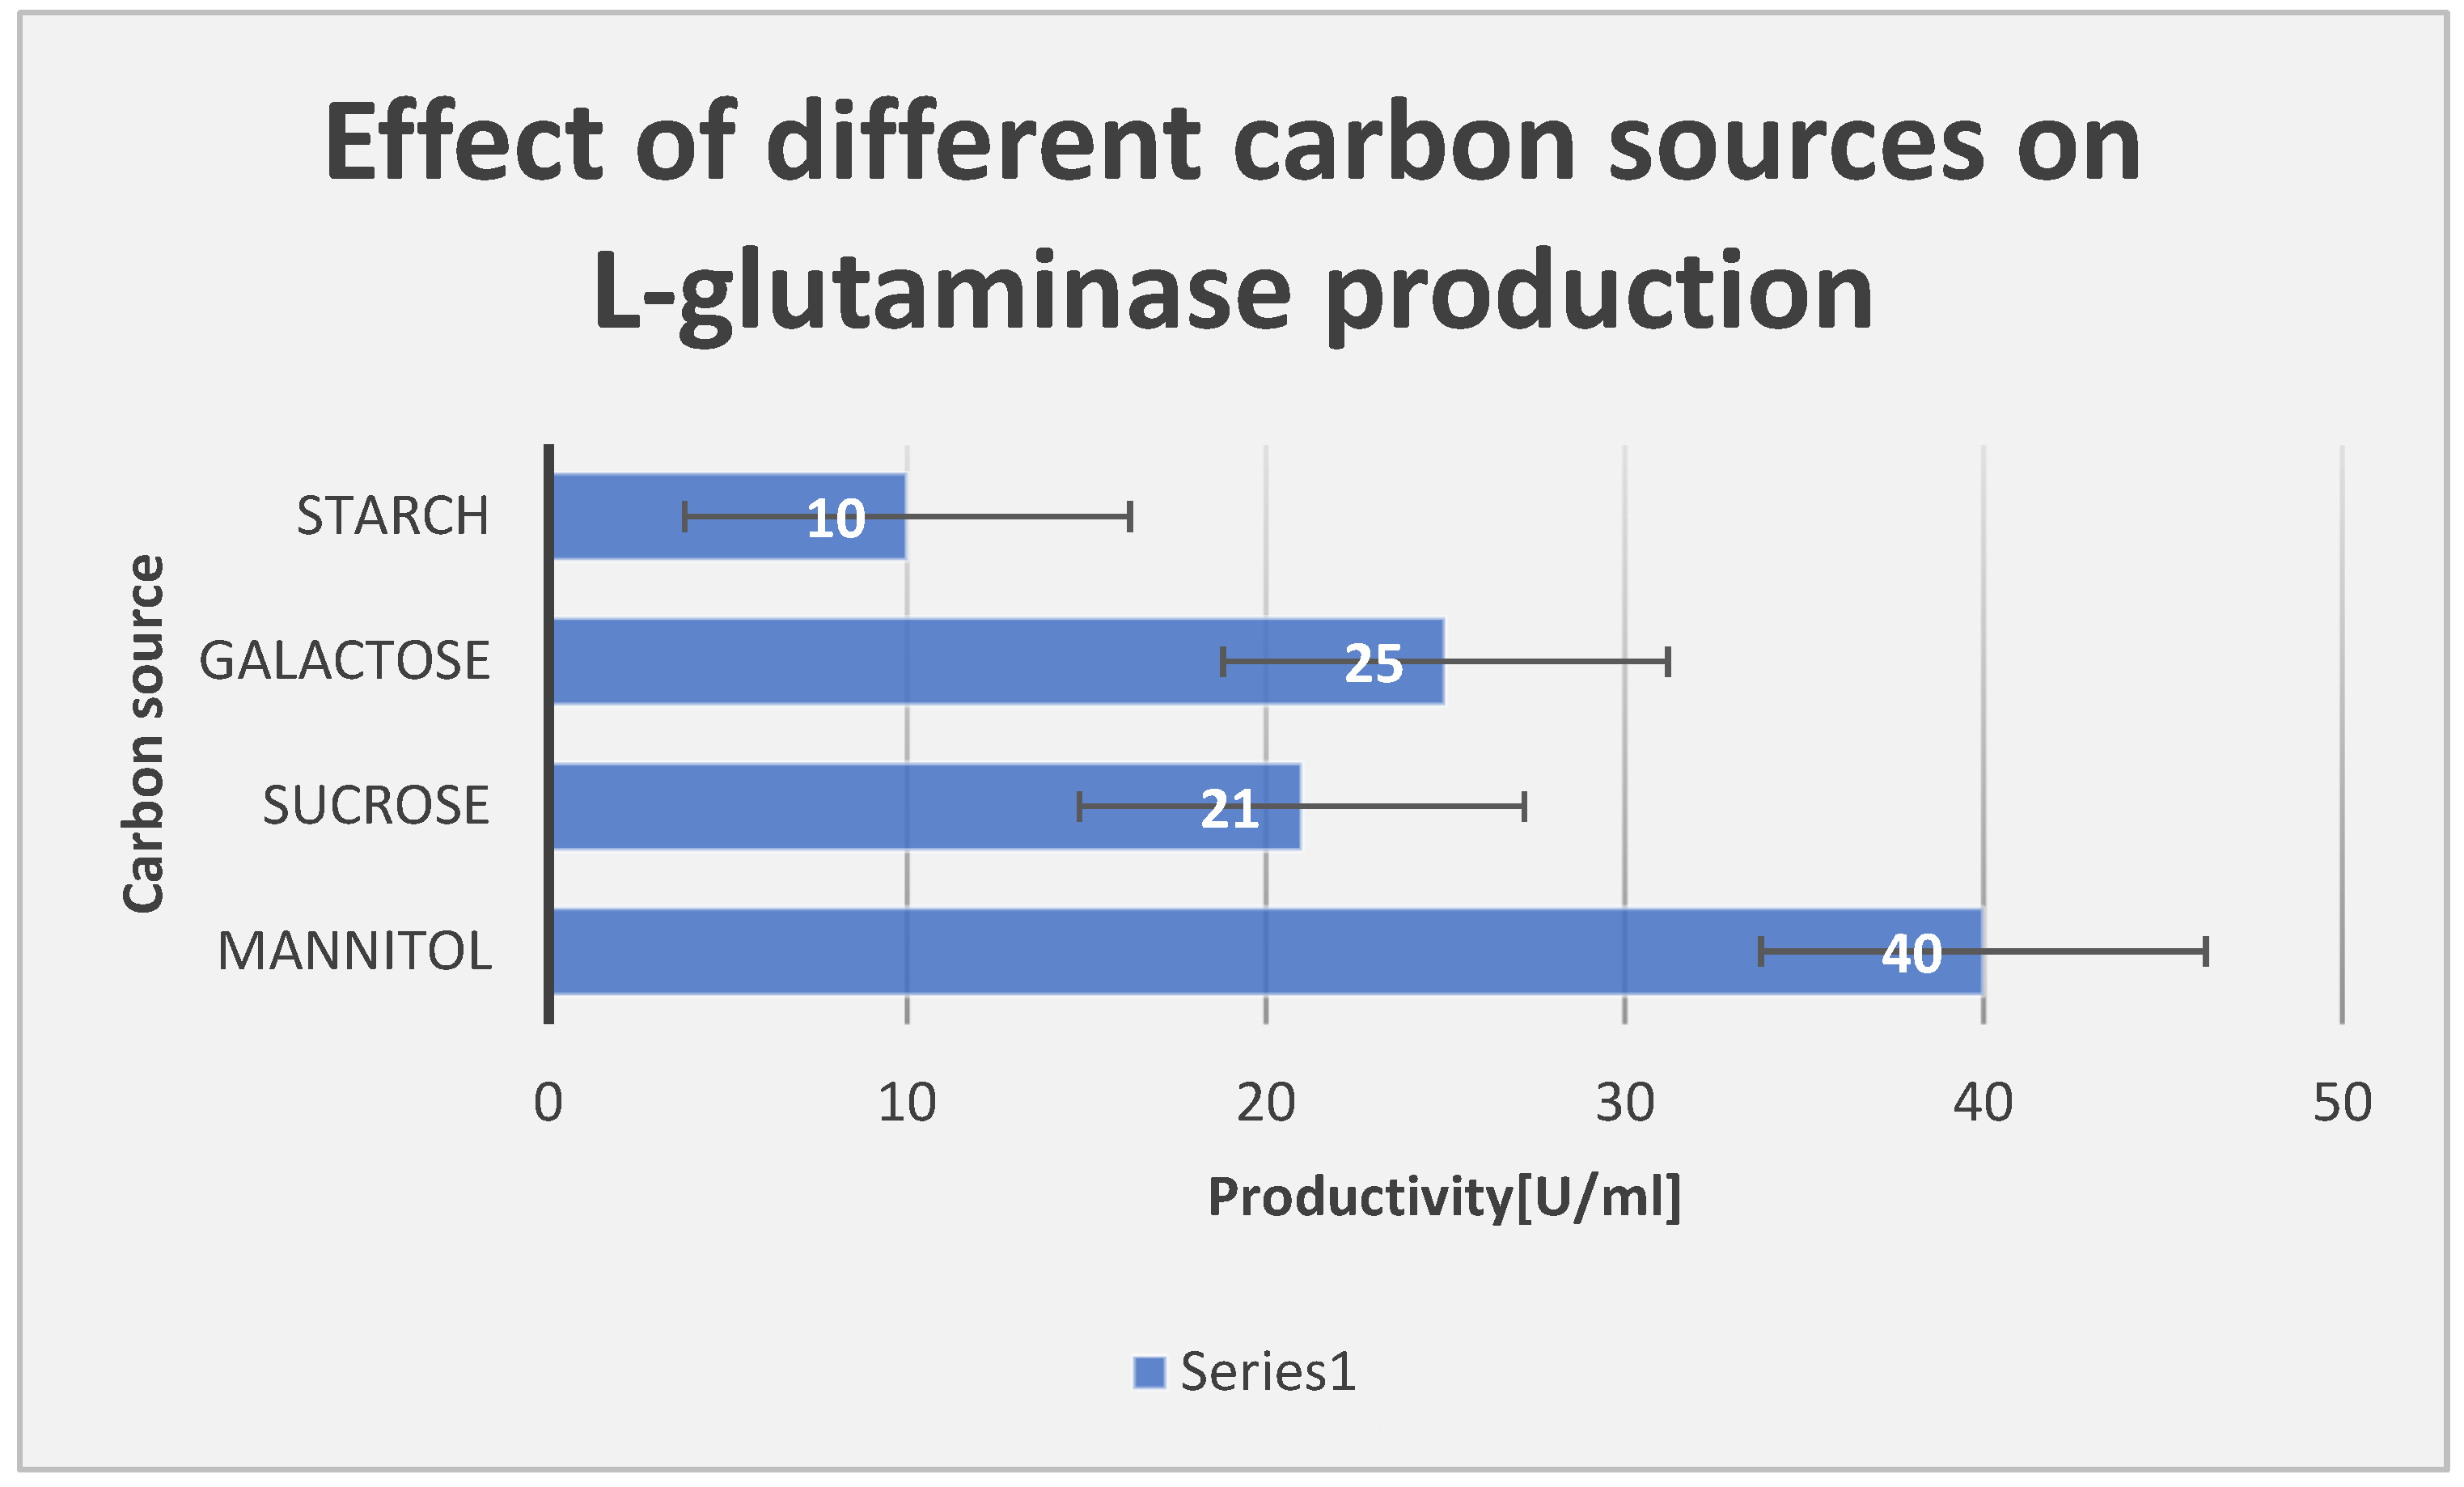
Graph 9. Effect of different carbon sources on L-glutaminase productivity.
Preprints 106636 g015
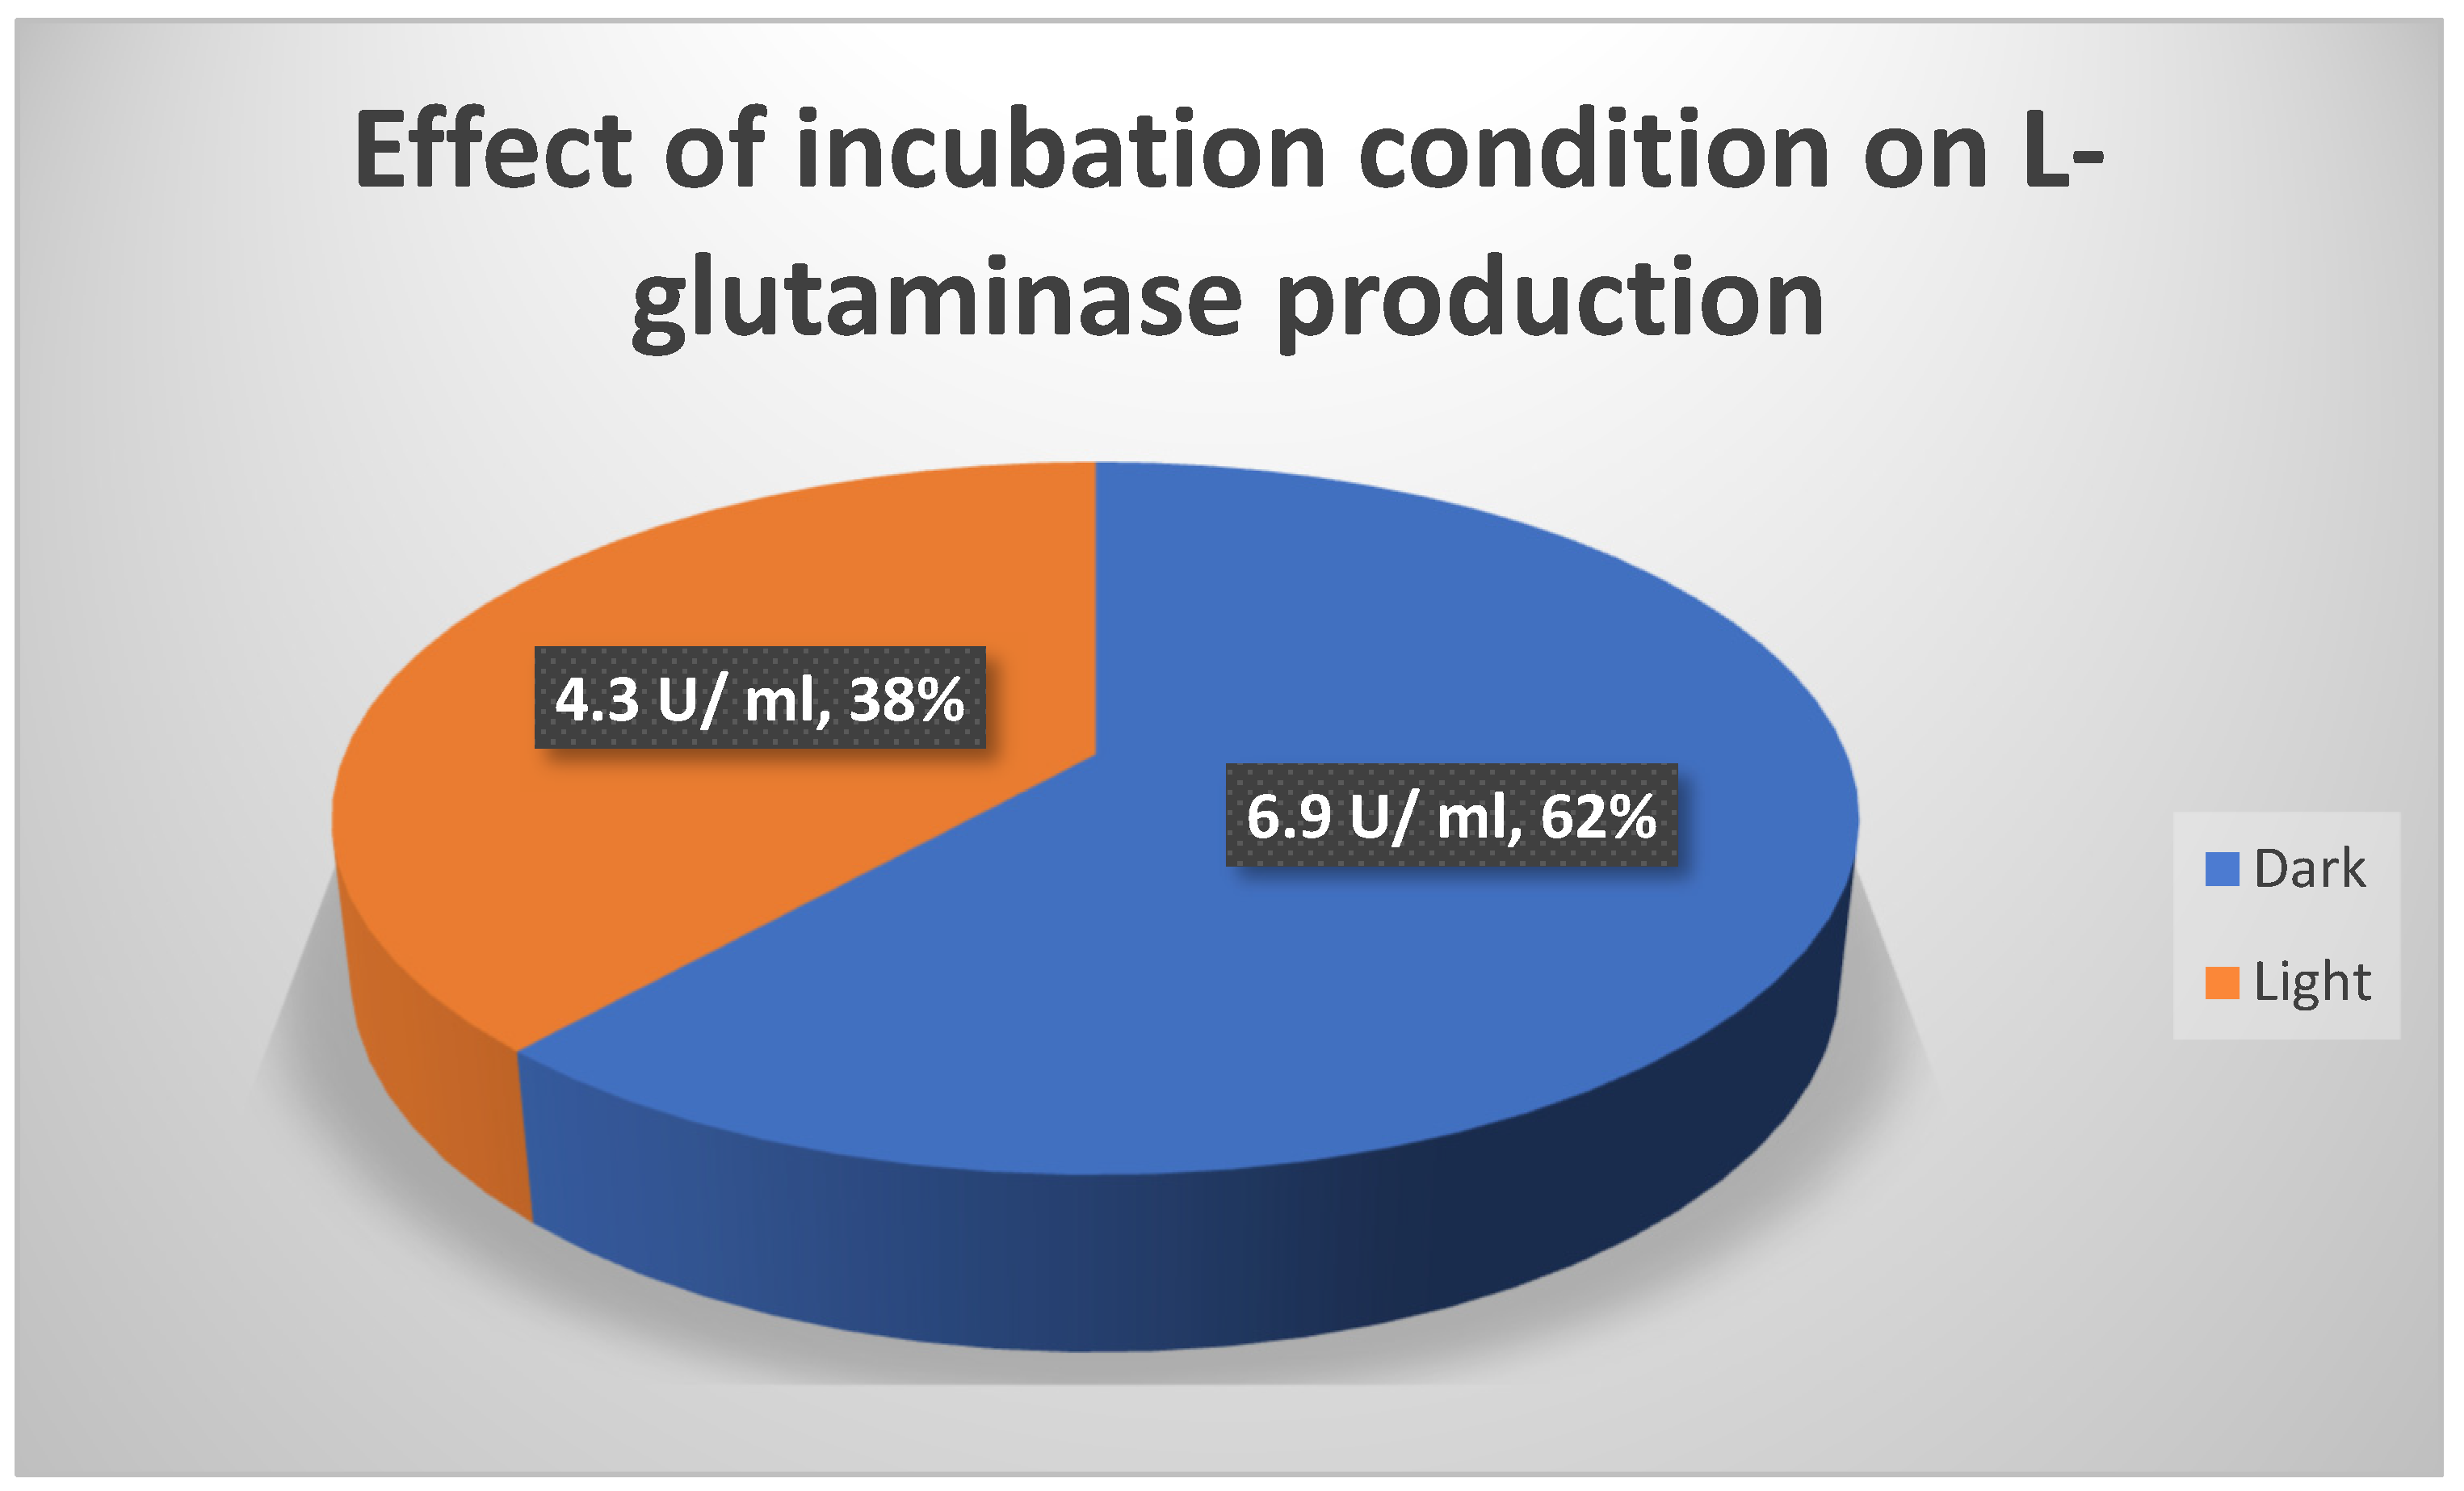
Graph 10. Effect of different incubation conditions [Dark and light] on L-glutaminase output.
Preprints 106636 g016
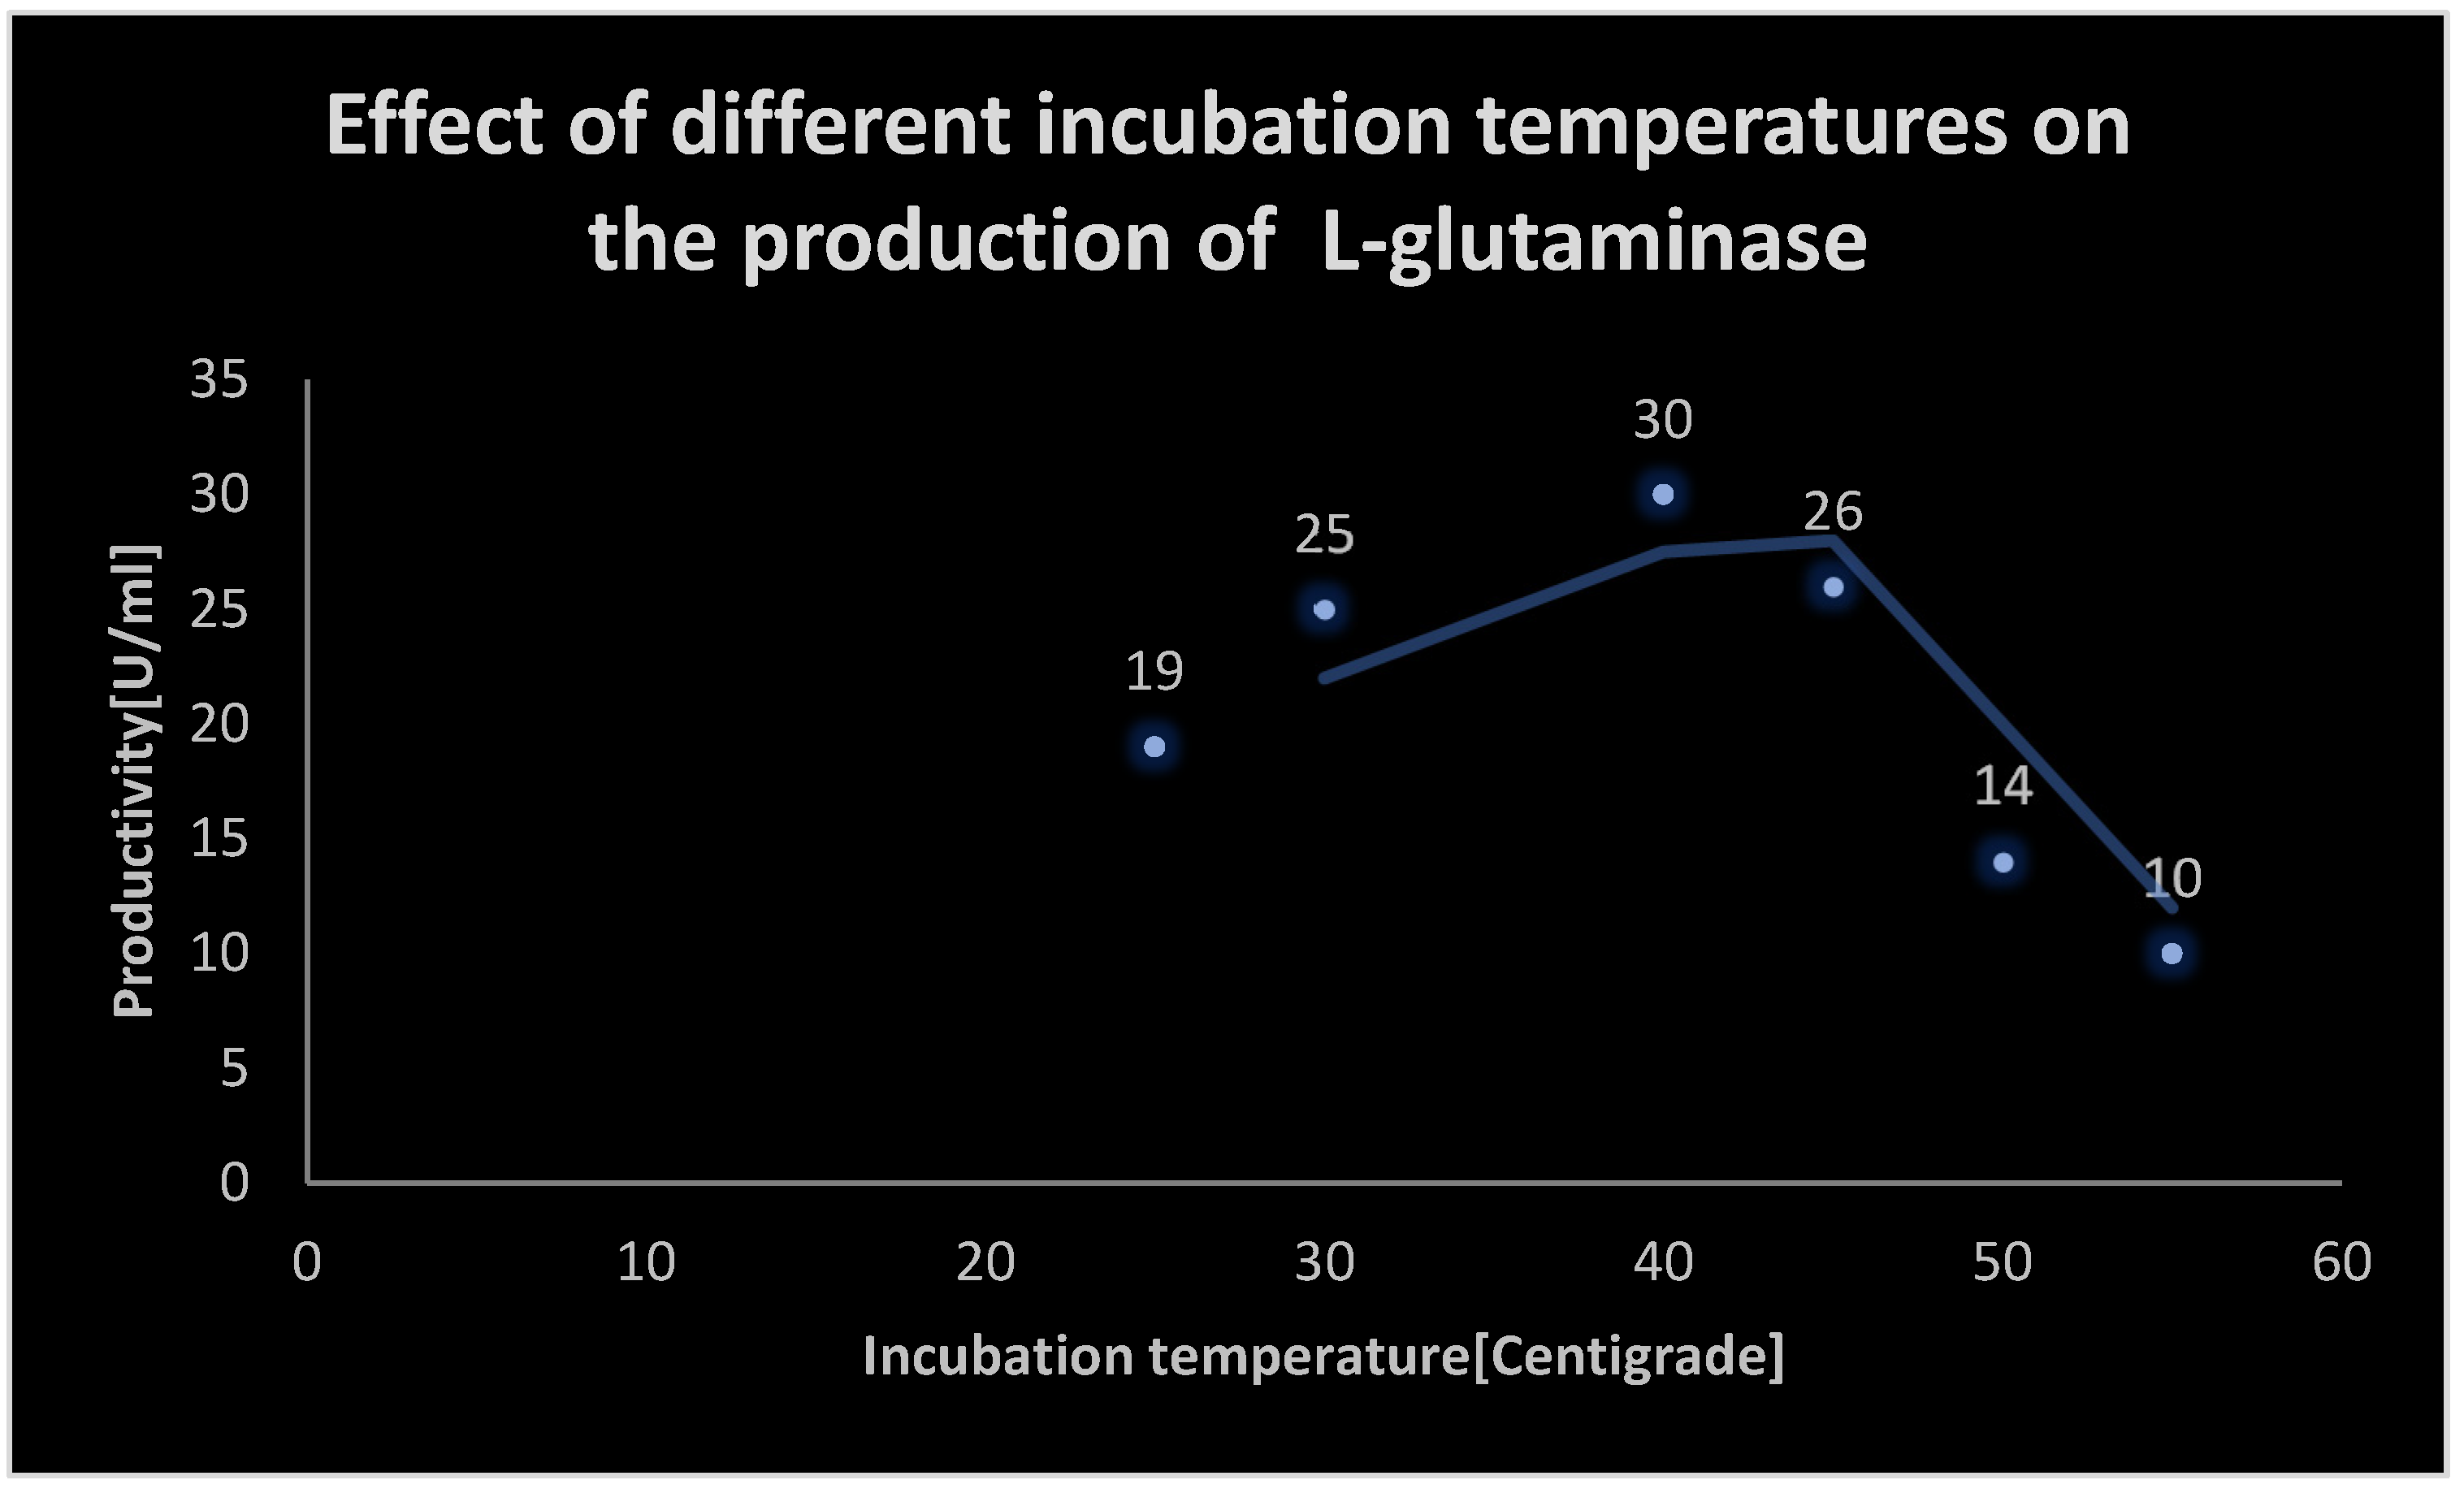
Graph 11. It displays the effect of different incubation temperatures on L-glutaminase production.
Preprints 106636 g017
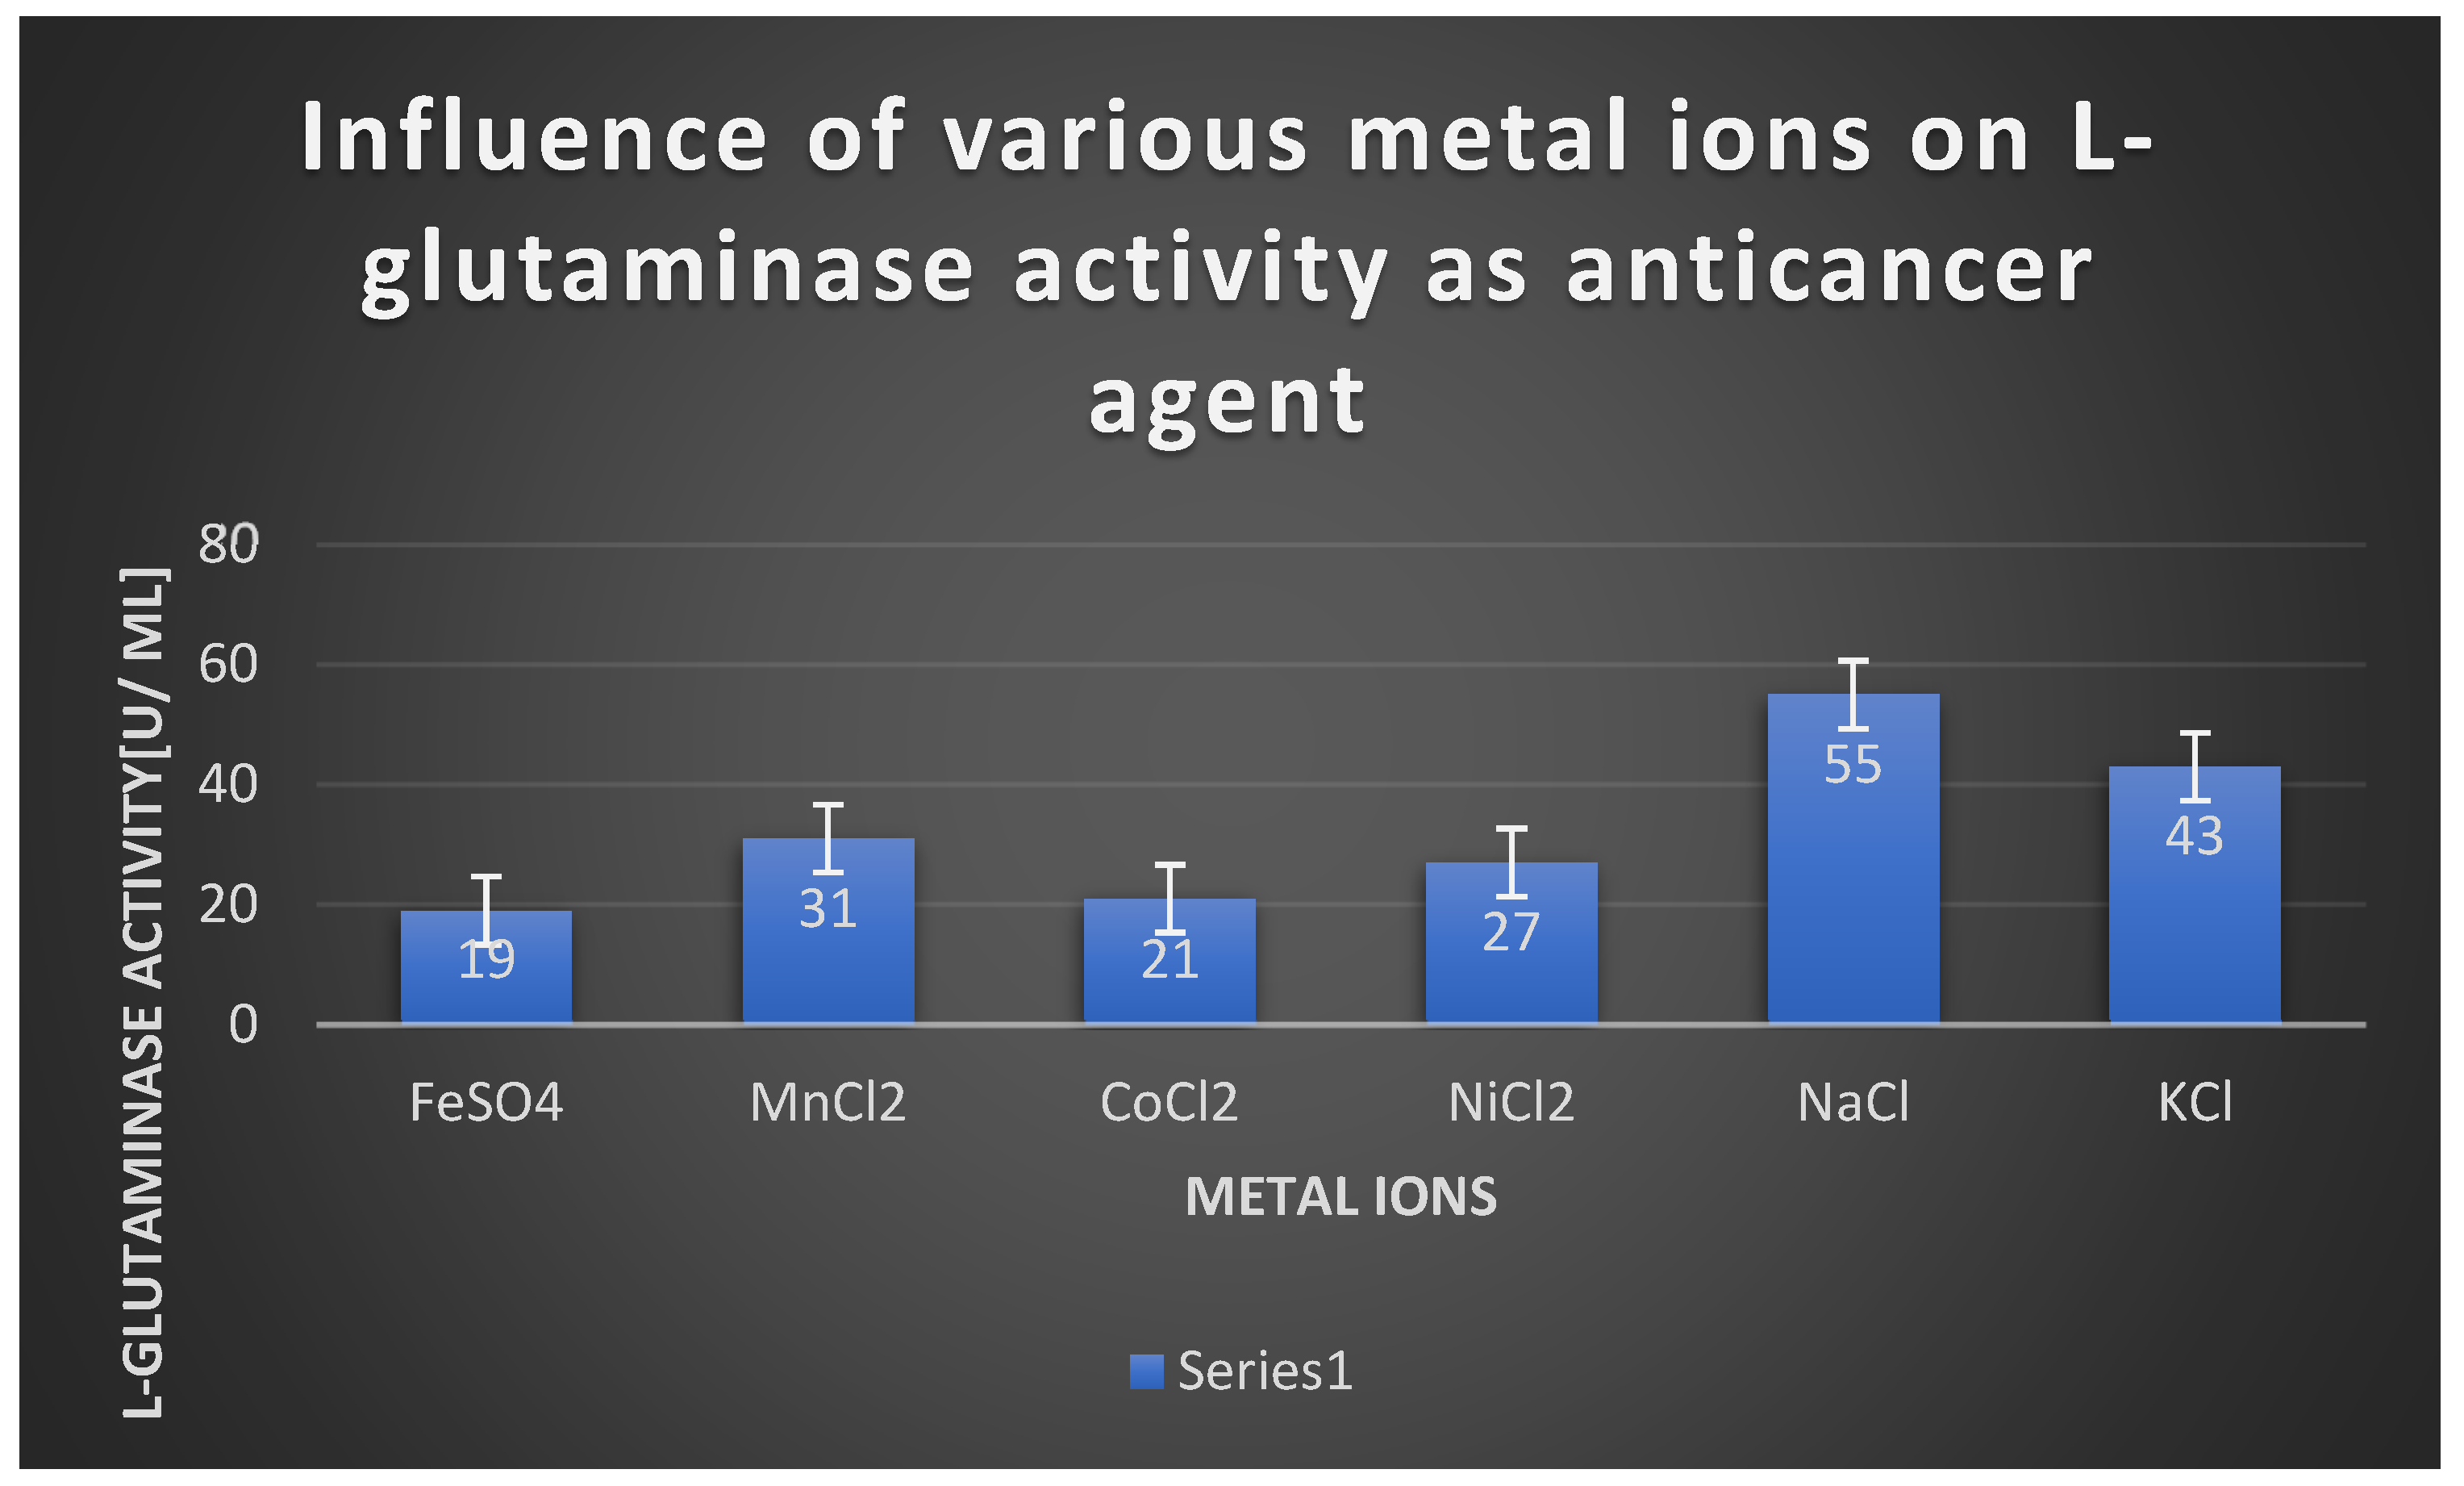
Graph 12. The effect of different metal ions on L-glutaminase cytotoxixity.
Preprints 106636 g018
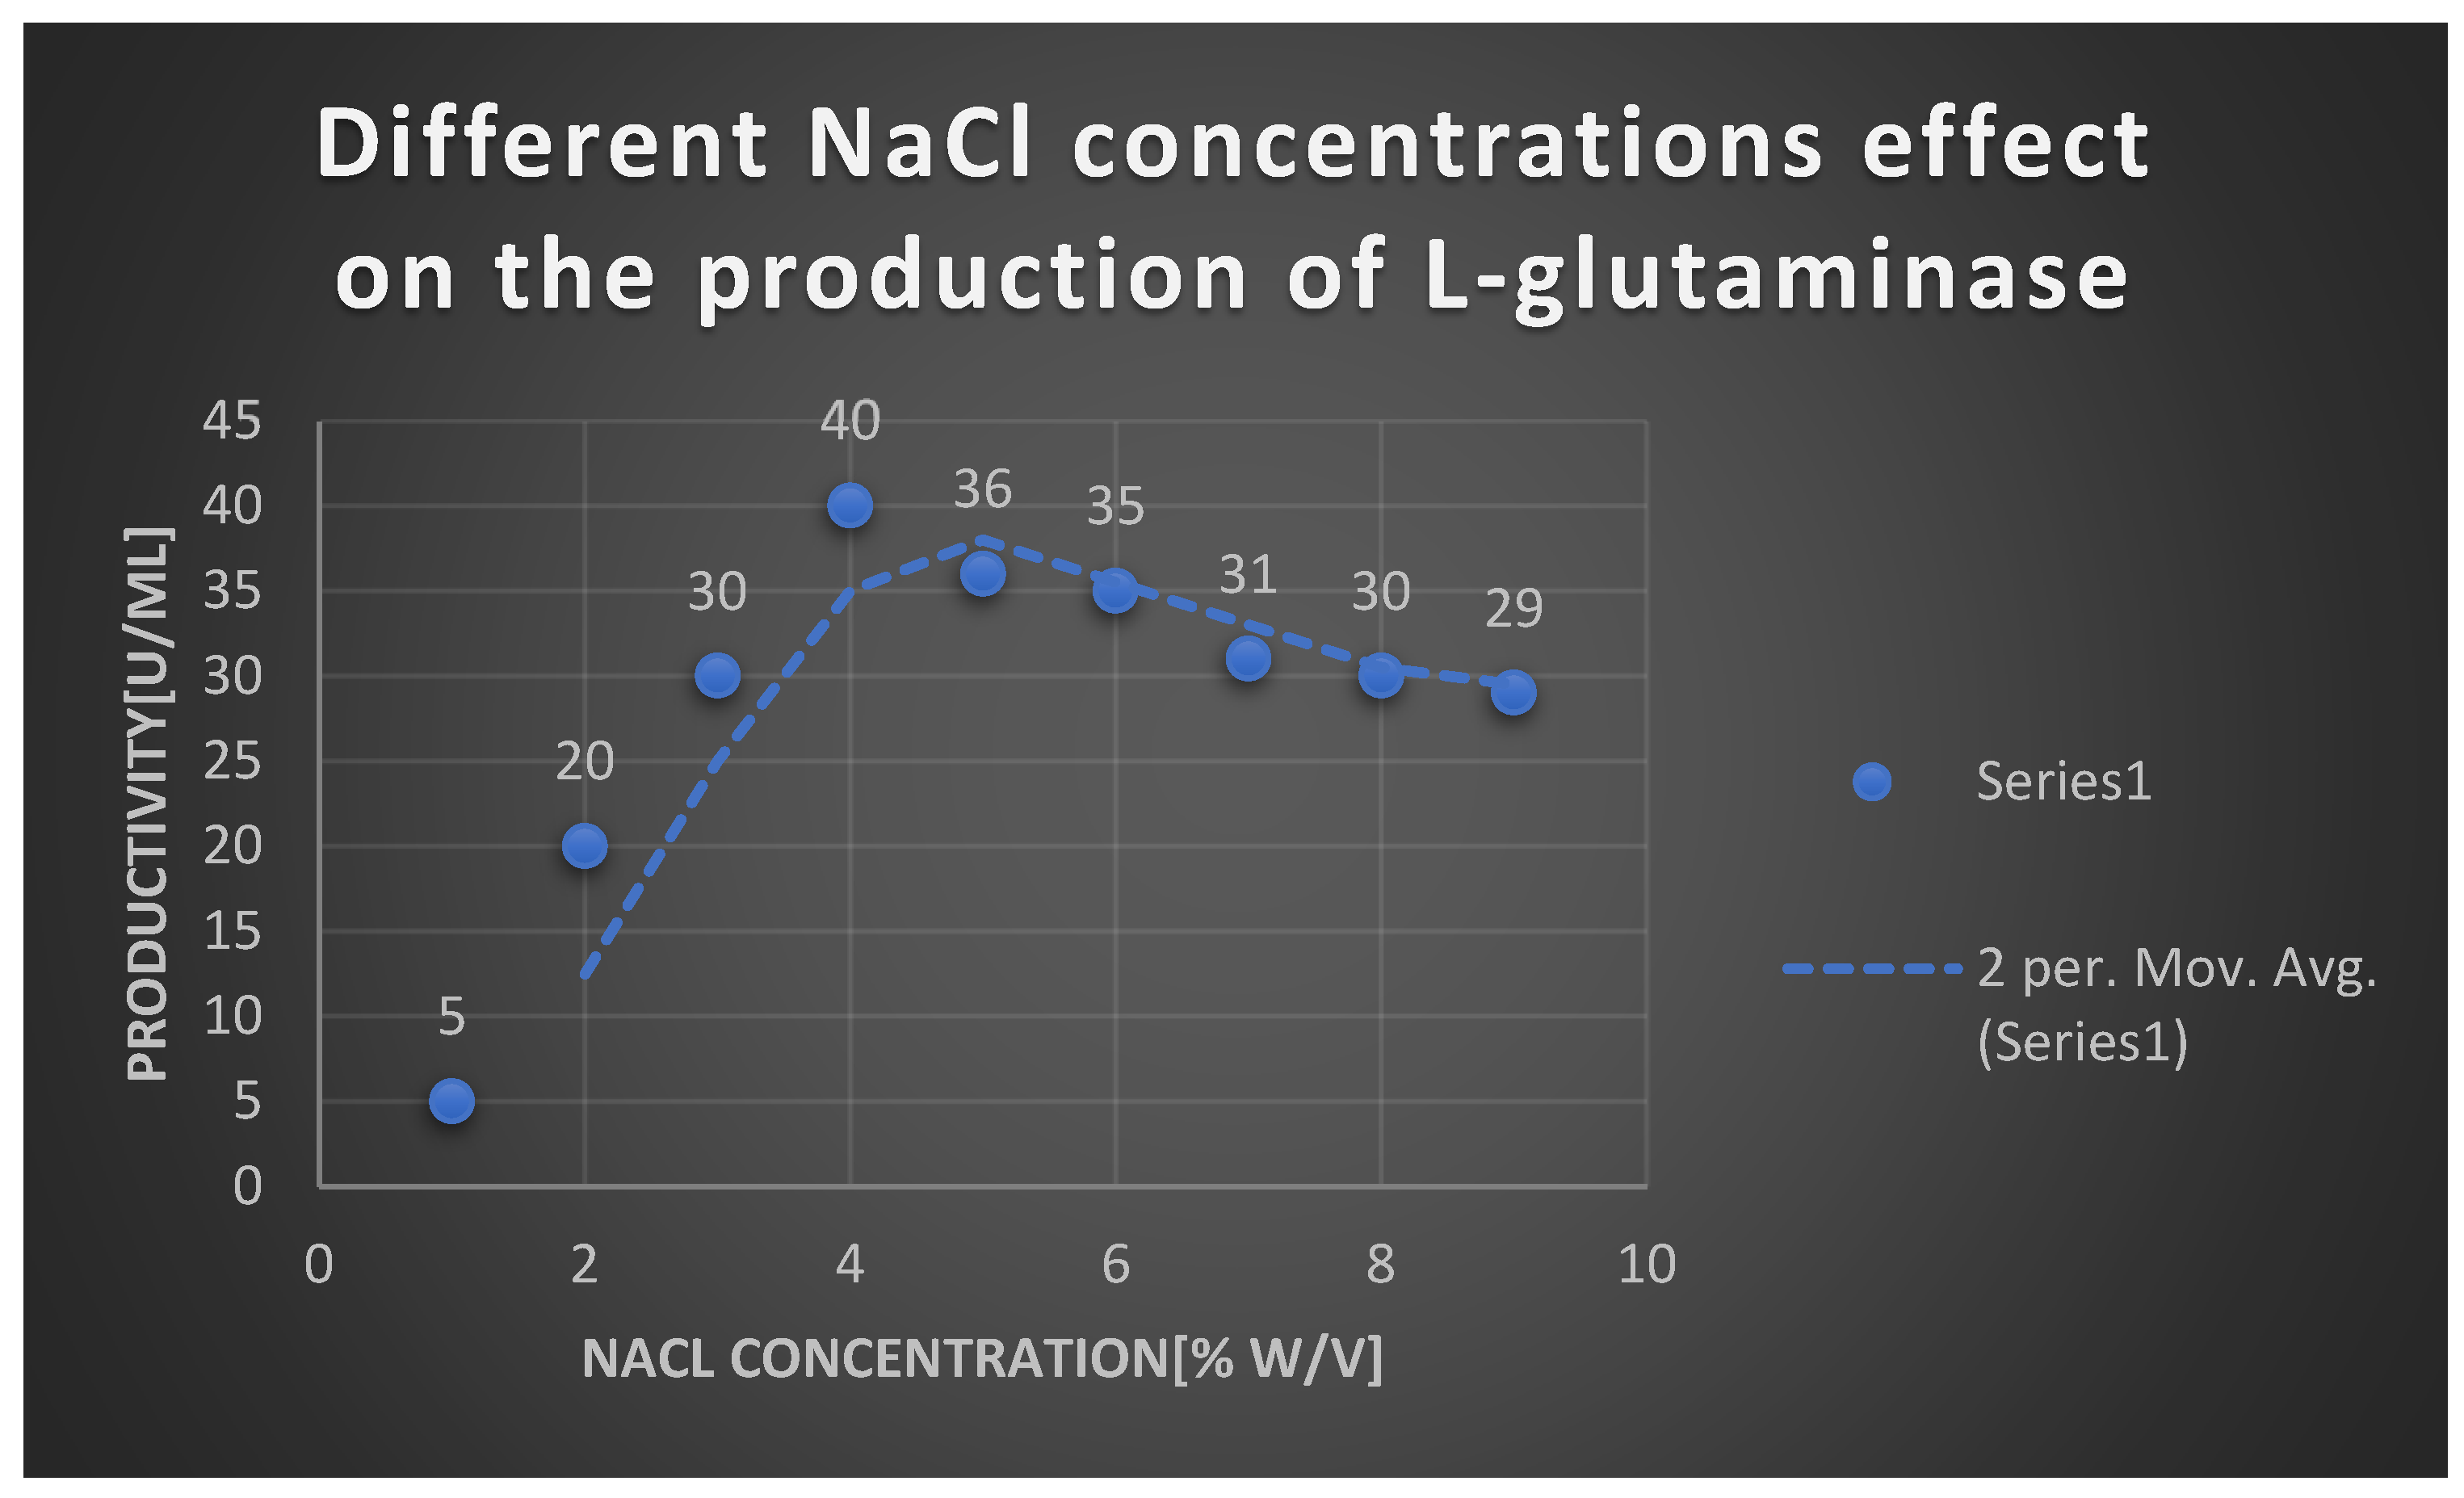
Graph 13. It shows the effects of different NaCl concentrations on L-glutaminase production.
Preprints 106636 g019
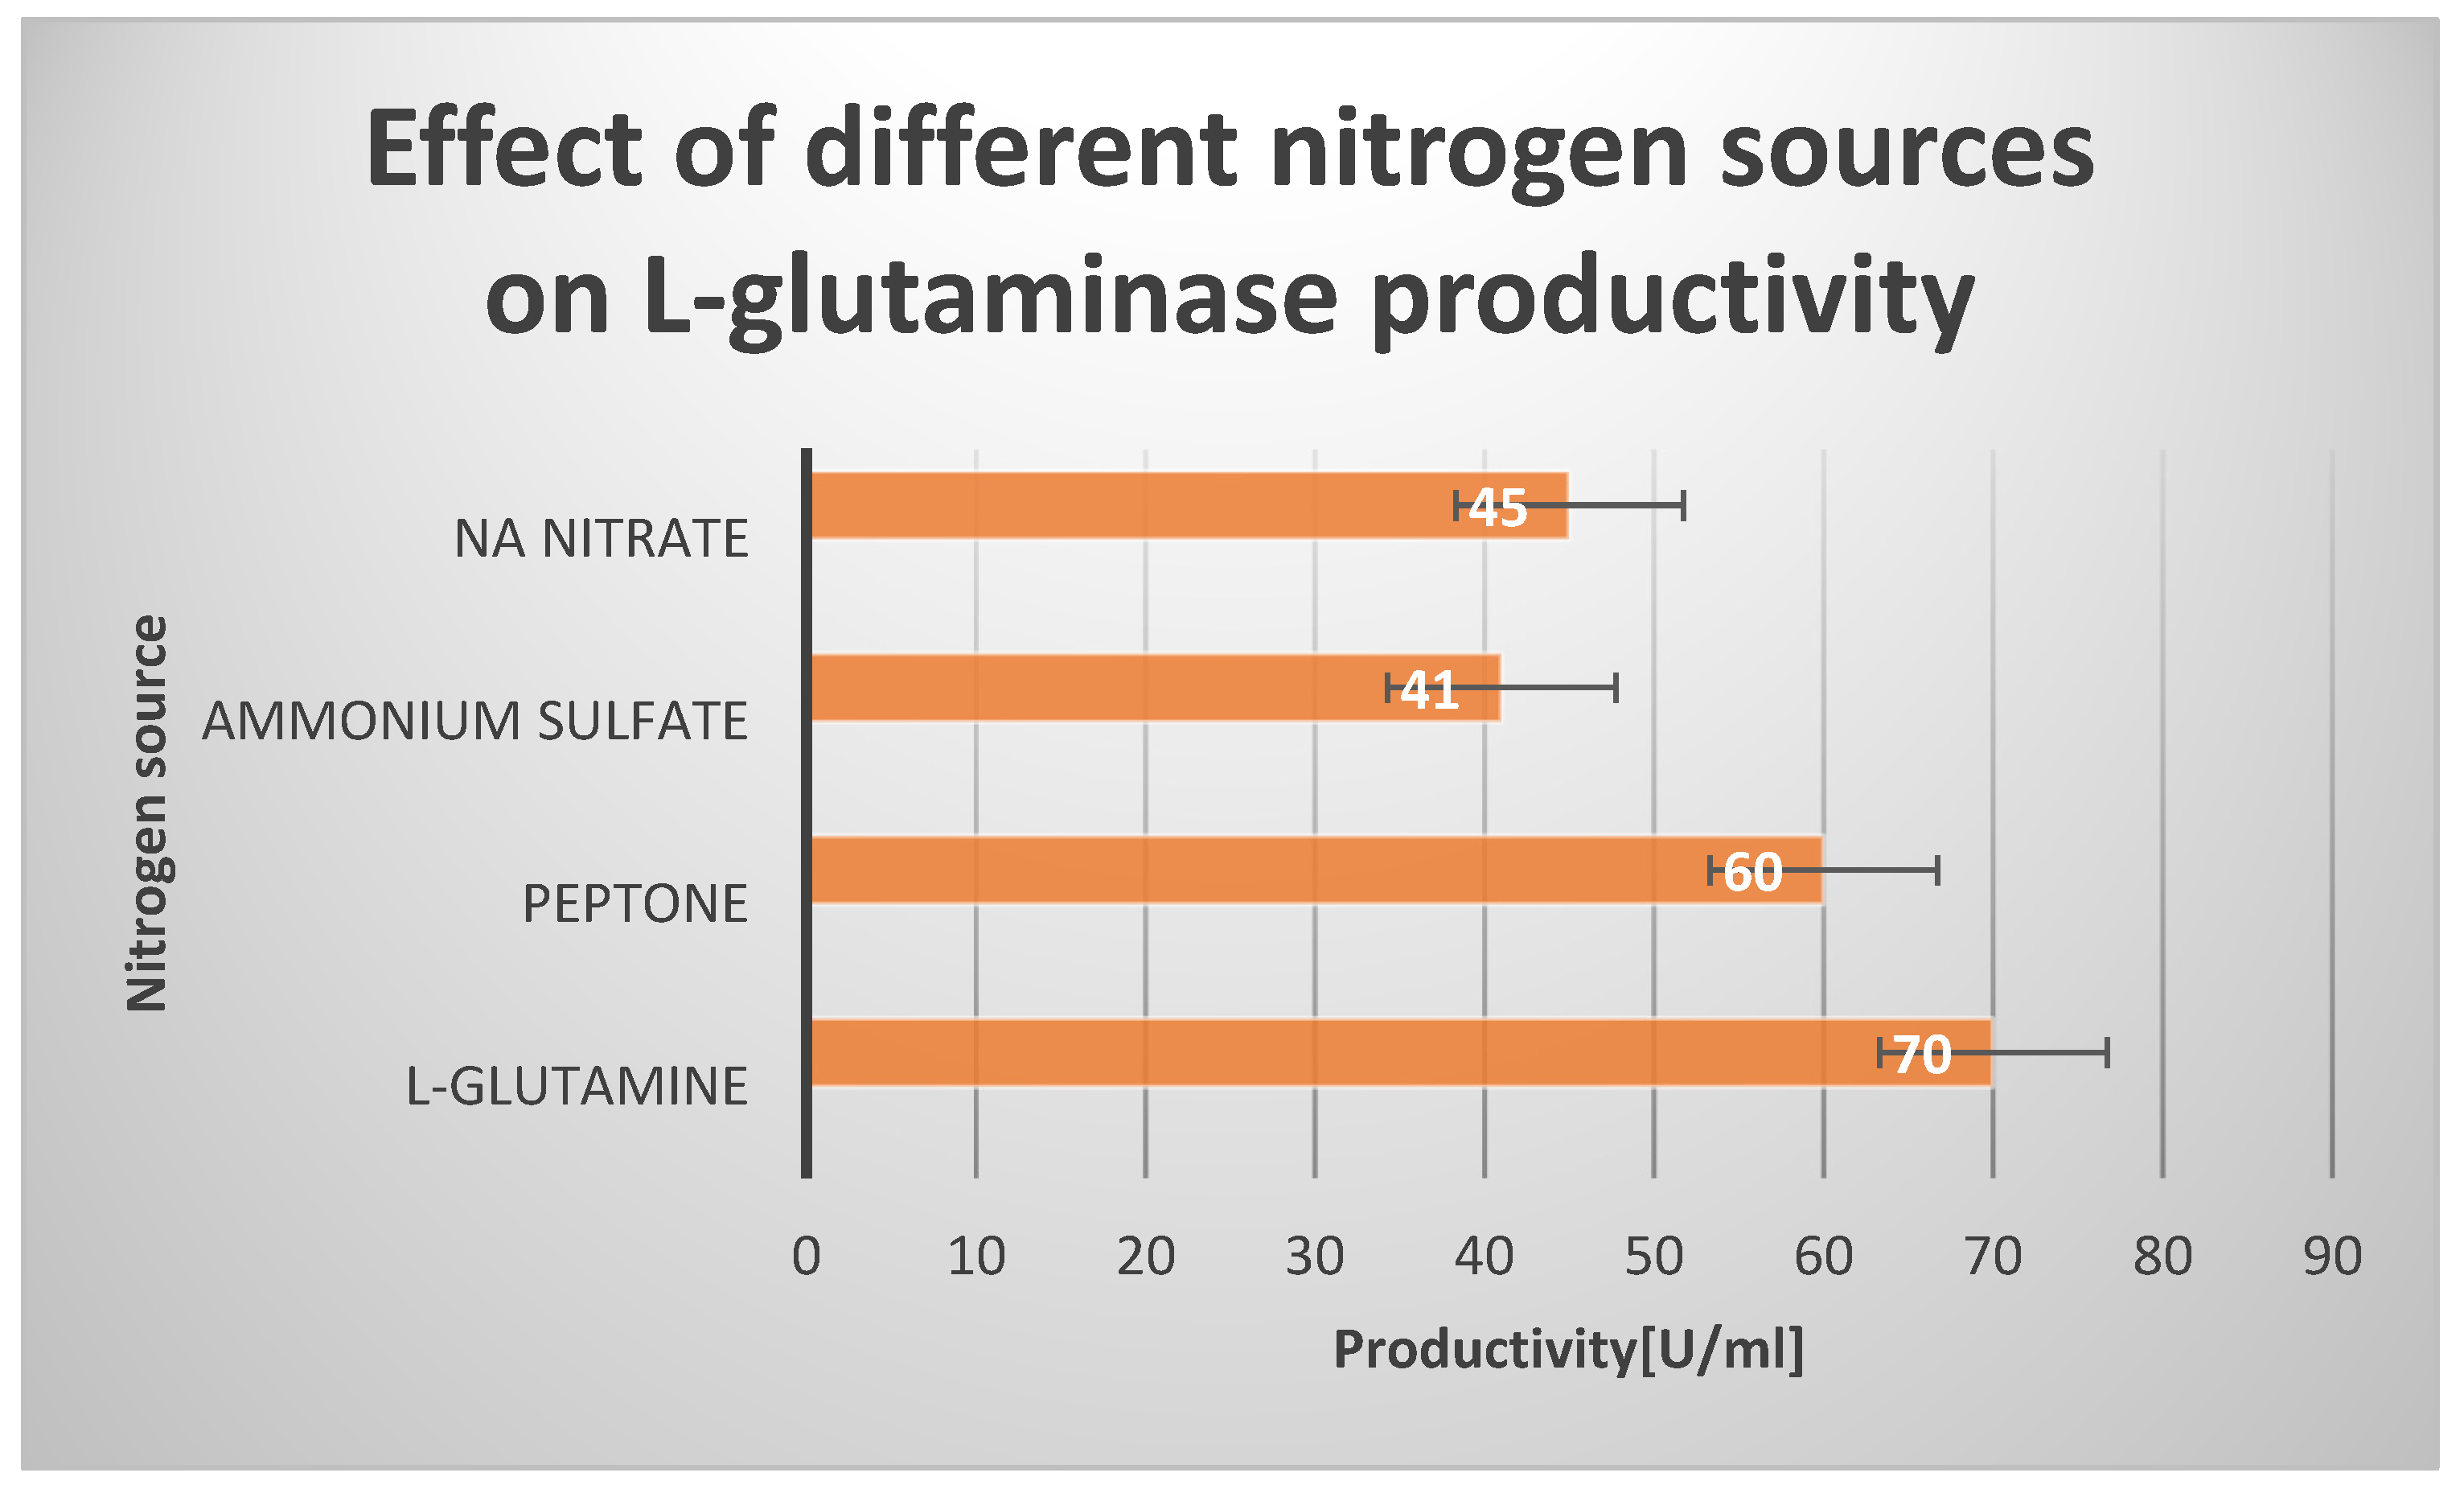
Graph 14. Effect of different Nitrogen sources on L-glutaminase production.
Preprints 106636 g020
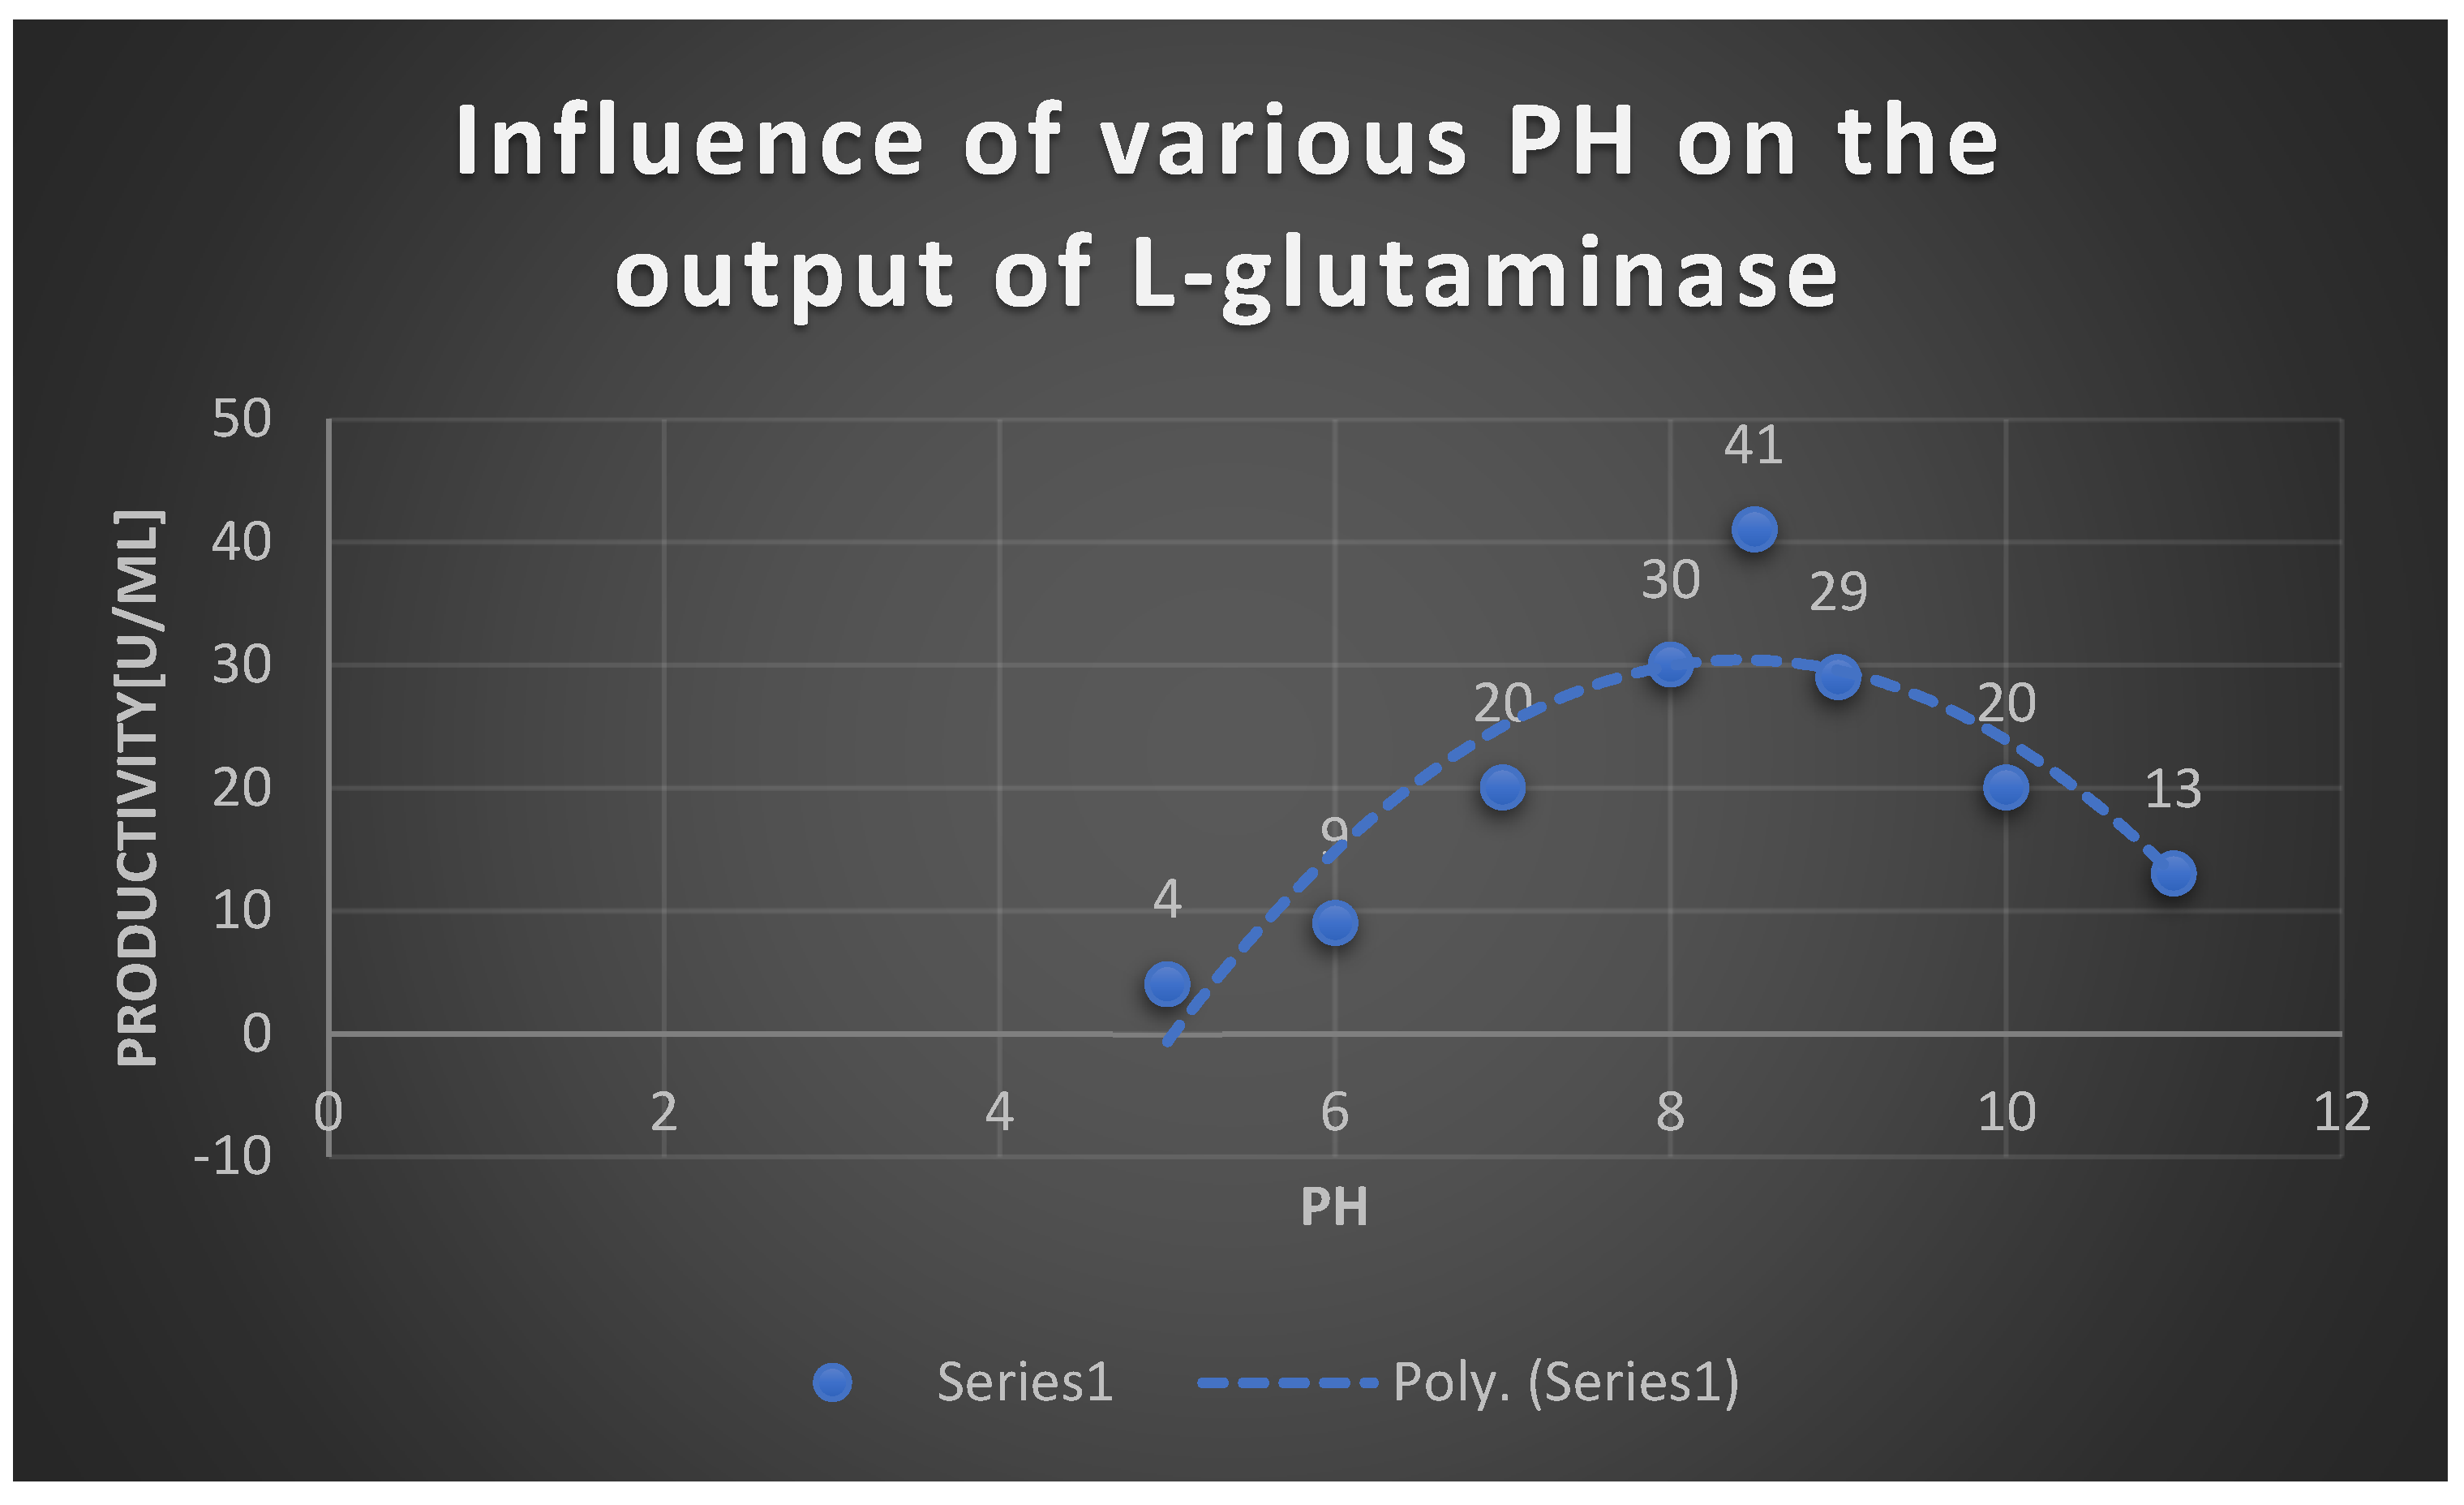
Graph 15. It displays Effect of different PH on the the productivity of L-glutaminase.
Preprints 106636 g021
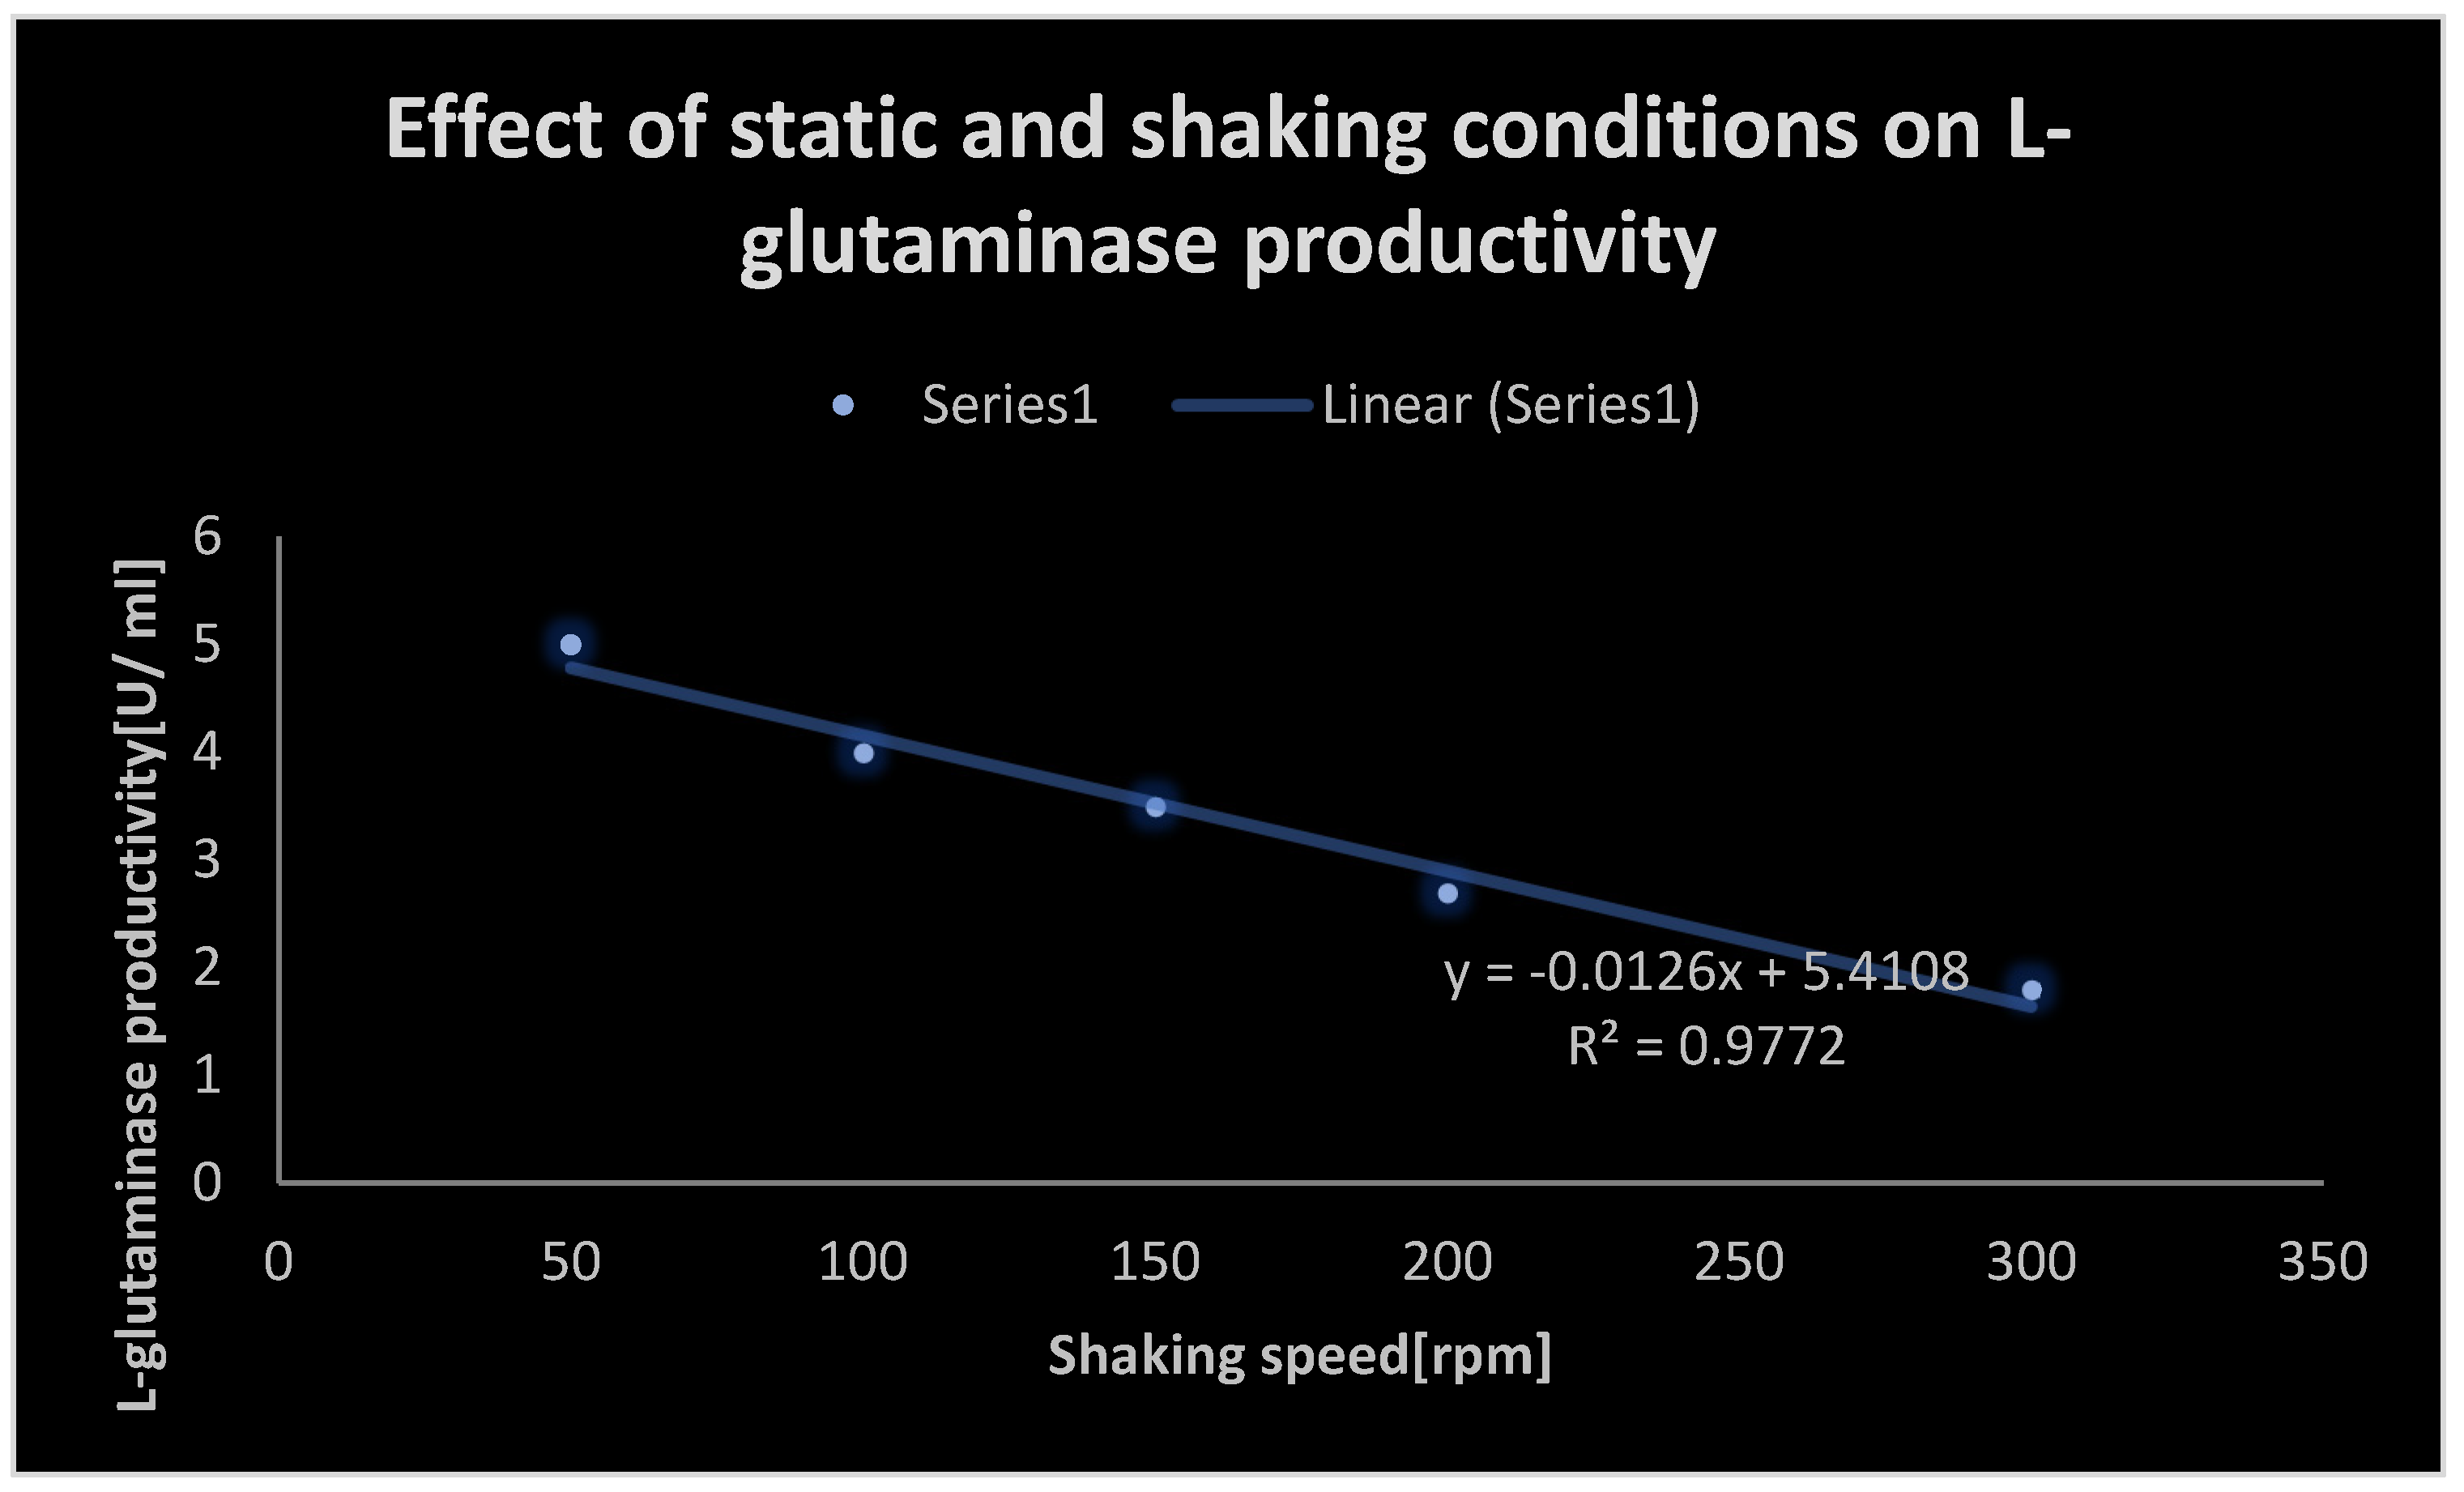
Graph 16. Effect of static and shaking conditions on L-glutaminase productivity.
Preprints 106636 g022
Graph 17. It displays the incubation time for L-glutaminase production.
Preprints 106636 g023
Graph 18. Effect of different inoculum sizes on L-glutaminase productivity.
Preprints 106636 g024
Graph 19. Effect of substrate concentration on the velocity of L-glutaminase.
Preprints 106636 g025
Graph 20. Effect of different temperatures on relative activity of L-glutaminase.
Preprints 106636 g026
Graph 21. Effect of PH on L-glutaminase activity.
Preprints 106636 g027
Graph 22. It shows the growth of L-glutaminase secreting bacterial isolates on metallic glutamine agar medium.
Preprints 106636 g028
Graph 23. It displays the cellular position detection of L-glutaminase through Nesslerization assay.
Preprints 106636 g029
Table 4. Antioxidant activity of standard L-ascorbic acid via DPPH assay.
Concentration [mg/ ml] % of inhibition of oxidization
0.02 15
0.04 29
0.06 38
0.08 49
0.10 80
Table 5. Antioxidant activity of test L-glutaminase via DPPH assay.
Concentration [mg/ ml] % of inhibition of oxidization
100 30
200 60
300 69
400 81
Table 6. Detection of the cytotoxicity of L-glutaminase on Hela cervical cancer cell line.
Concentration [mcg/ml] Percentage of viability [%]
0.001 92
0.01 83
0.1 77
1 65
10 58
100 51
1000 44
10000 8
Table 7. Detection of the cytotoxicity of L-glutaminase on lymphocytic CCL4 cancer cell line:.
Concentration [mcg/ml] Percentage of viability [%]
0.001 97
0.01 89
0.1 71
1 63
10 54
100 50
1000 43
10000 18
Table 8. Detection of the cytotoxicity of L-glutaminase on A-549 lung cancer cell line:.
Concentration [mcg/ml] Percentage of viability [%]
0.001 89
0.01 84
0.1 70
1 65
10 56
100 53
1000 40
10000 10
Table 9. Detection of the cytotoxicity of L-glutaminase on MCF-7 breast cancer cell line:.
Concentration [mcg/ml] Percentage of viability [%]
0.001 91
0.01 83
0.1 69
1 63
10 58
100 52
1000 39
10000 14
Table 10. Detection of the cytotoxicity of L-glutaminase on HCT-116 colon cancer cell line:.
Concentration [mcg/ml] Percentage of viability [%]
0.001 95
0.01 79
0.1 71
1 66
10 60
100 57
1000 49
10000 23
Table 11. Detection of the cytotoxicity of L-glutaminase on He-PG-Z hepatic carcinoma cell line:.
Concentration [mcg/ml] percentage of viability [%]
0.001 96
0.01 82
0.1 70
1 65
10 58
100 40
1000 19
10000 7
Table 12. Effect of different carbon sources on L-glutaminase productivity:.
Carbon source Productivity [U/ml]
Mannitol 40
Sucrose 21
Galactose 25
Starch 10
Table 13. Effect of different incubatin conditions on L-glutaminase output:.
Incubation condition Dark Light
L-glutaminase productivity [U/ ml] 6.9 4.3
Table 14. It displays the effect of different incubation temperatures on L-glutaminase production:.
Incubation temperature [℃] Productivity [U/ml]
25 19
30 25
40 30
45 26
50 14
55 10
Table 15. The effect of different metal ions on L-glutaminase cytotoxixity:.
Metal ion L-glutaminase activity [U/ ml]
FeSO4 19
MnCl2 31
CoCl2 21
NiCl2 27
NaCl 55
KCl 43
Table 16. It shows the effects of different NaCl concentrations on L-glutaminase production:.
NaCl concentration [% w/v] Productivity [U/ml]
1 5
2 20
3 30
4 40
5 36
6 35
7 31
8 30
9 29
Table 17. Effect of different Nitrogen sources on L-glutaminase productivity:.
Nitrogen source Productivity [U/ml]
L-glutamine 70
Peptone 60
Ammonium sulfate 41
Na Nitrate 45
Table 18. Effect of PH on the the productivity of L-glutaminase:.
PH Productivity [U/ml]
5 4
6 9
7 20
8 30
8.5 41
9 29
10 20
11 13
Table 19. Effect of static and shaking conditions on L-glutaminase productivity:.
Shaking speed [rpm] L-glutaminase productivity [U/ ml]
50 5
100 4
150 3.5
200 2.7
300 1.8
Table 20. It displays the incubation time for L-glutaminase production:.
Fermentation time(hr) L-glutaminase production(U/ml)
6 3
12 10
24 21
36 35
48 24
60 19
72 14
84 10
96 7
108 5
120 4
Table 21. Effect of different inoculum sizes on L-glutaminase productivity:.
Inoculum size [Spores/ ml L-glutaminase productivity [U/ ml]
1 2
3 4
5 7
7 8
9 3
11 2
Table 22. It shows the growth of L-glutaminase secreting bacterial isolates on MGA:.
No. of +ve isolates No. of negative isolates
31 19
Table 23. It displays the cellular position detection of L-gutaminase via Nesslerization Assay:.
Cellular proportion Percent [%]
Extracellular 71
Surface bound 18
Intracellular 11
Table 24. Effect of PH on L-glutaminase activity:.
PH Relative activity [ %]
5 20
6 31
7 70
8 80
8.5 95
9 92
10 90
11 79
Table 25. Effect of temperature on relative activity of L-glutaminase:.
Temperature [℃] Relative activity [%]
25 38
30 61
35 69
40 73
45 78
50 86
60 93
70 60
Table 26. Effect of substrate concentration on the velocity of L-glutaminase:.
Substrate concentration [M] Velocity [U moles/ min]
20 0.02
55 0.04
80 0.06
90 0.08
95 0.10
Table 27. The outcomes of biochemical reactions:.
Test Result
Gram stain +
Cell shape Rod
Spore shape Ellipsoidal
Spore site Central
Motility +
Catalase +
Oxidase +
Blood haemolysis Beta haemolysis
Indol -
Methyl red +
Voges-proskauer +
Citrate utilization +
Starch hydrolysis +
Gelatin hydrolysis +
Growth at 45 0C +
TSI +
Tolerance salinity
5% NaCl +
7% NaCl +
Saccharide fermentation
Glucose +
Fructose +
Maltose +
Sucrose +
Table 28. It displays the formulation of L-glutaminase as a sterile solution at PH 7:.
Ingredient concentration
L-glutaminase 10 mg
PEG20 50 mg
Mono-basic sodium phosphate USP, 1.5 mg +5%
Di-basic sodium phosphate USP, 3 mg + 5%
Sodium chloride USP, 7.5 mg +5%
Water for injection Query size to 1 ml

Discussion

The enzymes responsible for breaking down the amino acid glutamine are necessary for the treatment of cancers that depend on obtaining L-glutamine from the outside environment.
Because they do not have the ability to manufacture it, such as liver cancers and malignant acute lymphocytic lymphoma, while normal cells have the ability to manufacture it. These enzymes include:
L-glutaminase. The present study was concerned with isolating and exploring bacteria that produce L-glutaminase as Anti-cancer factor from different soil environments, as well as the identification and determination of environmental and physiological factors affecting the growth of some L-glutaminase-producing isolates as an anti-cancer agent. Moreover, the determination of enzyme properties.
A special medium was used to grow L-glutaminase enzyme-producing bacteria was called the mineralized glutamine agar. Bacterial isolate that had the ability to produce the enzyme L-glutaminase and the use of glutamine as a source of nitrogen and carbon for their growth was what has grown on mineralized L-glutamine agar.
By studying the phenotype, molecular detection and conducting biochemical reactions of these isolates, it turned out to be the bacterium Bacillus cereus 14579.
The environmental and physiological factors affecting the growth of bacteria was that it was from the soil of the acidic medium and next to flour mills and legumes rich in glutamine and L-metallic glutamine medium PH was 7.3 at 37°C in the presence of oxygen. The catalyst for its production were found to be zinc sulfate, magnesium sulfate, ferric sulfate, potassium chloride and potassium dihydrogen phosphate salts.
Salicylic acid test was done to measure the concentration of ammonia resulting from the activity of bacterial L-glutaminase, on the other hand direct Nessler,s test was utilized to measure the percentage of ammonia to detect enzyme-producing bacteria and test enzyme activity For different concentrations of soil samples. it was found that Its activators were the mineral salts: sodium sulfate salts, potassium chloride and manganese sulfate and ferric sulfate at a moderate pH of 7.3 and 37 °C in the presence of oxygen. The test enzyme was tested for the efficacy of the enzyme as an anti-cancer agent, and its efficacy was proven through MTT assay. Furthermore, It was produced by bacterial hybrid DNA technology (hybrid genetic material) with the ability to produce effective emulsion injections as a anticancer factor.
Only bacterial isolates showed positive growth on MGA which utilized L-glutamine as the sole metabolic growth source of nitrogen. The optimal environmental and physiological factors affecting growth of positive bacterial isolates were PH 7.4 at temperature 37 0C. The morphological and the biochemical tests revealed that Bacillus cereus was the major positive bacterial producing L-glutaminase isolate from the soil samples collected from different soil environments in Egypt. The optimal conditions for characterization of L-glutaminase production were with the following activators KCL, ZnSO4, FeSO4, K2HPO4, MgSO4 at PH 7.4 and temperature 37 0C. L-glutaminase produced from Bacillus cereus 14579 showed high efficacy and bio-availability as anticancer agent. Molecular mass of L-glutaminase was approximately 37 KDa, The yield [productivity] was 5.2 U/ml during the initial production from MGA; while it rose to 42.96 U/ml via bacterial recombinant DNA production. L-glutaminase was purified to yield total activity 12,990 ± 19.76 (U), specific activity 384.66 ± 8.92 (U/mg of protein), and purification fold 2 ± 2.99 with final enzyme recovery 55 ± 1.23 %. Furthermore, Mn2+, K+, Na+, and Fe3+ were enzymatic activators that increased the L-glutaminase activity by 19 %, 23 %, 15 %, and 9 %, respectively. It showed potent DPPH scavenging activities with IC50 = 203 μg/mL and anticancer activities against human liver (HepG-2), colon (HCT-116), breast (MCF-7), lung (A-549), lymphocytic (CCL-120) and cervical (Hela) cancer cell lines with IC50 40.72, 9.7, 7.39, 20.61, 51.28 and 11.55 μg/mL, respectively. The kinetic parameters of Km and Vmax were 13.2 × 10⁻⁵ M and 119.86 μmol/mL/min, respectively, which reflected a higher affinity for its substrate. The purified L-glutaminase showed a maximal activity against L-glutamine when, it was incubated at PH 8.5 at 40.5 0C for 35 minutes in addition to agitation at195 rev/min. And inoculum size 1× 10⁸ spores/ml. It maintained its stability at a wide range of PH from 5-10.5 and was thermostable up to 60 0C with Tm [melting temperature] value 56.810C. It demonstrated high affinity and catalytic activity for L-glutamine. Mechanism of action of was found to be because L-glutaminase activates caspase 8 leading to apoptosis of cancer cells which are auxotrophic for L-glutamine; as well as due to deprivation of the cancer cells from obtaining L-glutamine [which is considered a sole metabolic source of carbon and nitrogen], as a consequence of degradation of L-glutamine in the external surrounding media by L-glutaminase. L-glutamine mediated selective death of cancer cells was considered, since the cancerous cells were unable to synthesize L-glutamine due to the lack of L-glutamine synthase; unlike the normal cells which contains L-glutamine synthase.
According to the findings, L-glutaminase isolated from Bacillus cereus exhibited good antioxidant activities. As the concentration rose, there was a remarkable proportionate increase in scavenging activity. This was approved via IC50 values for ascorbic acid as the control and L-glutaminase which were 99 and 203 mcg/ml respectively. L-glutamine could exhibit antioxidant properties and a proportional increase was observed in scavenging activity along with the concentration of antioxidant molecule. L-glutaminase utilized scavenge free radicals generated in vitro by donating their protons(H). L-glutaminase resembled other antioxidant enzymes such as superoxide dismutase, catalase, glutathione peroxidase and reductase in its ability to convert reactive oxygen species into non reactive oxygen molecule. As a result L-glutaminase can be considered protective mechanism in reactive oxygen species [ROS] development.
According to Butheina A et al., 2021 study, the IC50 value of antioxidant activity of L-glutaminase reached 165 mcg/ml; whereas the IC50 of antioxidant activity of L-ascorbic acid reached 65 mcg/ml [18].
Eman Z et al., 2022 study stated that the produced L-glutaminase by the isolated marine bacterial strain Bacillus sp. DV2-37 showed potential anticancer activity against all the tested cell lines with IC50 values of 3.5, 3.4 and 3.8 mcg/ml for MCF-7, HepG-2 and HCT-116, respectively. As well, it stated that the maximum L-glutaminase productivity(47.12) by Bacillus sp. DV2-37 was obtained at 96 hours of cultivation period. After that the enzyme production decreased, suggesting its association with growth parameters [19].
The present study showed corresponding anticancer activities towards the same these cell lines. Nathiya et al., 2011 study mentioned that L-glutaminase purified from a bacterium was able to stop a breast carcinoma with IC50 of 256 mcg/ml [20].
Kiruthika, 2013 study confirmed that the maximum L-glutaminase activity by Vibrio azureus JK-79 isolated from marine environment was at 37 0C [21].
Hassan M Awad et al., 2019 study stated that the purified L-glutaminase had a molecular mass of 55 kDa, Km and Vmax values of 1.314mmol/l and 95.24 µ Me/min, respectively. Of the various physio-chemical parameters tested, PH 7.5 and temperature 40 0C were optimal for the enzyme activity [22].
Nagwa M et al., 2019 study confirmed that the optimized conditions for L-glutaminase production by isolate FIH was found to be 6 days at 35 0C and PH 7 under static and dark incubation conditions with inoculum size of 4.38x 10⁶ spores/ ml. The optimization led to the production of 7.66 U/ml of L-glutaminase with great stability at 4% salt concentration [23].
Glucose was the best carbon source for L-glutaminase production by Pseudomonas aurignosa as indicated by Al-Zahrani et al., 2020 study [24].
Kiruthika and Nachimuthu, 2014 reported that L-glutaminase production by marine Bacillus subtilis JK-79 was enhanced by using yeast extract [25].
Pandian et al., 2014 reported that purified L-glutaminase by Alcaligenes faecalis KL102 inhibited the growth of Hela cells with an IC50 value of 12.5 mcg/ml [26].
In the present study, L-glutaminase exhibited weak toxicity to the normal Vero cell lines indicating that this enzyme possesses high selectivity towards cancer cells. As well the PH range 6-9 was reported to be the most favorable range for L-glutaminase production.
Krisha-kumar et al., 2011 study mentioned that the highest production of L-glutaminase by the marine alkalophilic Streptomyces sp. SBU1 was at 96 hours of incubation period [27]. However, maximum L-glutaminase production was achieved at 18 hours of incubation time by marine isolated bacterial strain Bacillus subtilis as reported by Zhang et al., 2021 [28]. The current investigation found less detectable immunogenicity against L-glutaminase coupled with PEG than other bacterial L-glutaminases used in prior studies. The duration of the activity, on the other hand, was prolonged due to PEG chelation, but it was shorter when L-glutaminase was used without PEG conjugation.

Conclusion

Bacterial L-glutaminase was an ideal anticancer agent for the treatment of auxotrophic cancers for glutamine such as acute lymphocytic leukaemia.
It was found that Bacillus cereus group was the main bacterial isolate producing glutaminase enzyme. We recommend that researchers explore fungal sources of L-glutaminase in the future.

Note

1
Final PH at 25 0C: 7.3.

References

  1. Bardal Stan, Waechter Jason, Martin Douglas [2020]. Applied pharmacology.V14: Chemotherapeutic drugs. Elsevier Edinburgh, London. 2020. 14[2]: 1348-1362.
  2. Caroline S, Zeind Michael G. 2018. Applied therapeutics, the clinical use of drugs.V23: Complications of End-Stage Liver Disease. Wolters Kluwer, London. 2018. 23[7]: 863-874.
  3. Dipro Cecily, Schwinghammer Terry, Dipro Joseph, Well Barbara. 2021. Pharmacotherapy handbook.V13: Hepatic carcinoma. McGraw Hill Education, New York. 2021. 13(9): 1882-1893.
  4. Fisher Bruce, Champe Pamela, Harvey Richard [2021]. Lippincott illustrated reviews microbiology. V6:Virology. Wolters Kluwer, London. 2021. 6(8): 762-781.
  5. Golderg Stephen [2020]. Clinical physiology is made ridiculously simple.V6: Physiology of the liver. Med Master, Miami, United States of America. 2020. 6(9): 2311-2319.
  6. Levinson Warren [2021]. Review of medical microbiology and immunology. V15: Immunology. McGraw Hill Education, New York. 2021. 15[13]: 737-753.
  7. Meeting Patricia J [2019]. Physiology.V16: Gastrointestinal physiology. McGraw Hill Education, New York. 2019. 16[1]: 1587-1604.
  8. Olson James [2020]. Clinical pharmacology made ridiculously simple. V7: Anticancer drugs. MedMaster, Miami, United States of America. 2020. 7[5]: 142-153.
  9. Parveen Kumar [2017]. Kumar, Clark’s clinical medicine.V9: Oncology. Elsevier Edinburgh London. 2017. 9[20]: 661-668.
  10. Parveen Nadaf et al. [2019]. Isolation, screening and characterization of L-glutaminase producing soil bacteria. International journal of pharmaceutical sciences and research; 23(9):1882-1893. 2019.
  11. Trevor Anthony, Katzung Bertram, Kruidering-Hall Marieke [2021]. Katzung Trevor pharmacology examination board review.V13: Anticancer drugs. McGraw Hill Education, New York. 2021. 13[7]: 513-527.
  12. Swanson Larry N, Souney Paul F, Muntnick Alan H, Shargel Leon. 2019. Comprehensive Pharmacy Review for NAPLEX.V10: Oncology. Wolters Kluwer, London. 2019. 10[13]: 1738-1749.
  13. Wilson Golder N [2019]. Biochemistry and genetics. V8: Gastroenterology and nutrition. McGraw Hill Education, New York. 2019. 8(3): 876-884.
  14. Bionod P et al. [2017]. Recent developments in L-glutaminase production and applications- an overview. Journal of bioresource technology. 2017; 245(2): 1766-1774.
  15. Sajitha N et al. [2014]. Antibacterial and antioxidant activities of L-glutaminase from seaweed endophytic fungi penicillium citrinum. Journal of international microbiology. 2014; Corpus ID: 85718144.
  16. Tung Duc Vo et al. [2020]. Safety assessment of L-glutaminase from Aspergillus niger. Journal of food science and nutrition. 2020; 8(3): 1433-1450.
  17. Singh P et al. Biochemical characterization and antitumor study of L-glutaminase from Bacillus cereus MTCC 1305. Journal of applied biochemistry biotechnology. 2013; 171(2): 522- 531.
  18. Butheina A et al. [2021]. Evidence of Antioxidant Activity of Novel L-Glutaminase Purified from L. Gasseri Brlhm. Journal of Applied Sciences and Nanotechnology. Vol. 1, No. 4 (2021).
  19. Eman Z et al. [2022]. Production, characterization and anti-tumor efficiency of L-glutaminase from halophilic bacteria. Journal of bulletin of the national research centre. 2022, 46[10].
  20. Nathiya et al. [2011]. Screening of a high glutaminolytic enzyme producing strain and its extracellular production by solid state fermentation. International Journal of Pharma and Bio Sciences 2(3):297-302.
  21. Kiruthika Jambulingam et al. [2013]. production of L- glutaminase ant its optimization from a novel marine isolate Vibrio azureus JK-79. African journal of biotechnology. Vol. 12, No. 50[2013].
  22. Hassan M Awad et al. [2019]. Biochemical studies and biological activities on L-glutaminase from rhizosphere soil Streptomyces rochei SAH2_CWMSG. Egyptian pharmaceutical journal. 2019, 18[1]: 27-41.
  23. Nagwa M et al. [2019]. Anticancer L-glutaminase production and optimization using halo-tolerant Aspergillus flavus CZCU-9, F1H. Journal of Al-Azhar Bulletin of Science Vol. 30, No. 1, (June) 2019, pp. 1-9.
  24. Al-Zahrani NH [2020]. Screening L-Glutaminase producing some Pseudomonas sp. isolated from contact lenses by Rapid Plate Assay. Medical Science, 2020, 24(105): 3647-3654.
  25. Nachimuthu S et al. [2014]. Isolation and characterization of a novel L-glutaminase producing marine Bacillus subtilis strain JK-79. Asian Journal of Microbiology, Biotechnology and Environmental Sciences. January 2014.16(3): 601-610.
  26. Pandian, S.R.K., Deepak, V., Sivasubramaniam, S.D. et al. [2014]. Optimization and purification of anticancer enzyme L-glutaminase from Alcaligenes faecalis KLU102. Journal of Biologia. 2014; 69: 1644–1651. https://doi.org/10.2478/s11756-014-0486-1. [CrossRef]
  27. Krisha k et al. [2011]. Extracellular production of L-Glutaminase by marine alkalophilic Streptomyces sp.-SBU1 isolated from Cape Comorin coast. Indian Journal of Geo-Marine Sciences. 2011; 40(5).
  28. Zhang G et al. [2021]. Protein-glutaminase: Research progress and prospect in food manufacturing. Journal of food bioscience. 2019; Volume 43, October 2021, 101314.
Disclaimer/Publisher’s Note: The statements, opinions and data contained in all publications are solely those of the individual author(s) and contributor(s) and not of MDPI and/or the editor(s). MDPI and/or the editor(s) disclaim responsibility for any injury to people or property resulting from any ideas, methods, instructions or products referred to in the content.
Copyright: This open access article is published under a Creative Commons CC BY 4.0 license, which permit the free download, distribution, and reuse, provided that the author and preprint are cited in any reuse.
Prerpints.org logo

Preprints.org is a free preprint server supported by MDPI in Basel, Switzerland.

Subscribe

© 2024 MDPI (Basel, Switzerland) unless otherwise stated