
Submitted:
15 May 2024
Posted:
16 May 2024
You are already at the latest version
Abstract
In this report, we present a study demonstrating how machine learning methods can reveal the interaction of different risk factors of post-transplant leukemic relapse and obtain robust predictions even with a modest clinical dataset. Using a cohort of 63 pediatric patients with acute lymphocytic leukemia (ALL) and 46 patients with acute myeloid leukemia (AML) who underwent stem cell transplant at a single institution, we built predictive models of leukemic relapse with both pretransplant and posttransplant patient variables (specifically lineage-specific chimerism) using the random forest classifier. The random forest classifier revealed different important predictive factors between ALL and AML in our relapse models consistent with previous knowledge. Furthermore, it also distinguished donor CD34 chimerism as most impactful in relapse prediction compare to donor chimerism of other cellular lineages in our dataset for ALL but CD3 for AML. Our models greatly improved sensitivity and specificity at predicting relapses in cross validation compared to a reference model based on our own institutional incidence of relapse and inferential statistical principles. Local Interpretable Model-Agnostic Explanations, an interpretable machine learning tool, confirmed our Random Forest Classification result and provided an intuitive explanation of how our machine learning models made the relapse prediction for each individual patient.
Keywords:
Leukemia
; relapse
; predictive model
; random forest
; machine learning
1. Introduction
Leukemia relapse remains a major cause of treatment failure after hematopoietic stem cell transplant (HSCT) for pediatric patients with acute lymphoblastic leukemia (ALL) or acute myeloid leukemia (AML).[1,2] Post-transplant donor chimerism has been identified as a predictor of relapse in patients with hematologic malignancies who received HSCT, suggesting the possibility of meaningful relapse surveillance prior to the detection of minimal residual disease [3,4,5,6,7]. The ability to more accurately forecast leukemia relapse would likely improve post-transplant outcome by enabling more timely initiation of post-transplant treatment strategies [8,9,10,11]. The application these post-transplant chimerism analyses to predict leukemia relapse is limited by the fact that studies mostly correlate relapse to a single selected threshold of chimerism at fixed time points, making it more difficult to apply to individual patients and their own unique risk factors. A prediction model that takes account of both pretransplant risk factors and post-transplant chimerism could help clinicians assess relapse risk and individualize treatment strategies.
One way to achieve a deeper understanding of the complex interaction of multiple risk factors is through the application of machine learning (ML), a suite of data analysis methods which automate analytical model building emphasizing pattern recognition and has been adopted in hematology [12,13,14,15]. Instead of focusing on making statistical inference to the entire population, ML methods hone in on the structure of the data itself, leading to better pattern recognition [16]. A number of studies have used ML to build predictive models with large datasets; Fuse et al published their work on using ML to predict leukemia relapse within the first year of HSCT and achieved a highly accurate prediction in cross validation with only [7] pretransplant variables [17]. On a larger scale, Shouval et al reported the European Society for Blood and Marrow Transplantation (EBMT) ML analysis of Day 100 non-relapse mortality and found that only 3 to 5 variables were necessary to achieve maximum predictive skill in each model, suggesting that a few high impact variables might be adequate to make accurate predictions for focused clinical questions with ML [18] While there are increasing numbers of large or “big” datasets, there are many more smaller datasets available from more focused clinical studies. These findings raise the question of whether that, while well suited for “big data”, ML methods may also be successfully applied to smaller datasets to extract useful information and build useful predictive models that could complement standard statistical analysis [19,20,21,22,23]. An obstacle of applying ML in clinical decision making is that these prediction models are often viewed as a “black box” to clinicians. Interpretable machine learning (IML) methods can help illustrate in an intuitive manner on how an ML algorithm learns the relationship between the input variables and the predicted outcome [24,25] To further demonstrate the potential of ML/IML analysis to extract valid information for focused clinical questions, we used a random forest (RF) classifier, a ML algorithm, to analyze the pattern of posttransplant relapse using pretransplant variables and post-transplant chimerism in a single-center cohort of patients with ALL and AML undergoing HSCT. Our RF analysis yielded findings consistent with the current knowledge, but was also able to detect different patterns of interactions between the variables in subgroups. IML, specifically Local Interpretable Model-Agnostic Explanations (LIME), was applied each individual patient and collaborated with our RF analysis, lending more confidence in the RF prediction model [26].
2. Materials & Methods
2.1. Study Design and Data Acquisition
We performed a retrospective archival data analysis using RF classification to produce predictive models of leukemic relapse in post-HSCT setting. Patients with the diagnosis of ALL and AML (confirmed by immunophenotyping and pathology review) undergoing HSCT with at least 18 months of follow-up at Lucile Packard Children’s Hospital (LPCH), a tertiary teaching hospital, from 2012 to 2020 were included in the analysis. Patients who relapsed beyond 24 months post-HSCT were excluded from the analysis due to the paucity of chimerism data beyond the first year of HSCT. Patients who had no chimerism data were also excluded. Time-invariant variables included demographics, remission status, inclusion of total body irradiation in the conditioning regimen, development of the graft-versus-host (GVHD) diseases post-HSCT. Graft source, HLA match and GVHD prophylaxis were combined as one variable given our center’s standard approach—bone marrow grafts were given tacrolimus/methotrexate, cord blood grafts were given tacrolimus/mycophenolate and peripheral blood stem cell grafts were almost exclusively used in haploidentical SCT with ex vivo T-cell depletion. Post-HSCT donor chimerism tests were performed between 1 and 5 times (at approximately 1, 2, 3, 6 and 12-months post-transplant) per patient and used as time-variant variables. Leukemic relapse was defined as detection of leukemic blasts by minimal residual disease flow cytometry and confirmed by the pathology review. Chimerism results at the same time of the leukemic relapse were excluded since they would correlate 100% with relapse and offer no value in the predictive model.
Posttransplant chimerism was performed with the AmpFLSTR™ Identifiler™ PCR Amplification Kit (Thermo Fisher Scientific, Waltham, MA) which is a multiplex short tandem repeat assay. The test involves amplifying 15 tetranucleotide repeat loci and Amelogenin gender determining marker in a single PCR reaction using DNA extracted from peripheral blood/bone marrow aspirate samples, and lineage-specific cell subsets (CD3, CD15 and CD34) isolated from blood/marrow specimens. For isolation of CD34+ cells from peripheral blood or bone marrow, Ficoll-Hypague was first used to isolate the mononuclear cells followed by positive selection of CD34+ cell subset with CD34 monoclonal antibody conjugated to magnetic nanoparticles. The rest of the cell subsets were isolated through positive selection with the corresponding monoclonal antibodies conjugated to magnetic nanoparticles. Based on the differences between recipient and donor STR alleles, the presence and quantitative fractions of recipient/donor chimerisms were determined.
Clinical data was collected from internal database maintained for Center of International Blood Marrow Transplant Research data submission by the data management team at LPCH and crossed checked against source documents in the electronic medical record (EMR). Chimerism data were obtained from EMR and cross checked with the internal HLA laboratory database for accuracy and completeness. All data collected was independently verified by two investigators.
Once the data was verified and cleaned, they were assembled and merged for machine learning. For the analysis, we considered each test to be an independent observation, with any patient-level impact on relapse probability being controlled by the time-invariant variables. Each set of test results is linked to the final relapse outcome for that patient, coded as a ‘1’ for relapse, and ‘0’ for no relapse within the study period. As we excluded any post-relapse test information, our model framework estimates the risk of future relapse, given any test within the 18-month follow-up period.
The institutional review boards of both Stanford (IRB 58403) and University of Utah (IRB 00137615) approved the study.
2.2. Standard Statistical Analysis
Wilcoxon rank sum test was performed on all post-transplant lineage-specific donor chimerism analyzing them collectively as well as by different time point. This was performed to confirm the correlation between mixed chimerism and relapse in our dataset prior to machine learning analysis.
2.3. Machine Learning Analysis
For the relapse dataset, we first created a simple baseline predictive model to compare against the random forest, we define the baseline model by setting the probability of relapse () for each case as the proportion of relapse cases in the sample dataset. We further used a Monte Carlo approach to assess the uncertainty in this baseline model by repeatedly assigning relapse or non-relapse status to each case based on random draws from a binomial distribution with . This Monte Carlo simulation provided a range of possible outcomes and their probability of occurring for any test.
We then used a random forest to build a predictive model of relapse risk. Model predictive skill was assessed using a nested 5-fold cross-validation. The outer cross-validation loop was used to assess model skill as the area under the curve (AUC) score of the receiver operator characteristic (ROC) curve, a threshold independent metric widely used to test the accuracy of binary predictions, as well as sensitivity and specificity. In addition to this outer cross-validation, we used an inner 5-fold cross-validation to tune the model hyperparameters, including the minimum node size (nodesize), the size of the subset of variables for each split (mtry) and the number of trees (ntree). A stratified sampling approach was used to form all training and testing datasets to ensure that all tests for an individual patient were either in the training or testing dataset. The same approach was used to assess the baseline model to allow comparisons with the random forest results.
Following cross-validation, we built a final Random Forest model using the full dataset and the parameter values obtained from tuning. This model was then used to estimate feature importance, partial dependencies that show the marginal response of the model, and LIME models. All calculations were carried out using the open-source R statistical language, which provides many add-on packages to facilitate machine learning.[27] Random forests were built using the R package ranger, which allowed the forest to be built using multiple CPU cores, with notable increases in computational time. [28] Cross-validation was carried out using the caret package [29],and LIME models were built using the lime package. Additional information on ML and IML methods used in the study can be found in the supplementary materials. Our work contains all pertinent elements of medical AI publication per International Journal of Medical Informatics 2021 guidelines [30].
2.4. Data Sharing
Please contact the corresponding author for the patient data set. Machine learning codes with explanation as well as all subgroup analysis and LIME analysis for every individual patient can be found at https://simonbrewer.github.io/aml_all/
3. Results
63 ALL patients and 46 AML patients were included in our data analysis, with a total of 141 tests. Table 1 and Table 2 summarize the variables included in our study. The median and mean days from last peripheral chimerism to relapse in our study cohort were 63 and 129 days for ALL, and 39 and 132 days for AML, respectively. All patients had minimal residual disease evaluation by flow cytometry on the same days of the chimerism testing. Wilcoxon rank sum test demonstrated statistical significance between peripheral blood and marrow donor chimerism between relapse vs no-relapse group in the both the ALL and AML cohort (Figure 1).
We observed a drop-off in the post-HSCT chimerism testing for both ALL and AML cohorts starting at the 6-month time points and significantly less at 12-month time points. This is partially attributed to deaths from other causes and relapses. The missing chimerism data likely to have minimal impact the model given most of the relapses occurs within 300 days (12 out of 14 ALL relapses and 10 out of 13 from AML).
Hyperparameter tuning of the random forest resulted in the following values: mtry (number of variables randomly chosen for each split) = 8; nodesize (minimum node size for partitioning) = 4; ntree (total number of trees built) = 500. Model accuracy was first assessed using the out-of-bag (OOB) error rate estimate, based on the samples excluded in each bootstrap iteration. The OOB rate was 8% for the ALL cohort and 14% for the AML cohort, which supported strongly the validity of our models. The results of the cross-validation process showed that a random forest model using these hyperparameter values achieves 85% accuracy, 85% sensitivity, 89% specificity for ALL and 81% accuracy, 75% sensitivity and 100% specificity for AML at predicting relapses within 24 months post-HSCT in cross validation. This represented a significant improvement over the baseline Monte Carlo simulation model, which has sensitivity similar to incidence of relapse in our patient cohorts.
Variable importance values were estimated using a final Random Forest model based on the full dataset and the selected hyperparameter values, and ranked based on the relative importance of the different variables. For the ALL cohort, our analysis showed recipient age as the most important predictive feature amongst the variables we tested, while whole blood or marrow chimerism was the most important post-transplant variable. For AML, peripheral CD3 chimerism was the most important variable (Figure 2).
The same model was then used to calculate partial dependency plots (PDPs) for the highest ranked variables from the importance analysis. The PDP of the probability of relapse to recipient age at transplant is shown in Figure 3, and the PDP of peripheral blood chimerism of various lineages in Figure 4. The age PDP identified the highest risk of relapse in patients less than 2 years old in our cohort and higher relapse risk in teenage/adolescent patients in ALL.
PDPs for the lineage specific peripheral blood chimerism showed an increase in relapse risk with decreases of all lineages, but large differences in the scale response, indicating that CD34 was most impactful at predicting relapse. Notably, this exhibited a threshold effect at 95% donor chimerism where < 95% confers significantly increased relapse risk. In contrast, age did not have large impact in risk of relapse in AML. PB CD3 chimerism showed similar threshold at 95%. Of note, whole marrow chimerism was most predictive of relapse compare to lineage specific chimerism in both ALL and AML patients with a threshold of 95% (Figure 4).
We used 2-dimensional PDPs to illustrate the interaction between two continuous variables. These illustrated changes in relapse risk as a heatmap, with the color scale indicating the probability of relapse for pairwise combinations of two selected variables. The interaction between peripheral blood CD34 and CD3 chimerism (Figure 5) showed the 95% threshold of CD34 chimerism values far outweighs the effect of changes in CD3 chimerism in ALL and vice versa in AML.
We used LIME plots to illustrate how the random forest model makes predictions for an individual, helping to identify how the specific characteristics of an individual increase or decrease the probability of predicted relapse. As the random forest model captured both non-linearities in the data and interactions between variables, the impact of these characteristics may vary strongly between individuals. For example, an individual’s age might correspond to a region of the partial dependency where the response changes very little, so a change in the patient’s age would have little impact on the overall prediction. As a result, other variables were able to dominate and inform the prediction. In each plot, the bars show whether the value of a variable decreases (red) or increases (blue) the risk of relapse. In a given example, the overall predicted probability or relapse is given above each figure and increases slightly and expressed in probability (Figure 6).
The explanation fit indicates how good the LIME analysis explains the model predictions for that individual; lower values indicate that the results should be interpreted with caution. Our LIME analysis has explanation fit up to 0.5 for both ALL and AML, indicating the LIME can explain about 50% of the RF model. The LIME analysis for consistently selected TBI = ‘yes’ having a positive effect at decreasing relapse risk, in contrast with the variable importance scores (figure 2), where TBI was only ranked 9th, far behind age, the most important variable. This indicated that while the presence or absence of TBI has relatively little predictive power for the entire cohort, it may be highly important for individual patients.
4. Discussion
A major obstacle of applying ML in the clinical setting is that they are often viewed by clinicians as “black box” models, in which the ML algorithm make predictions in an unknown fashion, leading to skepticism. On the contrary, ML methods can actually provide information about dataset both “globally” and “locally” in an intuitive manner, and we argue that this information can be used to supplement traditional assessment methods, even with small datasets. Variable importance provides a “global” view of the predictive model or how the variables influence the analysis of relapse for the population or cohort of patients. Partial dependence allows us to visualize how the probability of relapse varies across the range of values for any variable, illustrating how the ML can capture different types of response, including linear, non-linear or threshold. By calculating the partial dependency for two variables, we can further visualize how the model captures interactions between variables and that these interactions can also be non-linear. It is important to note that while we restricted our results to first order interactions, the model includes higher order interactions (e.g. the influence of variable x3 on the interaction between x1 and x2) [31]. These plots showed the nuance of the different variables and their interactions to relapse risk, which was the basis of improved prediction.
In contrast to the “global” view provided by variable importance and partial dependence, IML, e.g. LIME, shows how predictions are made “locally” or for individual cases. This provides another check on the logic of the machine learning prediction, and helps to identify the factors that most relevant to an individual prediction, and the extent to which they increase or decrease relapse risk as well as how confident can we be with any individual prediction. This again highlights the nonlinearity and interactions captured by the model, and allows us to better appreciate the main drivers of a given case which may be different between cases, and notably, different from what is the most important variable for the population. Our analysis suggests PB CD34 donor chimerism might warrant further investigation for pediatric patients with ALL for relapse surveillance. PB CD3 chimerism might be valuable in AML patients post-HSCT; however, the brisker pace of AML relapse makes disease surveillance challenging regardless.
The RF classifier dramatically improved relapse prediction within 18 months post-HSCT in the context of our dataset. Our model is far from being perfect and as it is based on a small sample size, it is difficult to know how well this would generalize to a patient population outside of our institution. However, the goal of our study was not meant to create a definitive or generally applicable prediction model, but instead to demonstrate the rationale of adopting ML/IML more broadly to improve patient care and add more value to existing data and knowledge even within a single institution. It is worth noting that during our study, the analytical results changed as we included more patient data, further illustrating the adaptable, learning nature of ML. ML methods offer a highly flexible approach for working with complex datasets, including low n, high p data, in which the number of variables or features is greater than the number of observations. They are potentially an useful and complementary approach to standard statistic methods on clinical studies constrained by smaller patient sample size or under powered [32]. The common perception of “large” sample size is requisite for validity or applicability in ML should be re-evaluated. The dataset should be appropriate for the clinical challenge and might not necessarily need to be large or highly granular details but, more importantly, relevant. Machine learning is not only for "big data", but can also be applied to smaller datasets, which may be more appropriate to answer more focused questions, particularly with rare diseases and less common medical challenges.
Author Contributions
D.S. designed and performed the research, collected the data, analyzed the data and wrote the paper. G.S. verified the data. B.Z. performed the chimerism testing. S.B. designed and performed research, contributed vital analytical tools, analyzed the data and wrote the paper. D.S. and S.B. contributed equally to this study.
Acknowledgments
We thank Dr. Robertson Parkman and Dr. Kenneth Weinberg (Stanford University) for providing critical feedback on the manuscript.
Conflicts of Interest
The authors declare no competing financial interests.
References
- Styczynski J, Tridello G, Koster L, et al. Death after hematopoietic stem cell transplantation: changes over calendar year time, infections and associated factors. Bone Marrow Transplant. 2020;55(1):126-136. [CrossRef]
- Styczyński J, Tridello G, Koster L, et al. Death after hematopoietic stem cell transplantation: changes over calendar year time, infections and associated factors. Bone Marrow Transplant. 2020;55(1):126-136. [CrossRef]
- Broglie L, Helenowski I, Jennings LJ, et al. Early mixed T-cell chimerism is predictive of pediatric AML or MDS relapse after hematopoietic stem cell transplant. Pediatr Blood Cancer. 2017;64(9). [CrossRef]
- Kinsella FAM, Inman CF, Gudger A, et al. Very early lineage-specific chimerism after reduced intensity stem cell transplantation is highly predictive of clinical outcome for patients with myeloid disease. Leuk Res. 2019;83:106173. [CrossRef]
- Lee HC, Saliba RM, Rondon G, et al. Mixed T Lymphocyte Chimerism after Allogeneic Hematopoietic Transplantation Is Predictive for Relapse of Acute Myeloid Leukemia and Myelodysplastic Syndromes. Biol Blood Marrow Transplant. 2015;21(11):1948-1954. [CrossRef]
- Preuner S, Peters C, Potschger U, et al. Risk assessment of relapse by lineage-specific monitoring of chimerism in children undergoing allogeneic stem cell transplantation for acute lymphoblastic leukemia. Haematologica. 2016;101(6):741-746. [CrossRef]
- Thompson PA, Stingo F, Keating MJ, et al. Long-term follow-up of patients receiving allogeneic stem cell transplant for chronic lymphocytic leukaemia: mixed T-cell chimerism is associated with high relapse risk and inferior survival. Br J Haematol. 2017;177(4):567-577. [CrossRef]
- Lee CJ, Savani BN, Mohty M, et al. Post-remission strategies for the prevention of relapse following allogeneic hematopoietic cell transplantation for high-risk acute myeloid leukemia: expert review from the Acute Leukemia Working Party of the European Society for Blood and Marrow Transplantation. Bone Marrow Transplant. 2019;54(4):519-530. [CrossRef]
- DeFilipp Z, Langston AA, Chen Z, et al. Does Post-Transplant Maintenance Therapy With Tyrosine Kinase Inhibitors Improve Outcomes of Patients With High-Risk Philadelphia Chromosome-Positive Leukemia? Clin Lymphoma Myeloma Leuk. 2016;16(8):466-471 e461. [CrossRef]
- Yan CH, Liu QF, Wu DP, et al. Prophylactic Donor Lymphocyte Infusion (DLI) Followed by Minimal Residual Disease and Graft-versus-Host Disease-Guided Multiple DLIs Could Improve Outcomes after Allogeneic Hematopoietic Stem Cell Transplantation in Patients with Refractory/Relapsed Acute Leukemia. Biol Blood Marrow Transplant. 2017;23(8):1311-1319. [CrossRef]
- Lankester AC, Locatelli F, Bader P, et al. Will post-transplantation cell therapies for pediatric patients become standard of care? Biol Blood Marrow Transplant. 2015;21(3):402-411. [CrossRef]
- Hastie T, Tibshirani R, Friedman J. Boosting and Additive Trees. In: Hastie T, Tibshirani R, Friedman J, eds. The Elements of Statistical Learning: Data Mining, Inference, and Prediction. New York, NY: Springer New York; 2009:337-387.
- Shouval R, Fein JA, Savani B, Mohty M, Nagler A. Machine learning and artificial intelligence in haematology. Br J Haematol. 2021;192(2):239-250. [CrossRef]
- Muhsen IN, Shyr D, Sung AD, Hashmi SK. Machine Learning Applications in the Diagnosis of Benign and Malignant Hematological Diseases. Clin Hematol Int. 2021;3(1):13-20. [CrossRef]
- Zhou Y, Smith J, Keerthi D, et al. Longitudinal clinical data improve survival prediction after hematopoietic cell transplantation using machine learning. Blood Adv. 2024;8(3):686-698. [CrossRef]
- Powers S, Qian J, Jung K, et al. Some methods for heterogeneous treatment effect estimation in high dimensions. Stat Med. 2018;37(11):1767-1787. [CrossRef]
- Fuse K, Uemura S, Tamura S, et al. Patient-based prediction algorithm of relapse after allo-HSCT for acute Leukemia and its usefulness in the decision-making process using a machine learning approach. Cancer Med. 2019;8(11):5058-5067. [CrossRef]
- Shouval R, Labopin M, Unger R, et al. Prediction of Hematopoietic Stem Cell Transplantation Related Mortality- Lessons Learned from the In-Silico Approach: A European Society for Blood and Marrow Transplantation Acute Leukemia Working Party Data Mining Study. PLoS One. 2016;11(3):e0150637. [CrossRef]
- Zhang Y, Ling C. A strategy to apply machine learning to small datasets in materials science. npj Computational Materials. 2018;4(1):25.
- Caiafa CF, Sun Z, Tanaka T, Marti-Puig P, Solé-Casals J. Machine Learning Methods with Noisy, Incomplete or Small Datasets. Applied Sciences. 2021;11(9):4132. [CrossRef]
- Koppe G, Meyer-Lindenberg A, Durstewitz D. Deep learning for small and big data in psychiatry. Neuropsychopharmacology. 2021;46(1):176-190. [CrossRef]
- Shaikhina T, Lowe D, Daga S, Briggs D, Higgins R, Khovanova N. Machine Learning for Predictive Modelling based on Small Data in Biomedical Engineering. IFAC-PapersOnLine. 2015;48(20):469-474. [CrossRef]
- Caiafa CF, Sun Z, Tanaka T, Marti-Puig P, Solé-Casals J. Machine Learning Methods with Noisy, Incomplete or Small Datasets. Applied Sciences. 2021;11(9). [CrossRef]
- Murdoch WJ, Singh C, Kumbier K, Abbasi-Asl R, Yu B. Definitions, methods, and applications in interpretable machine learning. Proc Natl Acad Sci U S A. 2019;116(44):22071-22080. [CrossRef]
- Rudin C. Stop explaining black box machine learning models for high stakes decisions and use interpretable models instead. Nature Machine Intelligence. 2019;1(5):206-215. [CrossRef]
- Kumarakulasinghe NB, Blomberg T, Liu J, Leao AS, Papapetrou P. Evaluating Local Interpretable Model-Agnostic Explanations on Clinical Machine Learning Classification Models. Paper presented at: 2020 IEEE 33rd International Symposium on Computer-Based Medical Systems (CBMS); 28-30 July 2020, 2020. [CrossRef]
- RCoreTeam. R:A language and environment for statistical computing. R Foundation for Statistical Computing, Vienna, Austria Web site. https://www.R-project.org. Published 2020. Accessed.
- Esplin IND, Berg JA, Sharma R, et al. Genome Sequences of 19 Novel Erwinia amylovora Bacteriophages. Genome Announc. 2017;5(46). [CrossRef]
- Kuhn M. Building Predictive Models in R Using the caret Package. 2008. 2008;28(5):26. [CrossRef]
- Cabitza F, Campagner A. The need to separate the wheat from the chaff in medical informatics: Introducing a comprehensive checklist for the (self)-assessment of medical AI studies. International Journal of Medical Informatics. 2021;153:104510. [CrossRef]
- Friedman JH, Popescu BE. Predictive Learning via Rule Ensembles. The Annals of Applied Statistics. 2008;2(3):916-954. [CrossRef]
- Bzdok D, Altman N, Krzywinski M. Statistics versus machine learning. Nat Methods. 2018;15(4):233-234. [CrossRef]
Figure 1.
Box plot of the post-transplant lineage-specific donor chimerism showing significant difference of peripheral blood CD34 donor chimerism between relapse and no-relapse, taken all measurement together as well by the different time points post-transplant. Bmc-bone marrow chimerism, pbc-peripheral blood chimerism, cdw-whole. Top right panel-ALL peripheral blood chimerism. Top left panel-ALL bone marrow chimerism. Bottom right-AML peripheral blood chimerism. Bottom left-AML bone marrow chimerism.
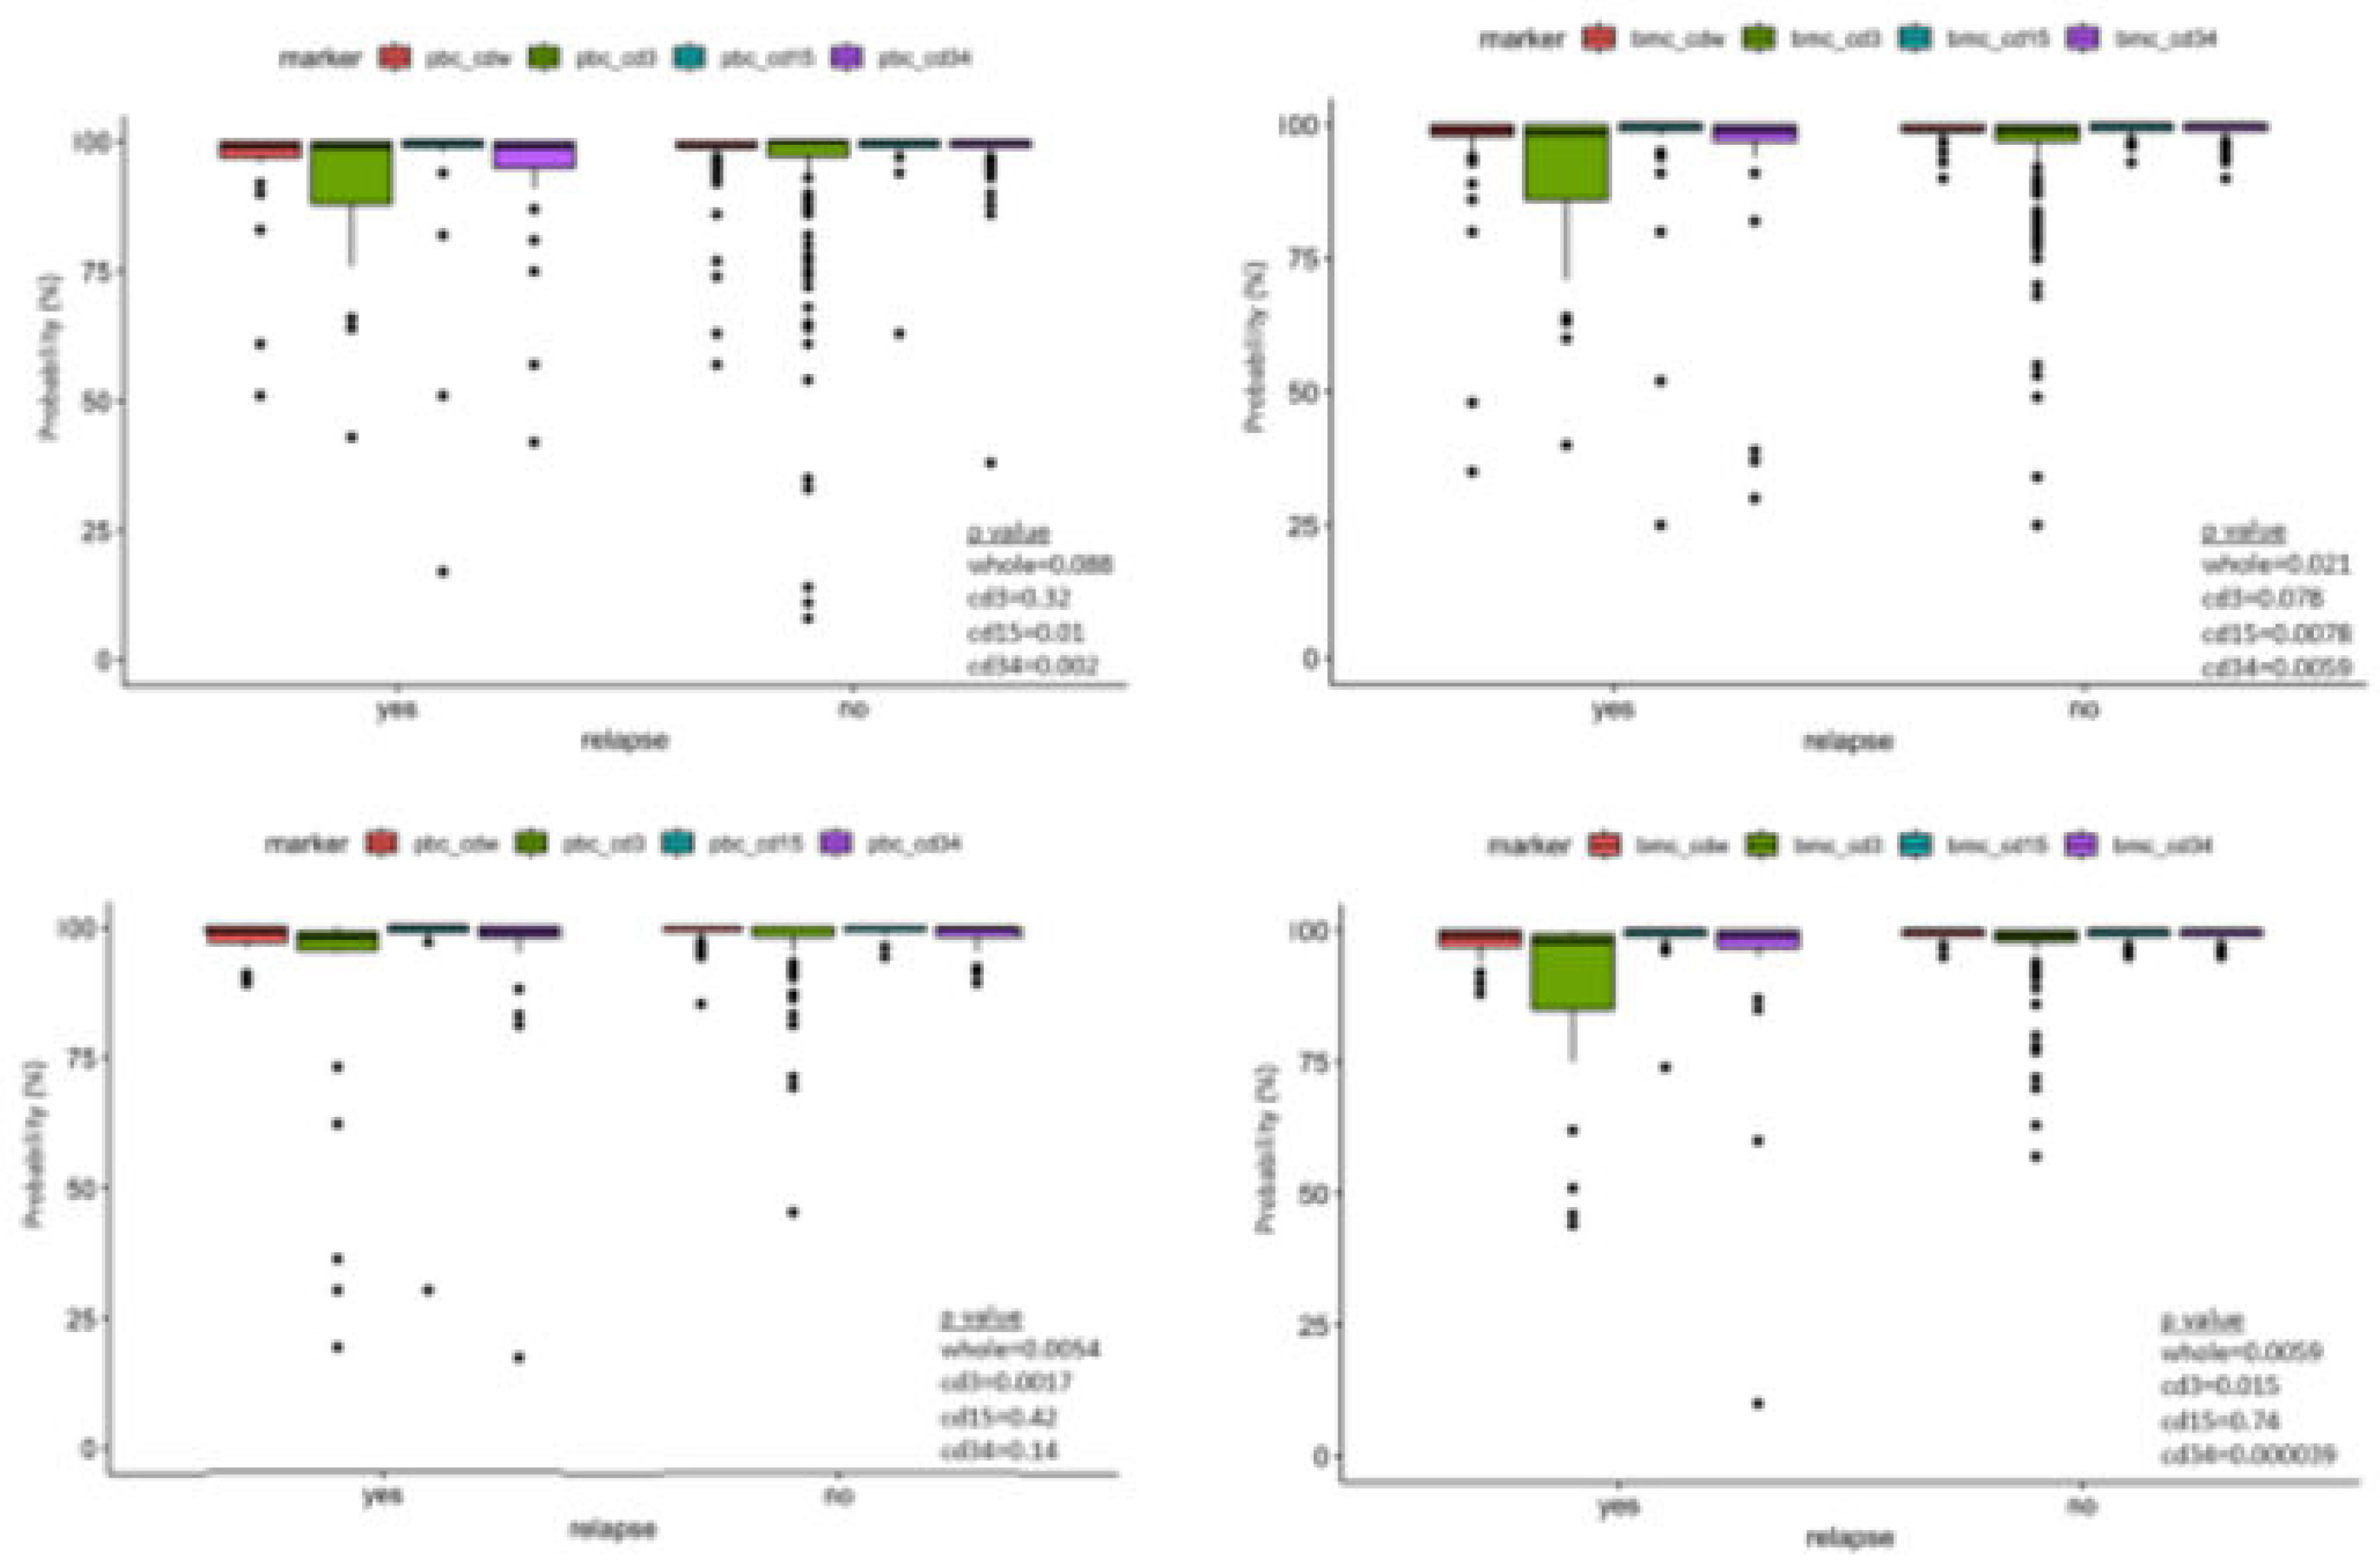
Figure 2.
Variable importance plot. Left panel shows variable importance for ALL. Right panel shows variable importance for AML. Recipient age at time of transplant was the most important variable (or feature) in the random forest classification for leukemic relapse for ALL. Peripheral CD3 donor chimerism was the most important variable for AML.
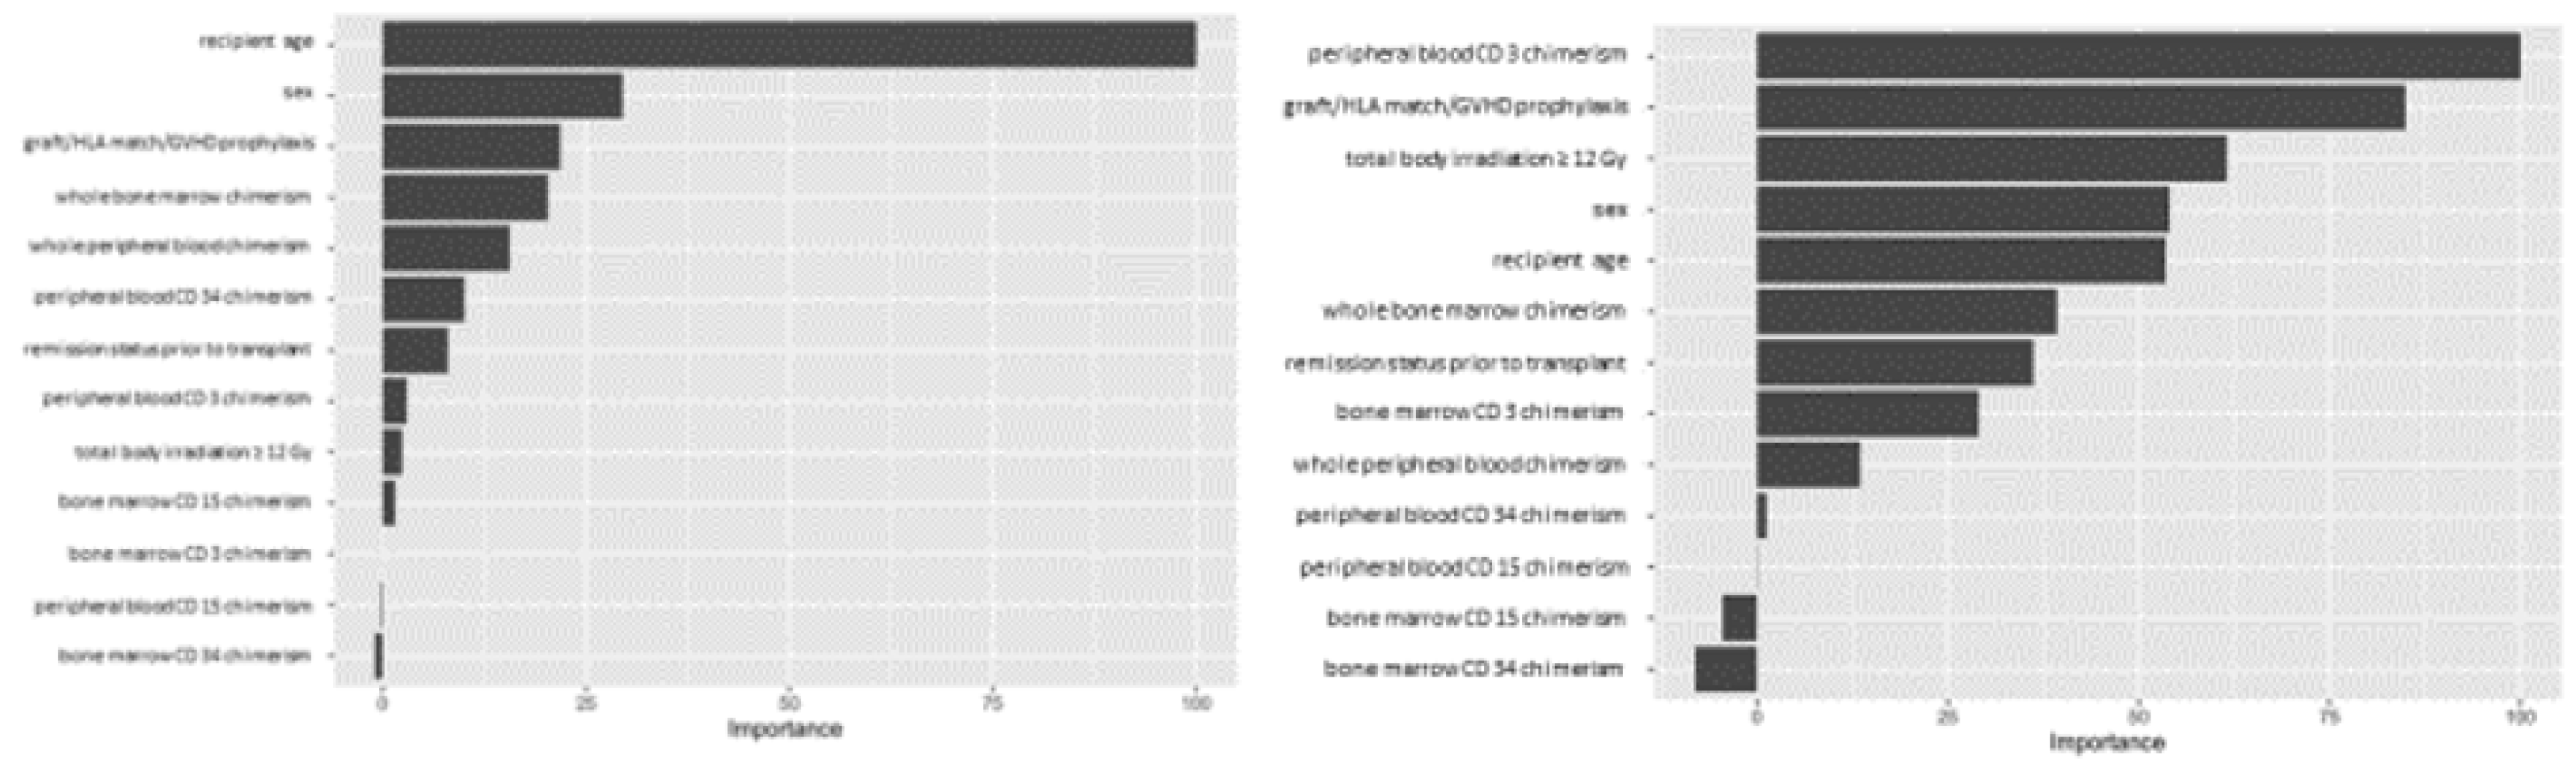
Figure 3.
Partial dependence plot visualizes the relationship of a given variable (feature) to leukemic relapse. In this figure, X-axis represents recipient age at transplant and Y-axis represents the probability of leukemic relapse as predicted by the Random Forest classification. Recipient age at transplant shows a bimodal distribution with younger patients having lower risk of relapse except those less than 1 year old, representing the very high-risk infantile leukemia.
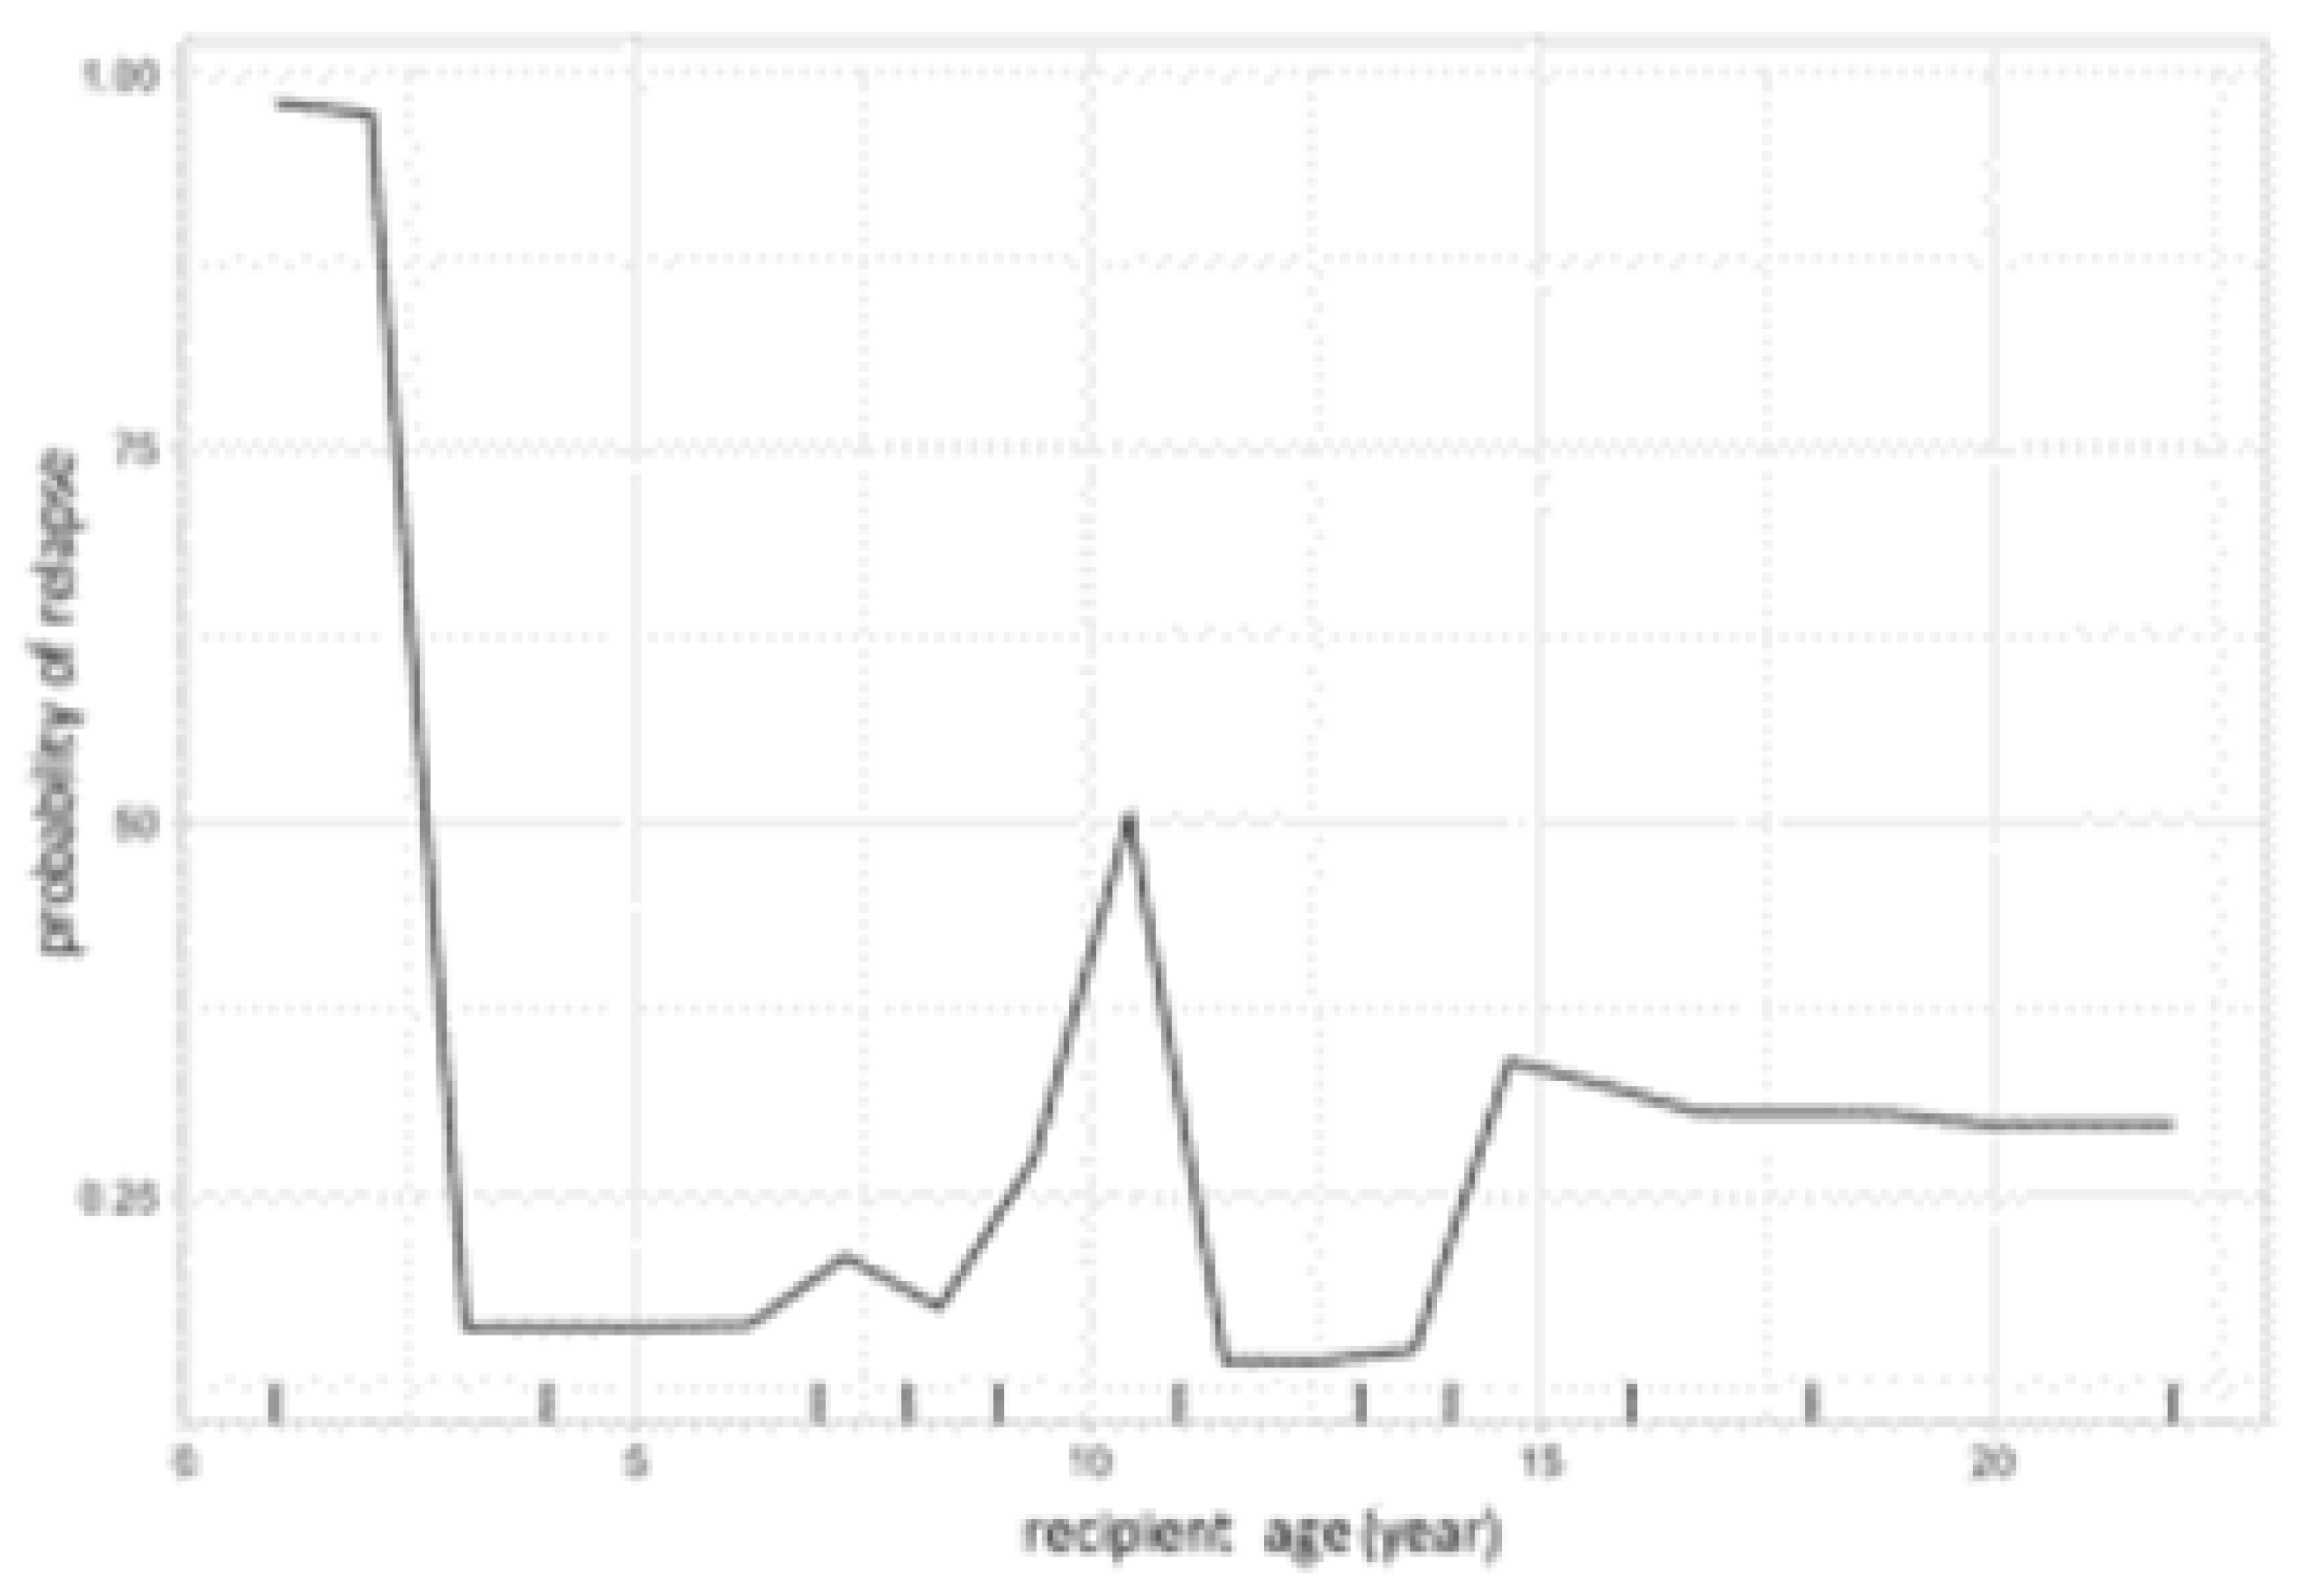
Figure 4.
Composite partial dependence plot of CD3, CD15, CD34 and whole peripheral/marrow blood donor chimerism to leukemic relapse. In this figure, X-axis represents lineage specific donor chimerism at transplant and Y-axis represents the probability of leukemic relapse. Top panel shows peripheral blood chimerism partial dependence for ALL on the left and AML on the right. CD34 chimerism below 95% dramatically increase risk of relapse for ALL, while CD3 chimerism below 95% dramatically increase risk of relapse for AML. Bottom panel shows bone marrow chimersim partial dependence for ALL on the left and AML on the right. Whole marrow chimerism below 95% greatly increases risk of relapse for both ALL and AML.
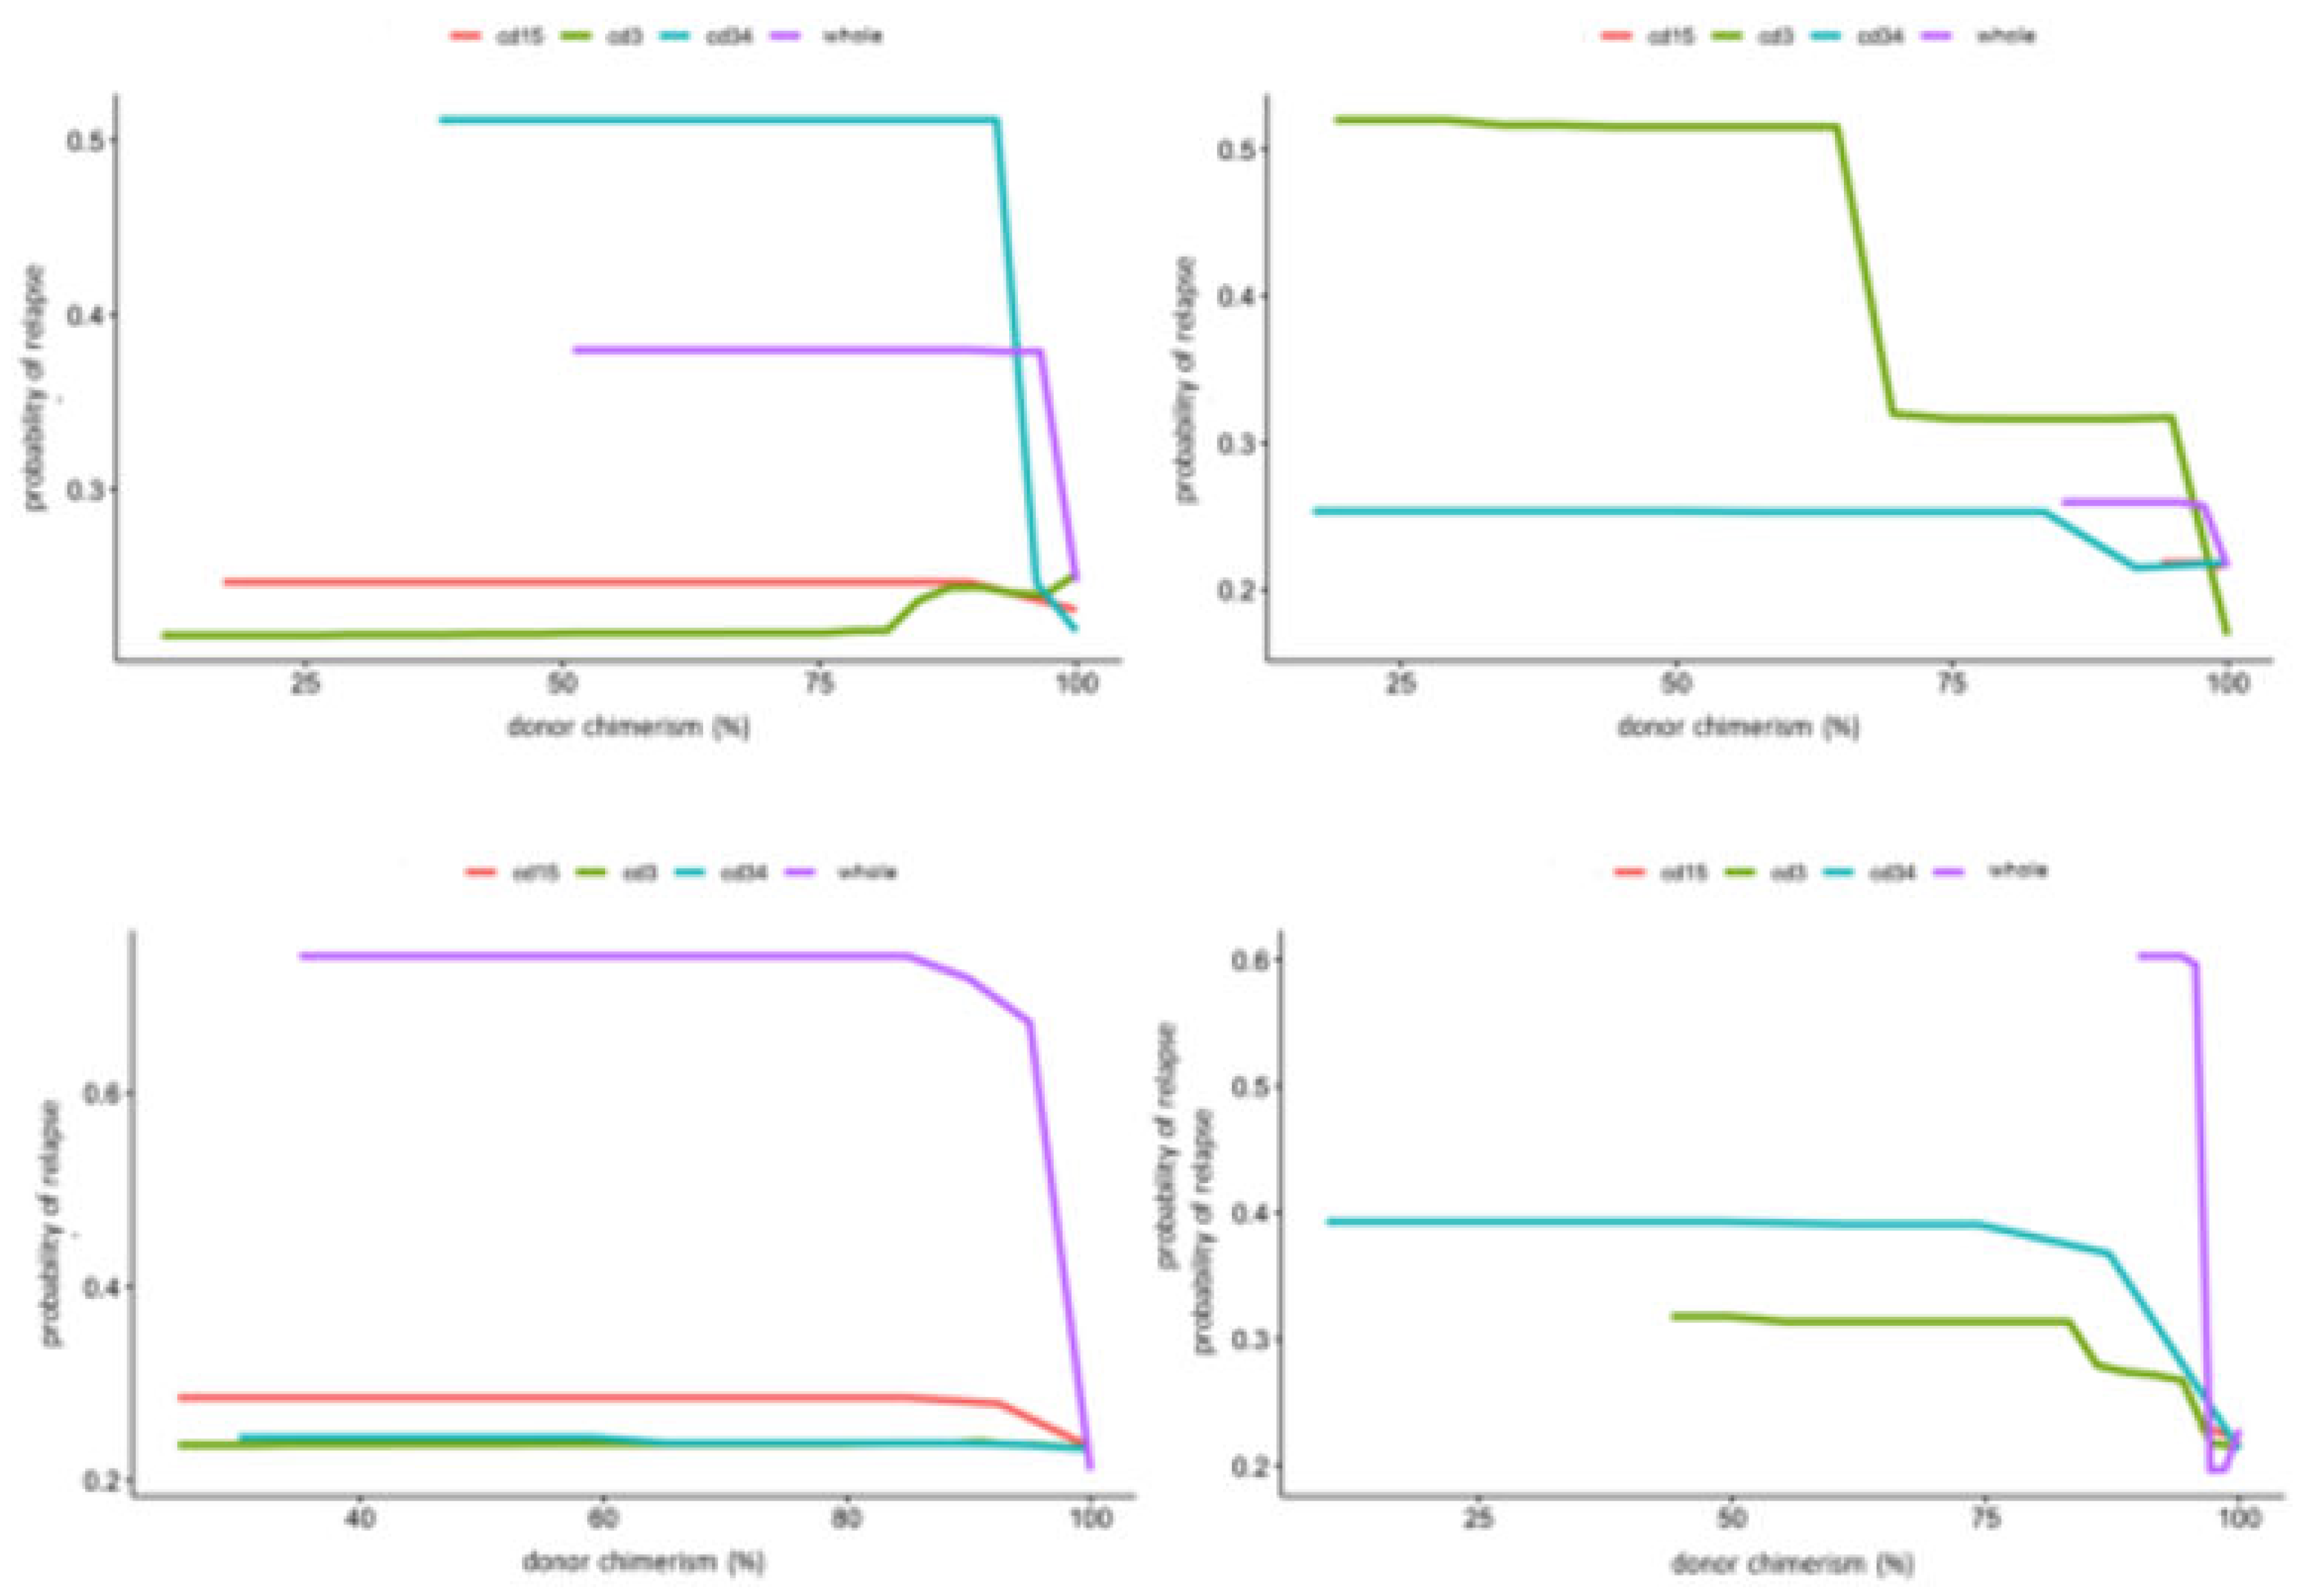
Figure 5.
Example of 2D partial dependence plot showing interaction between peripheral blood CD34 donor and CD3 chimerism. In this figure, X-axis represents peripheral blood CD34 donor chimerism and Y-axis represents peripheral blood CD33 donor chimerism. The heat map scale on represents updated probability of relapse combining the two variables. The left panel shows in ALL, >95% Peripheral blood CD34 donor chimerism lowers the probability of relapse for recipient regardless of donor CD3 chimerism. The right panel shows stronger impact of donor CD3 chimerism than donor CD34 on risk of relapse in AML.

Figure 6.
Example of LIME analysis. The left panel shows how LIME reveals the logic of the random forest classier in making a prediction of relapse in a patient with AML including whole bone marrow chimerism below 99% and peripheral blood CD3 chimerism below 93%. The right panel shows similar LIME analysis for a patient with ALL, noted TBI in conditioning regimen consistently acts as opposing factor for relapse.
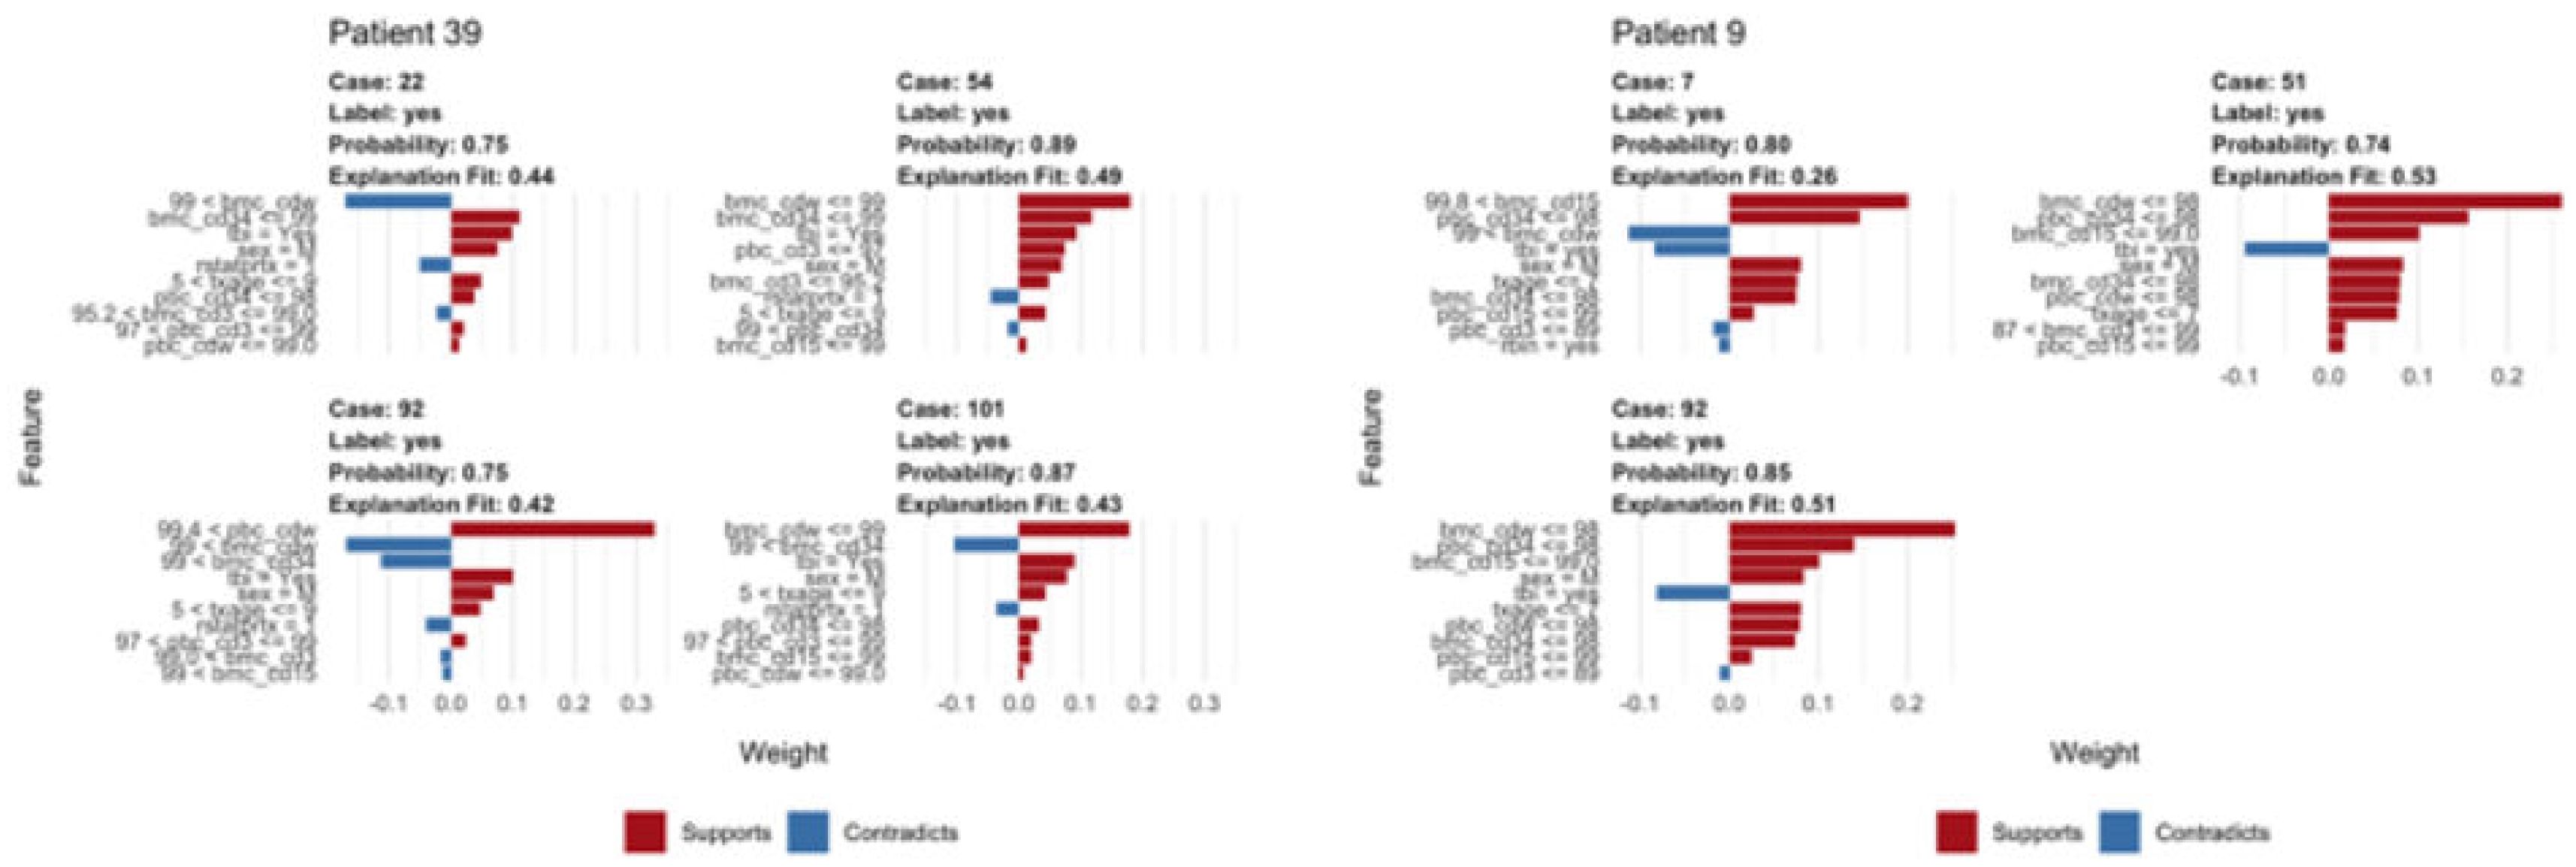

Table 1.
Patient and Transplantation Characteristics.
| ALL (n=63) | AML (n=46) | |
|---|---|---|
| Age (year) | ||
| Range | 1 to 22 | 1 to 23 |
| Median | 12 | 11 |
| Mean | 11 | 10 |
| Sex (n) | ||
| Male | 37 (59%) | 29 (63%) |
| Female | 26 (41%) | 17 (27%) |
| Pretransplant Remission Status (n) | ||
| Complete Remission 1 | 21 (33%) | 32 (70%) |
| Complete Remission 2 | 36 (57%) | 10 (22%) |
| Complete Remission 3 | 6 (10%) | 0 |
| Relapse | 0 | 3 (7%) |
| Unknown | 0 | 1 (2%) |
| Graft Source (n) | ||
| Bone Marrow | 37 (59%) | 22 (48%) |
| Cord Blood | 8 (13%) | 9 (20%) |
| Peripheral Blood Stem Cell | 18 (28%) | 15 (32%) |
| Total Body Irradiation (n) | ||
| Yes | 57 (90%) | 25 (54%) |
| No | 6 (10%) | 21 (46%) |
| Acute Graft versus Host Disease any grade (n) | ||
| Yes | 38 (60%) | 22 (48%) |
| No | 25 (40%) | 24 (52%) |
| Relapsed | ||
| Yes (n) | 14 (26%) | 13 (28%) |
| Range (days) | 53 to 620 | 54 to 621 |
| Mean (days) | 244 | 210 |
| Median (days) | 188 | 174 |
| Days from last peripheral blood chimerism | ||
| Range (days) | 7 to 531 | 15 to 467 |
| Mean (days) | 129 | 132 |
| Median (days) | 63 | 39 |
Table 2.
Chimerism Data, TX-transplant.
| Peripheral Blood | Bone Marrow | |||||
| ALL |
Number of tests (n, % data present) |
mean (post-TX days) |
Range (post-TX days) |
Number of tests (n, % data present) |
mean (post-TX days) |
Range (post-TX days) |
| Chimerism #1 | 55 (87%) | 27 | 12 to 40 | 63 (100%) | 21 | 24 to 62 |
| Chimerism #2 | 49 (78%) | 60 | 30 to 91 | 59 (94%) | 63 | 43 to 98 |
| Chimerism #3 | 47 (74%) | 100 | 42 to 186 | 55 (87%) | 96 | 77 to 186 |
| Chimerism #4 | 39 (62%) | 191 | 84 to 384 | 43 (68%) | 180 | 127 to 377 |
| Chimerism #5 | 23 (37%) | 332 | 139 to 532 | 14 (22%) | 321 | 173 to 449 |
| AML | ||||||
| Chimerism #1 | 36 (78%) | 28 | 12 to 37 | 42 (91%) | 32 | 21 to 43 |
| Chimerism #2 | 28 (61%) | 61 | 29 to 85 | 44 (95%) | 63 | 43 to 89 |
| Chimerism #3 | 26 (57%) | 97 | 62 to 145 | 36 (78%) | 93 | 69 to 119 |
| Chimerism #4 | 23 (50%) | 174 | 97 to 265 | 31 (67%) | 174 | 119 to 197 |
| Chimerism #5 | 17 (37%) | 345 | 243 to 518 | 19 (41%) | 335 | 182 to 557 |
Disclaimer/Publisher’s Note: The statements, opinions and data contained in all publications are solely those of the individual author(s) and contributor(s) and not of MDPI and/or the editor(s). MDPI and/or the editor(s) disclaim responsibility for any injury to people or property resulting from any ideas, methods, instructions or products referred to in the content. |
© 2024 by the authors. Licensee MDPI, Basel, Switzerland. This article is an open access article distributed under the terms and conditions of the Creative Commons Attribution (CC BY) license (http://creativecommons.org/licenses/by/4.0/).
Copyright: This open access article is published under a Creative Commons CC BY 4.0 license, which permit the free download, distribution, and reuse, provided that the author and preprint are cited in any reuse.


